2014 Centuria Annual Report
92
Annual Report 2014 Centuria Capital Limited
-
Upload
centuria-capital-limited -
Category
Documents
-
view
219 -
download
2
description
Â
Transcript of 2014 Centuria Annual Report

Cen
turia
Cap
ital L
imite
d An
nual
Rep
ort 2
014
Annual Report 2014
CenturiaCapitalLimited
Contents
1 About Centuria2 Highlights3 Chairman’s Review4 Chief Executive’s Report 7 Centuria Property Funds12 Centuria Life15 Centuria in the Community 16 Meet the Directors 18 Corporate Governance Statement 22 Directors’ Report27 Remuneration Report (Audited)36 Auditor’s Independence Declaration39 Directors’ Declaration 40 Financial Statements89 Corporate Directory
Management Directory
Centuria Capital Limited
John McBain Group CEOMatthew Coy Chief Financial OfficerTroy Dafter Head of Compliance
Centuria Life Limited
Neil Rogan General Manager – Investment Bond Division Terry Reid Friendly Societies Operations ManagerAsh Nakhla Investor Services Team Leader
Centuria Property Funds Limited
Jason Huljich CEO – Unlisted Property FundsNicholas Collishaw CEO – Listed Property FundsWoon Pin Chong Managing Director, AsiaDavid Govey Head of AssetsAndre Bali Head of DevelopmentBen Harvie Head of Funds ManagementHadyn Stephens Head of TransactionsAndrew Essey National Leasing ManagerJacques Duvenage National Facilities ManagerMark Jones Manager, Property Funds Victoria
Centuria Capital Limited and Controlled Entities ABN 22 095 454 336 Annual Report for the year ended 30 June 2014
1Annual Report 2014
Welcome to our 2014 Annual Report
Centuria Capital is a Specialist Investment Manager concentrating on two core product sectors:
Centuria takes pride in offering a range of astute investment opportunities across both the real estate spectrum and the tax effective investment bond sectors.We are focused on creating wealth for investors in our investment funds and this year we will begin a program in Australia of co-investing alongside our fund clients. We continue to deliver strong growth for our shareholders and attach a high priority to this performance.We stand for innovation and excellence in our investment products, personal management of our clients’ interests and hands-on, in-depth market knowledge of the market sectors we operate in.We are growing our brand awareness and reputation for superior investment outcomes. With greater size and more access to capital, we will continue to deliver superior results for our investors.
About Centuria
1Annual Report 2014
• Property Funds Management• Tax Effective Investment Bonds

2 Centuria Capital Limited
Total Number of Clients at 30 June 2014
114,435
Direct Property Acquisitions during FY14
$100 MILLION
93% Overall Commercial Property Portfolio Occupancy at 30 June 2014
Underlying Net Profit after Tax at 30 June 2014
$5.9
$1.8 BILLIONGroup Total Funds under Management (FUM) at 30 June 2014
$9.1 MILLIONStatutory Net Profit after Tax at 30 June 2014
$9.5 MILLIONUnderlying Earnings before Tax at 30 June 2014
Highlights
Corporate Gearing (excl. Non-Recourse Debt)
at 30 June 2014
11%
Underlying Earnings per Share Growth at 30 June 2014
11% MILLION
2 Centuria Capital Limited

3Annual Report 2014
As our CEO, John McBain, writes in his report to you, the 2015 financial year will see us continue working towards the further implementation of our strategy for the Group. Subsequent to balance date there have been significant developments towards implementing our strategy as outlined in John’s report. In that respect, 2015 is shaping up to be a very significant one as we continue to work to position the Group for further growth in all of our core areas of business. We will further update you on these developments at our AGM. I look forward to seeing you then. Roger Dobson Chairman
Chairman’s Review
Dear Shareholders, 2014 was a successful year for the Group and saw us continue to focus on the strategy set by the Board of Directors a few years ago.On the property funds management side of the business, we continued our focus on acquiring significantly larger properties and were successful in targeting large offshore institutional investors. On the Centuria Life side of the business, importantly, funds under management has stabilised and we have experienced funds growth this financial year. I express my thanks to my fellow directors and to all of our executives and staff for their hard work and contribution to the Group’s success throughout the year.
“2014 WAS A SUCCESSFUL YEAR FOR THE GROUP AND SAW US CONTINUE TO FOCUS ON THE STRATEGY SET BY THE BOARD OF DIRECTORS A FEW YEARS AGO.”
ROGER DOBSON Non-Executive Chairman
3Annual Report 2014

4 Centuria Capital Limited
2014 was a busy year across the Group and a year in which Centuria has remained committed to its business strategies. Focusing on our core business activities will bring many benefits to shareholders but most importantly our strategy acts as a “change agent” removing non-core distracting operations and allowing financial markets to clearly focus on our core strengths.We are pleased to report an increase in underlying net profit after tax of 10.6% from the prior period and a similar increase in earnings per share of 11.1%. In addition, fully franked dividends of 2.75 cents were declared in respect of the 2014 financial year which we view as a welcome return to regular shareholder returns. Finally, net assets per share increased by 9.6% from the prior period to $1.34.
Financial Summary
Chief Executive’s Report
A highlight during the period for the Property Funds Management division was undoubtedly the acquisition of the largest asset in Centuria’s history being the $100 million purchase of a 50% interest in the Channel Seven headquarters in Sydney by the Centuria 8 Central Avenue Fund. The launch of this Fund was unique in another respect for Centuria, as it was equity funded by a combination of Centuria investors and a major offshore investment fund secured by our Singapore office. Both the large size of the transaction and the sourcing of offshore funding are direct results of Centuria successfully adhering to its long-stated strategies of targeting higher quality, larger assets and developing our Singapore office to source offshore wholesale investors. Pleasingly, we also experienced a stabilisation in our investment bonds funds under management (FUM) to $714 million at the close of FY14, up from $710 million at the end of FY13. Further growth in this division is being targeted through new products, including the Centuria Credit Bond launched in August 2014 as part of the Centuria TaxAstute Series. We are also committing additional resources so the Investment Bond division can create its own market position and identity in the tax effective savings market. Since the financial year-end we have appointed a new General Manager – Investment Bond Division who is highly experienced in this market sector and we have included further details about our Investment Bond initiatives later in the report.
JOHN MCBAIN Executive Director and Chief Executive Officer
2014 2013 Change
Underlying NPAT $5.9m $5.3m 10.6%
Underlying EPS 7.6c 6.8c 11.1%
DPS (fully franked) 2.75c 1.25c 120.0%
Net Assets per Share $1.34 $1.22 9.6%
4 Centuria Capital Limited
“ADHERING TO OUR STRATEGIC GOALS WILL ALLOW CENTURIA TO HAVE A SIMPLIFIED BUSINESS MODEL, A STRENGTHENED BALANCE SHEET AND GREATER FREE CASH TO INVEST IN CORE ACTIVITIES.”
5Annual Report 2014
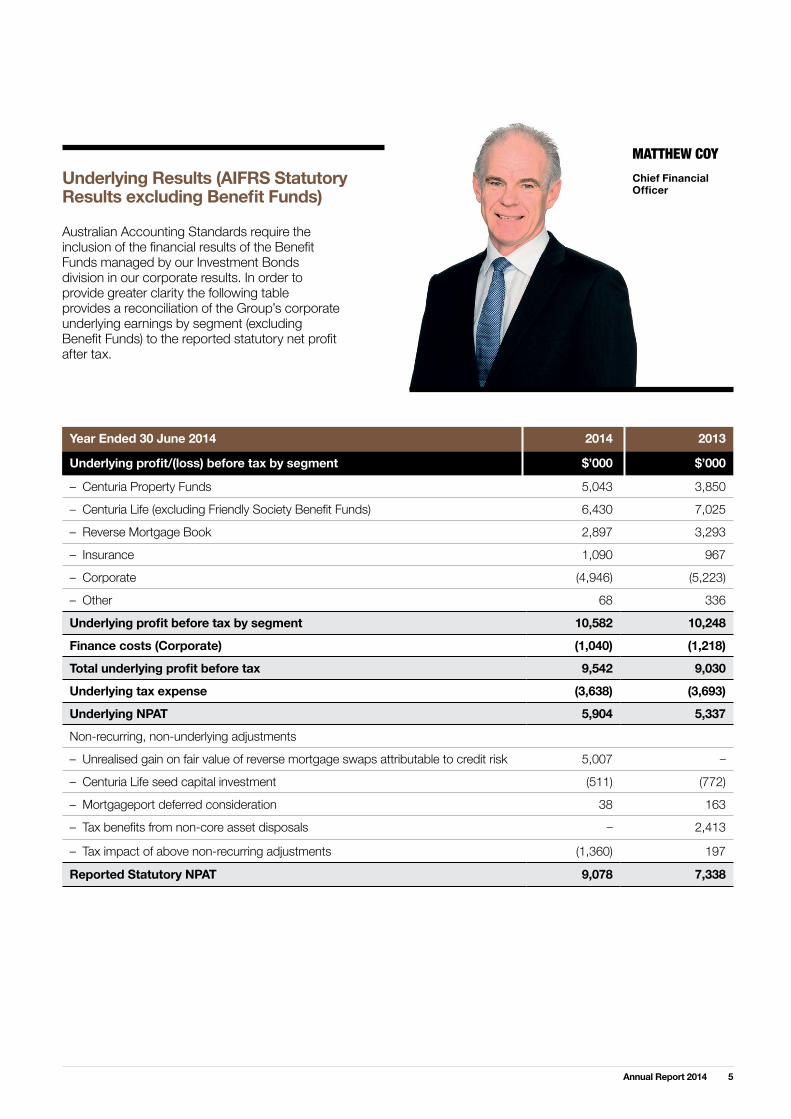
Year Ended 30 June 2014 2014 2013
Underlying profit/(loss) before tax by segment $’000 $’000
– Centuria Property Funds 5,043 3,850
– Centuria Life (excluding Friendly Society Benefit Funds) 6,430 7,025
– Reverse Mortgage Book 2,897 3,293
– Insurance 1,090 967
– Corporate (4,946) (5,223)
– Other 68 336
Underlying profit before tax by segment 10,582 10,248
Finance costs (Corporate) (1,040) (1,218)
Total underlying profit before tax 9,542 9,030
Underlying tax expense (3,638) (3,693)
Underlying NPAT 5,904 5,337
Non-recurring, non-underlying adjustments
– Unrealised gain on fair value of reverse mortgage swaps attributable to credit risk 5,007 –
– Centuria Life seed capital investment (511) (772)
– Mortgageport deferred consideration 38 163
– Tax benefits from non-core asset disposals – 2,413
– Tax impact of above non-recurring adjustments (1,360) 197
Reported Statutory NPAT 9,078 7,338
MATTHEW COYChief Financial Officer
Australian Accounting Standards require the inclusion of the financial results of the Benefit Funds managed by our Investment Bonds division in our corporate results. In order to provide greater clarity the following table provides a reconciliation of the Group’s corporate underlying earnings by segment (excluding Benefit Funds) to the reported statutory net profit after tax.
Underlying Results (AIFRS Statutory Results excluding Benefit Funds)
6 Centuria Capital Limited
* Post transaction costs but excluding taxation impact which is minor.
Chief Executive’s Report
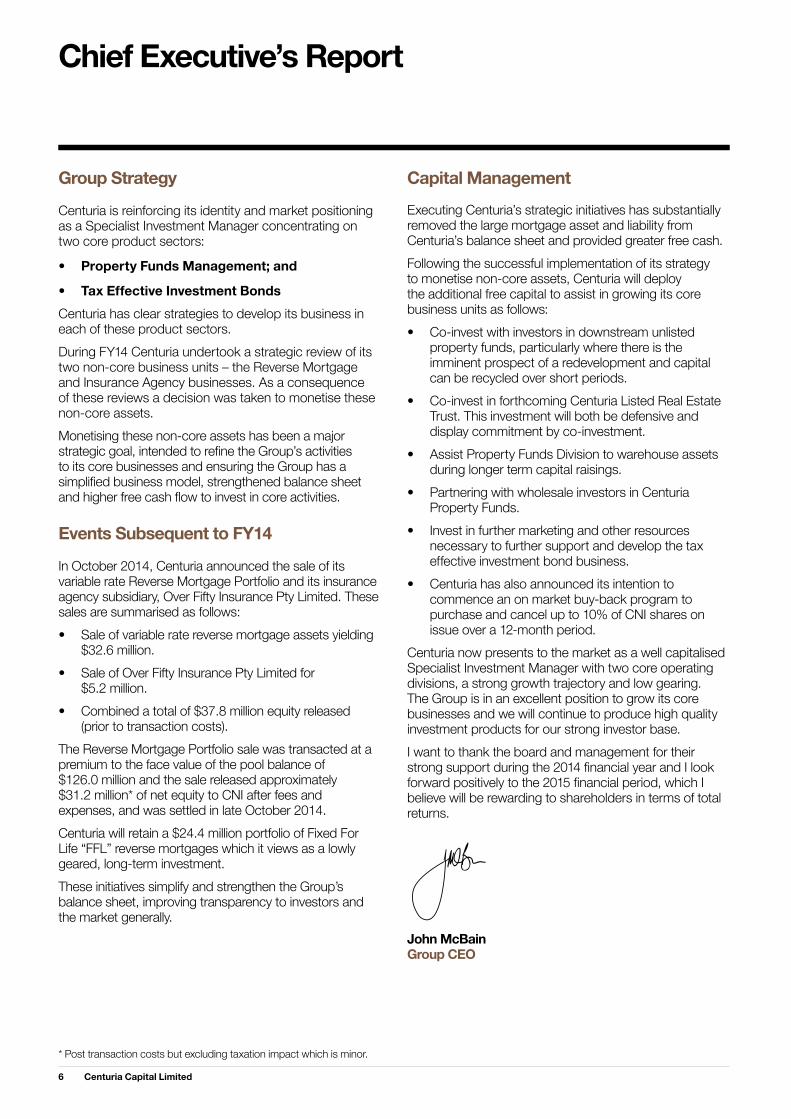
Capital Management Executing Centuria’s strategic initiatives has substantially removed the large mortgage asset and liability from Centuria’s balance sheet and provided greater free cash. Following the successful implementation of its strategy to monetise non-core assets, Centuria will deploy the additional free capital to assist in growing its core business units as follows:• Co-invest with investors in downstream unlisted property funds, particularly where there is the imminent prospect of a redevelopment and capital can be recycled over short periods.• Co-invest in forthcoming Centuria Listed Real Estate Trust. This investment will both be defensive and display commitment by co-investment.• Assist Property Funds Division to warehouse assets during longer term capital raisings.• Partnering with wholesale investors in Centuria Property Funds.• Invest in further marketing and other resources necessary to further support and develop the tax effective investment bond business.• Centuria has also announced its intention to commence an on market buy-back program to purchase and cancel up to 10% of CNI shares on issue over a 12-month period.Centuria now presents to the market as a well capitalised Specialist Investment Manager with two core operating divisions, a strong growth trajectory and low gearing. The Group is in an excellent position to grow its core businesses and we will continue to produce high quality investment products for our strong investor base.I want to thank the board and management for their strong support during the 2014 financial year and I look forward positively to the 2015 financial period, which I believe will be rewarding to shareholders in terms of total returns. John McBain Group CEO
Group Strategy Centuria is reinforcing its identity and market positioning as a Specialist Investment Manager concentrating on two core product sectors:
• Property Funds Management; and
• Tax Effective Investment BondsCenturia has clear strategies to develop its business in each of these product sectors.During FY14 Centuria undertook a strategic review of its two non-core business units – the Reverse Mortgage and Insurance Agency businesses. As a consequence of these reviews a decision was taken to monetise these non-core assets.Monetising these non-core assets has been a major strategic goal, intended to refine the Group’s activities to its core businesses and ensuring the Group has a simplified business model, strengthened balance sheet and higher free cash flow to invest in core activities.
Events Subsequent to FY14 In October 2014, Centuria announced the sale of its variable rate Reverse Mortgage Portfolio and its insurance agency subsidiary, Over Fifty Insurance Pty Limited. These sales are summarised as follows:• Sale of variable rate reverse mortgage assets yielding $32.6 million.• Sale of Over Fifty Insurance Pty Limited for $5.2 million.• Combined a total of $37.8 million equity released (prior to transaction costs).The Reverse Mortgage Portfolio sale was transacted at a premium to the face value of the pool balance of $126.0 million and the sale released approximately $31.2 million* of net equity to CNI after fees and expenses, and was settled in late October 2014.Centuria will retain a $24.4 million portfolio of Fixed For Life “FFL” reverse mortgages which it views as a lowly geared, long-term investment.These initiatives simplify and strengthen the Group’s balance sheet, improving transparency to investors and the market generally.

7Annual Report 2014
Centuria Property Funds
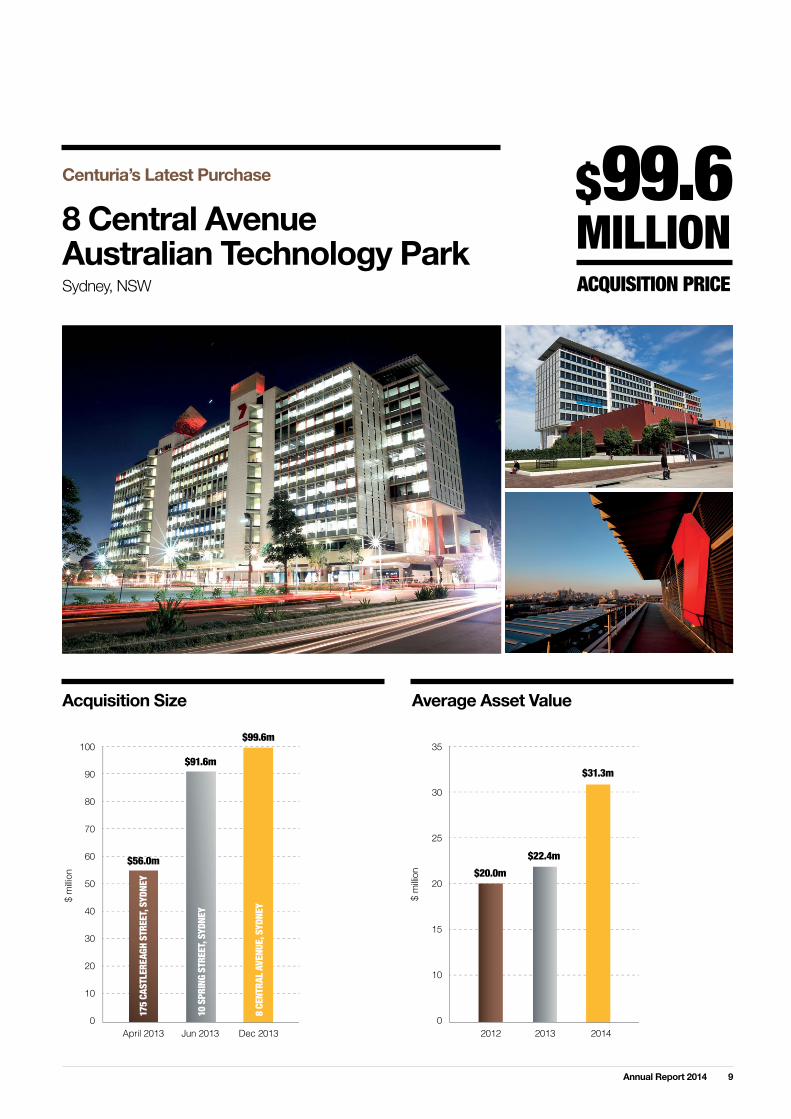
• Record NPAT of $3.5 million.• $100 million direct property acquisition. Centuria’s largest purchase to date.• Singapore office introduces $32 million institutional investor to Centuria Fund.• 83% increase in performance and sales fee income as management takes advantage of strong property market. • Exploration of potential REIT for IPO in late 2014. The average property value in the portfolio has increased from $22.4 million (June 2013) to $31.3 million in June 2014 as Centuria has taken advantage of a strong property market to dispose of assets, resulting in a reduction in property FUM over the period whilst generating significant profits for its investors. Outlook – Three-tiered property strategy The outlook for the coming year looks particularly exciting. Centuria’s three-tiered property strategy will create a powerful property “engine” permitting a greater volume of transactions and increasing asset size capability.
Centuria Property Funds had another successful year with all three divisions gaining significant traction:
UnlistedThe unlisted funds division will continue to purchase quality investment grade assets for its strong investor base. There will be a specific focus on larger assets as well as offering a diversified range of products to our investors including development funds and alternative investment opportunities.These new products will contribute additional downstream revenue for the Group such as development fee income. Centuria’s existing property portfolio provides the opportunity to develop circa 1,000 apartments in Sydney and Melbourne over the short to medium term. These opportunities have arisen where current commercial and industrial assets have been rezoned for residential development. Centuria may utilise a modest proportion of its balance sheet capital to invest alongside our investors in these opportunities and share in the development profits.SingaporeCenturia established its Asia HQ in Singapore in 2012 to tap offshore capital and distribute its property funds to institutional, wholesale and mid-cap investors. In FY14 SEB Investment Gmbh, the property funds management arm of a major Nordic Bank SEB, invested $32 million in the Centuria 8 Central Avenue Fund – our first institutional investor. We intend to build on this momentum and secure additional institutional investor mandates for our Funds and concurrently grow our FUM.
ListedAs noted last year we have remained focused on our objective of expanding the investment products we are able to offer to you, our investor. To that end we have continued to pursue the creation of an investment vehicle suitable for listing on the Australian Stock Exchange. Continued positive sentiment in the equity markets and an investor focus on yield has really shone the spotlight on the REIT (real estate investment trust) sector. Work commenced in April this year in preparation for a listing of a commercial REIT in December. The assets secured for inclusion in the proposed REIT are closely aligned to Centuria’s core investment activities and in markets that Centuria knows extremely well. We believe that the time is now right to launch Centuria’s new investment opportunity and we look forward to providing more detailed information to you when it becomes available in November.
JASON HULJICH CEO – Unlisted Property Funds
NICHOLAS COLLISHAW CEO – Listed Property Funds
WOON PIN CHONG Managing Director, Asia

8 Centuria Capital Limited
Increasing annuity fee income as well as continued diversification of revenue streams
• Annuity stream fee income (fund management fees, property and facilities management fees) are increasing steadily (8% increase y/o/y).• Performance and sale fee income have increased significantly (83% y/o/y) in a strong market when purchases are difficult and acquisition fee income has been affected.
16
14
12
10
8
6
4
2
-2014201320122011
Annuity Vs Transactional Revenues
Other Revenue Performance and Sales Fees Net Acquisition Fees Development Fees Leasing Fees Property and Facilities Management Fund Management Fees
Business Profile of Funds7.14%
7.14%
17.86%
10.71%
57.15%
PORTFOLIO BY STATE
PORTFOLIO BY SECTOR
7.14%
3.57%7.14%
78.58%
3.57%
New South Wales Victoria Queensland South Australia Australian Capital Territory
Office Industrial Office/Warehouse Speciality Use Retail
Number of Investors
5,728
Number of Funds
21Portfolio Weighted Average Lease Expiry (income)
4.4 YEARS
Number of Buildings
28
Centuria Property Funds
9Annual Report 2014
$ m
illion
$ m
illion
35
30
25
20
15
10
0
100
90
80
70
60
50
40
30
20
10
0201420132012Dec 2013Jun 2013April 2013
Acquisition Size Average Asset Value
$ m
illion
$ m
illion
35
30
25
20
15
10
0
100
90
80
70
60
50
40
30
20
10
0201420132012Dec 2013Jun 2013April 2013
8 Central Avenue Australian Technology Park Sydney, NSW
Centuria’s Latest Purchase $99.6MILLIONACQUISITION PRICE
$31.3m
$22.4m$20.0m
175
CAST
LERE
AGH
STRE
ET, S
YDNE
Y
10 S
PRIN
G ST
REET
, SYD
NEY
8 CE
NTRA
L AVE
NUE,
SYD
NEY
$99.6m
$91.6m
$56.0m
10 Centuria Capital Limited
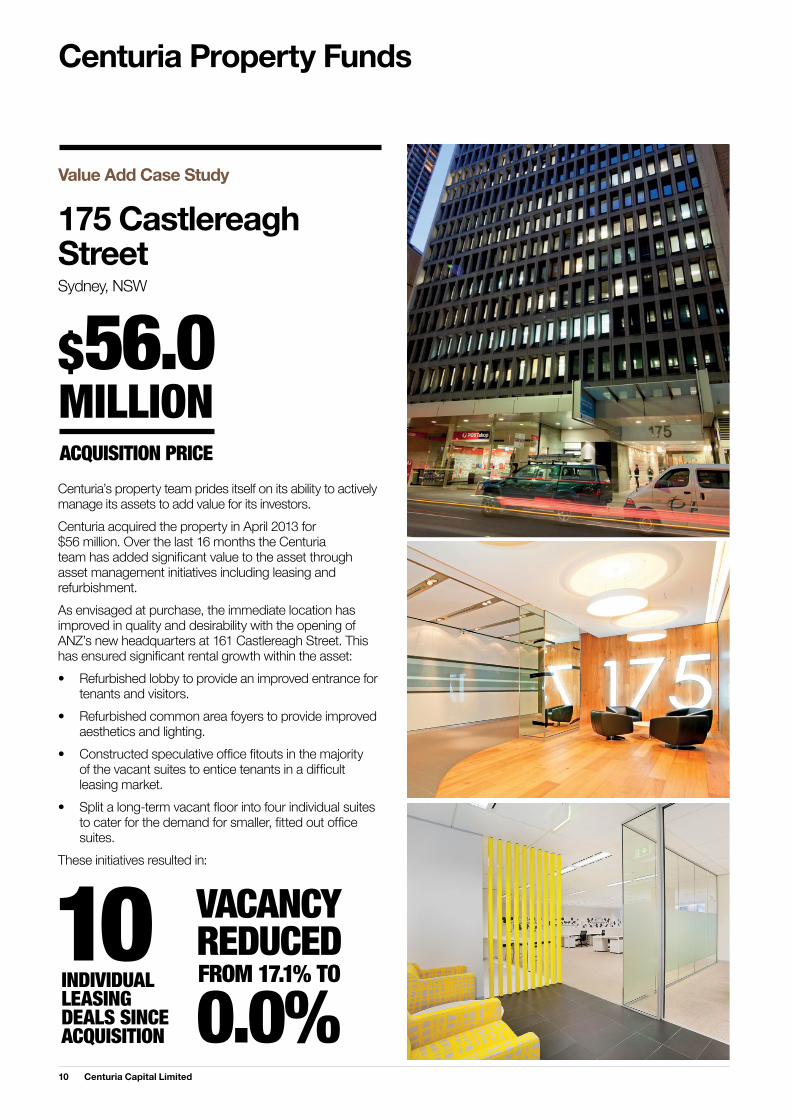
Centuria’s property team prides itself on its ability to actively manage its assets to add value for its investors.Centuria acquired the property in April 2013 for $56 million. Over the last 16 months the Centuria team has added significant value to the asset through asset management initiatives including leasing and refurbishment.As envisaged at purchase, the immediate location has improved in quality and desirability with the opening of ANZ’s new headquarters at 161 Castlereagh Street. This has ensured significant rental growth within the asset:• Refurbished lobby to provide an improved entrance for tenants and visitors.• Refurbished common area foyers to provide improved aesthetics and lighting.• Constructed speculative office fitouts in the majority of the vacant suites to entice tenants in a difficult leasing market.• Split a long-term vacant floor into four individual suites to cater for the demand for smaller, fitted out office suites.These initiatives resulted in:
175 Castlereagh Street Sydney, NSW
INDIVIDUAL LEASING DEALS SINCE ACQUISITION
10 VACANCY REDUCEDFROM 17.1% TO
0.0%
$56.0MILLIONACQUISITION PRICE
Value Add Case Study
Centuria Property Funds

11Annual Report 2014
In June 2013, Centuria purchased the property for $92 million. The property had persistent vacancy issues and was acquired because of Centuria’s ability to add value through refurbishment and an intensive leasing campaign.The property was fully leased in 12 months, with significant value added due to Centuria’s active asset management capabilities:• Significant upgrade to lobby, retail area and lift cars.• Leased Level 5 within one week of acquisition due to intensive leasing involvement for three months leading up to settlement.• Constructed speculative office fitouts to attract office fitouts.• Full retail arcade refurbishment and intensive leasing campaign resulting in five new tenants.
INDIVIDUAL LEASING DEALS SINCE ACQUISITION
12 VACANCY REDUCEDFROM 19.18% TO
0.0%*
$91.6MILLIONACQUISITION PRICE
10 Spring Street Sydney, NSW
Value Add Case Study
* Including a 128.8 sqm tenancy that is presently under offer.

12 Centuria Capital Limited
Centuria Life
Outline of Investment Bonds • Investment Bonds are technically insurance bonds or “friendly society” bonds issued by APRA regulated Life Insurance companies such as Centuria Life.• These bonds are simple long-term savings and/or estate planning vehicles and enjoy a tax incentivised status, being taxed at 30% provided investors invest for at least 10 years, after which they can withdraw their capital and interest, tax free.• They are very flexible in that investors may withdraw all or part of their investment at any time, although this will affect the tax incentivised status of the investment.• Centuria has a range of bonds which offer underlying investments in differing asset classes including shares, fixed interest and diversified funds. Strategy for Investment Bond Division • Centuria will continue to position its investment bonds as either complementary to compulsory Superannuation or targeted savings vehicles for special purposes.• Successive rounds of Superannuation legislation changes and the personal marginal taxation rates of 47% combine to make Investment Bonds a compelling alternative for investors seeking to establish a tax effective long-term savings strategy to complement compulsory superannuation.• Centuria intends to continue to utilise third party distribution channels to cost effectively distribute its products and introduce new bond products.
Centuria has positioned itself as a Specialist Investment Manager and the Group is committed to its Investment Bond division as a core business. Fresh resources to this division include a new General Manager and further business development and product development appointments are planned.
“CENTURIA LIFE INTENDS TO REPOSITION ITS INVESTMENT BONDS AS TAX EFFECTIVE TARGETED SAVINGS VEHICLES.”
NEIL ROGAN General Manager – Investment Bond division

13Annual Report 2014
New Products/Performance Centuria launched the Centuria Credit Bond as part of the Centuria TaxAstute Series in August 2014.www.centuriataxastute.com.au• This new Tax Astute bond series will ultimately cover a range of asset classes giving investors more choice and flexibility. This first credit bond is being distributed through the Mason Stevens network as well as to Centuria clients.• Policyholder numbers steadily increasing throughout the year with 83,136 primary holders at 30 June 2014 (30 June 2013: 82,220).• Total investment bond funds under management have stabilised and grown to $714 million during FY14, whilst funds under management in the Over Fifty Guardian Friendly Society grew 11.0% to $305 million from $275 million during FY14. • In addition to this organic growth, further inflows are targeted from new investment products such as the Tax Astute bond series.
Total FUM of Centuria Life Bonds
$409MILLION
Total FUM of Over Fifty Guardian Friendly Society Bonds
$305MILLION
(FY13 $710m)Total FUM
$714MILLION
13Annual Report 2014

14 Centuria Capital Limited
Reverse Mortgage Book Update As reported under “Events Subsequent to FY14” in the CEO report, the variable rate mortgage portfolio was sold in October 2014 releasing net cash of $32.6 million to the Group prior to transaction costs and greatly simplifying Centuria’s balance sheet. Further details of the transaction are incorporated in a detailed ASX platform release made on 10 October 2014 A brief history of this division is as follows;• Centuria stopped issuing new reverse mortgage loans in 2008. • The value of total reverse mortgage book at 30 June 2014 was $157.2 million (30 June 2013: $172.7 million) secured by $602.5 million of residential property (33.5% weighted average LVR).• The non-recourse warehouse loan reduced to $114.2 million as at 30 June 2014 (30 June 2013: $135.3 million).• Mortgage assets exceeded liabilities by $43 million as at 30 June 2014• After the sale of its variable rate reverse mortgage portfolio of $125.4 million in October 2014, Centuria retained its Fixed For Life reverse mortgage portfolio of $24.4 million (loan balances as at 31 August 2014). • Following the sale of the variable rate portfolio, and the continued amortisation since 30 June 2014, non-recourse debt relating to mortgage assets reduced from $114.2 million to $13.2 million.
Insurance Agency Division – Over Fifty Insurance Centuria operates a general insurance, home insurance and motor vehicle insurance agency branded “Over Fifty Insurance”. This division generated a net profit after tax of $0.8 million in FY14 During FY14 the business was the subject of a detailed strategic review by an external adviser and Centuria designated the business as non-core and sub-scale.Accordingly, subsequent to FY14 balance date on 1 October 2014, Centuria announced the sale of the business for $5.2 million. These funds, along with the capital released from the sale of the reverse mortgage assets, will be utilised in the manner set out in the “Capital Management” section of the CEO report.
Centuria Life
14 Centuria Capital Limited

15Annual Report 2014
In July, Centuria held its third annual Trivia Night to raise funds for our community partner, St. Lucy’s School. The event sold out in under a week, attracted 165 guests and raised over $25,000. The funds raised will go a long way to help provide vital education services and facilities to primary school children with disabilities.We would like to thank all our partners and volunteers who supported this cause, and the Commonwealth Bank of Australia, who kindly donated their boardroom for the evening. We look forward to hosting the event again in 2015.Our staff also continued to donate their time this year by assisting with gardening and other tasks around the school in addition to the fundraising that takes place. This is a reminder to all staff as to why we fundraise and to see firsthand the difference we can make to St. Lucy’s.
We believe that every child deserves to be heardIn addition to our fundraising, the three CEOs John, Jason and Nick signed up to “Week Without Words” in September to contribute even further to the lives of children with disabilities. St. Lucy’s Week Without Words is an awareness and fundraising campaign to give St. Lucy’s students the tools they need to communicate. 95% of St. Lucy’s children have a communication disability. They need speech therapy, electronic devices that can ‘speak’ for them and training in how to use them. About St. Lucy’sSt. Lucy’s is a Dominican co-educational Catholic primary school providing an education of excellence for children with disabilities and is based at Wahroonga with satellite classes on the Northern Beaches.Watch the video to find out more about St. Lucy’s and how you can get involved at: www.stlucys.nsw.edu.au
IT’S BEEN A BUSY YEAR FOR CENTURIA IN THE COMMUNITY.
Centuria in the Community
“95% OF ST. LUCY’S CHILDREN HAVE A COMMUNICATION DISABILITY.”
15Annual Report 2014
From top left clockwise: Top: Centuria’s staff helping out at St. Lucy’s School.
Bottom left: John McBain – Group CEO, presents a cheque to Rebecca Welsh of St. Lucy’s School. Bottom right: Centuria Trivia Night.
15Annual Report 2014

16 Centuria Capital Limited
Meet the Directors
JOHN MCBAIN Executive Director and Chief Executive Officer Dip. Urban Valuation
JASON HULJICH Executive Director B.Comm, Commercial Law
John was appointed CEO of the Company in April 2008. He was the founder of Century Property Funds, which was acquired by Centuria Capital in 2006. John gained his valuation qualification from Auckland University in 1978 and since then has been continuously involved in commercial property investment and consulting in Australia, New Zealand and the UK.From 1986 to 1989 he was Managing Director of a commercial property investment company based in the UK. In 1990 he established boutique property advisory firm Hanover Property Group in Australia. Entering the financial services market in 1995, he founded Waltus Investments Australia Limited, one of the first ASIC regulated direct property fund managers. In 1998 he formed Century Funds Management and in 2006 he joined the Board of Centuria Capital and the Investment Committees of both Centuria Life (formerly the Over Fifty Group) and the Over Fifty Guardian Friendly Society.
Jason became the CEO of Centuria Property Funds in 2006 and joined the Board in 2007. He is responsible for providing strategic leadership and ensuring the effective operation of Centuria’s property portfolio. Jason has been involved in the unlisted property sector in Australia since 1996 and has considerable expertise in investment property selection, fund feasibility and funds management. Jason is the President of the National Executive Committee of the Property Funds Association of Australia, the peak industry body representing the $32 billion direct property investment industry.
Nicholas was appointed CEO – Listed Property Funds on 1 May 2013.Prior to this position, Nicholas held the position of CEO and Managing Director at the Mirvac Group. During his time at Mirvac (2005–2012), he was responsible for successfully guiding the business through the impact of the GFC and implementing a strategy positioning the real estate developer and investor for sustained growth. Nicholas has held senior positions with James Fielding Group, Paladin Australia, Schroders Australia and Deutsche Asset Management. He is currently a National Director of the Property Industry Foundation and a member of the UNSW Faculty of the Built Environment Advisory Council.
NICHOLAS COLLISHAW Executive Director SAFin, FAAPI, FRICS, GAICD

17Annual Report 2014
ROGER DOBSON Non-Executive Chairman LLB (Hons) LL.M
PETER DONE Non-Executive Director B. Comm, FCA
JOHN SLATER Non-Executive Director Dip. FS (FP), F Fin
Roger was appointed to the Board in 2007. He is Chairman of the Board, Chairman of the Nomination and Remuneration Committee and is also a member of the Audit, Risk Management and Compliance Committee. Roger is a senior partner of Henry Davis York. Roger has extensive legal knowledge of the property funds management and financial services industries, as well as corporate governance and regulatory issues.
Peter was appointed to the Board in 2007 and is the Chairman of the Audit, Risk Management and Compliance Committee. He is also a member of the Nomination and Remuneration Committee and the Investment Committees. Peter was a partner of KPMG for 27 years until his retirement in June 2006. He has extensive knowledge in accounting, audit and financial management in the property development and financial services industries, corporate governance, regulatory issues and Board processes through his many senior roles.
John was appointed to the Board in May 2013 and is a member of the Nomination and Remuneration Committee, the Audit, Risk Management and Compliance Committee and the Investment Committee.John was a senior executive in the KPMG Financial Services practice from 1989 to 1999 and acted as State director of the Brisbane practice. He has also served on the Investment Committees of KPMG Financial Services, Berkley Group and Byron Capital and has been an adviser to the Centuria Life Friendly Society Investment Committees since 2011.In 2008, John founded boutique Financial Advisory firm Riviera Capital and has a wealth of financial services experience.

18 Centuria Capital Limited
This statement sets out the eight core principles identified by the ASX Corporate Governance Council (the Council) as underlying good corporate governance and outlines the approach of Centuria Capital Limited (Centuria, CCL or the Company) to each of the principles.As recognised by the Council, corporate governance is the system by which companies are directed and managed. It influences how the objectives of the company are set and achieved, how risk is monitored and assessed and how performance is optimised. There is no single model of good corporate governance. At Centuria, corporate governance will evolve with our changing circumstances and will be tailored to meet those circumstances. Principle 1: Lay solid foundations for management and oversight The Role of the Board The Board of Directors is responsible for setting the strategic direction and establishing the policies of Centuria. It is responsible for overseeing the financial position, and for monitoring the business and affairs of Centuria on behalf of the shareholders, by whom the directors are elected and to whom they are accountable. It also addresses issues relating to internal controls and approaches to risk management. It ensures that there are processes in place to conform to legal requirements and corporate governance standards and that risk exposures are adequately managed.For full details of the role of the Board please refer to our Board Charter, a link to which is contained under the Corporate Governance page of our website. Delegation to Senior Executives The role of the Chief Executive Officer (CEO) and Senior Executives is to manage Centuria in accordance with the direction given by the Board. The CEO’s responsibilities include: • Formulating and reviewing, with the Board, the vision and strategy for Centuria;• Developing actions and plans to achieve the vision and implement the strategy and to report to the Board on the progress against those plans; • Appointing a management team and negotiating terms and conditions of their employment; and• Approving the remuneration levels of all staff. Performance review of Senior Executives The performance of the CEO is reviewed periodically by the Nomination and Remuneration Committee and the Board. This assessment is made against pre-determined criteria including Key Performance Indicators relating to Centuria’s performance as determined in Centuria’s Strategic Plan. Performance reviews of Senior Executives are carried out by the CEO who reports the findings to the Nomination and Remuneration Committee. The CEO conducts the reviews each year by comparing performance against agreed measures, evaluating any efficiencies or improvements during the course of the year and deciding upon targets for next year.
Principle 2: Structure the Board to add value Directors The Directors’ Report in the Annual Report contains details of the directors’ skills, experience and qualifications. It also states the date the individual director was appointed to the Board, their status as non-executive or executive directors and the committees on which they sit. The directors seek to ensure the Board consists of directors with an appropriate range of experience, skills, knowledge and vision to enable it to operate Centuria’s business with excellence. The number of directors is limited by Centuria’s constitution to a minimum of five and a maximum of thirteen. The Board considers that the ideal size is five to eight directors. The Board is reviewing its structure as it aims to have a majority of independent directors. Any future new appointments shall continue to adhere to Centuria’s desire to maintain the appropriate skills, experience and qualification mix, keeping in mind a commitment to diversity of gender and background. Currently the Board consists of six directors. Three of the six directors, namely Roger Dobson, Peter Done and John Slater are considered to be independent as per independence criteria set out in the Board Charter. The three independent directors do not have relationships with Centuria which affect their independent status, such as substantial shareholdings or direct employment. They do not provide material professional consultancy services, they are not a material supplier or customer and they do not have a material contractual relationship with Centuria or other Group members except as a director. Our CEO, John McBain and Jason Huljich and Nicholas Collishaw are executive directors. Directors are required to disclose at each Board meeting any interests that may affect their independence. Independent directors reconfirm their independent status to the Board by way of a written confirmation on an annual basis. Directors are selected and appointed in accordance with documented procedures. For full details on the procedures for the selection and appointment of directors please see our policy, a link to which is contained under the Corporate Governance page of our website. Chairman Centuria’s chairman, Roger Dobson, is considered to be an independent director for the reasons given above. There is a clear division of responsibility at the head of the Company as the roles of chairman and the CEO are not performed by the same person. The Board Charter also provides that the chairman shall be an independent non-executive director. A Statement of Position Authority is in place for the CEO which details the responsibilities and authorities for that position. Nomination and Remuneration Committee The Nomination and Remuneration Committee formulates criteria for appointment of directors to the Board, identifies potential candidates and recommends remuneration of directors and senior management. A link to the charter of the Nomination and Remuneration Committee can be found on the Corporate Governance page of our website.
2014 Corporate Governance Statement

19Annual Report 2014
Specific activities of the Nomination and Remuneration Committee include: • Annual review of Board composition to ensure that the necessary skills are represented, together with the appropriate continuity and balance;• Assessment of the effectiveness and composition of Board committees;• Regular evaluation of the performance of the CEO;• Recommending remuneration for Non-Executive directors;• Recommending a competitive remuneration and reward program for the CEO and other senior management; and• Ensuring that other human resource management programs, including performance assessment programs, are in place.The Nomination and Remuneration Committee consists of three directors, all of whom are independent and is chaired by an independent director. Details of membership of the Nomination and Remuneration Committee, including meeting attendance, is set out at the end of the Corporate Governance Statement. Each director’s skills, experience and expertise is contained in the Directors’ Report. Board performance The Board reviews and assesses its performance each year. Detailed consideration is given to the following areas: • The Board’s composition;• The operations and effectiveness of the Board and its Committees; • Decision-making processes, including agendas, frequency of meetings and content of papers; • Communications between Board and Executives;• Determination of company strategy; and • The Board’s policies for Board renewal. Continuing education to update and enhance director knowledge is seen as an important factor in ensuring optimum performance by each director. Clause 5 of the Board Charter gives directors the authority to seek professional advice as considered necessary in the performance of its duties at Centuria’s expense. The directors also have full access to the Company Secretary to assist them to carry out their role. Re-election of Directors The Company’s constitution stipulates that a number of directors not exceeding one-third of their number should retire by rotation at each annual general meeting (AGM). A director must offer themself for re-election at the third AGM since their election or re-election. The CEO, if also a director, is not subject to the retirement by rotation process, and is not included when calculating the number of directors required to retire by rotation.
Principle 3: Promote ethical and responsible decision-making Code of Conduct The Board has established a Directors and Employee Code of Conduct that sets the standard by which all officers and employees of the Company are to conduct themselves in the course of their duties. Potential breaches of the Code of Conduct can be reported to management, the Audit, Risk Management and Compliance Committee or an external auditor using the guide outlined in Centuria’s Whistleblower Policy. A link to the Code of Conduct can be found under the Corporate Governance page of our website. Trading in Centuria’s securities The Board has established a policy concerning trading in Centuria’s securities by directors, officers and employees. The policy prohibits directors and employees trading in Centuria’s securities if they are aware of any price sensitive information and also, at nominated times when a “black-out period” is imposed. A link to Centuria’s Directors and Employee’s Securities Trading Policy can be found under the Corporate Governance page of our website. Diversity at Centuria Amendments to the ASX Corporate Governance Principles and Recommendations have focused the Board’s attention on formalising into policy the Company’s belief that a diverse workforce with equality of opportunity will achieve strong business results. Whilst ultimately all new appointments, whether of a director or an employee will be made on the basis of merit, meeting the targets will provide evidence of the effectiveness of the policy.The Board has established the following measurable objectives regarding gender diversity and aims to achieve these objectives over the next few years as directors and Senior Executive positions become available and appropriately qualified candidates come forward:
(i) 30% of the Company’s employees and consultants be women; (ii) 20% of the Company’s senior executives be women; and (iii) One member of the Board be a woman.
The table below details the objectives set by the Company during the reporting period for gender diversity and the Company’s performance against these objectives:
Objective 2014
30% of employees and consultants be women
33%
20% of Senior Executives be women
0.05%
One female member of the Board 0%

20 Centuria Capital Limited
Principle 4: Safeguard integrity in financial reporting Audit, Risk Management and Compliance Committee Our Audit, Risk Management and Compliance Committee consists of three independent directors and is chaired by an independent chair who is not the chair of Centuria’s Board. All members are financially literate either holding financial or accounting qualifications and/or having professional experience in a financial or accounting related field. The Committee chairman, Peter Done, is a chartered accountant with over 40 years of experience. John Slater has 25 years’ experience in the financial services and investment management industry. The third member of the committee, Roger Dobson, is a senior partner in the banking and finance practice at the legal firm in which he is a partner. The Committee meets at least six times per year. The external and internal auditors of the Group attend on a regular basis. Details of the Audit, Risk Management and Compliance Committee members’ names, appointment date, status, qualifications and meeting attendance is set out in the Directors’ Report of this Annual Report. Charter The Board has formulated an Audit, Risk Management and Compliance Committee Charter, a link to which is contained under the Corporate Governance page of our website. External auditor Procedures have been established in relation to the external auditor selection, appointment and lead partner rotation. A link to the procedures relating to the external auditor selection, appointment and lead partner rotation can be found under the Corporate Governance page of our website. Principle 5: Make timely and balanced disclosure The Company has policies and procedures on information disclosure. The focus of these policies and procedures is to affect Centuria’s commitment to:• Comply with the general and continuous disclosure principles contained in the ASX Listing Rules and the Corporations Act;• Prevent the selective or inadvertent disclosure of price sensitive information;• Ensure that shareholders and the market are provided with full and timely information about its activities; and• Ensure that all market participants have equal opportunity to receive externally available information issued by Centuria.A summary of our Continuous Disclosure Policy can be found under the Corporate Governance page of our website.Responsibility for compliance with Centuria’s continuous disclosure obligations rests with the Company Secretaries. Price sensitive information is publicly released through the ASX before disclosing it to analysts or others outside the
Company. Information is posted on Centuria’s website as soon as reasonably practicable after the stock exchange confirms an announcement has been made, with the aim of making the information accessible to the widest audience. Principle 6: Respect the rights of shareholders Centuria aims to provide prompt, accurate and accessible information to its shareholders. It has established a Communications Policy detailing steps to be taken to achieve this objective, a copy of which can be viewed under the Corporate Governance page of our website. The main mechanisms through which Centuria communicates with its shareholders are:• The Annual Report, the half and full-year financial reports;• Announcements made to the Australian Stock Exchange;• The Annual General Meeting (AGM); • Notices and explanatory memoranda of AGMs; and• Centuria’s website www.centuria.com.au.Centuria’s website forms an important part of the strategy for communicating with shareholders. Centuria’s website has a shareholders’ page which includes share details, company reports, company announcements and press releases (including copies of any significant presentations made to analysts), and items relating to AGMs. In designing notices and explanatory statements / memoranda of AGMs, Centuria gives consideration to the guidelines given by the ASX Corporate Governance Council in its Corporate Governance Principles and Recommendations.At the time of providing a notice of meeting and explanatory memoranda for the AGM a form is provided for shareholders to mail back to Centuria if they wish to raise any issues. At the AGM, the Company will, where appropriate, endeavour to address issues raised by shareholders in these forms. During the course of the AGM the floor is opened for questions. Principle 7: Recognise and manage risk The Centuria Board has established a Risk Management Framework for the Group, a summary of which can be viewed under the Corporate Governance page of our website. Risk management is an integral part of the governance of Centuria and is one of the main responsibilities of the Board and Senior Management. The Board is ultimately responsible for approving and reviewing Centuria’s Risk Management Framework. The monitoring and management of risk on an ongoing basis is the responsibility of management as represented by the heads of the respective business units of Centuria.At Centuria, managing risk is a continuous process for both management and the Board. Centuria’s comprehensive risk management framework requires a detailed annual business risk review, which seeks to define all the major risks that could prevent or impact the Company from achieving its objectives. This review has been completed for this financial year and the Board has accepted Management’s report that material business risks have been managed effectively.
2014 Corporate Governance Statement (continued)

21Annual Report 2014
The management of risk is continually addressed during the year at the business unit level. Periodically, a review of the effectiveness of Centuria’s risk management framework is undertaken. Combined with this, is an embedded compliance culture to ensure Centuria meets the requirements of the Australian Securities and Investments Commission for conducting a financial services business and operating managed investment schemes. A robust compliance framework has been implemented which requires the business to monitor its activities and those of its outsourced service providers. The compliance function at Centuria reports directly to the Audit, Risk Management and Compliance Committee and the Board.A co-sourced internal audit function has also been established with a focus on Centuria’s control environment. The annual internal audit plan is determined having regard to the risk profile of the business arising from the annual business risk review. The Audit, Risk Management and Compliance Committee has the following risk management responsibilities: • Assessing risks arising from the Group’s operations and ensuring the adequacy of measures taken to moderate those risks;• Reviewing and assessing the effectiveness of the Group’s Risk Management Framework and internal control practices and ensure there is a continuous process for the management of significant risks throughout the Group; and• Monitoring compliance with the Company’s Risk Management Framework.Quarterly risk management reporting is provided to the Audit, Risk Management and Compliance Committee by management. The CEO and CFO have declared in writing to the Board for both the half-year and full-year financial statements that the declaration provided in accordance with section 295A of the Corporations Act is founded on a sound system of risk management and internal control and that the system is operating effectively in all material respects in relation to financial reporting risks.
Principle 8: Remunerate fairly and responsibly Nomination and Remuneration Committee The Nomination and Remuneration Committee consists of three directors, all of whom are independent and is chaired by an independent director. Detail of membership of the Nomination and Remuneration Committee including meeting attendance is set out at the end of this Corporate Governance Statement.Remuneration related responsibilities of the Nomination and Remuneration Committee include:• Recommending fees for directors;• Recommending a competitive remuneration and reward program for the CEO and other senior management; and
• Ensuring that other human resource management programs, including performance assessment programs and incentive schemes, are in place.Centuria recognises the important role people play in the achievement of its long-term objectives and as a key determinant of competitive advantage. To grow and be successful, Centuria must be able to attract, motivate and retain capable individuals. Senior Executive remuneration structure The key principles that underpin Centuria’s Senior Executive Remuneration Policy are:• Competitive rewards are provided to attract and retain executive talent;• Remuneration is linked to performance so that higher levels of performance attract higher rewards;• Rewards to all staff but particularly executives are linked to the creation of value to shareholders;• The criteria used to assess and reward staff include financial and non-financial measures of performance;• The overall cost of remuneration is managed and linked to the ability of the Company to pay; and• Severance payments due to the CEO on termination are limited to pre-established contractual arrangements which do not commit the Group to making any unjustified payments in the event of non-performance.The Remuneration Policy assists Centuria to achieve its business strategy and objectives. Centuria recognises that, while remuneration is a key factor in recruiting the right people, it is not the only factor. Centuria’s values and its ability to provide interesting and challenging career opportunities, also play an important role. Non-Executive Director remuneration structure The Board has established a policy relating to the remuneration of Non-Executive Directors. Centuria pays Non-Executive Directors fees at a level which is sufficient to attract individuals with the appropriate skills, and to fairly reimburse those Directors for services provided. Non-Executive Directors’ remuneration does not include incentive schemes or performance related payments.Executive Directors are paid a salary commensurate with their position and responsibilities and at a level which attracts high calibre executives with appropriate skills and experience. Executive Directors also participate in Centuria’s long-term and short-term incentive plans. Further information regarding director and Senior Executive remuneration can be found in the Remuneration Report.
22 Centuria Capital Limited
The directors of Centuria Capital Limited (the “Company” or “CCL”) submit herewith the annual financial report of the Company for the financial year ended 30 June 2014. In order to comply with the provisions of the Corporations Act 2001, the Directors Report as follows: Information about the directors and senior management The names and particulars of the directors of the Company during or since the end of the financial year are:
Name Particulars
Mr Roger W. Dobson (LL.B, LL.M)
Roger was appointed to the Board in 2007. He is Chairman of the Board, Chairman of the Nomination and Remuneration Committee and is also a member of the Audit, Risk Management and Compliance Committee. Roger is a senior partner of Henry Davis York and works primarily for clients in the financial services sector, including in the areas of property funds management, corporate governance and regulatory issues.
Mr Peter J. Done(B.Comm, FCA)
Peter was appointed to the Board in 2007 and is the Chairman of the Audit, Risk Management and Compliance Committee. He is also a member of the Nomination and Remuneration Committee and the Investment Committees. Peter was a partner of KPMG for 27 years until his retirement in June 2006. He has extensive knowledge in accounting, audit and financial management in the property development and financial services industries, corporate governance, regulatory issues and Board processes through his many senior roles.
Mr John R. Slater(Dip.FS (FP), F Fin)
John was a senior executive in the KPMG Financial Services practice from 1989 to 1999 and acted as State director of the Brisbane practice. He has also served on the Investment Committees of KPMG Financial Services, Berkley Group and Byron Capital and has been an adviser to the Centuria Life Friendly Society Investment Committees since 2011.
In 2008, John founded boutique Financial Advisory firm Riviera Capital and has a wealth of financial services experience.
Mr John E. McBain(Dip. Urban Valuation)
John was appointed CEO of the Company in April 2008. He was the founder of Century Property Funds, which was acquired by Centuria Capital in 2006. John gained his valuation qualification from Auckland University in 1978 and since then has been continuously involved in commercial property investment and consulting in Australia, New Zealand and the UK.
From 1986 to 1989 he was Managing Director of a commercial property investment company based in the UK. In 1990 he established boutique property advisory firm Hanover Property Group in Australia. Entering the financial services market in 1995, he founded Waltus Investments Australia Limited, one of the first ASIC regulated direct property fund managers. In 1998 he formed Century Funds Management and in 2006 he joined the Board of Centuria Capital and the Investment Committees of both Centuria Life (formerly the Over Fifty Group) and the Over Fifty Guardian Friendly Society.
Mr Jason C. Huljich(B. Comm)
Jason became the CEO of Centuria Property Funds in 2006 and joined the Board in 2007. He is responsible for providing strategic leadership and ensuring the effective operation of Centuria’s property portfolio. Jason has been involved in the unlisted property sector in Australia since 1996 and has considerable expertise in investment property selection, fund feasibility and funds management. Jason is the President of the National Executive Committee of the Property Funds Association of Australia, the peak industry body representing the $32 billion direct property investment industry.
Mr Nicholas R. Collishaw(SAFin, FAAPI, FRICS)(Appointed 27 August 2013)
Nicholas was appointed CEO – Listed Property Funds on 1 May 2013.
Prior to this position, Nicholas held the position of CEO and Managing Director at the Mirvac Group. During his time at Mirvac (2005–2012), he was responsible for successfully guiding the business through the impact of the GFC and implementing a strategy positioning the real estate developer and investor for sustained growth.
Nicholas has held senior positions with James Fielding Group, Paladin Australia, Schroders Australia and Deutsche Asset Management.
He is currently a National Director of the Property Industry Foundation and a member of the UNSW Faculty of the Built Environment Advisory Council.
Directors’ Report for the year ended 30 June 2014

23Annual Report 2014
Directors’ shareholdings The following table sets out each director’s relevant interest in shares in the Company as at the date of this report.
Directors hold ordinary interests, with equal rights to other shareholders.Information about the remuneration of directors and senior management is set out in the Remuneration Report of this Directors’ Report.
Company Secretaries Mr Terry Reid, Chartered Accountant, has been the Company Secretary since December 2007. He is a member of the Institute of Chartered Accountants in Australia. Mr Reid resigned on 27 May 2014 and Mrs Lucy Rowe (BA, Grad Dip Legal Studies) was appointed as Company Secretary on that same date. Mr Matthew Coy (BBus, CPA), Chief Financial Officer, was appointed in October 2009 as a Company Secretary. Principal activities The principal activities of the consolidated entity (being the Company, and its controlled entities, together “the Group”) during the course of the financial year, were the marketing and management of investment products (including friendly society investment bonds and property investment funds), general insurance through agency arrangement, mortgage lending and management, and management of Over Fifty Guardian Friendly Society Limited. Review of operations The Consolidated Group recorded a consolidated net profit after tax for the year is $9.078 million (2013: $7.338 million). The main sources of revenue continue to be derived from the Centuria Life, Property Funds Management and Residential Mortgages divisions.
Directors Fully Paid Ordinary Shares
Number
R.W. Dobson 997,728
P.J. Done 400,000
J.R. Slater 1,402,297
J.E. McBain 4,590,286
J.C. Huljich 2,387,715
N.R. Collishaw (Appointed 27 August 2013) 850,051
Operational highlights for the respective divisions within the Group for the financial year were as follows: Centuria Life • The Company’s key focus on preserving Funds under Management (FUM) in the Centuria Life business is through prudent investment decision- making, maintaining strong and regular policyholder communication, and creating new and innovative products that meet market demand. • The number of primary policyholders under administration has steadily increased throughout the year with 83,316 policies at 30 June 2014 (30 June 2013: 82,210), or a net increase of 1.3%.• Centuria Life has begun marketing the release of its new Product Disclosure Statements for the “TaxAstute Series”. Centuria TaxAstute Series will be offered across a variety of portfolios. The first of these is known as the Centuria Credit Bond Fund. This Fund seeks to generate before tax returns in excess of the RBA Cash Rate (Benchmark) by 3.5% per annum after fees and expenses. The Fund seeks to do this by investing directly or indirectly in fixed income securities that are expected to deliver income and yield. The second of the portfolios is expected to be released during September 2014.• Funds Under Management grew over the 12 month period – FUM at 30 June 2014 is $714 million (30 June 2013: $710 million). A solid result considering the declining result of Funds under Management over recent years.

24 Centuria Capital Limited
Property Funds Management • Centuria Property Funds Limited as Responsible Entity successfully launched Centuria 8 Central Avenue Fund which facilitated the purchase of 50% interest in 8 Central Avenue, Everleigh for $99.6 million (valued at purchase at $102.0 million) representing Centuria’s largest property purchase to date. Moreover, but just as important, the Fund received Centuria’s first significant overseas wholesale investor through the property funds management arm of SEB, a major Nordic bank, following the opening of Centuria Singapore Office in 2012 (as reported last year).• During the year, the Property division sold 17 assets across the portfolio at an average sale price of approximately $14.3 million per asset. All these assets had reached term and were sold at an average 5% over book value as at 30 June 2013. The sale of these assets is very complementary to Centuria’s longer term strategy of managing larger assets which generate better economies of scale to the Property Funds Management function.• The Company continues to actively work hard at its other strategic growth objective of listing its first Real Estate Investment Trust, under the directive of Nick Collishaw, an experienced executive. • Profit before tax for Centuria Property Funds Management grew substantially to $5.043 million (2013: $3.850 million) for 2014, largely driven by fund and property management fees. Residential Mortgages The Company continues to manage the Residential Mortgage Loan Portfolio diligently, which remains in long-term run down by:• Ensuring a strong relationship is maintained with the warehouse loan facility provider. Accordingly, the current facility has a maturity date extended to 30 August 2015;• Maintaining competitive pricing on its loan products;• Maintaining a high service ethic of the loan portfolio to the highest possible standard via the Company’s in-house personnel;• Playing an active role in industry advocate groups to ensure that management maintains best industry practices; and• Amortising the underlying warehouse debt facility via natural attrition of the portfolio, which will eventually unlock substantial shareholder value and cash flow to be redeployed by the Group. Insurance • Policyholder renewals continue for another year to track at 90%.• The Insurance Agency division contributed a net profit before tax of $1.090 million to the Group’s results.
Significant expenses/adjustments incurred The Group’s net profit for the year contains particular items of non-cash or one off nature that in the opinion of the directors need to be adjusted in order to provide shareholders with a better understanding of the Group’s underlying profit from operations. In the current financial year, the most significant of these relates to the Group’s application of the new fair value measurements required by AASB 13 Fair Value Measurement which was effective from 1 July 2013. AASB 13 requires the Group to include credit risk when determining the fair value of financial assets and liabilities. The impact of this new requirement has resulted in a $5.007 million unrealised gain being recognised, resulting from a decrease in the fair value of financial instruments (interest rate swaps) when including credit risk in the fair value measurement. This new standard is applied prospectively from 1 July 2013, hence there is no comparative.In the prior financial year, the net profit result reflected tax benefits from the disposal of non-core assets amounting to $2.413 million and a discounting charge to the time value of seed capital invested by Centuria Life of $0.772 million. Corporate governance practices The directors have, in striving to achieve the highest standards of corporate behaviour and accountability, complied with the principles and practices set out in the Corporate Governance Statement contained in this annual report. Changes in state of affairs There were no significant changes in the state of affairs of the Group during the financial year. Subsequent events On 22 July 2014, Centuria Capital Limited acquired Centuria Capital Private Limited, an entity incorporated in Singapore.On 22 August 2014, the Board declared a final dividend in respect of the year ended 30 June 2014 of 1.5 cents per share franked to 100%. Dividends In respect of the financial year ended 30 June 2014, an interim dividend of 1.25 cents per share franked to 100% was paid to the holders of fully paid ordinary shares on 27 March 2014 and subsequent to year end, a final dividend of 1.5 cents per share franked to 100% has been declared.
Directors’ Report for the year ended 30 June 2014 (continued)

25Annual Report 2014
Indemnification of officers and auditors CCL has agreed to indemnify all current and former directors and executive officers of the Company and its controlled entities against all liabilities to persons (other than the Company or a related body corporate) which arise out of the performance of their normal duties as a director or executive officer unless the liability relates to conduct involving a lack of good faith. CCL has agreed to indemnify the directors and executive officers against all costs and expenses incurred in defending an action that falls within the scope of the indemnity and any resulting payments. The directors have not included details of the nature of the liabilities covered or the amount of premium paid in respect of the directors’ and officers’ liability and legal expenses insurance contracts, as such disclosure is prohibited under the terms of the contracts. The Company has not otherwise, during or since the end of the financial year, except to the extent permitted by law, indemnified or agreed to indemnify an officer or auditor of the Company or any related body corporate against a liability incurred as such an officer or auditor. Directors’ meetings The following table sets out the number of directors’ meetings (including meetings of committees of directors) held during the financial year and the number of meetings attended by each director (while they were a director or committee member).
Directors Board of Directors Audit, Risk, Management
and Compliance Committee
Investment Committee
Nomination and Remuneration
Committee
R.W. Dobson 8/10 4/6 # 1/1
P.J. Done 10/10 6/6 11/13 1/1
J.R. Slater 10/10 6/6 12/13 1/1
J.E. McBain 10/10 # 10/13 #
J.C. Huljich 10/10 # # #
N.R. Collishaw (Appointed 27 August 2013)
9/9 # # #
# Not a member of the committee. Number of meetings attended/Number of meetings held whilst a member of the Board or Committee.
26 Centuria Capital Limited
Non-audit services Details of amounts paid or payable to the auditor for non-audit services provided during the year are outlined in Note 22 to the financial statements. The directors are satisfied that the provision of non-audit services, during the year, by the auditor (or by another person or firm on the auditor’s behalf) is compatible with the general standard of independence for auditors imposed by the Corporations Act 2001. The directors are of the opinion that the services as disclosed in Note 22 to the financial statements do not compromise the external auditor’s independence, based on advice received from the Audit, Risk Management and Compliance committee, for the following reasons: • All non-audit services have been reviewed and approved to ensure that they do not impact the integrity and objectivity of the auditor; and• None of the services undermine the general principles relating to auditor independence as set out in Code of Conduct APES 110 Code of Ethics for Professional Accountants issued by the Accounting Professional and Ethical Standards Board, including reviewing or auditing the auditor’s own work, acting in a management or decision-making capacity for the Company, acting as advocate for the Company or jointly sharing economic risks and rewards. Auditor’s Independence Declaration The Auditor’s Independence Declaration is included on page 36 of the Annual Report and forms part of the Directors’ Report for the year ended 30 June 2014. Rounding off of amounts The Company is a company of the kind referred to in ASIC Class Order 98/0100, dated 10 July 1998, and in accordance with that Class Order amounts in the Directors’ Report and the financial Report are rounded off to the nearest thousand dollars, unless otherwise indicated.
Directors’ Report for the year ended 30 June 2014 (continued)
27Annual Report 2014
This Remuneration Report, which forms part of the Directors’ Report, sets out information about the remuneration of CCL’s directors and its senior management for the financial year ended 30 June 2014. The prescribed details for each person covered by this report are detailed under the following headings: 1. Director and Senior Management details; 2. Remuneration policy; 3. Relationship between the remuneration policy and company performance; 4. Non-Executive Director remuneration; 5. Remuneration of Executive Directors and Senior Management; 6. All other employees’ remuneration; and 7. Key terms of employment contracts. 1. Director and Senior Management details
The following persons acted as directors of the Company during or since the end of the financial year: • R.W. Dobson (Independent Chairman) • P.J. Done (Independent Director)• J.R. Slater (Independent Director) • J.E. McBain (Group CEO – Centuria Capital and Executive Director)• J.C. Huljich (CEO – Direct Property Trust and Executive Director)• N.R. Collishaw (CEO – Listed Property Funds and Executive Director) Appointed 27 August 2013 The term “Senior Management” is used in this Remuneration Report to refer to the following persons. Except as noted, the named persons held their current position for the whole of the financial year and since the end of the financial year: • M.J. Coy (Chief Financial Officer and Company Secretary) • T.D. Reid (General Manager – Centuria Life Limited and Company Secretary until resignation on 27 May 2014)• D.B. Govey (Head of Assets) 2. Remuneration Policy CCL recognises the important role people play in the achievement of its long-term objectives and as a key source of competitive advantage. To grow and be successful, CCL must be able to attract, motivate and retain capable individuals. CCL’s remuneration policy focuses on the following:• Ensuring competitive rewards are provided to attract and retain executive talent;• Linking remuneration to performance so that higher levels of performance attract higher rewards;
• Aligning rewards of all staff, but particularly executives, to the creation of value to shareholders;• Making sure the criteria used to assess and reward staff include financial and non-financial measures of performance;• Ensuring the overall cost of remuneration is managed and linked to the ability of the Company to pay; and• Ensuring severance payments due to the Chief Executive Officer on termination are limited to pre- established contractual arrangements which do not commit the Group to making any unjustified payments in the event of non-performance. 3. Relationship between the remuneration policy and Company performance The main objective in rewarding the Company executives for their performances is to ensure that shareholders’ wealth is maximised through the Company’s continued growth moving forward. It is necessary to structure and strengthen this focus to drive this strategy so that they are aligned with the Company’s objectives and successes.Under the remuneration policy, senior management’s remuneration includes a fixed remuneration component, short-term and long-term incentive arrangements. The long-term incentives are based on CCL’s performance for the year in reference to specific Earnings per Share (EPS) hurdles and Key Strategic Goals being met. The short-term incentives are based on the individual’s performance in the preceding 12 months compared to pre-agreed goals.Where Senior Management is remunerated with shares, the Remuneration Policy places no limitations to their exposure to risk in relation to the shares. Target incentive remuneration refers to the incentive pay provided for meeting performance requirements. Actual incentive remuneration can vary for executive directors and senior management depending on the extent to which they meet performance requirements.In accordance with the Company’s corporate governance, the structure of non-executive director and executive remuneration is separate and distinct.
4. Non-Executive director remuneration Objective The Board seeks to set aggregate remuneration at a level that provides the Company with the ability to attract and retain directors of the highest calibre, whilst incurring a cost that is acceptable to shareholders. Structure The Constitution and the ASX Listing Rules specify that the aggregate remuneration of non-executive directors shall be determined from time to time by a general meeting. An amount not exceeding the amount determined is then divided between the directors as agreed. Clause 63.2 of the Constitution provides an aggregate maximum amount of not more than $750,000 per year.
Remuneration Report (audited) for the year ended 30 June 2014

28 Centuria Capital Limited
4. Non-Executive Director remuneration (continued) Directors’ fees Each director receives a fee for being a director of Group companies and an additional fee is paid to the Chairman and to the Chairman of each Board Committee. The payment of the additional fees to each Chairman recognises the additional time commitment and responsibility associated with the position. 5. Remuneration of Executive Directors and Senior Management Objective The Company aims to reward executives with a level and mix of remuneration commensurate with their position and responsibilities within the Company so as to:• Reward executives for company, business unit and individual performance against targets set by reference to appropriate benchmarks;• Align the interests of executives with those of stakeholders;• Link rewards with the strategic goals and performance of the Company; and• Ensure total remuneration is competitive by market standards. Structure In determining the level and make-up of executive remuneration, the CEO seeks independent advice regarding market levels of remuneration for comparable executive roles. Remuneration packages include a mix of fixed and variable remuneration and short and long-term performance-based incentives. The proportion of fixed and variable remuneration is established for each executive by the CEO after consultation with the Nomination and Remuneration Committee. While the allocation may vary from period to period, the table below details the approximate fixed and variable components for the executives.
(a) Fixed Remuneration Fixed remuneration consists of base remuneration (which is calculated on a total cost basis and includes any FBT charges related to employee benefits including motor vehicles), as well as employer contributions to superannuation funds. This is reviewed annually by the CEO and the process consists of a review of Company, business unit and individual performance as well as relevant comparative remuneration in the market. The same process is used by the Nomination and Remuneration Committee when reviewing the fixed remuneration of the CEO.The CEO and senior management are given the opportunity to receive their fixed (primary) remuneration in a variety of forms including cash and salary sacrifice items such as motor vehicles, motor vehicle allowances and/or additional superannuation contributions. It is intended that the manner of payment chosen will be optimal without creating undue cost for the Group but always contained in their respective fixed total remuneration. (b) Variable Remuneration Under CCL’s Senior Management Remuneration Policy, long and short-term performance incentives may be made under the Company’s incentive plans. These are discussed further below. (b)(i) Short-term Incentives (STI) The objective of the STI program is to link the achievement of the Group’s operational and financial targets with the remuneration received by the executives charged with meeting those targets. The total potential STI available is set at a level so as to provide sufficient incentive to the executive to achieve operational targets and such that the cost to the Group is reasonable in the circumstances. At the Board’s absolute discretion, employees may be provided with the opportunity to receive an annual, performance-based cash incentive, or the issue of Performance Rights under the Performance Rights Plan, or a combination of both.
Directors Fixed Remuneration
Variable Remuneration
Executive DirectorsJ.E. McBain 80% 20%
J.C. Huljich 80% 20%
N.R. Collishaw 80% 20%
Senior ManagementM.J. Coy 80% 20%
T.D. Reid 80% 20%
D.B. Govey 80% 20%
% of Total Target Annual Remuneration
Remuneration Report (audited) for the year ended 30 June 2014 (continued)

29Annual Report 2014
Performance Rights Plan (PRP) At the 2009 AGM, shareholders approved the issue of up to three million Performance Rights for nil consideration. The PRP applies to executive directors, senior management and other employees within the Group.A Performance Right is one share in the Company for nil consideration (unless otherwise determined by the Board at the time of grant). Performance Rights may not be transferred, or encumbered without the approval of the Board and will not be listed for quotation on any stock exchange.The Board may determine from time to time the performance conditions (if any) that will apply to Performance Rights. Only Performance Rights which satisfy these conditions or which vest following a Change of Control Event will vest and become exercisable.Only those persons employed on the relevant Performance Rights Grant Date by the Company or one of its subsidiaries will be eligible to receive a grant of Performance Rights. The Performance Rights of an eligible employee will be forfeited upon termination of the eligible employee ceasing to be an employee or director of the Company (other than as a result of certain circumstances such as death, total and permanent disability or redundancy or the sale of a CCL company or business which employs the CCL employee or as otherwise determined by the Board).
Incentive Performance Rights These provide eligible employees with a short-term incentive, and the Board may elect to award an employee with either Performance Rights or a cash bonus or a combination of both, bearing in mind the total remuneration the employee is awarded in a particular year.The Performance Rights will vest on, and are exercisable after, dates specified at the time of grant subject to the achievement of certain performance hurdles by the Company. If the capital of the Company is reconstructed then the hurdles will be adjusted as necessary for the plan.
Performance Rights
Grant Date
Number of Performance
Rights Granted
EPS Hurdle Vesting Date
Compensation Performance Rights 10 February 2010 685,308 No EPS hurdle 1 July 2010
Incentive Performance Rights 30 June 2010 300,000 8.96 cents 30 September 2010
Incentive Performance Rights 30 June 2011 700,000 7.50 cents 30 June 2011
Incentive Performance Rights 30 June 2012 85,000 8.00 cents 31 July 2012
Incentive Performance Rights 29 August 2013 144,310 8.20 cents 29 August 2013
(i) CCL issued 685,308 new shares in July 2010 in respect of the Compensation Performance Rights. All other Incentive Performance Rights issued to date have been satisfied by Treasury shares held by the Centuria Employee Share Trust (the Trust) which were acquired by the Trust as part of the Unmarketable Parcel Selling Plan executed by the Company.
(ii) Based on underlying net profit after tax, the EPS hurdle wasn’t met at 30 June 2012; hence only a discretionary 85,000 performance rights were granted.
(iii) Based on underlying net profit after tax, the EPS hurdle was met at 30 June 2013 and 144,310 Incentive Performance Rights vested. A cash bonus equivalent to 685,691 Performance Rights was also issued.
(iv) There are 399,691 Performance Rights available for potential future issuance by the Nomination and Remuneration Committee.
(i)
(ii)
(iii)

30 Centuria Capital Limited
5. Remuneration of Executive Directors and Senior Management (continued)
(b)(ii) Long-term incentive (LTI) Following a review of the Company’s incentive arrangements for executive directors and select senior management roles undertaken in the previous financial year, the Board approved the adoption of the Centuria Capital Limited Executive Incentive Plan (“LTI Plan”).The new LTI Plan forms a key element of the Company’s incentive and retention strategy for senior executives and is the Company’s principal vehicle to grant long-term incentive awards.The Board considers long-term incentive awards to be an important component to the remuneration of senior executives, and therefore, the primary objectives of the Plan include:• Focusing executives on the longer term performance of the Group to drive long-term shareholder value creation;• Ensuring executive remuneration outcomes are aligned with shareholder interests, in particular, the strategic goals and performance of the Group; and• Ensuring remuneration is competitive and aligned with general market practice by ASX listed companies. A summary of the key terms of the Performance Rights awarded during the current year are set out below. Performance Rights issued under the LTI Plan are issued in accordance with the thresholds approved at the 2013 AGM.
Term Detail
Performance Rights Each Performance Right is a right to receive a fully paid ordinary share in the Company (“Share”), subject to meeting the Performance Conditions.
Upon meeting the Performance Conditions, the Performance Rights vest and Shares are allocated. Performance Rights do not carry a right to vote or to dividends or, in general, a right to participate in other corporate actions such as bonus issues.
Vesting Conditions The Performance Rights will vest to the extent that the Board determines that:
• The Performance Conditions that apply to the Performance Rights were satisfied; and
• The employee was continuously employed by the Company until the end of the Performance Period.
Vesting Date The date on which the Board determines the extent to which the Performance Conditions are satisfied and the Performance Rights vest.
Performance Conditions The Performance Conditions and portion of Performance Rights tested against each hurdle granted in the current year are:
• Earnings Per Share (EPS) – 70% (“EPS Hurdle”) • Key Strategic Goals:
– Growth in property and friendly society funds under management – 15% (“Growth in FUM Hurdle”)
– Absolute Total Shareholder Return Performance – 15% (“Absolute TSR Hurdle”)
Remuneration Report (audited) for the year ended 30 June 2014 (continued)

31Annual Report 2014
Further details on the Performance Conditions are set out below. EPS Hurdle The percentage of Performance Rights subject to the EPS Hurdle that vest, if any, will be determined as follows:
Performance Rights subject to EPS Hurdle that vest (%)
Maximum % or above 12.5% or greater 100%
Between threshold % and maximum % More than 7.5%, less than 12.5% Progressive pro-rata vesting between 50% to 100% (i.e. on a straight-line basis)
Threshold % 7.5% 50%
Less than the threshold % Less than 7.5% 0%
Annual compound growth in underlying EPS over the Performance Period
The Board retains a discretion to adjust the EPS performance hurdle to ensure that participants are neither advantaged nor disadvantaged by matters outside managements’ control that affect EPS (for example, by excluding one-off non-recurrent items or the impact of significant acquisitions or disposals). Growth in FUM Hurdle The percentage of Performance Rights subject to the Growth in FUM Hurdle that vest, if any, will be determined as follows:
Performance Rights subject to Growth Hurdle that vest (%)
Maximum % or above 25% or greater 100%
Between threshold % and maximum % More than 15%, less than 25% Progressive pro-rata vesting between 50% to 100% (i.e. on a straight-line basis)
Threshold % 15% 50%
Less than the threshold % Less than 15% 0%
Annual compound growth in FUM over the Performance Period
Absolute TSR Hurdle The percentage of Performance Rights subject to the Absolute TSR Hurdle that vest, if any, will be determined as follows:
Performance Rights subject to Absolute TSR Hurdle that vest (%)
Maximum % or above 18% or greater 100%
Between threshold % and maximum % More than 12%, less than 18% Progressive pro-rata vesting between 50% to 100% (i.e. on a straight-line basis)
Threshold % 12% 50%
Less than the threshold % Less than 12% 0%
Annual compound growth in Absolute TSR over the Performance Period
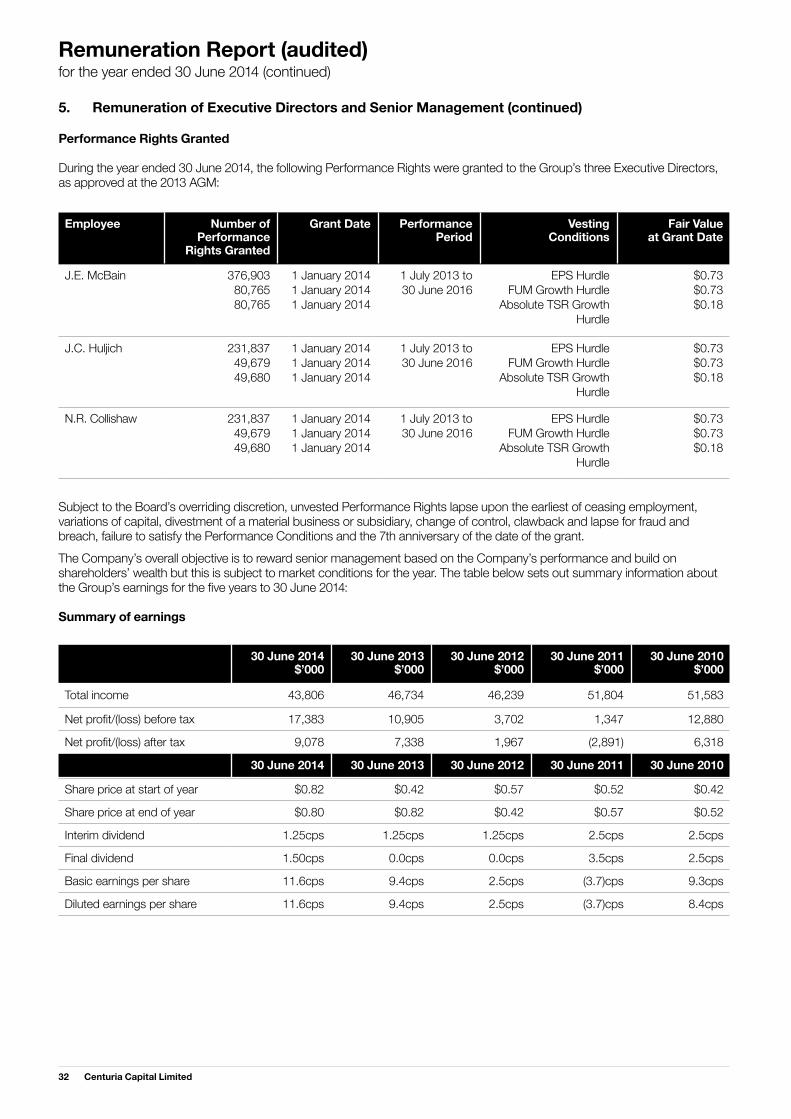
32 Centuria Capital Limited
5. Remuneration of Executive Directors and Senior Management (continued) Performance Rights Granted During the year ended 30 June 2014, the following Performance Rights were granted to the Group’s three Executive Directors, as approved at the 2013 AGM:
Employee Number of Performance
Rights Granted
Grant Date Performance Period
Vesting Conditions
Fair Value at Grant Date
J.E. McBain 376,90380,76580,765
1 January 20141 January 20141 January 2014
1 July 2013 to30 June 2016
EPS HurdleFUM Growth Hurdle
Absolute TSR Growth Hurdle
$0.73$0.73$0.18
J.C. Huljich 231,83749,67949,680
1 January 20141 January 20141 January 2014
1 July 2013 to30 June 2016
EPS HurdleFUM Growth Hurdle
Absolute TSR Growth Hurdle
$0.73$0.73$0.18
N.R. Collishaw 231,83749,67949,680
1 January 20141 January 20141 January 2014
1 July 2013 to30 June 2016
EPS HurdleFUM Growth Hurdle
Absolute TSR Growth Hurdle
$0.73$0.73$0.18
Subject to the Board’s overriding discretion, unvested Performance Rights lapse upon the earliest of ceasing employment, variations of capital, divestment of a material business or subsidiary, change of control, clawback and lapse for fraud and breach, failure to satisfy the Performance Conditions and the 7th anniversary of the date of the grant.The Company’s overall objective is to reward senior management based on the Company’s performance and build on shareholders’ wealth but this is subject to market conditions for the year. The table below sets out summary information about the Group’s earnings for the five years to 30 June 2014: Summary of earnings
30 June 2014$’000
30 June 2013$’000
30 June 2012$’000
30 June 2011$’000
30 June 2010$’000
Total income 43,806 46,734 46,239 51,804 51,583
Net profit/(loss) before tax 17,383 10,905 3,702 1,347 12,880
Net profit/(loss) after tax 9,078 7,338 1,967 (2,891) 6,318
30 June 2014 30 June 2013 30 June 2012 30 June 2011 30 June 2010
Share price at start of year $0.82 $0.42 $0.57 $0.52 $0.42
Share price at end of year $0.80 $0.82 $0.42 $0.57 $0.52
Interim dividend 1.25cps 1.25cps 1.25cps 2.5cps 2.5cps
Final dividend 1.50cps 0.0cps 0.0cps 3.5cps 2.5cps
Basic earnings per share 11.6cps 9.4cps 2.5cps (3.7)cps 9.3cps
Diluted earnings per share 11.6cps 9.4cps 2.5cps (3.7)cps 8.4cps
Remuneration Report (audited) for the year ended 30 June 2014 (continued)

33Annual Report 2014
Remuneration for the year ended 30 June 2014
Post Employment
Benefits
Share-based Payment
Total
Salaries$
Fees$
Bonus $
Car allowance$
Superannuation$
Share issue$
$
Directors
R.W. Dobson – 140,000 – – 12,950 – 152,950
J.E. McBain 514,261 – 80,873 – 24,000 73,631 692,765
J.C. Huljich 463,842 – 74,641 15,000 17,775 45,291 616,549
P.J. Done – 120,000 – – 11,100 – 131,100
J.R. Slater – 98,266 – – 9,090 – 107,356
N.R. Collishaw (i),(ii) 482,442 – 75,120 – 17,776 45,291 620,629
Sub-total 1,460,545 358,266 230,634 15,000 92,691 164,213 2,321,349
M.J. Coy 351,738 – 55,591 – 17,775 – 425,104
T.D. Reid 217,894 – 11,111 – 17,775 – 246,780
D.B. Govey 312,724 – 50,564 – 25,000 – 388,288
Sub-total 882,356 – 117,266 – 60,550 – 1,060,172
Grand total 2,342,901 358,266 347,900 15,000 153,241 164,213 3,381,521
(i) N.R. Collishaw commenced employment on 1 May 2013 and was appointed as a Director on 27 August 2013.
(ii) At the time of his employment in May 2013, Mr. Collishaw became eligible to receive a one-off $500,000 incentive payment upon successful listing of a listed property fund once the fund reaches $500 million of assets under management.
No directors or senior management person appointed during the period received a payment as part of his or her consideration for agreeing to hold the position. Non-executive Directors’ Remuneration The aggregate Non-Executive Directors’ Remuneration paid in 2014 was $391,406 (2013: $316,861).
Short-term employee benefits
Senior Management
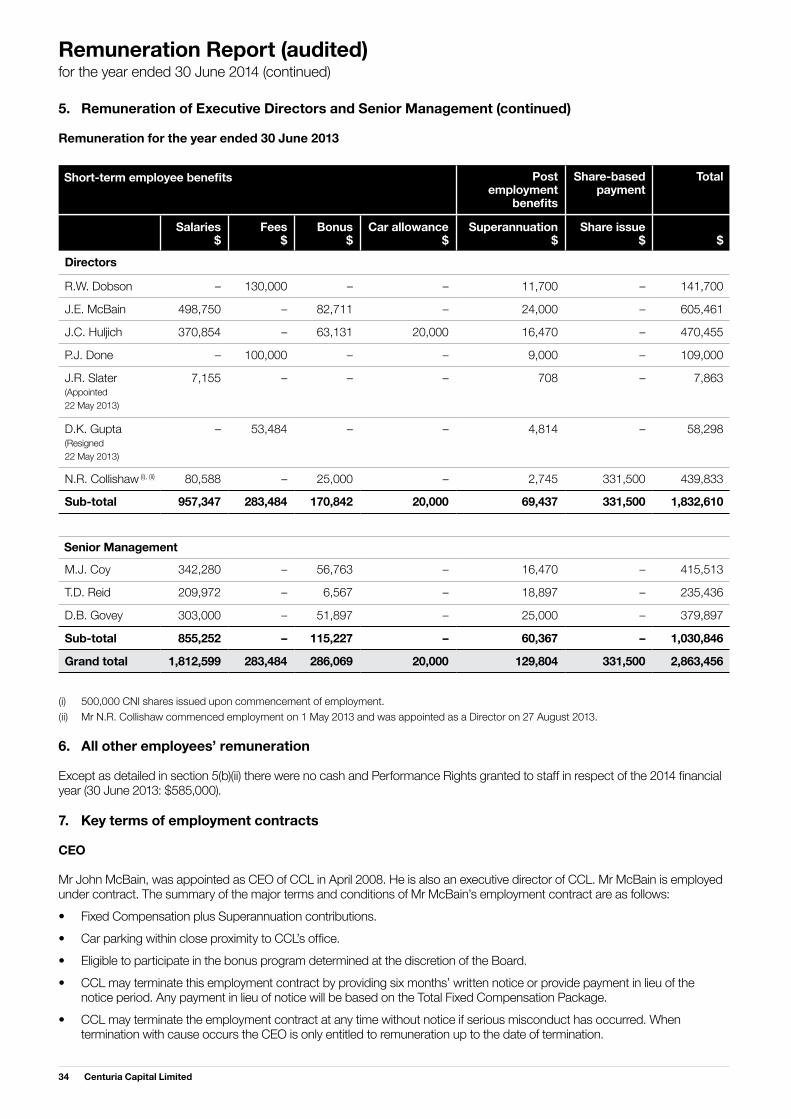
34 Centuria Capital Limited
5. Remuneration of Executive Directors and Senior Management (continued) Remuneration for the year ended 30 June 2013
Post employment
benefits
Share-based payment
Total
Salaries$
Fees$
Bonus $
Car allowance$
Superannuation$
Share issue$
$
Directors
R.W. Dobson – 130,000 – – 11,700 – 141,700
J.E. McBain 498,750 – 82,711 – 24,000 – 605,461
J.C. Huljich 370,854 – 63,131 20,000 16,470 – 470,455
P.J. Done – 100,000 – – 9,000 – 109,000
J.R. Slater (Appointed 22 May 2013)
7,155 – – – 708 – 7,863
D.K. Gupta (Resigned 22 May 2013)
– 53,484 – – 4,814 – 58,298
N.R. Collishaw (i), (ii) 80,588 – 25,000 – 2,745 331,500 439,833
Sub-total 957,347 283,484 170,842 20,000 69,437 331,500 1,832,610
M.J. Coy 342,280 – 56,763 – 16,470 – 415,513
T.D. Reid 209,972 – 6,567 – 18,897 – 235,436
D.B. Govey 303,000 – 51,897 – 25,000 – 379,897
Sub-total 855,252 – 115,227 – 60,367 – 1,030,846
Grand total 1,812,599 283,484 286,069 20,000 129,804 331,500 2,863,456
(i) 500,000 CNI shares issued upon commencement of employment. (ii) Mr N.R. Collishaw commenced employment on 1 May 2013 and was appointed as a Director on 27 August 2013.
6. All other employees’ remuneration Except as detailed in section 5(b)(ii) there were no cash and Performance Rights granted to staff in respect of the 2014 financial year (30 June 2013: $585,000). 7. Key terms of employment contracts CEO Mr John McBain, was appointed as CEO of CCL in April 2008. He is also an executive director of CCL. Mr McBain is employed under contract. The summary of the major terms and conditions of Mr McBain’s employment contract are as follows: • Fixed Compensation plus Superannuation contributions.• Car parking within close proximity to CCL’s office.• Eligible to participate in the bonus program determined at the discretion of the Board. • CCL may terminate this employment contract by providing six months’ written notice or provide payment in lieu of the notice period. Any payment in lieu of notice will be based on the Total Fixed Compensation Package. • CCL may terminate the employment contract at any time without notice if serious misconduct has occurred. When termination with cause occurs the CEO is only entitled to remuneration up to the date of termination.
Short-term employee benefits
Remuneration Report (audited) for the year ended 30 June 2014 (continued)
Senior Management

35Annual Report 2014
Other executives (standard contracts) All executives are employed under contract. The Company may terminate the executive’s employment agreement by providing between one and six months written notice or providing payment in lieu of the notice period (based on the Total Fixed Compensation Package). On behalf of the Board
R.W. Dobson P.J. Done Chairman Director Chairman – Audit, Risk Management and Compliance Committee
Sydney 22 August 2014
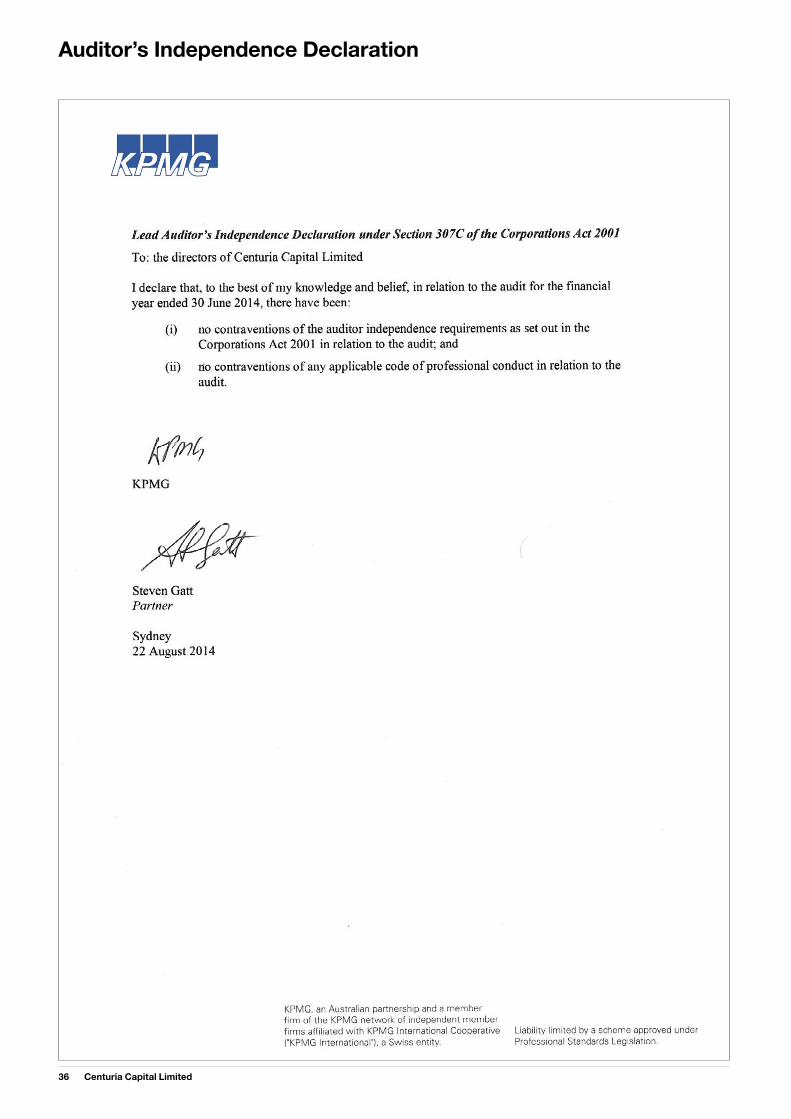
36 Centuria Capital Limited
Auditor’s Independence Declaration

37Annual Report 2014
Independent Auditor’s Report

38 Centuria Capital Limited
Independent Auditor’s Report
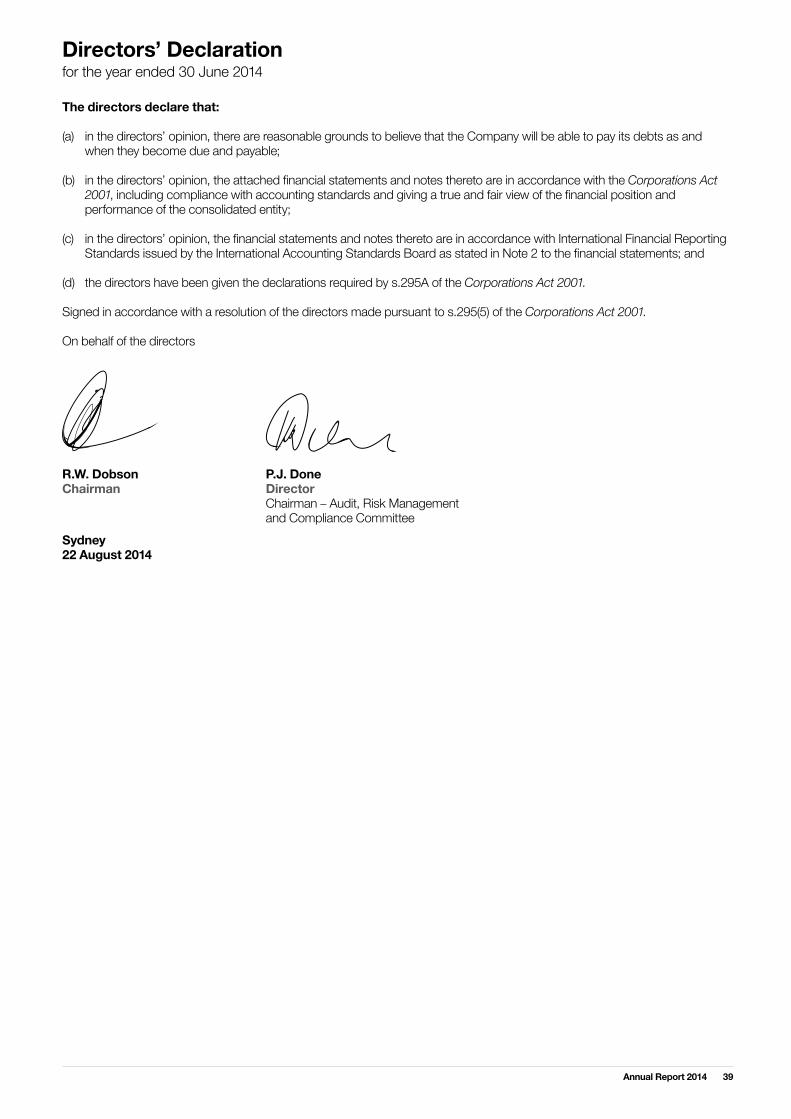
39Annual Report 2014
Directors’ Declaration for the year ended 30 June 2014
The directors declare that: (a) in the directors’ opinion, there are reasonable grounds to believe that the Company will be able to pay its debts as and when they become due and payable; (b) in the directors’ opinion, the attached financial statements and notes thereto are in accordance with the Corporations Act 2001, including compliance with accounting standards and giving a true and fair view of the financial position and performance of the consolidated entity; (c) in the directors’ opinion, the financial statements and notes thereto are in accordance with International Financial Reporting Standards issued by the International Accounting Standards Board as stated in Note 2 to the financial statements; and (d) the directors have been given the declarations required by s.295A of the Corporations Act 2001. Signed in accordance with a resolution of the directors made pursuant to s.295(5) of the Corporations Act 2001. On behalf of the directors R.W. Dobson P.J. Done Chairman Director Chairman – Audit, Risk Management and Compliance CommitteeSydney 22 August 2014

40 Centuria Capital Limited
Consolidated statement of comprehensive income for the year ended 30 June 2014
Note 2014$’000
2013 $’000
Revenue 3(i) 40,499 44,146
Net revenue from Benefit Funds 3(ii) 3,307 2,533
Share of gain of associates 10 – 55
Total income 43,806 46,734
Finance costs 4 (10,239) (12,419)
Employee benefits expense 5(a) (10,888) (9,314)
Administrative and other expenses 5(b) (10,303) (14,096)
Unrealised gain arising from fair value movements of derivative financial instruments
25(c) 5,007 –
Profit before tax 17,383 10,905
Income tax expense relating to shareholders 6(a) (4,998) (1,034)
Income tax expense relating to Benefit Funds 3(ii) (3,307) (2,533)
Total income tax expense 6(a) (8,305) (3,567)
Profit for the year 9,078 7,338
Other comprehensive income:
Gain on cash flow hedges taken to equity 19(b) 490 408
Income tax expense relating to components of other comprehensive income 6(b) (147) (122)
Other comprehensive income for the year (net of tax) 343 286
Total comprehensive income for the year 9,421 7,624
Earnings per share
Basic (cents per share) 7 11.6 9.4
Diluted (cents per share) 7 11.6 9.4
The Consolidated result aggregates the financial results of the Group, including the Benefit Funds (refer to Note 2(a)).

41Annual Report 2014
Note 2014$’000
2013 $’000
Assets
Cash and cash equivalents 24 13,115 9,285
Trade and other receivables 8 11,004 13,290
Financial assets at fair value through profit and loss 9 285 3,154
Other financial assets 9 170,321 185,848
Prepayments 1,421 1,382
Investment in associates 10 668 668
Plant and equipment 11 1,031 728
Assets in respect of Benefit Funds 18(ii) 411,238 435,459
Deferred tax assets 6(d) 3,838 6,662
Income tax receivable 6(c) 1,399 7,451
Intangible assets 12 53,025 53,109
Total assets 667,345 717,036
Liabilities
Trade and other payables 13 8,086 16,921
Borrowings 14 126,236 147,298
Other liabilities 16 1,082 678
Derivative financial liabilities 17 14,967 20,141
Liabilities in respect of Benefit Funds 18(ii) 411,238 435,459
Provisions 15 1,185 1,129
Total liabilities 562,794 621,626
Net assets 104,551 95,410
Equity
Contributed equity 19(a) 89,167 88,634
Cash flow hedge reserve 19(b) (38) (381)
Share-based payment reserve 19(c) 164 –
Profits reserves 19(d) 14,491 6,390
Retained earnings 19(e) 767 767
Total equity 104,551 95,410
The Consolidated result aggregates the financial results of the Group, including the Benefit Funds (refer to Note 2(a)).
Consolidated statement of financial position for the year ended 30 June 2014
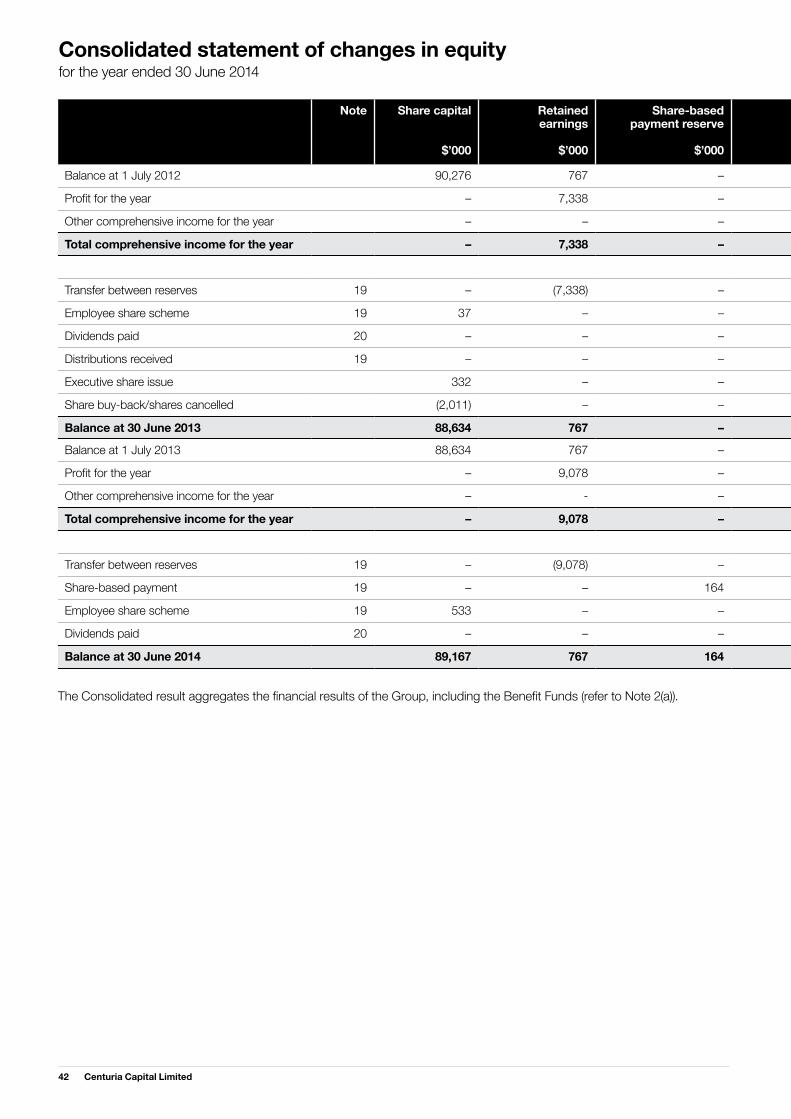
42 Centuria Capital Limited
Consolidated statement of changes in equity for the year ended 30 June 2014
The Consolidated result aggregates the financial results of the Group, including the Benefit Funds (refer to Note 2(a)).
Note Share capital
$’000
Retained earnings
$’000
Share-based payment reserve
$’000
Profits reserve
$’000
Cash flow hedge reserve
$’000
Attributable to equity holders of the parent
$’000
Non-controlling interests
$’000
Total
$’000
Balance at 1 July 2012 90,276 767 – – (667) 90,376 – 90,376
Profit for the year – 7,338 – – – 7,338 – 7,338
Other comprehensive income for the year – – – – 286 286 – 286
Total comprehensive income for the year – 7,338 – – 286 7,624 – 7,624
Transfer between reserves 19 – (7,338) – 7,338 – – – –
Employee share scheme 19 37 – – – – 37 – 37
Dividends paid 20 – – – (970) – (970) – (970)
Distributions received 19 – – – 22 – 22 – 22
Executive share issue 332 – – – – 332 – 332
Share buy-back/shares cancelled (2,011) – – – – (2,011) – (2,011)
Balance at 30 June 2013 88,634 767 – 6,390 (381) 95,410 – 95,410
Balance at 1 July 2013 88,634 767 – 6,390 (381) 95,410 – 95,410
Profit for the year – 9,078 – – - 9,078 – 9,078
Other comprehensive income for the year – - – – 343 343 – 343
Total comprehensive income for the year – 9,078 – – 343 9,421 – 9,421
Transfer between reserves 19 – (9,078) – 9,078 – – – –
Share-based payment 19 – – 164 – – 164 – 164
Employee share scheme 19 533 – – – – 533 – 533
Dividends paid 20 – – – (977) – (977) – (977)
Balance at 30 June 2014 89,167 767 164 14,491 (38) 104,551 – 104,551

43Annual Report 2014
Note Share capital
$’000
Retained earnings
$’000
Share-based payment reserve
$’000
Profits reserve
$’000
Cash flow hedge reserve
$’000
Attributable to equity holders of the parent
$’000
Non-controlling interests
$’000
Total
$’000
Balance at 1 July 2012 90,276 767 – – (667) 90,376 – 90,376
Profit for the year – 7,338 – – – 7,338 – 7,338
Other comprehensive income for the year – – – – 286 286 – 286
Total comprehensive income for the year – 7,338 – – 286 7,624 – 7,624
Transfer between reserves 19 – (7,338) – 7,338 – – – –
Employee share scheme 19 37 – – – – 37 – 37
Dividends paid 20 – – – (970) – (970) – (970)
Distributions received 19 – – – 22 – 22 – 22
Executive share issue 332 – – – – 332 – 332
Share buy-back/shares cancelled (2,011) – – – – (2,011) – (2,011)
Balance at 30 June 2013 88,634 767 – 6,390 (381) 95,410 – 95,410
Balance at 1 July 2013 88,634 767 – 6,390 (381) 95,410 – 95,410
Profit for the year – 9,078 – – - 9,078 – 9,078
Other comprehensive income for the year – - – – 343 343 – 343
Total comprehensive income for the year – 9,078 – – 343 9,421 – 9,421
Transfer between reserves 19 – (9,078) – 9,078 – – – –
Share-based payment 19 – – 164 – – 164 – 164
Employee share scheme 19 533 – – – – 533 – 533
Dividends paid 20 – – – (977) – (977) – (977)
Balance at 30 June 2014 89,167 767 164 14,491 (38) 104,551 – 104,551
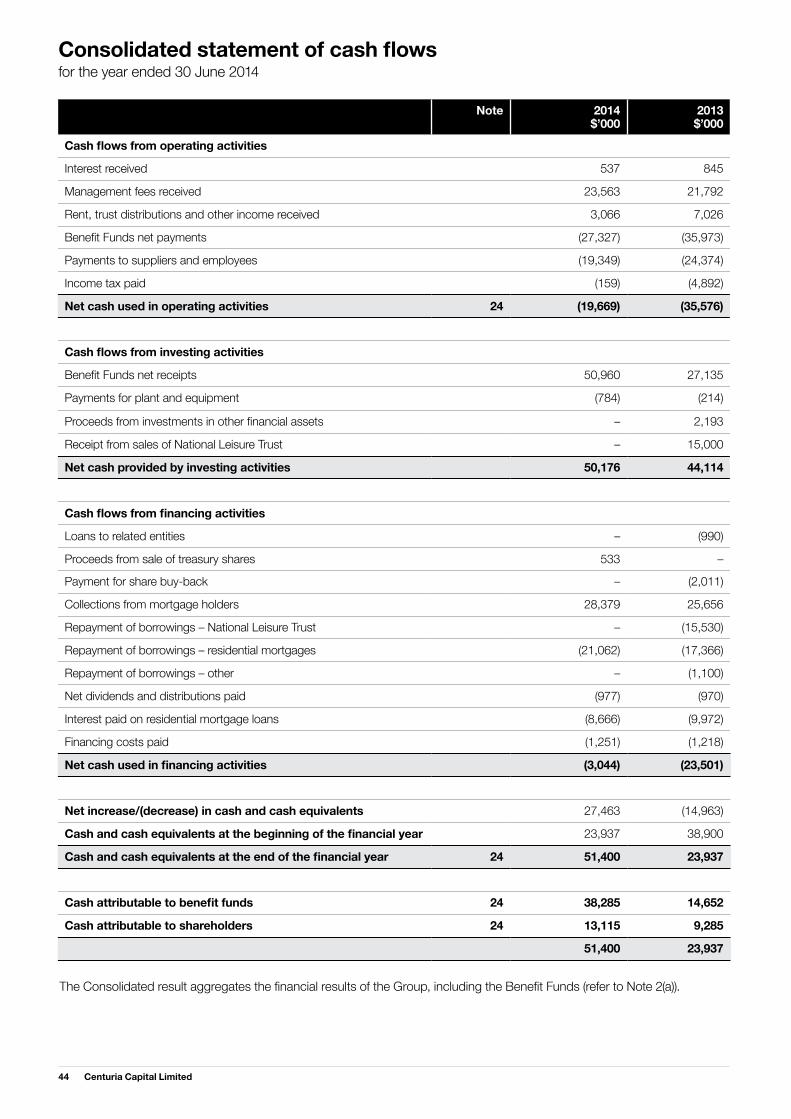
44 Centuria Capital Limited
Consolidated statement of cash flows for the year ended 30 June 2014
Note 2014$’000
2013 $’000
Cash flows from operating activities
Interest received 537 845
Management fees received 23,563 21,792
Rent, trust distributions and other income received 3,066 7,026
Benefit Funds net payments (27,327) (35,973)
Payments to suppliers and employees (19,349) (24,374)
Income tax paid (159) (4,892)
Net cash used in operating activities 24 (19,669) (35,576)
Cash flows from investing activities
Benefit Funds net receipts 50,960 27,135
Payments for plant and equipment (784) (214)
Proceeds from investments in other financial assets – 2,193
Receipt from sales of National Leisure Trust – 15,000
Net cash provided by investing activities 50,176 44,114
Cash flows from financing activities
Loans to related entities – (990)
Proceeds from sale of treasury shares 533 –
Payment for share buy-back – (2,011)
Collections from mortgage holders 28,379 25,656
Repayment of borrowings – National Leisure Trust – (15,530)
Repayment of borrowings – residential mortgages (21,062) (17,366)
Repayment of borrowings – other – (1,100)
Net dividends and distributions paid (977) (970)
Interest paid on residential mortgage loans (8,666) (9,972)
Financing costs paid (1,251) (1,218)
Net cash used in financing activities (3,044) (23,501)
Net increase/(decrease) in cash and cash equivalents 27,463 (14,963)
Cash and cash equivalents at the beginning of the financial year 23,937 38,900
Cash and cash equivalents at the end of the financial year 24 51,400 23,937
Cash attributable to benefit funds 24 38,285 14,652
Cash attributable to shareholders 24 13,115 9,285
51,400 23,937
The Consolidated result aggregates the financial results of the Group, including the Benefit Funds (refer to Note 2(a)).

45Annual Report 2014
Notes to the Consolidated Financial Statements for the year ended 30 June 2014
1. General information Centuria Capital Limited (the Company or CCL) is a public company listed on the Australian Stock Exchange (trading under the symbol CNI), incorporated and operating in Australia. The Consolidated Financial Statements for the year ended 30 June 2014, comprise the financial statements of the Company and its subsidiaries (together “the Group”). As discussed in Note 2(a), the Company is required by AASB 1038 Life Insurance Contracts to recognise the assets, liabilities, income, expenses and equity of the benefit funds of its subsidiary, Centuria Life Limited.CCL’s registered office and its principal place of business are as follows: Registered office Principal place of business Level 39 Level 39 100 Miller Street 100 Miller Street Sydney NSW 2060 Sydney NSW 2060 Tel: 1300 50 50 50 Tel: 1300 50 50 50 The Company is a for-profit entity and its principal activities are the marketing and management of investment products, general insurance through agency arrangements, mortgage lending and property funds management. 2. Significant accounting policies Statement of compliance The consolidated financial statements are general purpose financial statements which have been prepared in accordance with Australian Accounting Standards (AASBs) adopted by the Australian Accounting Standards Board (AASB) and the Corporations Act 2001. The consolidated financial statements comply with International Financial Reporting Standards (IFRS) adopted by the International Accounting Standards Board (IASB).The consolidated financial statements were authorised for issue by the directors on 22 August 2014. Basis of preparation The financial statements have been prepared on the basis of historical cost, except for investment properties and those financial assets and financial liabilities which have been valued at fair value through profit or loss. Cost is based on the fair values of the consideration given in exchange for assets. All amounts are presented in Australian dollars, which is the company’s functional currency, unless otherwise noted. The Company is a company of the kind referred to in ASIC Class Order 98/0100, dated 10 July 1998, and in accordance with that Class Order amounts in the financial report are rounded off to the nearest thousand dollars, unless otherwise indicated. Going concern The directors have prepared the financial report on a going concern basis, which assumes continuity of normal business activities and the realisation of assets and the settlement of liabilities in the ordinary course
of business. The going concern assumption has been formed after considering a number of factors including the cashflow forecast of the business for the next 12 months, the availability of debt finance and projected covenant compliance. Critical accounting judgements and key sources of estimation uncertainty In the application of the Group’s accounting policies, management is required to make judgements, estimates and assumptions about carrying values of assets and liabilities that are not readily apparent from other sources. The estimates and associated assumptions are based on historical experience and other factors that are considered to be relevant. Actual results may differ from these estimates. The estimates and underlying assumptions are reviewed on an ongoing basis. Revisions to accounting estimates are recognised in the period in which the estimate is revised if the revision affects only that period, or in the period of the revision and future periods if the revision affects both current and future periods. Key judgements Information about critical judgements in applying accounting policies that have the most significant effect on the amounts recognised in the financial statements is included in the following notes:• Note 12 – Goodwill.• Note 25 – Financial Instruments . Critical estimates in applying the entity’s accounting policies A Financial Condition Report was prepared by Centuria Life’s Appointed Actuary, Mr Guy Thorburn, BEc, FIAA, ASA. This report covers Benefit Fund liabilities and prudential reserves. The effective date of the report is 30 June 2014.The amount of the Benefit Fund liabilities has been determined in accordance with the methods and assumptions disclosed in the Financial Condition Report.Policyholder liabilities for benefit funds, other than the Funeral Benefit Fund, are valued using the accumulation method and are equal to the contributions made by members, net of fees, together with bonus additions to date. The balance of the fund is the unvested policyholder benefit liabilities (or surplus). Each year’s bonus declaration results in a movement from unvested policyholder benefit liabilities to the vested policy liability. The bonus rate is limited to ensure that the amount vesting is no more than the distributable portion of unvested policyholder benefit liabilities.For the Funeral Benefit Fund, the policyholder liability has been taken to be the value of assets of the fund net of other liabilities less the value of the current period bonus. This liability represents the present value of guaranteed benefits (pre-bonus) plus the present value of future bonuses. Following declaration of the bonus, there would then be no surplus under this arrangement. The Over Fifty Guardian Friendly Society (“the Society”) currently deducts management fees based on the fund’s assets from investment earnings. It has been assumed that interest will be earned in future years at rates after tax sufficient at least to meet this level of expense.

46 Centuria Capital Limited
Notes to the Consolidated Financial Statements for the year ended 30 June 2014 (continued)
2. Significant accounting policies Critical estimates in applying the entity’s accounting policies (continued) The main variables that determine the bonus rate for a Benefit Fund are the value of the net assets of each benefit fund at the end of the year, the amounts standing to the credit of each investment account through the previous year and the investment return (net of fees and taxes where applicable) earned by the fund throughout the year. The excess of the net assets of the benefit fund over the liabilities after meeting the prudential standards is the surplus that is generally able to be distributed to members as a bonus.There is no provision in the funds’ rules for any surplus to be transferred to the Management Fund. The Management Fund receives specified fee transfers from the funds to cover expenses. All remaining assets are to be used to provide benefits to members. Changes in economic conditions and demographics will alter the unallocated surplus. The Capital Requirements, as set by APRA, aim to ensure there is sufficient unallocated surplus to cover the effect of these changes.APRA has provided the Society with temporary transitional relief from the Capital Adequacy Requirements to the extent of $12.8 million for the period to 31 December 2014, at which point management and APRA will re-establish future transitional relief requirements based on the profile of the assets within the Funds. The expected recovery by Centuria Capital Limited of seed capital it has transferred into the Society’s Benefit Funds and the potential contribution of future injections of seed capital is dependent on the underlying performance of the Funds’ net assets. (a) Basis of consolidation The consolidated financial statements incorporate the financial statements of the Company and entities (including special purpose entities) controlled by the Company (its subsidiaries). Control is achieved where the Company has the power to govern the financial and operating policies of an entity so as to obtain benefits from its activities.CCL, as prescribed by AASB 1038 Life Insurance Contracts, is required to recognise the assets, liabilities, income, expenses and equity of the benefit funds which it manages, in its consolidated financial statements. The assets and liabilities of the Benefit Funds do not impact the net profit after tax or the equity attributable to the equity holders of CCL.CCL has majority representation on the Board of the Over Fifty Guardian Friendly Society Limited (Guardian). However, as Guardian is a mutual organisation, CCL has no legal rights to Guardian’s net assets, nor does it derive any benefit from exercising its power and therefore does not control Guardian. Intra-group balances and transactions, and any unrealised income and expenses arising from intra-group transactions, are eliminated in preparing the consolidated financial statements. Unrealised gains arising from transactions with equity-accounted investees are eliminated against the investment to the extent of the Group’s interest in the investee. Unrealised losses are eliminated in the same way
as unrealised gains, but only to the extent that there is no evidence of impairment. (b) Business combinations Acquisitions of subsidiaries and businesses are accounted for using the acquisition method. The consideration for each acquisition is measured at the aggregate of the fair values (at the date of exchange) of assets given, liabilities incurred or assumed, and equity instruments issued by the Group in exchange for control of the acquiree. Acquisition-related costs are recognised in profit or loss as incurred.Where applicable, the consideration for the acquisition includes any asset or liability resulting from a contingent consideration arrangement, measured at its acquisition date fair value. Subsequent changes in such fair values are adjusted against the cost of acquisition where they qualify as measurement period adjustments (see below). All other subsequent changes in the fair value of contingent consideration classified as a liability are recognised in profit or loss. Changes in the fair value of contingent consideration classified as equity are not remeasured.The interest of minority shareholders in the acquiree is initially measured at the minority’s proportion of the net fair value of the assets, liabilities and contingent liabilities recognised.Where a business combination is achieved in stages, the Group’s previously held interests in the acquired entity are remeasured to fair value at the acquisition date (i.e. the date the Group attains control) and the resulting gain or loss, if any, is recognised in profit or loss. Amounts arising from interests in the acquiree prior to the acquisition date that have previously been recognised in other comprehensive income are reclassified to profit or loss, where such treatment would be appropriate if that interest were disposed of.The acquiree’s identifiable assets, liabilities and contingent liabilities that meet the conditions for recognition under AASB 3 are recognised at their fair value at the acquisition date, except for:• deferred tax assets or liabilities and liabilities or assets related to employee benefit arrangements are recognised and measured in accordance with AASB 112 Income Taxes and AASB 119 Employee Benefits respectively;• liabilities or equity instruments related to the replacement by the Group of an acquiree’s share- based payment awards are measured in accordance with AASB 2 Share-based Payments; and• assets (or disposal groups) that are classified as held for sale in accordance with AASB 5 Non-current Assets Held for Sale and Discontinued Operations are measured in accordance with that Standard.If the initial accounting for a business combination is incomplete by the end of the reporting period in which the combination occurs, the Group reports provisional amounts for the items for which the accounting is incomplete. Those provisional amounts are adjusted during the measurement period (see below), or additional assets or liabilities are recognised, to reflect new information obtained about facts and circumstances that existed as of the acquisition date

47Annual Report 2014
that, if known, would have affected the amounts recognised as of that date.The measurement period is the period from the date of acquisition to the date the Group obtains complete information about facts and circumstances that existed as of the acquisition date and is subject to a maximum of one year. (c) Goodwill Goodwill arising in a business combination is recognised as an asset at the date that control is achieved (the acquisition date). Goodwill is measured as the excess of the sum of the consideration transferred, the amount of any non-controlling interests in the acquiree, and the fair value of the acquirer previously held equity interest in the acquiree (if any) over the net of the acquisition date amounts of the identifiable assets acquired and the liabilities assumed.If, after reassessment, the Group’s interest in the fair value of the acquiree’s identifiable net assets exceeds the sum of the consideration transferred, the excess is recognised immediately in the statement of comprehensive income as a bargain purchase gain.Goodwill is reviewed for impairment at least annually. For the purpose of impairment testing, goodwill is allocated to each of the Group’s cash-generating units expected to benefit from the synergies of the combination. Cash-generating units to which goodwill has been allocated are tested for impairment annually, or more frequently when there is an indication that the unit may be impaired. If the recoverable amount of the cash-generating unit is less than its carrying amount, the impairment loss is allocated first to reduce the carrying amount of any goodwill allocated to the unit and then to the other assets of the unit pro-rata on the basis of the carrying amount of each asset in the unit. An impairment loss recognised for goodwill is not reversed in a subsequent period.On disposal of a subsidiary, the attributable amount of goodwill is included in the determination of the profit or loss on disposal.The Group’s policy for goodwill arising on the acquisition of an associate is described in Note 2(d). (d) Investments in associates An associate is an entity over which the Group has significant influence and that is neither a subsidiary nor an interest in a joint venture. Significant influence is the power to participate in the financial and operating policy decisions of the investee but is not control or joint control over those policies.The results and assets and liabilities of associates are incorporated in these financial statements using the equity method of accounting, except when the investment is classified as held for sale, in which case it is accounted for in accordance with AASB 5 Non-current Assets Held for Sale and Discontinued Operations. Under the equity method, investments in associates are carried in the consolidated statement of financial position at cost as adjusted for post-acquisition changes in the Group’s share of the net assets of the associate, less any impairment in the value of individual investments.
Any excess of the cost of acquisition over the Group’s share of the net fair value of the identifiable assets, liabilities and contingent liabilities of the associate recognised at the date of the acquisition is recognised as goodwill. The goodwill is included within the carrying amount of the investment and is assessed for impairment as part of that investment. Any excess of the Group’s share of the net fair value of the identifiable assets, liabilities and contingent liabilities over the cost of the acquisition, after reassessment, is recognised immediately in profit or loss. Where a group entity transacts with an associate of the Group, unrealised profits and losses are eliminated to the extent of the Group’s interest in the relevant associate. (e) Goods and services tax Revenues, expenses and assets are recognised net of the amount of goods and services tax (GST), except:• where the amount of GST incurred is not recoverable from the taxation authority, it is recognised as part of the cost of acquisition of an asset or as part of an item of expense; or• for receivables and payables which are recognised inclusive of GST.The net amount of GST recoverable from, or payable to, the taxation authority is included as part of receivables or payables.Cash flows are included in the statement of cash flows on a gross basis. The GST component of cash flows arising from investing and financing activities which is recoverable from, or payable to, the taxation authority is classified within operating cash flows. (f) Revenue Revenue is measured at the fair value of the consideration received or receivable to the extent it is probable that the economic benefits will flow to the entity and the revenue can be reliably measured. Management fees Management fees are recognised on an accruals basis when the Group has the right to receive payment. Dividend revenue Dividend revenue from investments is recognised when the shareholder’s right to receive payment has been established (provided that it is probable that the economic benefits will flow to the Group and the amount of revenue can be measured reliably). Interest revenue Interest revenue is accrued on a time basis, by reference to the principal outstanding using the effective interest rate method.

48 Centuria Capital Limited
2. Significant accounting policies (continued) (f) Revenue (continued) Rental income Rental income arising on investment properties is accounted for on a straightline basis over the lease term. Lease incentives are amortised over the lease term and netted against rental income. Property acquisition income and sale performance fees Property acquisition income is recognised when an investment property has been acquired in a fund managed by the Group.Sale performance fee income derived from managed funds is recognised upon settlement of the sale of an investment property. Commission and application fee income All insurance agency commissions and application fee income is recognised on an accruals basis when the Group has the right to receive the payment. (g) Taxation Income tax expense represents the sum of the tax currently payable and deferred tax. Current tax The tax currently payable is based on taxable profit for the year. Taxable profit differs from profit as reported in the consolidated profit or loss because of items of income or expense that are taxable or deductible in other years and items that are never taxable or deductible. The Group’s liability for current tax is calculated using tax rates that have been enacted or substantively enacted by the end of the reporting period. Deferred tax Deferred tax is recognised on temporary differences between the carrying amounts of assets and liabilities in the financial statements and the corresponding tax bases used in the computation of taxable profit. Deferred tax liabilities are generally recognised for all taxable temporary differences. Deferred tax assets are generally recognised for all deductible temporary differences to the extent that it is probable that taxable profits will be available against which those deductible temporary differences can be utilised. Deferred tax liabilities are not recognised if the temporary difference arises from the initial goodwill or from the initial recognition (other than in a business combination) of other assets and liabilities in a transaction that affects neither the taxable profit nor the accounting profit.
Deferred tax liabilities are recognised for taxable temporary differences associated with investments in subsidiaries and associates, and interests in joint ventures, except where the Group is unable to control the reversal of the temporary difference and it is probable that the temporary difference will not reverse in the foreseeable future. Deferred tax assets arising from deductible temporary differences associated with such investments and interests are only recognised to the extent that it is probable that there will be sufficient taxable profits against which to utilise the benefits of the temporary differences and they are expected to reverse in the foreseeable future. The carrying amount of deferred tax assets is reviewed at the end of each reporting period and reduced to the extent that it is no longer probable that sufficient taxable profits will be available to allow all or part of the asset to be recovered. Deferred tax assets and liabilities are measured at the tax rates that are expected to apply in the period in which the liability is settled or the asset realised, based on tax rates (and tax laws) that have been enacted or substantively enacted by the end of the reporting period. The measurement of deferred tax liabilities and assets reflects the tax consequences that would follow from the manner in which the Group expects, at the end of the reporting period, to recover or settle the carrying amount of its assets and liabilities. Deferred tax assets and liabilities are offset when there is a legally enforceable right to set off current tax assets against current tax liabilities and when they relate to income taxes levied by the same taxation authority and the Group intends to settle its current tax assets and liabilities on a net basis. Tax consolidation The Company and all its wholly-owned Australian resident entities are part of a tax-consolidated group under Australian taxation law as of 1 July 2003. CCL is the head entity in the tax-consolidated group. Tax expense/benefit, deferred tax liabilities and deferred tax assets arising from temporary differences of the members of the tax-consolidated group are recognised in the separate financial statements of the members of the tax-consolidated group using a ‘stand-alone’ approach based on the allocation specified in the tax funding arrangement. The Benefit Funds are part of the tax consolidated group, and they are allocated a share of the income tax liability attributable to Centuria Life Limited equal to the income tax liability that would have arisen to the Benefit Funds had they been stand-alone. Current and deferred tax for the period Current and deferred tax are recognised as an expense or income in profit or loss, except when they relate to items that are recognised outside profit or loss (whether in other comprehensive income or directly in equity), in which case the tax is also recognised outside profit or loss, or where they arise from the initial accounting for a business combination. In the case of a business combination, the tax effect is included in the accounting for the business combination.
Notes to the Consolidated Financial Statements for the year ended 30 June 2014 (continued)

49Annual Report 2014
(h) Cash and cash equivalents Cash comprises cash on hand and demand deposits. Cash equivalents are short-term, highly liquid investments that are readily convertible to known amounts of cash, which are subject to an insignificant risk of changes in value and have a maturity of three months or less at the date of acquisition. Bank overdrafts are shown within borrowings in the statement of financial position. (i) Financial assets All financial assets are recognised and derecognised on trade date where the purchase or sale of a financial asset is under a contract whose terms require delivery of the financial asset within the timeframe established by the market concerned, and are initially measured at fair value plus transaction costs, except for those financial assets classified as at fair value through profit or loss, which are initially measured at fair value. Effective interest method The effective interest method is a method of calculating the amortised cost of a debt instrument and of allocating interest income over the relevant period. The effective interest rate is the rate that exactly discounts estimated future cash receipts (including all fees on points paid or received that form an integral part of the effective interest rate, transaction costs and other premiums or discounts) through the expected life of the debt instrument, or (where appropriate) a shorter period, to the net carrying amount on initial recognition. Financial assets at fair value through profit or loss Financial assets are classified as financial assets at fair value through profit or loss when the financial asset is either held for trading or it is designated as at fair value through profit or loss. A financial asset is classified as held for trading if: • it has been acquired principally for the purpose of selling in the near term;• on initial recognition it is a part of a portfolio of identified financial instruments that the Group manages together and has a recent actual pattern of short-term profit- taking; or • it is a derivative that is not designated and effective as a hedging instrument. A financial asset other than a financial asset held for trading may be designated as at fair value through profit or loss upon initial recognition if: • such designation eliminates or significantly reduces a measurement or recognition inconsistency that would otherwise arise; or • the financial asset forms part of a group of financial assets or financial liabilities or both, which is managed and its performance is evaluated on a fair value basis, in accordance with investment strategy; or• it forms part of a contract containing an embedded derivative.
Financial assets at fair value through profit or loss are stated at fair value, with any gains or losses arising on remeasurement recognised in profit or loss. The net gain or loss recognised in profit or loss incorporates any dividend or interest earned on the financial asset and is included in the statement of comprehensive income. Fair value is determined in the manner described in Note 25. Other financial assets Other financial assets include residential mortgage loans. Residential mortgage loans are held directly at amortised cost using the effective interest method except for commercial mortgage loans held by the Benefit Funds which are measured at fair value through profit or loss. An allowance for impairment loss is made at year end for specific amounts when there is objective evidence that collection of the full amount is no longer probable. Bad debts are written off when identified. Derecognition of financial assets The Group derecognises a financial asset only when the contractual rights to the cash flows from the asset expire, or it transfers the financial asset and substantially all the risks and rewards of ownership of the asset to another entity. If the Group neither transfers nor retains substantially all the risks and rewards of ownership and continues to control the transferred asset, the Group recognises its retained interest in the asset and an associated liability for amounts it may have to pay. If the Group retains substantially all the risks and rewards of ownership of a transferred financial asset, the Group continues to recognise the financial asset and also recognises a collateralised borrowing for the proceeds received. Impairment of financial assets Financial assets, other than those at fair value through profit or loss, are assessed for indicators of impairment at the end of each reporting period. Financial assets are considered to be impaired where there is objective evidence that, as a result of one or more events that occurred after the initial recognition of the financial asset, the estimated future cash flows of the investment have been affected.When an event occurring after the impairment was recognised causes the amount of impairment loss to decrease, the decrease in impairment loss is reversed through the profit or loss. Loans and receivables Trade receivables, loans and other receivables that have fixed or determinable payments that are not quoted in an active market are classified as “loans and receivables”. Loans and receivables are measured at amortised cost using the effective interest method less impairment.
50 Centuria Capital Limited
2. Significant accounting policies (continued) (j) Plant and equipment Plant and equipment is stated at cost less accumulated depreciation and accumulated impairment losses. Depreciation is recognised so as to write off the cost or valuation of assets less their residual values over their useful lives, using the straight-line method. The estimated useful lives, residual values and depreciation method are reviewed at each year end, with the effect of any changes in estimates accounted for on a prospective basis. The gain or loss arising on disposal or retirement of an item of plant and equipment is determined as the difference between the sales proceeds and the carrying amount of the asset and is recognised in profit or loss. The following useful lives are used in the calculation of depreciation: Plant and equipment : 3–5 years (k) Non-current assets held for sale Non-current assets and disposal groups are classified as held for sale if their carrying amount will be recovered principally through a sale transaction rather than through continuing use. This condition is regarded as met only when the sale is highly probable and the non-current asset (or disposal group) is available for immediate sale in its present condition. Management must be committed to the sale, which should be expected to qualify for recognition as a completed sale within one year from the date of classification. When the Group is committed to a sale plan involving loss of control of a subsidiary, all of the assets and liabilities of that subsidiary are classified as held for sale when the criteria described above are met, regardless of whether the Group will retain a non-controlling interest in its former subsidiary after the sale. Non-current assets (and disposal groups) classified as held for sale are measured at the lower of their previous carrying amount and fair value less costs to sell. (l) Borrowing costs Borrowing costs directly attributable to the acquisition, construction or production of qualifying assets, which are assets that necessarily take a substantial period of time to get ready for their intended use or sale, are added to the cost of those assets, until such time as the assets are substantially ready for their intended use or sale. Investment income earned on the temporary investment of specific borrowings pending their expenditure on qualifying assets is deducted from the borrowing costs eligible for capitalisation. All other borrowing costs are recognised in profit or loss in the period which they are incurred, using the effective interest method.
(m) Leasing Leases are classified as finance leases when the terms of the lease transfer substantially all the risks and rewards of ownership to the lessee. All other leases are classified as operating leases. Group as a lessor Rental income from operating leases is recognised on a straight-line basis over the term of the relevant lease. Initial direct costs incurred in negotiating and arranging an operating lease are added to the carrying amount of the leased asset and recognised on a straight-line basis over the lease term. Group as a lessee Operating lease payments are recognised as an expense on a straight-line basis over the lease term, except where another systematic basis is more representative of the time pattern in which economic benefits from the leased asset are consumed. Lease incentives Lease incentives received to enter into operating leases are recognised as a liability. The aggregate benefit of incentives is recognised as a reduction of rental expense on a straight-line basis, except where another systematic basis is more representative of the time pattern in which economic benefits from the leased asset are consumed. Lease incentives granted as part of operating leases are recognised as a reduction of rental income on a straight-line basis over the life of the lease. (n) Employee benefits A liability is recognised for benefits accruing to employees in respect of wages and salaries, annual leave and long service leave when it is probable that settlement will be required and they are capable of being measured reliably. Contributions to defined contribution retirement benefit plans are recognised as an expense when employees have rendered service entitling them to the contributions. Short-term employee benefits Liabilities recognised in respect of short-term employee benefits, are measured at their nominal values using the remuneration rate expected to apply at the time of settlement. Long-term employee benefits Liabilities recognised in respect of long-term employee benefits, are measured as the present value of the estimated future cash outflows to be made by the Group in respect of services provided by employees up to reporting date.
Notes to the Consolidated Financial Statements for the year ended 30 June 2014 (continued)

51Annual Report 2014
Share-based payment transactions Equity-settled share-based payments to employees and others providing similar services are measured at the fair value of the equity instruments at the grant date. Details regarding the determination of the fair value of equity-settled share-based transactions are set out in Note 30.The fair value determined at the grant date of the equity-settled share-based payments is expensed on a straight-line basis over the vesting period, based on the Group’s estimate of equity instruments that will eventually vest. At the end of each reporting period, the Group revises its estimate of the number of equity instruments expected to vest. The impact of the revision of the original estimates with respect to non-market vesting conditions, if any, is recognised in profit for the year such that the cumulative expense reflects the revised estimate, with a corresponding adjustment to the equity-settled employee benefits reserve.Equity-settled share-based payment transactions with parties other than employees are measured at the fair value of the goods and services received, except where that fair value cannot be estimated reliably, in which case they are measured at the fair value of the equity instruments granted, measured at the date the entity obtains the goods or the counterparty renders the service. (o) Provisions Provisions are recognised when the Group has a present obligation (legal or constructive) as a result of a past event, it is probable that the Group will be required to settle the obligation, and a reliable estimate can be made of the amount of the obligation. The amount recognised as a provision is the best estimate of the consideration required to settle the present obligation at the end of the reporting period, taking into account the risks and uncertainties surrounding the obligation. Where a provision is measured using the cash flows estimated to settle the present obligation, its carrying amount is the present value of those cash flows. (p) Financial liabilities and equity instruments issued by the Group Classification as debt or equity Debt and equity instruments are classified as either financial liabilities or as equity in accordance with AASB 132 Financial Instruments. Equity instruments An equity instrument is any contract that evidences a residual interest in the assets of an entity after deducting all of its liabilities. Equity instruments issued by the Group are recognised at the proceeds received, net of direct issue costs. (q) Derivative financial instruments The Group enters into derivative financial instruments such as interest rate swaps to manage its exposure to interest rate and equity price risk.
Derivatives are initially recognised at fair value at the date a derivative contract is entered into and are subsequently remeasured to their fair value at each reporting period. The resulting gain or loss is recognised in profit or loss immediately unless the derivative is designated and effective as a hedging instrument, in which event, the timing of the recognition in profit or loss depends on the nature of the hedge relationship. Embedded derivatives Derivatives embedded in other financial instruments or other host contracts are treated as separate derivatives when their risks and characteristics are not closely related to those of the host contracts and the host contracts are not measured at fair value through profit or loss.An embedded derivative is presented as a non-current asset or a non-current liability if the remaining maturity of the hybrid instrument to which the embedded derivative relates is more than 12 months and it is not expected to be realised or settled within 12 months. Other embedded derivatives are presented as current assets or current liabilities. Hedge accounting At the inception of the hedge relationship, the Group documents the relationship between the hedging instrument and hedged item, along with its risk management objectives and its strategy for undertaking the hedge. Furthermore, at the inception of the hedge and on an ongoing basis, the Group documents whether the hedging instrument that is used in a hedging relationship is highly effective in offsetting changes in cash flows of the hedged item. The Group designates certain derivatives as either hedges of fair value of recognised assets or liabilities (fair value hedges) or hedges of highly probable forecast transactions (cash flow hedges).Note 25 sets out details of the fair values of the derivative instruments used for hedging purposes. Movements in the hedging reserve in equity are also detailed in the statement of changes in equity. Cash flow hedge The effective portion of changes in the fair value of derivatives that are designated and qualify as cash flow hedges is recognised in other comprehensive income. The gain or loss relating to the ineffective portion is recognised immediately in profit or loss, and is included in the other expenses or other income line item.

52 Centuria Capital Limited
2. Significant accounting policies (continued) (q) Derivative financial instruments (continued) Cash flow hedge (continued) Amounts previously recognised in other comprehensive income and accumulated in equity are reclassified to profit or loss in the periods when the hedged item is recognised in profit or loss, in the same line of the statement of comprehensive income as the recognised hedged item. However, when the forecast transaction that is hedged results in the recognition of a non-financial asset or a non-financial liability, the gains and losses previously accumulated in equity are transferred from equity and included in the initial measurement of the cost of the non-financial asset or non-financial liability. Hedge accounting is discontinued when the Group revokes the hedging relationship, when the hedging instrument expires or is sold, terminated, or exercised, or when it no longer qualifies for hedge accounting. Any gain or loss accumulated in equity at that time remains in equity and is recognised when the forecast transaction is ultimately recognised in profit or loss. When a forecast transaction is no longer expected to occur, the gain or loss accumulated in equity is recognised immediately in profit or loss. Fair value hedge Changes in the fair value of derivatives that are designated and qualify as fair value hedges are recorded in profit or loss immediately, together with any changes in the fair value of the hedged asset or liability that are attributable to the hedged risk. The change in the fair value of the hedging instrument and the change in the hedged item attributable to the hedged risk are recognised in the line of the statement of comprehensive income relating to the hedged item.Hedge accounting is discontinued when the Group revokes the hedging relationship, the hedging instrument expires or is sold, terminated, or exercised, or when it no longer qualifies for hedge accounting. The fair value adjustment to the carrying amount of the hedged item arising from the hedged risk is amortised to profit or loss from that date. (r) Product classification The accounting treatment of certain transactions varies depending on the nature of the contract underlying the transaction. The major contract classifications are insurance contracts and investment contracts. Insurance contracts Insurance contracts are those containing significant risk at the inception, or those where at the inception of the contract there is a scenario with commercial substance where the level of insurance risk may be significant. Once a contract has been classified as an insurance contract, it remains an insurance contract for the remainder of its lifetime, even if the insurance risk reduces significantly during the period.
Investment contracts Contracts not considered insurance contracts are classified as investment contracts. The accounting treatment of investment contracts depends on whether the investment has a Discretionary Participation Feature (DPF). DPF means a contractual right to receive, as a supplement to guaranteed benefits, additional benefits: (a) that are likely to be a significant portion of the total contractual benefits; (b) whose amount or timing is contractually at the discretion of the issuer; and(c) that are contractually based on: • the performance of a specified pool of contracts or a specified type of contract; • realised and/or unrealised investment returns on a specified pool of assets held by the issuer; or • the profit or loss of the Company, fund or other entity that issues the contract. Applications and redemptions on investment contracts with a DPF are accounted for through profit or loss. The gross change in the liability to these policyholders for the period, which includes any participating benefits vested in policyholders and any undistributed surplus attributed to policyholders, is also recognised through profit or loss.Applications and redemptions on investment contracts without a DPF are accounted for through the statement of financial position as a movement in policyholder liabilities. Distributions on these contracts are charged to profit or loss as a movement in the policyholder liability. Premiums and claims relating to the investment component are accounted for as a deposit through the statement of financial position. (s) Policyholders’ funds Assets held by the Benefit Funds are included in total assets in the statement of financial position of the Group. A corresponding liability labelled “Liabilities in respect of Benefits Funds” is shown in total liabilities in the statement of financial position. Note 18 shows the movement in bonus funds (with DPF) and unit linked funds (without DPF).The liability to bonus fund policyholders is closely linked to the performance and value of the assets (after tax) that back those liabilities. The fair value of such liabilities is therefore the same as the fair value of those assets after tax. In accordance with the rules of the funds, any remaining surplus is attributed to the policyholders of the fund. In accordance with AASB 1038 Life Insurance Contracts applications to these funds are recorded as income, redemptions from these funds and amounts distributable to policyholders are recorded as expenses.The policyholders’ funds liabilities for unit linked funds are equal to the number of units held, multiplied by the unit redemption price based on market value of the fund’s investments as at the valuation date. Applications to these funds are not recorded as income, redemptions from these funds are not recorded separately as expenses, but amounts distributable to policyholders are recorded as an expense. No guarantees are provided by the Society in respect of the unit linked funds.
Notes to the Consolidated Financial Statements for the year ended 30 June 2014 (continued)

53Annual Report 2014
Claims incurred in respect of the Benefit Funds represent investment withdrawals (redemptions) and are recognised as a reduction in policyholder liabilities. Redemptions in respect of bonus funds are also disclosed as an expense as set out above. Benefit Fund expenses which are directly attributable to an individual policy or product are allocated directly to the benefit fund within which that class of business is conducted. The apportionment basis has been made in line with the principles set out in the Life Insurance Actuarial Standards Board (LIASB) Valuation Standard (Actuarial Standard AS1.04) and the apportionment is in accordance with Division 2 of Part 6 of the Life Act. (t) Unit prices Unit prices, for the unitised Benefit Funds, are determined in accordance with the Benefit Fund’s rules and are calculated as the net assets attributable to unit holders of the fund, divided by the number of units on issue. (u) New Accounting Standards and Interpretations The Group has adopted the following new standards and amendments to standards, including any consequential amendments to other standards, with a date of initial application of 1 July 2013. (i) AASB 10 Consolidated Financial Statements (2011) (ii) AASB 13 Fair Value Measurement The nature and effect of the changes are further explained below: (i) Consolidated Financial Statements As a result of AASB 10 (2011), the Group has changed its accounting policy for determining whether it has control over and consequently whether it consolidates its investees. AASB 10 (2011) introduces a new control model that is applicable to all investees, by focusing on whether the Group has power over an investee, exposure or rights to variable returns from its involvement with the investee and ability to use its power to affect those returns. In particular, AASB 10 (2011) requires the Group consolidate investees that it controls on the basis of de-facto circumstances. This change had no significant impact on the Group’s financial position or performance.
(ii) Fair Value Measurement AASB 13 establishes a single framework for measuring fair value and making disclosures about fair value measurements, when such measurements are required or permitted by other AASBs. In particular, it unifies the definition of fair value as the price at which an orderly transaction to sell an asset or to transfer a liability would take place between market participants at the measurement date. It also replaces and expands the disclosure requirements about fair value measurements in other AASBs, including AASB 7 Financial Instruments: Disclosures. Some of these disclosures are specifically required in interim financial statements. In accordance with the transitional provisions of AASB 13, the Group has applied the new fair value measurement guidance prospectively, and has not provided any comparative information for new disclosures. The change has resulted in a $5.01 million increase in the fair value of the financial instruments. This has been reflected as an “Unrealised gain arising from fair value movements of derivative financial instruments” in the Consolidated Statement of Comprehensive Income. Standards, amendments to standards and interpretations not yet effective A number of new standards, amendments to standards and interpretations are effective from annual periods beginning after 1 July 2014 and have not been applied in preparing these consolidated financial statements. None of these are expected to have a significant effect on the consolidated financial statements of the Group except for:• AASB 9 Financial Instruments which becomes mandatory for the Group’s 30 June 2016 consolidated financial report and could change the classification and measurement of financial assets and financial liabilities.The Group is currently considering the financial impact of this accounting standard changes.
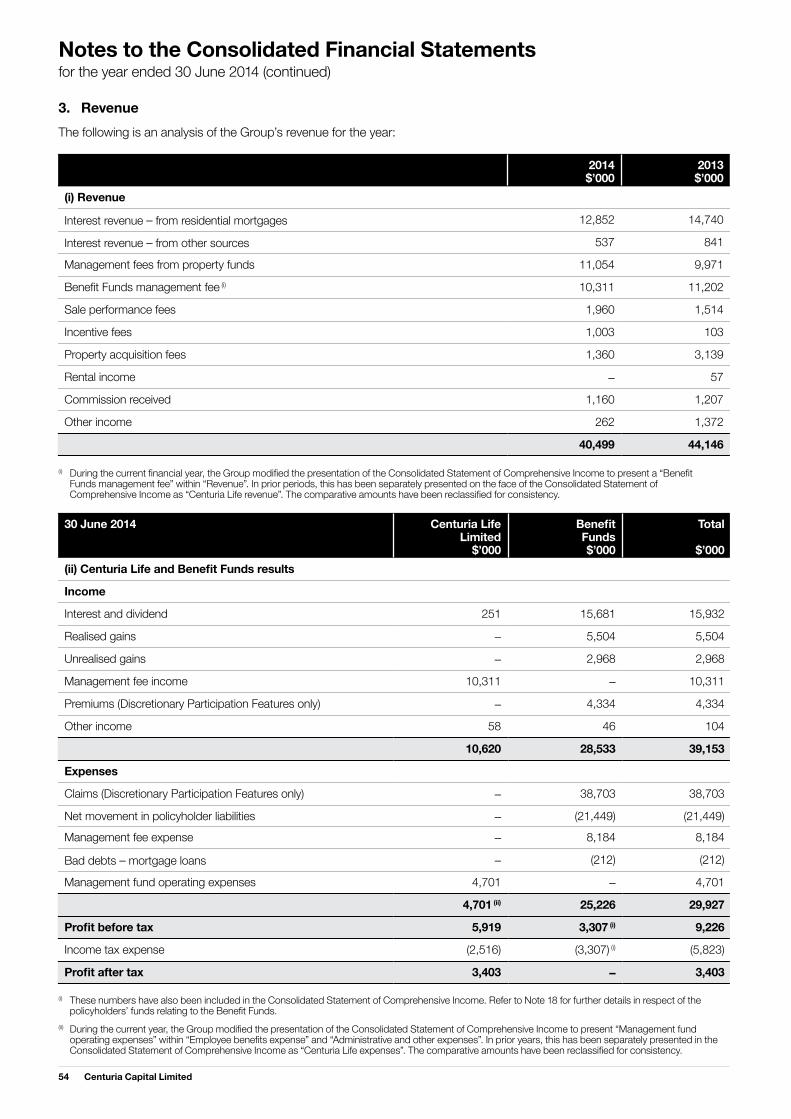
54 Centuria Capital Limited
2014$’000
2013 $’000
(i) Revenue
Interest revenue – from residential mortgages 12,852 14,740
Interest revenue – from other sources 537 841
Management fees from property funds 11,054 9,971
Benefit Funds management fee (i) 10,311 11,202
Sale performance fees 1,960 1,514
Incentive fees 1,003 103
Property acquisition fees 1,360 3,139
Rental income – 57
Commission received 1,160 1,207
Other income 262 1,372
40,499 44,146
3. Revenue The following is an analysis of the Group’s revenue for the year:
(i) During the current financial year, the Group modified the presentation of the Consolidated Statement of Comprehensive Income to present a “Benefit Funds management fee” within “Revenue”. In prior periods, this has been separately presented on the face of the Consolidated Statement of Comprehensive Income as “Centuria Life revenue”. The comparative amounts have been reclassified for consistency.
30 June 2014 Centuria Life Limited
$’000
Benefit Funds$’000
Total
$’000(ii) Centuria Life and Benefit Funds results
Income
Interest and dividend 251 15,681 15,932
Realised gains – 5,504 5,504
Unrealised gains – 2,968 2,968
Management fee income 10,311 – 10,311
Premiums (Discretionary Participation Features only) – 4,334 4,334
Other income 58 46 104
10,620 28,533 39,153
Expenses
Claims (Discretionary Participation Features only) – 38,703 38,703
Net movement in policyholder liabilities – (21,449) (21,449)
Management fee expense – 8,184 8,184
Bad debts – mortgage loans – (212) (212)
Management fund operating expenses 4,701 – 4,701
4,701 (ii) 25,226 29,927
Profit before tax 5,919 3,307 (i) 9,226
Income tax expense (2,516) (3,307) (i) (5,823)
Profit after tax 3,403 – 3,403
(i) These numbers have also been included in the Consolidated Statement of Comprehensive Income. Refer to Note 18 for further details in respect of the policyholders’ funds relating to the Benefit Funds.(ii) During the current year, the Group modified the presentation of the Consolidated Statement of Comprehensive Income to present “Management fund operating expenses” within “Employee benefits expense” and “Administrative and other expenses”. In prior years, this has been separately presented in the Consolidated Statement of Comprehensive Income as “Centuria Life expenses”. The comparative amounts have been reclassified for consistency.
Notes to the Consolidated Financial Statements for the year ended 30 June 2014 (continued)

55Annual Report 2014
30 June 2013 Centuria Life Limited
$’000
Benefit Funds$’000
Total
$’000(ii) Centuria Life and Benefit Funds results
Income
Interest and dividend 357 20,405 20,762
Realised losses – (10,267) (10,267)
Unrealised gains – 21,908 21,908
Management fee income 11,202 – 11,202
Premiums (Discretionary Participation Features only) – 6,156 6,156
Other income 25 155 180
11,584 38,357 49,941
Expenses
Claims (Discretionary Participation Features only) – 42,662 42,662
Net movement in policyholder liabilities – (24,978) (24,978)
Management fee expense – 9,161 9,161
Bad debts – mortgage loans – 8,979 8,979
Management fund operating expenses 5,331 – 5,331
5,331 35,824 41,155
Profit before tax 6,253 2,533 8,786
Income tax expense (2,660) (2,533) (5,193)
Profit after tax 3,593 – 3,593
4. Finance costs
2014$’000
2013 $’000
NAB working capital facility 1,040 1,295
Residential mortgage facility 8,666 9,749
Unwinding of discount on non-current related party receivable 511 772
Other finance costs 22 603
Gain arising on derivatives in a designated fair value hedge accounting relationship (127) (5,658)
Loss arising on fair value movements of hedged items in a designated fair value hedge 127 5,658
10,239 12,419

56 Centuria Capital Limited
5. Profit for the year before tax Profit for the year includes the following expenses:
2014$’000
2013 $’000
(a) Employee benefits expense (i)
Wages and salaries 9,892 8,467
Increase in leave provisions 40 69
Payroll taxes 470 415
Other associated personnel expenses 486 363
Total employee benefits expense 10,888 9,314
(b) Administration and other expenses (i)
Consulting and professional fees 2,346 2,928
Management fees 2,913 3,187
Brokerage fees 297 372
Bad debt expense (23) 18
Non-recoverable costs in connection with unsuccessful IPO of Centuria Property Trust – 2,703
Information systems expenses 372 394
Office administration expenses 707 1,008
Insurance expenses 366 380
Directors’ fees 373 317
Travel expenses 301 302
Depreciation and amortisation expense 481 599
Loss on disposal of property, plant and equipment 204 –
Advertising and marketing expense 625 723
Rental expense – operating leases 631 524
Other general expenses 710 641
10,303 14,096
(i) During the current year, the Group modified the presentation within the Consolidated Statement of Comprehensive Income to present “Centuria Life Expenses” within “Employee benefits expense” and “Administrative and other expenses”. The comparative amounts have been reclassified for consistency.
Notes to the Consolidated Financial Statements for the year ended 30 June 2014 (continued)

57Annual Report 2014
6. Income taxes (a) Income tax recognised in profit or loss
2014$’000
2013 $’000
Profit before tax 17,383 10,905
Less net revenue relating to Benefit Funds included in profit before tax (3,307) (2,533)
Profit before tax attributable to shareholders 14,076 8,372
Income tax expense calculated at 30% 4,223 2,512
Tax effect of amounts which are not deductible (taxable) in:
– Expenses relating to exempt income and non-allowable expenses 786 783
Adjustments in relation to prior years – National Leisure Trust non-assessable debt forgiveness – (2,348)
Adjustments recognised in the current year in relation to the current tax of prior years (11) 87
Income tax expense relating to Benefit Funds 3,307 2,533
8,305 3,567
Current tax expense in respect of the current year 3,017 (585)
Adjustments in relation to prior years (11) (2,260)
3,006 (2,845)
Deferred tax expense relating to the origination and reversal of temporary differences 1,992 3,878
Income tax expense relating to Benefit Funds 3,307 2,534
Total tax expense 8,305 3,567
Attributable to:
Income tax expense relating to shareholders (4,998) (1,034)
Income tax expense relating to Benefit Funds (3,307) (2,533)
(8,305) (3,567)
As a result of tax consolidation, CCL recognises current tax related receivables and corresponding payables from its subsidiaries and the Benefit Funds. The tax rate used in the above reconciliation is the corporate tax rate of 30% payable by Australian corporate entities on taxable profits under Australian tax law. There has been no change in the corporate tax rate when compared with the previous reporting period. (b) Deferred tax in comprehensive income
2014$’000
2013 $’000
Arising on income and expenses recognised in other comprehensive income:
– Revaluations of financial instruments treated as cash flow hedges (147) (122)
Total income tax recognised in other comprehensive income (147) (122)
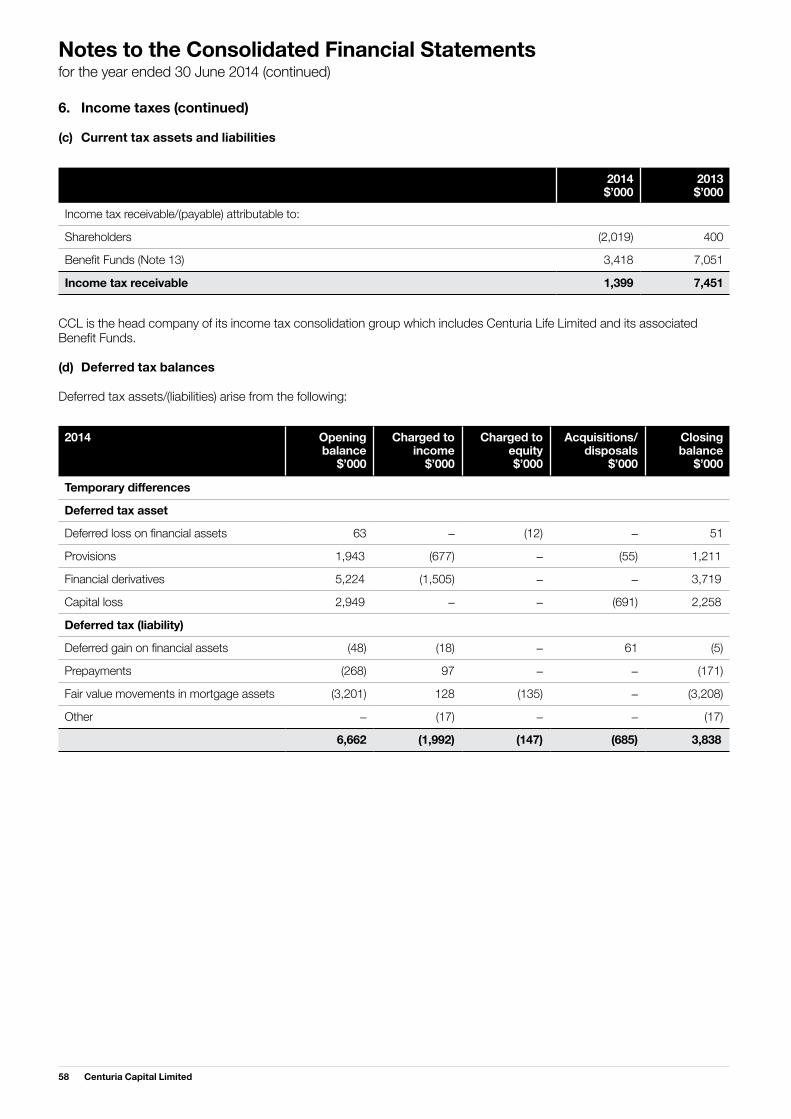
58 Centuria Capital Limited
6. Income taxes (continued) (c) Current tax assets and liabilities
2014$’000
2013 $’000
Income tax receivable/(payable) attributable to:
Shareholders (2,019) 400
Benefit Funds (Note 13) 3,418 7,051
Income tax receivable 1,399 7,451
CCL is the head company of its income tax consolidation group which includes Centuria Life Limited and its associated Benefit Funds. (d) Deferred tax balances Deferred tax assets/(liabilities) arise from the following:
2014 Opening balance
$’000
Charged to income
$’000
Charged to equity $’000
Acquisitions/ disposals
$’000
Closing balance
$’000
Temporary differences
Deferred tax asset
Deferred loss on financial assets 63 – (12) – 51
Provisions 1,943 (677) – (55) 1,211
Financial derivatives 5,224 (1,505) – – 3,719
Capital loss 2,949 – – (691) 2,258
Deferred tax (liability)
Deferred gain on financial assets (48) (18) – 61 (5)
Prepayments (268) 97 – – (171)
Fair value movements in mortgage assets (3,201) 128 (135) – (3,208)
Other – (17) – – (17)
6,662 (1,992) (147) (685) 3,838
Notes to the Consolidated Financial Statements for the year ended 30 June 2014 (continued)

59Annual Report 2014
2013 Opening balance
$’000
Charged to income
$’000
Charged to equity $’000
Acquisitions/ disposals
$’000
Closing balance
$’000
Temporary differences
Deferred tax asset
Deferred loss on financial assets 3,800 (2,023) (18) (1,696) 63
Investment properties 1,178 (2,832) – 1,654 –Provisions 1,310 633 – – 1,943
Financial derivatives 6,891 (1,667) – – 5,224
Capital loss 2,164 – – 785 2,949
Cash out guarantees 300 (300) – – –Other 25 (25) – – –Deferred tax (liability)
Deferred gain on financial assets (16) (46) – 14 (48)
Prepayments (672) 404 – – (268)
Fair value movements in mortgage assets (5,074) 1,978 (105) – (3,201)
9,906 (3,878) (123) 757 6,662
7. Earnings per share
2014Cents per share
2013Cents per share
Basic earnings per share 11.6 9.4
Diluted earnings per share 11.6 9.4
Basic and diluted earnings per share The earnings and weighted average number of ordinary shares used in the calculation of basic and diluted earnings per share are as follows:
2014No. 000
2013No. 000
Weighted average number of ordinary shares for the purposes of basic EPS 78,131 78,470
2014$’000
2013$’000
Net profit 9,078 7,338
Earnings used in the calculation of basic EPS 9,078 7,338
2014$’000
2013$’000
Net profit 9,078 7,338
Earnings used in the calculation of basic EPS 9,078 7,338

60 Centuria Capital Limited
8. Trade and other receivables
2014$’000
2013$’000
Amount owing by related entities (non-current assets) 8,260 11,815
Sundry debtors (current assets) 2,064 154
Deferred consideration (current asset) (i) 680 1,321
11,004 13,290
(i) Deferred consideration relates to the sale of Mortgageport in the previous financial year. Centuria has a first ranking registered mortgage over all of the shares in the Mortgageport business.
Except for the deferred consideration, the Group does not hold any collateral or other credit enhancements over these balances nor does it have a legal right of offset against any amounts owed by the Group to the counterparty. 9. Financial assets
2014$’000
2013$’000
Financial assets at fair value through profit or loss
Unit trusts (current asset) 17 18
Unit trusts (related party) (current asset) 268 3,136
285 3,154
Residential Mortgages
– at cost (i) 157,191 172,740
– at fair value attributable to interest rate risk (i) 13,130 13,108
170,321 185,848
(i) Whilst some mortgages are likely to be repaid during the next 12 months, Centuria does not control the repayment date and accordingly all amounts are treated as non-current.
10. Investment in associates
2014$’000
2013$’000
Centuria Direct Property Trust (i) 668 668
668 668
(i) The Group has a combined 44% investment in Centuria Direct Property Trust (DPT), an unlisted property trust which is a non-current asset. Although the Group holds a 44% investment in DPT, it does not control the voting rights. CCL accounts for its direct investment in DPT as an Investment in an Associate and equity accounts for CCL’s 5% interest. The 16% interest held by the Income Accumulation Fund and the 23% held by the Growth Bond Fund are accounted for at fair value.
Notes to the Consolidated Financial Statements for the year ended 30 June 2014 (continued)
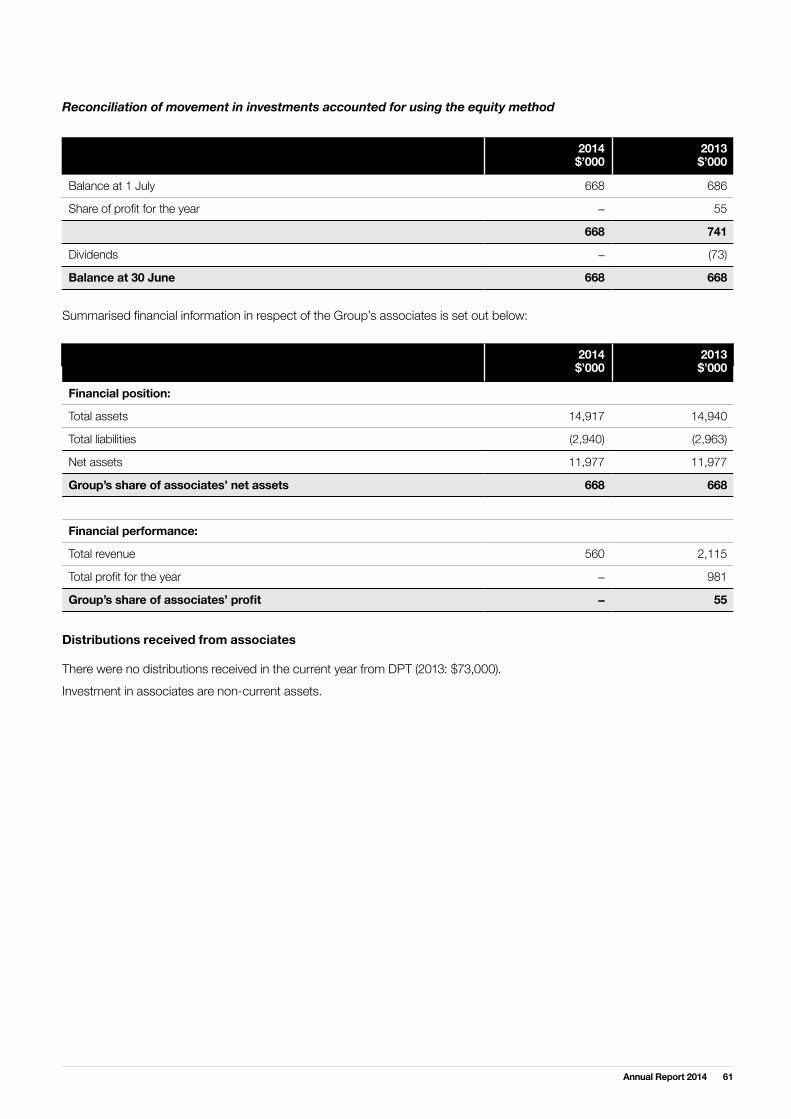
61Annual Report 2014
Reconciliation of movement in investments accounted for using the equity method
2014$’000
2013$’000
Balance at 1 July 668 686
Share of profit for the year – 55
668 741
Dividends – (73)
Balance at 30 June 668 668
Summarised financial information in respect of the Group’s associates is set out below:
2014$’000
2013$’000
Financial position:
Total assets 14,917 14,940
Total liabilities (2,940) (2,963)
Net assets 11,977 11,977
Group’s share of associates’ net assets 668 668
Financial performance:
Total revenue 560 2,115
Total profit for the year – 981
Group’s share of associates’ profit – 55
Distributions received from associates There were no distributions received in the current year from DPT (2013: $73,000).Investment in associates are non-current assets.

62 Centuria Capital Limited
11. Plant and equipment
2014$’000
2013$’000
Gross carrying amount
Balance at beginning of financial year 2,917 2,703
Additions 1,567 214
Disposals (1,191) –
Balance at end of financial year 3,293 2,917
Accumulated depreciation
Balance at beginning of financial year (2,189) (1,940)
Disposals 324 –Depreciation expense (397) (249)
Balance at end of financial year (2,262) (2,189)
Net book value 1,031 728
12. Intangible assets
2014$’000
2013$’000
Goodwill (non-current asset) 53,025 53,025
Other intangible assets (non-current asset) – 84
53,025 53,109
Goodwill
2014$’000
2013$’000
Gross amount at beginning of the period 53,025 53,025
Carrying amount at end of the period 53,025 53,025
Goodwill is solely attributable to the Property Funds Management business with recoverability determined by a value in use calculation using profit and loss projections covering a five-year period, with a terminal value determined after five years. The key assumptions used in the value in use calculations for the property funds management cash-generating unit are as follows:Revenue: Revenues in 2015 are based on the Board approved budget for FY2015 and are assumed to increase at a rate of 7.5% (2013: 7.5%) per annum for the years 2016–2019. The directors believe this is a prudent and achievable growth rate. Expenses: Expenses in 2015 are based on the Board approved budget for FY2015 and are assumed to increase at a rate of 5% (2013: 5%) per annum for the years 2016–2019. Significant investment has already been made to the business infrastructure to accommodate future growth.Post-tax discount rate: Discount rates are determined to calculate the present value of future cash flows. A rate of 9.32% (2013: 9.93%) is applied to cash flow projections. In determining the appropriate discount rate, regard has been given to relevant market data as well as CCL specific inputs.Terminal growth rate: Beyond 2019, a growth rate of 3%, in line with long-term economic growth, has been applied to determine the terminal value of the asset.
Notes to the Consolidated Financial Statements for the year ended 30 June 2014 (continued)
Plant and equipment are non-current assets.

63Annual Report 2014
Sensitivity to changes in assumptions As at 30 June 2014, the estimated recoverable amount of goodwill relating to the property funds management business exceeded its carrying amount by $11.5 million (2013: $6.0 million). The table below shows the key assumptions used in the value in use calculation and the amount by which each key assumption must change in isolation in order for the estimated recoverable amount to be equal to its carrying value:
Revenue growth rate
(average)
Post-tax discount rate
Expenses growth rate
Assumptions used in value in use calculation 7.50% 9.32% 5.00%
Change required for recoverable amount to equal carrying value -1.71% 1.35% 1.89%
Intangible assets are non-current assets. 13. Trade and other payables
2014$’000
2013$’000
Amount owing to related entities (non-current liability) – 3,024
Tax payable to Benefit Funds 3,418 7,051
Sundry creditors (i) 4,668 6,846
8,086 16,921
(i) Sundry creditors are non-interest bearing current liabilities, payable on commercial terms of 7 to 60 days.
14. Borrowings
2014$’000
2013$’000
NAB working capital facility (i) 12,000 12,000
Residential mortgage bill facilities and notes – secured (ii) 114,236 135,298
126,236 147,298
Terms and conditions relating to the above facilities are: (i) CCL has a financing facility with National Australia Bank (NAB) fully drawn to $12 million at 30 June 2014. The current facility limit of $12 million (30 June 2013: $12 million) is required to be amortised at a rate of $0.8 million per quarter. The facility maturity date was extended during the period to 31 August 2015. $3.2 million of the NAB working capital facility is a current liability and the balance of $8.8 million repayable at the maturity date is a non-current liability.(ii) The Group has $114.2 million (30 June 2013: $135.3 million) non-recourse notes on issue to the ANZ Bank secured over the residential mortgages held in Senex Warehouse Trust No.1 (a subsidiary of the Group) maturing on 31 August 2015. The facility limit ($150 million) is reassessed every six months with a view to reducing the facility (and therefore the overall facility cost) in line with the reduction in the residential mortgage book. Under the facility agreement, surplus funds (being mortgages repaid (including interest) less taxes, administration expenses and any hedge payments) are required to be applied against the facility each month. During the 12 months to 30 June 2014, $21.1 million surplus funds have been applied against the facility (12 months to 30 June 2013: $17.4 million).

64 Centuria Capital Limited
14. Borrowings (continued)
2014$’000
2013$’000
NAB working capital facility:
Amount used 12,000 12,000
Amount unused – – 12,000 12,000
Residential mortgage bill facilities and notes – secured:
Amount used 114,236 135,298
Amount unused 35,764 44,702
150,000 180,000
15. Provisions
2014$’000
2013$’000
Provision for annual leave (current liability) 528 495
Provision for long service leave (non-current liability) 657 634
1,185 1,129
16. Other liabilities
2014$’000
2013$’000
Accruals (current liability) 1,082 678
1,082 678
17. Derivative financial liabilities
2014$’000
2013$’000
Interest rate swaps at fair value 14,967 20,141
As at 30 June 2014, interest rate swaps at fair value of $0.9 million (2013: $0.9 million) are current liabilities and $14.1 million (2013: $19.2 million) are non-current liabilities.Refer to Note 25 for details on exposure to interest rates and credit risk.
Notes to the Consolidated Financial Statements for the year ended 30 June 2014 (continued)
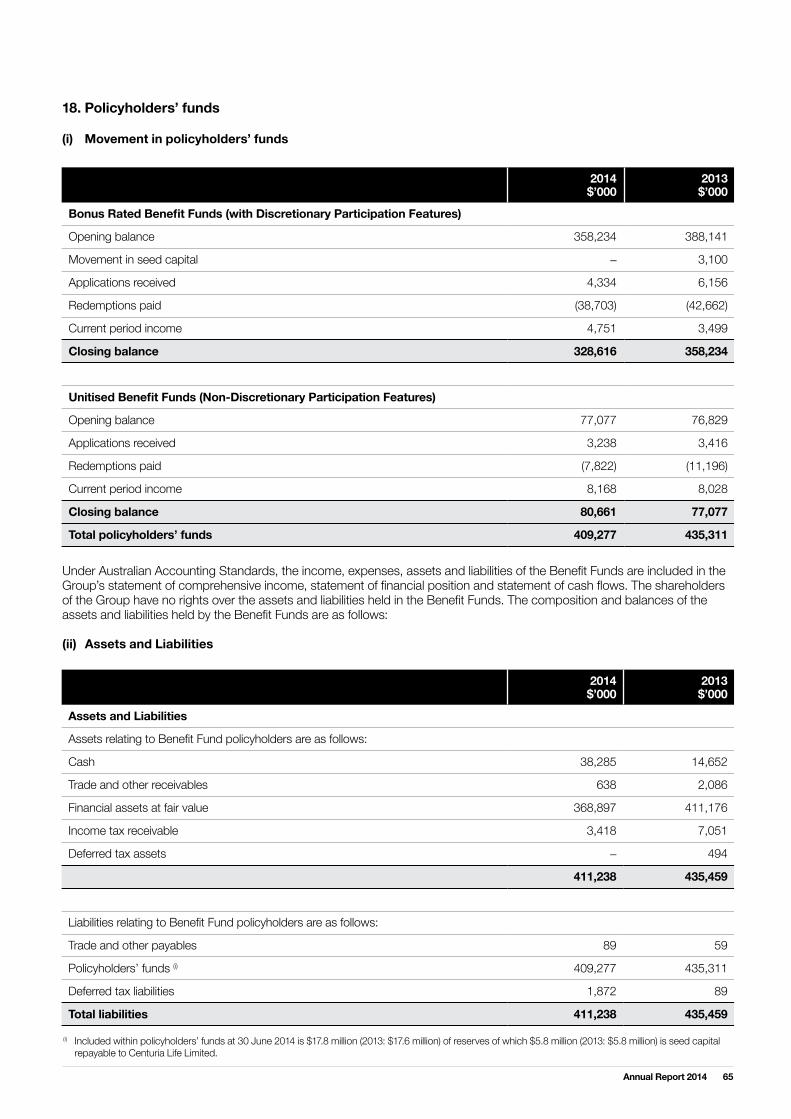
65Annual Report 2014
2014$’000
2013 $’000
Bonus Rated Benefit Funds (with Discretionary Participation Features)
Opening balance 358,234 388,141
Movement in seed capital – 3,100
Applications received 4,334 6,156
Redemptions paid (38,703) (42,662)
Current period income 4,751 3,499
Closing balance 328,616 358,234
Unitised Benefit Funds (Non-Discretionary Participation Features)
Opening balance 77,077 76,829
Applications received 3,238 3,416
Redemptions paid (7,822) (11,196)
Current period income 8,168 8,028
Closing balance 80,661 77,077
Total policyholders’ funds 409,277 435,311
18. Policyholders’ funds (i) Movement in policyholders’ funds
Under Australian Accounting Standards, the income, expenses, assets and liabilities of the Benefit Funds are included in the Group’s statement of comprehensive income, statement of financial position and statement of cash flows. The shareholders of the Group have no rights over the assets and liabilities held in the Benefit Funds. The composition and balances of the assets and liabilities held by the Benefit Funds are as follows: (ii) Assets and Liabilities
2014$’000
2013 $’000
Assets and Liabilities
Assets relating to Benefit Fund policyholders are as follows:
Cash 38,285 14,652
Trade and other receivables 638 2,086
Financial assets at fair value 368,897 411,176
Income tax receivable 3,418 7,051
Deferred tax assets – 494
411,238 435,459
Liabilities relating to Benefit Fund policyholders are as follows:
Trade and other payables 89 59
Policyholders’ funds (i) 409,277 435,311
Deferred tax liabilities 1,872 89
Total liabilities 411,238 435,459
(i) Included within policyholders’ funds at 30 June 2014 is $17.8 million (2013: $17.6 million) of reserves of which $5.8 million (2013: $5.8 million) is seed capital repayable to Centuria Life Limited.
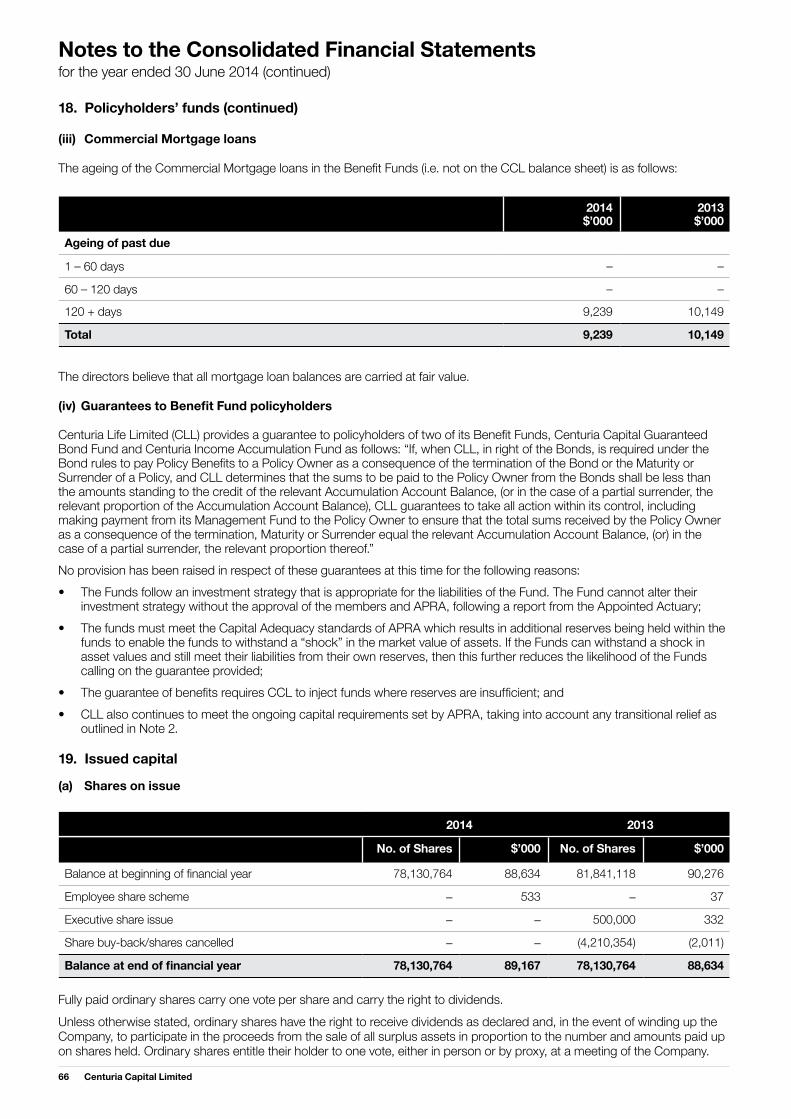
66 Centuria Capital Limited
18. Policyholders’ funds (continued) (iii) Commercial Mortgage loans The ageing of the Commercial Mortgage loans in the Benefit Funds (i.e. not on the CCL balance sheet) is as follows:
2014$’000
2013 $’000
Ageing of past due
1 – 60 days – –
60 – 120 days – –120 + days 9,239 10,149
Total 9,239 10,149
The directors believe that all mortgage loan balances are carried at fair value. (iv) Guarantees to Benefit Fund policyholders Centuria Life Limited (CLL) provides a guarantee to policyholders of two of its Benefit Funds, Centuria Capital Guaranteed Bond Fund and Centuria Income Accumulation Fund as follows: “If, when CLL, in right of the Bonds, is required under the Bond rules to pay Policy Benefits to a Policy Owner as a consequence of the termination of the Bond or the Maturity or Surrender of a Policy, and CLL determines that the sums to be paid to the Policy Owner from the Bonds shall be less than the amounts standing to the credit of the relevant Accumulation Account Balance, (or in the case of a partial surrender, the relevant proportion of the Accumulation Account Balance), CLL guarantees to take all action within its control, including making payment from its Management Fund to the Policy Owner to ensure that the total sums received by the Policy Owner as a consequence of the termination, Maturity or Surrender equal the relevant Accumulation Account Balance, (or) in the case of a partial surrender, the relevant proportion thereof.” No provision has been raised in respect of these guarantees at this time for the following reasons:• The Funds follow an investment strategy that is appropriate for the liabilities of the Fund. The Fund cannot alter their investment strategy without the approval of the members and APRA, following a report from the Appointed Actuary; • The funds must meet the Capital Adequacy standards of APRA which results in additional reserves being held within the funds to enable the funds to withstand a “shock” in the market value of assets. If the Funds can withstand a shock in asset values and still meet their liabilities from their own reserves, then this further reduces the likelihood of the Funds calling on the guarantee provided; • The guarantee of benefits requires CCL to inject funds where reserves are insufficient; and• CLL also continues to meet the ongoing capital requirements set by APRA, taking into account any transitional relief as outlined in Note 2. 19. Issued capital (a) Shares on issue
No. of Shares $’000 No. of Shares $’000
Balance at beginning of financial year 78,130,764 88,634 81,841,118 90,276
Employee share scheme – 533 – 37
Executive share issue – – 500,000 332
Share buy-back/shares cancelled – – (4,210,354) (2,011)
Balance at end of financial year 78,130,764 89,167 78,130,764 88,634
2014 2013
Fully paid ordinary shares carry one vote per share and carry the right to dividends. Unless otherwise stated, ordinary shares have the right to receive dividends as declared and, in the event of winding up the Company, to participate in the proceeds from the sale of all surplus assets in proportion to the number and amounts paid up on shares held. Ordinary shares entitle their holder to one vote, either in person or by proxy, at a meeting of the Company.
Notes to the Consolidated Financial Statements for the year ended 30 June 2014 (continued)

67Annual Report 2014
(b) Cash flow hedge reserve
2014$’000
2013 $’000
Balance at beginning of financial year (381) (667)
Gain recognised on cash flow hedges:
– Interest rate swaps 490 408 Income tax related to gains recognised in other comprehensive income (147) (122)
Balance at end of financial year (38) (381)
The cash flow hedge reserve represents the cumulative portion of gains and losses on hedging instruments deemed effective as cash flow hedges. (c) Share-based payment reserve
2014$’000
2013 $’000
Balance at beginning of financial year – –Share-based payment 164 –Balance at end of financial year 164 –
The share-based incentive reserve is used to record the value of share-based payments provided to employees, including the CEO, as part of their remuneration. (d) Profits reserve
2014 2013
2014$’000
2013 $’000
Balance at beginning of financial year 6,390 –Transfer from retained earnings 9,078 7,338
Dividends paid (Note 20) (977) (970)
Distributions received – 22
Balance at end of financial year 14,491 6,390
(e) Retained earnings
2014$’000
2013 $’000
Balance at beginning of financial year 767 767
Net profit attributable to shareholders 9,078 7,338
Transfer to profits reserve (9,078) (7,338)
Balance at end of financial year 767 767

68 Centuria Capital Limited
20. Dividends paid
Cents per share
Total$’000
Cents per share
Total$’000
Recognised amounts
Interim dividend:
Fully franked to 100% 1.25 (i) (977) 1.25 (ii) (970)
1.25 (977) 1.25 (970)
2014 2013
(i) CCL declared an interim dividend of 1.25 cents fully franked to 100% with a record date of 6 March 2014 which was paid on 27 March 2014. (ii) CCL declared an interim dividend of 1.25 cents fully franked to 100% with a record date of 9 March 2013 which was paid on 30 March 2013.
2014$’000
2013 $’000
Franking credits available at 30% (2013: 30%) are:
– Balance as at 1 July 5,112 1,070
– Increase in franking credits during the financial year 141 4,042
Franking account balance at end of financial year 5,253 5,112
21. Commitments and contingencies Operating leases During the current year, the Group entered into a new commercial lease for its Sydney head office premises with a term of five years. The Group also has a commercial lease for its Melbourne office with a term of one year remaining as at year end.Future minimum rentals payable under operating leases are as follows:
2014$’000
2013 $’000
Not longer than 1 year 663 236
Longer than 1 year and not longer than 5 years 2,425 107
3,088 343
22. Remuneration of auditors
2014$’000
2013 $’000
KPMG 327 294
Audit and review of the financial report 75 15
Other advisory services 168 173
Taxation services 570 482
Notes to the Consolidated Financial Statements for the year ended 30 June 2014 (continued)
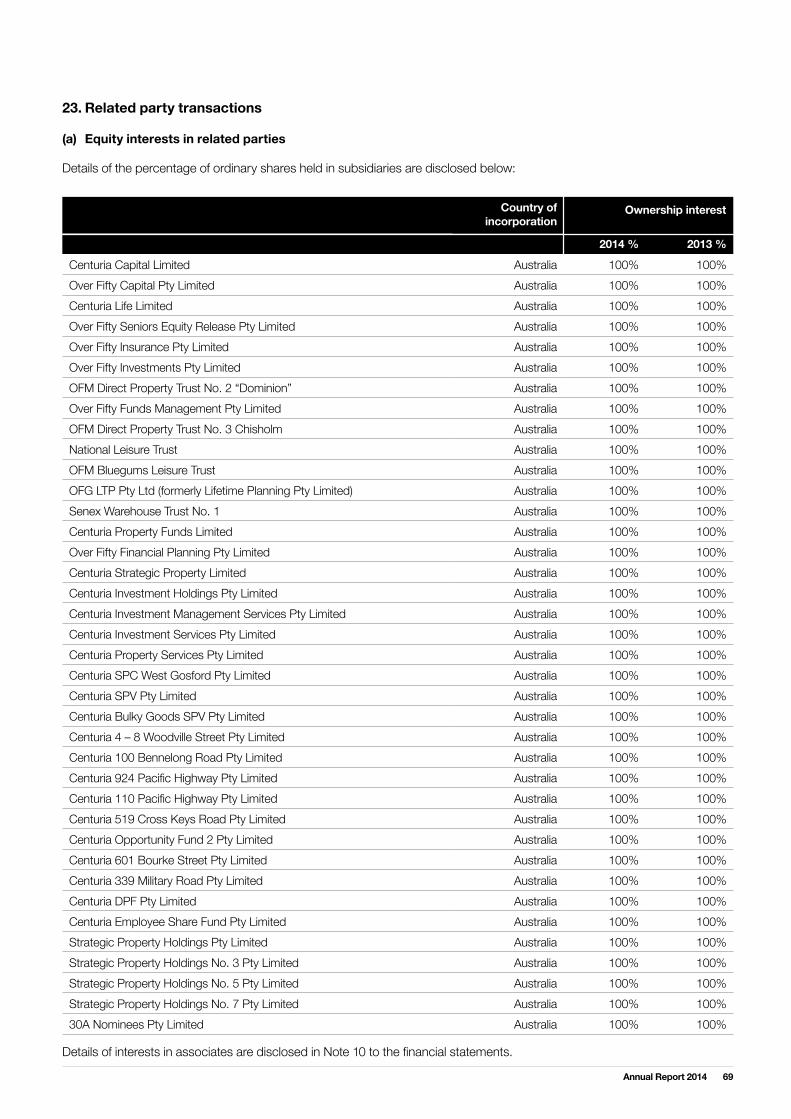
69Annual Report 2014
23. Related party transactions (a) Equity interests in related parties Details of the percentage of ordinary shares held in subsidiaries are disclosed below:
Country of incorporation
2014 % 2013 %
Centuria Capital Limited Australia 100% 100%Over Fifty Capital Pty Limited Australia 100% 100%Centuria Life Limited Australia 100% 100%Over Fifty Seniors Equity Release Pty Limited Australia 100% 100%Over Fifty Insurance Pty Limited Australia 100% 100%Over Fifty Investments Pty Limited Australia 100% 100%OFM Direct Property Trust No. 2 “Dominion” Australia 100% 100%Over Fifty Funds Management Pty Limited Australia 100% 100%OFM Direct Property Trust No. 3 Chisholm Australia 100% 100%National Leisure Trust Australia 100% 100%OFM Bluegums Leisure Trust Australia 100% 100%OFG LTP Pty Ltd (formerly Lifetime Planning Pty Limited) Australia 100% 100%Senex Warehouse Trust No. 1 Australia 100% 100%Centuria Property Funds Limited Australia 100% 100%Over Fifty Financial Planning Pty Limited Australia 100% 100%Centuria Strategic Property Limited Australia 100% 100%Centuria Investment Holdings Pty Limited Australia 100% 100%Centuria Investment Management Services Pty Limited Australia 100% 100%Centuria Investment Services Pty Limited Australia 100% 100%Centuria Property Services Pty Limited Australia 100% 100%Centuria SPC West Gosford Pty Limited Australia 100% 100%Centuria SPV Pty Limited Australia 100% 100%Centuria Bulky Goods SPV Pty Limited Australia 100% 100%Centuria 4 – 8 Woodville Street Pty Limited Australia 100% 100%Centuria 100 Bennelong Road Pty Limited Australia 100% 100%Centuria 924 Pacific Highway Pty Limited Australia 100% 100%Centuria 110 Pacific Highway Pty Limited Australia 100% 100%Centuria 519 Cross Keys Road Pty Limited Australia 100% 100%Centuria Opportunity Fund 2 Pty Limited Australia 100% 100%Centuria 601 Bourke Street Pty Limited Australia 100% 100%Centuria 339 Military Road Pty Limited Australia 100% 100%Centuria DPF Pty Limited Australia 100% 100%Centuria Employee Share Fund Pty Limited Australia 100% 100%Strategic Property Holdings Pty Limited Australia 100% 100%Strategic Property Holdings No. 3 Pty Limited Australia 100% 100%Strategic Property Holdings No. 5 Pty Limited Australia 100% 100%Strategic Property Holdings No. 7 Pty Limited Australia 100% 100%30A Nominees Pty Limited Australia 100% 100%
Ownership interest
Details of interests in associates are disclosed in Note 10 to the financial statements.

70 Centuria Capital Limited
23. Related party transactions (continued) (b) Transactions with key management personnel (i) Key management personnel compensation Details of key management personnel compensation are disclosed in Note 28 to the financial statements. (ii) Key management personnel equity holdings Fully paid ordinary shares
Balance at 1 July 2013
No.
Shares Purchased / Issued as part of
remuneration
No.
Shares Sold
No.
Balance at30 June 2014
No.
2014
R.W. Dobson 803,047 194,681 – 997,728
P.J. Done 324,261 75,739 – 400,000
J.R. Slater 1,100,000 302,297 – 1,402,297
J.E. McBain 4,538,359 51,927 – 4,590,286
J.C. Huljich 2,371,429 16,286 – 2,387,715
N.R. Collishaw 585,000 265,051 – 850,051
M.J. Coy 575,024 8,287 – 583,311
T.D. Reid 46,542 – – 46,542
D.B. Govey 625,661 89,611 – 715,272
2013
R.W. Dobson 713,639 89,408 – 803,047
P.J. Done 324,261 – – 324,261
J.R. Slater – 1,100,000 – 1,100,000
J.E. McBain 4,472,359 66,000 – 4,538,359
J.C. Huljich 2,189,116 182,313 – 2,371,429
D.K. Gupta 119,808 – (91,283) 28,525
M.J. Coy 559,024 16,000 – 575,024
T.D. Reid 51,542 – (5,000) 46,542
D.B. Govey 625,661 – – 625,661
N.R. Collishaw – 585,000 – 585,000
All equity transactions with directors and executives other than those arising from the exercise of remuneration options have been entered into under terms and conditions no more favourable than those the entity would have adopted if dealing at arm’s length.
Notes to the Consolidated Financial Statements for the year ended 30 June 2014 (continued)

71Annual Report 2014
(iii) Other transactions with key management personnel of the Group As a matter of Board policy, all transactions with directors and director-related entities are conducted on arm’s-length commercial or employment terms.During the financial year, the following transactions occurred between the Company and key management personnel:• Henry Davis York, a related party of R.W. Dobson, was paid $61,939 (2013: $69,313) for legal consultancy fees.• Riviera Capital Pty Ltd, a related party of J.R. Slater, was paid $97,715 (2013: $128,615) for consultancy services. (c) Transactions with other related parties
2014$’000
2013 $’000
Aggregate amounts received from related parties:
Management fees:
Centuria Life Limited Benefit Funds 10,311 11,202
Property Trusts managed by Centuria 15,377 14,727
25,688 25,929
Where a management agreement is in place, management fees are charged to controlled entities in accordance with such agreements. Terms and conditions of transactions with related parties Investments in benefit funds held by certain directors are made on the same terms and conditions as all other persons. Directors and director-related entities received the same returns on these investments as other policyholders.The parent entity and its related entities entered into transactions, which are insignificant in amount, with directors and their director-related entities in their domestic dealings and are made in arm’s-length transactions at normal market prices and on normal commercial terms. These are: • receipt of general insurance premiums; and• payment of general insurance benefits. CCL pays some expenses on behalf of related entities and receives a reimbursement for these payments. There are no loans on non-market terms between the Centuria Capital Group and the Benefit Funds. (d) Related party balances The following balances were outstanding at the end of the financial year between the Group and its other related parties: • Related party receivables of: – $655,612 in monthly management fees owing from the Benefit Funds; – $1,788,885 in monthly management fees from the Property Trusts managed by Centuria; – $197,540 from Over Fifty Guardian Friendly Society Limited; – $979,051 from Centuria Diversified Property Fund earning 10% p.a.; – $50,000 from 339 Military Road Fund earning 10% p.a.; and – $5,800,000 seed capital investment in the Income Accumulate Fund (present valued to $4,588,392 at 30 June 2014).Amounts owing by related entities at balance date are set out in Note 8 and amounts owing to related entities at balance date are set out in Note 13. • Financial assets carried at fair value through profit or loss: – 141,531 units in Centuria Opportunity Fund 2 representing 0.69% of units on issue; – 92,398 units in Centuria Diversified Property Fund, representing 0.11% of units on issue; – 38,392 units in Centuria Office Fund No. 2, representing 0.5% of units on issue; – 2,510 units in Centuria Diversified Direct Property Fund, representing 0.01% of units on issue; and – 1,485 units in Centuria 2 Lincoln Street Fund, representing 0.01% of units on issue.

72 Centuria Capital Limited
23. Related party transactions (continued) (d) Related party balances (continued) The Benefit Funds have the following investments in Property Trusts managed by Centuria: • Australian Property and Mortgage Bond Fund holds: – 458,635 units in 8 Australia Avenue Fund representing 2.42% of units on issue. – 30,916 units in Centuria 10 Spring Street Fund representing 0.01% of units on issue. • Centuria Growth Bond Fund holds: – 1,000,000 units in Centuria 8 Australia Avenue Fund representing 5.27% of units on issue. – 9,843,702 units in Centuria Direct Property Fund representing 22.74% of total units. – 11,119,259 units in Centuria Diversified Property Fund representing 13.43% of units on issue. – 3,113,000 units in Centuria 131–139 Grenfell Street Fund representing 28.92% of units on issue. • Centuria Income Accumulation Fund: – Holds 6,914,484 units in Centuria Direct Property Fund representing 15.98% of total units. 24. Notes to the statement of cash flows (a) Reconciliation of cash and cash equivalents For the purposes of the statement of cash flows, cash and cash equivalents includes cash on hand and in banks. Cash and cash equivalents at the end of the financial year as shown in the statement of cash flows are reconciled to the related items in the statement of financial position as follows:
Note 2014$’000
2013 $’000
Cash and cash equivalents 51,400 23,937
Attributable to shareholders 13,115 9,285
Attributable to Benefit Fund policyholders 38,285 14,652
Total 18 51,400 23,937
Under AASB 107 Statement of Cash Flows, the income, expenses, assets and liabilities of the Benefit Funds are included in the Group’s statement of comprehensive income and statement of financial position and statement of cash flows. As a result, the Benefit Funds’ cash is included in the Group’s assets with a corresponding amount included in liabilities. The shareholders of the Group have no rights over the cash held in the Benefit Funds. Included in cash and cash equivalents attributable to shareholders is an amount held by Centuria Life Limited and Senex Warehouse Trust No. 1 which is not readily available for use of $8.6 million (2013: $8.0 million).
Notes to the Consolidated Financial Statements for the year ended 30 June 2014 (continued)

73Annual Report 2014
(b) Reconciliation of profit for the period to net cash flows from operating activities
2014$’000
2013 $’000
Profit for the year 9,078 7,338
Depreciation and amortisation 481 576
Movement in provision for doubtful debts (1,171) (5,174)
Bad debts written off – (11,701)
Share-based payment expense 164 –
Unrealised income – 11,684
Share of gain in associate – (57)
Fair value loss on receivables – (805)
Fair value (gain)/loss on derivatives (4,860) –
Amortisation of borrowing costs – (375)
Decrease in deferred income tax assets (2,824) (3,244)
Increase/(decrease) in tax provision 2,419 (13,728)
Changes in net assets and liabilities:
(Increase)/decrease in assets:
Trade receivables (1,115) (1,913)
Prepayments (39) 408
Increase/(decrease) in liabilities:
Trade and other liabilities 5,581 11,152
Provisions (56) 84
Decrease in policyholder liability (27,327) (29,821)
Net cash flows used in operating activities (19,669) (35,576)

74 Centuria Capital Limited
25. Financial instruments The CCL consolidated results comprise the assets and liabilities of both the CCL Group and the Benefit Funds. The shareholders of CCL are subject only to the risks and rewards of assets and liabilities in CCL and not those of the assets and liabilities held in the Benefit Funds which are required to be aggregated in the financial report as prescribed by AASB 1038 Life Insurance Contracts. Therefore this note only addresses the financial assets and financial liabilities held directly on CCL’s statement of financial position and not those assets and liabilities held by the Benefit Funds (as detailed in Note 18). The only risk to the shareholders of CCL in respect to the Benefit Funds is limited to capital reserving. Centuria Life Limited (CLL), being a subsidiary of CCL, acts in the capacity of manager for two capital guaranteed benefit funds as described in Note 18 (iv). To mitigate the risk of these guarantees being called upon, the Benefit Funds set aside prescribed reserving which is determined upon a “1 in 400 year event” stress testing scenario. The reserving calculations are verified by an independent actuary appointed by CLL. The Benefit Fund’s at 30 June 2014 have set aside the requisite reserving as determined by the investment profile of the two respective funds. If the required reserving under the “Capital Adequacy Test” increases, in addition to the Benefit Funds’ assets, CLL would be required to inject additional seed capital. Seed capital is later repaid to CLL when reserving is returned to a normal sustainable level. APRA has provided the Society with temporary transitional relief from LPS 110 (para 25) to the extent of $12.8 million for the period to 31 December 2014, at which point management and APRA will re-establish future transitional relief requirements based on the profile of the assets within the Funds. The expected recovery of, or future injection of, seed capital into the Society’s Benefit Funds is dependent on the underlying performance of the Funds’ assets. (a) Management of financial instruments The Board is ultimately responsible for the Risk Management Framework of the Group.The Group employs a cascading approach to managing risk, facilitated through delegation to specialist committees and individuals within the Group.The Investment and Lending Committee’s function is to manage and oversee the Group’s investments in accordance with the investment objectives and framework as set down by the Board. Specifically, it has responsibility for setting and reviewing strategic asset allocations, reviewing investment performance, reviewing investment policy, monitoring and reporting on the performance of the investment risk management policy and performing risk management procedures in respect of the investments.The Group is exposed to a variety of financial risks as a result of its activities. These risks include market risk (including interest rate risk and price risk), credit risk and liquidity risk. The Group’s risk management and investment policies, approved by the Board, seek to minimise the potential adverse effects of these risks on the Group’s financial performance. These policies may include the use of certain financial derivative instruments.
The Group outsources the investment management of the Benefit Funds to specialist investment managers, who provide services to the Group, coordinate access to domestic and international financial markets, and manage the financial risks relating to the operations of the Group in accordance with an investment mandate set out in the Group’s constitution and the Benefit Funds’ product disclosure statements. The Benefit Funds’ investment mandates are to invest in equities and fixed interest securities via unit trusts, discount securities and may also invest in derivative instruments such as futures and options.The Group uses interest rate swaps to manage interest rate risk and not for speculative purposes in any situation. Hedging is put in place where the Group is either seeking to minimise or eliminate cash-flow variability, i.e. converting variable rates to fixed rates, or changes in the fair values of underlying assets or liabilities, i.e. to convert fixed rates to variable rates.Derivative financial instruments of the Benefit Funds, consolidated into the financial statements of the Group under AASB 1038 Life Insurance Contracts, are used only for hedging of actual or anticipated exposures relating to investments. All financial arrangements are backed up by cash or assets (as appropriate) with a fair value at least equal to the notional value of the asset which underlies the financial instrument. The Group does not enter into or trade financial instruments for speculative purposes. The use of financial derivatives in respect of Benefit Funds is governed by the Fund’s investment policies, which provide written principles on the use of financial derivatives. (b) Capital risk management The Group manages its capital to ensure that entities in the Group will be able to continue as going concerns while maximising the return to stakeholders through the optimisation of debt and equity capital. This overall strategy remains unchanged from the prior year.The Group’s capital structure consists of net debt (borrowings as detailed in Note 14, offset by cash and cash equivalents) and equity of the Group (comprising issued capital, reserves and retained earnings which are all detailed in Note 19).The Group carries on business throughout Australia, primarily through subsidiary companies that are established in the markets in which the Group operates. The operations of the Centuria Life Limited are regulated by APRA and the Management Fund of the Society has a minimum Prescribed Capital Amount (PCA) that must be maintained at all times. It is calculated monthly and these results are reported to the Board each month. The current level of share capital of the Centuria Life Limited meets the PCA requirements.In addition, Centuria Property Funds Limited and Centuria Strategic Property Limited have AFSL licences so as to operate registered property trusts. Regulations require these entities to hold a minimum net asset amount which is maintained by way of bank guarantees. Where necessary, the bank guarantees will be increased to ensure the net asset requirement is always met.
Notes to the Consolidated Financial Statements for the year ended 30 June 2014 (continued)

75Annual Report 2014
Operating cash flows are used to maintain and, where appropriate, expand the Group’s funds under management as well as to make the routine outflows of tax, dividends and repayment of maturing debt. The Group reviews regularly its anticipated funding requirements and the most appropriate form of funding (capital raising or borrowings) depending on what the funding will be used for.The capital structure of the Benefit Funds (and management fund) consists of cash and cash equivalents, bill facilities and mortgage assets. The Benefit Funds also hold a range of financial assets for investment purposes including investments in unit trusts, equity and floating rate notes. The Investment Committee aims to ensure that there is sufficient capital for possible redemptions by unit holders of the Benefit Funds by regularly monitoring the level of liquidity in each fund.The Benefit Funds have no restrictions or specific capital requirements on the application and redemption of units. The Benefit Funds overall investment strategy remains unchanged from the prior year. (c) Fair value of financial instruments Valuation techniques and assumptions applied for the purpose of measuring fair value The fair values of financial assets and financial liabilities are determined as follows:• The fair values of financial assets and financial liabilities with standard terms and conditions and traded on active liquid markets are determined with reference to quoted market prices (includes listed redeemable notes, bills of exchange, debentures and perpetual notes).• The fair values of other financial assets and financial liabilities (excluding derivative instruments) are determined in accordance with generally accepted pricing models based on discounted cash flow analysis using prices from observable current market transactions and dealer quotes for similar instruments. Discount rates are determined based on market rates applicable to the financial asset or liability.• The valuation technique used to determine the fair value of the Group’s residential mortgage loan book is as follows: – the weighted average residential mortgage holders’ age is 79 years; – the future cash flows calculation is related to borrowers’ mortality rates and mortality improvements. The data is sourced from public available information released by the government; – fixed or variable interest rates charged to borrowers are used to project future cash flows; – a redemption rate, which is based on historical loan redemption experience, applies to future cash flow forecast; and – year-end yield curve plus a credit margin is used to discount future cash flows back to 30 June 2014 to determine the fair value.
• The fair values of derivative instruments are calculated using quoted prices. Where such prices are not available, discounted cash flow analysis is performed using the applicable yield curve for the duration of the instruments for non-optional derivatives, and option pricing models for optional derivatives.• The valuation technique used to determine the fair value of the Fixed For Life interest rate swaps is as follows: – the weighted average residential mortgage holders’ age is 76 years; – the expected future cash flows in relation to the swaps are based on residential mortgage borrowers’ expected life expectancy sourced from data released by the government; and the difference between the fixed swap pay rates and forwards rates as of 30 June 2014 is used to calculate the future cash flows in relation to the swaps. Fair value measurements recognised in the statement of financial position The following table provides an analysis of financial instruments that are measured subsequent to initial recognition at fair value, grouped into Levels 1 to 3 based on the degree to which the fair value is observable.• Level 1 fair value measurements are those derived from quoted prices (unadjusted) in active markets for identical assets or liabilities.• Level 2 fair value measurements are those derived from inputs other than quoted prices included within Level 1 that are observable for the asset or liability, either directly (i.e. as prices) or indirectly (i.e. derived from prices).• Level 3 fair value measurements are those derived from valuation techniques that include inputs for the asset or liability that are not based on observable market data (unobservable inputs).There were no transfers between Levels 1, 2 and 3 in the period.

76 Centuria Capital Limited
25. Financial instruments (continued) (c) Fair value of financial instruments (continued)
30 June 2014 MeasurementBasis
Fair Value Hierarchy
Carrying Amount
$’000
FairValue
$’000
Financial assets
Cash and cash equivalents Amortised cost Not applicable 13,115 13,115
Trade and other receivables Amortised cost Not applicable 11,004 11,004
Financial assets at fair value through profit or loss Fair value Level 2 285 285
Other financial assets – residential mortgage loans – at cost Amortised cost Not applicable 157,191 185,563
Other financial assets – residential mortgage loans fair value Fair value Level 3 13,130 13,130
194,725 223,096
Financial liabilities
Trade and other payables Amortised cost Not applicable 4,392 4,392
Borrowings Amortised cost Not applicable 126,236 126,236
Derivative financial liabilities – non fixed-for-life interest rate swaps Fair value Level 2 892 892
Derivative financial liabilities – fixed-for-life interest rate swaps Fair value Level 3 14,075 14,075
145,595 145,595
30 June 2013 MeasurementBasis
Fair Value Hierarchy
Carrying Amount
$’000
FairValue
$’000
Financial assets
Cash and cash equivalents Amortised cost Not applicable 9,285 9,285
Trade and other receivables Amortised cost Not applicable 13,290 13,290
Financial assets at fair value through profit and loss Fair value Level 2 3,154 3,154
Other financial assets – residential mortgage loans – at cost Amortised cost Not applicable 172,740 234,645
Other financial assets – residential mortgage loans fair value Fair value Level 3 13,108 13,108
211,577 273,482
Financial liabilities
Trade and other payables Amortised cost Not applicable 9,933 9,933
Borrowings Amortised cost Not applicable 147,298 147,298
Derivative financial liabilities – non fixed-for-life interest rate swaps Fair value Level 2 1,818 1,818
Derivative financial liabilities – fixed-for-life interest rate swaps Fair value Level 3 18,323 18,323
177,372 177,372
The Group determines Level 2 fair values for financial assets and liabilities without an active market based on broker quotes.Level 2 fair values for simple over-the-counter derivatives are also based on broker quotes as well. Those quotes are tested for reasonableness by discounting expected future cash flows using market interest rates for a similar instrument at the measurement date. Fair values reflect the credit risk of the instrument and include adjustments to take account of the credit risk of the entity and counterparty when appropriate.
Notes to the Consolidated Financial Statements for the year ended 30 June 2014 (continued)

77Annual Report 2014
Total
O Other Financial
Assets
$’000
Fixed for Life Swaps
$’000
$’000
Balance at 1 July 2013 13,108 (18,323) (5,215)
Total gains in profit or loss
Attributable to interest rate risk 22 (759) (737)
Attributable to credit risk (i) – 5,007 5,007
Balance at 30 June 2014 13,130 (14,075) (945)
Fair Value through Profit or Loss
Details of the determination of Level 3 fair value movements the year ended 30 June 2014 are set out as follows: Reconciliation of Level 3 fair value measurements of financial assets and liabilities
Significant assumptions used in determining fair value of financial assets and liabilities Fixed For Life loans and swaps (FFL) The objective of 50-year interest rate swap contracts in a hedge relationship is to hedge the exposure to changes in fair value of recognised assets, being Fixed For Life residential mortgage loans, that is attributable to the interest rate risk that could affect profit or loss. This strategy is in accordance with the CCL Treasury Policy.The fair value of the 50-year residential mortgage loans and 50-year swaps are calculated using a valuation technique based on assumptions that are not supported by prices from observable current market transactions in the same instrument and not based on available observable market data due to the illiquid nature of the instruments. Use is made of discounted cash flow analysis using the applicable yield curve out to 15 years, with the yield curve at 15 years employed as the best proxy for subsequent rates due to non-observable market data.Mortality rates for males and females have been assumed to be consistent with 2013 Life Tables. Mortality improvements of 3% per annum. are assumed starting at age 70. The improvement factor tapers down to 1% per annum at age 90 and then zero at age 100. Joint life mortality is calculated based on last death for loans with joint borrowers. 50% of residential mortgage loan portfolio consists of joint lives. Adjusting the yield curve by an increase/(decrease) of 100 basis points as at 30 June 2014 would cause the fair value of the 50-year swaps to (decrease)/increase by $(4,420,192)/$5,367,085 (2013: $(7,353,797)/$6,018,494).Additionally, the valuations have been calculated with an assumption of deaths (as opposed to early voluntary repayment) of mortgagees during the life of the interest rate swaps.
(i) In accordance with the transitional provisions of AASB 13, the Group has applied the new fair value measurement guidance prospectively, and has not provided any comparative information for new disclosures. The change has resulted in a $5.007 million decrease in the fair value of financial instrument liabilities. This reduction has been reflected as an “Unrealised gain arising from fair value movements of derivative financial instruments” in the Consolidated Statement of Profit and Loss and Other Comprehensive Income.
However, the swap agreements provide that in the event of death of a mortgagee there is a nil cost prepayment option. Accordingly, the assumption on the number of deaths and timing of such deaths will impact the valuation. If the assumption of the death rate was to increase/(decrease) by 10%, the fair value of fixed for life swaps at 30 June 2014 would (decrease)/increase by $(465,103)/$567,989 (2013: $(811,182)/$1,000,350). (d) Credit risk Credit risk refers to the risk that a counterparty will default on its contractual obligations resulting in financial loss to the Group. The Group has adopted a policy of only dealing with creditworthy counterparties and obtaining sufficient collateral or other security, where appropriate, as a means of mitigating risk of financial loss from default. The credit risk on financial assets of the Group and the parent recognised in the statement of financial position is generally the carrying amount, net of allowance for impairment loss. Concentration of risk may exist when the volume of transactions limits the number of counterparties. Credit risk of residential mortgages Concentration of credit risk in relation to residential mortgage loans is minimal, as each individual residential mortgage loan is secured by an individual residential property. The loan is required to be paid off from the proceeds of disposal of the secured property after the borrower’s death.Individual property valuations are conducted at least every three years in accordance with financier’s requirements. At 30 June 2014, the highest loan to value ratio (LVR) of a loan in the residential mortgage loan book is 85% (2013: 93%), and there are only 84 out of 1,535 (2013: 64 out of 1,755) residential mortgage loans where the LVR is higher than 50%.

78 Centuria Capital Limited
25. Financial instruments (continued) (d) Credit risk (continued) Credit risk of residential mortgages (continued) There are no residential mortgage loans that are past due and not impaired. Credit risk of commercial mortgages Credit risk on mortgage loans is managed through prudential lending guidelines, appropriate mortgage security arrangements and loan default credit risk insurance, and are reviewed and approved by the risk management committee annually. Credit risk on other financial assets Credit risk on other financial assets such as investments in floating rate notes, standard discount securities and unit trusts is managed through strategic asset allocations with creditworthy counterparties and the ongoing monitoring of the credit quality of investments, including the use of credit ratings issued by well-known rating agencies. The exposure of credit risk in respect of financial assets is minimal.The Group does not have any significant credit risk exposure to any single entity in other financial assets or any group of counterparties having similar characteristics. No individual investment exceeds 5% of net assets at either 30 June 2014 or 30 June 2013. (e) Liquidity risk The Group’s approach to managing liquidity is to ensure that it will always have sufficient liquidity to meet its liabilities. The liquidity risk is managed for the Group at a corporate level. Bank account balances across all entities, current and future commitments, and expected cash inflows are reviewed in detail when the monthly cash flow projection is prepared for management purposes and presented to the Board at its regular monthly meetings.
By comparing the projected cash flows with the assets and liabilities shown in the individual and consolidated statements of financial position, which are also prepared on a monthly basis for management purposes and presented to the Board, liquidity requirements for the Group can be determined. Based on this review, if it is considered that the expected cash inflows plus liquidity on hand, may not be sufficient in the near term to meet cash outflow requirements, including repayment of borrowings, a decision can be made to carry out one or more of the following:• renegotiate the repayment terms of the borrowings;• sell assets that are held on the statement of financial position; and/or• undertake an equity raising.This, combined with a profitable business going forward, should ensure that the Group continues to meet its commitments, including repayments of borrowings, as and when required.The Group’s overall strategy to liquidity risk management remains unchanged from the prior year.The following tables summarise the Group’s remaining contractual maturity for its non-derivative financial liabilities with agreed repayment periods. The tables have been drawn up based on the undiscounted cash flows of financial liabilities based on the earliest date on which the Group and the parent can be required to pay. The tables include both interest and principal cash flows. To the extent that interest flows are at floating rate, the undiscounted amount is derived from interest rate curves at the end of the reporting period.The policyholders in the Benefit Funds are able to redeem their policies at any time and the Benefit Funds are therefore exposed to the liquidity risk of meeting policyholders’ withdrawals at any time. The Investment Committee aims to ensure that there is sufficient capital for possible redemptions by policyholders of the Benefit Funds by regularly monitoring the level of liquidity in each fund.
On Demand
$’000
Less than 3 months
$’000
3 months to 1 year
$’000
1–5 years
$’000
5+ years
$’000
Total
$’000
Non-derivative financial liabilities
Consolidated
2014
Borrowings – 7,469 21,326 104,677 – 133,472
Other payables – 4,392 – – – 4,392
Total – 11,861 21,326 104,677 – 137,864
2013
Borrowings – 5,355 15,523 133,143 – 154,021
Other payables – 9,873 – – – 9,873
Total – 15,228 15,523 133,143 – 163,894
Notes to the Consolidated Financial Statements for the year ended 30 June 2014 (continued)

79Annual Report 2014
The following table summarises the maturing profile of derivative financial liabilities. The table has been drawn up based on the undiscounted net cash flows on the derivative instruments that settle on a net basis.
On Demand
$’000
Less than 3 months
$’000
3 months to 1 year
$’000
1–5 years
$’000
5+ years
$’000
Total
$’000
Derivative financial liabilities
Consolidated
2014
Interest rate swaps – 486 612 – 43,864 44,962
Total – 486 612 – 43,864 44,962
2013
Interest rate swaps – 1,257 1,358 – 44,264 46,879
Total – 1,257 1,358 – 44,264 46,879
(f) Market risk Market risk is the risk that the fair value or future cash flows of a financial instrument will fluctuate because of changes in market prices. Market risk comprises interest rate risk and price risk. Due to the nature of assets held by the Group (excluding the Benefit Funds), there is an asset and liability management process which determines the interest rate sensitivity of the statement of financial position and the implementation of risk management practices to hedge the potential effects of interest rate changes. The Group manages the market risk associated with its Benefit Funds by outsourcing its investment management. The Investment Manager manages the financial risks relating to the operations of the Benefit Funds in accordance with an investment mandate set out in the Benefit Funds’ constitution and product disclosure statement. There has been no change to the Group’s exposure to market risks or the manner in which it manages and measures the risk. Interest rate risk management The Group is exposed to interest rate risk because entities in the Group borrow funds at floating interest rates and lend funds at both fixed and floating interest rates. The risk is managed by the Group by the use of interest rate swap contracts. Hedging activities are evaluated regularly to align with interest rate views and defined risk appetite; ensuring optimal hedging strategies are applied.The tables below detail the Group’s interest-bearing financial assets and liabilities.
2014 Weighted average effective interest rate
%
Variable rate
$’000
Fixed rate
$’000
Total
$’000
Financial assets
Cash and cash equivalents 2.93 5,948 7,167 13,115
Mortgage loans 7.73 128,987 28,204 157,191
Total financial assets 134,935 35,371 170,306
Financial liabilities
Borrowings 5.20 (126,236) – (126,236)
Total financial liabilities (126,236) – (126,236)
Net interest-bearing financial (liabilities)/assets 8,699 35,371 44,070

80 Centuria Capital Limited
25. Financial instruments (continued) (f) Market risk (continued) Interest rate risk management (continued)
2013 Weighted average effective interest rate
%
Variable rate
$’000
Fixed rate
$’000
Total
$’000
Financial assets
Cash and cash equivalents 3.38 4,439 4,846 9,285
Mortgage loans 7.93 139,855 45,979 185,834
Total financial assets 144,294 50,825 195,119
Financial liabilities
Borrowings 5.29 (147,298) – (147,298)
Total financial liabilities (147,298) – (147,298)
Net interest bearing financial (liabilities)/assets (3,004) 50,825 47,821
Notes to the Consolidated Financial Statements for the year ended 30 June 2014 (continued)
Interest rate swap contracts Under interest rate swap contracts, the Group agrees to exchange the difference between fixed and floating rate interest amounts calculated on agreed notional principal amounts. Such contracts enable the Group to mitigate the risk of changing interest rates on the fair value of fixed rate financial assets held and the cash flow exposures on the issued variable rate debt.The following table details the notional principal amounts and remaining expiry of the Group’s outstanding interest rate swap contracts as at reporting date. These swaps are at fair value through profit and loss except for those designated and effective as cash flow hedges in which case the fair value movements will be recorded in equity.
2014%
2013 %
2014 $’000
2013 $’000
2014 $’000
2013 $’000
Pay fixed for floating contracts designated as effective in fair value hedge
50-year swaps contracts 7.48 7.49 14,108 15,225 (14,075) (18,323)
14,108 15,225 (14,075) (18,323)
Pay fixed for floating contracts designated as effective in cash flow hedges
Less than 1 year 6.94 4.95 3,574 12,318 (892) (945)
1 – 2 years 6.94 – 3,574 – (873)
3,574 15,892 (892) (1,818)
17,682 31,117 (14,967) (20,141)
Average contracted rate
Notional principal amount
Fair value
The objective of cash flow swaps in a hedge relationship is to match the cash flows obtained from the fixed rate book to the floating funding obligations under the warehouse trust facility. This strategy is in accordance with the CCL Treasury Policy. The hedged item (being floating funding obligation) is expected to impact profit or loss over the next six months (2013: two years) following year end where the Group has an interest rate exposure from fixed rate residential mortgages from customers at a fixed rate for eight years of the loan.
Not applicable
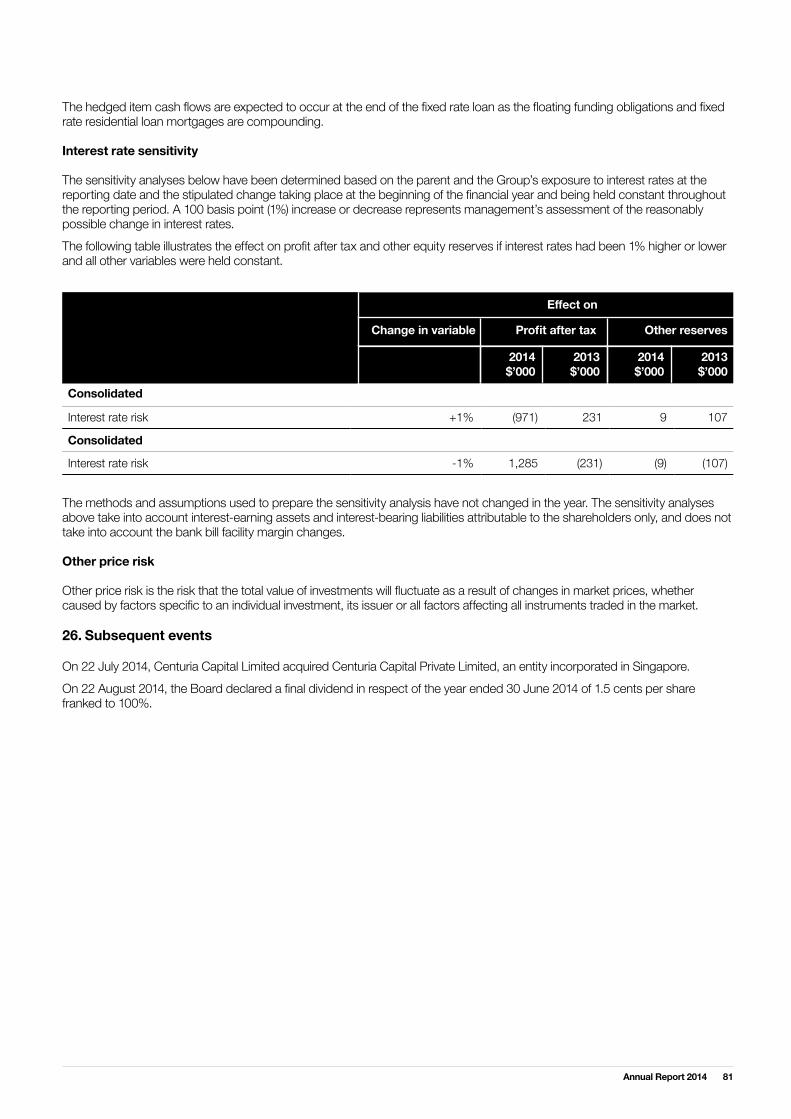
81Annual Report 2014
Change in variable Profit after tax Other reserves
Effect on
2014 $’000
2013 $’000
2014 $’000
2013 $’000
Consolidated
Interest rate risk +1% (971) 231 9 107
Consolidated
Interest rate risk -1% 1,285 (231) (9) (107)
The methods and assumptions used to prepare the sensitivity analysis have not changed in the year. The sensitivity analyses above take into account interest-earning assets and interest-bearing liabilities attributable to the shareholders only, and does not take into account the bank bill facility margin changes. Other price risk Other price risk is the risk that the total value of investments will fluctuate as a result of changes in market prices, whether caused by factors specific to an individual investment, its issuer or all factors affecting all instruments traded in the market. 26. Subsequent events On 22 July 2014, Centuria Capital Limited acquired Centuria Capital Private Limited, an entity incorporated in Singapore.On 22 August 2014, the Board declared a final dividend in respect of the year ended 30 June 2014 of 1.5 cents per share franked to 100%.
The hedged item cash flows are expected to occur at the end of the fixed rate loan as the floating funding obligations and fixed rate residential loan mortgages are compounding. Interest rate sensitivity The sensitivity analyses below have been determined based on the parent and the Group’s exposure to interest rates at the reporting date and the stipulated change taking place at the beginning of the financial year and being held constant throughout the reporting period. A 100 basis point (1%) increase or decrease represents management’s assessment of the reasonably possible change in interest rates.The following table illustrates the effect on profit after tax and other equity reserves if interest rates had been 1% higher or lower and all other variables were held constant.
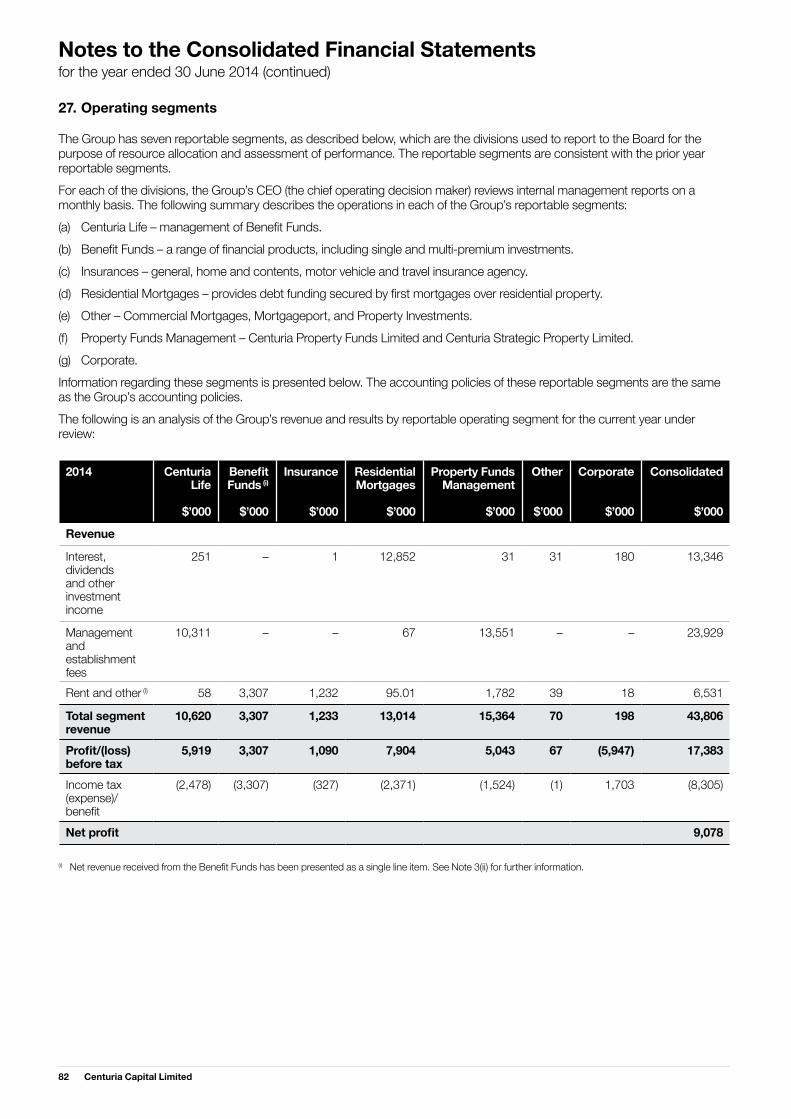
82 Centuria Capital Limited
27. Operating segments The Group has seven reportable segments, as described below, which are the divisions used to report to the Board for the purpose of resource allocation and assessment of performance. The reportable segments are consistent with the prior year reportable segments.For each of the divisions, the Group’s CEO (the chief operating decision maker) reviews internal management reports on a monthly basis. The following summary describes the operations in each of the Group’s reportable segments:(a) Centuria Life – management of Benefit Funds.(b) Benefit Funds – a range of financial products, including single and multi-premium investments. (c) Insurances – general, home and contents, motor vehicle and travel insurance agency.(d) Residential Mortgages – provides debt funding secured by first mortgages over residential property.(e) Other – Commercial Mortgages, Mortgageport, and Property Investments.(f) Property Funds Management – Centuria Property Funds Limited and Centuria Strategic Property Limited.(g) Corporate.Information regarding these segments is presented below. The accounting policies of these reportable segments are the same as the Group’s accounting policies. The following is an analysis of the Group’s revenue and results by reportable operating segment for the current year under review:
Notes to the Consolidated Financial Statements for the year ended 30 June 2014 (continued)
(i) Net revenue received from the Benefit Funds has been presented as a single line item. See Note 3(ii) for further information.
2014
Centuria Life
$’000
Benefit Funds (i)
$’000
Insurance
$’000
Residential Mortgages
$’000
Property Funds Management
$’000
Other
$’000
Corporate
$’000
Consolidated
$’000
Revenue
Interest, dividends and other investment income
251 – 1 12,852 31 31 180 13,346
Management and establishment fees
10,311 – – 67 13,551 – – 23,929
Rent and other (i) 58 3,307 1,232 95.01 1,782 39 18 6,531
Total segment revenue
10,620 3,307 1,233 13,014 15,364 70 198 43,806
Profit/(loss) before tax
5,919 3,307 1,090 7,904 5,043 67 (5,947) 17,383
Income tax (expense)/benefit
(2,478) (3,307) (327) (2,371) (1,524) (1) 1,703 (8,305)
Net profit 9,078

83Annual Report 2014
(i) Net revenue received from the Benefit Funds has been presented as a single line item.
2013 Centuria Life
$’000
Benefit Funds (i)
$’000
Insurance
$’000
Residential Mortgages
$’000
Property Funds Management
$’000
Other
$’000
Corporate
$’000
Consolidated
$’000
Revenue
Interest, dividends and other investment income
357 – 1 14,740 1,689 6 327 17,120
Management and establishment fees
11,202 – – 71 13,055 – 86 24,414
Rent and other (i) 25 2,533 1,283 65 518 484 292 5,200
Total segment revenue
11,584 2,533 1,284 14,876 15,262 490 705 46,734
Profit/(loss) before tax
6,253 2,533 967 3,293 3,850 498 (6,489) 10,905
Income tax (expense)/benefit
(2,660) (2,533) (290) (988) (1,232) 2,078 2,058 (3,567)
Net profit 7,338

84 Centuria Capital Limited
27. Operating segments (continued) The following is an analysis of the Group’s assets and liabilities and other information by reportable operating segment:
2014
Centuria Life
$’000
Benefit Funds
$’000
Insurance
$’000
Residential Mortgages
$’000
Property Funds Management
$’000
Other
$’000
Corporate
$’000
Consolidated
$’000
Assets 10,574 411,238 2,107 145,260 18,150 5,890 74,127 667,345
Liabilities (497) (411,238) – (137,744) (2,983) (87) (10,245) (562,794)
Carrying value of investments accounted for using the equity method
– – – – – – 668 668
Depreciation and amortisation 20 – – – 180 – 281 481
Significant other non-cash expenses – – – – – – – –
2013 Centuria Life
$’000
Benefit Funds
$’000
Insurance
$’000
Residential Mortgages
$’000
Property Funds Management
$’000
Other
$’000
Corporate
$’000
Consolidated
$’000
Assets 10,494 435,459 1,316 199,300 25,034 1,872 43,561 717,036
Liabilities (585) (435,459) – (163,484) (8,288) – (13,810) (621,626)
Carrying value of investments accounted for using the equity method
– – – – – – 668 668
Depreciation and amortisation – – – – 484 – 115 599
Significant other non-cash expenses – 8,979 – – 2,910 (222) 34 11,701
Geographical information The consolidated entity operates in one geographic region, Australia.
Notes to the Consolidated Financial Statements for the year ended 30 June 2014 (continued)

85Annual Report 2014
2014
Centuria Life
$’000
Benefit Funds
$’000
Insurance
$’000
Residential Mortgages
$’000
Property Funds Management
$’000
Other
$’000
Corporate
$’000
Consolidated
$’000
Assets 10,574 411,238 2,107 145,260 18,150 5,890 74,127 667,345
Liabilities (497) (411,238) – (137,744) (2,983) (87) (10,245) (562,794)
Carrying value of investments accounted for using the equity method
– – – – – – 668 668
Depreciation and amortisation 20 – – – 180 – 281 481
Significant other non-cash expenses – – – – – – – –
2013 Centuria Life
$’000
Benefit Funds
$’000
Insurance
$’000
Residential Mortgages
$’000
Property Funds Management
$’000
Other
$’000
Corporate
$’000
Consolidated
$’000
Assets 10,494 435,459 1,316 199,300 25,034 1,872 43,561 717,036
Liabilities (585) (435,459) – (163,484) (8,288) – (13,810) (621,626)
Carrying value of investments accounted for using the equity method
– – – – – – 668 668
Depreciation and amortisation – – – – 484 – 115 599
Significant other non-cash expenses – 8,979 – – 2,910 (222) 34 11,701
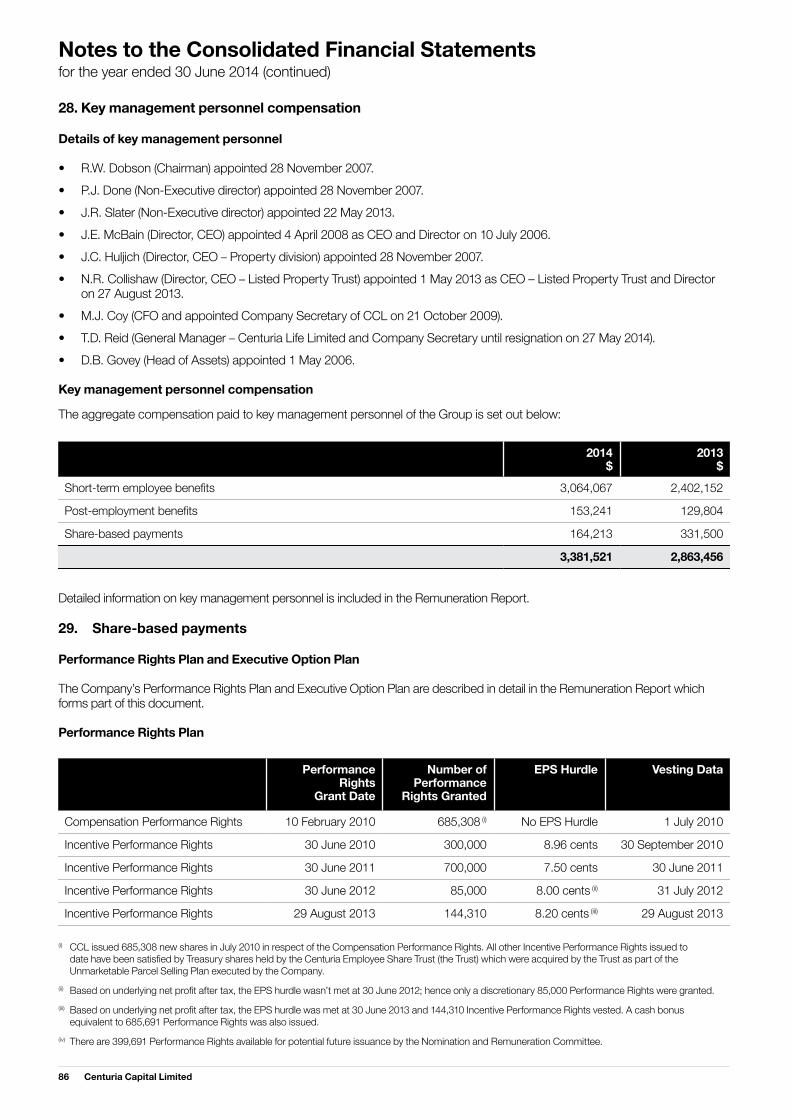
86 Centuria Capital Limited
28. Key management personnel compensation Details of key management personnel • R.W. Dobson (Chairman) appointed 28 November 2007.• P.J. Done (Non-Executive director) appointed 28 November 2007. • J.R. Slater (Non-Executive director) appointed 22 May 2013. • J.E. McBain (Director, CEO) appointed 4 April 2008 as CEO and Director on 10 July 2006.• J.C. Huljich (Director, CEO – Property division) appointed 28 November 2007. • N.R. Collishaw (Director, CEO – Listed Property Trust) appointed 1 May 2013 as CEO – Listed Property Trust and Director on 27 August 2013.• M.J. Coy (CFO and appointed Company Secretary of CCL on 21 October 2009). • T.D. Reid (General Manager – Centuria Life Limited and Company Secretary until resignation on 27 May 2014).• D.B. Govey (Head of Assets) appointed 1 May 2006. Key management personnel compensation
The aggregate compensation paid to key management personnel of the Group is set out below:
2014$
2013 $
Short-term employee benefits 3,064,067 2,402,152
Post-employment benefits 153,241 129,804
Share-based payments 164,213 331,500
3,381,521 2,863,456
Detailed information on key management personnel is included in the Remuneration Report. 29. Share-based payments Performance Rights Plan and Executive Option Plan The Company’s Performance Rights Plan and Executive Option Plan are described in detail in the Remuneration Report which forms part of this document. Performance Rights Plan
Performance Rights
Grant Date
Number of Performance
Rights Granted
EPS Hurdle Vesting Data
Compensation Performance Rights 10 February 2010 685,308 (i) No EPS Hurdle 1 July 2010
Incentive Performance Rights 30 June 2010 300,000 8.96 cents 30 September 2010
Incentive Performance Rights 30 June 2011 700,000 7.50 cents 30 June 2011
Incentive Performance Rights 30 June 2012 85,000 8.00 cents (ii) 31 July 2012
Incentive Performance Rights 29 August 2013 144,310 8.20 cents (iii) 29 August 2013
(i) CCL issued 685,308 new shares in July 2010 in respect of the Compensation Performance Rights. All other Incentive Performance Rights issued to date have been satisfied by Treasury shares held by the Centuria Employee Share Trust (the Trust) which were acquired by the Trust as part of the Unmarketable Parcel Selling Plan executed by the Company.(ii) Based on underlying net profit after tax, the EPS hurdle wasn’t met at 30 June 2012; hence only a discretionary 85,000 Performance Rights were granted.(iii) Based on underlying net profit after tax, the EPS hurdle was met at 30 June 2013 and 144,310 Incentive Performance Rights vested. A cash bonus equivalent to 685,691 Performance Rights was also issued.(iv) There are 399,691 Performance Rights available for potential future issuance by the Nomination and Remuneration Committee.
Notes to the Consolidated Financial Statements for the year ended 30 June 2014 (continued)

87Annual Report 2014
30. Parent entity disclosure As at, and throughout the financial year ending 30 June 2014, the parent entity of the Group was Centuria Capital Limited.
2014 $’000
2013 $’000
Result of parent entity
Income for the period 1,759 3,917
Total comprehensive income for the year 1,759 3,917
Financial position of parent entity at year end
Total assets 103,437 100,153
Total liabilities 16,123 13,813
Total equity of the parent entity comprising of:
Share capital 89,484 89,484
Share-based incentive reserve 164 (28)
Profits reserve 1,759 –
Retained earnings (4,092) (3,116)
Total equity 87,315 86,340

88 Centuria Capital Limited
Additional stock exchange information as at 19 August 2014
Distribution of holders of ordinary shares
Number of holders
Number of ordinary shares
1 – 1,000 819 409,417
1,001 – 5,000 5,250 12,903,258
5,001 – 10,000 912 6,188,448
10,001 – 100,000 612 15,196,708
100,001 and over 65 43,432,933
7,658 78,130,764
Holding less than a marketable parcel 520 172,075
Ordinary shareholders Number of shares held
RBC Investor Services Australia Nominees PTY Limited <BKCUST A/C> 7,768,327
Resolute Funds Management Pty Ltd <Hanover Property S/F A/C> 4,197,808
Number Percentage
1. RBC Investor Services Australia Nominees Pty Limited <BKCUST A/C> 7,768,327 9.94%
2. Resolute Funds Management Pty Limited <Hanover Property S/F A/C> 4,197,808 5.37%
3. HWM (NZ) Holdings Limited 3,514,141 4.50%
4. J P Morgan Nominees Australia Limited 3,223,056 4.13%
5. Paritai Pty Limited <PARITAI A/C> 2,104,076 2.69%
6. National Exchange Pty Limited <CORP A/C> 1,401,563 1.79%
7. Avanteos Investments Limited <2412987 SLATER A/C> 1,260,000 1.61%
8. Avanteos Investments Limited <1259738 PARSONS A/C> 1,107,822 1.42%
9. Vintage Capital Pty Limited 1,100,000 1.41%
10. Avanteos Investments Limited <1703553 JOHNSON A/C> 1,063,608 1.36%
11. National Nominees Limited 835,394 1.07%
12. Sterling Grace Capital Management LP 802,550 1.03%
13. Sterling Grace International LLC 802,550 1.03%
14. Bryshaw Management Pty Limited <BRYSHAW ACCOUNT> 765,051 0.98%
15. Vexdat Pty Limited <VEXDAT SUPER FUND A/C> 714,390 0.91%
16. Avanteos Investments Limited <2469707 N SLATER A/C> 650,000 0.83%
17. Aust Executor Trustees Limited <HENROTH PTY LIMITED> 637,533 0.82%
18. Philip Cairns Dixon + Jacqueline Patricia Dixon + Stephen Thomas Wright <DIXON FAMILY A/C> 550,000 0.70%
19. Koonta Pty Limited <KOONTA SUPER FUND ACCOUNT> 548,112 0.70%
20. National Exchange Pty Limited 500,000 0.64%
33,545,981 42.94%
Ordinary Shares
Voting rights All ordinary shares (whether fully paid or not) carry one vote per share without restriction.
Substantial shareholders
Top 20 shareholders

Contact Us Shareholder Enquiries call: 1800 11 29 29 Investor Enquiries call: 1300 50 50 50 Website: www.centuria.com.au
Head Office Level 39 100 Miller Street Sydney NSW 2060 T: 1300 50 50 50 F: (02) 9460 2960 E: [email protected]
Shareholder Enquiries Centuria Capital Limited Share Registry GPO Box 2975 Melbourne VIC 3001 T: 1800 11 29 29
Friendly Society Investor Enquiries Centuria Life Limited Level 4 441 St Kilda Road Melbourne VIC 3004 T: 1300 50 50 50 E: [email protected]
Company Secretary Matthew Coy Level 39 100 Miller Street Sydney NSW 2060 T: (02) 8923 8919 F: (02) 9460 2960
Mail to Centuria Capital Limited Reply Paid 695 Melbourne VIC 8060 (no stamp required)
Corporate Directory

www.centuria.com.auASX Stock Code: CNI
Strong