2014 Assessment and optimisation of N-nitrosamine ...
184
University of Wollongong Research Online University of Wollongong esis Collection University of Wollongong esis Collections 2014 Assessment and optimisation of N-nitrosamine rejection by reverse osmosis for planned potable water recycling applications Takahiro Fujioka University of Wollongong Research Online is the open access institutional repository for the University of Wollongong. For further information contact the UOW Library: [email protected] Recommended Citation Fujioka, Takahiro, Assessment and optimisation of N-nitrosamine rejection by reverse osmosis for planned potable water recycling applications, Doctor of Philosophy thesis, School of Civil, Mining, and Environmental Engineering, University of Wollongong, 2014. hp://ro.uow.edu.au/theses/4050
Transcript of 2014 Assessment and optimisation of N-nitrosamine ...

University of WollongongResearch Online
University of Wollongong Thesis Collection University of Wollongong Thesis Collections
2014
Assessment and optimisation of N-nitrosaminerejection by reverse osmosis for planned potablewater recycling applicationsTakahiro FujiokaUniversity of Wollongong
Research Online is the open access institutional repository for theUniversity of Wollongong. For further information contact the UOWLibrary: [email protected]
Recommended CitationFujioka, Takahiro, Assessment and optimisation of N-nitrosamine rejection by reverse osmosis for planned potable water recyclingapplications, Doctor of Philosophy thesis, School of Civil, Mining, and Environmental Engineering, University of Wollongong, 2014.http://ro.uow.edu.au/theses/4050


School of Civil, Mining, and Environmental Engineering
Faculty of Engineering and Information Sciences
Assessment and Optimisation of N-nitrosamine Rejection by Reverse Osmosis for Planned Potable
Water Recycling Applications
A thesis submitted in fulfilment of the
requirements for the award of the degree of
DOCTOR OF PHILOSOPHY
From
The University of Wollongong
By
Takahiro Fujioka
April 2014

Certificate of Originality
I hereby declare that this submission is my own work and that it contains no material previously published or written by any other person nor material which to substantial extent has been accepted for the award of any other degree or diploma at the university of Wollongong or any other educational institution.
Takahiro Fujioka
Thesis supervisor
A/Prof. Long Duc Nghiem, University of Wollongong, School of Civil, Mining, and Environmental Engineering, Wollongong, Australia. [email protected]

I
Abstract
A comprehensive assessment focusing on the rejection of eight N-nitrosamines by
reverse osmosis (RO) membranes was conducted for planned potable water recycling
applications. The effects of feed solution characteristics, operating conditions, fouling,
chemical cleaning and membrane characteristics on the rejection of N-nitrosamines
were first examined at laboratory scale. Field sampling campaigns were carried out at
full-scale water recycling plants to provide longitudinal and spatial insights to the
rejection of N-nitrosamines. For the prediction of the rejection of N-nitrosamines by
spiral-wound RO membrane systems, a mathematical model was developed based on
the irreversible thermodynamic principle and hydrodynamic calculation. The model was
validated with the results obtained from a pilot-scale RO system.
The results reported here indicate that the rejection of N-nitrosamines by a given
membrane increased in the order of increasing molecular weight, suggesting that steric
hindrance was a dominating rejection mechanism of N-nitrosamines. The results also
indicate that pH, ionic strength, and temperature of the feed solution can exert an
influence on the rejection of N-nitrosodimethylamine (NDMA) and in some cases other
N-nitrosamines. An increase in the feed temperature led to a significant decrease in the
rejection of all N-nitrosamines and the impact was more pronounced for the small
molecular weight N-nitrosamines. In general, the rejection of N-nitrosamines increased
when the membranes were fouled by tertiary effluent. The rejection of low molecular
weight N-nitrosamines was most affected by membrane fouling. From the results
reported here, it appears that low molecular weight foulants present in the tertiary
effluent can restrict the solute pathway within the active skin layer of membranes,
resulting in the observed increase of solute rejection. Caustic chemical cleaning resulted
in an increase in membrane permeability but caused a notable decrease in the rejection
of N-nitrosamines. The impact of caustic cleaning was not permanent and could be
significantly reduced by a subsequent acidic cleaning step. In general, the rejection of
NDMA and N-nitrosomethylethylamine (NMEA) increased with decreasing membrane
permeability. The impact of membrane permeability became less important for higher

II
molecular weight N-nitrosamines. In addition to the mean free-volume hole-radius of
RO membranes which was measured by the positron annihilation lifetime spectroscopy
(PALS), other membrane parameters and properties such as the free-volume hole-radius
distribution and thickness of the active skin layer can also play a role in governing the
rejection of small and uncharged solutes by RO membranes.
During the sampling campaigns at three full-scale water recycling plants, NDMA was
detected in all RO feed samples varying between 7 and 32 ng/L. Overall rejection of
NDMA among the three RO systems varied widely from 4 to 47%. Data presented here
suggest that the feed temperature can influence rejection of NDMA. A considerable
variation in NDMA rejection across the three RO stages (14-78%) was also observed.
Overall N-nitrosomorpholine (NMOR) rejections were consistently high ranging from
81 to 84%. On the other hand, overall rejection of N-nitrosodiethylamine (NDEA)
varied from negligible to 53%, which was considerably lower than values reported in
previous laboratory-scale studies.
The developed model was able to accurately describe the rejection of N-nitrosamines
under a range of permeate flux and system recovery conditions. The modelled N-
nitrosamine rejections were in good agreement with values obtained experimentally
using a pilot-scale RO filtration system. The modelling results also revealed that an
increase in recovery caused a decrease in the rejection of these N-nitrosamines, which is
consistent with the experimental results. Further modelling investigations suggested that
NDMA rejection by a spiral-wound system can drop from 49 to 35% when the overall
recovery increased from 10 to 50%. The model developed from this study can be a
useful tool for water utilities and regulators for system design and evaluating the
removal of N-nitrosamines by RO membranes.

III
Acknowledgements
I would like to express the deepest appreciation to Associate Professor, Long Nghiem who continually and persuasively conveyed a spirit of adventure and tremendous supports in regard to research. Without his supervision and constant help this achievement on my PhD work would not have been possible.
My PhD work was also made possible by the Australian Research Council (ARC) Linkage Project LP0990705 (with industry support from Veolia Water and Seqwater). I am most grateful to have had the opportunity to work in this ARC project. I would also like to thank the University of Wollongong for a PhD scholarship.
I would like to express my special thanks to the collaborators of the ARC project. A/Prof Stuart Khan and Dr James McDonald (UNSW) are thanked for providing their generous helps for the analysis of trace organic chemicals and sharing their valuable knowledge. I would also like to express my gratitude and thanks to Ms Annalie Roux (Seqwater) and Mr Yvan Poussade (Veolia Water) for providing us various supports and sharing their priceless experiences. I would like to express my special gratitude to Professor Jorg Drewes (TU München) for his critical advices on the research plan and publications and his continuous engagement through the progress of my PhD work.
I would like to express my gratitude to persons who provides me analytical information using state-of-the-art instruments. Dr Rita Henderson (UNSW) is thanks for allowing us to see the details of organic matter in water using the LC-OCD technique (Chapter 5). Dr Nagayasu Oshima and Dr Ryoichi Suzuki (National Institute of Advanced Industrial Science and Technology, Japan) are also thanked for providing us the insights of polymer membranes using the PALS technique (Chapter 8).
My thanks and appreciations also go to my colleagues in the same laboratory who have willingly helped me out with their abilities. I specially acknowledge Kha Tu for his assistance with ICP-MS analysis. I would like to express my thanks to technical officers of the Faculty of Engineering and Information Sciences, Robert Rowlan, Frank Crabtree and Ling Tie for their generous supports.
A special thank must be given to my wife Sandrine for her understanding and help on my work. I was able to devote myself to my research work thanks to her help.

IV
TableofContentsChapter 1 Introduction ............................................................................................... 1
Chapter 2 Literature review ...................................................................................... 4
1 Introduction .......................................................................................................... 4
2 Indirect potable water reuse and N-nitrosamines ................................................ 6 2.1 Water reclamation process ............................................................................... 6 2.2 Occurrence of N-nitrosamines in water recycling schemes ............................. 9 2.3 Health-based water quality guidelines and standards for N-nitrosamines ..... 14 2.4 N-nitrosamine quantification using chemical analysis .................................. 17 2.5 Removal of N-nitrosamines during Water Reclamation ................................ 18
3 N-nitrosamine removal by RO membranes ........................................................ 18 3.1 Rejection of N-nitrosamines in laboratory-scale studies ............................... 18 3.2 Rejection of N-nitrosamines and N-nitrosamine precursors in pilot- and full-scale installations ..................................................................................................... 20 3.3 Factors affecting N-nitrosamine rejections .................................................... 24 3.4 Research gaps ................................................................................................ 29
4 Conclusions ........................................................................................................ 30
Chapter 3 Materials and Methods ......................................................................... 32
1 Introduction ........................................................................................................ 32
2 Selected NF/RO membranes .............................................................................. 32
3 Chemicals ........................................................................................................... 33
4 Filtration system ................................................................................................. 36 4.1 Bench-scale filtration system ......................................................................... 36 4.2 Pilot-scale filtration system............................................................................ 36
5 Water chemistry analytical techniques .............................................................. 38 5.1 N-nitrosamine concentration analysis ............................................................ 38 5.2 Basic analytical techniques ............................................................................ 39
6 Membrane characterisation ............................................................................... 39 6.1 Contact angle measurement ........................................................................... 39 6.2 Zeta potential measurement ........................................................................... 40 6.3 Surface chemistry........................................................................................... 41
Chapter 4 Effects of feed solution characteristics ........................................... 42
1 Introduction ........................................................................................................ 42

V
2 Materials and methods ....................................................................................... 43 2.1 NF/RO membranes ........................................................................................ 43 2.2 Chemicals ....................................................................................................... 43 2.3 Bench-scale filtration system ......................................................................... 43 2.4 Experimental protocols .................................................................................. 43 2.5 Analytical methods ........................................................................................ 44 2.6 Transport model description .......................................................................... 44
3 Results and discussion ........................................................................................ 47 3.1 Separation behaviour of N-nitrosamines ....................................................... 47 3.2 Modelling the transport of N-nitrosamines during RO filtration ................... 49 3.3 Effects of RO feed solution chemistry ........................................................... 52
4 Conclusions ........................................................................................................ 57
Chapter 5 Effects of membrane fouling .............................................................. 58
1 Introduction ........................................................................................................ 58
2 Materials and methods ....................................................................................... 59 2.1 NF/RO membranes ........................................................................................ 59 2.2 Chemicals ....................................................................................................... 59 2.3 Tertiary treated effluent ................................................................................. 59 2.4 Membrane filtration system ........................................................................... 59 2.5 Experimental protocols .................................................................................. 59 2.6 Analytical techniques ..................................................................................... 61
3 Results and discussion ........................................................................................ 62 3.1 Characteristics of the tertiary effluent and model foulants ............................ 62 3.2 Membrane fouling behaviour ......................................................................... 64 3.3 Characteristics of fouled membranes ............................................................. 67 3.4 Effects of membrane fouling on inorganic salt retention ............................... 69 3.5 Effects of membrane fouling on N-nitrosamine rejection ............................. 70
4 Conclusions ........................................................................................................ 74
Chapter 6 Membrane exposure to chemical cleaning reagents ................... 75
1 Introduction ........................................................................................................ 75
2 Materials and methods ....................................................................................... 76 2.1 RO membranes .............................................................................................. 76 2.2 Chemicals ....................................................................................................... 76 2.3 Membrane filtration system ........................................................................... 77 2.4 Simulated chemical cleaning protocols ......................................................... 77 2.5 Filtration experiments .................................................................................... 79 2.6 Analytical methods ........................................................................................ 79

VI
3 Results and discussion ........................................................................................ 79 3.1 Effects of membrane cleaning on membrane characteristics ......................... 79 3.2 Effects of chemical cleaning on rejection performance of RO membranes .. 85 3.3 Sequential cleaning ........................................................................................ 88
4 Conclusions ........................................................................................................ 89
Chapter 7 Effects of membrane characteristics ................................................ 90
1 Introduction ........................................................................................................ 90
2 Materials and methods ....................................................................................... 91 2.1 RO membranes .............................................................................................. 91 2.2 Chemicals ....................................................................................................... 91 2.3 Membrane filtration system ........................................................................... 91 2.4 Filtration experiments .................................................................................... 91 2.5 N-nitrosamine analytical methods ................................................................. 92 2.6 Transport model description .......................................................................... 92
3 Results and discussion ........................................................................................ 93 3.1 N-nitrosamine rejection by NF/RO membranes ............................................ 93 3.2 Effects of filtration conditions ....................................................................... 97
4 Conclusions ...................................................................................................... 102
Chapter 8 Role of free-volume hole-space of RO membranes .................... 103
1 Introduction ...................................................................................................... 103
2 Materials and methods ..................................................................................... 104 2.1 RO membranes ............................................................................................ 104 2.2 Chemicals ..................................................................................................... 104 2.3 Membrane filtration system ......................................................................... 104 2.4 Experimental protocols ................................................................................ 105 2.5 Analytical technique .................................................................................... 105
3 Results and discussion ...................................................................................... 107 3.1 PALS analysis .............................................................................................. 107 3.2 Rejection of boric acid and N-nitrosamines................................................. 109 3.3 Rejection mechanisms ................................................................................. 110
4 Conclusions ...................................................................................................... 112
Chapter 9 Full-scale monitoring ........................................................................... 114
1 Introduction ...................................................................................................... 114
2 Materials and methods ..................................................................................... 115 2.1 RO systems .................................................................................................. 115 2.2 Sampling protocol ........................................................................................ 117

VII
2.3 Analytical technique .................................................................................... 118 2.4 Calculation ................................................................................................... 119
3 Results and discussion ...................................................................................... 119 3.1 Organic and inorganic constituent removal ................................................. 119 3.2 N-nitrosamine removal ................................................................................ 122 3.3 Rejections by RO membranes ...................................................................... 128
4 Conclusions ...................................................................................................... 131
Chapter 10 Mathematical model development and validation .................... 132
1 Introduction ...................................................................................................... 132
2 Theoretical background ................................................................................... 133 2.1 Membrane element characteristics ............................................................... 133 2.2 Hydrodynamics ............................................................................................ 134 2.3 Solute permeation through membranes ....................................................... 137
3 Materials and methods ..................................................................................... 139 3.1 Pilot-scale filtration system and RO element............................................... 139 3.2 Chemicals ..................................................................................................... 140 3.3 Filtration experiments .................................................................................. 140 3.4 Analytical technique .................................................................................... 141
4 Results and discussion ...................................................................................... 141 4.1 Determination of model parameters ............................................................. 141 4.2 N-nitrosamine rejection ............................................................................... 142 4.3 Impact of recoveries ..................................................................................... 144
5 Conclusions ...................................................................................................... 146
Chapter 11 Conclusions ........................................................................................ 148
Chapter 12 Future research .................................................................................. 152
Glossary ...................................................................................................................... 154
List of symbols .......................................................................................................... 155
References .................................................................................................................. 158
VIII
List of Publications
Thesis Related Publications
T. Fujioka, L.D. Nghiem, S.J. Khan, J.A. McDonald, Y. Poussade, J.E. Drewes, Effects of feed solution characteristics on the rejection of N-nitrosamines by reverse osmosis membranes, J. Membr. Sci., 409–410 (2012) 66-74.
T. Fujioka, S.J. Khan, Y. Poussade, J.E. Drewes, L.D. Nghiem, N-nitrosamine removal by reverse osmosis for indirect potable water reuse – A critical review based on observations from laboratory-, pilot- and full-scale studies, Sep. Purif. Technol., 98 (2012) 503-515.
T. Fujioka, S.J. Khan, J.A. McDonald, R.K. Henderson, Y. Poussade, J.E. Drewes, L.D. Nghiem, Effects of membrane fouling on N-nitrosamine rejection by nanofiltration and reverse osmosis membranes, J. Membr. Sci., 427 (2013) 311-319.
T. Fujioka, S.J. Khan, J.A. McDonald, A. Roux, Y. Poussade, J.E. Drewes, L.D. Nghiem, N-nitrosamine rejection by nanofiltration and reverse osmosis membranes: The importance of membrane characteristics, Desalination, 316 (2013) 67-75.
T. Fujioka, N. Oshima, R. Suzuki, S.J. Khan, A. Roux, Y. Poussade, J.E. Drewes, L.D. Nghiem, Rejection of small and uncharged chemicals of emerging concern by reverse osmosis membranes: The role of free volume space within the active skin layer, Sep. Purif. Technol., 116 (2013) 426-432.
T. Fujioka, S.J. Khan, J.A. McDonald, A. Roux, Y. Poussade, J.E. Drewes, L.D. Nghiem, N-nitrosamine rejection by reverse osmosis membranes: A full-scale study, Water Res., 47 (2013) 6141-6148.
T. Fujioka, S.J. Khan, J.A. McDonald, A. Roux, Y. Poussade, J.E. Drewes, L.D. Nghiem, N-nitrosamine rejection by RO: Effects of exposing the membrane to chemical cleaning reagents, Desalination, 343 (2014) 60-66.
T. Fujioka, S.J. Khan, J.A. McDonald, A. Roux, Y. Poussade, J.E. Drewes, L.D. Nghiem, Modelling the rejection of N-nitrosamines by a Spiral-Wound Reverse Osmosis System: Mathematical model development and validation, J. Membr. Sci., 454 (2014) 212-219.
IX
Other Publications
K.C. Wijekoon, T. Fujioka, J.A. McDonald, S.J. Khan, F.I. Hai, W.E. Price, L.D. Nghiem, Removal of N-nitrosamines by an aerobic membrane bioreactor, Bioresource Technology, 141 (2013) 41-45.
K.L. Tu, T. Fujioka, S.J. Khan, Y. Poussade, A. Roux, J.E. Drewes, A.R. Chivas, L.D. Nghiem, Boron as a surrogate for N-nitrosodimethylamine (NDMA) rejection by reverse osmosis membranes in potable water reuse applications, Environ. Sci. Technol., 47 (2013) 6425–6430.
T. Fujioka, L.D. Nghiem, Modification of a polyamide reverse osmosis membrane by heat treatment for enhanced fouling resistance, Water Sci. Technol. Water Supply, 13 (2013) 1553-1559.
T. Fujioka, S.J. Khan, J.A. McDonald, L.D. Nghiem, Ozonation of N-nitrosamines in the Reverse Osmosis Concentrate from Water Recycling Applications, Ozone: Science & Engineering, 36 (2014) 174-180.
T. Fujioka, S.J. Khan, J.A. McDonald, A. Roux, Y. Poussade, J.E. Drewes, L.D. Nghiem, Rejection of small solutes by reverse osmosis membranes for water reuse applications: A pilot-scale study, Manuscript submitted to Desalination.
T. Fujioka, N. Oshima, R. Suzuki, M. Higgins, W.E. Price, R.K. Henderson, L.D. Nghiem, Modification of reverse osmosis membrane by heat treatment for the improvement of boron rejection and fouling resistance, Manuscript submitted to Desalination.
Chapter 1: Introduction
1
Chapter 1
Introduction
Background
Potable water reuse has been recognised as an effective and reliable measure to augment
the supply of drinking water in many parts of the world where fresh water resources are
under severe stress [1]. This practice can be implemented by replenishing reservoirs or
underground aquifers with high quality reclaimed water. In most cases, the reclamation
of water for potable purposes is accomplished by an array of several advanced treatment
processes such as reverse osmosis (RO), activated carbon adsorption, and advanced
oxidation [1, 2]. The deployment of these advanced treatment processes is to ensure
effective removal of pathogenic agents and trace organic chemicals of concern [1, 3-5].
Notable examples of these trace organic chemicals are N-nitrosodimethylamine
(NDMA) and several other N-nitrosamines. NDMA is a disinfection by-product formed
during the chloramination of biologically treated effluent [6] and is often found in the
RO feed at up to a few hundred parts per trillion [7]. Other N-nitrosamines that have
previously been reported in treated wastewater include N-nitrosomethylethylamine
(NMEA), N-nitrosopyrrolidine (NPYR), N-nitrosodiethylamine (NDEA), N-
nitrosodipropylamine (NDPA), N-nitrosodi-n-butylamine (NDBA), N-nitrosopiperidine
(NPIP), N-nitrosomorpholine (NMOR), and N-Nitrosodiphenylamine (NDPhA) [8-12].
Some of these N-nitrosamines have also been identified as potential human carcinogens
by the US EPA [13] and their concentrations in reclaimed water intended for potable
reuse have been regulated in Australia and several other countries at 10 ng/L or less [14].
Research Rationale
RO is a key treatment process in water reclamation applications for the removal of
organic matter, inorganic salts and trace organic chemicals [3, 15, 16]. Due to its high
performance on solute separation, RO process in water reclamation plants is also

Chapter 1: Introduction
2
accounted for some degrees of N-nitrosamine removal from the reclaimed water which
is used for the augmentation of drinking water source. Nevertheless, the removal of
NDMA by RO process appears to be highly variable. For example, NDMA rejections
by the same type of RO membranes reported from full-scale studies range from
negligible to 60% [8, 12, 17, 18]. Moreover, the effectiveness of RO membranes for the
rejection of NDMA and other N-nitrosamines is still poorly understood.
Research objectives
The goal of this study was to understand and optimise N-nitrosamine rejections by RO
membranes. Specific objectives of this study are to:
1) Evaluate the rejection of N-nitrosamines by RO membranes under a range of operating conditions;
2) Examine the impact of fouling and chemical cleaning on N-nitrosamine rejection;
3) Elucidate the mechanisms of permeation of N-nitrosamines through RO membranes; and
4) Develop a full-scale rejection model of N-nitrosamines and validate the model using a pilot-scale RO system.
Thesis outline
The structure of this thesis is schematically described in Figure 1.1. A series of chapters
starts with Chapter 2 which provides a comprehensive literature review on the current
knowledge of N-nitrosamines and their rejections by RO membranes. Descriptions of
membranes, chemicals and filtration system used in this investigation as well as
analytical techniques are summarised in Chapter 3. This is followed by seven chapters
which include experimental results and discussions. The results in regard to the effects
of feed solution characteristics, fouling and chemical cleaning on N-nitrosamine
rejection are presented in Chapter 4, 5, and 6, respectively. The mechanisms of N-
nitrosamine rejection were explored focusing on the properties of RO membranes in
Chapter 7 and 8. The results regarding the removal of N-nitrosamines in full-scale RO
system are presented in Chapter 9. A developed model for the prediction of N-
nitrosamine rejection and the validation of the model using a pilot-scale RO system are

Chapter 1: Introduction
3
reported in Chapter 10. The findings in this thesis are summarised in the Conclusion
(Chapter 11). Recommendations and suggestions for future research are provided in the
last chapter (Chapter 12).
Figure 1.1: Schematic diagram of the thesis “Assessment and Optimisation of N-nitrosamine Rejection by Reverse Osmosis for Planned Potable Water Recycling Applications”.
Introduction (Chapter 1)
Literature Review (Chapter 2)
Materials & Methods (Chapter 3)
Modelling (Chapter 10)
Rejection evaluation
(Chapter 4, 5, 6)
Rejection mechanism
(Chapter 7, 8)
Full-scale monitoring (Chapter 9)
Conclusions (Chapter 11)
Future research (Chapter 12)
Chapter 2: Literature review
4
Chapter 2
Literature review
This chapter has been published as:
T. Fujioka, S.J. Khan, Y. Poussade, J.E. Drewes, L.D. Nghiem, N-nitrosamine removal by reverse osmosis for indirect potable water reuse – A critical review based on observations from laboratory-, pilot- and full-scale studies, Sep. Purif. Technol., 98 (2012) 503-515.
1 Introduction
Water reuse has grown significantly in recent years in response to the increasing
demand for water brought about by population increase, urbanisation, and diminishing
and uncertain availability of freshwater resources. Many water utilities around the world
have now recognised the potential value of water reuse after experiencing severe
droughts as well as the environmental and economic costs of imported water [1, 19, 20].
Since the quality of reclaimed water for potable reuse is stringently regulated, reverse
osmosis (RO) treatment has become an increasingly common component of the water
reclamation process. RO membranes can successfully remove a wide range of
contaminants including inorganic salts and trace organic chemicals [3, 16]. However,
the rejection of N-nitrosodimethylamine (NDMA) by RO membranes appears to be
highly variable [18, 21]. N-nitrosamines including NDMA can readily be formed during
the disinfection of biologically-treated effluent using chlorine or chloramines [22, 23].
Given the probable carcinogenic potency of NDMA and several other N-nitrosamines
[24, 25], the fate of these compounds in water reclamation applications is of significant
interest to both the scientific community and water utilities.
For indirect potable water reuse applications involving the use of the RO process,
concentration of NDMA in the final product water can be controlled via several
strategies. NDMA concentration can be minimised by reducing the formation of NDMA

Chapter 2: Literature review
5
during the chloramination process. This can be achieved by dosing pre-formed
chloramine [12] and reducing the contact time of chloramination [26, 27]. However,
reducing the NDMA formation may not be sufficient if a higher NDMA concentration
than the regulatory level occurs in the inflow of the wastewater treatment plant
(WWTP). An alternative approach is to use an additional treatment process for the
removal of NDMA. Possible treatment technologies include UV/H2O2 treatment process,
natural attenuation during aquifer recharge, and RO filtration.
Advanced oxidation using a combination of UV radiation and dosed hydrogen peroxide
(H2O2) to form hydroxyl radicals has been proven to be effective for the removal of
NDMA and has been applied following RO filtration in several water reclamation
schemes around the world [2, 21]. However, the energy consumption required by
UV/H2O2 treatment for the control of NDMA is high and can have a negative
consequence of increasing the carbon footprint of the water reuse scheme. Moreover, it
is still necessary to control the concentration of NDMA by other processes during
wastewater reclamation since the removal of NDMA by UV/H2O2 treatment is
sometimes incomplete [21]. At a water reuse facility in Southern California, there were
some periods when reclaimed water after UV/H2O2 treatment had to be blended with
other non-recycled sources to reduce NDMA concentration in the final product to below
the 10 ng/L notification level [18].
Natural attenuation over an extended retention time in an aquifer or surface reservoir
has been shown to be effective for the removal of NDMA and other N-nitrosamines [28,
29]. For example, Drewes et al. [29] reported that half-lives of N-nitrosamines in
laboratory-scale soil-column ranged from 1.3 to 7 days. Although natural attenuation is
likely to play a significant role as a post RO treatment process for the removal of
NDMA and other N-nitrosamines, most water utilities are still reluctant to exclusively
rely on this passive treatment technique. A reliable removal efficiency of NDMA and
other N-nitrosamines remains a major focus for the control of these contaminants in
indirect potable water recycling practices.
RO membranes are widely used for the treatment of reclaimed water for indirect potable
reuse and other applications. However, the effectiveness of RO membranes for the

Chapter 2: Literature review
6
rejection of NDMA and other N-nitrosamines is still poorly understood. Broad
discrepancy exists in the existing scientific literature regarding the rejection of NDMA
by RO membranes. For instance, NDMA rejection by a commonly used RO membrane
(TFC-HR, Koch Membranes) was reported to be 50% at the West Basin Municipal
Water District water recycling plant in California, USA [21]. At the Scottsdale Water
Campus (Arizona, USA), NDMA rejections by the same type of RO membrane (TFC-
HR) were reported to be 10 and 70% during two separate sampling events [21].
Compared to NDMA, little is known about the fate of other N-nitrosamines in water
reclamation due to the scarcity of sampling data. This chapter provides a comprehensive
review on the fate of N-nitrosamines and their rejections by RO treatment during water
reclamation.
2 Indirect potable water reuse and N-nitrosamines
2.1 Water reclamation process
Indirect potable water reuse is generally performed through a ‘multiple barrier’
approach that incorporates both engineered and natural treatment processes as well as
non-treatment measures. These multiple barriers may variably include (1)
residential/industrial source control; (2) conventional wastewater treatment; (3)
advanced water treatment; (4) environmental buffer and blending; and (5) drinking
water treatment [20].
A notable approach for the advanced treatment of reclaimed water is the use of
integrated membrane systems (Table 2.1). Since secondary effluents have high fouling
propensity against RO membranes [30], microfiltration (MF) or ultrafiltration (UF)
treatment is usually used as a pretreatment step to minimise membrane fouling in the
subsequent RO process. The RO process substantially reduces the concentration of
dissolved solids including macro-organic molecules and inorganic salts [31]. RO
membranes can also achieve an excellent removal of a large range of trace organic
chemicals [16, 17, 31, 32]. Although RO membranes can remove bacteria and viruses
[33, 34], it is still common to deploy either UV- or chlorine-based disinfection
processes as a ‘redundant’ post treatment to inactivate human pathogens (Table 2.1).
Because the rejection of NDMA by RO membranes is highly variable and can be quite

Chapter 2: Literature review
7
low, the advanced oxidation UV/H2O2 process may also be used for the destruction of
NDMA that can permeate through the RO membrane.

Chapter 2: Literature review
8
Table 2.1: Examples of advanced water treatment processes for indirect potable water reuse.
Treatment processes Location (Commissioning year) Final water use Capacity [m3/day]
Ref.
MF/UF → RO Scottsdale, AZ, USA (1999) Groundwater recharge 53,000 [20]
Terminal Island, CA, USA (2001) Groundwater recharge 18,900 [35]
MF/UF → RO → UV Vander Lans, CA, USA (2001) Groundwater recharge 12,000 [35]
Torreele, Belgium (2002) Groundwater recharge 8,800 [8]
NeWater, Singapore Kranji (2002), Bedok (2002), Seletar (2004), Ulu pandan (2007)
Surface water augmentation into a dam
216,000 [20]
MF/UF → RO →
UV+H2O2
Groundwater Replenishment Project, Orange County, CA, USA (2007)
Groundwater recharge 265,000 [20]
Western Corridor project, Australia Bundamba (2007), Luggage Point (2008), Gibson Island (2008)
Planned future surface water augmentation into a dam
232,000 [36]

Chapter 2: Literature review
9
2.2 Occurrence of N-nitrosamines in water recycling schemes
2.2.1 Presence of N-nitrosamines in wastewater
In addition to NDMA, other N-nitrosamines known to occur in secondary effluent
include N-nitrosomethylethylamine (NMEA), N-nitrosopyrrolidine (NPYR), N-
nitrosodiethylamine (NDEA), N-nitrosopiperidine (NPIP), N-nitrosomorpholine
(NMOR), N-nitrosodipropylamine (NDPA), N-nitrosodi-n-butylamine (NDBA) and N-
Nitrosodiphenylamine (NDPhA) [29, 37, 38]. The chemical structure of N-nitrosamines
is generally described as R1R2N-N=O. These N-nitrosamines are neutral and small
molecules ranging from 74 to 198 g/mol and most N-nitrosamines have high solubilities
(Table 2.2). N-nitrosamines are considered hydrophilic (i.e. log Kow < 3) with N-
nitrosodiphenylamine being the only exception (Table 2.2). Of these N-nitrosamines,
much of the recent research has focused on the fate of NDMA during wastewater
treatment and water reuse.
N-nitrosamines can be found in both domestic and industrial wastewater. Cosmetic and
toiletry products contain NDMA and NMOR [39] and NDMA concentration in the
range of 17 to 63 ng/L has been reported in raw residential sewage [21, 40, 41].
Industrial discharge is another potentially major pathway for NDMA to enter the
sewage system. N-nitrosamines including NDMA can be formed as impurities during
various manufacturing activities, such as the production of rubber, high-energy batteries,
some lubricants, antifreezers, and cutting fluids [21]. Due to industrial activities,
NDMA concentrations as high as 1,000 ng/L have been reported in an industrial sewer
system [41]. Sedlak and Kavanaugh [21] investigated the inflow of several WWTPs in
California and suggested that NDMA concentrations in the inflow could vary
significantly depending on the degree of industrial sewer inflow. They reported that
NDMA concentration in the inflow of WWTPs located in residential areas ranged
between 50 and 100 ng/L whereas an average of 150 ng/L NDMA concentrations was
found at WWTPs where the contribution of the industrial discharge was over 10%.
NMOR concentrations in the wastewater effluent reported in literature [7] are variable
in the ranged from 130 to 12,700 ng/L which may have occurred due to the industrial
activities.

Chapter 2: Literature review
10
Table 2.2: Physicochemical properties of the selected nitrosamines. Compound NDMA NMEA NPYR NDEA NPIP NMOR NDPA NDBA NDPhA
Structure
Molecular Formula
C2H6N2O C3H8N2O C4H8N2O C4H10N2O C5H10N2O C4H8N2O2 C6H14N2O C8H18N2O C12H10N2O
Molecular Weight
[g/mol]
74.05 88.06 100.06 102.08 114.08 116.06 130.11 158.14 198.22
Henry’s law constant at 25 ºC a [atm m3/mol]
1.20×10⁻⁶ 1.44×10⁻⁶ 1.99×10⁻⁷ 1.73×10⁻⁶ 2.81×10⁻⁷ 2.13×10⁻¹⁰ 3.46×10⁻⁶ 9.96×10⁻⁶ 1.38×10⁻⁵
Solubility in water at 20 ºC b [g/L]
1,000 300 780 147 49 4,714 9.9 1.2 0.035
LogKow b -0.64 -0.15 0.23 0.34 0.74 -1.39 1.35 2.31 3.16 a EPI SuiteTM v4.10 , US EPA, http://www.epa.gov/opptintr/exposure/pubs/episuite.htm b GSI Environmental Inc., http://www.gsi-net.com/en/publications/gsi-chemical-database.html
NN
ON
NO
NN
ON
NO
NN
O
NN
O
O
NN
ON
NO
NN
O

Chapter 2: Literature review
11
2.2.2 NDMA precursors
Together with the increasingly reported occurrence of NDMA in domestic and
industrial wastewater, the abundance of NDMA precursors in both domestic and
industrial wastewater discharge has been widely reported in the literature. For the
evaluation of the maximum NDMA formation that can occur in an aqueous solution, the
NDMA formation potential can be used [6]. NDMA formation potentials ranging from
25 to 55 µg/L were reported in domestic wastewater in California by Sedlak and
Kavanaugh [21]. They also reported NDMA formation potentials of as high as 82.5
µg/L in an industrial wastewater.
A number of substances have been identified as NDMA precursors. These include both
heterogeneous organic mixtures such as humic substances found in the natural
environment [42] and some specific organic compounds containing the amine
functional group such as dimethylamine, triethylamines, and dimethylaminobenzene
(Figure 2.1). These amine bearing organic compounds can be readily converted to
NDMA during chloramination [43]. Some pharmaceuticals and personal care products
(PPCPs) containing dimethylamine (DMA) or diethylamine (DEA) functional groups
can also act as NDMA precursors. For example, Shen and Andrews [44] reported higher
than 1% molar conversion of eight PPCPs containing these functional groups to NDMA
during chloramination.
Since DMA occurs naturally in urine and faeces, DMA is ubiquitous in domestic
wastewater [21, 45]. In fact, faeces and urine contain an average DMA concentration of
0.4 and 15.9 mg/L, respectively [46]. Numerous studies have used DMA to elucidate
mechanisms of NDMA formation [26, 45, 47]. Gerecke and Sedlak [48] reported that
the yield of NDMA from the reaction between DMA and chloramine was only
approximately 0.6%. Similarly, in the primary effluent of the Orange County Sanitation
District facility (CA, USA) approximately 80 µg/L of DMA was found while NDMA
formation potential was only 5 µg/L in the same sample [40].
Several other compounds such as DEA, dipropylamine (PYP), pyrrolidine (PIP) and
diphenylamine (DPhA) are also suspected to be the precursor of NDEA, NPYP, NPIP

Chapter 2: Literature review
12
and NDPhA, respectively. Amongst them, DEA, PYP and PIP are excreted through
faeces and urines in the range of 0.03-9 mg/L [46], and DPhA can be found in an
insecticide, a storage preservative for apples and a rubber antioxidant [49]. To date,
however, most N-nitrosamine precursor studies have focused exclusively on the
formation of NDMA during chloramination, and information regarding the precursors
of the other N-nitrosamines is rather scarce.
Figure 2.1: NDMA precursors found in wastewater.
2.2.3 NDMA formation
In general, oxidation of N-nitrosamine precursors by strong oxidants such as
chlorination, chloramination, ozone, and potassium permanganate leads to a formation
of NDMA [26, 50-53]. Several mechanisms of NDMA formation during chloramination
have been proposed [54], and they usually involve two major pathways. Unsymmetrical
dimethylhydrazine (UDMH) is initially formed from NDMA precursors such as DMA
by a reaction with monochloramine (NH2Cl). Then UDMH is transformed into NDMA
by the oxidation of monochloramine, as shown in Equation 1 [45, 47]. The yield of
NDMA formation from DMA is less than 3% and the oxidation is a gradual process
taking several days [6, 26].
Schreiber and Mitch [26] have revised this formula to take into account the significant
enhancement in NDMA formation by dichloramine (NHCl2), as shown in Equation 2.
Another study proposed that the chlorinated UDMH intermediates can be oxidised by
both dissolved oxygen and chloramines. This is attributed to the weak and non-polar
property of the N-Cl bond contained in the chlorinated UDMH intermediates [55].
CH3
CH3
NH
CH3
CH3
NCH3
CH3
CH3
N
Dimethylamine Trimethylamine Dimethylformamide Dimethylaminobenzene
H
O CH3
CH3
N
N
CH3
CH3
N
H
H
N Cl
H
HCH3
CH3
NH N N
CH3
CH3
O+
UDMH
(1)NH2Cl, H2O
DMA NDMA

Chapter 2: Literature review
13
Choi and Valentine [56] proposed another pathway for NDMA formation in the
presence of DMA and chlorine. It was hypothesised that dinitrogen tetroxide (N2O4) is
firstly formed by nitrosation enhanced by chlorine, and then a reaction between N2O4
and DMA leads to the formation of NDMA as shown in Equations 3 - 5.
HOCl + NO2- ↔ NO2Cl + OH- (3)
NO2Cl + NO2- ↔ N2O4 + Cl- (4)
The formation of NDMA by chloramination can vary significantly depending on the
conditions of the chloramination process. In fact, several studies reported that NDMA
concentration substantially increased with increasing reaction time and chloramine (or
chlorine) dosage [22, 23, 45, 47]. Farré et al. [12] investigated the impact of
chloramination contact time on NDMA formation in the feed of a full-scale RO plant.
They reported that 20 – 22 hours of chloramination contact time led to 170±20 ng/L
NDMA concentration, while 1 to 2 hours of chloramination exposure resulted in only
7±2 ng/L NDMA concentration. Laboratory-scale experiments conducted by the authors
also showed that NDMA formation significantly decreased as chloramine dose [12].
The disinfection process can be optimised to minimise the formation of NDMA. It has
been demonstrated that adding ammonium chloride followed by chlorine into the
wastewater forms less NDMA than adding chlorine followed by ammonium chloride
[26, 27]. This is because dichloramine, which forms more NDMA than
monochloramine, is generated less when ammonium chloride is added earlier into the
wastewater, reducing the transient occurrence of high chlorine/ammonia ratios. These
findings are consistent with another laboratory-scale study where dosing pre-formed
monochloramine into the wastewater led to far less NDMA formation potential (< 1
N
CH3
CH3
N
H
Cl
NH
Cl
ClCH3
CH3
NH + +
Chlorinated UDMH
(2)H+
Cl-
+
DMA
CH3
CH3
NH + (5)N2O4
DMA
N N
CH3
CH3
O
NDMA

Chapter 2: Literature review
14
ng/L) compared with dosing ammonium chloride and sodium hypochlorite into the
wastewater (6 ng/L) [12]. Although the formation of NDMA during water reclamation
can be minimised with an appropriate chloramination conditions, a subsequent
treatment process is often necessary for further removal of NDMA.
2.3 Health-based water quality guidelines and standards for N-nitrosamines
The occurrence of N-nitrosamines in drinking water has attracted significant scientific
and regulatory attention in recent years since some have been classified as probable
human carcinogens by the US Environmental Protection Agency [25] and the
International Agency for Research on Cancer [24]. The occurrence of NDMA is of
particular concern amongst all N-nitrosamines because NDMA concentration exceeding
some enforced regulatory levels has been detected in drinking water [52, 57, 58]. Based
on a calculated excess lifetime cancer risk of 1 in 106, the California Office of
Environmental Health Hazard Assessment have set a public health goal for NDMA in
drinking water of 3 ng/L [59] (Table 2.3). The California Department of Public Health
(CDPH) also established a notification level for NDMA, NDEA and NDPA of 10 ng/L
[59]. Outside the US, an interim action level of NDMA has been determined at 9 ng/L
by the Ontario Ministry of the Environment [60], while a NDMA guideline value of the
World Health Organisation [61] and Australian Drinking Water Guidelines [62] is as
high as 100 ng/L. The regulation of N-nitrosamines in indirect potable water reuse can
be more stringent than that in conventional drinking water. Health-based guideline
values of 10 ng/L for NDMA, 10 ng/L for NDEA and 1 ng/L for NMOR have been
established in the Australian Guidelines for Water Recycling [14]. Although an
increasing number of authorities have regulated N-nitrosamine concentrations for
drinking or recycled water (Table 2.3), many water utilities have not been able to
monitor their concentrations in the product water on a regular basis. Under the USEPA
Unregulated Contaminant Monitoring Rule 2 (UCMR 2), an extensive screening
exercise was conducted between 2008 and 2010 to identify key contaminants of concern
for future monitoring and regulation [58]. From 1,196 public water supplies and
approximately 17,150 samples, NDMA was the most frequently detected contaminant
in the samples from 25% of the public water supplies or 10% of the total samples in

Chapter 2: Literature review
15
which a maximum concentration of 630 ng/L was reported [58]. Five N-nitrosamines
(i.e., NDMA, NDEA, NDPA, NPYR and NDPhA) have also been included in the third
Contaminant Candidate List 3 (CCL3) proposed by the US EPA [63]. These N-
nitrosamines are likely to be regulated in the future under the Safe Drinking Water Act
of the United States [64].

Chapter 2: Literature review
16
Table 2.3: Risk level and guideline level of N-nitrosamines.
Compound
US EPA classificati
on a
IARC classificati
on b
US EPA, IRIS
10-6 risk level
CDPH 10-6 risk
level
CDPH notificatio
n level
Ontario MOE
interim action level
WHO guideline
value
ADWG guideline
value
AGWR guideline
value
[ng/L] [ng/L] [ng/L] [ng/L] [ng/L] [ng/L] [ng/L] NDMAc, d B2 2A 0.7 3 10 9 100 100 10 NMEAc B2 2B 2 1.5 - - - - - NPYRc, d B2 2B 20 15 - - - - - NDEAc, d B2 2A 0.2 1 10 - - - 10 NPIP - 2B - 3.5 - - - - - NMOR - 2B - 5 - - - - 1 NDPAc, d B2 2B 5 5 10 - - - - NDBAc B2 2B 6 3 - - - - - NDPhAd B2 3 7,000 - - - - - - Ref. [25] [24] [25] [59] [59] [60] [61] [62] [14] a B2: probable human carcinogen. b 2A: probable human carcinogen; 2B: possibly human carcinogen; 3: unclassifiable chemical as to its carcinogenicity to humans. c Chemical is on US EPA’s list of the UCMR 2. d Chemical is on US EPA’s list of the CCL3.

Chapter 2: Literature review
17
2.4 N-nitrosamine quantification using chemical analysis
Quantifying NDMA and other N-nitrosamines at the part-per-trillion level (ng/L) is a
challenging task and to date most reported detection limits are only marginally lower
than their regulated values. High analytical cost is also a hurdle to engage in intensive
monitoring efforts for N-nitrosamines in addition to regulatory requirements. To address
the low concentration analysis, most currently available methods involve a solid-phase
extraction (SPE) procedure followed by quantification using chromatographic-mass
spectrometric analytical instruments.
For quantitative determination of N-nitrosamines in water samples, many recent
methods use gas chromatography coupled with different detection techniques such as
mass spectrometry (GC-MS) [65, 66], tandem mass spectrometry (GC-MS/MS) [67-69]
or high resolution mass spectrometry (GC-HRMS) [70, 71]. These methods use
deuterated N-nitrosamines (i.e. d6-NDMA and d14-NDPA) as an internal standard for
calibrations and/or surrogate for recoveries. The US EPA has defined that Method 521
[67] be used for analysing N-nitrosamines under the USEPA Unregulated Contaminant
Monitoring Rule 2. Method 521 is based on coconut charcoal SPE, GC-MS/MS, large
volume injector and chemical ionization (CI) operation mode with CI reagent gas
(methanol or acetonitrile). Method 521 provides a reporting detection limit of 1.6 ng/L
for NDMA and the reporting detection limits of the other N-nitrosamines (NMEA,
NDEA, NDPA, NDBA, NPYR and NPIP) range from 1.2 to 2.1 ng/L. The Ontario
Ministry of Environment sets a different testing method for Ontario drinking water
samples using GC-HRMS after an SPE procedure using the Ambersorb 572 adsorbent
[70]. In the method, the reporting detection limit of NMDA is 0.99 ng/L. Recent
developments in N-nitrosamine analysis include a simple technique using selective ion
storage mode of GC/MS with chemical ionisation [72], a sensitive GC-MS/MS
technique using electron ionisation [73] and high-field asymmetric waveform ion
mobility spectrometry with time-of-flight mass spectrometry [74].
Analytical techniques using liquid chromatography (LC) have been increasingly
developed to analyse N-nitrosamine concentration in water. Compared to GC methods,
LC technique particularly has an advantage on detecting both thermally stable and

Chapter 2: Literature review
18
unstable N-nitrosamines (i.e. NDPhA) [75]. To date several LC-MS/MS techniques
have been reported [18, 37, 76]. Positive electrospray ionisation (ESI) combined with
multiple reaction monitoring mode is used in these methods. Zhao et al. [37]
investigated nine N-nitrosamines in water samples using SPE-LC(ESI)-MS/MS and
reported that detection limits of N-nitrosamines are in the range from 0.1 to 10.6 ng/L
with 41 to 111% recoveries. Another SPE-LC(ESI)-MS/MS technique has been
developed with a detection limit of 2 ng/L NDMA and over 90% recovery [18]. The
other recent techniques include a method using SPE and LC(ESI)-HRMS detection [76]
and SPE-LC-MS/MS with atmospheric pressure chemical ionisation [77]. Although
these LC-MS/MS or LC-HRMS methods can be an alternative technique to GC-based
techniques, very few water utilities have affordable routine access to LC-MS/MS and
LC-HRMS.
2.5 Removal of N-nitrosamines during Water Reclamation
N-nitrosamines have relatively low molecular weights and are stable in aqueous
solution, and thus are not sufficiently removed by most conventional water and
wastewater treatment processes. The removal of NDMA by secondary treatment is poor
and highly variable [21] and the removal of NDMA by coagulation has been reported to
be negligible [78]. Less than 10% NDMA removal by UF treatment was reported at a
full-scale plant [12]. Granular activated carbon adsorption also exhibited limited
effectiveness for NDMA removal [79, 80], with the removal of NDMA in the range of
20 – 50% [81]. Although RO membranes have been proven for complete or near
complete removal of a large range of trace organic chemicals, there exists significant
discrepancy in NDMA rejections both from laboratory- and full-scale data. This
discrepancy will be further discussed in the next section.
3 N-nitrosamine removal by RO membranes
3.1 Rejection of N-nitrosamines in laboratory-scale studies
N-nitrosamines are neutral compounds at the typical environmental pH range of 4 to 10.
In general, the rejection of N-nitrosamines is primarily governed by steric hindrance
(size exclusion) (Figure 2.2). It is noteworthy that all of the RO membranes listed in

Chapter 2: Literature review
19
Figure 2.2 are typically used for brackish water desalting and softening. There is a
strong correlation between molecular weight of N-nitrosamines and their rejections for a
given membrane [38, 82]. An overall trend of increasing rejection in the increasing
order of molecular width of the N-nitrosamines has also been demonstrated by
Miyashita et al. [82]. A strong correlation between the rejection of N-nitrosamines by a
NF membrane (NF270) and the Stokes radius of the N-nitrosamines was also reported
by Bellona et al. [83]. The rejection of NDMA, the smallest compound amongst all N-
nitrosamines, was consistently found to be lowest by all types of membrane reported in
the literature.
Laboratory-scale studies available to date have consistently indicated that the rejection
of NDMA by RO membranes (i.e. BE, BW30, and LFC3 membranes) was between
55% and 70% (Figure 2.2). On the other hand, NDMA rejection by NF membrane (i.e.
NF90) reported in a laboratory-scale study was below 15%. The impact of membrane
type on N-nitrosamine rejection is less profound with higher molecular weight N-
nitrosamines. It is noted that the rejection of NDPhA has not been reported in the
literature.
Figure 2.2: Rejection of N-nitrosamines by three RO (LFC3, BW30, BE) and one NF (NF90) membranes obtained from laboratory-scale studies [38, 82].
80 100 120 140 1600
10
20
30
40
50
60
70
80
90
100
LFC3 BW30 BE NF90
Rej
ect
ion [%
]
Molecular weight [g/mol]
ND
MA
NM
EA
NP
YR
ND
EA
ND
PA
ND
BA

Chapter 2: Literature review
20
3.2 Rejection of N-nitrosamines and N-nitrosamine precursors in pilot- and full-scale installations
3.2.1 Rejection of N-nitrosamines
In comparison to other trace organic chemicals, pilot- and full-scale data regarding the
rejection of N-nitrosamines by RO membranes are very scarce. To date, monitoring
effort in pilot- and full-scale investigations has focused almost exclusively on NDMA.
The rejections of other N-nitrosamines are rarely reported in the literature. While
NDMA rejection by RO membranes reported in most laboratory-scale studies was in the
range of 50 to 70% (Section 3.1), it is striking to note a substantial discrepancy in the
rejection of NDMA recorded from pilot- and full-scale RO plants (Table 2.4). These
plants had similar pretreatment processes and were operated with almost identical water
recovery ratios and average RO permeate fluxes. In these water reclamation plants,
chloramination was performed by injecting sodium hypochlorite (NaOCl) and ammonia
simultaneously prior to MF or UF to control biofouling. The concentration of
chloramine in the RO feed was usually maintained at between 1 and 5 mg/L. The
average permeate flux and water recovery of all RO plants were approximately 20
L/m2h and 80 – 85%, respectively (Table 2.4).
In general, the rejection of trace organic chemicals by RO membranes is very high (e.g.
over 90%) [32]. Nevertheless, the rejection of NDMA by the same membrane reported
at different RO plants can be very low and significantly variable. For example, NDMA
rejection by the TFC-HR membrane in the range of 14 to 70% was reported at the
Bundamba Advanced WTP (Queensland, Australia), the West Basin Municipal Water
District WTP (California, USA), and the Scottsdale Water Campus (Arizona, USA)
(Table 2.4). Similarly, there also exists substantial discrepancy in NDMA rejection
ranging from 22 to 86% at three different plants using the ESPA2 membrane (Table 2.4).
It is also worth noting that substantial difference in NDMA rejection can be found even
at the same plant. Two distinct NDMA rejections (10% and 70%) were recorded at
different sampling occasions at the Scottsdale Water Campus [21]. Approximately 30%
difference in NDMA rejection was also reported at the Interim Water Factory 21 (USA)
[18, 21]. As discussed above, although these plants were operated with a similar water
recovery and average permeate flux, the exact operating conditions may vary

Chapter 2: Literature review
21
significantly from one another. In order to account for variability in rejection
performance by a single plant, Khan and McDonald [84] have demonstrated the use of
probability density functions to more comprehensively describe the RO rejection of
NDMA, NDEA and NDPA. The variation in the removal of NDMA by the RO process
demonstrated in Table 2.4 can be attributed to such differences in operating conditions
amongst the different plants or sampling events. Further discussion of the impact of
operating conditions on the rejection of NDMA and other N-nitrosamines is provided in
Section 3.3.

Chapter 2: Literature review
22
Table 2.4: NDMA rejection by pilot and full-scale RO plants. Location Pretreatment processesa RO
Membrane RO stages
RO recovery [%]
RO permeate flux [L/m2h]
NDMA in RO feed [ng/L]
NDMA in RO permeate [ng/L]
NDMA rejection by RO [%]
Reference
El Segundo – train 3, West Basin Water Recycling Plant, USA
SEC - NaOCl - MF - RO TFC-HR 3 85 17 90 60
40 43
56 28
[21] [85]
Scottsdale Water Campus, USA
SEC - NaOCl/NH4+ - MF - RO TFC-HR 3 85 18.2 330
200 100 180
70 10
[21, 85]
Bundamba AWTP, Australia
SEC - NaOCl/NH4+ - COAG - UF -
RO
SEC - NH4+ - COAG - NaOCl - UF -
RO
TFC-HR 3 85 NA 190
7
170
6
11
14
[12, 86]
El Segundo - train 4, West Basin Water Recycling Plant, USA
SEC - NaOCl - MF - RO ESPA2 2 85 19.4 32 21 34 [35, 85]
Interim Water Factory 21, USA
SEC - NaOCl - MF - RO ESPA2 NA 85 20.5 18 45
14 20
22 55
[18]
Beenyup Pilot Plant, Australia
SEC - HOCl/NH4+ - MF - RO ESPA2 2 80 19.7 11
6.7 < 1.6 2.5
> 86 63
[87]
a SEC: Secondary effluent; COAG: Coagulation process; NaOCl/HOCl: Chlorine addition;NH4+: Ammonia addition; MF/UF: MF/UF process; RO: RO process.

Chapter 2: Literature review
23
3.2.2 Rejection of N-nitrosamine precursors
To measure the rejection of NDMA precursors by RO membranes, NDMA formation
potential is usually used as a surrogate. Results reported from laboratory- and pilot-scale
studies show that the rejection of NDMA formation potential by most RO membranes is
more than 97% [8, 22, 43]. Farré et al. [86] reported over 98.5% NDMA formation
potential rejection by the TFC-HR membrane at the Bundamba AWTP (Australia). It is
noteworthy that the elevated NDMA formation potential in the RO concentrate can be
reduced using a nitrification-denitrification process [86]. NDMA formation potential
may also be rejected to a certain extent by MF and UF membranes. At the Torreele
plant (Belgium), up to 10% NDMA formation potential rejection by an UF membrane
was reported [8]. Similarly, NDMA formation potential rejection in the range of 10 to
90% by a MF membrane was reported in a pilot study at the Interim Water Factory
21[21].
Because NDMA formation potential can occur at high concentration (i.e., 500 – 3,200
ng/L) prior to RO filtration [21, 43, 86], some NDMA formation potential may still be
detected in the RO permeate. For example, approximately 6 ng/L of NDMA formation
potential was reported in the RO permeate treated by the TFC-HR membrane at the
Bundamba AWTP [86]. On the other hand, NDMA formation potential in the range
from 12 to 52 ng/L was also detected in the RO permeate in a pilot study at the Interim
Water Factory 21 [21]. Because NDMA yield from NDMA formation potential by
chloramination and chlorination is very low (Section 2.2.2), the remaining NDMA
precursors in the RO permeate is not likely to adversely impact the RO permeate quality.
The investigation of NDMA precursor is frequently carried out with DMA. In a typical
water recycling application, it occurs in the feed water to the RO process in the range of
3 to 12 µg/L [21, 43]. The molecular weight of DMA is low (45 g/mol), however, its
basicity constant (pKb) is 3.36 and thus it is positively charged at pH below or near
neutral pH ((CH3)2NH + H2O (CH3)2NH2+ + OH-). As a result, DMA is very well
rejected by RO membranes. Mitch and Sedlak [43] reported over 99% DMA rejection
(from 8-11 µg/L to below 0.09 µg/L) at a WWTP using an unspecified RO membrane.
In a laboratory-scale study, Miyashita et al. [82] also demonstrated a very high DMA

Chapter 2: Literature review
24
rejection of 99.5% and 99.2% by RO (Saehan BE) and NF (NF90) membranes,
respectively. Despite the similarity in rejection between NDMA formation potential and
DMA, Mitch and Sedlak [43] suggested an average contribution of only 14% of DMA
into the total dissolved NDMA formation potential in secondary effluent. Although the
majority of NMDA formation potential found in the feed to the RO process have been
reported to be small and low molecular weight compounds (< 2.5 kDa) [8, 88], there is
very little information available regarding specific NDMA precursors prior to RO
treatment.
The rejection data of the other N-nitrosamine formation potential using pilot- or full-
scale RO treatment is scarcely available. Krauss et al. [8] reported over 98% of NPYR
formation potential rejection and over 94% of NPIP formation potential rejection by an
RO membrane, showing a similar rejection efficiency to the rejection of NDMA.
3.3 Factors affecting N-nitrosamine rejections
3.3.1 Feed concentration
Although most RO plants (Table 2.4) are operated with similar water recovery and
average permeate flux, the exact operating conditions may vary significantly from one
to another. A notable parameter is the concentration of NDMA in the feed, which may
vary over a wide range from 7 to 330 ng/L (Table 2.4). However, recent laboratory-
scale studies have conclusively demonstrated that the impact of feed concentration on
the rejection of NDMA is negligible [82]. Miyashita et al. [82] reported less than 5%
variation in NDMA rejection by the Saehan BE membrane when the feed concentration
of NDMA varied from 0.4 to 900 μg/L.
Previous studies using NF membranes also reported that solute concentration in the feed
does not affect its rejection [89, 90]. Transport of uncharged solutes such as N-
nitrosamines through porous membranes is governed by diffusive and convective flows
inside the pores, which is commonly expressed with the hydrodynamic model (Equation
6) [91, 92].
CKJdx
dCDJ cvps (6)
Chapter 2: Literature review
25
where Js is solute flux; Dp is the diffusion coefficient of the solute in the pore; x is
position in a pore from inlet; C is solute concentration at axial position x in the pore; Jv
is water flux; and Kc is the hindrance factor for convection. Although RO membranes
generally have non-porous active skin layer, free-volume spaces in the membrane
polymer chains can be considered as fictive pore radius [93] and the hydrodynamic
model may be still effective [92]. In fact, the free-volume hole-size in the active skin
layer of RO membranes have been analysed by previous studies [94, 95] using the
positron annihilation lifetime spectroscopy technique. In the hydrodynamic model, the
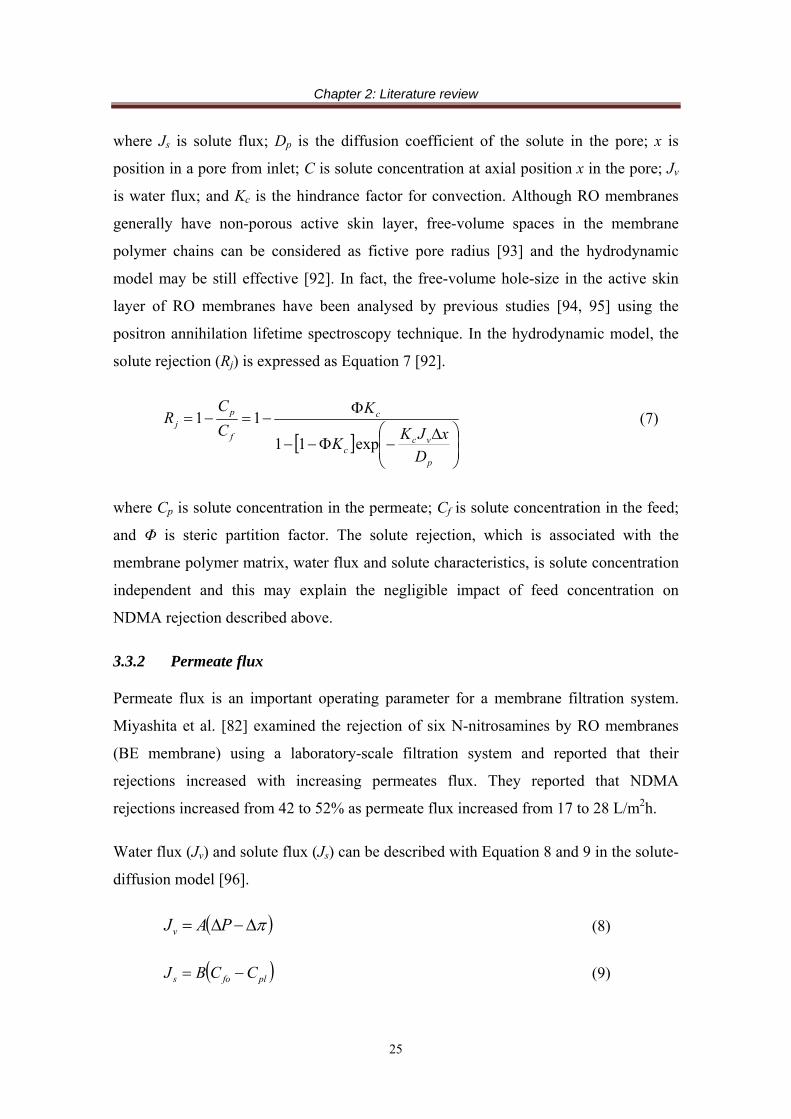
solute rejection (Rj) is expressed as Equation 7 [92].
p
vcc
c
f
pj
D
xJKK
K
C
CR
exp11
11 (7)
where Cp is solute concentration in the permeate; Cf is solute concentration in the feed;
and Φ is steric partition factor. The solute rejection, which is associated with the
membrane polymer matrix, water flux and solute characteristics, is solute concentration
independent and this may explain the negligible impact of feed concentration on
NDMA rejection described above.
3.3.2 Permeate flux
Permeate flux is an important operating parameter for a membrane filtration system.
Miyashita et al. [82] examined the rejection of six N-nitrosamines by RO membranes
(BE membrane) using a laboratory-scale filtration system and reported that their
rejections increased with increasing permeates flux. They reported that NDMA
rejections increased from 42 to 52% as permeate flux increased from 17 to 28 L/m2h.
Water flux (Jv) and solute flux (Js) can be described with Equation 8 and 9 in the solute-
diffusion model [96].
PAJv (8)
plfos CCBJ (9)

Chapter 2: Literature review
26
where A is called the water permeability constant; B is called the salt permeability
constant; ∆P is the difference in hydrostatic pressure across the membrane; ∆π is the
difference in osmotic pressure across the membrane; Cfo is the feed solute concentration
at the interface of the membrane surface; and Cpl is the permeate solute concentration at
the interface of the membrane in the permeate side. According to these equations, water
flux increases with applied feed pressure, while solute flux is not pressure-dependent.
Solute rejection thus increases when water flux increases by increasing pressure. In
practice, the average permeate flux of RO systems used for water recycling is usually
set at approximately 20 L/m2h (Table 2.4). However, differences in the local permeate
flux amongst different elements in an RO pressure vessel can be intensified by feed
pressure loss, osmotic pressure increase and membrane fouling [30, 97]. Thus,
variations in permeate flux that occur in an RO pressure vessel is likely to affect the
rejection of low molecular weight compounds such as NDMA.
3.3.3 Feed pH
The influence of feed pH on the rejection of seven N-nitrosamines was investigated in a
laboratory-scale study using the ESPA3 membrane [38]. They revealed higher NDMA
rejection (56%) at pH 10 than at pH 3 (49%). For the other six N-nitrosamines, the
impact of feed pH was not pronounced.
The rejection of small and neutral compounds can be influenced by the feed solution pH
and the rejection usually increases with increasing pH [98, 99]. It is assumed that high
pH causes an extended chain conformation of the membrane polymer matrix which
results in narrower pore size of membrane, and the rejection of neutral compounds thus
increases. On the other hand, chain groups existing on the membrane surface lose
electrostatic repulsion at low pH range, resulting in looser pore size and low rejections
[99, 100]. It can be inferred from these studies that an increase in feed pH led to tighter
membrane pore structure that results in an increase in the rejection of small N-
nitrosamines (i.e., NDMA and NMEA). In general, changes in feed pH of full-scale
water reclamation plants only occur in a small range (i.e. pH 5-8) [101] and most full-
scale RO plants adjust feed pH to 6.3-6.5 to minimize scaling. Thus, feed pH is unlikely
to be a major cause of the variations in NDMA rejection in full-scale RO plants.

Chapter 2: Literature review
27
3.3.4 Total dissolved solids concentration
Total dissolved solids (TDS) concentration can induce an observable impact on the
rejection of N-nitrosamines. Steinle-Darling et al. [38] investigated the impact of TDS
(ionic strength) on the rejections of the seven N-nitrosamines using a laboratory-scale
system and the ESPA3 membrane. They reported that NDMA rejections with deionised
feed solution and 100 mM NaCl feed solution were 56 and 41%, respectively. On the
other hand, the rejections of the other six N-nitrosamines for the two TDS feed solutions
were equivalent.
TDS concentration of RO feed for water recycling applications can vary across a range
of 10 to 30 mM [102-104]. Therefore, it is likely that feed TDS variations will play a
role in NDMA rejection variations. In addition to TDS variations in the RO feed, and
TDS are gradually accumulated in the feed toward a tail-element (the last membrane
element amongst serially-connected membrane elements in a vessel) because salt
rejection by RO membrane is well over 90% [17]. This concentration effect results in a
significant variation in total TDS concentration within RO system. The permeability of
a membrane and the rejection of salts typically decrease as TDS concentration increases
[105, 106]. Drewes et al. [31] demonstrated that the conductivity of the feed
substantially increased from 1,249 to 5,164 µS/cm after passing through two subsequent
RO stages during water reclamation. Consequently, the conductivity of the various
membranes permeates throughout the RO system increased from 22 µS/cm (1st stage
permeate) to 65 µS/cm (3rd stage permeate). Several studies demonstrated that an
increase in TDS concentration in the RO feed also resulted in a decrease in neutral
solute rejections [107-109]. They suggested that the decreasing solute rejection resulted
from the enlargement in pore sizes of a membrane and changes of the solute size caused
by increasing TDS concentration in the feed. It is thus reasonable to hypothesize that a
high TDS concentration can decrease NDMA rejection by RO membranes.
3.3.5 Feed temperature
Some seasonal and diurnal variation in the temperature of the feed solution is inevitable
in most WWTPs. To the best of our knowledge, so far there is only one laboratory-scale

Chapter 2: Literature review
28
study available regarding the impact of feed temperature on the rejection of N-
nitrosamines.
Ben Amar et al. [110] investigated the impact of feed temperature on the rejection of
neutral solutes using a thin-composite polyamide NF membrane and found that their
rejections increased with increasing feed temperature due partly to the increasing
diffusivity of the solutes. In addition to the increased diffusivity, effective pore radius
of a NF organic membrane has been suggested to increase with increasing feed
temperature due to thermal expansion of pores within the active skin layer, which
causes more passage of neutral solutes though membranes [111, 112]. In fact, Ben
Amar et al. [110] also reported that the rejection of neutral solute (arabinose) decreased
from 50 to 42% when the feed temperature increased from 22 to 30 °C using an organic
NF membrane (Desal 5 DK). These mechanisms reported in the literature may explain
the observed decrease in the rejection of N-nitrosamines by RO membranes with an
increase in feed temperature. In any water reclamation plants, the seasonal variation in
RO feed temperature can be over 10 °C [113]. Thus, changes in the feed temperature
can possibly account for up to 25% variation in NDMA rejection.
3.3.6 Membrane fouling and membrane ageing
Membrane fouling is inevitable in most if not all NF/RO filtration processes. The
separation of small organic molecules by NF/RO filtration can be significantly
influenced by membrane fouling [114-117]. Surprisingly, apart from a study by Steinle-
Darling et al. [38] who investigated the rejection of several N-nitrosamines by an RO
membrane artificially fouled with sodium alginate, to date little attention has been given
to the effects of membrane fouling on the rejection of N-nitrosamines. Nevertheless,
data reported by Steinle-Darling et al. [38] confirms that the impact of membrane
fouling caused by alginate on NDMA rejection can be significant. Due to membrane
fouling, the permeate flux decreased by 15% and the rejections of NDMA and NMEA
decreased from 56 to 39% and 79 to 68%, respectively [38]. The authors attributed the
decrease in NDMA and NMEA rejection to the cake-enhanced concentration
polarisation phenomenon as previously reported in the literature [115, 118]. It is
noteworthy that some of the reduction in NDMA and NMEA rejection observed by

Chapter 2: Literature review
29
Steinle-Darling et al. [38] can also be attributed to a decrease in the permeate flux as
discussed previously in section 3.3.2. Further investigation is required to separate the
impact of membrane fouling and flux decline and to develop a systematic understanding
of the influence of other forms of membrane fouling on the rejection of N-nitrosamines.
Of a particular note is the dearth of information regarding the influence of membrane
ageing on the rejection of N-nitrosamines. Membrane ageing caused by prolonged
exposure to hypochlorite has been shown to have a negative impact on the rejection of
inorganic salts and several trace organic compounds [119, 120]. The membrane ageing
process can also be exacerbated by occasional chemical cleaning which is used to
restore the permeate flux once the membrane has been fouled. A recent study reported
by Simon et al. [121] demonstrated that caustic cleaning at pH 12 could lead to a
significant reduction in the rejection of carbamazepine which is a pharmaceutically
active compound from 80 to 50%. These recent results highlight the need for a
systematic investigation of the impact of membrane ageing on the rejection of N-
nitrosamines. Thus, the impact of membrane ageing may also account for some of the
variations in the rejection of NDMA that have been observed in the literature.
3.4 Research gaps
The significant variations in the rejection of NDMA and the lack of rejection data of
other N-nitrosamines and their precursors discussed above underscore the current
research gap regarding the fate and transport of these contaminants during RO treatment
for indirect potable water reuse. Thus, in addition to the core research objectives
described in Chapter 1, the following research gaps will also be addressed in this thesis:
1) Impact of membrane fouling and membrane ageing on the rejection of N-nitrosamines is unclear;
2) Modelling of N-nitrosamine rejection at pilot- or full-scale level taking into account the changes in feed water composition and hydraulic variation throughout the system has not been performed by previous studies; and
3) Identifying a suitable surrogate parameter for routine assessment of NDMA rejection is required.

Chapter 2: Literature review
30
Research gaps I and II will be addressed in Chapters 5, 6, 10 of this thesis. Research gap
III has also been addressed as part of another PhD project (K.L. Tu, T. Fujioka, et al.,
Environmental Science & Technology, 47 (2013) 6425–6430) and thus the results will
not be presented here.
As discussed above, future studies addressing the impact of membrane fouling and
membrane ageing on the rejection of N-nitrosamines could also explain for some of the
variations in their rejection amongst different pilot/full scale RO plants. Recent research
has confirmed that the rejection of N-nitrosamines can be simulated using the existing
irreversible thermodynamic model. However, such modelling capacity is limited to a
flat-sheet membrane sample at the laboratory scale. Further expansion of this modelling
capacity is needed to take into account variation in the hydraulic condition along the
spiral wound membrane element and between different membrane elements in the
system and thus allowing for a systematic evaluation of the impact of permeate flux on
the rejection of NDMA and other N-nitrosamines. The monitoring of N-nitrosamines
rejection in pilot- and full-scale RO plants is severely hindered by the difficulties
associated with the analysis of NDMA at the regulatory levels (Section 2.4). Because
the rejection of NDMA by RO membranes is governed mostly by steric hindrance, it
may be possible to identify a solute that both has similar rejection behaviour to that of
NDMA and ubiquitously occurs in reclaimed water at a sufficiently high concentration
for routine analysis. Such a surrogate, if it can be identified, is not expected to
completely replace the need for the actual analysis of NDMA. However, it will be of
immense benefit to the study of NDMA rejection at the pilot- and full-scale level and
can serve as an early warning when low NDMA rejection occurs.
4 Conclusions
Data represented in the literature suggest that steric hindrance appears to be the primary
mechanism governing the rejection of N-nitrosamine by RO membranes. The rejection
of N-nitrosamines by RO membranes can be described by the irreversible
thermodynamic model. Considering all N-nitrosamines, studies available to date have
focused mostly on the rejection of NDMA. Several investigations focusing on other N-
nitrosamines have revealed that their rejection by RO membranes can be significantly

Chapter 2: Literature review
31
higher than that of NDMA (which has the lowest molecular weight amongst all N-
nitrosamines). This review reveals significant variation in NDMA rejection amongst
laboratory-, pilot- and full-scale studies (sometimes even by the same RO membrane).
The rejection of NDMA by a typical brackish water RO membrane obtained from
laboratory-scale studies ranged from 50 to 70%. In contrast, the rejections of NDMA
reported at pilot- and full-scale varied significantly, from negligible to over 70%. The
variation in NDMA rejection observed across studies can be partially explained by the
differences in operating conditions (i.e. recovery, permeate flux, and feed pH) and feed
solution characteristics (i.e. ionic strength and temperature). In particular, evidence
reported in the literatures suggests that seasonal changes in feed water temperature are
likely to play an important role in NDMA rejection. For example, an increase in feed
temperature by 10 ºC could account for as much as 25% reduction in NDMA rejection
by a conventional RO membrane. However, the combined effects of all operating
parameters cannot fully account for the variations in NDMA rejection that were
observed at full-scale RO installations. The impact of membrane fouling and chemical
cleaning on rejection of N-nitrosamines has not yet been systematically investigated. In
addition, further research on the development of a predictive model is also needed to
allow for the full understanding and optimisation of NDMA rejection in full-sale RO
systems.

Chapter 3: Materials and Methods
32
Chapter 3
Materials and Methods
1 Introduction
Experimental work in this study was carried out using laboratory-, pilot-, or full-scale
RO filtration system. In this chapter, the physicochemical properties of the selected
membranes and N-nitrosamines were examined. These data were obtained from
literature review, simulation using computer software and laboratory-scale experiments.
Chemicals and their sample preparations were described in details. Filtration systems
and experimental protocols were also included. In addition, each analytical technique
used in this investigation was fully explained.
2 Selected NF/RO membranes
Eight NF/RO membranes selected here are thin film composite membranes with a thin
polyamide active skin layer on a porous polysulfone supporting layer. The NF90 and
ESPA1 membranes are typically used for brackish water treatment. The ESPA2, LFC3,
TFC-HR and 70LW are low pressure reverse osmosis (LPRO) membranes which have
been widely employed for water reclamation applications [8, 86, 122, 123]. The ESPAB
is another LPRO membrane which is particularly designed to achieve a high rejection of
boron during second pass seawater desalination. A sea water reverse osmosis (SWRO)
membrane (namely SWC5) was also used in this study. The nominal salt rejection
values of these membranes are summarised in Table 3.1. It is noteworthy that for
comparison purposes, the pure water permeability values of the different membranes
were measured under the same filtration condition (Table 3.1). Given the variety of
membranes used in this study, our filtration condition is not necessarily identical to the
filtration protocol used by each manufacturer to specify the performance of their
membranes. Moreover, membrane properties such as permeability are not always
uniform in a membrane sheet. As a result, the pure water permeability values reported in
Table 3.1 may differ from what specified by the manufacturer by up to 20%.

Chapter 3: Materials and Methods
33
Table 3.1: Properties of the membranes used in this study (salt rejection values were specified by the manufacturers). Membrane Membran
e type Manufacturer NaCl
rejection [%]
MgSO4 rejection [%]
Pure water permeability f [L/m2hbar at 20°C]
Contact angle g [°]
NF90 NF Dow/Filmtec - > 97e 12.6 (±0.2) 69 ESPA1 LPRO Hydranautics 99.3a - 8.1 (±0.3) 61 ESPA2 LPRO Hydranautics 99.6a - 5.2 (±0.2) 53 LFC3 LPRO Hydranautics 99.7a - 2.9 (±0.3) 35 TFC-HR LPRO KMS 99.6b - 2.8 (±0.3) 52 70LW(TML) LPRO Toray 99.7c - 2.5 (±0.2) 41 ESPAB LPRO Hydranautics 99.3a - 4.3 (±0.5) 47 SWC5 SWRO Hydranautics 99.8d - 1.9 (±0.1) 61 a Filtration condition: 1,500 ppm NaCl, 1.05 MPa, 25 °C and pH 6.5 - 7.0. b Filtration condition: 2,000 ppm NaCl, 1.55 MPa, 25 °C and pH 7.5. c Filtration condition: 2,000 ppm NaCl, 1.55 MPa, 25 °C and pH 7.0. d Filtration condition: 32,000 ppm NaCl, 5.5 MPa, 25 °C and pH 6.5 - 7.0. e Filtration condition: 2,000 ppm MgSO4, 0.48 MPa, 25 °C and pH 8. f Determined with Milli-Q water at 1,000 kPa and 20 °C feed temperature. Errors represent the standard deviation of two replicates. g Measured with a Rame-Hart Goniometer (Model 250, Rame-Hart, Netcong, NJ, USA) using the standard sessile drop method.
3 Chemicals
The eight N-nitrosamines used in this study were of analytical grade and were
purchased from Sigma-Aldrich (St Louis, MO, USA). These N-nitrosamines include N-
nitrosodimethylamine (NDMA), N-nitrosomethylethylamine (NMEA), N-
nitrosopyrrolidine (NPYR), N-nitrosodiethylamine (NDEA), N-nitrosodipropylamine
(NDPA), N-nitrosodi-n-butylamine (NDBA), N-nitrosopiperidine (NPIP), and N-
nitrosomorpholine (NMOR). Their physicochemical properties have been described in
Table 3.2. N-nitrosamine stock solution was prepared in pure methanol with 250 µg/L
of each N-nitrosamine. A deuterated surrogate standard was used for each N-
nitrosamine under investigation. These surrogate standards include N-
nitrosodimethylamine-D6, N-nitrosomethylethylamine-D3, N-nitrosopyrrolidine-D8, N-
nitrosodiethylamine-D10, N-nitrosopiperidine-D10, N-nitrosomorpholine-D8, N-
nitrosodipropylamine-D14 and N-nitrosodi-n-butylamine-D9, and were purchased from

Chapter 3: Materials and Methods
34
CDN isotopes (Pointe-Claire, Quebec, Canada). A surrogate stock solution containing
100 µg/L of each deuterated N-nitrosamine was prepared in pure methanol. The stock
solutions were stored at -18 ºC and used within one month of preparation. The stock
solutions were kept at -18 °C in the dark. All stock solutions were used within 1 month
of preparation.
Analytical grade boric acid was obtained from by Sigma-Aldrich (St Louis, MO, USA).
A stock solution of boric acid of 1 g-boron/L was prepared in Milli-Q. Analytical grade
NaCl, CaCl2 and NaHCO3 were purchased from Ajax Finechem (Taren Point, NSW,
Australia) and used as the background electrolytes for the filtration experiments. Stock
solutions of these background electrolytes were also prepared in Milli-Q water at 2M
(NaCl) and 0.1M (CaCl2 and NaHCO3) concentrations.

Chapter 3: Materials and Methods
35
Table 3.2: Physicochemical properties of the selected N-nitrosamines. Compound NDMA NMEA NPYR NDEA NPIP NMOR NDPA NDBA Structure
Molecular Formula
C2H6N2O C3H8N2O C4H8N2O C4H10N2O C5H10N2O C4H8N2O2 C6H14N2O C8H18N2O
Molecular Weight [g/mol]
74.05 88.06 100.06 102.08 114.08 116.06 130.11 158.14
Molecular Width a [nm]
0.270 0.306 0.318 0.322 0.325 0.317 0.365 0.405
Diffusion coefficient in water b [cm2/s]
9.7×10⁻⁶ 8.0×10⁻⁶ 8.0×10⁻⁶ 8.0×10⁻⁶ 8.6×10⁻⁶ 9.2×10⁻⁶ 8.2×10⁻⁶ 8.0×10⁻⁶
LogKow b
-0.64 -0.15 0.23 0.34 0.74 -1.39 1.35 2.31
Solubility in water at 20 ºC b [g/L]
1,000 300 780 147 49 4,714 9.9 1.2
Dipole moment c
[Debye] 3.71 3.71 3.74 3.72 3.73 2.68 3.77 3.82
a Calculated using Molecular Modeling Pro (ChemSW Inc., Fairfield, CA, USA). b GSI chemical properties database (GSI ENVIRONMENTAL INC), http://www.gsi-net.com/en/publications/gsi-chemical-database.html. c Millsian 2.1 software (Millsian INC).
NN
ON
NO
NN
ON
NO
NN
O
NN
O
O
NN
ON
NO
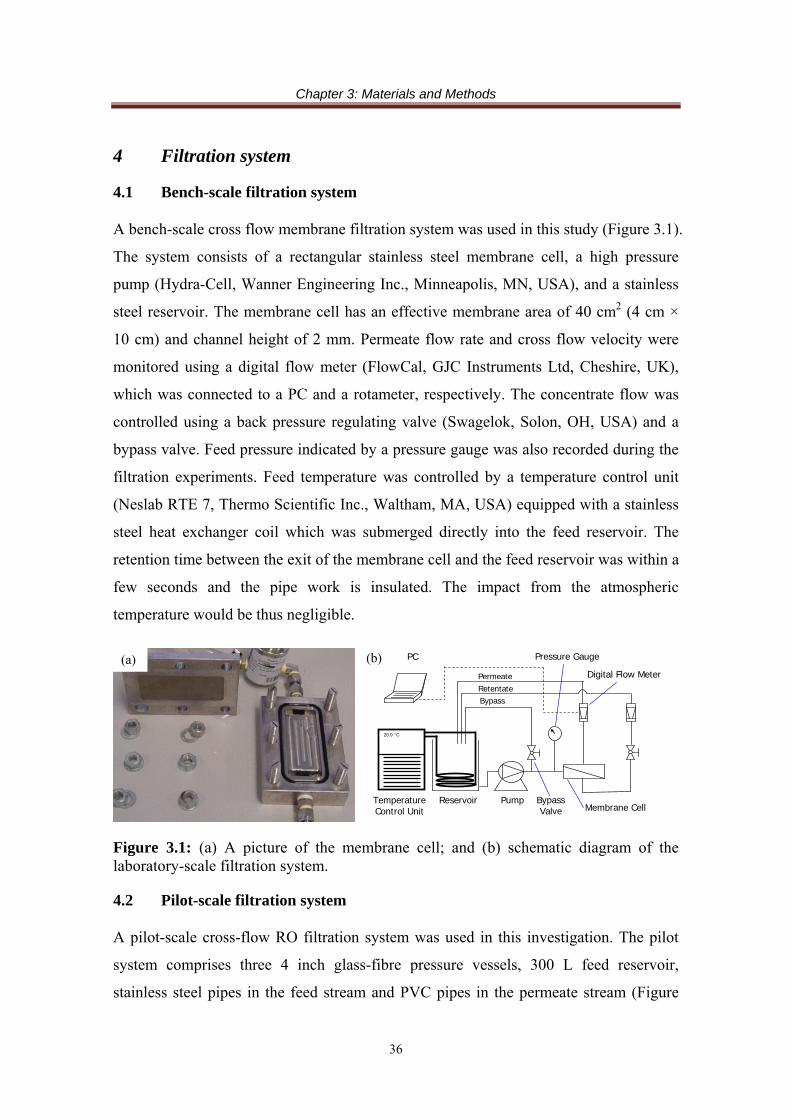
Chapter 3: Materials and Methods
36
4 Filtration system
4.1 Bench-scale filtration system
A bench-scale cross flow membrane filtration system was used in this study (Figure 3.1).
The system consists of a rectangular stainless steel membrane cell, a high pressure
pump (Hydra-Cell, Wanner Engineering Inc., Minneapolis, MN, USA), and a stainless
steel reservoir. The membrane cell has an effective membrane area of 40 cm2 (4 cm ×
10 cm) and channel height of 2 mm. Permeate flow rate and cross flow velocity were
monitored using a digital flow meter (FlowCal, GJC Instruments Ltd, Cheshire, UK),
which was connected to a PC and a rotameter, respectively. The concentrate flow was
controlled using a back pressure regulating valve (Swagelok, Solon, OH, USA) and a
bypass valve. Feed pressure indicated by a pressure gauge was also recorded during the
filtration experiments. Feed temperature was controlled by a temperature control unit
(Neslab RTE 7, Thermo Scientific Inc., Waltham, MA, USA) equipped with a stainless
steel heat exchanger coil which was submerged directly into the feed reservoir. The
retention time between the exit of the membrane cell and the feed reservoir was within a
few seconds and the pipe work is insulated. The impact from the atmospheric
temperature would be thus negligible.
Temperature Control Unit
Reservoir Pump Bypass Valve
Bypass RetentatePermeate
PC Pressure Gauge
Membrane Cell
Digital Flow Meter
20.0 °C
Figure 3.1: (a) A picture of the membrane cell; and (b) schematic diagram of the laboratory-scale filtration system.
4.2 Pilot-scale filtration system
A pilot-scale cross-flow RO filtration system was used in this investigation. The pilot
system comprises three 4 inch glass-fibre pressure vessels, 300 L feed reservoir,
stainless steel pipes in the feed stream and PVC pipes in the permeate stream (Figure
(a) (b)
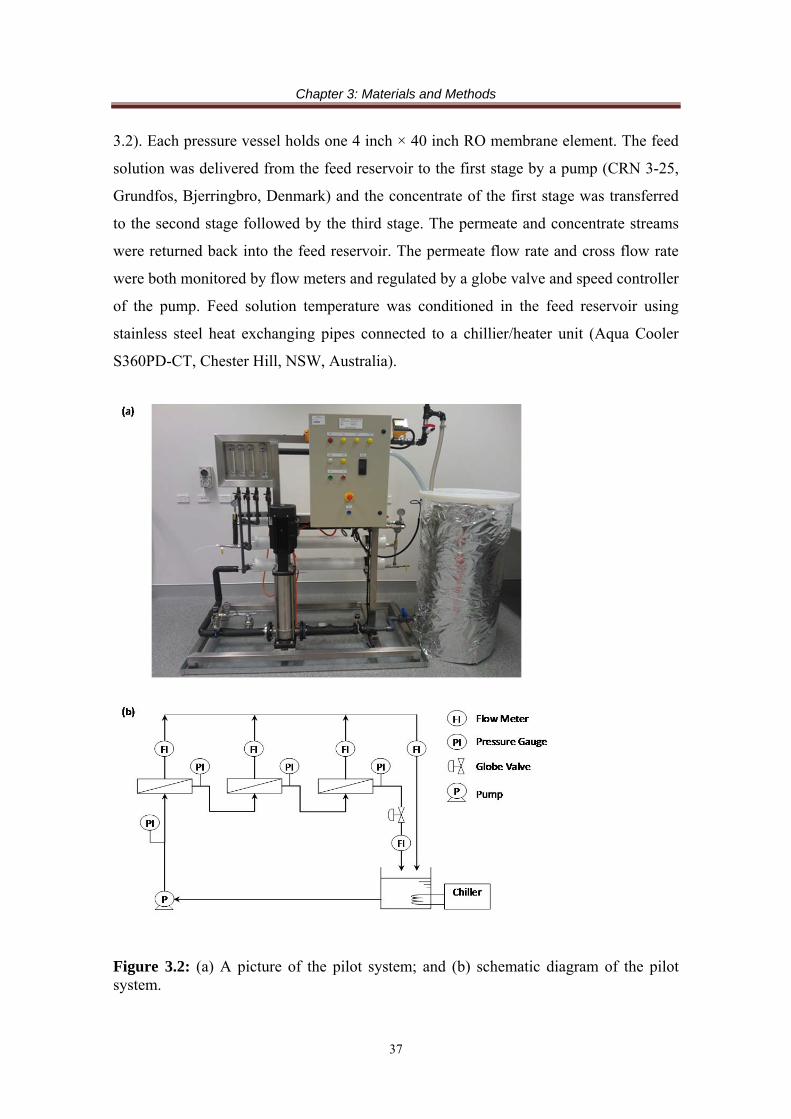
Chapter 3: Materials and Methods
37
3.2). Each pressure vessel holds one 4 inch × 40 inch RO membrane element. The feed
solution was delivered from the feed reservoir to the first stage by a pump (CRN 3-25,
Grundfos, Bjerringbro, Denmark) and the concentrate of the first stage was transferred
to the second stage followed by the third stage. The permeate and concentrate streams
were returned back into the feed reservoir. The permeate flow rate and cross flow rate
were both monitored by flow meters and regulated by a globe valve and speed controller
of the pump. Feed solution temperature was conditioned in the feed reservoir using
stainless steel heat exchanging pipes connected to a chillier/heater unit (Aqua Cooler
S360PD-CT, Chester Hill, NSW, Australia).
Figure 3.2: (a) A picture of the pilot system; and (b) schematic diagram of the pilot system.
Chapter 3: Materials and Methods
38
5 Water chemistry analytical techniques
5.1 N-nitrosamine concentration analysis
The analysis of each N-nitrosamine concentration in this study is based on the gas
chromatography coupled with tandem mass spectrometry (GC-MS/MS) technique using
electron ionisation in a combination with the solid phase extraction (SPE) method
previously described by McDonald et al [73]. Prior to the SPE procedure, 100 μL
surrogate stock solution was spiked into the sample to obtain 50 ng/L of each N-
nitrosamine surrogate. SupelcleanTM Coconut Charcoal SPE cartridges (2 g), supplied
by Supelco (St Louis, MO, USA), were used for the SPE process. Thereafter, the SPE
cartridges were cleaned with 6 mL dichloromethane, 6 mL methanol and 12 mL of
Milli-Q water. Accurate quantitation (accounting for incomplete SPE recovery) was
undertaken by direct-analogue isotope dilution for all nitrosamines by adding 100 μL
surrogate stock solution into 200 mL of each sample to make up 50 ng/L of each N-
nitrosamine surrogate. N-nitrosamines in the samples were then extracted by SPE at a
flow rate of 5 mL/min. The cartridges were rinsed with 3 mL Milli-Q water and dried
with high purity nitrogen gas for at least 60 minutes. The dried SPE cartridges were
then eluted using 12 mL dichloromethane, and 100 µL of toluene was added in the
eluent. The eluent was then concentrated to 1 mL with a Turbovap LV (Caliper Life
Sciences, Hopkinton, MA, USA) under a gentle nitrogen stream. The concentrations of
N-nitrosamines were quantified using an Agilent 7890A gas chromatograph (GC)
coupled with an Agilent 7000B triple quadrupole mass spectrometer (MS/MS) (Figure
3.3). Calibration curves were established for each N-nitrosamine in the range of 1-400
ng/L. The detection limits of N-nitrosamines established for this analytical method are 5
ng/L for NDMA, NDEA, NPIP, and NMOR, and 10 ng/L for NMEA, NPYR, NDPA,
and NDBA.

Chapter 3: Materials and Methods
39
Figure 3.3: A picture of GC-MS/MS.
5.2 Basic analytical techniques
Turbidity was analysed using a 2100N laboratory turbidity meter (Hach, USA).
Conductivity and pH were measured using an Orion 4-Star Plus pH/conductivity meter
(Thermo scientific, USA). Total organic carbon (TOC) concentration was determined
using a TOC-VSH analyser (Shimadzu, Japan) based on the non-purgeable organic
carbon (NPOC) method. Cations and anions were analysed using an Inductive Coupled
Plasma – Mass Spectrometer (7500CS, Agilent Technologies, Wilmington, DE, USA)
and an ion chromatography (IC) system (Shimadzu, Tokyo, Japan), respectively.
6 Membrane characterisation
6.1 Contact angle measurement
Contact angle of membrane surface was measured using the standard sessile drop
method. This was performed with a Rame-Hart Goniometer (Model 250, Rame-Hart,
Netcong, NJ) (Figure 3.4). Prior to the measurement, virgin and fouled membrane
samples were dried for over 24 h in the dark. The dry membrane was fixed on the stage
of the instrument and contact angle of the membrane was measured with a water droplet
(Milli-Q water). The contact angle of each membrane was determined from ten droplets.

Chapter 3: Materials and Methods
40
Figure 3.4: A picture of Rame-Hart Goniometer.
6.2 Zeta potential measurement
The streaming potential of the membrane surface was measured using a SurPASS
electrokinetic analyser (Anton Paar GmbH, Graz, Austria) (Figure 3.5). The
measurement of the streaming potential was performed in 1 mM KCl background
electrolyte solution. The background solution was first adjusted to pH 9.5 using a KOH
(0.1 M) solution. Subsequently, the background pH was reduced to pH 3 by a stepwise
automatic titration using HCl (0.1 M) solution. The zeta potential of the membrane
surface was calculated with the measured streaming potential using the Fairbrother-
Mastin method [124]. During the analysis, the background solution temperature was
maintained at 25 ± 1 °C.
Figure 3.5: A picture of SurPASS electrokinetic analyser.
Chapter 3: Materials and Methods
41
6.3 Surface chemistry
Functional groups of RO membranes were analysed obtaining Fourier transform
infrared spectroscopy (FTIR) spectra using an IRAffinity-1 (Shimazu, Kyoto, Japan)
equipped with a diamond crystal plate. The active skin layer of each dried membrane
sample was fixed on the diamond crystal plate with the same press force. The spectrum
was obtained in the range of 400-4000 cm-1 at 2 cm-1 resolution.

Chapter 4: Effects of feed solution characteristics
42
Chapter 4
Effects of feed solution characteristics
This chapter has been published as:
T. Fujioka, L.D. Nghiem, S.J. Khan, J.A. McDonald, Y. Poussade, J.E. Drewes, Effects of feed solution characteristics on the rejection of N-nitrosamines by reverse osmosis membranes, J. Membr. Sci., 409–410 (2012) 66-74.
1 Introduction
Variations in the feed solution characteristics are expected at full-scale RO plants. For
example, wastewater temperature is a seasonally variable parameter and is typically in
the range of 15 to 30°C [125]. However, to date, studies focusing on the impact of feed
temperature on the rejection of N-nitrosamines by RO membranes have not been
reported. Although feed solution pH is usually adjusted to pH 6 – 8 prior to RO
treatment [101], the impact of such feed pH setting variation on the rejection of N-
nitrosamines is not well understood. Total dissolved solid or ionic strength of the feed
has also been found as an important feed solution characteristic which may affect solute
separation during RO filtration [108, 109, 126]. While ionic strength as well as N-
nitrosamine concentration in the feed can increase considerably on the brine side of an
RO pressure vessel and between different stages, there is no data available to
systematically elucidate these effects on the rejection of N-nitrosamines by RO
membranes.
This study investigated the rejection of eight N-nitrosamines by NF/RO membranes.
The effects of feed solution characteristics on the rejection of these trace organic
chemicals were elucidated by examining the rejection of N-nitrosamines under various
operational conditions (i.e. permeate flux, feed concentration, pH, temperature, and
ionic strength). The overall objective of this study was to provide insight into the
separation behaviour of a complete set of N-nitrosamines by RO membranes. The study
Chapter 4: Effects of feed solution characteristics
43
also aimed to reconcile the highly variable rejection values of NDMA by RO
membranes previously reported in the literature.
2 Materials and methods
2.1 NF/RO membranes
One NF (NF90) and two RO (SWC5 and TFC-HR) membranes were used in this study.
Properties of these membranes are summarized in Table 3.1 (Chapter 3).
2.2 Chemicals
Properties of eight N-nitrosamines are summarized in Table 3.2 (Chapter 3).
2.3 Bench-scale filtration system
A bench-scale cross flow membrane filtration system was used (Figure 3.1).
Specification of the bench-scale filtration system is described in Chapter 3, Section 4.1.
2.4 Experimental protocols
Prior to each experiment, the membrane sample was rinsed with Milli-Q water to
remove any preservative coating layer. The membrane was then compacted using Milli-
Q water at 1,800 kPa for at least one hour until stable permeate flux had been achieved.
Unless otherwise stated, the cross flow velocity and solution temperature were kept
constant at 0.42 m/s and 20±0.1°C, respectively. Once the membrane had been
compacted, the pressure was reduced to 1,000 kPa for the measurement of the pure
water permeability. The Milli-Q water used for compaction and pure water permeability
measurement was then replaced with 10 L of a solution containing 20 mM NaCl, 1 mM
CaCl2 and 1 mM NaHCO3 as background electrolytes. Background electrolytes of
20mM NaCl and 1mM CaCl2 were selected to simulate the typical composition of
monovalent and divalent ions in secondary treated effluent, and 1mM NaHCO3 was
selected and to maintain a constant pH. Similar synthetic feed solutions have been
widely adopted in previous studies [38, 127, 128]. Unless otherwise stated, the permeate
flux was adjusted to 20 L/m2h, which is a typical value used in most RO plants for
water reclamation applications [18, 85]. Stock solutions containing 250 µg/L of each N-
nitrosamine were then spiked into the feed reservoir to obtain the desirable

Chapter 4: Effects of feed solution characteristics
44
concentration of each target compound. Throughout the experiment, both permeate and
retentate were circulated back to the feed reservoir. The system was continuously
operated for 12 hours before any samples were taken for analysis to ensure that the
stabilisation of N-nitrosamine rejection has been achieved. Experiments with variable
permeate flux were conducted by first adjusting the permeate flux to 60 L/m2h, and then
it was stepwise decreased to 5 L/m2h. To study the effect of feed concentration on the
rejection of N-nitrosamines, stock solutions of N-nitrosamines were incrementally
added to the feed reservoir to increase the concentration from 250 to 1,500 ng/L.
Experiments with variable pH were conducted by first adjusting the feed solution pH to
9 using NaOH (1 M). The pH was then incrementally reduced to approximately 3.5 by
the addition of HCl (1 M). For experiments with variable temperature, the feed
temperature was incrementally increased from 10 to 40 ºC. Once the temperature set
point had been achieved, the permeate flux was adjusted to 20 L/m2h by gently
regulating the feed pressure. Experiments with variable ionic strength were conducted in
the range from 26 to 260 mM by a stepwise addition of the electrolytes (NaCl, CaCl2
and NaHCO3 with the molar ratio of 20:1:1 respectively) to the feed reservoir. In all
experiments described above, once the target parameter has been adjusted, the filtration
system was stabilised for one hour prior to the collection of feed and permeate samples
for analysis. At each sampling event, 200 mL of feed and permeate samples were
collected simultaneously and solid phase extraction (SPE) was conducted immediately.
2.5 Analytical methods
N-nitrosamine concentrations were analysed using an analytical method described in
Chapter 3, Section 5.1. Solution pH and electrical conductivity of the feed and permeate
samples were measured using an Orion 4-Star Plus pH/conductivity meter (Thermo
Fisher Scientific, Waltham, MA, USA).
2.6 Transport model description
According to the irreversible thermodynamics model previously developed by Kedem
and Katchalsky [129], the transport of solvent (Jv) and solute (Js) through an NF/RO
membrane can be expressed as the following equations:

Chapter 4: Effects of feed solution characteristics
45
J L ∆P‐σ∆π PLJ pv
(1)
J P C ‐C 1‐σ CJ vss CJdx
dCxPJ
1
(2)
where Lp = pure water permeability, ∆P = pressure difference between the feed and
permeate sides, σ = reflection coefficient, ∆π = osmotic pressure difference between the
feed and permeate sides, Ps = solute permeability coefficient, ∆x = membrane thickness
and C = concentration. The reflection coefficient (σ) represents the fraction of solute
reflected by the membrane in convective flow and ranges from 0 (no rejection of
solutes) to 1 (no passage of solutes), while the solute permeability coefficient (Ps)
represents the effective diffusivity of a solute inside a pore [130]. Reflection coefficient
(σ), solute permeability coefficient (Ps) and pure water permeability (Lp) are transport
coefficients representing membrane characteristics. Equation (2) can be expressed as the
following equation (3), using reverse osmosis conditions (Js = CpJv, Cp = permeate
concentration):
01
vps JCC
dx
dCxP (3)
Equation (3) is integrated with boundary limits as follows:
x = 0, C = Cp and x = ∆x, C = Cm (4)
m
p
C
C
x
s
v
p xP
dxJ
CC
dC0
)1( 0 (5)
where Cm is membrane concentration. Integration of equation (5) gives the following
equation:
011
log
vsp
mp JPC
CC
(6)

Chapter 4: Effects of feed solution characteristics
46
Real rejection can be expressed by the following Spiegler-Kedem equation [131]:
F
F
C
CR
m
preal
1
11 (7)
F exp ‐‐J
v
s
JP
F1
exp F exp ‐‐J
(8)
Due to the concentration polarisation phenomenon, the solute accumulates at the
membrane surface and the solute concentration on the membrane surface (Cm) is higher
than that in the feed (Cb). Therefore, the real rejection (Rreal) can be calculated from the
observed rejection (which is defined as Robs=1-Cp/Cb) by taking into account the
concentration polarisation effect [132]:
1exp1
exp
k
JR
k
JR
Rv
obs
vobs
real (9)
where k = mass transfer coefficient. Mass transfer coefficient (k) can be calculated by
Sherwood number (Sh). When the filtration experiment is carried out under laminar
flow conditions (Reynolds number (Re) < 2000) and the length of the entry region (L* =
0.029dhRe) is larger than the length of the membrane (L), the Schmidt number (Sc) can
be expressed by Grover equation [133]:
33.0
33.05.0Re664.0
L
dSc
D
kdSh hh (10)
where Re = (dhu/ν), Sc = (ν/D), dh = hydraulic diameter, u = feed velocity, ν =
kinematic viscosity and D = diffusion coefficient.

Chapter 4: Effects of feed solution characteristics
47
3 Results and discussion
3.1 Separation behaviour of N-nitrosamines
3.1.1 Rejection of N-nitrosamines by NF/RO membranes
Solute separation by NF/RO membranes can be governed by electrostatic interactions
and steric hindrance. The former is not expected to occur for the eight N-nitrosamines
investigated here since they are uncharged at neutral pH. Steric exclusion relates
directly to the molecular size (for which molecular weight can be used as an
approximate surrogate measure) of these compounds. In general, the rejection of N-
nitrosamines by all three NF/RO membranes selected in this study increased in the
increasing order of their molecular weight (Figure 4.1a). Results reported here are
consistent with previous bench-scale studies [38, 82]. However, it is striking to note a
peculiarity regarding the rejection of NMOR. Despite the similarity in molecular weight
between NMOR (116 g/mol) and NPIP (114 g/mol), NMOR rejection by the TFC-HR
and NF90 membrane was 2% and 16% lower than that of NPIP, respectively. NMOR
was not used in either of the previous studies [38, 82] and this appears to be the first
time the rejection of NMOR has been reported and compared to that of other N-
nitrosamines.
An overall trend of increasing rejection in the increasing order of molecular width can
also be observed (Figure 4.1b). The molecular width is defined as half of the square root
of the rectangle minimum area that encloses the projection of N-nitrosamine on a
perpendicular plane [134]. In this study, the molecular width was calculated using the
Molecular Modeling Pro software package (ChemSW Inc., Fairfield, CA, USA). The
molecular width has been suggested to correlate better with the rejection of neutral
solutes than molecular weight [134, 135]. There is a good correlation between
molecular width and the rejection of N-nitrosamines with NMOR being the only
exception (Figure 4.1b). Although the molecular width of NMOR is similar to that of
NPYR and NDEA (NMOR: 0.317 nm, NPYR: 0.318 nm and NDEA: 0.322 nm),
rejections of these three compounds by the NF90 varied over a wide range, from 33 to
52%. Similarly, their rejections by the TFC-HR were in the range of 90 to 95%.
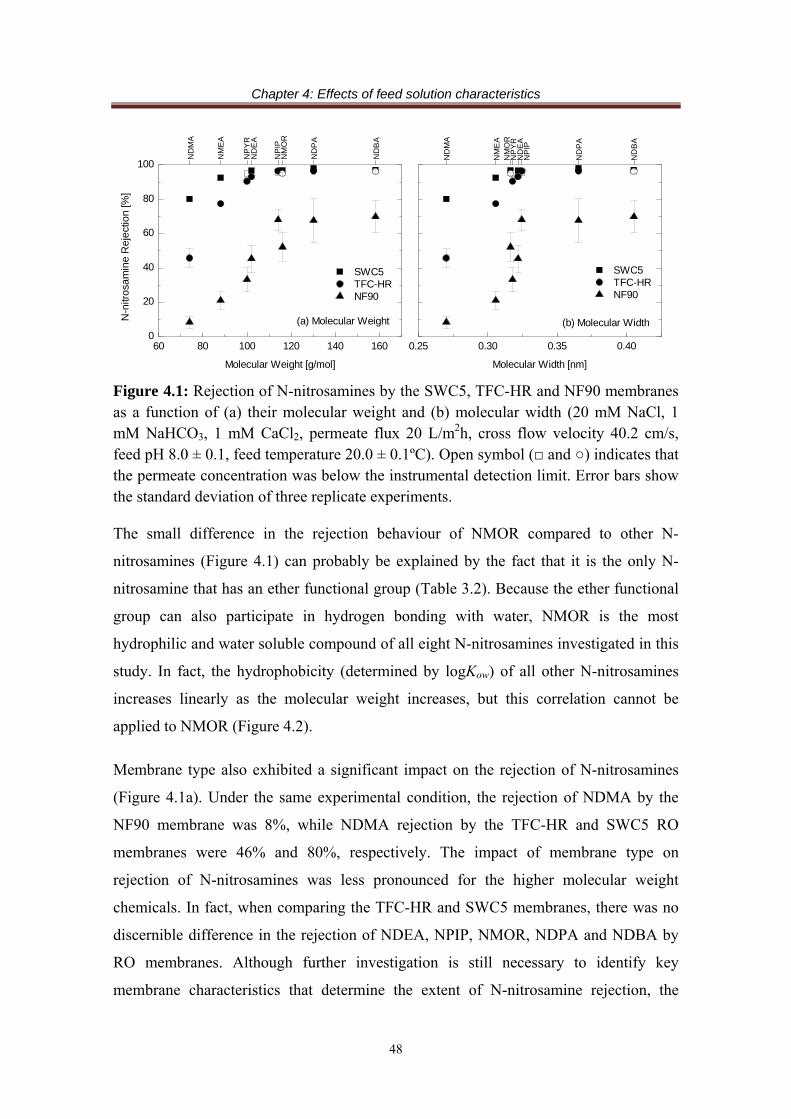
Chapter 4: Effects of feed solution characteristics
48
Figure 4.1: Rejection of N-nitrosamines by the SWC5, TFC-HR and NF90 membranes as a function of (a) their molecular weight and (b) molecular width (20 mM NaCl, 1 mM NaHCO3, 1 mM CaCl2, permeate flux 20 L/m2h, cross flow velocity 40.2 cm/s, feed pH 8.0 ± 0.1, feed temperature 20.0 ± 0.1ºC). Open symbol (□ and ○) indicates that the permeate concentration was below the instrumental detection limit. Error bars show the standard deviation of three replicate experiments.
The small difference in the rejection behaviour of NMOR compared to other N-
nitrosamines (Figure 4.1) can probably be explained by the fact that it is the only N-
nitrosamine that has an ether functional group (Table 3.2). Because the ether functional
group can also participate in hydrogen bonding with water, NMOR is the most
hydrophilic and water soluble compound of all eight N-nitrosamines investigated in this
study. In fact, the hydrophobicity (determined by logKow) of all other N-nitrosamines
increases linearly as the molecular weight increases, but this correlation cannot be
applied to NMOR (Figure 4.2).
Membrane type also exhibited a significant impact on the rejection of N-nitrosamines
(Figure 4.1a). Under the same experimental condition, the rejection of NDMA by the
NF90 membrane was 8%, while NDMA rejection by the TFC-HR and SWC5 RO
membranes were 46% and 80%, respectively. The impact of membrane type on
rejection of N-nitrosamines was less pronounced for the higher molecular weight
chemicals. In fact, when comparing the TFC-HR and SWC5 membranes, there was no
discernible difference in the rejection of NDEA, NPIP, NMOR, NDPA and NDBA by
RO membranes. Although further investigation is still necessary to identify key
membrane characteristics that determine the extent of N-nitrosamine rejection, the
60 80 100 120 140 1600
20
40
60
80
100
0.25 0.30 0.35 0.40
SWC5 TFC-HR NF90
N-n
itro
sam
ine
Re
ject
ion
[%]
Molecular Weight [g/mol]
(a) Molecular Weight
ND
MA
NM
EA
NM
OR
NP
YR
ND
EA
NP
IP
ND
PA
ND
BA
(b) Molecular Width
SWC5 TFC-HR NF90
Molecular Width [nm]
ND
BA
ND
PA
NP
IPN
DE
AN
PY
RN
MO
RN
ME
A
ND
MA
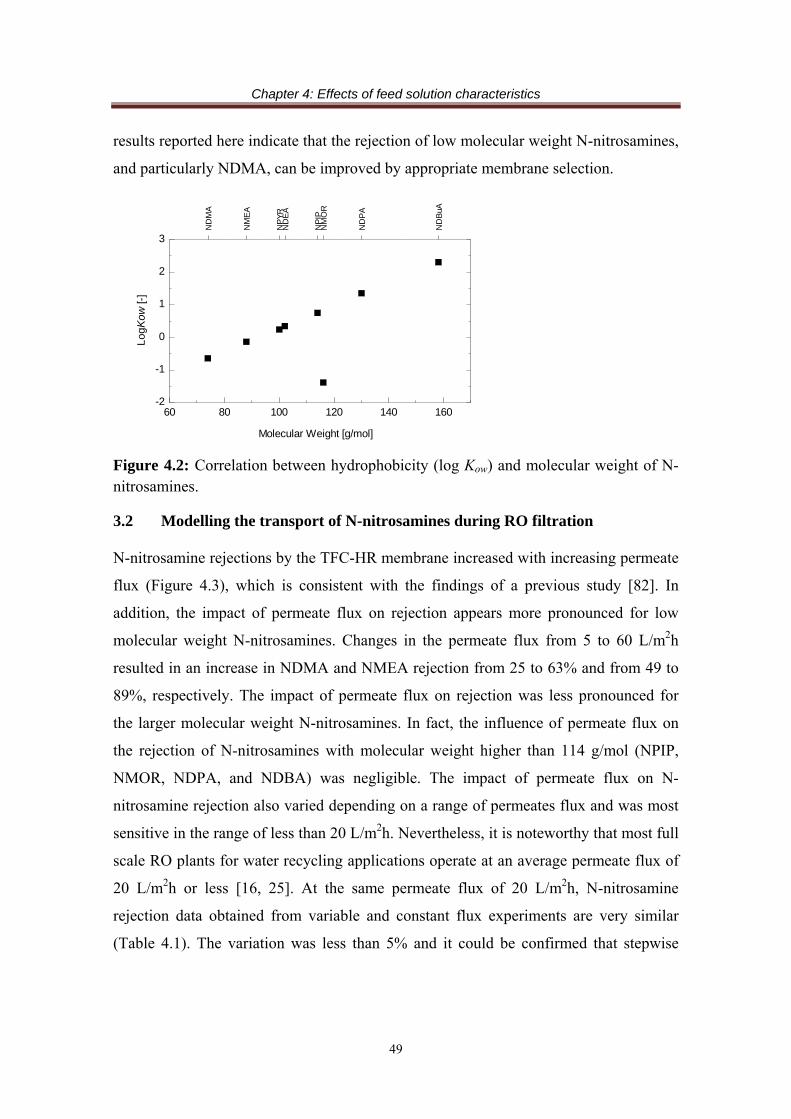
Chapter 4: Effects of feed solution characteristics
49
results reported here indicate that the rejection of low molecular weight N-nitrosamines,
and particularly NDMA, can be improved by appropriate membrane selection.
Figure 4.2: Correlation between hydrophobicity (log Kow) and molecular weight of N-nitrosamines.
3.2 Modelling the transport of N-nitrosamines during RO filtration
N-nitrosamine rejections by the TFC-HR membrane increased with increasing permeate
flux (Figure 4.3), which is consistent with the findings of a previous study [82]. In
addition, the impact of permeate flux on rejection appears more pronounced for low
molecular weight N-nitrosamines. Changes in the permeate flux from 5 to 60 L/m2h
resulted in an increase in NDMA and NMEA rejection from 25 to 63% and from 49 to
89%, respectively. The impact of permeate flux on rejection was less pronounced for
the larger molecular weight N-nitrosamines. In fact, the influence of permeate flux on
the rejection of N-nitrosamines with molecular weight higher than 114 g/mol (NPIP,
NMOR, NDPA, and NDBA) was negligible. The impact of permeate flux on N-
nitrosamine rejection also varied depending on a range of permeates flux and was most
sensitive in the range of less than 20 L/m2h. Nevertheless, it is noteworthy that most full
scale RO plants for water recycling applications operate at an average permeate flux of
20 L/m2h or less [16, 25]. At the same permeate flux of 20 L/m2h, N-nitrosamine
rejection data obtained from variable and constant flux experiments are very similar
(Table 4.1). The variation was less than 5% and it could be confirmed that stepwise
60 80 100 120 140 160-2
-1
0
1
2
3
Molecular Weight [g/mol]
Log
Kow
[-]
ND
MA
NM
EA
NP
YR
ND
EA
NP
IPN
MO
R
ND
PA
ND
BuA
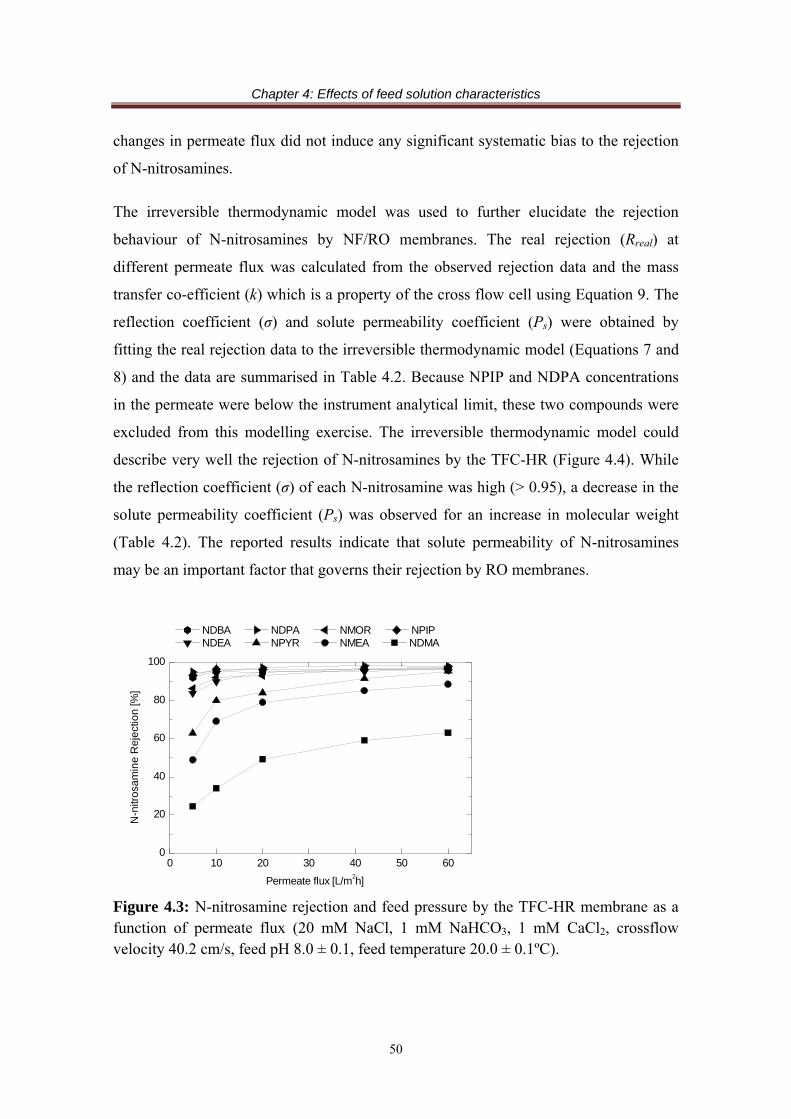
Chapter 4: Effects of feed solution characteristics
50
changes in permeate flux did not induce any significant systematic bias to the rejection
of N-nitrosamines.
The irreversible thermodynamic model was used to further elucidate the rejection
behaviour of N-nitrosamines by NF/RO membranes. The real rejection (Rreal) at
different permeate flux was calculated from the observed rejection data and the mass
transfer co-efficient (k) which is a property of the cross flow cell using Equation 9. The
reflection coefficient (σ) and solute permeability coefficient (Ps) were obtained by
fitting the real rejection data to the irreversible thermodynamic model (Equations 7 and
8) and the data are summarised in Table 4.2. Because NPIP and NDPA concentrations
in the permeate were below the instrument analytical limit, these two compounds were
excluded from this modelling exercise. The irreversible thermodynamic model could
describe very well the rejection of N-nitrosamines by the TFC-HR (Figure 4.4). While
the reflection coefficient (σ) of each N-nitrosamine was high (> 0.95), a decrease in the
solute permeability coefficient (Ps) was observed for an increase in molecular weight
(Table 4.2). The reported results indicate that solute permeability of N-nitrosamines
may be an important factor that governs their rejection by RO membranes.
Figure 4.3: N-nitrosamine rejection and feed pressure by the TFC-HR membrane as a function of permeate flux (20 mM NaCl, 1 mM NaHCO3, 1 mM CaCl2, crossflow velocity 40.2 cm/s, feed pH 8.0 ± 0.1, feed temperature 20.0 ± 0.1ºC).
0 10 20 30 40 50 600
20
40
60
80
100
NDBA NDPA NMOR NPIP NDEA NPYR NMEA NDMA
N-n
itros
am
ine
Rej
ect
ion
[%]
Permeate flux [L/m2h]

Chapter 4: Effects of feed solution characteristics
51
Table 4.1: Impact of step-wise changes in permeate flux on the rejection of N-nitrosamines at 20 L/m2h permeate flux by the TFC-HR membrane (20 mM NaCl, 1 mM NaHCO3, 1 mM CaCl2, cross flow velocity 40.2 cm/s, feed pH 8.0 ± 0.1, feed temperature 20.0 ± 0.1 ºC). Rejection [%] from
variable flux experiment Rejection [%] from constant flux experiment*
NDMA 49.3 47.6 (±5.2) NMEA 79.0 77.4 (±1.3) NPYR 84.0 90.4 (±0.7) NDEA 95.3 93.0 (±1.0) NPIP 96.2 96.6 (±1.0) NMOR 93.0 94.9 (±1.0) NDPA 97.3 96.5 (±0.9) NDBA 94.8 96.3 (±1.4) * Errors show the standard deviation of three replicate experiments.
Table 4.2: Transport parameters of N-nitrosamines through the TFC-HR membrane and the fitting coefficient of determination (R2) of the irreversible thermodynamics model.
N-nitrosamine
k [m/s] σ [-]
(95% confidence bounds)
P [m/s] (95% confidence bounds)
R2 [-]
NDMA 2.26×10⁻⁵ 0.949 (0.800, 1.10) 4.15×10⁻⁶ (2.88×10⁻⁶,
5.41×10⁻⁶) 0.99
NMEA 1.99×10⁻⁵ 0.968 (0.805, 1.13) 1.07×10⁻⁶ (4.97×10⁻⁷,
1.64×10⁻⁶) 0.98
NPYR 1.99×10⁻⁵ 0.989 (0.869, 1.11) 6.74×10⁻⁷ (3.59×10⁻⁷,
9.88×10⁻⁷) 0.98
NDEA 1.99×10⁻⁵ 0.998 (0.968, 1.03) 2.49×10⁻⁷ (1.95×10⁻⁷,
3.02×10⁻⁷) 0.99
NMOR 2.18×10⁻⁵ 0.988 (0.957, 1.02) 1.99×10⁻⁷ (1.37×10⁻⁷,
2.60×10⁻⁷) 0.97
NDBA 1.99×10⁻⁵ 0.983 (0.962, 1.01) 1.01×10⁻⁷ (5.34×10⁻⁸,
1.47×10⁻⁷) 0.92

Chapter 4: Effects of feed solution characteristics
52
Figure 4.4: Real rejection of N-nitrosamines by the TFC-HR membrane as a function of reciprocal permeate flux. Experimental conditions are as described in Figure 4.3.
3.3 Effects of RO feed solution chemistry
3.3.1 N-nitrosamine concentrations
All N-nitrosamines investigated here are hydrophilic (Table 3.2) and thus they are not
expected to adsorb to the membrane. Indeed, in all experiments of this study, N-
nitrosamine concentrations in the feed were stable indicating that the adsorption of N-
nitrosamines to the membrane was negligible and that the filtration process of N-
nitrosamines would reach a steady state condition in a short period. Miyashita et al. [82]
reported that steady state conditions in the rejection of N-nitrosamines by NF/RO
membranes were achieved within less than 45 minutes of N-nitrosamine addition in the
feed. Similarly, Steinle-Darling et al. [38] reported that the rejection of N-nitrosamines
by the LFC3 membrane reached a steady state condition (±5% of the final rejection
value) within 5 minutes of operation.
Changes in the feed concentration of N-nitrosamine (250-1,500 ng/L) did not have any
apparent effect on their rejections (Figure 4.5), which is in agreement with a previous
study by Miyashita et al. [82]. Because concentration of the solute in the feed solution is
not an input parameter to the irreversible thermodynamic model previously described in
section 2.6, solute rejection (which is an output of the model) is expected to be
independent of the feed solute concentration. The results reported here suggest that the
0 2 4 6 8 100
20
40
60
80
100
NDBA NMOR NDEA NPYR NMEA NDMA
Rea
l re
ject
ion
[%]
1/Jv [10
5 s/m]
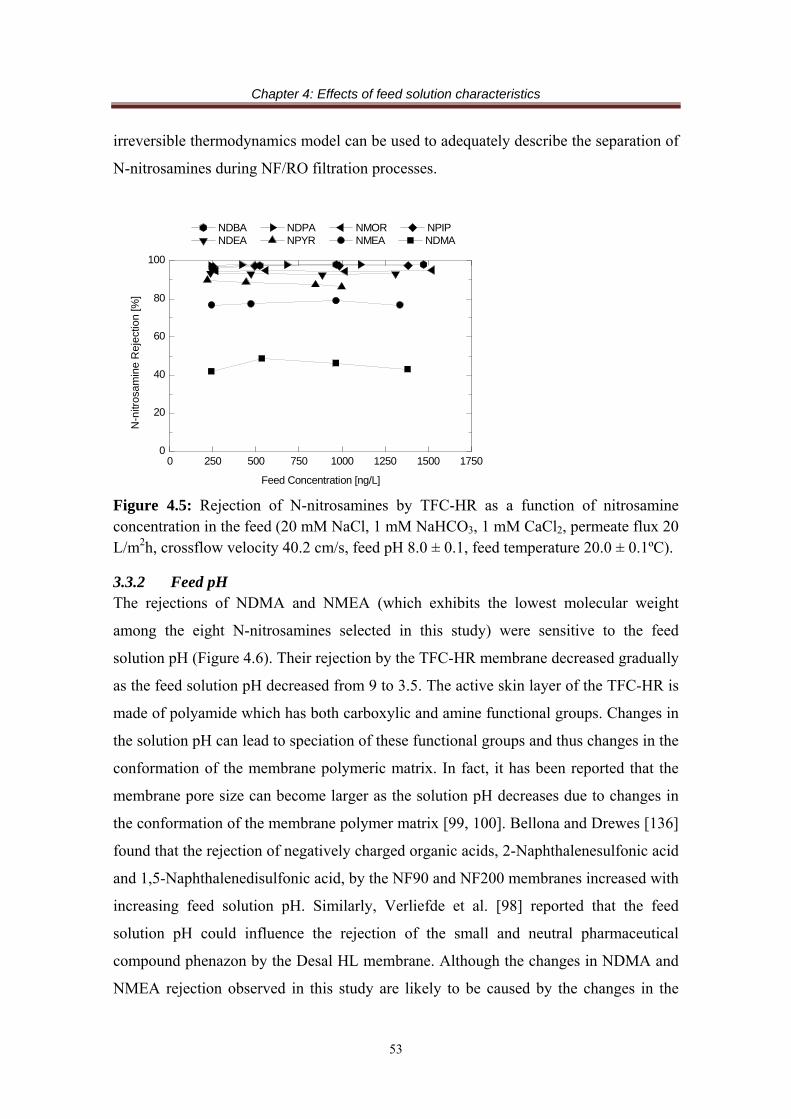
Chapter 4: Effects of feed solution characteristics
53
irreversible thermodynamics model can be used to adequately describe the separation of
N-nitrosamines during NF/RO filtration processes.
Figure 4.5: Rejection of N-nitrosamines by TFC-HR as a function of nitrosamine concentration in the feed (20 mM NaCl, 1 mM NaHCO3, 1 mM CaCl2, permeate flux 20 L/m2h, crossflow velocity 40.2 cm/s, feed pH 8.0 ± 0.1, feed temperature 20.0 ± 0.1ºC).
3.3.2 Feed pH The rejections of NDMA and NMEA (which exhibits the lowest molecular weight
among the eight N-nitrosamines selected in this study) were sensitive to the feed
solution pH (Figure 4.6). Their rejection by the TFC-HR membrane decreased gradually
as the feed solution pH decreased from 9 to 3.5. The active skin layer of the TFC-HR is
made of polyamide which has both carboxylic and amine functional groups. Changes in
the solution pH can lead to speciation of these functional groups and thus changes in the
conformation of the membrane polymeric matrix. In fact, it has been reported that the
membrane pore size can become larger as the solution pH decreases due to changes in
the conformation of the membrane polymer matrix [99, 100]. Bellona and Drewes [136]
found that the rejection of negatively charged organic acids, 2-Naphthalenesulfonic acid
and 1,5-Naphthalenedisulfonic acid, by the NF90 and NF200 membranes increased with
increasing feed solution pH. Similarly, Verliefde et al. [98] reported that the feed
solution pH could influence the rejection of the small and neutral pharmaceutical
compound phenazon by the Desal HL membrane. Although the changes in NDMA and
NMEA rejection observed in this study are likely to be caused by the changes in the
0 250 500 750 1000 1250 1500 17500
20
40
60
80
100
NDBA NDPA NMOR NPIP NDEA NPYR NMEA NDMA
N-n
itros
amin
e R
eje
ctio
n [%
]
Feed Concentration [ng/L]

Chapter 4: Effects of feed solution characteristics
54
membrane pore size, it is noteworthy that no discernible changes in the membrane
permeability as a function of feed solution pH could be observed. It can be inferred
from the results reported here that small variations in feed pH in the range from pH 6 to
8, which can occur in a full-scale RO plant [101], have only a small impact upon the
rejection of NDMA and NMEA. The impact of feed solution pH on other N-
nitrosamines with molecular weight larger than that of NMEA is expected to be
negligible.
Figure 4.6: (a) Feed pressure and (b) N-nitrosamine rejection by the TFC-HR membrane as a function of feed pH (20 mM NaCl, 1 mM NaHCO3, 1 mM CaCl2, permeate flux 20 L/m2h, crossflow velocity 40.2 cm/s, feed temperature 20.0 ± 0.1ºC).
3.3.3 Ionic strength
Higher feed ionic strength necessitated higher feed pressure to maintain permeate flux,
due to the increased osmotic pressure (Figure 4.7). Changes in ionic strength mainly
affected the rejection of NDMA, which is consistent with results reported in a previous
study [38]. As the ionic strength increased by a factor of ten (from 26 to 260 mM),
NDMA rejection by the TFC-HR decreased from 52 to 34%. Although several other N-
nitrosamines also exhibited changes in their rejection as the ionic strength of the feed
0
250
500
750
1000
3 4 5 6 7 8 90
20
40
60
80
100
Fee
d P
ress
ure
[kP
a]
(b) N-nitrosamine Rejection
(a) Feed pressure
NDBA NDPA NMOR NPIP NDEA NPYR NMEA NDMA
Feed pH [-]
N-n
itros
am
ine
Re
ject
ion
[%]
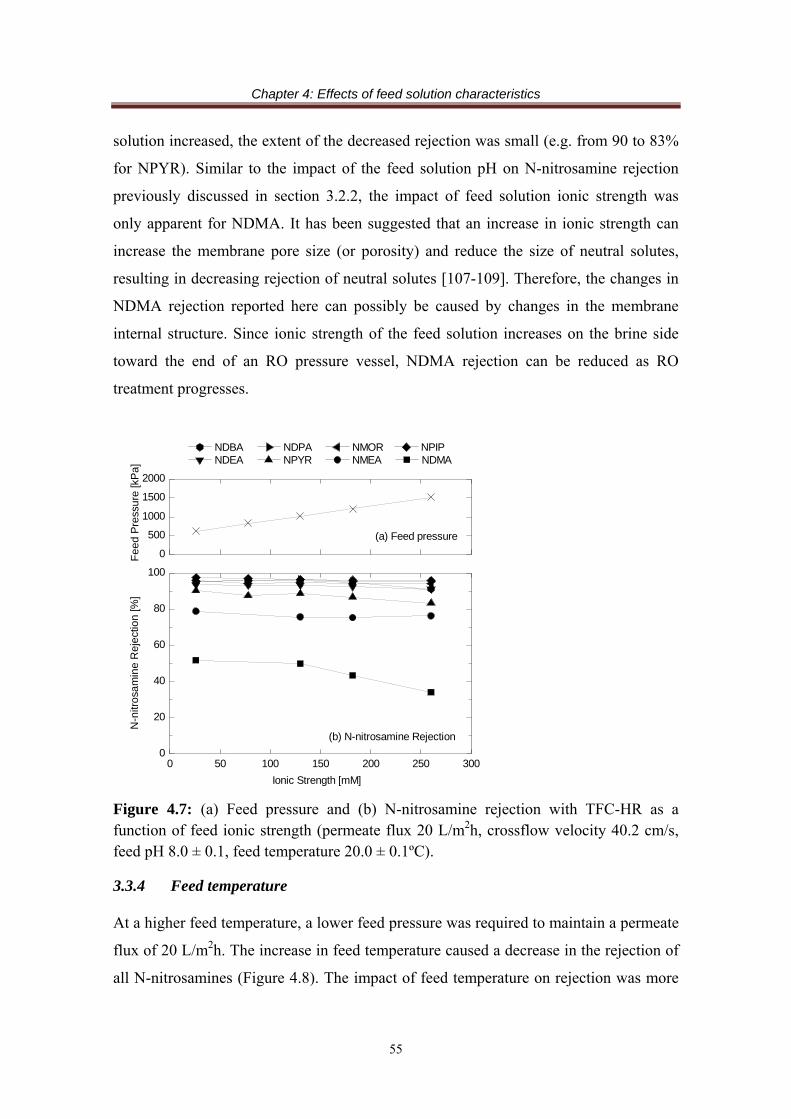
Chapter 4: Effects of feed solution characteristics
55
solution increased, the extent of the decreased rejection was small (e.g. from 90 to 83%
for NPYR). Similar to the impact of the feed solution pH on N-nitrosamine rejection
previously discussed in section 3.2.2, the impact of feed solution ionic strength was
only apparent for NDMA. It has been suggested that an increase in ionic strength can
increase the membrane pore size (or porosity) and reduce the size of neutral solutes,
resulting in decreasing rejection of neutral solutes [107-109]. Therefore, the changes in
NDMA rejection reported here can possibly be caused by changes in the membrane
internal structure. Since ionic strength of the feed solution increases on the brine side
toward the end of an RO pressure vessel, NDMA rejection can be reduced as RO
treatment progresses.
Figure 4.7: (a) Feed pressure and (b) N-nitrosamine rejection with TFC-HR as a function of feed ionic strength (permeate flux 20 L/m2h, crossflow velocity 40.2 cm/s, feed pH 8.0 ± 0.1, feed temperature 20.0 ± 0.1ºC).
3.3.4 Feed temperature
At a higher feed temperature, a lower feed pressure was required to maintain a permeate
flux of 20 L/m2h. The increase in feed temperature caused a decrease in the rejection of
all N-nitrosamines (Figure 4.8). The impact of feed temperature on rejection was more
0
500
1000
1500
2000
0 50 100 150 200 250 3000
20
40
60
80
100
Fe
ed P
ress
ure
[kP
a]
NDBA NDPA NMOR NPIP NDEA NPYR NMEA NDMA
Ionic Strength [mM]
N-n
itro
sam
ine
Rej
ect
ion
[%]
(a) Feed pressure
(b) N-nitrosamine Rejection

Chapter 4: Effects of feed solution characteristics
56
pronounced for smaller N-nitrosamines. For example, an increase in the feed
temperature in the range from 20 to 30ºC caused a significant drop in the rejection of
NDMA, NMEA and NPYR from 49 to 24%, 81 to 62% and 90 to 74%, respectively.
Figure 4.8: (a) Feed pressure and (b) N-nitrosamine rejection by the TFC-HR membrane as a function of feed temperature (20 mM NaCl, 1 mM NaHCO3, 1 mM CaCl2, permeate flux 20 L/m2h, crossflow velocity 40.2 cm/s, feed pH 8.0 ± 0.1).
A decreasing trend in neutral solute rejection in response to an increase in the feed
temperature has been reported in several previous studies. The permeability coefficients
of neutral solutes (raffinose, alcohols, sugars and polyethylene glycols) through
inorganic NF membranes were reported to increase with increasing feed temperature
[130, 132]. For polymeric membranes, it has been reported that an increase in the feed
temperature could lead to changes in the polymer structure of the membrane active layer,
reflected by an increase in the membrane average pore size and a higher passage of
neutral solute [111]. The low rejection of N-nitrosamines at high feed temperature
observed in this study is, therefore, likely to have been caused by both the increased
permeability coefficient of N-nitrosamines and the increased pore size of the organic
RO membrane. This finding is important because temperature variation in the range
0
250
500
750
1000
10 20 30 400
20
40
60
80
100
Fee
d P
ress
ure
[kP
a]
Feed Temperature [°C]
NDBA NDPA NMOR NPIP NDEA NPYR NMEA NDMA
N-n
itros
am
ine
Re
ject
ion
[%]
(a) Feed pressure
(b) N-nitrosamine Rejection
Chapter 4: Effects of feed solution characteristics
57
from 20 to 30°C is likely to occur at many water reclamation plants employing RO
membranes and is usually difficult to control.
4 Conclusions
The rejection of specific N-nitrosamines increased in the order of NF (NF90), low
pressure RO (TFC-HR), and seawater RO (SWC5) membranes. Similarly, the rejection
of N-nitrosamines increased in the order of increasing molecular weight. Results
reported in this study indicate that steric hindrance is a major rejection mechanism and
is mainly associated with the molecular dimensions or molecular weight of N-
nitrosamines. However, a small but nevertheless discernible difference in the rejection
behaviour between NMOR and the other N-nitrosamines was also observed. The
irreversible thermodynamics model was able to describe the separation of N-
nitrosamines by the TFC-HR membrane. In good agreement with this model, changes in
the feed concentration in the range from 250 – 1,500 ng/L did not lead to any
discernible influence on their rejection. An increase in the feed solution pH (i.e. from 6
to 8) led to a small but clearly discernible increase in the rejection of NDMA and
NMEA, which are the two smallest N-nitrosamines. A ten-fold increase in the feed
solution ionic strength (from 26 to 260 mM) led to a discernible decrease in NDMA
rejection (from 52 to 34%), while there was no apparent impact of ionic strength on all
other N-nitrosamines. It is important to note that an increase in the feed temperature
caused a considerable decrease in the rejection of all N-nitrosamines. The impact of
feed solution temperature on the rejection was more severe for the low molecular
weight N-nitrosamines. When the feed temperature increased from 20 to 30°C, the
rejection of NDMA, NMEA and NPYR decreased from 49 to 24%, 81 to 62%, and 90
to 74%, respectively. Results reported here indicate that pH, ionic strength, and
temperature of the feed solution can exert some influence on the rejection of NDMA
and in some cases other N-nitrosamines. The combined effects of these feed solution
characteristics, particularly feed solution temperature, may account for some of the
variation of NDMA rejection by RO membranes previously reported in the literature.
Chapter 5: Effects of membrane fouling
58
Chapter 5
Effects of membrane fouling
This chapter has been published as:
T. Fujioka, S.J. Khan, J.A. McDonald, R.K. Henderson, Y. Poussade, J.E. Drewes, L.D. Nghiem, Effects of membrane fouling on N-nitrosamine rejection by nanofiltration and reverse osmosis membranes, J. Membr. Sci., 427 (2013) 311-319.
1 Introduction
Municipal wastewater usually contains a large amount of organic and inorganic matter,
resulting in the formation of organic and colloidal fouling, bio-fouling and inorganic
scales on RO membranes [101, 116]. It has been established in the literature that
membrane fouling can either increase or decrease the separation efficiency of NF/RO
membranes [114, 116, 117, 137]. However, apart from a laboratory-scale study
conducted by Steinle-Darling et al. [38] who investigated the rejection of several N-
nitrosamines by an RO membrane (ESPA3) artificially fouled with sodium alginate, to
date little attention has been given to the effects of membrane fouling on the rejection of
N-nitrosamines. Steinle-Darling et al. [38] reported that membrane fouling by sodium
alginate on the ESPA3 membrane caused a reduction in NDMA rejection (from 56 to
37%).
The aim of this work was to provide insights into the effects of membrane fouling on
the rejection of N-nitrosamines by NF/RO membranes. The effects of membrane
fouling were investigated by comparing the rejections of N-nitrosamines by clean and
fouled membranes. Tertiary treated effluent and four different model foulants (namely
sodium alginate, bovine serum albumin, humic acid and colloidal silica) were used to
induce membrane fouling. The tertiary treated effluent and model foulants were
characterised in detail to systematically elucidate the effects of membrane fouling on the
rejection of N-nitrosamines by NF/RO membranes.

Chapter 5: Effects of membrane fouling
59
2 Materials and methods
2.1 NF/RO membranes
Three NF/RO membranes – namely the NF90, ESPA2, and ESPAB – were used in this
investigation. Properties of these membranes are summarized in Table 3.1 (Chapter 3).
2.2 Chemicals
Properties of eight N-nitrosamines are summarized in Table 3.2 (Chapter 3). Sodium
alginate (SA), bovine serum albumin (BSA), humic acid (HA) and colloidal silica
(Ludox CL, 30% weight suspension in water) were selected as model foulants to
simulate polysaccharides, proteins, refractory organic matter and colloidal particles,
respectively. The source of SA was alginic acid sodium salt from brown algae. These
model foulants were purchased from Sigma-Aldrich (St Louis, MO, USA). The Ludox
CL is a positively charged silica particle whose surface is coated with a layer of
aluminium [138]. The hydrodynamic diameter of the Ludox CL is from approximately
40 nm at below pH 6 to 233 nm at pH 10 due to aggregation effects in different pH
solutions [138].
2.3 Tertiary treated effluent
Tertiary treated effluent sample was collected from an advanced water recycling plant in
New South Wales, Australia. The treatment train of the plant prior to the sampling point
includes screening, bioreactor and sand filtration, and the sample was collected after
sand filtration.
2.4 Membrane filtration system
A bench-scale cross flow membrane filtration system was used (Figure 3.1).
Specification of the bench-scale filtration system is described in Chapter 3, Section 4.1.
2.5 Experimental protocols
Rejection measurement and membrane fouling development were sequentially carried
out with four steps: (1) compaction; (2) measuring N-nitrosamine rejection without
membrane fouling; (3) fouling development; and (4) remeasuring N-nitrosamine

Chapter 5: Effects of membrane fouling
60
rejection by fouled membrane (Figure 5.1). Because full-scale RO plants are generally
operated with a constant (average) permeate flux which is approximately 20 L/m2h
[122] and feed pressure increases as fouling progresses to maintain the permeate flux,
the constant permeate flux of 20 L/m2h was used to evaluate N-nitrosamine rejection
before and after fouling. Throughout the experiments, cross flow velocity and feed
temperature in the reservoir were always kept constant at 0.42 m/s and 20 ± 0.1 ºC,
respectively. The details of these four steps are as follows.
Step 1: The membrane sample was first compacted using Milli-Q water at 1,800 kPa
until the permeate flux was stabilised.
Step 2: Following the compaction step, the Milli-Q water in the filtration system was
replaced with either the tertiary effluent or synthetic solution containing a particular
model foulant (e.g. SA, HA, BSA or Ludox CL) and background electrolytes (20 mM
NaCl, 1 mM CaCl2 and 1 mM NaHCO3). The concentrations of SA, BSA and HA in the
feed solution were adjusted to make up approximately 10 mg/L as total organic carbon
(TOC). The Ludox CL was suspended in the same background electrolyte solution (20
mM NaCl, 1 mM CaCl2 and 1 mM NaHCO3) to obtain 100 mg/L of colloidal silica.
After the replacement of feed solutions, stock N-nitrosamine solution was spiked into
the feed solution at environmentally relevant concentration (i.e., 250 ng/L). The
permeate flux was also adjusted at 20 L/m2h which is a typical value for most water
reclamation RO plants [122]. The system was operated for 1 h prior to the collection of
the feed and permeate samples for analysis. This sampling point represents the
performance of the membrane under a clean condition.
Step 3: After the first sampling event, membrane fouling was promoted by adjusting the
permeate flux to 60 L/m2h. The system was then continuously operated with a constant
feed pressure. The fouling development step ended after the permeate flux reached 45
L/m2h (i.e., decreased by 25%).
Step 4: The permeate flux was adjusted to 20 L/m2h and the system was stabilised for 1
h prior to the second sampling of the feed and permeate. This sampling point represents
the performance of the membrane under a fouled condition.

Chapter 5: Effects of membrane fouling
61
Figure 5.1: Fouling development procedure and N-nitrosamine rejection measurement.
2.6 Analytical techniques
2.6.1 Size exclusion chromatography analyses
Characterisation of dissolved organic carbon (DOC) composition in the tertiary effluent
and model foulant solution samples was carried out with a size exclusion
chromatography technique using a Liquid Chromatography - Organic Carbon Detection
(LC-OCD) Model 8 system (DOC-LABOR, Karlsruhe, Germany). The LC-OCD
system is equipped with a UV-detector (254 nm) as well as organic carbon and nitrogen
detectors. Chromatographic separation is undertaken using a Toyopearl® TSK HW-50S
column (Tosoh Bioscience, Tokyo, Japan). Prior to the analysis, calibration of humic
substance molecular weights was conducted using IHSS Humic acid and IHSS Fulvic
acid. Calibrations of detectors for total organic carbon and total organic nitrogen were
also conducted using potassium hydrogen phthalate and potassium nitrate, respectively.
For the analysis, a mobile phase (phosphate buffer, pH 6.37, 2.5 g/L KH2PO4 and
1.5g/L Na2HPO4·H2O) was set at a flow rate of 1.1 mL/min. In the LC-OCD system, an
injected sample of 1 mL was pre-filtered with an in-line 0.45 µm PES-filter located in
front of the column and detectors. Software provided by the manufacturer
(ChromCALC, DOC-LABOR, Karlsruhe, Germany) was used for the quantification of
the organic matter compositions. Further details can also be found in previous studies
[139, 140].
Filtration time
Per
mea
te F
lux
Fouling development
Compaction
Rejection measurement
Chapter 5: Effects of membrane fouling
62
2.6.2 N-nitrosamine concentration analysis
N-nitrosamine concentrations were analysed using an analytical method described in
Chapter 3, Section 5.1.
2.6.3 Basic analytical techniques
Basic analytical techniques are described in Chapter 3, Section 5.2.
2.6.4 Contact angle measurement
Details of contact angle analysis are described in Chapter 3, Section 6.1.
2.6.5 Zeta potential measurement
Details of zeta potential analysis are described in Chapter 3, Section 6.2.
3 Results and discussion
3.1 Characteristics of the tertiary effluent and model foulants
Ionic composition and organic content of the tertiary effluent used in this study (Table
5.1) was similar to that of most water reclamation plants. Nevertheless, the conductivity
of this tertiary treated effluent (Table 5.1) was slightly lower than the typical range of
1200-1700 µS/cm, which is often found in the literature [31, 113]. The tertiary effluent
used in this study had not been subjected to chloramination, and all other N-
nitrosamines, with the exception of NMOR, were not detectable in the tertiary effluent
sample. The concentration of NMOR in this tertiary effluent was 1350 ng/L. NMOR
can be found in toiletry and cosmetic products [39] and rubber and tire industry, and
elevated NMOR concentration of NMOR in treated effluent has previously been
reported [7]. The water recycling plant where the tertiary treated effluent was collected
is known to have a very high load of industrial wastewaters in its catchment.

Chapter 5: Effects of membrane fouling
63
Table 5.1: Water quality of the tertiary effluent. Parameter Value Turbidity 0.7 NTU Conductivity 790 µS/cm pH 7.8 TOC 9.3 mg/L Na+ 106 mg/L Mg2+ 14 mg/L K+ 17 mg/L Ca2+ 23 mg/L Fe2+ 13 mg/L Cl- 177 mg/L NO3
- 43 mg/L SO4
2- 46 mg/L
The organic contents of secondary effluents have been generally characterised to
comprise a number of size fractions commonly referred to as biopolymers
(polysaccharides, proteins and colloidal organics) (>>20,000 Da), humic substances
(approximately 1000 Da), building blocks (300-500 Da) and low molecular weight
(LMW) acids (<350 Da) and neutrals (<350 Da) [139-142]. The building blocks block
fraction represents breakdown products, or intermediates during the degradation, of
humic substances such as fulvic acid [140, 143]. The tertiary effluent used in this study
has a diverse molecular weight distribution (Figure 5.2). The DOC concentration of
fractions of biopolymers (10%), humic substances (46%), building blocks (17%) and
LMW neutrals (23%) in the tertiary effluent (Table 5.2) was in good agreement with a
previous study carried out by Henderson et al. [141]. Model foulants used in this
investigation had significant differences in their physicochemical characteristics which
were expected to assist in identifying the impact of fouling on membrane separation
performance. The major fraction of SA and BSA solutions was biopolymers (>20000
g/mol), which is consistent with a previous study [144] showing a molecular weight of
12000-80000 g/mol (SA) and 67000 g/mol (BSA). The molecular weight of HA
analysed here was in the range of approximately 1000 g/mol and this is in good
agreement of the average molecular weight of HA (1000 g/mol) reported in the
literature [140]. All three organic model foulant also contained some fraction of
building blocks (300-500 g/mol) and LMW neutrals (<350 g/mol) (Table 5.2).

Chapter 5: Effects of membrane fouling
64
Figure 5.2: LC-OCD chromatograms of tertiary effluent, SA, BSA and HA solutions. OCD and UVD represent organic carbon detection and UV-detection at 254 nm, respectively.
Table 5.2: Organic matter fractions in each feed solution. Tertiary
effluent BSA Sodium
alginate Humic acid
Hydrophobic [%] 11.1 n.q. 2.0 0.4 Hydrophilic Biopolymer [%] 9.8 79.5 91.1 5.6 Humics [%] (Mean MW [g/mol])
50.8 (467)
n.q. n.q. 68.4 (850)
Building blocks [%] 15.1 8.1 2.2 9.2 LMW neutrals [%] 12.6 22.4 2.6 16.4 LMW acid [%] 0.6 0.2 2.1 n.q. *n.q., not quantifiable
3.2 Membrane fouling behaviour
Significant membrane fouling was observed with all three membranes investigated in
this study when tertiary effluent was used at the elevated initial permeate flux of 60
L/m2h (which is approximately three times the value used in most full scale RO systems
0
5
10
15
20
25
30
35
40
15 25 35 45 55 65 75 85 95
rel.
Sig
nal R
esp
ons
e
Retention Time in Minutes
-- OCD-- UVD-- OND x 0.5
Humic acid
Sodium alginate
BSA
Tertiary effluent
Hum
ics
Bio
poly
mer
s
Bui
ldin
g B
lock
s
LMM
Aci
ds a
nd H
S
LMW Neutrals
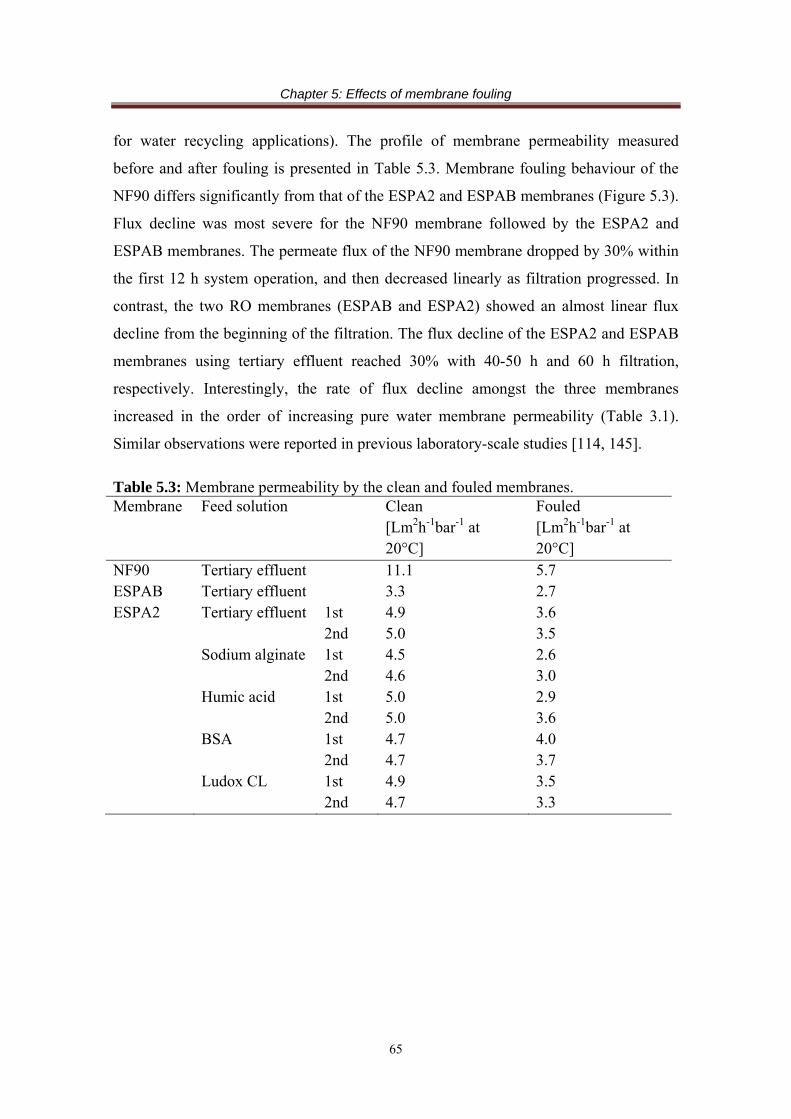
Chapter 5: Effects of membrane fouling
65
for water recycling applications). The profile of membrane permeability measured
before and after fouling is presented in Table 5.3. Membrane fouling behaviour of the
NF90 differs significantly from that of the ESPA2 and ESPAB membranes (Figure 5.3).
Flux decline was most severe for the NF90 membrane followed by the ESPA2 and
ESPAB membranes. The permeate flux of the NF90 membrane dropped by 30% within
the first 12 h system operation, and then decreased linearly as filtration progressed. In
contrast, the two RO membranes (ESPAB and ESPA2) showed an almost linear flux
decline from the beginning of the filtration. The flux decline of the ESPA2 and ESPAB
membranes using tertiary effluent reached 30% with 40-50 h and 60 h filtration,
respectively. Interestingly, the rate of flux decline amongst the three membranes
increased in the order of increasing pure water membrane permeability (Table 3.1).
Similar observations were reported in previous laboratory-scale studies [114, 145].
Table 5.3: Membrane permeability by the clean and fouled membranes. Membrane Feed solution Clean
[Lm2h-1bar-1 at 20°C]
Fouled [Lm2h-1bar-1 at 20°C]
NF90 Tertiary effluent 11.1 5.7 ESPAB Tertiary effluent 3.3 2.7 ESPA2 Tertiary effluent 1st 4.9 3.6 2nd 5.0 3.5 Sodium alginate 1st 4.5 2.6 2nd 4.6 3.0 Humic acid 1st 5.0 2.9 2nd 5.0 3.6 BSA 1st 4.7 4.0 2nd 4.7 3.7 Ludox CL 1st 4.9 3.5 2nd 4.7 3.3

Chapter 5: Effects of membrane fouling
66
Figure 5.3: Normalised permeate flux of the ESPAB, ESPA2 and NF90 membranes as a function of filtration time using the tertiary effluent (crossflow velocity 40.2 cm/s, feed temperature 20.0 ± 0.1 ºC).
When the model foulants were used, significant variation in membrane fouling was
observed. When the ESPA2 membrane was fouled with either SA or HA, permeate flux
dropped rapidly within 10–20 h of system operation (Figure 5.4a-b). These observed
curves of membrane fouling are consistent with a previous study [146]. The rapid flux
decline in the early stage may have resulted from the formation of an alginate and
humic acid fouling layer on the membrane surface, resulting in a substantial resistance
to permeate flow [114, 147]. In fact, it is known that the HA foulant layer can account
for a cake layer as thick as 4 µm [148], while a skin layer thickness of RO membrane is
usually less than 0.3 µm [107]. In contrast, membrane fouling by BSA used here
progressed slowly and linearly until 30 h system operation, and then the slope of the
permeate flux decline became steeper (Figure 5.4c). This trend of the permeate flux
decline is again in good agreement with a previous study [144]. Permeate flux with
Ludox CL dropped significantly within 5 h of system operation, then gradually
decreased as filtration progressed (Figure 5.4d). This observation is consistent with a
previous laboratory-study from which it was suggested that the hydrophobic
interactions and electrostatic attraction forces between charged colloid particles and
membrane surface were key causes for colloidal membrane fouling in the early filtration
stage [138].
0 10 20 30 40 50 60 700.5
0.6
0.7
0.8
0.9
1.0 ESPAB ESPA2 - 1st ESPA2 - 2nd NF90
No
rma
lise
d P
erm
ea
te F
lux
[-]
Filtration period [h]
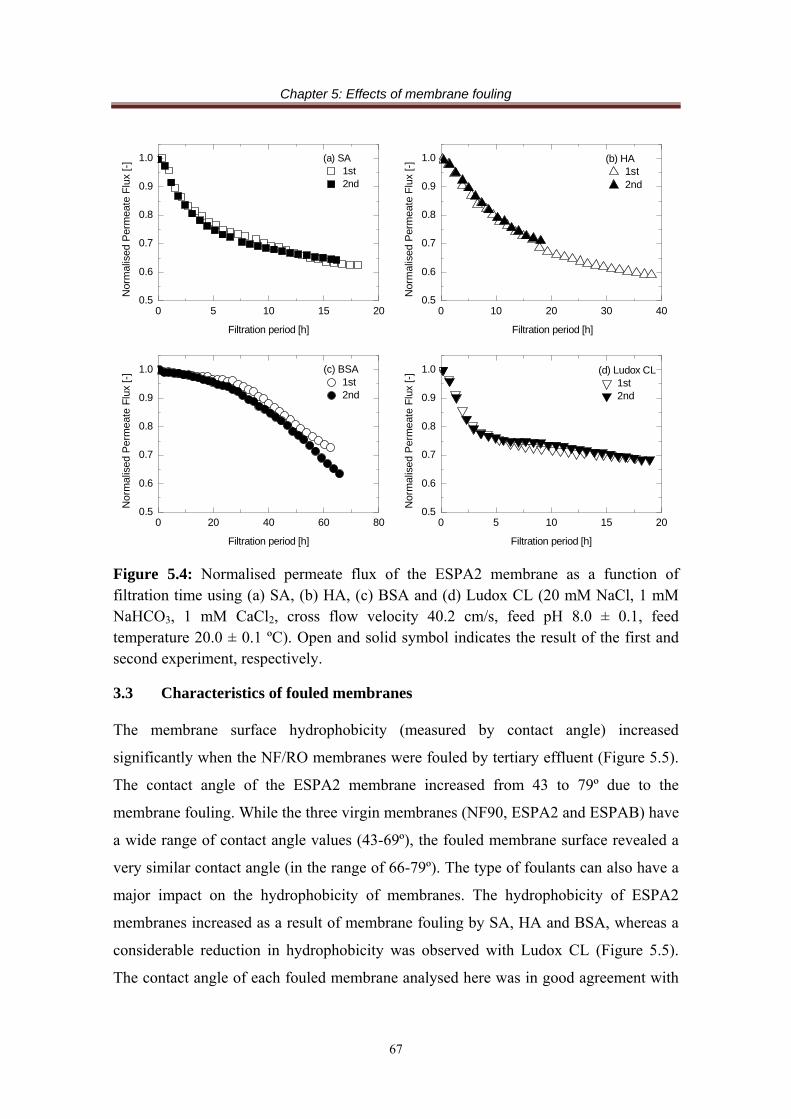
Chapter 5: Effects of membrane fouling
67
Figure 5.4: Normalised permeate flux of the ESPA2 membrane as a function of filtration time using (a) SA, (b) HA, (c) BSA and (d) Ludox CL (20 mM NaCl, 1 mM NaHCO3, 1 mM CaCl2, cross flow velocity 40.2 cm/s, feed pH 8.0 ± 0.1, feed temperature 20.0 ± 0.1 ºC). Open and solid symbol indicates the result of the first and second experiment, respectively.
3.3 Characteristics of fouled membranes
The membrane surface hydrophobicity (measured by contact angle) increased
significantly when the NF/RO membranes were fouled by tertiary effluent (Figure 5.5).
The contact angle of the ESPA2 membrane increased from 43 to 79º due to the
membrane fouling. While the three virgin membranes (NF90, ESPA2 and ESPAB) have
a wide range of contact angle values (43-69º), the fouled membrane surface revealed a
very similar contact angle (in the range of 66-79º). The type of foulants can also have a
major impact on the hydrophobicity of membranes. The hydrophobicity of ESPA2
membranes increased as a result of membrane fouling by SA, HA and BSA, whereas a
considerable reduction in hydrophobicity was observed with Ludox CL (Figure 5.5).
The contact angle of each fouled membrane analysed here was in good agreement with
0 5 10 15 200.5
0.6
0.7
0.8
0.9
1.0
0 10 20 30 400.5
0.6
0.7
0.8
0.9
1.0
0 20 40 60 800.5
0.6
0.7
0.8
0.9
1.0
0 5 10 15 200.5
0.6
0.7
0.8
0.9
1.0
(a) SA 1st 2nd
Filtration period [h]
Nor
mal
ised
Per
mea
te F
lux
[-] (b) HA
1st 2nd
Filtration period [h]
Nor
mal
ised
Per
mea
te F
lux
[-]
(c) BSA 1st 2nd
Nor
mal
ised
Per
mea
te F
lux
[-]
Filtration period [h]
(d) Ludox CL 1st 2nd
Nor
mal
ised
Per
mea
te F
lux
[-]
Filtration period [h]
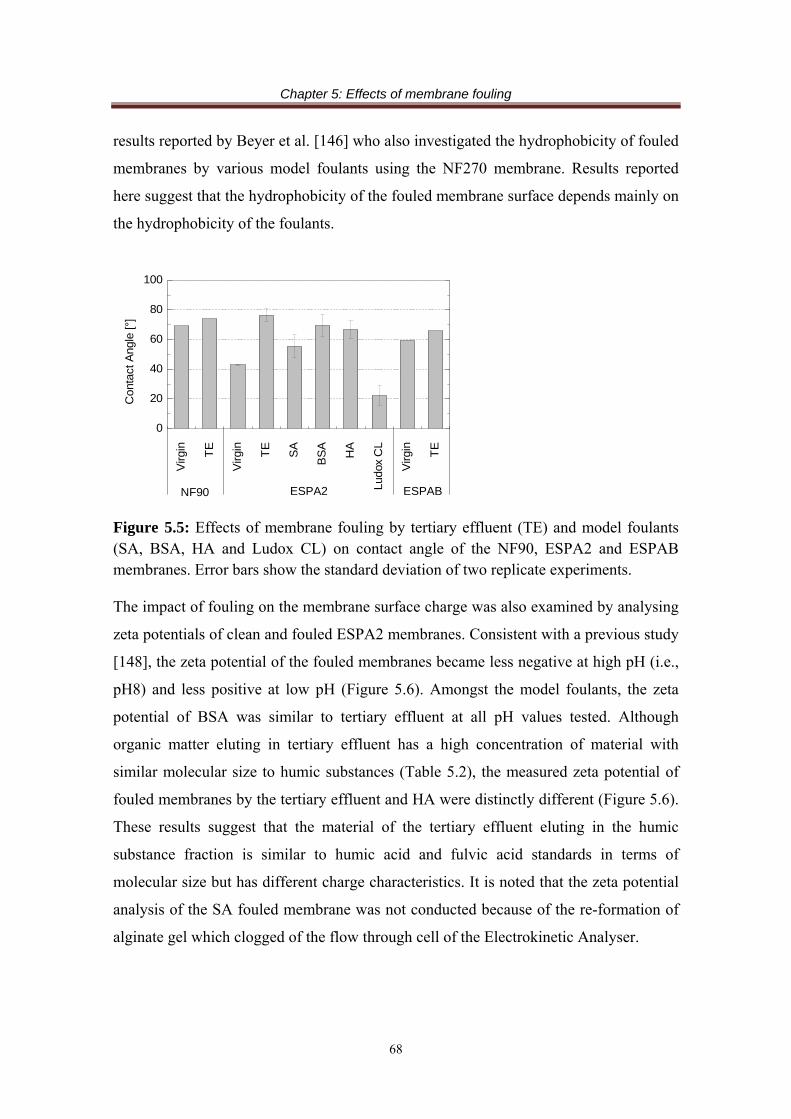
Chapter 5: Effects of membrane fouling
68
results reported by Beyer et al. [146] who also investigated the hydrophobicity of fouled
membranes by various model foulants using the NF270 membrane. Results reported
here suggest that the hydrophobicity of the fouled membrane surface depends mainly on
the hydrophobicity of the foulants.
Figure 5.5: Effects of membrane fouling by tertiary effluent (TE) and model foulants (SA, BSA, HA and Ludox CL) on contact angle of the NF90, ESPA2 and ESPAB membranes. Error bars show the standard deviation of two replicate experiments.
The impact of fouling on the membrane surface charge was also examined by analysing
zeta potentials of clean and fouled ESPA2 membranes. Consistent with a previous study
[148], the zeta potential of the fouled membranes became less negative at high pH (i.e.,
pH8) and less positive at low pH (Figure 5.6). Amongst the model foulants, the zeta
potential of BSA was similar to tertiary effluent at all pH values tested. Although
organic matter eluting in tertiary effluent has a high concentration of material with
similar molecular size to humic substances (Table 5.2), the measured zeta potential of
fouled membranes by the tertiary effluent and HA were distinctly different (Figure 5.6).
These results suggest that the material of the tertiary effluent eluting in the humic
substance fraction is similar to humic acid and fulvic acid standards in terms of
molecular size but has different charge characteristics. It is noted that the zeta potential
analysis of the SA fouled membrane was not conducted because of the re-formation of
alginate gel which clogged of the flow through cell of the Electrokinetic Analyser.
Virg
in TE
Virg
in TE
SA
BS
A
HA
Ludo
x C
L
Virg
in TE
0
20
40
60
80
100
ESPA2NF90 ESPAB
Con
tact
Ang
le [°
]
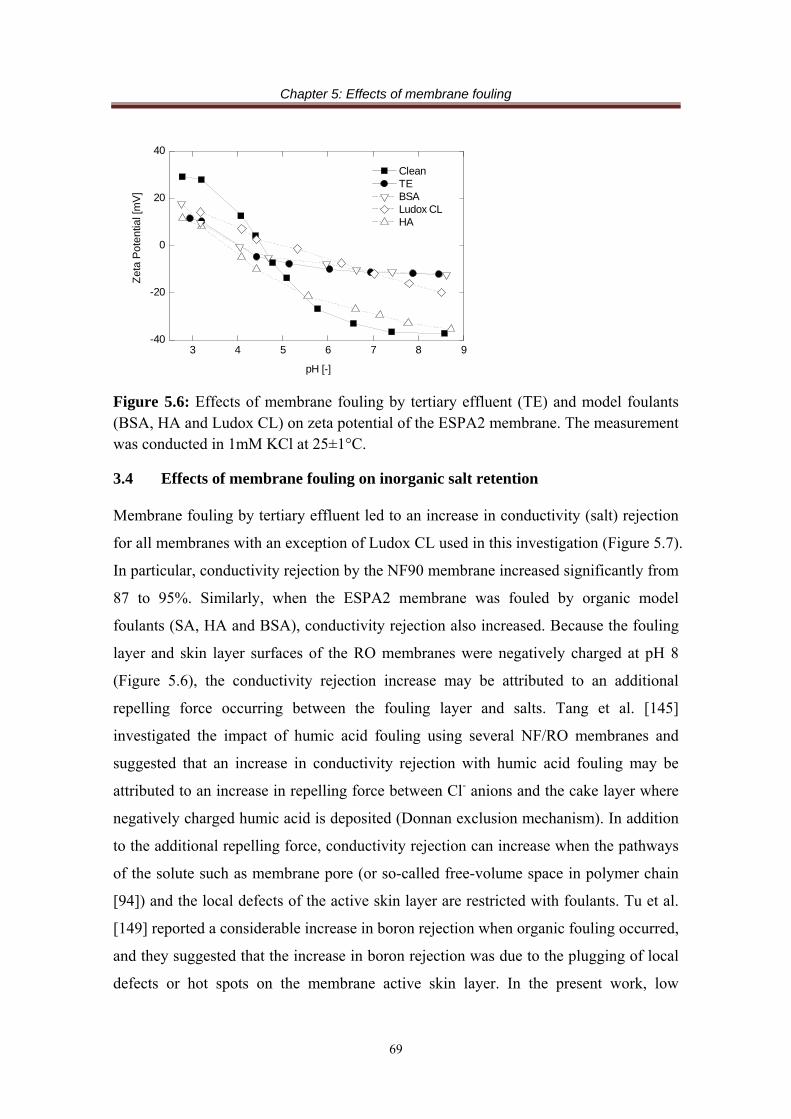
Chapter 5: Effects of membrane fouling
69
Figure 5.6: Effects of membrane fouling by tertiary effluent (TE) and model foulants (BSA, HA and Ludox CL) on zeta potential of the ESPA2 membrane. The measurement was conducted in 1mM KCl at 25±1°C.
3.4 Effects of membrane fouling on inorganic salt retention
Membrane fouling by tertiary effluent led to an increase in conductivity (salt) rejection
for all membranes with an exception of Ludox CL used in this investigation (Figure 5.7).
In particular, conductivity rejection by the NF90 membrane increased significantly from
87 to 95%. Similarly, when the ESPA2 membrane was fouled by organic model
foulants (SA, HA and BSA), conductivity rejection also increased. Because the fouling
layer and skin layer surfaces of the RO membranes were negatively charged at pH 8
(Figure 5.6), the conductivity rejection increase may be attributed to an additional
repelling force occurring between the fouling layer and salts. Tang et al. [145]
investigated the impact of humic acid fouling using several NF/RO membranes and
suggested that an increase in conductivity rejection with humic acid fouling may be
attributed to an increase in repelling force between Cl- anions and the cake layer where
negatively charged humic acid is deposited (Donnan exclusion mechanism). In addition
to the additional repelling force, conductivity rejection can increase when the pathways
of the solute such as membrane pore (or so-called free-volume space in polymer chain
[94]) and the local defects of the active skin layer are restricted with foulants. Tu et al.
[149] reported a considerable increase in boron rejection when organic fouling occurred,
and they suggested that the increase in boron rejection was due to the plugging of local
defects or hot spots on the membrane active skin layer. In the present work, low
3 4 5 6 7 8 9-40
-20
0
20
40
Clean TE BSA Ludox CL HA
Zet
a P
ote
ntia
l [m
V]
pH [-]

Chapter 5: Effects of membrane fouling
70
molecular weight organic foulants present in the tertiary effluent may have narrowed
down the pores within the active skin layer and/or blocked the local defects on the
active skin layer surface. This additional restriction of the solute pathway may explain
why the increase in conductivity rejection observed using tertiary effluent was higher
than that using BSA despite their similar zeta potential of fouled membrane surface. On
the other hand, the results reported here also revealed a reduction in conductivity
rejection with Ludox CL fouling. Colloidal cake fouling layer depositing on membrane
surface hinders back diffusion of rejected salt from the membrane surface to bulk
solution, and the higher concentration gradient across the membrane is likely to result in
a decrease in salt rejection (cake enhanced concentration polarisation) [115, 144].
Because the fouled membrane by colloids remarkably decreased salt rejection from
96.3% to 94.9%, the cake enhanced concentration polarisation may have played an
important role in salt rejection using the fouled membrane.
Figure 5.7: Conductivity rejection of the clean and fouled membranes (Permeate flux 20 L/m2h, crossflow velocity 40.2 cm/s, feed temperature 20.0 ± 0.1 ºC). Error bars show the standard deviation of two replicate experiments.
3.5 Effects of membrane fouling on N-nitrosamine rejection
The rejection of small organic compounds by NF/RO membranes can be governed by
steric hindrance, electrostatic interactions and adsorption onto the membrane surface [3].
All N-nitrosamines used are hydrophilic and uncharged at neutral pH, thus the
electrostatic interactions and adsorption effects do not play a major role on their
rejection performances. Previous studies also reported that N-nitrosamine rejection by
TE
TE
SA
BS
A
HA
Ludo
x C
L
TE
86
88
94
96
98
100
ESPA2NF90
Con
duct
ivity
Rej
entio
n [%
]
Clean Fouled
ESPAB

Chapter 5: Effects of membrane fouling
71
NF/RO membranes in clean water matrices reached a steady state condition within a 45
min filtration period [38, 82]. Preliminary experimental results (Figure 5.8) revealed no
significant changes in the rejection of N-nitrosamines with the exception of NDEA after
1 and 48 h of filtration even in tertiary effluent feed. These results indicate that 1 h
filtration is sufficient to evaluate the rejection of most N-nitrosamines in tertiary
effluent. During the preliminary experiment, the concentration of some N-nitrosamines
(i.e, NDMA, NMEA and NDBA) in the feed decreased as the filtration progressed.
These N-nitrosamines have been reported to be readily biodegradable [29], and the
reduction in these N-nitrosamines was possibly caused by biodegradation. Fujioka et al.
[150] investigated the impact of N-nitrosamine feed concentration on their rejection
using a RO membrane (TFC-HR) and reported their negligible impacts in the range
from 0.25 to 1.5 µg/L of each N-nitrosamine concentration. Thus, the changes in N-
nitrosamine feed concentration are unlikely to play an important role in the evaluation
of N-nitrosamine rejections.
Figure 5.8: (a) Conductivity rejection and (b) N-nitrosamine rejection by the ESPA2 membrane as a function of filtration period (permeate flux 20 L/m2h, cross flow velocity 40.2 cm/s, feed temperature 20.0 ± 0.1 °C).
9596979899
100
0 10 20 30 40 500
20
40
60
80
100
(b) N-nitrosamine Rejection
(a) Conductivity Rejection
Con
duct
ivity
Rej
ectio
n [%
]
NDBA NDPA NMOR NPIP NDEA NPYR NMEA NDMA
N-n
itros
amin
e R
ejec
tion
[%]
Filtration Period [h]

Chapter 5: Effects of membrane fouling
72
Figure 5.9: Effects of membrane fouling using tertiary effluent on the rejection of N-nitrosamines by (a) ESPAB, (b) ESPA2 and (c) NF90 membranes (permeate flux 20 L/m2h, cross flow velocity 40.2 cm/s, feed temperature 20.0 ± 0.1 ºC). Error bars on the ESPA2 membranes show the standard deviation of two replicate experiments. N-nitrosamine concentrations (except NDMA and NMOR) in the permeate of the ESPAB membrane were all below detection limits.
In general, membrane fouling by tertiary effluent caused an increase in N-nitrosamine
rejection (Figure 5.9). This was particularly apparent for low molecular weight N-
nitrosamines such as NDMA. For example, the rejection of NDMA by the NF90 and
ESPA2 membranes increased in the range from 11 to 34% and from 34 to 73%,
respectively. In contrast, membrane fouling on the ESPAB membrane resulted in only a
slight increase (from 82 to 88%) in NDMA rejection. The results reported here also
indicate that the ESPAB membrane is very effective for the removal of N-nitrosamines
regardless of membrane fouling. As expected, during these filtration tests the
0
20
40
60
80
100
60 80 100 120 140 1600
20
40
60
80
1000
20
40
60
80
100
(a) ESAPBFouledClean
Rej
ectio
n [%
]
(c) NF90 Fouled Clean
Rej
ectio
n [%
]
Molecular Weight [g/mol]
ND
MA
NM
EA
NP
YR
ND
EA
NP
IPN
MO
R
ND
PA
ND
BA
(b) ESPA2FouledClean
Rej
ectio
n [%
]

Chapter 5: Effects of membrane fouling
73
concentrations of NDMA, NMEA and NDBA in the feed (i.e., tertiary effluent)
decreased by up to 82%. The impact of SA fouling was minor, but nevertheless
discernible for low molecular weight N-nitrosamines such as NDMA (Figure 5.10). On
the other hand, membrane fouling of HA, BSA and Ludox CL had a negligible impact
on the rejection of N-nitrosamines.
Figure 5.10: N-nitrosamine rejections by the ESPA2 membrane with and without fouling of (a) SA, (b) HA, (c) BSA and (d) Ludox CL. (20 mM NaCl, 1 mM NaHCO3, 1 mM CaCl2, permeate flux 20 L/m2h, cross flow velocity 40.2 cm/s, feed pH 8.0 ± 0.1, feed temperature 20.0 ± 0.1 ºC). Error bars show the standard deviation of two replicate experiments.
The clear difference in the impact of membrane fouling observed between tertiary
effluent (Figure 5.9) and model foulants (Figure 5.10) is intriguing. For the separation
mechanism of N-nitrosamines, the rejection of N-nitrosamines by NF/RO membranes
has been reported to be mainly governed by steric hindrance where the interaction
between N-nitrosamine molecule size and pore size of the active skin layer plays an
60 80 100 120 140 1600
20
40
60
80
100
60 80 100 120 140 1600
20
40
60
80
100
60 80 100 120 140 1600
20
40
60
80
100
60 80 100 120 140 1600
20
40
60
80
100
(a) SA Fouled Clean
Rej
ectio
n [%
]
Molecular Weight [g/mol]
(b) HA Fouled Clean
Rej
ectio
n [%
]
Molecular Weight [g/mol]
(c) BSA Fouled Clean
Rej
ectio
n [%
]
Molecular Weight [g/mol]
(d) Ludox CL Fouled Clean
Rej
ectio
n [%
]
Molecular Weight [g/mol]
ND
MA
NM
EA
NP
YR
ND
EA
NP
IPN
MO
R
ND
PA
ND
BA
ND
MA
NM
EA
NP
YR
ND
EA
NP
IPN
MO
R
ND
PA
ND
BA
ND
MA
NM
EA
NP
YR
ND
EA
NP
IPN
MO
R
ND
PA
ND
BA
ND
MA
NM
EA
NP
YR
ND
EA
NP
IPN
MO
R
ND
PA
ND
BA
Chapter 5: Effects of membrane fouling
74
important role in their rejection [150]. Because the molecular size of N-nitrosamines
does not change under the experimental conditions, the increased rejection of some N-
nitrosamines using the tertiary effluent is likely to be attributed to changes in membrane
characteristics. As described in Section 3.4, it can be suggested that the pathway of
solutes (such as membrane pore and local defects of the active skin layer) on RO
membranes can be restricted with foulants present in the tertiary effluent, and these
changes in the solute pathway leads to an increase of N-nitrosamine rejection.
4 Conclusions
Membrane fouling by tertiary effluent and organic model foulants (i.e., sodium alginate,
bovine serum albumin and humic acid) led to an increase in conductivity rejection due
to enhanced electrostatic interactions between the fouling layer and inorganic salts. On
the other hand, colloidal fouling using Ludox CL caused a reduction in conductivity
rejection. Membrane fouling by tertiary effluent also increased the rejection of N-
nitrosamines. The rejection of low molecular weight N-nitrosamines such as NDMA
was most affected by membrane fouling and the impact was most pronounced for
membranes that have high membrane permeability. Although the ESPA2 and ESPAB
membranes were comparable in terms of membrane permeability and fouling
susceptibility the rejection of N-nitrosamines by the ESPAB membrane was very high
(over 82%) regardless the impact of membrane fouling. In contrast to the results using
tertiary effluent, membrane fouling by model foulants revealed only a negligible impact
on N-nitrosamine rejection. Because the tertiary effluent used in this investigation
contained a high fraction of low molecular weight organic substances, these foulants
may have restricted the pathway of solutes on the active skin layer of the RO membrane,
resulting in an increase in N-nitrosamine rejection. The present findings provide
valuable insights for predicting NDMA rejection variations observed during full-scale
RO plant operation. In addition, the results reported here indicate that changes in
NDMA rejection may be predicted by analysing conductivity rejection because both
rejections increased as fouling progressed.

Chapter 6: Membrane exposure to chemical cleaning reagents
75
Chapter 6
Membrane exposure to chemical cleaning reagents
This chapter has been published as:
T. Fujioka, S.J. Khan, J.A. McDonald, A. Roux, Y. Poussade, J.E. Drewes, L.D. Nghiem, N-nitrosamine rejection by RO: Effects of exposing the membrane to chemical cleaning reagents, Desalination, 343 (2014) 60-66.
1 Introduction
In addition to feed solution characteristics and operating conditions, the separation
performance of RO membranes may also be affected by the alteration of membrane
surface characteristics particularly caused by chemical cleaning. Because membrane
fouling is an inherent phenomenon in almost all pressure driven membrane processes,
chemical cleaning is inevitable. Typical cleaning chemicals include sodium hydroxide
(NaOH) citric acid (CA), hydrochloric acid (HCl) and ethylenediaminetetraacetic acid
(EDTA) [151, 152]. Although chemical cleaning can frequently restore the performance
of RO membranes exposed to wastewater foulants [127, 153], these chemicals may also
modify polyamide membrane structures, resulting in an increase in permeability or
decrease in salt rejection [151]. Simon et al. [121] recently investigated the effects of
chemical cleaning by exposing a NF270 nanofiltration membrane to several cleaning
reagents (i.e., NaOH, CA, sodium dodecyl sulphate (SDS) and EDTA) and reported that
these chemical cleaning agents (with the exception of CA) increased membrane
permeability by up to 30%. Simon et al. [121] reported that the rejection of neutral
solutes was more significantly affected by chemical cleaning than that of charged
compounds. When the NF270 membrane was exposed to NaOH solution (pH 12), its
permeability increased by 30% and the rejection of carbamazepine (molecular weight
253.3 g/mol) decreased from 80 to 50%. From the previous literature mentioned above,
periodical chemical cleaning can potentially lead to a decrease in the rejection of N-
nitrosamines including NDMA in full-scale RO installations, causing unexpected

Chapter 6: Membrane exposure to chemical cleaning reagents
76
deterioration and variation in their rejection. Nevertheless, to date, the impact of
chemical cleaning on the rejection of N-nitrosamines by RO membranes has not fully
understood.
The aim of this study was to provide a comprehensive understanding of the effects of
chemical cleaning on the rejection of N-nitrosamines by RO membranes. The cleaning
agents used in this investigation include three general cleaning chemical solutions
(NaOH, HCl, CA) and three proprietary cleaning solutions. The impact of chemical
cleaning was elucidated by examining the membrane pure water permeability, surface
charge through zeta potential measurements, and separation performances of salts and
select organic solutes.
2 Materials and methods
2.1 RO membranes
Two low pressure RO membranes – namely TFC-HR (Koch Membrane Systems, San
Diego, CA, USA) and ESPA2 (Hydranautics, Oceanside, CA, USA) – were used in this
study. Properties of these membranes are summarized in Table 3.1 (Chapter 3).
2.2 Chemicals
Properties of eight N-nitrosamines are summarized in Table 3.2 (Chapter 3).
Six chemical cleaning agents were used in this investigation (Table 6.1). Analytical
grade NaOH, HCl and CA from Ajax Finechem (Taren Point, NSW, Australia) were
used as cleaning reagents based on recommendations from the membrane manufacturers
(Table 6.2). The cleaning solution was prepared by dissolving the reagent in Milli-Q
water. Three proprietary formulations designed for membrane cleaning in full-scale RO
plants were also used. They are referred to as MC3, MC11 and PC98. Floclean® MC3 is
an acidic based while Floclean® MC11 and PermaClean® PC98 are caustic based
chemical cleaning formulations. MC3 and MC11 were supplied in powder form and the
cleaning solution was prepared at 25 g/L as recommended by the manufacturer. PC98
was supplied in liquid form and was prepared at 4% (w/w) as recommended by the
manufacturer.
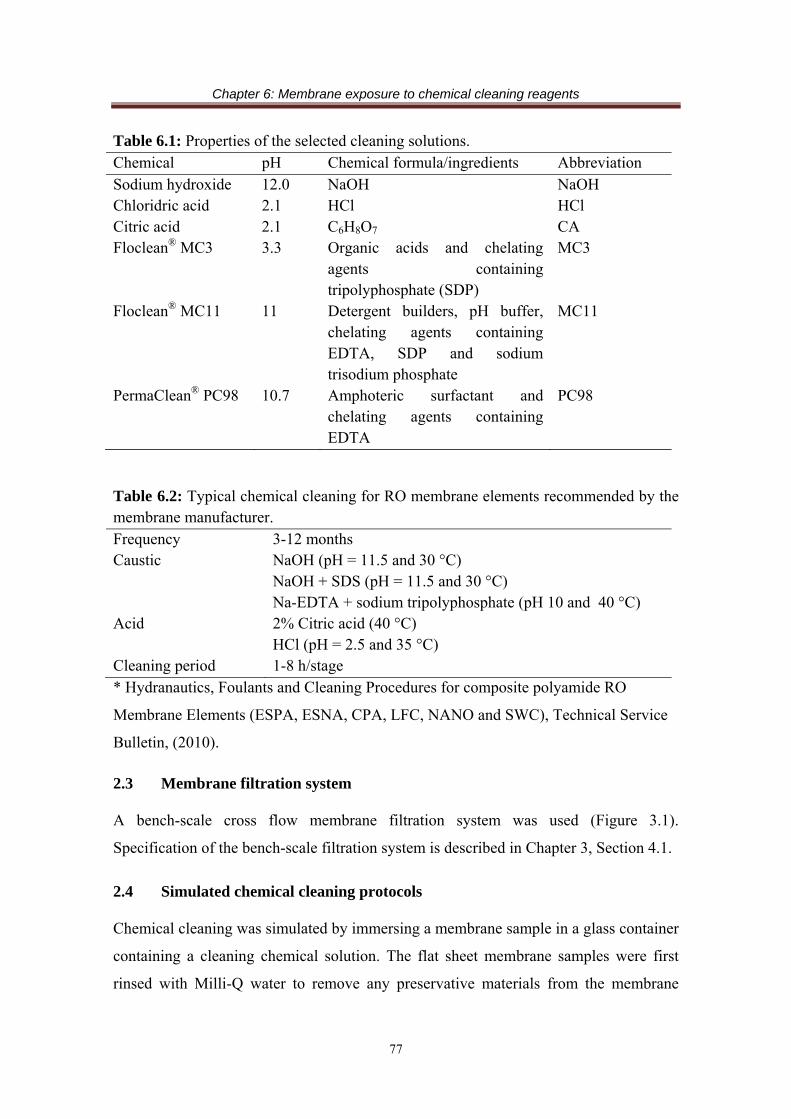
Chapter 6: Membrane exposure to chemical cleaning reagents
77
Table 6.1: Properties of the selected cleaning solutions. Chemical pH Chemical formula/ingredients Abbreviation Sodium hydroxide 12.0 NaOH NaOH Chloridric acid 2.1 HCl HCl Citric acid 2.1 C6H8O7 CA Floclean® MC3 3.3 Organic acids and chelating
agents containing tripolyphosphate (SDP)
MC3
Floclean® MC11 11 Detergent builders, pH buffer, chelating agents containing EDTA, SDP and sodium trisodium phosphate
MC11
PermaClean® PC98 10.7 Amphoteric surfactant and chelating agents containing EDTA
PC98
Table 6.2: Typical chemical cleaning for RO membrane elements recommended by the membrane manufacturer. Frequency Caustic Acid Cleaning period
3-12 months NaOH (pH = 11.5 and 30 °C) NaOH + SDS (pH = 11.5 and 30 °C) Na-EDTA + sodium tripolyphosphate (pH 10 and 40 °C) 2% Citric acid (40 °C) HCl (pH = 2.5 and 35 °C) 1-8 h/stage
* Hydranautics, Foulants and Cleaning Procedures for composite polyamide RO
Membrane Elements (ESPA, ESNA, CPA, LFC, NANO and SWC), Technical Service
Bulletin, (2010).
2.3 Membrane filtration system
A bench-scale cross flow membrane filtration system was used (Figure 3.1).
Specification of the bench-scale filtration system is described in Chapter 3, Section 4.1.
2.4 Simulated chemical cleaning protocols
Chemical cleaning was simulated by immersing a membrane sample in a glass container
containing a cleaning chemical solution. The flat sheet membrane samples were first
rinsed with Milli-Q water to remove any preservative materials from the membrane

Chapter 6: Membrane exposure to chemical cleaning reagents
78
surface. In addition to these cleaning chemical solutions, Milli-Q water was also used
for cleaning to obtain control membrane samples, and these control samples are
designated as virgin membrane in this study. The containers were submerged in a
temperature-controlled water bath (SWB1, Stuart®, Staffordshire, UK) and the
temperature was maintained at 30±0.5 ºC according to the membrane manufacturer’s
recommendation (Table 6.2). The simulated cleaning was carried out for 25 h. This
cleaning simulation over 25 hours corresponds to the cumulative chemical cleaning
period of typical three-year operation comprising six months of chemical cleaning
frequency and approximately 4 h of each cleaning. After the chemical cleaning
procedure, the membrane samples were rinsed with a copious amount of Milli-Q water
and stored (in Milli-Q water) at 4 ºC in the dark until they were used for further
experiments. To evaluate the impact of a two-step cleaning procedure, the membrane
sample was first immersed into a NaOH solution for 25 h followed by a CA solution for
25 h. For the evaluation of effects of each cleaning solution, two membrane samples
were prepared.
A general chemical cleaning procedure in full-scale RO plants is based on a sequential
cycle of the first recirculation of chemical solution, 1-8 h soaking, second recirculation
of chemical solution at an elevated temperature (e.g. 30 – 35 ºC), rinsing with clean
water and flushing with feed water (Table 6.2). Although the first recirculation using
chemical solution is effective to remove fouling layer from the membrane surface, the
membrane surface might still be partially covered by a fouling layer compromising
direct exposure of the top skin layer of the membrane to chemical cleaning solution.
Moreover, the effectiveness of chemical cleaning in full-scale RO plants is generally
enhanced by higher cross-flow velocities [154]. Despite the difference in the impact of
chemical cleaning from full-scale RO plants, the simulated chemical cleaning procedure
used in this study enables a systematic investigation for the impact of each chemical
cleaning solution on the separation performance of RO membranes. In fact, similar
experimental protocols on chemical cleaning were previously reported in the literature
[121, 155, 156].
Chapter 6: Membrane exposure to chemical cleaning reagents
79
2.5 Filtration experiments
Prior to each filtration experiment, the membrane was compacted at 1,800 kPa using
Milli-Q as the feed until the permeate flux stabilised. Following the compaction stage,
the permeability of each membrane sample was measured at feed pressure of 1,000 kPa.
The Milli-Q water in the feed was then conditioned at 20 mM NaCl, 1 mM CaCl2 and 1
mM NaHCO3 to simulate the background electrolyte composition typically found in
secondary or tertiary treated effluent. The stock solution of N-nitrosamines was also
spiked into the feed to make up 250 ng/L of each target compound. The permeate flux
was then adjusted to 20 L/m2h, and the system was operated for at the least 2 h before
the first samples of the feed and permeate were taken for analysis. A previous study
revealed no significant changes in the rejection of almost all N-nitrosamines after 1 h
filtration [150]. The cross flow velocity and feed temperature during tests were kept at
0.42 m/s and 20±0.1°C, respectively.
2.6 Analytical methods
2.6.1 N-nitrosamine analytical technique
N-nitrosamine concentrations were analysed using an analytical method described in
Chapter 3, Section 5.1.
2.6.2 Zeta potential measurement
Details of zeta potential analysis are described in Chapter 3, Section 6.2.
2.6.3 Surface chemistry
Functional groups of RO membranes were analysed obtaining fourier transform infrared
spectroscopy (FTIR) spectra described in Chapter 3, Section 6.3.
3 Results and discussion
3.1 Effects of membrane cleaning on membrane characteristics
Caustic chemical cleaning caused a significant increase in membrane permeability for
both the TFC-HR and ESPA2 membranes (Figure 6.1). In comparison to caustic
cleaning, the impact of acidic chemical cleaning on the membrane permeability was

Chapter 6: Membrane exposure to chemical cleaning reagents
80
much less discernible (Figure 6.1). Changes in the membrane permeability could occur
via several mechanisms. A previous study by Kim et al. [157] suggested that under
extreme conditions, the polyamide active akin layer can be hydrolysed to carboxylic
acid derivatives, resulting in an increase in water permeability and surface
hydrophilicity. Both acidic and caustic cleaning resulted in some variation in the
membrane hydrophilicity and impact was specific to each membrane and the individual
cleaning reagent (Figure 6.2). There was no evidence to suggest that the membrane was
hydrolysed under the experimental conditions of this study. The increase in
permeability can also be attributed to some extent to adsorption of cleaning additives
such as chelating reagents and surfactants in the proprietary cleaning formulations on
the membrane surface. A previous study by Ang et al. [154] suggested that a small
amount of residual chemical reagent (e.g. EDTA) on the membrane surface makes the
active skin layer more hydrophilic, leading to more water passage through the
membrane. Indeed, the proprietary cleaning formulations MC11 (pH 11) and PC98 (pH
10.7) resulted in a similar increase in permeability of the TFC-HR membrane in
comparison to the NaOH (pH 12) solution (Figure 6.1a).
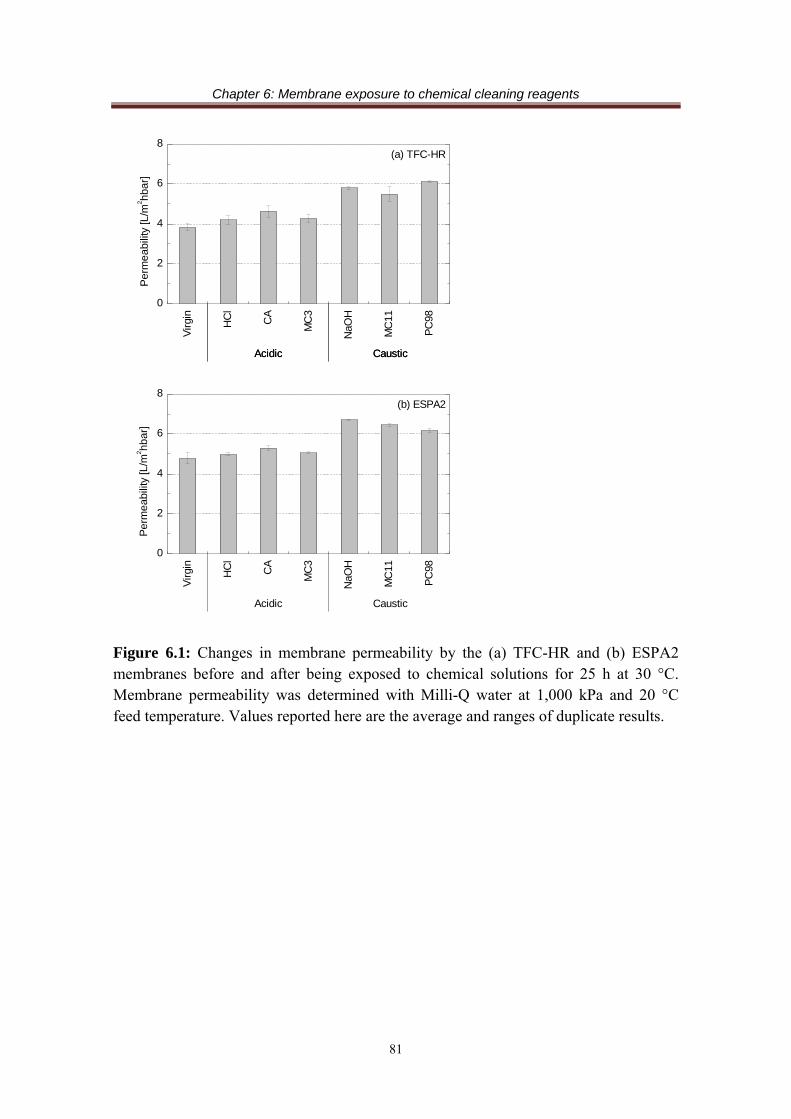
Chapter 6: Membrane exposure to chemical cleaning reagents
81
Figure 6.1: Changes in membrane permeability by the (a) TFC-HR and (b) ESPA2 membranes before and after being exposed to chemical solutions for 25 h at 30 °C. Membrane permeability was determined with Milli-Q water at 1,000 kPa and 20 °C feed temperature. Values reported here are the average and ranges of duplicate results.
Vir
gin
HC
l
CA
MC
3
NaO
H
MC
11
PC
98
0
2
4
6
8
(b) ESPA2
(a) TFC-HRP
erm
eab
ility
[L/m
2 hbar
]
Virg
in
HC
l
CA
MC
3
NaO
H
MC
11
PC
98
0
2
4
6
8
Per
mea
bilit
y [L
/m2 hb
ar]
CausticAcidic CausticAcidic
CausticAcidic

Chapter 6: Membrane exposure to chemical cleaning reagents
82
Figure 6.2: Hydrophobicity of the (a) TFC-HR and (b) ESPA2 membranes before and after being exposed to permeability of TFC-HR membrane before and after being exposed to cleaning solutions for 25 hours at 30 °C.
FTIR spectra of the virgin and several cleaned membranes in the range of 1750-750 cm-
1 revealed the bonding structure of the polyamide active skin layer and the polysulfone
supporting layer (Figure 6.3). The polyamide active skin layer exhibit peaks at 1663,
1609 and 1541 cm-1, which represent C-O and C-N stretching and C-C-N deformation
vibration (amide I), N-H deformation vibration and C=C ring stretching vibration of
aromatic amide, and N-H in-place bending and N-C stretching vibration of a -CO-NH-
group (amide II), respectively [158, 159]. Details of the other peaks associated with
polysulfone supporting layer can be found elsewhere [158]. The FTIR spectra exhibited
no discernible variations in these peaks (i.e. 1663, 1609 and 1541 cm-1) after exposing
the membranes to chemical cleaning reagents (Figure 6.3). These results suggest that
Vir
gin
HC
l
CA
MC
3
NaO
H
MC
11
PC
98
0
20
40
60
80
(b) ESPA2
(a) TFC-HR
Caustic
Con
tact
Ang
le [°
]
Acidic
CausticAcidic
Virg
in
HC
l
CA
MC
3
NaO
H
MC
11
PC
98
0
20
40
60
80
Con
tact
Ang
le [°
]

Chapter 6: Membrane exposure to chemical cleaning reagents
83
hydrolysis of the polyamide skin layer did not occur and that other mechanisms are
responsible for the increase in permeability after caustic chemical cleaning.
Figure 6.3: FTIR spectra of the (a) TFC-HR and (b) ESPA2 membranes before and after being exposed to the cleaning solutions NaOH, MC11 and HCl for 25 h at 30 °C.
Several previous studies have reported that changes in the membrane charge density can
lead to conformational changes in the polymeric matrix due to a reduced electrostatic
repulsion amongst charged functional group, which can result in a variation in the
membrane pore and thus permeability [100, 160]. In this study, zeta potential of the
virgin and chemically cleaned RO membranes was measured to substantiate any impact
on permeability that may be caused by the changes in the membrane surface charge.
The results reveal that acidic chemical cleaning (i.e., using HCl, CA and MC3
solutions) did not result in any discernible impact on zeta potential of the polyamide RO
1700 1600 1500 1400 1300 1200 1100 1000 900 8000.0
0.1
0.2
0.3
1700 1600 1500 1400 1300 1200 1100 1000 900 8000.0
0.1
0.2
0.3
1541
1609
(b) ESPA2
(a) TFC-HR
HCl
MC11
NaOH
Abso
rban
ce
Wavenumber [cm-1]
Virgin
Virgin
NaOH
MC11
HCl
1663
1663 1609
1541
Abs
orban
ce
Wavenumber [cm-1]
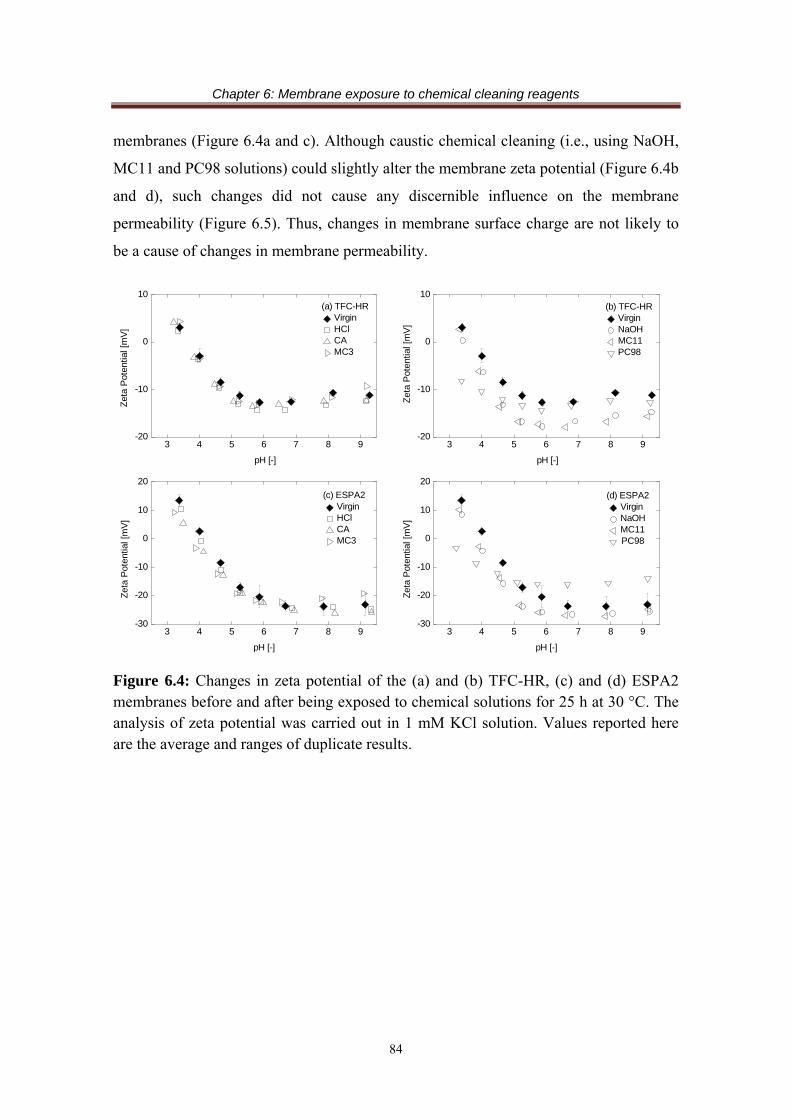
Chapter 6: Membrane exposure to chemical cleaning reagents
84
membranes (Figure 6.4a and c). Although caustic chemical cleaning (i.e., using NaOH,
MC11 and PC98 solutions) could slightly alter the membrane zeta potential (Figure 6.4b
and d), such changes did not cause any discernible influence on the membrane
permeability (Figure 6.5). Thus, changes in membrane surface charge are not likely to
be a cause of changes in membrane permeability.
Figure 6.4: Changes in zeta potential of the (a) and (b) TFC-HR, (c) and (d) ESPA2 membranes before and after being exposed to chemical solutions for 25 h at 30 °C. The analysis of zeta potential was carried out in 1 mM KCl solution. Values reported here are the average and ranges of duplicate results.
3 4 5 6 7 8 9-20
-10
0
10
3 4 5 6 7 8 9-20
-10
0
10
3 4 5 6 7 8 9-30
-20
-10
0
10
20
3 4 5 6 7 8 9-30
-20
-10
0
10
20
(a) TFC-HR Virgin HCl CA MC3
Zet
a P
oten
tial [
mV
]
pH [-]
(b) TFC-HR Virgin NaOH MC11 PC98
Zet
a P
oten
tial [
mV
]
pH [-]
(c) ESPA2 Virgin HCl CA MC3
Zet
a P
oten
tial [
mV
]
pH [-]
(d) ESPA2 Virgin NaOH MC11 PC98
Zet
a P
oten
tial [
mV
]
pH [-]
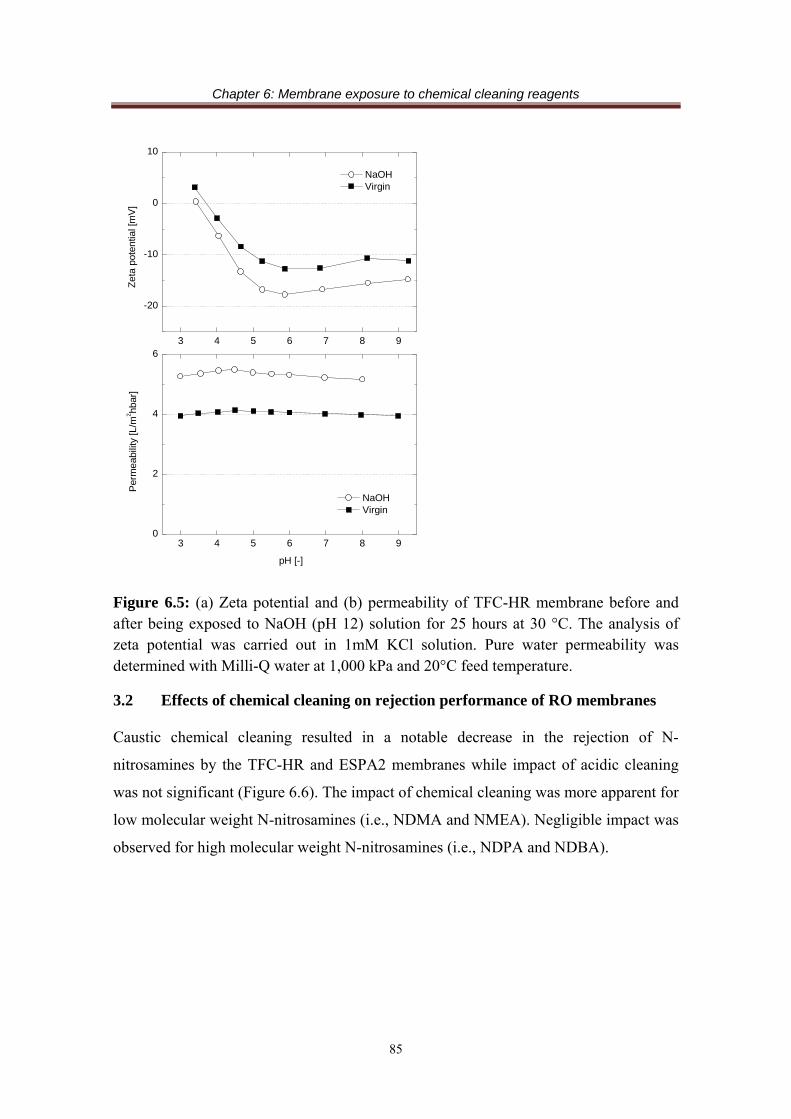
Chapter 6: Membrane exposure to chemical cleaning reagents
85
Figure 6.5: (a) Zeta potential and (b) permeability of TFC-HR membrane before and after being exposed to NaOH (pH 12) solution for 25 hours at 30 °C. The analysis of zeta potential was carried out in 1mM KCl solution. Pure water permeability was determined with Milli-Q water at 1,000 kPa and 20°C feed temperature.
3.2 Effects of chemical cleaning on rejection performance of RO membranes
Caustic chemical cleaning resulted in a notable decrease in the rejection of N-
nitrosamines by the TFC-HR and ESPA2 membranes while impact of acidic cleaning
was not significant (Figure 6.6). The impact of chemical cleaning was more apparent for
low molecular weight N-nitrosamines (i.e., NDMA and NMEA). Negligible impact was
observed for high molecular weight N-nitrosamines (i.e., NDPA and NDBA).
3 4 5 6 7 8 90
2
4
63 4 5 6 7 8 9
-20
-10
0
10
NaOH Virgin
Per
mea
bilit
y [L
/m2 hb
ar]
pH [-]
NaOH Virgin
Zet
a po
tent
ial [
mV
]

Chapter 6: Membrane exposure to chemical cleaning reagents
86
Figure 6.6: N-nitrosamine rejection of the virgin and chemical cleaned (a) and (b) TFC-HR, and (c) and (d) ESPA2 membranes (20 mM NaCl, 1 mM NaHCO3, 1 mM CaCl2, permeate flux 20 L/m2h, cross flow velocity 40.2 cm/s, feed pH 8.0 ± 0.1, feed temperature 20.0 ± 0.1 °C). Values reported here are the averages of duplicate results.
Results reported here are in agreement with the changes in the membrane permeability
due to chemical cleaning reported in section 3.1. A correlation was observed between
permeability and the rejection of NDMA (R2 = 0.86 and 0.87) and NMEA (R2 = 0.93
and 0.86) for the TFC-HR and ESPA2 membranes, respectively (Figure 6.7). These
results indicate that the rejection of low molecular weight N-nitrosamines (i.e., NDMA
and NMEA) by RO membranes decrease significantly in accordance with the degree of
the permeability increase caused by chemical cleaning, while the rejection of high
molecular weight N-nitrosamines is not affected by chemical cleaning. Water
permeability and solute passage increase when the void volume within the active skin
layer increases and effective thickness of the active skin layer decreases [92]. Al-
Amoudi [161] recently used the positron annihilation spectroscopy technique to
measure the change in membrane pore volume due to chemical cleaning and reported
60 80 100 120 140 1600
20
40
60
80
100
60 80 100 120 140 1600
20
40
60
80
100
60 80 100 120 140 1600
20
40
60
80
100
60 80 100 120 140 1600
20
40
60
80
100
(a) TFC-HR Virgin HCl CA MC3
N-n
itros
amin
e R
ejec
tion
[%]
Molecular Weight [g/mol]
(b) TFC-HR Virgin NaOH MC11 PC98N
-nitr
osam
ine
Rej
ectio
n [%
]
Molecular Weight [g/mol]
(c) ESPA2 Virgin HCl CA MC3N
-nitr
osam
ine
Rej
ectio
n [%
]
Molecular Weight [g/mol]
(d) ESPA2 Virgin NaOH MC11 PC98N
-nitr
osam
ine
Rej
ectio
n [%
]
Molecular Weight [g/mol]
ND
MA
NM
EA
NP
YR
ND
EA
NP
IPN
MO
R
ND
PA
ND
BA
ND
MA
NM
EA
NP
YR
ND
EA
NP
IPN
MO
R
ND
PA
ND
BA
ND
MA
NM
EA
NP
YR
ND
EA
NP
IPN
MO
R
ND
PA
ND
BA
ND
MA
NM
EA
NP
YR
ND
EA
NP
IPN
MO
R
ND
PA
ND
BA

Chapter 6: Membrane exposure to chemical cleaning reagents
87
that the pore volume increased slightly after chemical cleaning. Simon et al. [162]
hypothesized that the enlargement of the membrane pore size immediately after caustic
cleaning can be attributed to the increased electrostatic interactions at high pH among
the deprotonated carboxylic functional groups of the polyamide active skin layer. Due
to the hysteresis effect, the membrane pore size can only return to the normal condition
after a sufficient period.
Figure 6.7: Rejection of N-nitrosamines by the virgin and chemical cleaned (a) TFC-HR and (b) ESPA2 membranes as a function of membrane permeability after being exposed to chemical solutions for 25 h at 30 °C.
It is also notable that in addition to N-nitrosamines rejection, a correlation (R2 = 0.79
and 0.80 for the TFC-HR and ESPA2 membranes, respectively) between permeability
and conductivity rejection was also observed (Figure 6.7). These results also suggest
that changes in conductivity rejection, which is monitored online in full-scale plants,
also correspond to some extend to variations in the rejection of low molecular weight
N-nitrosamines.
95
96
97
98
99
100
95
96
97
98
99
100
3 4 5 6 70
20
40
60
80
100
4 5 6 7 80
20
40
60
80
100
R2=0.80
(b) ESPA2(a) TFC-HR
Cond
uctiv
ity R
ejec
tion
[%]
R2=0.79
Cond
uctiv
ity R
ejec
tion
[%]
Vir
gin
HC
lM
C3
CA
MC
11
NaO
H
PC
98
Vir
gin
HC
lM
C3
CA
PC
98
MC
11
NaO
H
NDBA NDPA NMOR NPIP NDEA NPYR NMEA NDMA
R2=0.86
N-n
itros
amin
e R
ejec
tion
[%]
Pure Water Permeability [L/m2hbar]
R2=0.93
R2=0.86
R2=0.87
N-n
itros
amin
e R
ejec
tion
[%]
Pure Water Permeability [L/m2hbar]
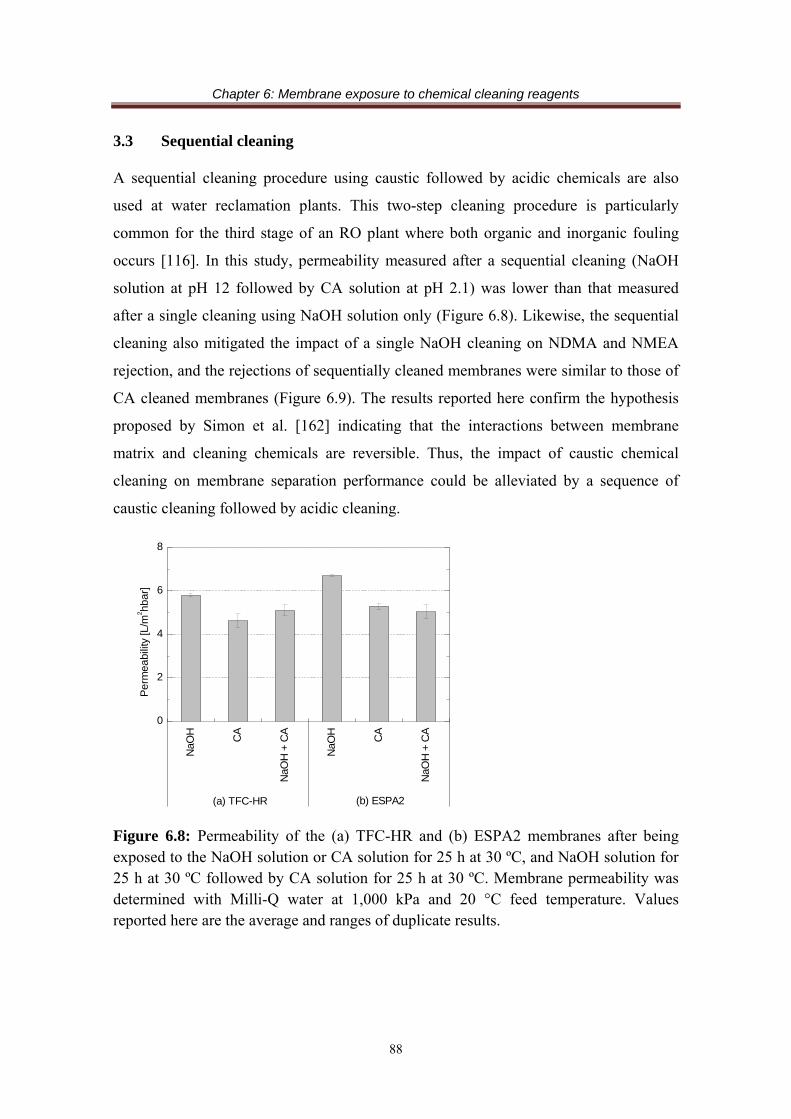
Chapter 6: Membrane exposure to chemical cleaning reagents
88
3.3 Sequential cleaning
A sequential cleaning procedure using caustic followed by acidic chemicals are also
used at water reclamation plants. This two-step cleaning procedure is particularly
common for the third stage of an RO plant where both organic and inorganic fouling
occurs [116]. In this study, permeability measured after a sequential cleaning (NaOH
solution at pH 12 followed by CA solution at pH 2.1) was lower than that measured
after a single cleaning using NaOH solution only (Figure 6.8). Likewise, the sequential
cleaning also mitigated the impact of a single NaOH cleaning on NDMA and NMEA
rejection, and the rejections of sequentially cleaned membranes were similar to those of
CA cleaned membranes (Figure 6.9). The results reported here confirm the hypothesis
proposed by Simon et al. [162] indicating that the interactions between membrane
matrix and cleaning chemicals are reversible. Thus, the impact of caustic chemical
cleaning on membrane separation performance could be alleviated by a sequence of
caustic cleaning followed by acidic cleaning.
Figure 6.8: Permeability of the (a) TFC-HR and (b) ESPA2 membranes after being exposed to the NaOH solution or CA solution for 25 h at 30 ºC, and NaOH solution for 25 h at 30 ºC followed by CA solution for 25 h at 30 ºC. Membrane permeability was determined with Milli-Q water at 1,000 kPa and 20 °C feed temperature. Values reported here are the average and ranges of duplicate results.
NaO
H
CA
NaO
H +
CA
NaO
H
CA
NaO
H +
CA
0
2
4
6
8
(b) ESPA2
Perm
eabi
lity
[L/m
2hb
ar]
(a) TFC-HR

Chapter 6: Membrane exposure to chemical cleaning reagents
89
Figure 6.9: N-nitrosamine rejection of the virgin and chemical cleaned (a) TFC-HR and (b) ESPA2 membranes (20 mM NaCl, 1 mM NaHCO3, 1 mM CaCl2, permeate flux 20 L/m2h, cross flow velocity 40.2 cm/s, feed pH 8.0 ± 0.1, feed temperature 20.0 ± 0.1 °C). Values reported here are the average and ranges of duplicate results.
4 Conclusions
The effect of chemical cleaning on the rejection of N-nitrosamines by two RO
membranes was investigated at bench-scale using six different caustic and acidic
cleaning chemicals. Caustic chemical cleaning resulted in a considerable increase in the
membrane permeability and the impact was much more significant than that of acidic
cleaning. After exposure to caustic cleaning reagents, notable decrease in the rejection
of low molecular weight N-nitrosamines (i.e., NDMA and NMEA) was observed. The
rejection of larger molecular weight N-nitrosamines exhibited no discernible changes
after chemical cleaning. The sequence of caustic followed by acidic cleaning could
alleviate the impact of caustic chemical cleaning on permeability and N-nitrosamine
rejection despite the fact that the additional cleaning leads to an increase in operational
cost. This suggests that the impact of caustic cleaning on water permeation and
transport of small molecular weight solutes is reversible and is not permanent. Indeed,
FTIR analysis of the membrane surface before and after exposure to various chemical
cleaning reagents did not show any discernible changes in the bonding structure of the
polyamide skin layer.
60 80 100 120 140 1600
20
40
60
80
100
60 80 100 120 140 1600
20
40
60
80
100
(a) TFC-HR CA NaOH+CA NaOH
Molecular Weight [g/mol]
N-n
itros
am
ine
Rej
ectio
n [%
]
(b) ESPA2 CA NaOH+CA NaOH
Molecular Weight [g/mol]
N-n
itros
am
ine
Rej
ectio
n [%
]
ND
MA
NM
EA
NP
YR
ND
EA
NP
IPN
MO
R
ND
PA
ND
BA
ND
MA
NM
EA
NP
YR
ND
EA
NP
IPN
MO
R
ND
PA
ND
BA

Chapter 7: Effects of membrane characteristics
90
Chapter 7
Effects of membrane characteristics
This chapter has been published as:
T. Fujioka, S.J. Khan, J.A. McDonald, A. Roux, Y. Poussade, J.E. Drewes, L.D. Nghiem, N-nitrosamine rejection by nanofiltration and reverse osmosis membranes: The importance of membrane characteristics, Desalination, 316 (2013) 67-75.
1 Introduction
Although most LPRO membranes available to date are able to achieve NaCl rejection of
more than 99% under similar recovery and flux conditions [17], there are no specific
criteria for selecting LPRO membranes in terms of the rejection of trace organic
chemicals including N-nitrosamines. Several laboratory-scale studies have investigated
the rejection of N-nitrosamines by several LPRO membranes in pure water matrices and
reported NDMA rejections to be in the range of 45 – 70% and the rejection of the other
N-nitrosamines to be over 75% [38, 82, 150]. On the other hand, a recent laboratory-
scale study carried out by Fujioka et al. [163] demonstrated that LPRO membranes
specifically designed for boron removal (such as the ESPAB) may achieve as high as
80% NDMA rejection. These studies suggest that a considerable variation in the
rejection of N-nitrosamines exists amongst the LPRO membranes. Operating conditions
(such as feed pH, feed salt concentration, feed temperature and permeate flux) can
significantly influence the rejection of low molecular weight N-nitrosamines including
NDMA [38, 150]. Because the reported rejection values currently available in the
literature were obtained under different filtration conditions, it is unclear whether the
significant variation in the rejection of NDMA by LPRO membranes can also be
attributed to intrinsic differences in separation efficiency among the membranes.
The aim of this study was to evaluate the impact of membrane characteristics on N-
nitrosamine rejection. This investigation was carried out with eight NF and RO

Chapter 7: Effects of membrane characteristics
91
membranes, with a specific focus on LPRO membranes used for water reclamation
applications. The rejection of N-nitrosamines was further examined under various
permeate flux and feed temperatures to elucidate the impact of operating conditions on
the rejection of N-nitrosamines and the underlying rejection mechanisms.
2 Materials and methods
2.1 RO membranes
Properties of eight membranes are summarized in Table 3.1 (Chapter 3).
2.2 Chemicals
Eight N-nitrosamines with molecular weight in the range from 74 to 158 g/mol were
used in this study. Properties of these N-nitrosamines are summarized in Table 3.2
(Chapter 3).
2.3 Membrane filtration system
A laboratory-scale cross flow membrane filtration system was used (Figure 3.1).
Specification of the bench-scale filtration system is described in Chapter 3, Section 4.1.
2.4 Filtration experiments
Prior to the experiment, each membrane sample was rinsed with a few litres of Milli-Q
water to remove any water soluble preservatives on surface. Each filtration experiment
started with a compaction step where the membrane was compacted at 1,800 kPa for at
least 1 h using Milli-Q water feed. The cross-flow velocity was maintained at 0.42 m/s
during the experiment. Unless otherwise stated, the feed temperature was maintained at
20±0.1 °C. After the permeate flux stabilised, the feed pressure was adjusted to 1,000
kPa and pure water permeability was measured using the feed pressure. The feed
solution was then conditioned at 20 mM NaCl, 1mM CaCl2 and 1 mM NaHCO3 by
adding the stock solution of background electrolytes. A similar composition of
background electrolytes simulating treated wastewater effluent has been reported in
previous studies [38, 127]. The stock solution of N-nitrosamines was spiked into the
feed to make up an initial concentration of 250 ng/L of each target compound. The
system was then operated at 20 L/m2h permeate flux, which is typically used for water

Chapter 7: Effects of membrane characteristics
92
reclamation applications [122]. Following at least 1 h of operation, 200 mL of feed and
permeate samples were taken for analysis. Immediately following each sampling, the
surrogate stock solution was dosed into each feed and permeate sample to make up 50
ng/L of each N-nitrosamine surrogate. For the experiments using variable permeate flux,
the permeate fluxes was first set at 40 or 60 L/m2h and was stepwise decreased down to
5 L/m2h. Experiments with variable feed temperature started with low temperature (10
or 14 °C) and the feed temperature was stepwise increased up to 40 °C. In each
experiment, the filtration system was operated for at least 1 h prior to any samplings to
stabilise N-nitrosamine rejections. Conductivity and pH were both measured using an
Orion 4-Star Plus pH/conductivity meter (Thermo scientific, USA).
2.5 N-nitrosamine analytical methods
N-nitrosamine concentrations were analysed using an analytical method described in
Chapter 3, Section 5.1.
2.6 Transport model description
A numerous number of previous studies reported in the literature have been carried out
based on the irreversible thermodynamics model [164]. Kedem and Katchalsky
described water (Jv) and solute (Js) flux through an NF/RO membrane with the
following equations [129]:
PLJ pv (1)
vss CJCdx
dxPJ 1 (2)
where Lp is pure water permeability; ∆P is pressure difference between the feed and
permeate sides; σ is reflection coefficient; ∆π is osmotic pressure difference between the
feed and permeate sides; Ps is solute permeability coefficient; ∆x is membrane
thickness; x is position in a pore from inlet; and C is solute concentration. The reflection
coefficient (σ) represents the fraction of solute reflected by the membrane in convective
flow [130]. Equation 2 is integrated with boundary limits (x = 0, C = Cp and x = ∆x, C =
Cm) and is described with the following Spiegler-Kedem equations [131]:

Chapter 7: Effects of membrane characteristics
93
F
F
C
CR
m
preal
1
11 (3)
v
s
JP
F1
exp (4)
where Cp and Cm are permeate and membrane concentration, respectively. Because
solute concentration in the feed (Cb) can be obtained from experiments, the real
rejection (Rreal) is calculated using the observed rejection (Robs=1-Cp/Cb) as follows
[132]:
1exp1
exp
k
JR
k
JR
Rv
obs
vobs
real (5)
where k is mass transfer coefficient. The value of k is calculated by the Sherwood
number (Sh) using the following Grover equation [133]:
33.0
33.05.0Re664.0
L
dSc
D
kdSh hh (6)
where Reynolds number (Re) = (dhu/ν), Schmidt number (Sc) = (ν/D), dh = hydraulic
diameter, u = feed velocity, ν = kinetic viscosity and D = diffusion coefficient. Further
details of the calculation are also available elsewhere [150].
3 Results and discussion
3.1 N-nitrosamine rejection by NF/RO membranes
3.1.1 N-nitrosamine rejection
The rejection of low molecular weight N-nitrosamines (i.e. NDMA and NMEA) by the
eight NF/RO membranes used in this study varied significantly in the range from 8 –
82% and 23 – 94%, respectively (Figure 7.1). The type of membrane was less
significant for other N-nitrosamines with higher molecular weights. NDPA and NDBA,
which are the two largest N-nitrosamines selected in this study, were rejected by

Chapter 7: Effects of membrane characteristics
94
approximately 70% by the NF90 and over 90% by any of the RO membranes. A small
variation in the rejection of N-nitrosamines was observed among the four LPRO
membranes (i.e. ESPA2, LFC3, TFC-HR and 70LW) which have been widely used for
water reclamation applications. For example, NDMA rejection by these membranes
ranged from 37% to 52%. The variation was less apparent for NMEA (69-82%)
followed by NPYR (84-94%) and NDEA (86-95%), and was negligible for all the other
N-nitrosamines. The results reported here suggest that the rejections of N-nitrosamines
by LPRO membranes commonly used for water recycling applications under an
identical filtration condition may differ from one another by about 15% despite the
similarity in their nominal NaCl rejection values (Table 3.1). In other words, the
nominal salt rejection value specified by the manufacturers may be not an appropriate
criterion to accurately predict the rejection of low molecular weight N-nitrosamines by
LPRO membranes. It is noteworthy that a model aquatic solution was used in this study.
The presence of effluent organic matter in treated effluent can lead to membrane fouling,
which may exert a small influence on the rejection of N-nitrosamines and inorganic
salts by NF/RO membranes [163].

Chapter 7: Effects of membrane characteristics
95
Figure 7.1: N-nitrosamine rejection by NF/RO membranes (20 mM NaCl, 1 mM NaHCO3, 1 mM CaCl2, permeate flux 20 L/m2h, cross flow velocity 40.2 cm/s, feed pH 8.0 ± 0.1, feed temperature 20.0 ± 0.1 °C). Open bar indicates that the permeate concentration was below the instrumental detection limit. Error bars show the standard deviation of two replicate experiments.
NF
90
ES
PA
1
ES
PA
2
LFC
3
TF
C-H
R
70LW
ES
PA
B
SW
C5
0
20
40
60
80
100
ND
MA
Rej
ectio
n [%
]
NF
90
ES
PA
1
ES
PA
2
LFC
3
TF
C-H
R
70LW
ES
PA
B
SW
C5
0
20
40
60
80
100
NM
EA
Rej
ectio
n [%
]
NF
90
ES
PA
1
ES
PA
2
LFC
3
TF
C-H
R
70LW
ES
PA
B
SW
C5
0
20
40
60
80
100
NP
YR
Rej
ectio
n [%
]
NF
90
ES
PA
1
ES
PA
2
LFC
3
TF
C-H
R
70LW
ES
PA
B
SW
C5
0
20
40
60
80
100
ND
EA
Rej
ectio
n [%
]
NF
90
ES
PA
1
ES
PA
2
LFC
3
TF
C-H
R
70LW
ES
PA
B
SW
C5
0
20
40
60
80
100
NP
IP R
ejec
tion
[%]
NF
90
ES
PA
1
ES
PA
2
LFC
3
TF
C-H
R
70LW
ES
PA
B
SW
C5
0
20
40
60
80
100
NM
OR
Re
ject
ion
[%]
NF
90
ES
PA
1
ES
PA
2
LFC
3
TF
C-H
R
70LW
ES
PA
B
SW
C5
0
20
40
60
80
100
ND
PA
Rej
ectio
n [%
]
NF
90
ES
PA
1
ES
PA
2
LFC
3
TF
C-H
R
70LW
ES
PA
B
SW
C5
0
20
40
60
80
100
ND
BA
Rej
ectio
n [%
]
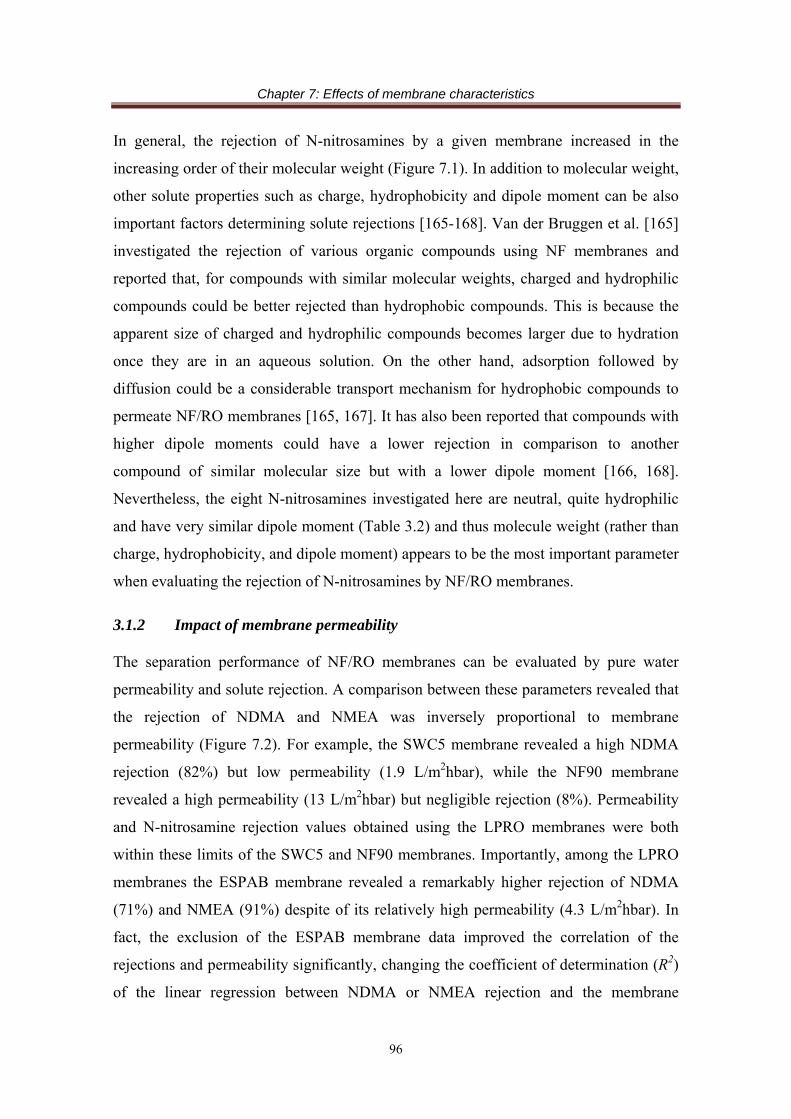
Chapter 7: Effects of membrane characteristics
96
In general, the rejection of N-nitrosamines by a given membrane increased in the
increasing order of their molecular weight (Figure 7.1). In addition to molecular weight,
other solute properties such as charge, hydrophobicity and dipole moment can be also
important factors determining solute rejections [165-168]. Van der Bruggen et al. [165]
investigated the rejection of various organic compounds using NF membranes and
reported that, for compounds with similar molecular weights, charged and hydrophilic
compounds could be better rejected than hydrophobic compounds. This is because the
apparent size of charged and hydrophilic compounds becomes larger due to hydration
once they are in an aqueous solution. On the other hand, adsorption followed by
diffusion could be a considerable transport mechanism for hydrophobic compounds to
permeate NF/RO membranes [165, 167]. It has also been reported that compounds with
higher dipole moments could have a lower rejection in comparison to another
compound of similar molecular size but with a lower dipole moment [166, 168].
Nevertheless, the eight N-nitrosamines investigated here are neutral, quite hydrophilic
and have very similar dipole moment (Table 3.2) and thus molecule weight (rather than
charge, hydrophobicity, and dipole moment) appears to be the most important parameter
when evaluating the rejection of N-nitrosamines by NF/RO membranes.
3.1.2 Impact of membrane permeability
The separation performance of NF/RO membranes can be evaluated by pure water
permeability and solute rejection. A comparison between these parameters revealed that
the rejection of NDMA and NMEA was inversely proportional to membrane
permeability (Figure 7.2). For example, the SWC5 membrane revealed a high NDMA
rejection (82%) but low permeability (1.9 L/m2hbar), while the NF90 membrane
revealed a high permeability (13 L/m2hbar) but negligible rejection (8%). Permeability
and N-nitrosamine rejection values obtained using the LPRO membranes were both
within these limits of the SWC5 and NF90 membranes. Importantly, among the LPRO
membranes the ESPAB membrane revealed a remarkably higher rejection of NDMA
(71%) and NMEA (91%) despite of its relatively high permeability (4.3 L/m2hbar). In
fact, the exclusion of the ESPAB membrane data improved the correlation of the
rejections and permeability significantly, changing the coefficient of determination (R2)
of the linear regression between NDMA or NMEA rejection and the membrane

Chapter 7: Effects of membrane characteristics
97
permeability from 0.61 to 0.70 and from 0.86 to 0.95, respectively. The underlying
reason for this notably better performance of the ESPAB with respect to NDMA and
NMEA rejection observed here is currently unknown and is the subject for a future
study.
In the surface force-pore flow model, membrane permeability (Lp) increases with
increasing membrane pore size (rp) and with decreasing the thickness of the membrane
active layer (∆x) as described with the Hagen-Poiseuille equation [92, 169].
(7)
where Ak is membrane porosity; and µ is viscosity of water. Because the changes in
membrane pore size and the thickness of the membrane active layer also affect solute
rejection [92], it can be hypothesized that the variation in NDMA and NMEA rejection
by these NF/RO membranes is associated with the difference in the properties (i.e. rp
and ∆x) of these membranes.
Figure 7.2: Rejection of NDMA and NMEA by NF/RO membranes as a function of pure water permeability. Experimental conditions are as described in Figure 7.1.
3.2 Effects of filtration conditions
3.2.1 Permeate flux
In general, solute rejection increases when water permeate flux increases, because water
flux increases with applied feed pressure while the applied pressure has only a
negligible impact on solute flux [96]. As expected, an increase in permeate flux led to
x
ArL kp
p
8
2
0 4 8 12 160
20
40
60
80
100
0 4 8 12 160
20
40
60
80
100
ESPAB
TFC-HR
ESPA2
70LW
LFC3
ESPA1
NF90
SWC5
ESPAB
TFC-HRESPA2
70LW
LFC3
ESPA1
SWC5
NF90
(b) NMEA(a) NDMA
R2 = 0.86
SWROLPRONF
SWROLPRONF
ND
MA
Rej
ectio
n [%
]
Pure Water Permeability [L/m2hbar]
R2 = 0.61
NM
EA
Rej
ectio
n [%
]
Pure Water Permeability [L/m2hbar]
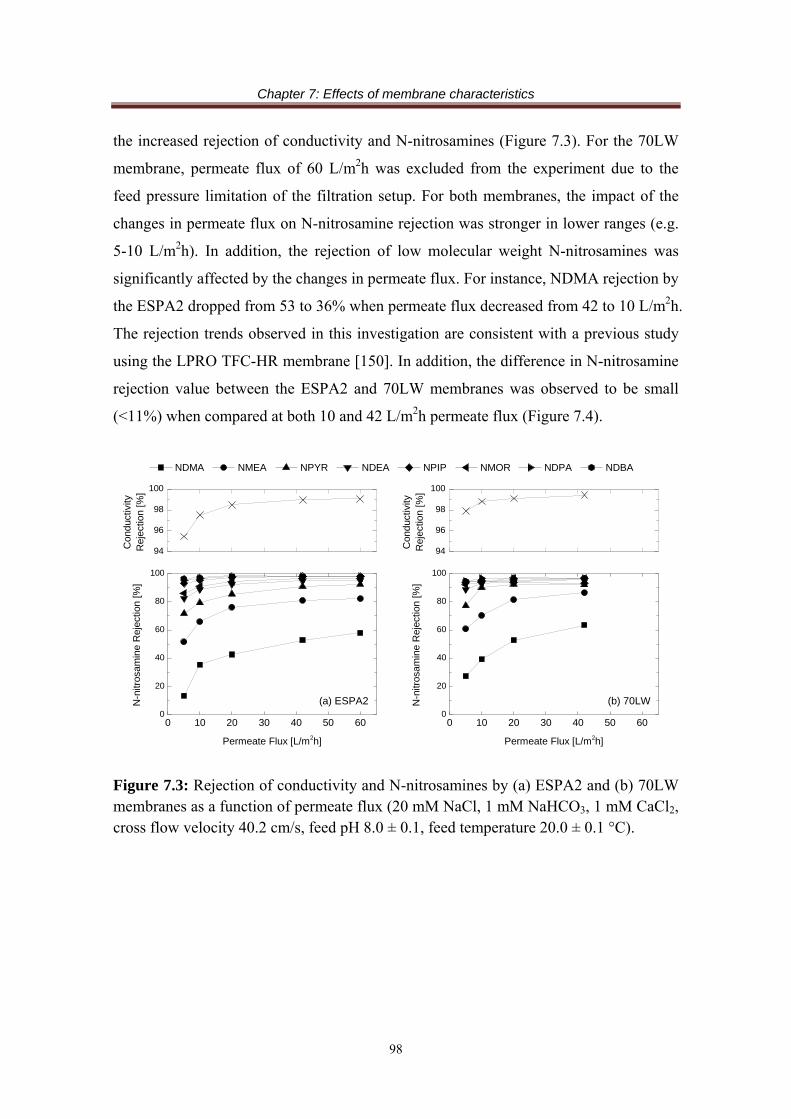
Chapter 7: Effects of membrane characteristics
98
the increased rejection of conductivity and N-nitrosamines (Figure 7.3). For the 70LW
membrane, permeate flux of 60 L/m2h was excluded from the experiment due to the
feed pressure limitation of the filtration setup. For both membranes, the impact of the
changes in permeate flux on N-nitrosamine rejection was stronger in lower ranges (e.g.
5-10 L/m2h). In addition, the rejection of low molecular weight N-nitrosamines was
significantly affected by the changes in permeate flux. For instance, NDMA rejection by
the ESPA2 dropped from 53 to 36% when permeate flux decreased from 42 to 10 L/m2h.
The rejection trends observed in this investigation are consistent with a previous study
using the LPRO TFC-HR membrane [150]. In addition, the difference in N-nitrosamine
rejection value between the ESPA2 and 70LW membranes was observed to be small
(<11%) when compared at both 10 and 42 L/m2h permeate flux (Figure 7.4).
Figure 7.3: Rejection of conductivity and N-nitrosamines by (a) ESPA2 and (b) 70LW membranes as a function of permeate flux (20 mM NaCl, 1 mM NaHCO3, 1 mM CaCl2, cross flow velocity 40.2 cm/s, feed pH 8.0 ± 0.1, feed temperature 20.0 ± 0.1 °C).
94
96
98
100
Con
duct
ivity
Rej
ectio
n [%
]
94
96
98
100
Con
duct
ivity
Rej
ectio
n [%
]
0 10 20 30 40 50 600
20
40
60
80
100
(b) 70LW
NDMA NMEA NPYR NDEA NPIP NMOR NDPA NDBA
N-n
itros
amin
e R
ejec
tion
[%]
Permeate Flux [L/m2h]
(a) ESPA2
0 10 20 30 40 50 600
20
40
60
80
100
N-n
itros
amin
e R
ejec
tion
[%]
Permeate Flux [L/m2h]
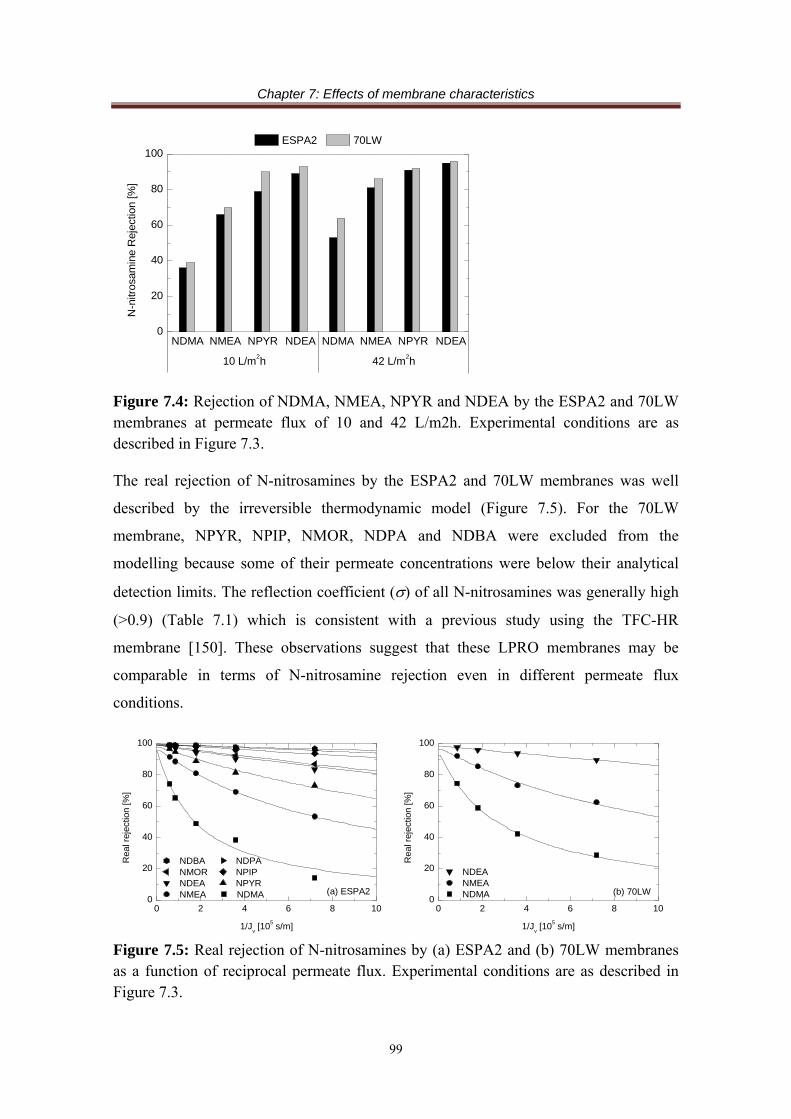
Chapter 7: Effects of membrane characteristics
99
Figure 7.4: Rejection of NDMA, NMEA, NPYR and NDEA by the ESPA2 and 70LW membranes at permeate flux of 10 and 42 L/m2h. Experimental conditions are as described in Figure 7.3.
The real rejection of N-nitrosamines by the ESPA2 and 70LW membranes was well
described by the irreversible thermodynamic model (Figure 7.5). For the 70LW
membrane, NPYR, NPIP, NMOR, NDPA and NDBA were excluded from the
modelling because some of their permeate concentrations were below their analytical
detection limits. The reflection coefficient () of all N-nitrosamines was generally high
(>0.9) (Table 7.1) which is consistent with a previous study using the TFC-HR
membrane [150]. These observations suggest that these LPRO membranes may be
comparable in terms of N-nitrosamine rejection even in different permeate flux
conditions.
Figure 7.5: Real rejection of N-nitrosamines by (a) ESPA2 and (b) 70LW membranes as a function of reciprocal permeate flux. Experimental conditions are as described in Figure 7.3.
NDMA NMEA NPYR NDEA NDMA NMEA NPYR NDEA0
20
40
60
80
100
10 L/m2h 42 L/m2h
N
-nitr
osam
ine
Rej
ectio
n [%
] ESPA2 70LW
0 2 4 6 8 100
20
40
60
80
100
0 2 4 6 8 100
20
40
60
80
100
NDBA NDPA NMOR NPIP NDEA NPYR NMEA NDMA (b) 70LW
Rea
l rej
ectio
n [%
]
1/Jv [105 s/m]
(a) ESPA2
NDEA NMEA NDMA
Rea
l rej
ectio
n [%
]
1/Jv [105 s/m]

Chapter 7: Effects of membrane characteristics
100
Table 7.1: Transport parameters of N-nitrosamines through the ESPA2, 70LW and TFC-HR [150] membranes.
N-nitrosamine k [m/s] σ [-] P [m/s]
ESPA2 70LW TFC-HR ESPA2 70LW TFC-HR NDMA 2.26×10⁻⁵ 0.953 0.926 0.949 5.35×10⁻⁶ 3.32×10⁻⁶ 4.15×10⁻⁶
NMEA 1.99×10⁻⁵ 0.958 0.963 0.968 1.14×10⁻⁶ 8.24×10⁻⁷ 1.07×10⁻⁶
NPYR 1.99×10⁻⁵ 0.973 - 0.989 5.12×10⁻⁷ - 6.74×10⁻⁷
NDEA 1.99×10⁻⁵ 0.985 0.978 0.998 2.26×10⁻⁷ 1.47×10⁻⁷ 2.49×10⁻⁷
NPIP 2.09×10⁻⁵ 0.993 - - 9.25×10⁻⁸ - -
NMOR 2.18×10⁻⁵ 0.991 - 0.988 2.06×10⁻⁷ - 1.99×10⁻⁷
NDPA 2.02×10⁻⁵ 0.992 - - 6.02×10⁻⁸ - -
NDBA 1.99×10⁻⁵ 0.990 - 0.983 4.33×10⁻⁸ - 1.01×10⁻⁷
3.2.2 Feed temperature
An increase in feed temperature resulted in the decreased rejection of conductivity and
N-nitrosamines (Figure 7.6). For example, an increase in the feed temperature from 20
to 40 °C led to a decrease in NDMA rejection by the ESPA2 and 70LW membrane from
41 to 15% and from 52 to 22%, respectively. In response to the feed temperature
increase, NMEA and NPYR rejections also dropped significantly. The impact of feed
temperature was less pronounced with increasing their molecular weight, and the
rejection of high molecular weight N-nitrosamines (i.e. NDPA and NDBA) equally
remained almost constant and high (>94%) within the ranges of feed temperature tested
here (Figure 7.6). When feed temperature increases, the pore size within an active skin
layer of membranes can enlarge slightly [111] and the permeability coefficient of
solutes also increases [130, 132], both of which cause more solute passage through
membranes. Thus, these combination effects may have decreased the rejection of N-
nitrosamines against the increase in feed temperature. Between the two LPRO
membranes, the difference in the rejection vales of NDMA, NMEA, NPYR and NDEA
was always less than 13% at the feed temperature of both 20 and 40 °C (Figure 7.7).
The observations reported here indicate that the impact of feed temperature on the
rejection of N-nitrosamines is similar among the LPRO membranes tested.

Chapter 7: Effects of membrane characteristics
101
Figure 7.6: Effects of feed temperature on the feed pressure and the rejection of conductivity and N-nitrosamines by (a) ESPA2 and (b) 70LW membranes (20 mM NaCl, 1 mM NaHCO3, 1 mM CaCl2, permeate flux 20 L/m2h, cross flow velocity 40.2 cm/s, feed pH 8.0 ± 0.1, feed temperature 20.0 ± 0.1 °C).
Figure 7.7: Rejection of NDMA, NMEA, NPYR and NDEA by the ESPA2 and 70LW membranes at feed temperature of 20 and 40 °C. Experimental conditions are as described in Figure 7.6.
0.0
0.3
0.6
0.9
1.2
Fe
ed P
ress
ure
[MP
a]
0.0
0.3
0.6
0.9
1.2
Feed
Pre
ssur
e[M
Pa]
94
96
98
100
Co
ndu
ctiv
ityR
ejec
tion
[%]
94
96
98
100
Co
ndu
ctiv
ityR
ejec
tion
[%]
10 20 30 400
20
40
60
80
100
(b) 70LW
NDMA NMEA NPYR NDEA NPIP NMOR NDPA NDBA
N-n
itros
amin
e R
ejec
tion
[%]
Temperature [°C]
(a) ESPA2
10 20 30 400
20
40
60
80
100
N-n
itros
amin
e R
ejec
tion
[%]
Temperature [°C]
NDMA NMEA NPYR NDEA NDMA NMEA NPYR NDEA0
20
40
60
80
100
20 °C 40 °C
N-n
itros
am
ine
Re
ject
ion
[%]
ESPA2 70LW

Chapter 7: Effects of membrane characteristics
102
4 Conclusions
The rejection of NDMA by NF/RO membranes varied significantly in the range of 8-
82% depending on the membrane and operating conditions. The impact of membrane
characteristics was less apparent for higher molecular weight N-nitrosamines and the
rejection of NPYR, NMOR, NDPA and NDBA were over 90% by any of the tested RO
membranes. Using these NF/RO membranes, a correlation was found between
membrane permeability and the rejection of low molecular weight N-nitrosamines (i.e.
NDMA and NMEA). The variation in NDMA and NMEA rejections among the LPRO
membranes frequently used for water reclamation applications (i.e. ESPA2, LFC3,
TFC-HR and 70LW) was relatively small, at 37-52% and 69-82%, respectively.
However, a high rejection of NDMA (71%) and NMEA (91%) was obtained with the
ESPAB membrane which is also an LPRO membrane but is specifically designed for
the removal of boron. Results reported here suggest the potential of using boron
removal LPRO membranes (i.e. ESPAB) for wastewater recycling applications where
NDMA concentration in the final water is a critical parameter under water quality
regulations. Similar rejection behaviours of N-nitrosamines were obtained with two
different LPRO membranes (i.e. ESPA2 and 70LW) when compared with variable
permeate flux and feed temperature conditions. In particular, the rejection of low
molecular weight N-nitrosamines such as NDMA and NMEA decreased significantly
when the permeate flux decreased or the feed temperature increased. In practice, some
variations in permeate flux and temperature are inevitable. Thus, the impact of permeate
flux and solute temperature on the rejection of N-nitrosamines reported here has an
important implication to full-scale operation of NF/RO systems for water reclamation
applications. Results reported here also suggest that membrane properties associated
with membrane permeability such as the pore size and thickness of the active skin layer
might determine N-nitrosamine rejection.

Chapter 8: Role of free volume hole-space of RO membranes
103
Chapter 8
Role of free-volume hole-space of RO membranes
This chapter has been published as:
T. Fujioka, N. Oshima, R. Suzuki, S.J. Khan, J.A. McDonald, A. Roux, Y. Poussade, J.E. Drewes, L.D. Nghiem, Rejection of small and uncharged chemicals of emerging concern by reverse osmosis membranes: The role of free volume space within the active skin layer, Separation Purification Technology, 116 (2013) 426-432..
1 Introduction
The rejection of solutes through the active skin layer of RO thin-film composite
membranes is usually described using indirect molecular transport measures such as salt
rejections [3]. This simplification is due to the unavailability of any techniques for
directly analysing the free-volume distribution of these membranes in the past. Recently,
positron annihilation lifetime spectroscopy (PALS) has been successfully applied to
quantify free-volume hole-radii within the active skin layers of NF/RO membranes [94,
95, 170-174]. In a pioneering study, Kim et al. [95] applied the PALS technique to
several surface-modified RO membranes and reported that permeability increased with
increasing free-volume hole-radius of the active skin layer. Another recent PALS study
by Chen et al. [94] also revealed that the rejection of several uncharged compounds (i.e.,
urea, ethylene glycol, and 1- or 2-propanol) by NF/RO membranes increased with
decreasing free-volume hole-radii. To the best of our knowledge, to date, no studies
have applied PALS to examine the impact of free-volume hole-size on the rejection of
water contaminants of significant health and environmental concern such as N-
nitrosamines and boron.
The aim of this study was to provide an understanding of uncharged solute transport
through nanoscale free-volume structure within RO membranes. A PALS technique
with a slow positron beam was used to analyse the free-volume hole-radii within the
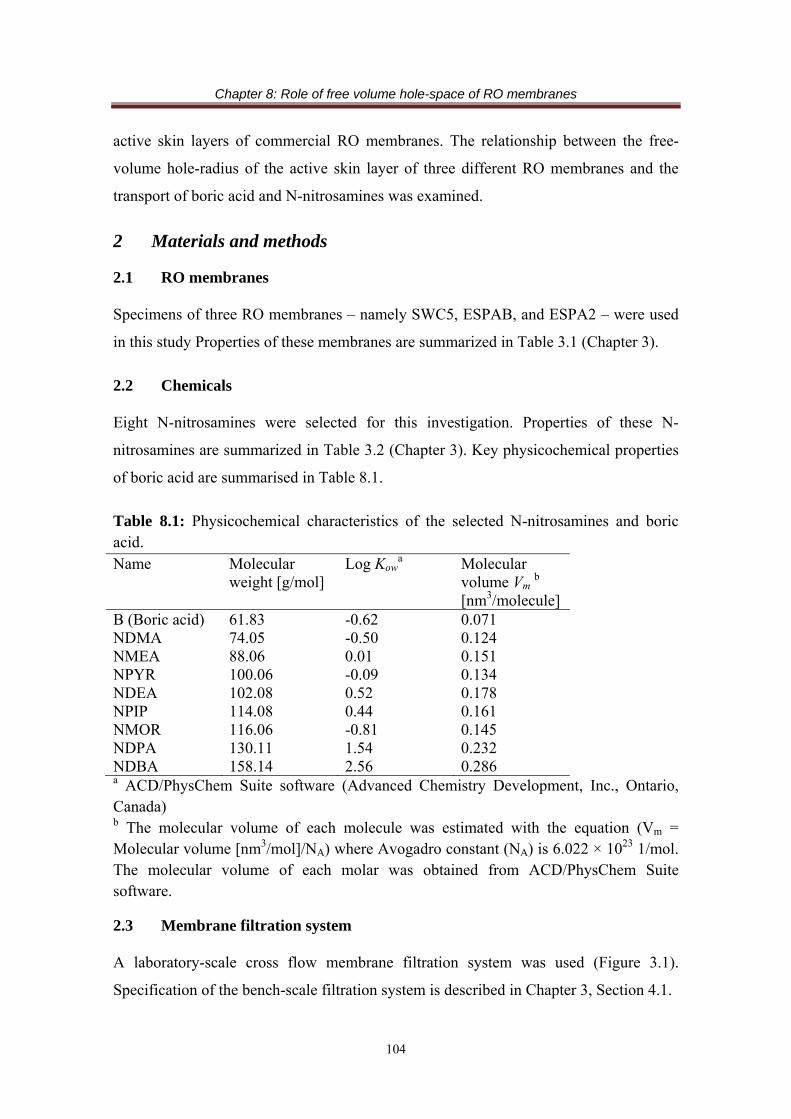
Chapter 8: Role of free volume hole-space of RO membranes
104
active skin layers of commercial RO membranes. The relationship between the free-
volume hole-radius of the active skin layer of three different RO membranes and the
transport of boric acid and N-nitrosamines was examined.
2 Materials and methods
2.1 RO membranes
Specimens of three RO membranes – namely SWC5, ESPAB, and ESPA2 – were used
in this study Properties of these membranes are summarized in Table 3.1 (Chapter 3).
2.2 Chemicals
Eight N-nitrosamines were selected for this investigation. Properties of these N-
nitrosamines are summarized in Table 3.2 (Chapter 3). Key physicochemical properties
of boric acid are summarised in Table 8.1.
Table 8.1: Physicochemical characteristics of the selected N-nitrosamines and boric acid. Name Molecular
weight [g/mol] Log Kow
a Molecular volume Vm b [nm3/molecule]
B (Boric acid) 61.83 -0.62 0.071 NDMA 74.05 -0.50 0.124 NMEA 88.06 0.01 0.151 NPYR 100.06 -0.09 0.134 NDEA 102.08 0.52 0.178 NPIP 114.08 0.44 0.161 NMOR 116.06 -0.81 0.145 NDPA 130.11 1.54 0.232 NDBA 158.14 2.56 0.286 a ACD/PhysChem Suite software (Advanced Chemistry Development, Inc., Ontario, Canada) b The molecular volume of each molecule was estimated with the equation (Vm = Molecular volume [nm3/mol]/NA) where Avogadro constant (NA) is 6.022 × 10²³ 1/mol. The molecular volume of each molar was obtained from ACD/PhysChem Suite software.
2.3 Membrane filtration system
A laboratory-scale cross flow membrane filtration system was used (Figure 3.1).
Specification of the bench-scale filtration system is described in Chapter 3, Section 4.1.

Chapter 8: Role of free volume hole-space of RO membranes
105
2.4 Experimental protocols
Prior to each filtration experiment, the membrane sample was compacted at 1,800 kPa
using Milli-Q water until permeate flux has been stabilised. The cross flow velocity and
solution temperature were 0.42 m/s and 20±0.1 °C, respectively. Following the
compaction step, the feed water solution was conditioned at 20 mM NaCl, 1mM CaCl2
and 1 mM NaHCO3 by adding appropriate volumes of the stock solutions of each
background electrolyte. The stock solutions of N-nitrosamines and boric acid were also
introduced into the feed to obtain approximately 250 ng/L of each N-nitrosamine and
1.0 mg/L of boron. Thereafter, the permeate flux was adjusted with 20 L/m2h. The
system was continuously operated for 2 h before the first permeate and concentrate
samples were taken for analysis.
2.5 Analytical technique
2.5.1 PALS
The free-volume hole-radii of the RO membranes were analysed using a PALS
technique with a pulsed slow positron beam at the National Institute of Advanced
Industrial Science and Technology (AIST) in Tsukuba, Japan [175]. Details of this
PALS analysis are available elsewhere [94, 176, 177]. In brief, the PALS technique
with a slow positron beam is capable of measuring free-volume hole-radius within a
sub-nanometer range within the membrane active skin layer [94]. In principal, when
positrons are injected into a solid sample, the positrons annihilate with electrons of the
solid sample and emit gamma-rays. Application of PALS relies on the fact that some
positrons combine with an electron to form the hydrogen-like bound state, positronium
(Ps). The intrinsic lifetimes of spin-antiparallel para-positronium (p-Ps) and spin-
parallel ortho-positronium (o-Ps) in vacuum are 0.125 ns and 142 ns, respectively. In a
polymer sample, a typical positron lifetime spectrum of a polymer contains three
exponentially decaying components, due to the intrinsic p-Ps, free positron (non-Ps) and
o-Ps annihilation. Although o-Ps annihilates with a lifetime much shorter than 142 ns in
a polymer sample, o-Ps still survives far longer than the p-Ps and free positrons which
indicates that o-Ps is the longest lifetime component.

Chapter 8: Role of free volume hole-space of RO membranes
106
Lifetime of o-Ps (τo-Ps) is affected by the free volume size in insulating materials
including polymer and their relationship is given by the Tao-Eldrup model as follows
[178, 179]
1
166.0
2sin
2
1
166.015.0
r
r
r
rPso
(1)
where r (≤1 nm) is the radius of the free volume hole approximated as a spherical shape.
Consequently, the free-volume hole-space (Vf) can be calculated with the following
formula.
3
3
4rVf (2)
It should be noted that the evaluated r (calculated by Eq. 1) represents the mean radius
of free-volume holes which were probed by o-Ps. Although this indicates that the PALS
technique is expected to have a limited range for evaluating the size of free-volume hole
[176, 177], the mean free-volume hole-radius based on the PALS technique was
referred simply as “mean free-volume hole-radius” in this study.
Positron lifetime was measured as the time difference between the pulsing trigger from
the beam pulsing system and the detection timing of annihilation gamma-ray detected
by a BaF2 scintillation detector [175] (Figure 8.1). The analysis was carried out under
vacuum at 10-5 Pa. The mean implantation depth of positrons was adjusted by changing
positron incident energy of the slow positron beam. During the PALS analysis in this
study, positron incident energy was set at 1.0 keV which corresponds to a mean depth of
around 40 nm. This energy (1 keV) and corresponding implantation depth (~ 40nm) of
slow positron was decided reasonably for our sample evaluation based on previous
investigations. For example, previous studies investigated the mean free-volume hole-
radius in variable implantation depths using composite polyamide RO membranes and
reported that smallest mean free-volume hole-radii were found at mean implantation
depth of 40-100 nm [94, 180] where the active skin layer is expected to exist. In fact, for
LPRO and SWRO membranes the total thickness of about 200 nm active skin layers has
been estimated with transmission electron microscopy by Freger et al. [181].

Chapter 8: Role of free volume hole-space of RO membranes
107
Approximate 2 × 10⁶ events of positron annihilation were collected to obtain one
positron lifetime spectrum for each sample. The positron lifetime spectra were analysed
assuming three exponential components to deduce the lifetime, τo-Ps, using a non-linear
least-squares fitting program. The relative measurement uncertainty of τo-Ps was
evaluated not more than 5%.
Figure 8.1: Schematic diagram of the PALS analysis.
2.5.2 N-nitrosamine analysis
N-nitrosamine concentrations were analysed using an analytical method described in
Chapter 3, Section 5.1.
2.5.3 General analytical techniques
Basic analytical techniques are described in Chapter 3, Section 5.2.
3 Results and discussion
3.1 PALS analysis
The o-Ps lifetime (τo-Ps) of the LPRO membranes (i.e. ESPA2 and ESPAB) obtained
here were almost identical (τo-Ps = 2.07 ns) and, as a result, these two membranes were
determined to have the same mean free-volume hole-radii (r) of 0.289 nm (Table 8.2).
The o-Ps lifetime (τo-Ps) of the SWC5 membrane was 1.75 ns and the corresponding
mean free-volume hole-radius (r) was determined to be 0.259 nm. In good agreement
Sample
BaF2 scintillation detector
Pulsing system
Pulsed e+ beam (1 keV)
Annihilation ‐ray
Timer
Stop timing signal
Start timing signal

Chapter 8: Role of free volume hole-space of RO membranes
108
with our results, Lee et al. [174] used the PALS technique and obtained a mean free-
volume hole-radius of 0.278 nm for the SW30 which is commonly used as seawater RO
membrane. Pure water permeability was generally membrane dependent and increased
in the order of the SWC5, ESPAB and ESPA2 membranes and sodium ion rejection
decreased following the same order (Table 8.2).
Although the mean free-volume hole-radii of the ESPA2 and ESPAB probed by o-Ps
are both 0.289 nm, a notable variation was found for their pure water permeability and
sodium ion rejections (Table 8.2). In general, pure water permeability of RO
membranes increases and solute rejection decreases with increasing mean free-volume
hole-radius (r) and with decreasing the effective thickness of the membrane active skin
layer [92], thus these two parameters (i.e, mean hole-radius and effective thickness) are
likely to be key factors differentiating permeability and solute rejections among these
membranes. Although not reported in this study, it is noteworthy that the distribution of
the free-volume hole-radii may also play a role in permeability and solute rejection.
Freger [181] measured the membrane thickness of LPRO and SWRO membranes by
transmission electron microscopy and reported that the LPRO membrane have thinner
active skin layer than the SWRO membrane, which is consistent with the fact that it is
an SWRO membrane with lower permeability and higher sodium ion rejection than the
ESPA2 and ESPAB membranes (Table 8.2). In addition, Prakash et al. [182] reported a
strong correlation between the effective thickness of active skin layer and pure water
permeability of RO membranes. It is also noteworthy that the ESPAB is likely to be a
modified version of the ESPA2 (which may explain the same calculated free-volume
hole-radii of these two membranes). The details of this modification are proprietary
information of the manufacturer. However, it can be speculated that the lower pure
water permeability and higher sodium ion rejection of the ESPAB compared to the
ESPA2 is attributed to a thicker active layer thickness and different free-volume hole-
radius distribution of the ESPAB. Although it is beyond the scope of this study,
measurement of the active layer thickness and distribution of free-volume hole-radius
within the active skin layer would be useful to substantiate this hypothesis.
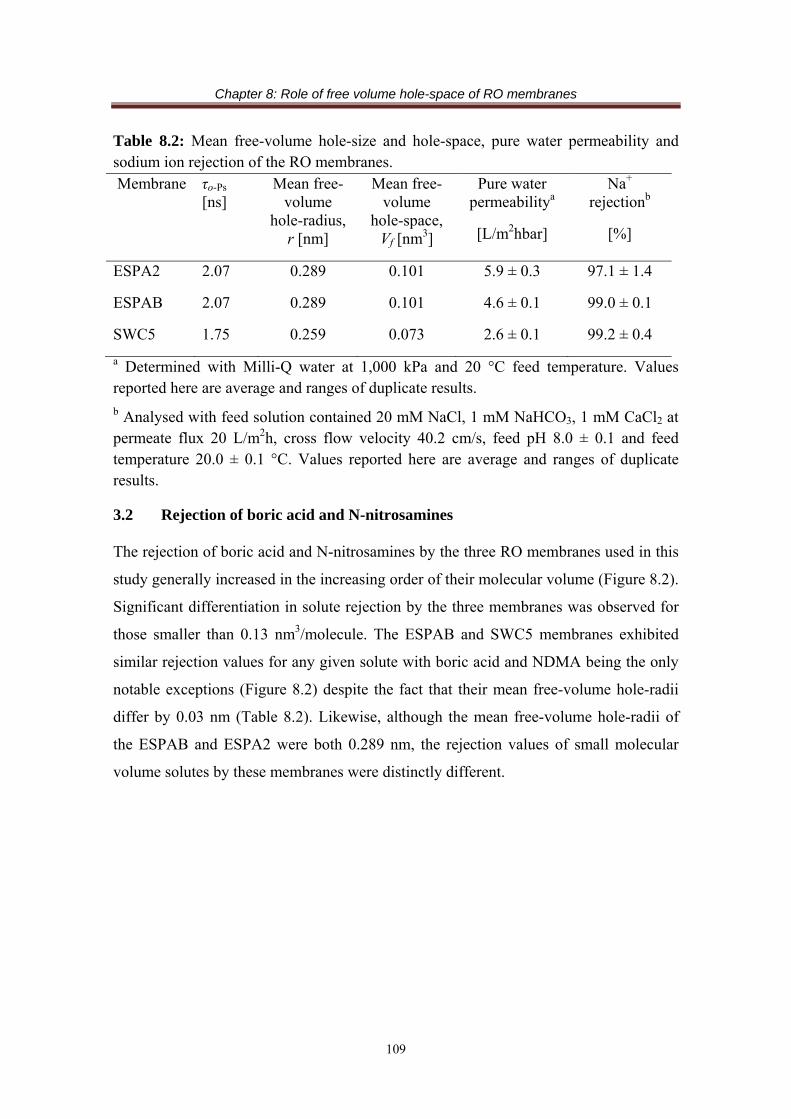
Chapter 8: Role of free volume hole-space of RO membranes
109
Table 8.2: Mean free-volume hole-size and hole-space, pure water permeability and sodium ion rejection of the RO membranes. Membrane τo-Ps
[ns] Mean free-
volume hole-radius,
r [nm]
Mean free-volume
hole-space, Vf [nm3]
Pure water permeabilitya
[L/m2hbar]
Na+ rejectionb
[%]
ESPA2 2.07 0.289 0.101 5.9 ± 0.3 97.1 ± 1.4
ESPAB 2.07 0.289 0.101 4.6 ± 0.1 99.0 ± 0.1
SWC5 1.75 0.259 0.073 2.6 ± 0.1 99.2 ± 0.4
a Determined with Milli-Q water at 1,000 kPa and 20 °C feed temperature. Values reported here are average and ranges of duplicate results. b Analysed with feed solution contained 20 mM NaCl, 1 mM NaHCO3, 1 mM CaCl2 at permeate flux 20 L/m2h, cross flow velocity 40.2 cm/s, feed pH 8.0 ± 0.1 and feed temperature 20.0 ± 0.1 °C. Values reported here are average and ranges of duplicate results.
3.2 Rejection of boric acid and N-nitrosamines
The rejection of boric acid and N-nitrosamines by the three RO membranes used in this
study generally increased in the increasing order of their molecular volume (Figure 8.2).
Significant differentiation in solute rejection by the three membranes was observed for
those smaller than 0.13 nm3/molecule. The ESPAB and SWC5 membranes exhibited
similar rejection values for any given solute with boric acid and NDMA being the only
notable exceptions (Figure 8.2) despite the fact that their mean free-volume hole-radii
differ by 0.03 nm (Table 8.2). Likewise, although the mean free-volume hole-radii of
the ESPAB and ESPA2 were both 0.289 nm, the rejection values of small molecular
volume solutes by these membranes were distinctly different.
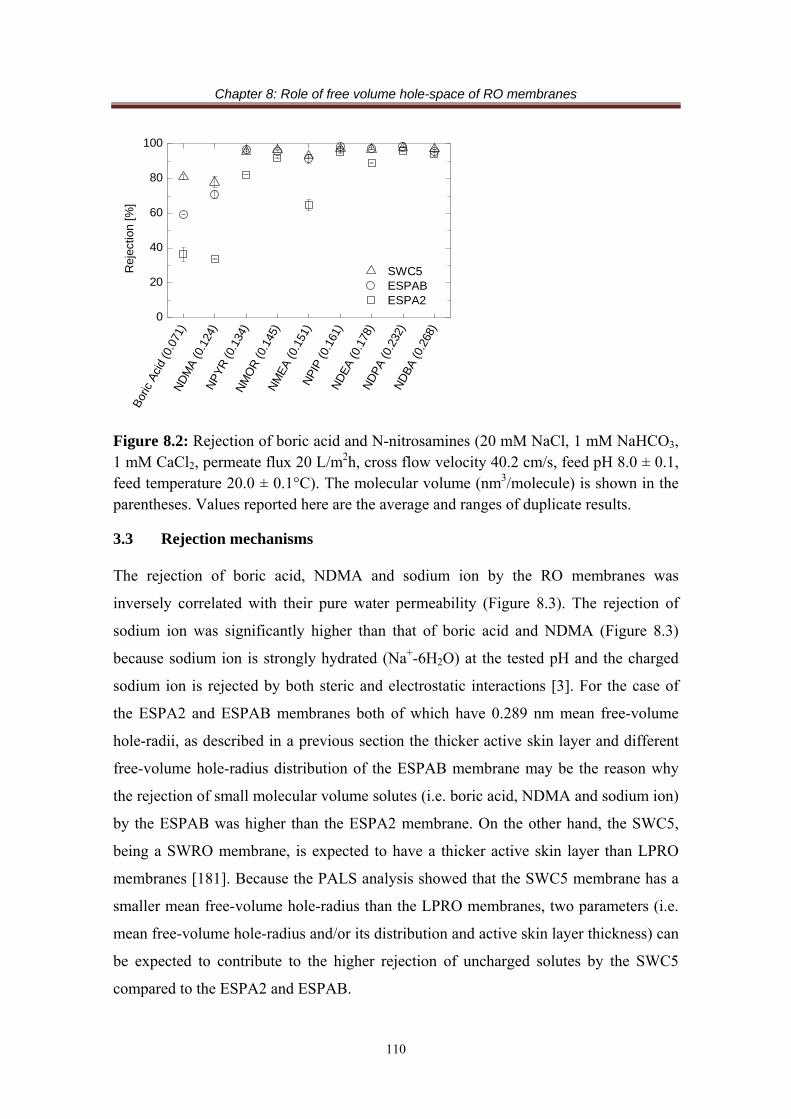
Chapter 8: Role of free volume hole-space of RO membranes
110
Figure 8.2: Rejection of boric acid and N-nitrosamines (20 mM NaCl, 1 mM NaHCO3, 1 mM CaCl2, permeate flux 20 L/m2h, cross flow velocity 40.2 cm/s, feed pH 8.0 ± 0.1, feed temperature 20.0 ± 0.1°C). The molecular volume (nm3/molecule) is shown in the parentheses. Values reported here are the average and ranges of duplicate results.
3.3 Rejection mechanisms
The rejection of boric acid, NDMA and sodium ion by the RO membranes was
inversely correlated with their pure water permeability (Figure 8.3). The rejection of
sodium ion was significantly higher than that of boric acid and NDMA (Figure 8.3)
because sodium ion is strongly hydrated (Na+-6H2O) at the tested pH and the charged
sodium ion is rejected by both steric and electrostatic interactions [3]. For the case of
the ESPA2 and ESPAB membranes both of which have 0.289 nm mean free-volume
hole-radii, as described in a previous section the thicker active skin layer and different
free-volume hole-radius distribution of the ESPAB membrane may be the reason why
the rejection of small molecular volume solutes (i.e. boric acid, NDMA and sodium ion)
by the ESPAB was higher than the ESPA2 membrane. On the other hand, the SWC5,
being a SWRO membrane, is expected to have a thicker active skin layer than LPRO
membranes [181]. Because the PALS analysis showed that the SWC5 membrane has a
smaller mean free-volume hole-radius than the LPRO membranes, two parameters (i.e.
mean free-volume hole-radius and/or its distribution and active skin layer thickness) can
be expected to contribute to the higher rejection of uncharged solutes by the SWC5
compared to the ESPA2 and ESPAB.
Bor
ic A
cid
(0.0
71)
ND
MA
(0.1
24)
NP
YR
(0.1
34)
NM
OR
(0.1
45)
NM
EA
(0.1
51)
NP
IP (0
.161
)N
DE
A (0
.178
)N
DP
A (0
.232
)N
DB
A (0
.268
)
0
20
40
60
80
100
SWC5 ESPAB ESPA2
Rej
ectio
n [%
]
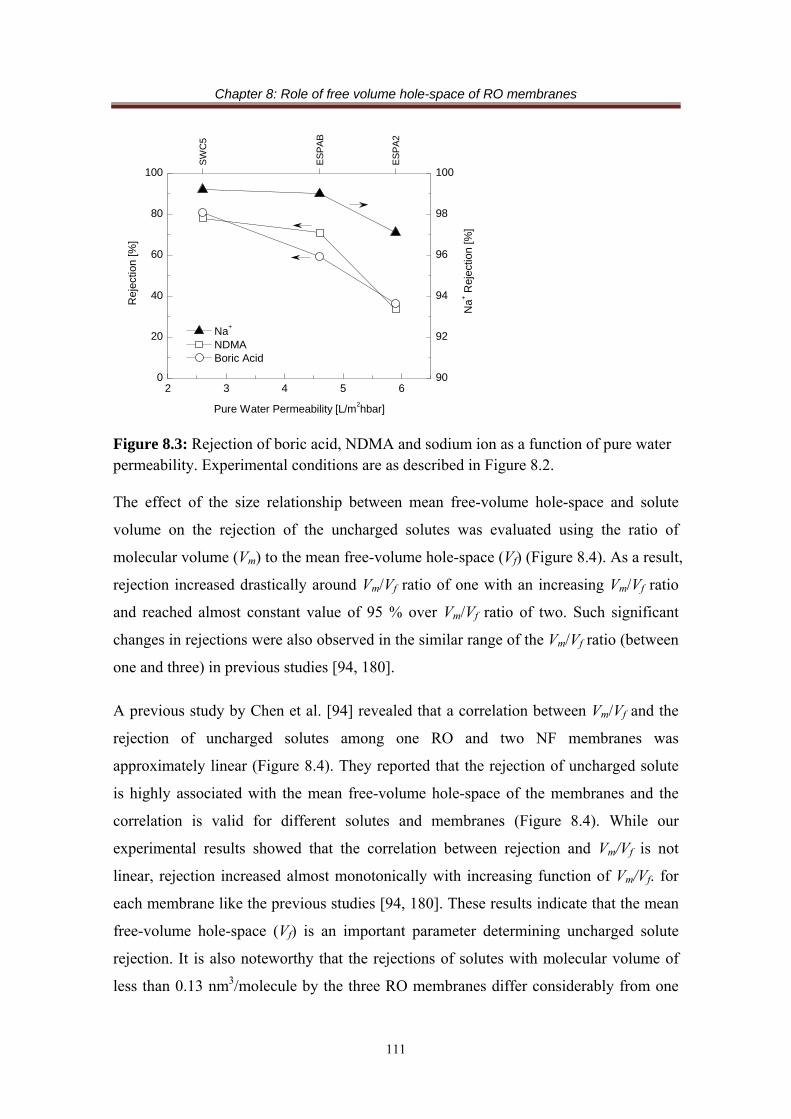
Chapter 8: Role of free volume hole-space of RO membranes
111
Figure 8.3: Rejection of boric acid, NDMA and sodium ion as a function of pure water permeability. Experimental conditions are as described in Figure 8.2.
The effect of the size relationship between mean free-volume hole-space and solute
volume on the rejection of the uncharged solutes was evaluated using the ratio of
molecular volume (Vm) to the mean free-volume hole-space (Vf) (Figure 8.4). As a result,
rejection increased drastically around Vm/Vf ratio of one with an increasing Vm/Vf ratio
and reached almost constant value of 95 % over Vm/Vf ratio of two. Such significant
changes in rejections were also observed in the similar range of the Vm/Vf ratio (between
one and three) in previous studies [94, 180].
A previous study by Chen et al. [94] revealed that a correlation between Vm/Vf and the
rejection of uncharged solutes among one RO and two NF membranes was
approximately linear (Figure 8.4). They reported that the rejection of uncharged solute
is highly associated with the mean free-volume hole-space of the membranes and the
correlation is valid for different solutes and membranes (Figure 8.4). While our
experimental results showed that the correlation between rejection and Vm/Vf is not
linear, rejection increased almost monotonically with increasing function of Vm/Vf. for
each membrane like the previous studies [94, 180]. These results indicate that the mean
free-volume hole-space (Vf) is an important parameter determining uncharged solute
rejection. It is also noteworthy that the rejections of solutes with molecular volume of
less than 0.13 nm3/molecule by the three RO membranes differ considerably from one
2 3 4 5 60
20
40
60
80
100
Na+
NDMA Boric Acid
Rej
ectio
n [%
]
Pure Water Permeability [L/m2hbar]
90
92
94
96
98
100
Na+
Rej
ectio
n [%
]
SW
C5
ES
PA
B
ES
PA
2

Chapter 8: Role of free volume hole-space of RO membranes
112
to another although the mean free-volume hole-space (Vf) of these membranes were
similar. Thus, in addition to the mean free-volume hole-space (or mean radius), other
membrane characteristics such as the free-volume hole-radii distribution and active skin
layer thickness could also be important parameters governing the rejection of small and
uncharged solutes by RO membranes.
Figure 8.4: Correlation between the ratio of molecular volume (Vm) to the mean free-volume of the membranes (Vf) and the rejection of boric acid and N-nitrosamines. Experimental conditions are as described in Figure 8.2. The correlation data of this study was obtained from the rejection of boron and eight N-nitrosamines by the three RO membranes. The short dash line and the dash dotted line represent the correlation data reported by Ito et al. [180] and Chen et al. [94], respectively.
4 Conclusions
PALS analysis with 1 keV slow positron beam revealed that the seawater RO (SWC5)
membrane has the smallest mean free-volume hole-radius followed by the two low
pressure RO membranes (ESPA2 and ESPAB). The SWC5 membrane also exhibited
the highest rejection of uncharged solutes (i.e. boric acid and N-nitrosamines) and
sodium ions. The ESPAB membrane revealed a lower pure water permeability and
higher rejection of uncharged solutes and sodium ions than the ESPA2 membrane,
despite their identical mean free-volume hole-radii. The comparison between solute
volume (Vm) and mean free-volume hole-space (Vf) evaluated by PALS by exhibited a
monotonically increasing factor of Vm/Vf, indicating the mean free-volume hole-space
(or referred as hole-radii) is indeed an important factor determining uncharged solute
0.5 1.0 1.5 2.0 2.5 3.00
20
40
60
80
100
SWC5 ESPAB ESPA2 This study Ito et al. Chen et al.
Rej
ectio
n [%
]
Vm/V
f [-]

Chapter 8: Role of free volume hole-space of RO membranes
113
rejection. Nevertheless, because the rejection of small and uncharged solutes by the
three RO membranes differ considerably from one to another, other membrane
parameters and properties such as the distribution of free-volume hole-radius and
thickness of the active skin layer are also likely to play a role in governing the passage
of solutes with small molecular volume.
Chapter 9: Full-scale monitoring
114
Chapter 9
Full-scale monitoring
This chapter has been published as:
T. Fujioka, S.J. Khan, J.A. McDonald, A. Roux, Y. Poussade, J.E. Drewes, L.D. Nghiem, N-nitrosamine rejection by reverse osmosis membranes: A full-scale study, Water Res., 47 (2013) 6141-6148.
1 Introduction
The rejection of N-nitrosamines by RO membranes has been extensively investigated at
the laboratory scale [38, 82, 83, 150]. However, full-scale monitoring data to reaffirm
findings from laboratory-scale experiments and to assess the impact of realistic
operating conditions on the rejection of N-nitrosamines have rarely been reported in the
peer review literature. Plumlee et al. [18] studied the removal of NDMA by different
treatment processes (including RO) at the Interim Water Purification Facility (Orange
County, California, USA). NDMA removal by the RO process varied from 24 to 56%.
The authors suggested that the variation in NDMA rejection observed in their study
might be associated with changing feed conditions and membrane fouling. However, the
authors did not monitor the feed and membrane fouling conditions. Farré et al. [12]
reported the fate of NDMA after each treatment process of the Bundamba Water
Recycling plant in Queensland, Australia. Because Farré et al. [12] did not focus on the
RO process, only one overall rejection value of NDMA by the RO system can be
inferred from their study. Some information about the rejection of NDMA and NMOR
by a full-scale RO plant can also be inferred from a study by Krauss et al. [8], who
investigated the fate of N-nitrosamine precursors at the Wulpen/Torreele Water
Recycling plant in Belgium. In comparison to NDMA, very little is known about the
fate and removal of other N-nitrosamines during RO filtration at full scale. The scarcity
of full-scale monitoring and the lack of information regarding operating conditions (e.g.
permeate flux and recovery) and feed water characteristics (e.g. temperature, ionic

Chapter 9: Full-scale monitoring
115
composition) significantly hinder any meaningful data analysis. RO systems for
wastewater recycling are typically designed using three stages to achieve recovery
around 85% [122]. Although the RO feed is further concentrated after each filtration
stage, no studies available to date have examined rejection efficiencies for nitrosamines
at subsequent stages.
The aim of this study was to assess the removal of eight N-nitrosamines in three full-
scale RO plants. N-nitrosamine rejection values obtained at different stages were
systematically related to the operating conditions and feed water characteristics. In
addition, the difference in N-nitrosamine rejections between a cool and a warm weather
period at one plant was also elucidated. Based on the obtained results, implications to
water recycling practice were highlighted and discussed.
2 Materials and methods
2.1 RO systems
Samples were collected from three full-scale water recycling plants denoted as A, B and
C located in Australia. In these plants, prior to RO filtration, secondary treated effluent
is first pretreated by either microfiltration (MF) or ultrafiltration (UF). At plant A and B,
ferric chloride is used as coagulant. In all three plants, pre-formed chloramines were
added to the process prior to MF or UF filtration to mitigate biofouling on the RO
membranes (Figure 9.1). The RO membranes used in these plants are from three
different manufacturers. The membranes used in these three plants are thin film
composite with a polyamide skin layer. They were characterized by similar salt (NaCl)
rejection and water permeability [183]. The process flow diagrams of these RO systems
are shown in Figure 9.1. Samples were collected from plant A during cool (A-1) and
warm (A-2) weather periods. At plant A, chloramination is normally added downstream
of the coagulation process, which was the configuration when sampling campaign A-1
was conducted (Figure 9.1). During an extended period of warm weather when it is
necessary to control algal growth during the coagulation process, chloramination can be
added upstream of the coagulation process. Plant A was operated in this configuration
when the sampling campaign A-2 took place (Figure 9.1). Unlike plants B and C, plant
A is equipped with a booster pump prior to the third stage to maintain the same average

Chapter 9: Full-scale monitoring
116
flux at all three stages (Figure 9.1). All three systems produce reclaimed water for
industrial and/or agriculture uses. Plants A and B were designed for a possible indirect
potable water recycling application where high quality reclaimed water can be used to
replenish an existing reservoir for drinking water supply. Thus, the UV-H2O2 process
was also installed after the RO process at these systems for the destruction of residual
NDMA in the RO permeate. Similar installation using the UV-H2O2 process specifically
for the removal of residual NDMA in the RO permeate can also be found elsewhere [18,
20].
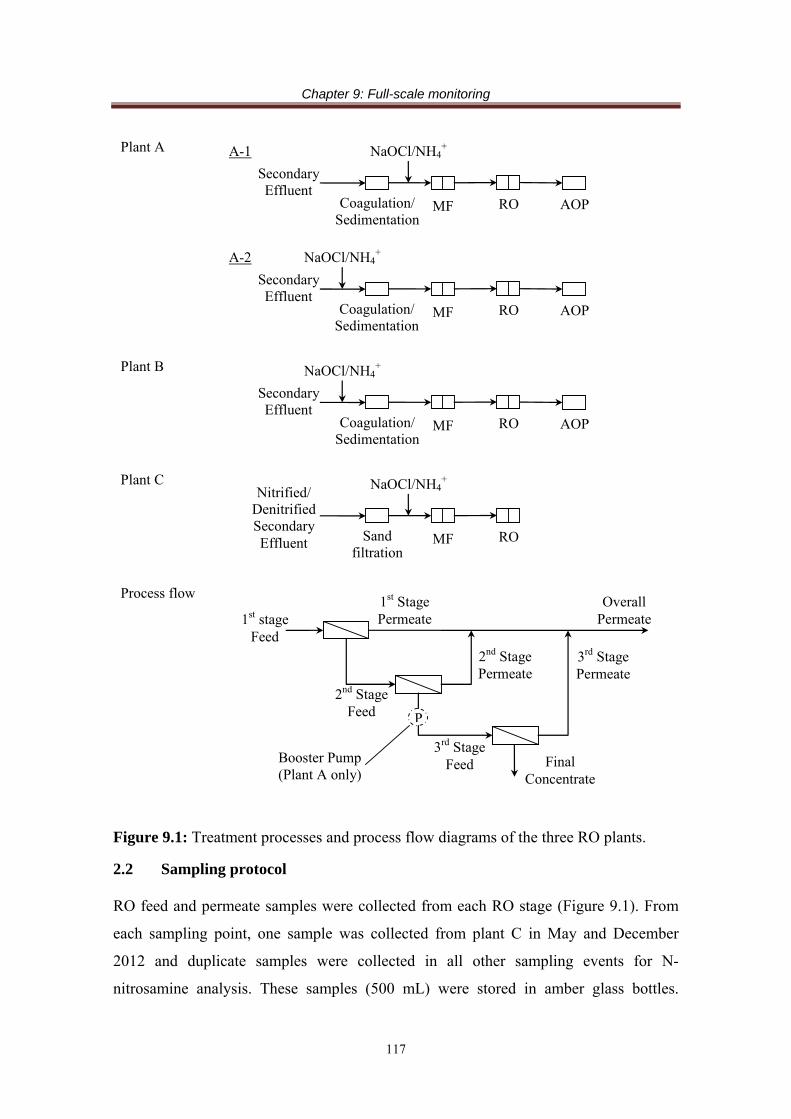
Chapter 9: Full-scale monitoring
117
Figure 9.1: Treatment processes and process flow diagrams of the three RO plants.
2.2 Sampling protocol
RO feed and permeate samples were collected from each RO stage (Figure 9.1). From
each sampling point, one sample was collected from plant C in May and December
2012 and duplicate samples were collected in all other sampling events for N-
nitrosamine analysis. These samples (500 mL) were stored in amber glass bottles.
Plant A
Plant B
Plant C
Process flow
1st stage Feed
2nd Stage Feed
3rd Stage Feed Final
Concentrate
1st Stage Permeate
2nd Stage Permeate
3rd Stage Permeate
Overall Permeate
Booster Pump (Plant A only)
P
MF RO
Nitrified/ Denitrified Secondary Effluent
NaOCl/NH4+
Sand filtration
MF RO AOP
Secondary Effluent
NaOCl/NH4+
Coagulation/ Sedimentation
MF RO AOP
Secondary Effluent
NaOCl/NH4+
Coagulation/ Sedimentation
A-2
MF RO AOP
Secondary Effluent
NaOCl/NH4+
Coagulation/ Sedimentation
A-1
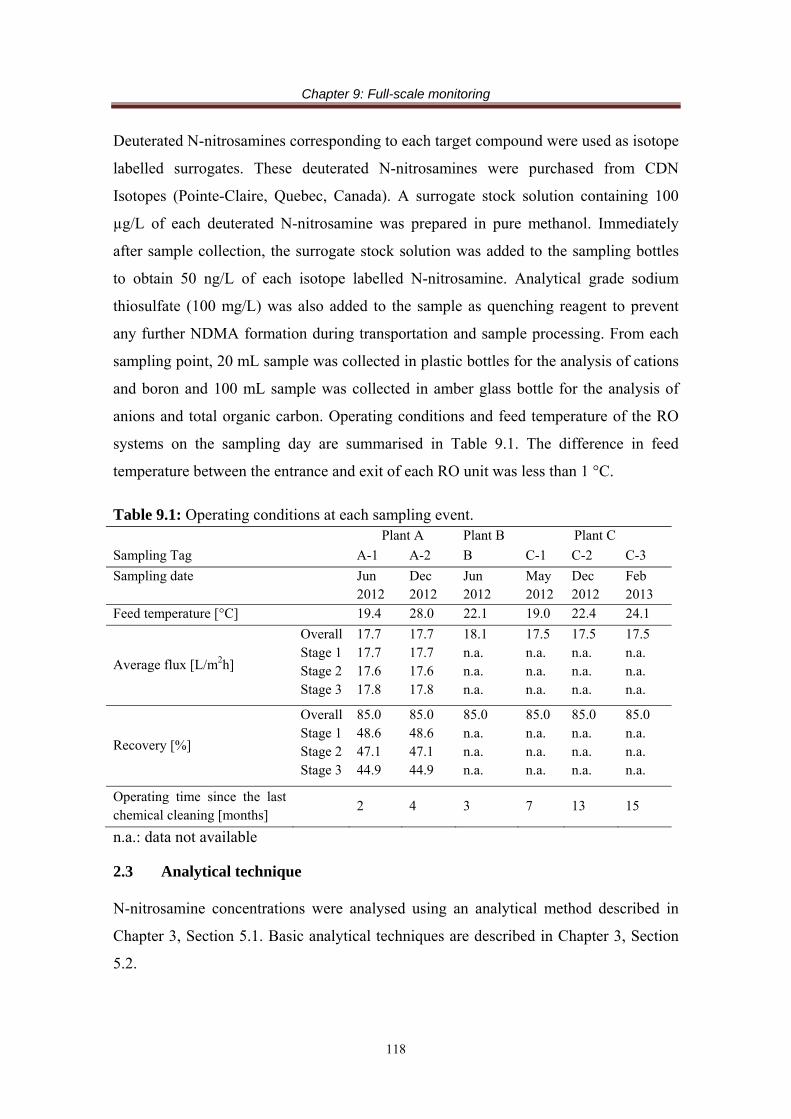
Chapter 9: Full-scale monitoring
118
Deuterated N-nitrosamines corresponding to each target compound were used as isotope
labelled surrogates. These deuterated N-nitrosamines were purchased from CDN
Isotopes (Pointe-Claire, Quebec, Canada). A surrogate stock solution containing 100
µg/L of each deuterated N-nitrosamine was prepared in pure methanol. Immediately
after sample collection, the surrogate stock solution was added to the sampling bottles
to obtain 50 ng/L of each isotope labelled N-nitrosamine. Analytical grade sodium
thiosulfate (100 mg/L) was also added to the sample as quenching reagent to prevent
any further NDMA formation during transportation and sample processing. From each
sampling point, 20 mL sample was collected in plastic bottles for the analysis of cations
and boron and 100 mL sample was collected in amber glass bottle for the analysis of
anions and total organic carbon. Operating conditions and feed temperature of the RO
systems on the sampling day are summarised in Table 9.1. The difference in feed
temperature between the entrance and exit of each RO unit was less than 1 °C.
Table 9.1: Operating conditions at each sampling event. Plant A Plant B Plant C
Sampling Tag A-1 A-2 B C-1 C-2 C-3
Sampling date Jun 2012
Dec 2012
Jun 2012
May 2012
Dec 2012
Feb 2013
Feed temperature [°C] 19.4 28.0 22.1 19.0 22.4 24.1
Average flux [L/m2h]
Overall Stage 1 Stage 2 Stage 3
17.7 17.7 17.6 17.8
17.7 17.7 17.6 17.8
18.1 n.a. n.a. n.a.
17.5 n.a. n.a. n.a.
17.5 n.a. n.a. n.a.
17.5 n.a. n.a. n.a.
Recovery [%]
Overall Stage 1 Stage 2 Stage 3
85.0 48.6 47.1 44.9
85.0 48.6 47.1 44.9
85.0 n.a. n.a. n.a.
85.0 n.a. n.a. n.a.
85.0 n.a. n.a. n.a.
85.0 n.a. n.a. n.a.
Operating time since the last chemical cleaning [months]
2 4 3 7 13 15
n.a.: data not available
2.3 Analytical technique
N-nitrosamine concentrations were analysed using an analytical method described in
Chapter 3, Section 5.1. Basic analytical techniques are described in Chapter 3, Section
5.2.

Chapter 9: Full-scale monitoring
119
2.4 Calculation
The rejection of N-nitrosamines and other solutes in each RO stage and combined RO
stages was calculated using the following equations.
Each stage rejection Ri [%] = 1001
fi
pi
C
C (1)
Overall rejection RT [%] = 10011
f
pT
C
C (2)
where i is the number of stage, Cpi is the solute concentration in the RO permeate of the
stage i, Cfi is the solute concentration in the RO feed of the stage i, and CpT is the solute
concentration in the combined RO permeate.
3 Results and discussion
3.1 Organic and inorganic constituent removal
The feed waters to the three RO systems differed markedly in TOC concentration and
salinity(). In particular, the feed water to plant A exhibited a relatively high conductivity
(salinity) at approximately 2.5 mS/cm. The sewer catchment of plant A is
predominantly in a low-lying coastal area and is subjected to seawater intrusion. In fact,
due to seawater ingresses, boron concentration in the feed to plant A was also higher
compared to plant B and C. Despite the high feed water salinity, the quality of RO
permeate at plant A was comparable to that at the other two RO systems. Most common
cations and anions in the feed water can be rejected well by the RO membranes. As a
result, the permeate at all three RO systems was of high quality with respect to basic
water quality parameters. In agreement with the 85% water recovery (Table 9.1) of
these RO systems, TOC and conductivity concentrations in the final concentrates were
approximately six times greater than those in the feed waters (Table 9.2).
The rejections of TOC, cations (sodium, magnesium, potassium and calcium), anions
(chloride, nitrate and sulphate) and boric acid by all three RO systems are summarised
in Figure 9.2. Divalent ions (i.e. magnesium, calcium and sulphate) were consistently

Chapter 9: Full-scale monitoring
120
removed over 99%. On the other hand, in agreement with a previous study by Bellona
and Drewes [184], nitrate rejection was slightly lower than that of all other ions. The
rejection of boric acid was in the range of 15-30%, which is consistent with the fact that
boric acid has a small molecular size and is uncharged at pH below 8 [185]. The
difference between the charged and uncharged solutes observed here can be attributed to
the electrostatic interaction and size exclusion rejection mechanisms. In addition to size
exclusion, electrostatic repulsion can also play an important role in the rejection of
charged solutes by NF/RO membranes [3].
Figure 9.2: Overall rejection of TOC and inorganic constituents by RO membranes.
.
TOC Sodium Magnesium Potassium Calcium Chloride Nitrate Sulphate Boric acid0
10
20
30
80
90
100
NeutralAnions
Rej
ectio
n [%
]
A-1 B C-1
Cations

Chapter 9: Full-scale monitoring
121
Table 9.2: Water quality of the RO feed, combined RO permeate and final RO concentrate. RO feed Combined RO permeate Final RO concentrate
Sampling Tag A-1 A-2 B C-1 C-2 C-3 A-1 A-2 B C-1 C-2 C-3 A-1 A-2 B C-1 C-2 C-3 TOC [mg/L] 8.9 7.2 2.3 21 8.2 19.6 <0.5 <0.5 <0.5 0.7 <0.5 0.6 52 49 13 117 58 105 pH [-] 7.4 7.5 6.7 7.0 6.7 6.8 6.2 6.5 5.3 5.8 5.3 5.5 7.8 7.9 7.5 7.8 7.5 7.3 Conductivity [mS/cm]
2.34 2.59 1.26 0.95 0.92 0.85 0.07 0.13 0.07 0.04 0.03 44 13.2 14.3 7.2 5.5 5.4 4.8
Boron [mg/L] 0.14 n.a. 0.07 0.08 0.11 0.08 0.10 n.a. 0.05 0.07 0.11 0.06 0.35 n.a. 0.15 0.19 0.26 n.a. Na+ [mg/L] 313 496 144 93 118 119 11 48 10 6 6 5 2114 4033 952 592 875 998 Mg2+ [mg/L] 35 n.a. 17 9 12 11 <1 n.a. <1 <1 <1 <1 236 n.a. 121 63 94 90 K+ [mg/L] 169 36 76 16 20 22 <1 6 <1 <1 3 <1 1245 370 542 105 149 177 Ca2+ [mg/L] 71 n.a. 46 20 33 25 n.d. n.a. n.d. n.d. n.d. n.d. 384 n.a. 337 134 253 195 Cl- [mg/L] 442 640 218 183 132 160 11 26 10 4 3 3 2895 4972 1347 1202 1150 1052 NO3
- [mg/L] 10 4 7 52 37 60 2 1 2 7 5 7 53 25 40 314 298 395 SO4
2- [mg/L] 63 118 46 38 25 42 n.d. n.d. 0.6 n.d. n.d. n.d. 427 926 313 264 273 320 n.d.: not detectable. n.a.: not available.

Chapter 9: Full-scale monitoring
122
3.2 N-nitrosamine removal
3.2.1 Occurrence of N-nitrosamines in the RO feed water
NDMA was detected in all RO feed water samples (Figure 9.3). NDMA concentrations
(7-16 ng/L) detected in the RO feed solutions were below or only marginally higher
than the value (i.e. 10 ng/L) in the final product water stipulated by the Australian
Guidelines for Water Recycling, with samples from A-2 being the only exception. In A-
2, chloramine was added upstream of the coagulation process and thus resulting in an
increase in NDMA formation. Results in Figure 9.3 are consistent with those obtained
from previous studies [12, 18, 27]. For typical water recycling plants where NDMA in
raw water can be controlled to similar levels found in this study, reducing NDMA
formation in the feed [27] and RO filtration can be implemented to meet the guideline
value without relying on an additional subsequent treatment process such as AOP.
In addition to NDMA, several other N-nitrosamines (i.e. NPYR, NDEA, NPIP, NMOR
and NDBA) were also detected in some but not all RO feed water samples (Figure 9.4).
NMEA, which is the second lowest molecular weight compound among the N-
nitrosamines investigated here, was not detected during any sampling campaign.
Surprisingly, a comparatively high NMOR concentration (177-475 ng/L) was observed
in the feed water at plant C. Compared to plant C, NMOR concentrations detected in the
RO feed in plants A-2 and B configurations were low. It is noted that NMOR
concentrations in A-1, B and C-1 were not reported due to unsatisfactory variation
between duplicate samples and poor recovery of the isotopically labelled internal
standard. In fact, a sampling program conducted in plant A from 2010 to 2012 revealed
low NMOR concentrations (< 21 ng/L) in the RO feed (Figure 9.5) which indicates that
a very high NMOR concentration like plant C has not been identified in plant A.
Likewise, a sampling program conducted in plant B from 2009 to 2011 also showed a
relatively low NMOR concentrations in the range from 9 to 57 ng/L in the RO feed
(Figure 9.5). The results reported here suggest that high NMOR concentrations in RO
feed may be site specific and could relate to certain industrial dischargers. Thus, further
research is necessary to identify sources of NMOR within the catchment of plant C.

Chapter 9: Full-scale monitoring
123
After each stage, concentrations of N-nitrosamines increased to quantifiable levels due
to the concentration effect leading to higher feed concentrations in subsequent stages
(Figure 9.3). As a result, the highest N-nitrosamine concentration was consistently
observed in the final RO concentrate. For example, NDMA concentrations in the final
RO concentrate were two to six times higher than those in the RO feed. Likewise,
NMOR concentrations in the RO concentrate were approximately six times higher than
those in the RO feed.
n.d
.
n.d
.n
.d.
n.a
.
n.d
.
n.a
.
n.a
.
n.a
.
n.a
.
n.a
.
n.a
.
n.a
.
n.a
.
n.a
.
0
25
50
75
100
Con
cent
ratio
n [n
g/L]
1st Stage 2nd Stage 3rd Stage Final Concentrate
0
10
20
30
40
50
(c) NMOR
(b) NDEA
Con
cent
ratio
n [n
g/L]
(a) NDMA
A-1 A-2 B C-1 C-2 C-30
50
1000
2000
3000
(n=2) (n=2) (n=2) (n=1) (n=1) (n=2)
Con
cent
ratio
n [n
g/L]
Figure 9.3: Concentrations of NDMA, NDEA and NMOR in the RO feed and RO concentrate in the three RO plants. (n.a.: data not available, and n.d.: not detectable in the feed). The number of replicate samples is shown in the parentheses. Values reported for A-1, A-2, B and C-3 are the average and range of duplicate measurements.

Chapter 9: Full-scale monitoring
124
n.d
.
n.d
.
n.d
.
n.d
.
n.a
.
n.d
.
n.d
.
n.d
.
n.d
.
n.a
.
n.d
.
n.d
.
n.d
.
n.d
.
n.a
.
n.d
.
n.d
.
n.d
.
n.d
.
n.d
.
n.d
.
n.d
.
n.d
.
n.d
.
n.d
.
n.d
.
n.d
.
n.d
.
n.d
.
n.d
.
n.d
.
n.d
.
n.d
.
n.d
.
n.d
.
n.d
.
n.d
.
n.d
.
n.d
.
n.d
.
n.d
.
n.d
.
n.d
.
n.d.
n.d.
n.d.
n.d.
n.d.
n.d.
n.d.
n.a.
n.d.
n.d.
n.d.
n.a.
n.d.
n.d.
n.d.
n.a.
n.d.
n.d.
n.d.
n.d.
n.a.
n.d.
n.d.
n.d.
n.a.
n.d.
n.d.
n.a.
n.d.
n.a.
n.d.
n.d.
n.d.
n.d.
n.d.
n.d.
n.d.
n.d.
n.d.
n.d.
n.d.
n.d.
n.d.
n.d.
n.d.
n.d.
n.d.
n.d.
n.d.
n.d.
n.d.
n.d.
n.d.
n.d.
n.d.
n.d.
n.d.
n.d.
n.d.
n.d.
n.d.
n.d.
n.d.
n.d.
NDMA NMEA NPYR NDEA NPIP NMOR NDPA NDBA0
50
100
150
200
C
onc
entr
atio
n[n
g/L
] 1st Stage 2nd Stage 3rd Stage Final Concentrate
NDMA NMEA NPYR NDEA NPIP NMOR NDPA NDBA0
50
100
150
200
(f) C-3 (n=2)
(e) C-2 (n=1)
(d) C-1 (n=1)
(c) B (n=2)
(b) A-2 (n=2)
Con
cent
ratio
n[n
g/L
]
(a) A-1 (n=2)
NDMA NMEA NPYR NDEA NPIP NMOR NDPA NDBA0
50
100
150
200
Co
ncen
tra
tion
[ng
/L]
NDMA NMEA NPYR NDEA NPIP NMOR NDPA NDBA0
50
100
150
200
Con
cen
tra
tion
[ng
/L]
NDMA NMEA NPYR NDEA NPIP NMOR NDPA NDBA0
50
50010001500200025003000
Con
cent
ratio
n[n
g/L
]
NDMA NMEA NPYR NDEA NPIP NMOR NDPA NDBA0
50
250500750
10001250
Con
cent
ratio
n[n
g/L]
Figure 9.4: N-nitrosamine concentrations of the RO feed and RO concentrate in the three RO plants. n.a. represents that the data is not available and n.d. represents that the concentration was below their detection limits. The number of replicate samples is shown in the parentheses. Values reported for A-1, A-2, B and C-3 are the average and range of duplicate measurements.

Chapter 9: Full-scale monitoring
125
29/0
1/20
10
29/0
7/20
10
29/0
1/20
11
29/0
7/20
11
29/0
1/20
12
29/0
7/20
12
0
10
20
30
40
50
60
8/06
/200
9
8/12
/200
9
8/06
/201
0
8/12
/201
0
8/06
/201
1
8/12
/201
1
8/06
/201
2
0
10
20
30
40
50
60(b) Plant B
N
MO
R c
once
ntra
tion
[ng/
L]
(a) Plant A
NM
OR
con
cent
ratio
n [n
g/L]
Figure 9.5: Historical record of NMOR concentrations in the RO feed in (a) plant A and (b) plant B. Open symbols indicate that NMOR concentration in the RO feed was below its detection limit (i.e. 10 ng/L).
3.2.2 N-nitrosamine concentrations in the RO permeate NDMA concentrations in the RO permeate were detected above the detection limit (3
ng/L) at least once in samples from each plant (Figure 9.6). However, most of these
detections did not exceed the guideline value of 10 ng/L, again with a sample collected
from A-2 being the only exception. Of the seven remaining N-nitrosamines, only
NDEA, NMOR and NDBA were detected in RO permeate samples (Figure 9.7). NMOR
concentration in the overall RO permeate samples of plant C varied between 34 and 76
ng/L, which was comparatively higher than the other N-nitrosamines. This is because
NMOR concentration in the RO feed of plant C was also higher than all other N-
nitrosamines (Figure 9.3). Once again, NMOR concentrations in A-1, B and C-1 are
noted as not available due to a large variation in analysed NMOR concentration
between duplicate samples and poor recovery of the isotopically labelled internal
standard.
In all cases, the concentration of N-nitrosamines in the RO permeate increased in later
stages due to the increased concentration in the RO feed for each stage (Figure 9.6). As
a result, N-nitrosamine concentrations in the overall RO permeate (i.e. the combined
RO permeate of the first, second and third stages) were higher than those in the first
stage. The results here indicate that rejection estimates obtained from laboratory-scale
systems, which are operated at low water recovery, may result in an underestimation of

Chapter 9: Full-scale monitoring
126
N-nitrosamine concentrations in the RO permeate. Although the permeation of NDMA
through RO membranes can be managed by a subsequent UV-H2O2 based AOP, little is
known about its removal efficiency for NMOR and other N-nitrosamines. The results
reported here also suggest that, in addition to NDMA, it is necessary to monitor the
concentration of several other N-nitrosamines particularly NMOR in secondary treated
effluent and the corresponding RO permeate.
n.d
.
n.d
.
n.d
.
n.d
.
n.d
.
n.d
.
n.d
.
n.d
.
n.d
.
n.d
.
n.d
.
n.d
.
n.d
.
n.d
.
n.d
.
n.d
.
n.d
.
n.d
.
n.d
.
n.d
.
n.a
.
n.d
.
n.a
.
n.a
.
n.a
.
n.d
.
n.a
.
n.a
.
n.a
.
n.d
.
n.a
.
n.a
.
n.a
.
n.d
.
n.a
.
n.a
.
0
10
20
30
40
50
Con
cent
ratio
n [n
g/L]
1st Stage 2nd Stage 3rd Stage Overall
0
10
20
30
40
50
(c) NMOR
(b) NDEA
Con
cent
ratio
n [n
g/L]
(a) NDMA
A-1 A-2 B C-1 C-2 C-30
50
100
150
200
250
(n=2) (n=2) (n=2) (n=1) (n=1) (n=2)
Con
cent
ratio
n [n
g/L]
Figure 9.6: Concentrations of NDMA, NDEA and NMOR in the RO permeate in the three RO plants. n.a. represents that the data is not available and n.d. represents that the concentration was below their detection limits. The number of replicate samples is shown in the parentheses. Values reported for A-1, A-2, B and C-3 are the average and range of duplicate measurements.

Chapter 9: Full-scale monitoring
127
n.d
.
n.d
.
n.d
.
n.d
.
n.a
.
n.d
.
n.d
.
n.d
.
n.d
.
n.d
.
n.d
.
n.a
.
n.d
.
n.d
.
n.d
.
n.d
.
n.d
.
n.d
.
n.a
.
n.d
.
n.d
.
n.d
.
n.d
.
n.d
.
n.d
.
n.a
.
n.d
.
n.d
.
n.d.
n.d.
n.d.
n.d.
n.d.
n.d.
n.d.
n.d.
n.d.
n.d.
n.d.
n.d.
n.d.
n.d.
n.d.
n.d.
n.d.
n.d.
n.d.
n.d.
n.d.
n.d.
n.d.
n.d.
n.d
.
n.d
.
n.d
.
n.d
.
n.a
.
n.d
.
n.d
.
n.d
.
n.d
.
n.d
.
n.d
.
n.a
.
n.d
.
n.d
.
n.d
.
n.d
.
n.d
.
n.d
.
n.a
.
n.d
.
n.d
.
n.d
.
n.d
.
n.d
.
n.d
.
n.a
.
n.d
.
n.d
.
n.d.
n.d.
n.d.
n.d.
n.d.
n.a.
n.d.
n.d.
n.d.
n.d.
n.d.
n.d.
n.a.
n.d.
n.d.
n.d.
n.d.
n.d.
n.d.
n.a.
n.d.
n.d.
n.d.
n.d.
n.d.
n.d.
n.a.
n.d.
n.d.
n.d.
n.d.
n.d.
n.d.
n.d.
n.d.
n.d.
n.d.
n.d.
n.d.
n.d.
n.d.
n.d.
n.d.
n.d.
n.d.
n.d.
n.d.
n.d.
n.d.
n.d.
n.d.
n.d.
n.d.
n.d.
n.d.
n.d.
n.d.
n.d.
n.d.
n.d.
n.d.
n.d.
n.d.
n.d.
n.d.
n.d.
n.d.
n.d.
n.d.
n.d.
n.d.
n.d.
NDMA NMEA NPYR NDEA NPIP NMOR NDPA NDBA0
25
50
75
100
C
once
ntra
tion
[ng
/L]
1st Stage 2nd Stage 3rd Stage Overall
NDMA NMEA NPYR NDEA NPIP NMOR NDPA NDBA0
25
50
75
100
(f) C-3 (n=2)
(b) A-2 (n=2)
(a) A-1 (n=2)
(e) C-2 (n=1)
(d) C-1 (n=1)
Con
cent
ratio
n[n
g/L
]
(c) B (n=2)
NDMA NMEA NPYR NDEA NPIP NMOR NDPA NDBA0
25
50
75
100
Con
cen
tra
tion
[ng
/L]
NDMA NMEA NPYR NDEA NPIP NMOR NDPA NDBA0
25
50
75
100
Co
nce
ntr
atio
n[n
g/L
]
NDMA NMEA NPYR NDEA NPIP NMOR NDPA NDBA0
50
100
150
200
250
Co
nce
ntr
atio
n[n
g/L
]
NDMA NMEA NPYR NDEA NPIP NMOR NDPA NDBA0
50
100
150
200
250
Co
nce
ntr
atio
n[n
g/L
]
Figure 9.7: N-nitrosamine concentrations of the RO permeate in the three RO plants. n.a. represents that the data is not available and n.d. represents that the concentration was below their detection limits. The number of replicate samples is shown in the parentheses. Values reported for A-1, A-2, B and C-3 are the average and range of duplicate measurements.
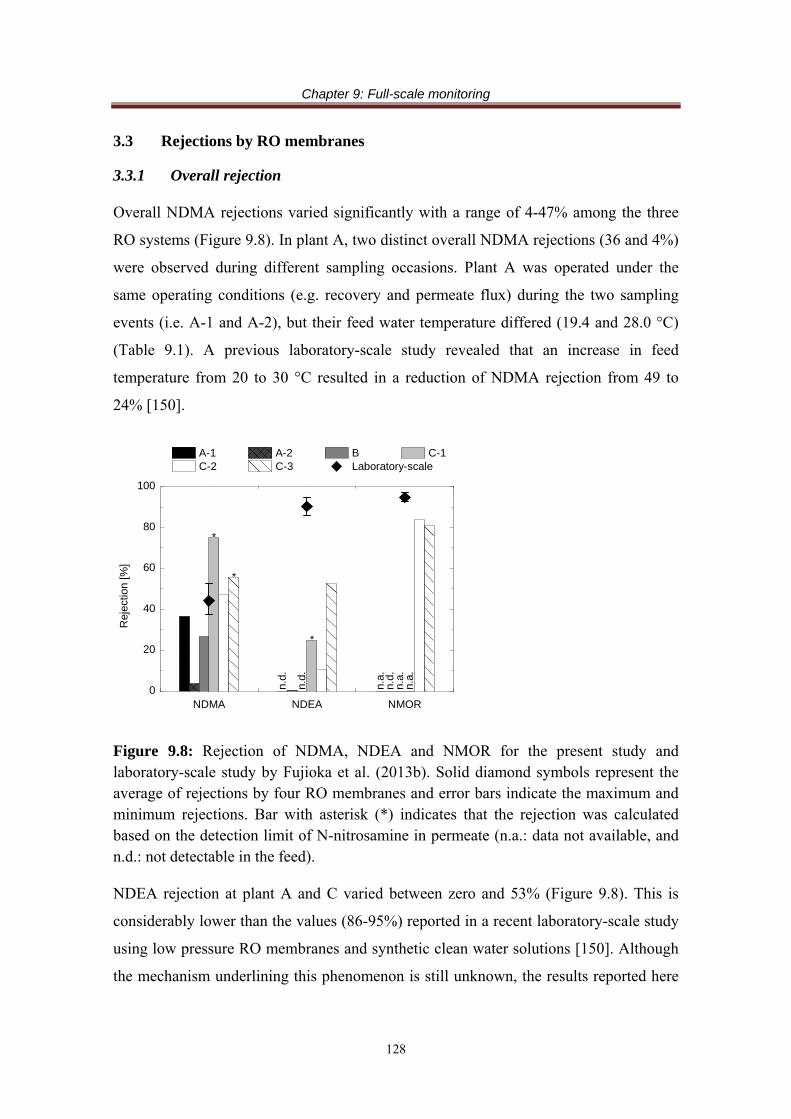
Chapter 9: Full-scale monitoring
128
3.3 Rejections by RO membranes
3.3.1 Overall rejection
Overall NDMA rejections varied significantly with a range of 4-47% among the three
RO systems (Figure 9.8). In plant A, two distinct overall NDMA rejections (36 and 4%)
were observed during different sampling occasions. Plant A was operated under the
same operating conditions (e.g. recovery and permeate flux) during the two sampling
events (i.e. A-1 and A-2), but their feed water temperature differed (19.4 and 28.0 °C)
(Table 9.1). A previous laboratory-scale study revealed that an increase in feed
temperature from 20 to 30 °C resulted in a reduction of NDMA rejection from 49 to
24% [150].
n.d.
n.a.
n.d.
n.d.
n.a.
n.a.
NDMA NDEA NMOR0
20
40
60
80
100
*
*
A-1 A-2 B C-1 C-2 C-3 Laboratory-scale
Rej
ectio
n [%
]
*
Figure 9.8: Rejection of NDMA, NDEA and NMOR for the present study and laboratory-scale study by Fujioka et al. (2013b). Solid diamond symbols represent the average of rejections by four RO membranes and error bars indicate the maximum and minimum rejections. Bar with asterisk (*) indicates that the rejection was calculated based on the detection limit of N-nitrosamine in permeate (n.a.: data not available, and n.d.: not detectable in the feed).
NDEA rejection at plant A and C varied between zero and 53% (Figure 9.8). This is
considerably lower than the values (86-95%) reported in a recent laboratory-scale study
using low pressure RO membranes and synthetic clean water solutions [150]. Although
the mechanism underlining this phenomenon is still unknown, the results reported here

Chapter 9: Full-scale monitoring
129
indicate that RO filtration in treated wastewater can result in a significant reduction in
NDEA rejection. In fact, in a laboratory-scale study Fujioka et al. [163] reported a
considerable deterioration in NDEA rejection using tertiary effluent as feed water.
Overall, NMOR rejection was high and each stage exhibited rejection ranges of 87-91%
(Figure 9.8) which is consistent with previous laboratory-scale studies [150, 163].
3.3.2 Rejection at each stage
In plant B, 16 inch membrane elements were used whereas 8 inch membrane elements
were used in plants A and C. Thus, the hydraulic distribution of plant B can differ
significantly from that of plant A and C. At plant B, a significant variation in NDMA
rejection (14-78%) was observed among the three RO stages (Figure 9.9). Changes in
the permeate flux after each filtration stage may contribute to this variation to some
extent (Fujioka et al. 2012b). However, because permeate flux was not monitored in
each individual stage at plant B, it was not possible to confirm this hypothesis.
Rejection of N-nitrosamines was further investigated using the two sampling events at
plant A, focusing on the difference in NDMA rejection among the three stages. As RO
filtration progressed, feed pH increased slightly and feed conductivity increased
significantly for both sampling events (Figure 9.10). During the first sampling event (A-
1) an increase in NDMA rejection from the first stage to third stage was observed. In
general, an increase in feed conductivity (or ionic strength) results in a decrease in N-
nitrosamine rejection [150]. However, the current study revealed an opposite trend
which indicates that another factor such as membrane fouling may have been developed
more extensively in later stages and may have compensated the decreased trend of
NDMA rejection. On the other hand, during the second sampling event (A-2), NDMA
rejections decreased as RO filtration progressed to later stages (Figure 9.10). The results
reported here indicate that NDMA rejections among three RO stages may vary
significantly even when operating conditions (i.e. permeate flux and recovery) were
maintained constant.

Chapter 9: Full-scale monitoring
130
Figure 9.9: Rejection of NDMA at each stage of the three RO plants.
Figure 9.10: NDMA rejection, feed pH and feed conductivity at each stage of RO plant A.
1 2 30
20
40
60
80
100 A-1 A-2 B C-2
Stage Number [-]
N
DM
A R
ejec
tion
[%]
0
20
40
60
80
100
7.0
7.5
8.0
1 2 30
2
4
6
8
10
A-1 A-2
ND
MA
Rej
ectio
n [%
]F
eed
pH [
-]
Stage [-]
Fee
d C
ondu
ctiv
ity [
mS
/cm
]

Chapter 9: Full-scale monitoring
131
4 Conclusions
NDMA was detected in all feed samples at the three full-scale RO trains investigated in
this study. Although most other N-nitrosamines were not detected in the RO feed,
several N-nitrosamines became detectable as the feed was further concentrated after
each filtration stage. N-nitrosamine concentrations in the final RO concentrate were up
to six times higher than those in the RO feed. As a notable exception, one of the three
plants exhibited high NMOR concentrations (177-475 ng/L) in the feed, resulting in
high NMOR concentrations (34-76 ng/L) in the permeate. In most cases, NDMA was
detected below the Australian guideline value in the RO permeate. Overall rejection of
NDMA and NDEA among the three RO systems varied significantly with a range of 4-
47% and 0-53%, respectively. NDMA rejections among three RO stages also exhibited
a significant variation in several cases. These rejection variations may have resulted
from the difference in feed temperature and possibly membrane fouling. These findings
suggest that N-nitrosamine rejection estimates derived from laboratory-scale flat-sheet
membrane studies, which are operated at very low water recovery, may not be
representative of full-scale operation. On the other hand, overall NMOR rejections were
equally high with a range of 81-84%. The findings of this study provide insights for
potential variations in N-nitrosamine rejection among different RO systems and RO
stages.
Chapter 10: Mathematical model development and validation
132
Chapter 10
Mathematical model development and validation
This chapter has been published as:
T. Fujioka, S.J. Khan, J.A. McDonald, A. Roux, Y. Poussade, J.E. Drewes, L.D. Nghiem, Modelling the rejection of N-nitrosamines by a Spiral-Wound Reverse Osmosis System: Mathematical model development and validation, J. Membr. Sci., 454 (2014) 212-219.
1 Introduction
Modelling the rejection of N-nitrosamines under various conditions is essential for the
design of RO plants and compliance monitoring. NDMA and several other N-
nitrosamines have been frequently detected in the feed water to RO treatment at
concentration higher than the regulatory levels [122]. In addition, N-nitrosamine
rejection by RO membranes is sensitive to operating conditions and feed solution
characteristics [150]. Difficulties associated with analytical determination of N-
nitrosamines in the permeate at regulatory concentrations (i.e. 1 to 10 ng/L) [18, 67, 73]
also underscore the need for a model that can accurately describe the rejection of N-
nitrosamines. N-nitrosamine concentrations in aqueous samples can be determined by
chromatography (GC) or high pressure liquid chromatography (HPLC) with tandem
mass spectrometry (MS/MS) detector. However, the number of commercial laboratories
capable of trace level N-nitrosamine analysis is still limited and regular monitoring of
N-nitrosamines remains difficult and expensive. Thus, a capacity to describe and predict
the rejection of N-nitrosamines by the RO process is particularly useful for the
management of these trace organic chemicals in water recycling applications.
The rejection of inorganic salts by multi-stage RO membrane systems can be simulated
with a high level of accuracy using commercially available RO design software
packages (e.g. IMSDesign, TorayDS/DS2, and ROSA provided by Hydranautics, Toray,
and Dow/FilmTec, respectively). The development of mathematical models for
Chapter 10: Mathematical model development and validation
133
simulating specific trace organic and inorganic chemicals by spiral wound RO
membrane systems has been reported in several recent studies. Kim and co-workers
have successfully developed a model for predicting boron rejection by applying the
irreversible thermodynamic principle and sub-dividing a spiral wound element into a
number of small sub-sections [186-188]. Using a similar approach, Verliefde et al. [189]
have also developed a full-scale rejection model for several pharmaceutically active
compounds (PhACs) using nanofiltration (NF) membranes. These models significantly
enhance our understanding of the permeation of boron and PhACs through RO
membranes under realistic conditions. However, to date, there have yet been any
software packages or mathematical models that can simulate the rejection of N-
nitrosamines.
The aim of this study was to develop a mathematical model to predict the rejection of
N-nitrosamines by RO systems under a range of operating conditions. The developed
model was validated using experimental data obtained from a pilot RO system. The
potential application of this model for predicting N-nitrosamine rejection at full-scale
level was also discussed.
2 Theoretical background
2.1 Membrane element characteristics
A commercial spiral-wound element has one or several membrane leaves. Each leaf
consists of two flat sheet membranes sealed on three sides with the forth side attached to
a perforated tube called the permeate collector. The membrane leaf is wound around the
permeate collector. As a result, each spiral-wound element can essentially be presented
by a large flat sheet membrane. In this study, each element is geometrically described
with the length (L), width (W) and feed channel height (hb) (Figure 10.1). On the other
hand, the irreversible thermodynamic principle can be used to model the rejection of N-
nitrosamines by a small flat sheet membrane for a given hydrodynamic condition. Thus,
the irreversible thermodynamic principle can also be used to model solute rejection by a
spiral wound element. This can be done by sub-dividing the membrane area on each
element smaller sections of the same size and using fluid mechanics to calculate and
define the hydrodynamic condition for each sub-section. In this study, the membrane

Chapter 10: Mathematical model development and validation
134
area on one each element is divided into 20 sub-sections (m = 20) in a longitudinal
direction where each sub-section length (Δx) is described as:
m
Lx (1)
It is noteworthy that the length of each sub-section selected here is similar to that of the
flat sheet membrane coupon used in the laboratory-scale study. The membrane surface
area attached to the feed spacers is assumed to be 10% and this area is not utilised for
filtration. Thus, the active surface area in each sub-section (ΔS) is defined as:
m
SS
9.0 (2)
The cross-section area of the feed channel (ΔSc) is expressed as:
bc WhS (3)
Figure 10.1: Representation of a spiral-wound RO element as flat sheet configuration including the mass balance of a flat sheet sub-section.
2.2 Hydrodynamics
The local permeate flux (Jp(i)), local permeate flow rate (Qp(i)) and the overall permeate
flow rate of a membrane element (Qp,t) are calculated using equations 4 - 6.
)()()()( iiPiPLiJ pfpp (4)
L
W
Feed
Permeate
∆x
Feed Qf (i-1) Cf (i-1)
Qf(i+1)
Cf(i+1)
0.5Qp(i)
Cp(i)
0.5Qp(i)
Cp(i)
L/m W
Qf (i)
Cf(i)

Chapter 10: Mathematical model development and validation
135
SiJiQ pp )()( (5)
m
iptp iQQ
1, )( (6)
where Lp = pure water permeability which is obtained from bench-scale tests. Because
permeate pressure (Pp) is negligible compared to feed pressure (Pf), local permeate
pressure (Pp(i)) is assumed to be zero in this study. Local osmotic pressure (π(i)) shown
in equation 4 is computed with feed solution temperature (T) and molar concentrations
of ions (msalt(i)).
i
imTi1
)()273(19.1)( (7)
Concentration of the solute (msalt(i)) increases in the feed in the subsequent sub-sections
since the solute is retained by the membrane. Changes in solute concentration can be
calculated using the following equation:
)1(
)()1()()()1(
iQ
iQRiQimim
f
psaltfsaltsalt (8)
where Qf(i) = local feed flow rate and Rsalt = salt rejection. In the model, overall feed
flow rate measured in the pilot system is used as the feed flow rate of the first sub-
section Qf(1). Local feed flow rate (Qf(i+1)) is calculated from the feed and permeate
flow rates of the previous sub-section (Qf(i)):
)()()1( iQiQiQ pff (9)
Using the local feed flow rate (Qf(i)), local bulk velocity of the feed within the feed
channel (Ub(i)) is defined as:
c
fb S
iQiU
)()( (10)

Chapter 10: Mathematical model development and validation
136
The pressure drop in the feed stream (ΔPf(i)) and overall pressure drop of an element in
the feed stream (ΔPf,t) is calculated using the following formula [190, 191]:
hbfbf d
xiUifiP
)()(2
1)( 2 (11)
saltCMMMi 4.7522484004.498)( 2 (12)
TM 410757.20069.1 (13)
m
iftf iPP
1, )( (14)
where ffb = feed friction parameter, ρ(i) = local solution density [192], T = feed
temperature and dh = hydraulic diameter (dh = 2hb) [190]. Friction parameter (ffb) is
determined by an approach minimising the difference between the experimentally
modelled and measured overall pressure drops. Feed pressure which is experimentally
measured at the entrance of the first membrane element is used as the feed pressure of
the first sub-section in the model. Then local feed pressure in the next sub-section
(Pf(i+1)) is calculated from the feed pressure (Pf(i)) and the feed pressure loss (ΔPf(i))
of the previous section:
)()()1( iPiPiP fff (15)

Chapter 10: Mathematical model development and validation
137
Figure 10.2: Schematic diagram of the iteration procedure to determine the pressure drop in a spiral-wound element and the subsequent rejection calculation.
2.3 Solute permeation through membranes
Local real rejection (Rreal(i)) can be expressed by the Spiegler-Kedem equation [129]:
))(1(
))(1(
)(
)(1)(
iF
iF
iC
iCiR
m
preal
(16)
Inputs a. Membrane element characteristics b. Feed solution characteristics c. Transport parameters (Lp, Ps, σ):
obtained from bench‐scale experiments
Overall feed pressure loss ΔPf,actual
Calculate overall feed pressure loss (ΔPf,t)
Input parameters (nF, kfb)
ΔPf,t ≈ ΔPf,actual
No
Yes
Output a. Local and overall rejection b. Hydrodynamic states c. Local compound concentrations
Calculate local rejection (Robs(i)) and apply mass balance calculation
Model Hydrodynamic characteristics of the spiral–wound system
Feed flow and feed pressure measured at the entrance of the first element

Chapter 10: Mathematical model development and validation
138
)(
1exp)( iJ
PiF p
s
(17)
where Ps = permeability coefficient and σ = reflection coefficient both of which can be
obtained from bench-scale experiments. Local observed rejection (Robs(i)) can be
calculated with the local real rejection (Rreal(i)) and local mass transfer coefficient (k(i))
as follows [193]:
)()(
)(exp)(1
)()(
iRik
iJiR
iRiR
realp
real
realobs
(18)
5.06/1
5.0
)(2
753.0)(
L
PehiSc
h
D
K
Kik b
b
(19)
where K = efficiency of mixing net (K = 0.5), D = diffusion coefficient Sc = Schmidt
number (μ/ρ(i)D), Pe = Peclet number (Pe = 2hbUb(i)/D) and μ = viscosity of feed
solution.
140
8.2475 1010141.2 T (20)
Once the local observed rejection (Robs(i)) is determined, the local permeate
concentration (Cp(i)) can also be calculated using local feed concentration (Cf(i)) using
equation 21. Then local feed concentration in the following sub-section (Cf(i+1)) can be
expressed by equation 22. The overall permeate concentration of an element j (Cp(j))
can be calculated by totalling mass transport in all sub-sections of the membrane
element as described in equation 23.
))(1)(()( iRiCiC obsfp (21)
)1(
)()()()()1(
iQ
iCiQiCiQiC
f
ppfff (22)
Chapter 10: Mathematical model development and validation
139
m
ip
m
ipp
p
iQ
iQiCjC
1
1
)(
)()()( (23)
Because permeate streams from each membrane element blend in the combined
permeate stream, solute rejection by a certain number (n) of membrane elements need to
be evaluated using the combined concentration. The combined permeate concentration
of n elements (Cp(n)), combined observed solute rejection of n elements (Robs(n)), and
recovery of n elements (Rc(n)) can be calculated as follows:
n
jp
n
jpp
p
jQ
jQjC
nC
1
1
)(
)()(
)( (24)
)(
)()()(
jC
nCjCnR
f
pfobs
, j = 1 (25)
)(
)(
)( 1
jQ
jQ
nRf
n
jp
c
, j = 1 (26)
The iterative procedure to determine the hydrodynamic constants (Eqs 1 – 15) and
solute transport following the irreversible thermodynamic principle described Eqs 16 –
26 above provide the basis for this mathematical model as schematically summarised in
Figure 10.2.
3 Materials and methods
3.1 Pilot-scale filtration system and RO element
A pilot-scale filtration system was used (Figure 3.2). Specification of the bench-scale
filtration system is described in Chapter 3, Section 4.2. Three ESPA2-4040
(Hydranautics, Oceanside, CA, USA) spiral wound elements were used. The ESPA2-
4040 membrane element has an equivalent length of 1.016 m, actual membrane sheet
length (L) of 0.9 m, membrane area (S) of 7.9 m2, and feed channel height (hb) of 6.60 ×
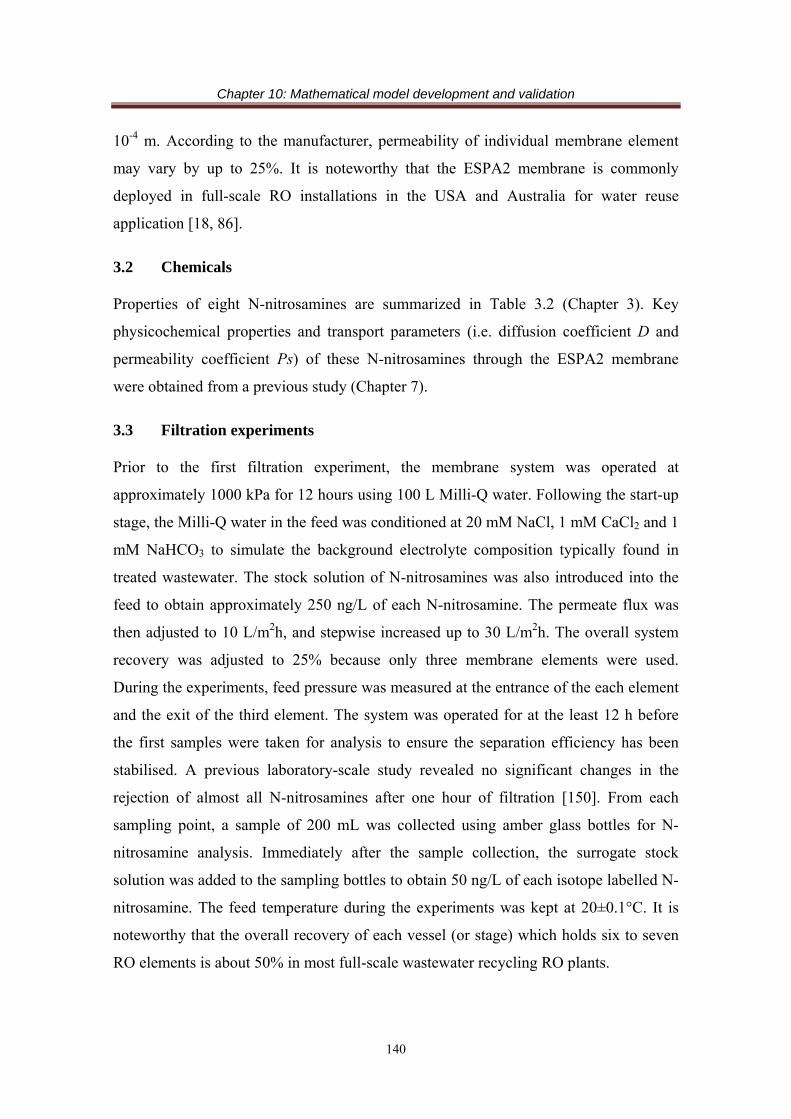
Chapter 10: Mathematical model development and validation
140
10-4 m. According to the manufacturer, permeability of individual membrane element
may vary by up to 25%. It is noteworthy that the ESPA2 membrane is commonly
deployed in full-scale RO installations in the USA and Australia for water reuse
application [18, 86].
3.2 Chemicals
Properties of eight N-nitrosamines are summarized in Table 3.2 (Chapter 3). Key
physicochemical properties and transport parameters (i.e. diffusion coefficient D and
permeability coefficient Ps) of these N-nitrosamines through the ESPA2 membrane
were obtained from a previous study (Chapter 7).
3.3 Filtration experiments
Prior to the first filtration experiment, the membrane system was operated at
approximately 1000 kPa for 12 hours using 100 L Milli-Q water. Following the start-up
stage, the Milli-Q water in the feed was conditioned at 20 mM NaCl, 1 mM CaCl2 and 1
mM NaHCO3 to simulate the background electrolyte composition typically found in
treated wastewater. The stock solution of N-nitrosamines was also introduced into the
feed to obtain approximately 250 ng/L of each N-nitrosamine. The permeate flux was
then adjusted to 10 L/m2h, and stepwise increased up to 30 L/m2h. The overall system
recovery was adjusted to 25% because only three membrane elements were used.
During the experiments, feed pressure was measured at the entrance of the each element
and the exit of the third element. The system was operated for at the least 12 h before
the first samples were taken for analysis to ensure the separation efficiency has been
stabilised. A previous laboratory-scale study revealed no significant changes in the
rejection of almost all N-nitrosamines after one hour of filtration [150]. From each
sampling point, a sample of 200 mL was collected using amber glass bottles for N-
nitrosamine analysis. Immediately after the sample collection, the surrogate stock
solution was added to the sampling bottles to obtain 50 ng/L of each isotope labelled N-
nitrosamine. The feed temperature during the experiments was kept at 20±0.1°C. It is
noteworthy that the overall recovery of each vessel (or stage) which holds six to seven
RO elements is about 50% in most full-scale wastewater recycling RO plants.

Chapter 10: Mathematical model development and validation
141
3.4 Analytical technique
N-nitrosamine concentrations were analysed using an analytical method described in
Chapter 3, Section 5.1.
4 Results and discussion
4.1 Determination of model parameters
The pressure of each sub-section within the membrane system was calculated from the
pressure of the previous sub-section and the local pressure drop. The local pressure drop
(ΔP(i)) was determined using equation 11. The feed friction parameter (ffb), which is
dependent upon the geometry of membrane element and operating conditions [190, 191],
was obtained using the iteration procedure outline in Figure 10.2 to minimise the
difference between the modelled and observed feed pressure to less than 5% at an
average permeate flux of 10, 20, and 30 Lm2/h (Figure 10.3). In this study, ffb values of
10, 20 and 30 Lm2/h were 3.9, 4.3 and 5.5, respectively. Knowing the membrane
permeability, the local permeate flux can then be calculated based on the local pressure.
Subsequently, the overall permeate flux can also be calculated. In fact, the simulated
permeate flux only deviated slightly from the observed value at the applied pressure of
1.0 MPa (Figure 10.4). These results indicate that the model can adequately simulate the
hydrodynamic condition (i.e. feed pressure and permeate flow) within the RO
membrane elements. The small deviation observed in Figure 10.4 may be attributed to
the fact that the determined ffb value was used for the entire system as well as the
difference in permeability of membranes that were used in the fundamental and pilot-
scale experiments. There can be some variation in permeability between different areas
of the same membrane element or between different batches of production (Chapter 3,
Section 2). As the applied pressure increases, the pressure drop across the membrane
element increases resulting in a larger deviation between the simulated and
experimentally obtained values.

Chapter 10: Mathematical model development and validation
142
Figure 10.3: Observed and modelled feed pressure within three RO elements (overall permeate flux = 10, 20 and 30 L/m2h; feed solution contains 20 mM NaCl, 1 mM NaHCO3, and 1 mM CaCl2; feed temperature = 20.0 ± 0.1 °C).
Figure 10.4: Observed and modelled overall permeate flux as a function of the feed pressure at the system entrance (feed solution contains 20 mM NaCl, 1 mM NaHCO3, and 1 mM CaCl2; feed temperature = 20.0 ± 0.1 °C).
4.2 N-nitrosamine rejection
All N-nitrosamines used in this study are uncharged in the tested solution (pH 8). In
general, the rejection of uncharged solutes by NF/RO membranes generally increases as
permeate flux increases [189]. A similar trend using N-nitrosamines was also reported
in a previous laboratory-scale study by Fujioka et al. [150]. As expected, the simulated
rejection values of three lowest molecular weight N-nitrosamines (i.e. NDMA, NMEA
0.0 0.5 1.0 1.5 2.0 2.50.2
0.4
0.6
0.8
1.0
1.2
Observed Modelled
30 L/m2h 20 L/m2h 10 L/m2h
Fee
d P
ress
ure
[MP
a]
Distance from the entrance [m]
21
Element Position [-]
3
0.2 0.4 0.6 0.8 1.0 1.20
10
20
30
40
Observed ModelledA
vera
ged
Per
mea
te F
lux
[L/m
2 h]
Feed Pressure [MPa]
Chapter 10: Mathematical model development and validation
143
and NPYR) increased when the overall (system) permeate flux increased (Figure 10.5).
Among these three N-nitrosamines, modelled NDMA rejection showed the most
significant increase from 31 to 54% with increasing overall permeate flux from 10 to 30
L/m2h, respectively. The impact of permeate flux on N-nitrosamine rejection was less
significant as their molecular weights increase. The modelled rejections were
comparable with the observed rejections at three different overall permeate fluxes (i.e.
10, 20 and 30 L/m2h) investigated here. Results from Figure 10.5 indicate that the
developed model is capable of describing N-nitrosamine rejection at a range of
permeate flux. It is also noteworthy that rejection values obtained from the model are
conservative. In other word, the modelled rejections of NDMA, NMEA, and NPYR
were slightly smaller than values obtained experimentally.
Modelled rejections of the other N-nitrosamines (i.e. NDEA, NPIP, NDPA, NMOR and
NDBA) were over 90%. As a result, only a slight increase in rejection was found with
increasing overall permeate flux (data not shown). In fact, pilot-scale experiments
conducted in this study revealed that the observed rejections of these N-nitrosamines
were over 90% and no discernible variation in rejection was observed for changes in
permeate flux (Figure 10.6).
Figure 10.5: Observed and modelled overall rejection of NDMA, NMEA and NDEA (feed solution contains 20 mM NaCl, 1 mM NaHCO3, 1 mM CaCl2; feed temperature = 20.0 ± 0.1 °C).
10 15 20 25 300
20
40
60
80
100
Permeate Flux [L/m2h]
Modelled Observed
NPYR NMEA NDMA
Rej
ecito
n [%
]

Chapter 10: Mathematical model development and validation
144
Figure 10.6: Overall rejection of N-nitrosamines by the pilot-scale experiments (overall permeate flux = 10, 20 and 30 L/m2h; feed solution contains 20 mM NaCl, 1 mM NaHCO3, and 1 mM CaCl2; feed temperature = 20.0 ± 0.1 °C). Open symbols indicate that the permeate concentration was below the instrumental detection limit. Values reported here are the average and ranges of duplicate results.
4.3 Impact of recoveries
In full-scale RO plants, solute rejection can vary depending on the element position
within a vessel and the overall train due to changes in hydrodynamic states and solution
characteristics. The variation in solute rejection was investigated by extending the
model calculation from three elements to seven elements and the rejections were plotted
against recovery (Figure 10.7). The model showed approximately 50% recovery with
seven RO membrane elements, which is equivalent to one vessel of the first stage in a
full-scale RO train deployed for water reclamation applications. The simulated
rejections of the three N-nitrosamines decreased when recovery increased (Figure 10.7).
When the recovery of the RO system increased from 10 to 50%, the modelled rejection
of NDMA decreased remarkably from 49 to 35%. Likewise, for the same change in
recovery, the rejections of NMEA and NPYR also decreased from 81 to 72% and from
89 to 83%, respectively. The observed rejections of these three N-nitrosamines were
similar to the modelled rejections (Figure 10.7).
80 100 120 140 1600
20
40
60
80
100
30 L/m2h
20 L/m2h
10 L/m2h
Rej
ectio
n [%
]
Molecular Weight [g/mol]
ND
MA
NM
EA
NM
OR
NP
YR
ND
EA
NP
IP
ND
PA
ND
BA

Chapter 10: Mathematical model development and validation
145
Figure 10.7: Effects of recovery on the rejection of NDMA, NMEA and NPYR (feed solution contains 20 mM NaCl, 1 mM NaHCO3, and 1 mM CaCl2; feed temperature = 20.0 ± 0.1 °C).
Changes in the localised rejection of NDMA within a membrane vessel containing
several elements were further investigated by examining the variation in hydrodynamic
states and mass transfers. As filtration progresses, local feed pressure decreases due to
increases in pressure loss and osmotic pressure (Figure 10.8). As a result of the reduced
driving force, local permeate flux decreases along with the progress of the filtration.
Since permeate flux affects the rejection of N-nitrosamines [183], the local NDMA
rejection could also decrease. It is also noteworthy that an increase in TDS along with
filtration also causes a slight decrease in N-nitrosamine rejection [183]. In addition,
rejected compounds remain in the feed stream, leading to an increase in NDMA
concentration in the subsequent feed and permeate. The increased NDMA concentration
in the permeate stream contributes to deteriorations in the overall rejection of solutes,
since the overall rejection is calculated based on solute concentrations in the feed
solution and combined permeate solution as described in equation 25. Thus, the
simulation results reported here could explain the discrepancy between laboratory scale
results with very low recovery and those from full-scale RO plants for water recycling
applications with about 85% recovery [122].
10 20 30 40 500
20
40
60
80
100
Modelled Observed NPYR NMEA NDMA
Rej
ectio
n [%
]
Recovery [%]
765432
Modelled Element Position [-]
1

Chapter 10: Mathematical model development and validation
146
Figure 10.8: Variation in (a) feed pressure, (b) local permeate flux, (c) NDMA rejeciton and (d) NDMA concentration in the feed and permeate (feed solution contains 20 mM NaCl, 1 mM NaHCO3, and 1 mM CaCl2; feed temperature = 20.0 ± 0.1 °C).
5 Conclusions
The developed model successfully simulated the hydrodynamic states (i.e. pressure and
permeate flow) of the pilot-stale plant. The modelled results revealed that changes in
permeate flux (from 10 to 30 L/m2h) considerably affected the rejection of low
molecular weight N-nitrosamines such as NDMA (from 31 to 54%). The modelled N-
0.0
0.2
0.4
0.6
0
10
20
30
0
20
40
60
80
100
0 1 2 3 4 5 60
100
200
300
400
500
Feed Pressure
Cumulative Pressure Loss
Osmotic Pressure
(d) NDMA Concentration
(c) NDMA Rejection
(b) Permeate Flux
(a) Pressure
P
ress
ure
[MP
a]
Local Permeate Flux
Per
mea
te F
lux
[L/m
2 h]
NDMA Rejection
Rej
ectio
n [
%]
1 2 3 4 5 6 7
Element Position [-]
Permeate
Feed
Con
cent
ratio
n [n
g/L]
Distance From the Entrance [m]

Chapter 10: Mathematical model development and validation
147
nitrosamine rejections at each permeate flux were in a good agreement with
experimentally determined N-nitrosamine rejections. Modelling conditions simulating a
vessel with seven spiral-wound membrane elements revealed that recovery plays an
important role in the rejection of low-molecular weight N-nitrosamines. In particular,
when recovery changed from 10 to 50% by increasing the number of elements from one
to seven, NDMA rejection decreased considerably from 49 to 35%. Additional
simulation using the model revealed that the local NDMA rejection decreased with
NDMA concentration increasing along the flow path from the first to the last stage,
resulting in a decrease in the overall rejection of NDMA.

Chapter 11: Conclusions
148
Chapter 11
Conclusions
The rejection of N-nitrosamines by RO membranes was systematically investigated in
the context of indirect potable water reuse. Specific objectives of this study were to:
1) Evaluate the rejection of N-nitrosamines by RO membranes under a range of operating conditions;
2) Examine the impact of fouling and chemical cleaning on N-nitrosamine rejection;
3) Elucidate the mechanisms of permeation of N-nitrosamines through RO membranes; and
4) Develop a full-scale rejection model of N-nitrosamines and validate the model using a pilot-scale RO system.
In chapter 4, the rejection of eight N-nitrosamines was investigated, focusing on the
influence of feed solution characteristics on their separation by low pressure RO
membranes. In general, the rejection of N-nitrosamines by a given membrane increased
in the order of increasing molecular weight, suggesting that steric hindrance was a
dominating rejection mechanism of N-nitrosamines. The results presented in this
chapter indicate that pH, ionic strength, and temperature of the feed solution can exert
an influence on the rejection of NDMA and in some cases other N-nitrosamines. It is
striking that an increase in the feed temperature led to a significant decrease in the
rejection of all N-nitrosamines.
In chapter 5, the impact of fouling on N-nitrosamine rejection was investigated using
tertiary treated effluent and several model fouling solutions. In general, the rejection of
N-nitrosamines increased when the membranes were fouled by tertiary effluent. The
rejection of small molecular weight N-nitrosamines was most affected by membrane
fouling. The effect of membrane fouling caused by model foulants on N-nitrosamine
rejection was considerably less than that caused by tertiary effluent. Size exclusion
chromatography analyses revealed that the tertiary effluent contains a high fraction of

Chapter 11: Conclusions
149
low molecular weight (< 500 g/mol) organic substances. It appears that these low
molecular weight foulants present in the tertiary effluent can restrict the solute pathway
within the active skin layer of membranes, resulting in the observed increase of solute
rejection.
In chapter 6, the impact of chemical cleaning on the removal of N-nitrosamines was
investigated. The results show that caustic chemical cleaning resulted in an increase in
membrane permeability but caused a notable decrease in the rejection of N-nitrosamines.
The impact was particularly obvious for NDMA and NMEA, which have the lowest
molecular weight amongst the N-nitrosamines investigated in this study. The rejection
of conductivity also decreased as the membrane permeability increased, indicating that
conductivity rejection can be an indicative parameter of predicting changes in NDMA
and NMEA rejection during RO plant operation. The impact of caustic cleaning was not
permanent and could be significantly reduced by a subsequent acidic cleaning step.
In chapter 7, the influence of membrane characteristics on the rejection of eight N-
nitrosamines was investigated using one NF, one SWRO and six LPRO membranes.
The rejection of the two lowest molecular weight N-nitrosamines, NDMA and NMEA,
varied in the range from 8–82% and 23–94%, respectively. In general, the rejection of
NDMA and NMEA increased with decreasing membrane permeability. The impact of
membrane characteristics became less important for higher molecular weight N-
nitrosamines. Results reported here suggest that membrane characteristics associated
with permeability such as the pore size and thickness of the active skin layer might be a
key factor determining N-nitrosamine rejection.
In chapter 8, free-volume hole-radii of the active skin layer of one SWRO (SWC5) and
two LPRO membranes (ESPA2 and ESPAB) were evaluated using PALS technique to
provide insights to the transport of these small solutes through RO membranes. PALS
analysis showed that the SWC5 has the smallest mean free-volume hole-radius (0.259
nm) among the three RO membranes investigated here. Correspondingly, the SWC5
membrane exhibited the highest rejection of boric acid and all N-nitrosamines. The
EPSA2 and ESPAB were determined to have mean free-volume hole-radius of 0.289
nm. However, the ESPAB membrane had lower water permeability and showed

Chapter 11: Conclusions
150
considerably higher rejection of boric acid and NDMA than the ESPA2 membrane.
These results suggest that in addition to the mean free-volume hole-radius, other
membrane parameters and properties such as the free-volume hole-radius distribution
and thickness of the active skin layer can also play a role in governing the rejection of
small and uncharged solutes by RO membranes.
In chapter 9, the rejection of N-nitrosamines was investigated using full-scale RO
systems to provide longitudinal and spatial insights during sampling campaigns. Overall
rejection of NDMA among the three RO systems varied widely from 4 to 47%. A
considerable variation in NDMA rejection across the three RO stages (14-78%) was
also observed. Overall NMOR rejections were consistently high ranging from 81 to
84%. On the other hand, overall rejection of NDEA varied from negligible to 53%,
which was considerably lower than values reported in previous laboratory-scale studies.
A comparison between results reported here and the literature indicates that there can be
some discrepancy in N-nitrosamine rejection data between laboratory- and full-scale
studies probably due to differences in water recoveries and operating conditions (e.g.
temperature, membrane fouling, and hydraulic conditions).
In chapter 10, a mathematical model was developed based on the irreversible
thermodynamic principle and hydrodynamic calculation to predict the rejection of N-
nitrosamines by spiral-wound RO membrane systems. The developed model is able to
accurately describe the rejection of N-nitrosamines under a range of permeate flux and
system recovery conditions. The modelled N-nitrosamine rejections were in good
agreement with values obtained experimentally using a pilot-scale RO filtration system.
Simulation from the model revealed that an increase in permeate flux from 10 to 30
L/m2h led to an increase in the rejection of low molecular weight N-nitrosamines such
as NDMA (from 31 to 54%), which was validated by experimental results. The
modelling results also revealed that an increase in recovery caused a decrease in the
rejection of these N-nitrosamines, which is consistent with the experimental results.
Further modelling investigations suggested that NDMA rejection by a spiral-wound
system can drop from 49 to 35% when the overall recovery increased from 10 to 50%.
The model developed from this study can be a useful tool for water utilities and

Chapter 11: Conclusions
151
regulators for system design and evaluating the removal of N-nitrosamine by RO
membranes.
Overall, this thesis provides a comprehensive knowledge and findings with regards to
N-nitrosamine rejection by RO membranes. The results reported here indicate that
changing operating conditions doesn’t sufficiently result in an improvement of N-
nitrosamine rejection. Nevertheless, plant operators need to be aware that the rejection
of low molecular weight N-nitrosamines can vary significantly over time due to
membrane fouling and chemical cleaning. The results reported here also suggest that the
rejection of low molecular weight N-nitrosamines (e.g. NDMA) can be improved by
selecting appropriate LPRO membranes, indicating that membrane selection is
important during RO system design. The last findings with regards to modelling
revealed that the RO system designs for N-nitrosamine rejection can be easily extended
using simple laboratory-scale experiments which may potentially cut the cost of design
and validation and during pilot-scale experiments and full-scale plant commissioning.

Chapter 12: Future research
152
Chapter 12
Future research
A comprehensive investigation in regard to the impact of feed solution characteristics,
fouling and chemical cleaning was conducted using a laboratory-scale RO system
(Chapter 4-6). Although the importance of each factor on the variation of N-nitrosamine
rejection during full-scale system operation has been identified through these
laboratory-scale studies, the impact of changes in multiple factors still remain
unconfirmed using a full-scale RO system (Chapter 9). A long-term investigation with
frequent full-scale samplings and monitoring will assist the identification of the
importance of each factor during full-scale system operation.
Understanding the mechanism of N-nitrosamine transport within the active skin layer of
RO membranes can potentially allow us to improve N-nitrosamine rejection by
controlling the important parameters during manufacturing or modifying existing RO
membranes. Membrane properties associated with membrane permeability such as the
free-volume hole-radius are likely to determine N-nitrosamine rejection (Chapter 7, 8).
Nevertheless, free-volume hole-radius is not the only one important factor and there still
remain potential membrane properties determining their rejection. Thus, further work is
necessary to examine the impact of several other physicochemical properties of RO
membranes (e.g. distribution of mean free-volume hole-radius and thickness of the
active skin layer) on N-nitrosamine rejection.
A mathematical model simulating hydrodynamic conditions of spiral wound RO
membranes was developed and the model was validated under a range of permeate flux
conditions using a pilot-scale RO system (Chapter 10). Further work is required to
examine the effects of several other factors (e.g. feed water characteristics, fouling and
chemical cleaning) on N-nitrosamine rejection using a pilot-scale plant and incorporate
these effects into the model. Validating the model using a full-scale RO system, which
Chapter 12: Future research
153
generally comprise three stages in series, will also be beneficial to ensure the accuracy
of its prediction.
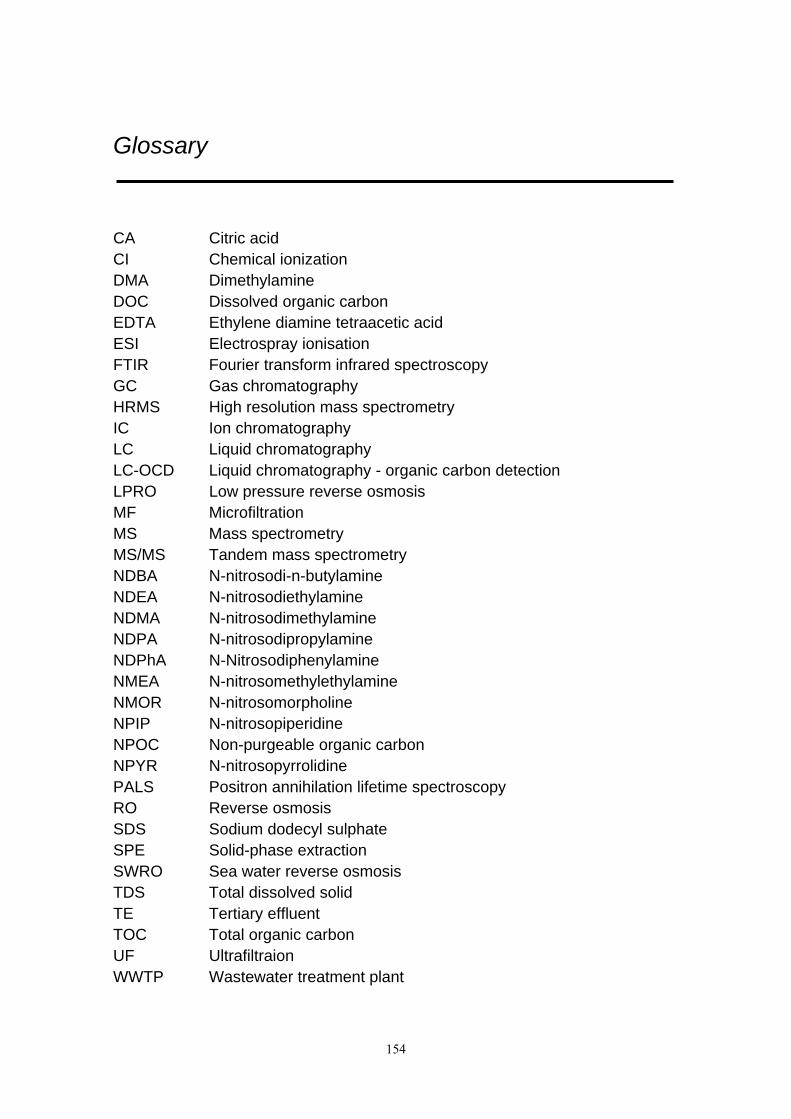
154
Glossary
CA Citric acid CI Chemical ionization DMA Dimethylamine DOC Dissolved organic carbon EDTA Ethylene diamine tetraacetic acid ESI Electrospray ionisation FTIR Fourier transform infrared spectroscopy GC Gas chromatography HRMS High resolution mass spectrometry IC Ion chromatography LC Liquid chromatography LC-OCD Liquid chromatography - organic carbon detection LPRO Low pressure reverse osmosis MF Microfiltration MS Mass spectrometry MS/MS Tandem mass spectrometry NDBA N-nitrosodi-n-butylamine NDEA N-nitrosodiethylamine NDMA N-nitrosodimethylamine NDPA N-nitrosodipropylamine NDPhA N-Nitrosodiphenylamine NMEA N-nitrosomethylethylamine NMOR N-nitrosomorpholine NPIP N-nitrosopiperidine NPOC Non-purgeable organic carbon NPYR N-nitrosopyrrolidine PALS Positron annihilation lifetime spectroscopy RO Reverse osmosis SDS Sodium dodecyl sulphate SPE Solid-phase extraction SWRO Sea water reverse osmosis TDS Total dissolved solid TE Tertiary effluent TOC Total organic carbon UF Ultrafiltraion WWTP Wastewater treatment plant
155
List of symbols
Chapter 4
Cb concentration in the feed (ng/L) Cm membrane concentration (ng/L) Cp permeate concentration (ng/L) dh hydraulic diameter (m) D diffusion coefficient (m2/s) Js solute flux (m/s) Jv water flux, volume flux, permeate flux (m/s) k mass transfer coefficient (m/s) L* length of the entry region (m) L the length of the membrane (m) Lp pure water permeability (L/m2h) Ps solute permeability coefficient (m/s) Re Reynolds number (-) Robs observed rejection (-) Rreal real rejection (-) Sc Schmidt number (-) Sh Sherwood number (-) u feed velocity (m/s) ∆P Pressure difference between the feed and permeate sides (Pa) ∆x membrane thickness (m) σ reflection coefficient (-) ∆π osmotic pressure difference between the feed and permeate sides (Pa)
Chapter 7
Cb concentration in the feed (ng/L) Cm membrane concentration (ng/L) Cp permeate concentration (ng/L) dh hydraulic diameter (m) D diffusion coefficient (m2/s) Js solute flux (m/s) Jv water flux, permeate flux (m/s) k mass transfer coefficient (m/s) L the length of the membrane (m) Lp pure water permeability (L/m2h)

156
Ps solute permeability coefficient (m/s) Re Reynolds number (-) Robs observed rejection (-) Rreal real rejection (-) Sc Schmidt number (-) Sh Sherwood number (-) u feed velocity (m/s) ∆P pressure difference between the feed and permeate sides (Pa) x position in a pore from inlet (m) ∆x membrane thickness (m) σ reflection coefficient (-) ∆π osmotic pressure difference between the feed and permeate sides (Pa)
Chapter 8
r the radius of the free volume hole Vf free-volume hole-space τo-Ps o-Ps lifetime Vm molecular volume
Chapter 9
Cpi solute concentration in the RO permeate of the stage i Cfi solute concentration in the RO feed of the stage i CpT solute concentration in the combined RO permeate
Chapter 10
Cf feed concentration [kg/m3] Cp permeate concentration [kg/m3] dh hydraulic diameter [m] D diffusion coefficient [m2/s] hb feed channel height [m] i number of sub-section [-] j number of element [-] ffb feed friction parameter [-] Jp permeate flux [m3/m2s] k mass transfer coefficient [m/s] K efficiency of mixing net [-] L membrane sheet length [m] Lp pure water permeability [L/m2hPa] m number of sub-sections in a membrane sheet [-] msalt molar concentrations of ions [mol/L]

157
n quantity of elements [-] Pe Peclet number [-] Pf feed pressure [Pa] Pp permeate pressure [Pa] ΔP pressure drop [Pa] Ps permeability coefficient of a compound [m/s] Qf feed flow rate [m3/s] Qp permeate flow rate [m3/s] Rc recovery [-] Robs observed rejection [-] Rreal real rejection [-] Rsalt salt rejection [-] ΔS valid surface area [m] ΔSc cross-section area [m] Sc Schmidt number [-] T solution temperature [°C] Ub bulk velocity of the feed within the feed channel [m/s] W membrane sheet width [m] Δx sub-section length [m] ρ density of solution [kg/m3] σ reflection coefficient [-] π osmotic pressure [Pa] µ viscosity of feed solution [Pa-s]
158
References
[1] M.A. Shannon, P.W. Bohn, M. Elimelech, J.G. Georgiadis, B.J. Marinas, A.M. Mayes, Science and technology for water purification in the coming decades, Nature, 452 (2008) 301-310.
[2] W.H. Traves, E.A. Gardner, B. Dennien, D. Spiller, Towards indirect potable reuse in south east Queensland, Water Sci. Technol., 58 (2008) 153-161.
[3] C. Bellona, J.E. Drewes, P. Xu, G. Amy, Factors affecting the rejection of organic solutes during NF/RO treatment - A literature review, Water Res., 38 (2004) 2795-2809.
[4] A.R.D. Verliefde, S.G.J. Heijman, E.R. Cornelissen, G.L. Amy, B. Van der Bruggen, J.C. van Dijk, Rejection of trace organic pollutants with high pressure membranes (NF/RO), Environ. Prog., 27 (2008) 180-188.
[5] G. Oron, L. Gillerman, A. Bick, N. Buriakovsky, Y. Manor, E. Ben-Yitshak, L. Katz, J. Hagin, A two stage membrane treatment of secondary effluent for unrestricted reuse and sustainable agricultural production, Desalination, 187 (2006) 335-345.
[6] W.A. Mitch, J.O. Sharp, R.R. Trussell, R.L. Valentine, L. Alvarez-Cohen, D.L. Sedlak, N-Nitrosodimethylamine (NDMA) as a drinking water contaminant: A review, Environ. Eng. Sci., 20 (2003) 389-404.
[7] S.W. Krasner, P. Westerhoff, B. Chen, B.E. Rittmann, G. Amy, Occurrence of disinfection byproducts in United States wastewater treatment plant effluents, Environ. Sci. Technol., 43 (2009) 8320-8325.
[8] M. Krauss, P. Longrée, E. van Houtte, J. Cauwenberghs, J. Hollender, Assessing the fate of Nitrosamine precursors in wastewater treatment by physicochemical fractionation, Environ. Sci. Technol., 44 (2010) 7871-7877.
[9] C. Reyes-Contreras, C. Domínguez, J.M. Bayona, Determination of nitrosamines and caffeine metabolites in wastewaters using gas chromatography mass spectrometry and ionic liquid stationary phases, J. Chromatogr. A, 1261 (2012) 164-170.
[10] S. Yoon, N. Nakada, H. Tanaka, A new method for quantifying N-nitrosamines in wastewater samples by gas chromatography—triple quadrupole mass spectrometry, Talanta, 97 (2012) 256-261.
[11] J. Nawrocki, P. Andrzejewski, Nitrosamines and water, J. Hazard. Mater., 189 (2011) 1-18.
[12] M.J. Farré, K. Döderer, L. Hearn, Y. Poussade, J. Keller, W. Gernjak, Understanding the operational parameters affecting NDMA formation at Advanced Water Treatment Plants, J. Hazard. Mater., 185 (2011) 1575-1581.
[13] USEPA, N-Nitrosodimethylamine (CASRN 62-75-9) - Integrated risk information system (IRIS), http://www.epa.gov/iris/subst/0045.htm (1993).
[14] NRMMC, EPHC, AHMC, Australian guidelines for water recycling: Managing health and environmental risks (Phase 2): Augmentation of drinking water supplies, Environment Protection and Heritage Council, National Health and
159
Medical Research Council, Natural Resource Management Ministerial Council, Canberra, 2008.
[15] K.O. Agenson, J.-I. Oh, T. Urase, Retention of a wide variety of organic pollutants by different nanofiltration/reverse osmosis membranes: controlling parameters of process, J. Membr. Sci., 225 (2003) 91-103.
[16] L.D. Nghiem, A.I. Schäfer, M. Elimelech, Removal of natural hormones by nanofiltration membranes: Measurement, modeling, and mechanisms, Environ. Sci. Technol., 38 (2004) 1888-1896.
[17] C. Bellona, J.E. Drewes, G. Oelker, J. Luna, G. Filteau, G. Amy, Comparing nanofiltration and reverse osmosis for drinking water augmentation, Journal AWWA, 100 (2008) 102-116.
[18] M.H. Plumlee, M. López-Mesas, A. Heidlberger, K.P. Ishida, M. Reinhard, N-nitrosodimethylamine (NDMA) removal by reverse osmosis and UV treatment and analysis via LC-MS/MS, Water Res., 42 (2008) 347-355.
[19] T. Wintgens, T. Melin, A. Schäfer, S. Khan, M. Muston, D. Bixio, C. Thoeye, The role of membrane processes in municipal wastewater reclamation and reuse, Desalination, 178 (2005) 1-11.
[20] J. Drewes, S. Khan, Chapter 16: Water reuse for drinking water augmentation, in: American Water Works Association, J.K. Edzwald (Eds.) Water Quality & Treatment: A Handbook on Drinking Water, 6th Edition, McGraw-Hill Professional, 2011.
[21] D. Sedlak, M. Kavanaugh, Removal and destruction of NDMA and NDMA precursors during wastewater treatment, WateReuse Foundation, (2006).
[22] W.A. Mitch, A.C. Gerecke, D.L. Sedlak, A N-Nitrosodimethylamine (NDMA) precursor analysis for chlorination of water and wastewater, Water Res., 37 (2003) 3733-3741.
[23] E. Pehlivanoglu-Mantas, E.L. Hawley, R.A. Deeb, D.L. Sedlak, Formation of nitrosodimethylamine (NDMA) during chlorine disinfection of wastewater effluents prior to use in irrigation systems, Water Res., 40 (2006) 341-347.
[24] IARC, IARC monographs on the evaluation of carcinogenic risks to humans: Overall evaluations of carcinogenicity: An updating of IARC monographs volumes 1 - 42: Supplement 7, International agency for research on cancer, (1987).
[25] USEPA, Integrated Risk Information System (IRIS), http://www.epa.gov/iris/ (1993).
[26] I.M. Schreiber, W.A. Mitch, Influence of the order of reagent addition on NDMA formation during chloramination, Environ. Sci. Technol., 39 (2005) 3811-3818.
[27] W.A. Mitch, G.L. Oelker, E.L. Hawley, R.A. Deeb, D.L. Sedlak, Minimization of NDMA formation during chlorine disinfection of municipal wastewater by application of pre-formed chloramines, Environ. Eng. Sci., 22 (2005) 882-890.
[28] D.W. Hawker, J.L. Cumming, P.A. Neale, M.E. Bartkow, B.I. Escher, A screening level fate model of organic contaminants from advanced water treatment in a potable water supply reservoir, Water Res., 45 (2011) 768-780.
[29] J.E. Drewes, C. Hoppe, T. Jennings, Fate and transport of N-Nitrosamines under conditions simulating full-scale groundwater recharge operations, Water Environment Research, 78 (2006) 2466-2473.
160
[30] M. Wilf, S. Alt, Application of low fouling RO membrane elements for reclamation of municipal wastewater, Desalination, 132 (2000) 11-19.
[31] J.E. Drewes, C. Bellona, M. Oedekoven, P. Xu, T.-U. Kim, G. Amy, Rejection of wastewater-derived micropollutants in high-pressure membrane applications leading to indirect potable reuse, Environ. Prog., 24 (2005) 400-409.
[32] A.A. Alturki, N. Tadkaew, J.A. McDonald, S.J. Khan, W.E. Price, L.D. Nghiem, Combining MBR and NF/RO membrane filtration for the removal of trace organics in indirect potable water reuse applications, J. Membr. Sci., 365 (2010) 206-215.
[33] L.S. Tam, T.W. Tang, G.N. Lau, K.R. Sharma, G.H. Chen, A pilot study for wastewater reclamation and reuse with MBR/RO and MF/RO systems, Desalination, 202 (2007) 106-113.
[34] S.B. Sadr Ghayeni, P.J. Beatson, R.P. Schneider, A.G. Fane, Water reclamation from municipal wastewater using combined microfiltration-reverse osmosis (ME-RO): Preliminary performance data and microbiological aspects of system operation, Desalination, 116 (1998) 65-80.
[35] R.D. Reardon, SParanjape Sudan V., X.J. Foussereau, F.A. DiGiano, M.D. Aitken, J.H. Kim, S.-Y. Chang, R. Cramer, Membrane treatment of secondary effluent for subsequent use, in, Water Environment Research Fondation, Alexandria, VA, 2005.
[36] Y. Poussade, A. Roux, T. Walker, V. Zavlanos, Advanced oxidation for indirect potable reuse: a practical application in Australia, Water Sci. Technol., 60 (2009) 2419-2424.
[37] Y.-Y. Zhao, J. Boyd, S.E. Hrudey, X.-F. Li, Characterization of new Nitrosamines in drinking water using liquid chromatography tandem mass spectrometry, Environ. Sci. Technol., 40 (2006) 7636-7641.
[38] E. Steinle-Darling, M. Zedda, M.H. Plumlee, H.F. Ridgway, M. Reinhard, Evaluating the impacts of membrane type, coating, fouling, chemical properties and water chemistry on reverse osmosis rejection of seven nitrosoalklyamines, including NDMA, Water Res., 41 (2007) 3959-3967.
[39] B. Spiegelhalder, R. Preussmann, Contamination of toiletries and cosmetic products with volatile and nonvolatile N-nitroso carcinogens, J. Cancer Res. Clin. Oncol., 108 (1984) 160-163.
[40] D.L. Sedlak, R.A. Deeb, E.L. Hawley, W.A. Mitch, T.D. Durbin, S. Mowbray, S. Carr, Sources and fate of Nitrosodimethylamine and its precursors in municipal wastewater treatment plants, Water Environment Research, 77 (2005) 32-39.
[41] H. Middleton, M.R. Moore, H. Chapman, F. Leusch, B. Tan, R. Drew, J. Frangos, S. Khan, G. Leslie, G. Shaw, Recycled water quality - A guide to determining, monitoring and achieving safe concentrations of chemicals in recycled water (14655), (2008).
[42] Z. Chen, R.L. Valentine, Formation of N-Nitrosodimethylamine (NDMA) from humic substances in natural water, Environ. Sci. Technol., 41 (2007) 6059-6065.
[43] W.A. Mitch, D.L. Sedlak, Characterization and fate of N-Nitrosodimethylamine precursors in municipal wastewater treatment plants, Environ. Sci. Technol., 38 (2004) 1445-1454.

161
[44] R. Shen, S.A. Andrews, Demonstration of 20 pharmaceuticals and personal care products (PPCPs) as nitrosamine precursors during chloramine disinfection, Water Res., 45 (2011) 944-952.
[45] J. Choi, R.L. Valentine, Formation of N-nitrosodimethylamine (NDMA) from reaction of monochloramine: a new disinfection by-product, Water Res., 36 (2002) 817-824.
[46] A.R. Tricker, B. Pfundstein, T. Kalble, R. Preussmann, Secondary amine precursors to nitrosamines in human saliva, gastric juice, blood, urine and faeces, Carcinogenesis, 13 (1992) 563-568.
[47] W.A. Mitch, D.L. Sedlak, Formation of N-Nitrosodimethylamine (NDMA) from dimethylamine during chlorination, Environ. Sci. Technol., 36 (2002) 588-595.
[48] A.C. Gerecke, D.L. Sedlak, Precursors of N-Nitrosodimethylamine in natural waters, Environ. Sci. Technol., 37 (2003) 1331-1336.
[49] W.-J. Zhou, J.M. Boyd, F. Qin, S.E. Hrudey, X.-F. Li, Formation of N-Nitrosodiphenylamine and two new N-containing disinfection byproducts from chloramination of water containing diphenylamine, Environ. Sci. Technol., 43 (2009) 8443-8448.
[50] P. Andrzejewski, B. Kasprzyk-Hordern, J. Nawrocki, N-nitrosodimethylamine (NDMA) formation during ozonation of dimethylamine-containing waters, Water Res., 42 (2008) 863-870.
[51] P. Andrzejewski, J. Nawrocki, N-nitrosodimethylamine (NDMA) as a product of potassium permanganate reaction with aqueous solutions of dimethylamine (DMA), Water Res., 43 (2009) 1219-1228.
[52] J.W.A. Charrois, S.E. Hrudey, Breakpoint chlorination and free-chlorine contact time: Implications for drinking water N-nitrosodimethylamine concentrations, Water Res., 41 (2007) 674-682.
[53] W. Lee, P. Westerhoff, J.-P. Croué, Dissolved organic nitrogen as a precursor for chloroform, dichloroacetonitrile, N-Nitrosodimethylamine, and trichloronitromethane, Environ. Sci. Technol., 41 (2007) 5485-5490.
[54] A.D. Shah, W.A. Mitch, Halonitroalkanes, Halonitriles, Haloamides, and N-Nitrosamines: A Critical Review of Nitrogenous Disinfection Byproduct Formation Pathways, Environ. Sci. Technol., 46 (2011) 119-131.
[55] I.M. Schreiber, W.A. Mitch, Nitrosamine formation pathway revisited: The importance of chloramine speciation and dissolved oxygen, Environ. Sci. Technol., 40 (2006) 6007-6014.
[56] J. Choi, R.L. Valentine, N-Nitrosodimethylamine formation by free-chlorine-enhanced nitrosation of dimethylamine, Environ. Sci. Technol., 37 (2003) 4871-4876.
[57] J.W.A. Charrois, J.M. Boyd, K.L. Froese, S.E. Hrudey, Occurrence of N-nitrosamines in Alberta public drinking-water distribution systems J. Environ. Eng. Sci., 6 (2007) 103-114.
[58] USEPA, Second cycle of the unregulated contaminant monitoring regulation (UCMR2) data summary, in, U.S. Environmental Protection Agency, 2010.
[59] CDPH, NDMA and other Nitrosamines - Drinking water issues (http://www.cdph.ca.gov/certlic/drinkingwater/Pages/NDMA.aspx), California Department of Public Health 2011.

162
[60] Ontario MOE, Technical support document for Ontario drinking water standards, objectives and guidelines, Ontario Ministry of the Environment, Ontario, 2003.
[61] WHO, Guidelines for drinking-water quality 4th edition, in, World Health Organization, Geneva, 2011.
[62] NHMRC, NRMMC, Australian drinking water guidelines paper 6 national water quality management strategy, National Healthand Medical Research Council, National Resource Management Ministerial Council, Commonwealth of Australia, Canberra, 2011.
[63] USEPA, Contaminant information sheets for the final CCL 3 chemicals, in, EPA, 2009.
[64] J.A. Roberson, How USEPA Is looking at regulating groups, Journal American Water Works Association, 102 (2010) 16-18.
[65] J.W.A. Charrois, M.W. Arend, K.L. Froese, S.E. Hrudey, Detecting N-Nitrosamines in drinking water at nanogram per liter levels using ammonia positive chemical ionization, Environ. Sci. Technol., 38 (2004) 4835-4841.
[66] S. Yoon, N. Nakada, H. Tanaka, Occurrence and removal of NDMA and NDMA formation potential in wastewater treatment plants, J. Hazard. Mater., 190 (2011) 897-902.
[67] J.W. Munch, M.V. Bassett, METHOD 521 Determination of nitrosamines in drinking water by solid phase extraction and capillary column gas chromatography with large volume injection and chemical ionization tandem mass spectrometry (MS/MS) Version 1.0, in, National Exposure Research Laboratory Office of Research and Development, U.S. Environmental Protection Agency, Cincinnati, 2004.
[68] A. Llop, F. Borrull, E. Pocurull, Fully automated determination of N-nitrosamines in environmental waters by headspace solid-phase microextraction followed by GC–MS–MS, Journal of Separation Science, 33 (2010) 3692-3700.
[69] H.-W. Hung, T.-F. Lin, C.-H. Chiu, Y.-C. Chang, T.-Y. Hsieh, Trace analysis of N-Nitrosamines in water using solid-phase microextraction coupled with gas chromatograph–tandem mass spectrometry, Water, Air, Soil Pollut., 213 (2010) 459-469.
[70] Ontario MOE, Protocol of accepted drinking water testing methods version 2.0, E3388 - The determination of N-nitrosamines in water by gas chromatography-high resolution mass spectrometry (GC/HRMS), Laboratory Services Branch, Ontario Ministry of the Environment Ontario, 2010.
[71] C. Planas, Ó. Palacios, F. Ventura, J. Rivera, J. Caixach, Analysis of nitrosamines in water by automated SPE and isotope dilution GC/HRMS: Occurrence in the different steps of a drinking water treatment plant, and in chlorinated samples from a reservoir and a sewage treatment plant effluent, Talanta, 76 (2008) 906-913.
[72] R. Pozzi, P. Bocchini, F. Pinelli, G.C. Galletti, Determination of nitrosamines in water by gas chromatography/chemical ionization/selective ion trapping mass spectrometry, J. Chromatogr. A, 1218 (2011) 1808-1814.
[73] J.A. McDonald, N.B. Harden, L.D. Nghiem, S.J. Khan, Analysis of N-nitrosamines in water by isotope dilution gas chromatography-electron ionisation tandem mass spectrometry, Talanta, 99 (2012) 146-152.

163
[74] Y.Y. Zhao, X. Liu, J.M. Boyd, F. Qin, J. Li, X.-F. Li, Identification of N-Nitrosamines in treated drinking water using nanoelectrospray ionization high-field asymmetric waveform ion mobility spectrometry with quadrupole time-of-flight mass spectrometry, J. Chromatogr. Sci., 47 (2009) 92-96.
[75] J.M. Boyd, S.E. Hrudey, X.F. Li, S.D. Richardson, Solid-phase extraction and high-performance liquid chromatography mass spectrometry analysis of nitrosamines in treated drinking water and wastewater, TRAC Trends in Analytical Chemistry, 30 (2011) 1410-1421.
[76] M. Krauss, J. Hollender, Analysis of Nitrosamines in wastewater: Exploring the trace level quantification capabilities of a hybrid linear ion trap/orbitrap mass spectrometer, Anal. Chem., 80 (2008) 834-842.
[77] C. Ripollés, E. Pitarch, J.V. Sancho, F.J. López, F. Hernández, Determination of eight nitrosamines in water at the ngL−1 levels by liquid chromatography coupled to atmospheric pressure chemical ionization tandem mass spectrometry, Anal. Chim. Acta, 702 (2011) 62-71.
[78] J. Chung, Y. Yoon, M. Kim, S.-B. Lee, H.-J. Kim, C.-K. Choi, Removal of radio N-nitrosodimethylamine (NDMA) from drinking water by coagulation and Powdered Activated Carbon (PAC) adsorption, Drinking Water Engineering and Science, 2 (2009) 49-55.
[79] E.C. Fleming, J.C. Pennington, B.G. Wachob, R.A. Howe, D.O. Hill, Removal of N-nitrosodimethylamine from waters using physical-chemical techniques, J. Hazard. Mater., 51 (1996) 151-164.
[80] F. Soroushian, M. Patel, S. Fitzsimmons, M. Wehner, NDMA Removal and Reformation Prevention, in: Proceedings of the Water Environment Federation, 2004, pp. 85-112.
[81] C.K. Schmidt, H.-J. Brauch, N,N-Dimethylsulfamide as precursor for N-Nitrosodimethylamine (NDMA) formation upon ozonation and its fate during drinking water treatment, Environ. Sci. Technol., 42 (2008) 6340-6346.
[82] Y. Miyashita, S.-H. Park, H. Hyung, C.-H. Huang, J.-H. Kim, Removal of N-Nitrosamines and their precursors by nanofiltration and reverse osmosis membranes, J. Environ. Eng., 135 (2009) 788-795.
[83] C. Bellona, K. Budgell, D. Ball, K. Spangler, J.E. Drewes, S. Chellam, Models to predict organic contaminant removal by RO and NF membranes, IDA Journal, 3 (2011) 40-44.
[84] S.J. Khan, J.A. McDonald, Quantifying human exposure to contaminants for multiple-barrier water reuse systems, Water Sci. Technol., 61 (2010) 77-83.
[85] J.E. Drewes, C. Bellona, P. Xu, G. Amy, G. Filteau, G. Oelker, Comparing nanofiltration and reverse osmosis for treating recycled water, AWWA Research Foundation, (2008).
[86] M.J. Farré, J. Keller, N. Holling, Y. Poussade, W. Gernjak, Occurrence of NDMA precursors in wastewater treatment plant effluent and their fate during UF-RO membrane treatment, Water Sci. Technol., 63 (2011) 605-612.
[87] R. Lugg, Characterising treated wastewater for drinking purposes following reverse osmosis treatment, Premier's Collaborative Research Program, (2009).
[88] E. Pehlivanoglu-Mantas, D.L. Sedlak, Measurement of dissolved organic nitrogen forms in wastewater effluents: Concentrations, size distribution and NDMA formation potential, Water Res., 42 (2008) 3890-3898.
164
[89] B. Van der Bruggen, J. Schaep, W. Maes, D. Wilms, C. Vandecasteele, Nanofiltration as a treatment method for the removal of pesticides from ground waters, Desalination, 117 (1998) 139-147.
[90] J.M.K. Timmer, M.P.J. Speelmans, H.C. van der Horst, Separation of amino acids by nanofiltration and ultrafiltration membranes, Sep. Purif. Technol., 14 (1998) 133-144.
[91] W.R. Bowen, A.W. Mohammad, N. Hilal, Characterisation of nanofiltration membranes for predictive purposes — use of salts, uncharged solutes and atomic force microscopy, J. Membr. Sci., 126 (1997) 91-105.
[92] Y. Kiso, K. Muroshige, T. Oguchi, M. Hirose, T. Ohara, T. Shintani, Pore radius estimation based on organic solute molecular shape and effects of pressure on pore radius for a reverse osmosis membrane, J. Membr. Sci., 369 (2011) 290-298.
[93] J.L.C. Santos, P. de Beukelaar, I.F.J. Vankelecom, S. Velizarov, J.G. Crespo, Effect of solute geometry and orientation on the rejection of uncharged compounds by nanofiltration, Sep. Purif. Technol., 50 (2006) 122-131.
[94] Z. Chen, K. Ito, H. Yanagishita, N. Oshima, R. Suzuki, Y. Kobayashi, Correlation study between free-volume holes and molecular separations of composite membranes for reverse osmosis processes by means of variable-energy positron annihilation techniques, J. Phys. Chem. C, 115 (2011) 18055-18060.
[95] S.H. Kim, S.-Y. Kwak, T. Suzuki, Positron Annihilation Spectroscopic Evidence to Demonstrate the Flux-Enhancement Mechanism in Morphology-Controlled Thin-Film-Composite (TFC) Membrane, Environ. Sci. Technol., 39 (2005) 1764-1770.
[96] J.G. Wijmans, R.W. Baker, The solution-diffusion model: a review, J. Membr. Sci., 107 (1995) 1-21.
[97] S.A. Avlonitis, M. Pappas, K. Moutesidis, A unified model for the detailed investigation of membrane modules and RO plants performance, Desalination, 203 (2007) 218-228.
[98] A.R.D. Verliefde, E.R. Cornelissen, S.G.J. Heijman, J.Q.J.C. Verberk, G.L. Amy, B. Van der Bruggen, J.C. van Dijk, The role of electrostatic interactions on the rejection of organic solutes in aqueous solutions with nanofiltration, J. Membr. Sci., 322 (2008) 52-66.
[99] M.S. Oak, T. Kobayashi, H.Y. Wang, T. Fukaya, N. Fujii, pH effect on molecular size exclusion of polyacrylonitrile ultrafiltration membranes having carboxylic acid groups, J. Membr. Sci., 123 (1997) 185-195.
[100] A.E. Childress, M. Elimelech, Relating nanofiltration membrane performance to membrane charge (electrokinetic) characteristics, Environ. Sci. Technol., 34 (2000) 3710-3716.
[101] R.Y. Ning, T.L. Troyer, Colloidal fouling of RO membranes following MF/UF in the reclamation of municipal wastewater, Desalination, 208 (2007) 232-237.
[102] M. Abdel-Jawad, S. Al-Shammari, J. Al-Sulaimi, Non-conventional treatment of treated municipal wastewater for reverse osmosis, Desalination, 142 (2002) 11-18.

165
[103] J.H. Al-Rifai, H. Khabbaz, A.I. Schäfer, Removal of pharmaceuticals and endocrine disrupting compounds in a water recycling process using reverse osmosis systems, Sep. Purif. Technol., 77 (2011) 60-67.
[104] W. Won, T. Walker, M. Patel, E. Owens, Comparing membrane operations at three of the world’s largest advanced water treatment plants, IDA Journal, 2 (2010) 14-19.
[105] S.L. Ong, W. Zhou, L. Song, W.J. Ng, Evaluation of feed concentration effects on salt/Ion transport through RO/NF membranes with the Nernst-Planck-Donnan model, Environ. Eng. Sci., 19 (2002) 429-439.
[106] C. Bartels, R. Franks, S. Rybar, M. Schierach, M. Wilf, The effect of feed ionic strength on salt passage through reverse osmosis membranes, Desalination, 184 (2005) 185-195.
[107] V. Freger, Swelling and morphology of the skin layer of polyamide composite membranes: an atomic force microscopy study, Environ. Sci. Technol., 38 (2004) 3168-3175.
[108] A. Escoda, P. Fievet, S. Lakard, A. Szymczyk, S. Déon, Influence of salts on the rejection of polyethyleneglycol by an NF organic membrane: Pore swelling and salting-out effects, J. Membr. Sci., 347 (2010) 174-182.
[109] J. Luo, Y. Wan, Effect of highly concentrated salt on retention of organic solutes by nanofiltration polymeric membranes, J. Membr. Sci., 372 (2011) 145-153.
[110] N. Ben Amar, H. Saidani, J. Palmeri, A. Deratani, Effect of temperature on the rejection of neutral and charged solutes by Desal 5 DK nanofiltration membrane, Desalination, 246 (2009) 294-303.
[111] R.R. Sharma, R. Agrawal, S. Chellam, Temperature effects on sieving characteristics of thin-film composite nanofiltration membranes: pore size distributions and transport parameters, J. Membr. Sci., 223 (2003) 69-87.
[112] N. Ben Amar, H. Saidani, A. Deratani, J. Palmeri, Effect of temperature on the transport of water and neutral solutes across nanofiltration membranes, Langmuir, 23 (2007) 2937-2952.
[113] E. Van Houtte, J. Verbauwhede, Operational experience with indirect potable reuse at the Flemish Coast, Desalination, 218 (2008) 198-207.
[114] L.D. Nghiem, S. Hawkes, Effects of membrane fouling on the nanofiltration of pharmaceutically active compounds (PhACs): Mechanisms and role of membrane pore size, Sep. Purif. Technol., 57 (2007) 176-184.
[115] H.Y. Ng, M. Elimelech, Influence of colloidal fouling on rejection of trace organic contaminants by reverse osmosis, J. Membr. Sci., 244 (2004) 215-226.
[116] P. Xu, C. Bellona, J.E. Drewes, Fouling of nanofiltration and reverse osmosis membranes during municipal wastewater reclamation: Membrane autopsy results from pilot-scale investigations, J. Membr. Sci., 353 (2010) 111-121.
[117] A.R.D. Verliefde, E.R. Cornelissen, S.G.J. Heijman, I. Petrinic, T. Luxbacher, G.L. Amy, B. Van der Bruggen, J.C. van Dijk, Influence of membrane fouling by (pretreated) surface water on rejection of pharmaceutically active compounds (PhACs) by nanofiltration membranes, J. Membr. Sci., 330 (2009) 90-103.
[118] E.M.V. Hoek, M. Elimelech, Cake-Enhanced Concentration Polarization: A New Fouling Mechanism for Salt-Rejecting Membranes, Environ. Sci. Technol., 37 (2003) 5581-5588.

166
[119] G.-D. Kang, C.-J. Gao, W.-D. Chen, X.-M. Jie, Y.-M. Cao, Q. Yuan, Study on hypochlorite degradation of aromatic polyamide reverse osmosis membrane, J. Membr. Sci., 300 (2007) 165-171.
[120] A. Simon, L.D. Nghiem, P. Le-Clech, S.J. Khan, J.E. Drewes, Effects of membrane degradation on the removal of pharmaceutically active compounds (PhACs) by NF/RO filtration processes, J. Membr. Sci., 340 (2009) 16-25.
[121] A. Simon, W.E. Price, L.D. Nghiem, Effects of chemical cleaning on the nanofiltration of pharmaceutically active compounds (PhACs), Sep. Purif. Technol., 88 (2012) 208-215.
[122] T. Fujioka, S.J. Khan, Y. Poussade, J.E. Drewes, L.D. Nghiem, N-nitrosamine removal by reverse osmosis for indirect potable water reuse – A critical review based on observations from laboratory-, pilot- and full-scale studies, Sep. Purif. Technol., 98 (2012) 503-515.
[123] G. Kang, Y. Cao, Development of antifouling reverse osmosis membranes for water treatment: A review, Water Res., 46 (2012) 584-600.
[124] M. Elimelech, W.H. Chen, J.J. Waypa, Measuring the zeta (electrokinetic) potential of reverse osmosis membranes by a streaming potential analyzer, Desalination, 95 (1994) 269-286.
[125] D. Frigon, R. Michael Guthrie, G. Timothy Bachman, J. Royer, B. Bailey, L. Raskin, Long-term analysis of a full-scale activated sludge wastewater treatment system exhibiting seasonal biological foaming, Water Res., 40 (2006) 990-1008.
[126] P. Berg, G. Hagmeyer, R. Gimbel, Removal of pesticides and other micropollutants by nanofiltration, Desalination, 113 (1997) 205-208.
[127] W.S. Ang, N.Y. Yip, A. Tiraferri, M. Elimelech, Chemical cleaning of RO membranes fouled by wastewater effluent: Achieving higher efficiency with dual-step cleaning, J. Membr. Sci., 382 (2011) 100-106.
[128] D. Jermann, W. Pronk, M. Boller, A.I. Schäfer, The role of NOM fouling for the retention of estradiol and ibuprofen during ultrafiltration, J. Membr. Sci., 329 (2009) 75-84.
[129] O. Kedem, A. Katchalsky, Permeability of composite membranes. Part 1.-Electric current, volume flow and flow of solute through membranes, Trans. Faraday Soc., 59 (1963) 1918-1930.
[130] T. Tsuru, S. Izumi, T. Yoshioka, M. Asaeda, Temperature effect on transport performance by inorganic nanofiltration membranes, AIChE Journal, 46 (2000) 565-574.
[131] K.S. Spiegler, O. Kedem, Thermodynamics of hyperfiltration (reverse osmosis): criteria for efficient membranes, Desalination, 1 (1966) 311-326.
[132] T. Tsuru, K. Ogawa, M. Kanezashi, T. Yoshioka, Permeation characteristics of electrolytes and neutral solutes through titania nanofiltration membranes at high temperatures, Langmuir, 26 (2010) 10897-10905.
[133] G.B. van den Berg, I.G. Rácz, C.A. Smolders, Mass transfer coefficients in cross-flow ultrafiltration, J. Membr. Sci., 47 (1989) 25-51.
[134] Y. Kiso, K. Muroshige, T. Oguchi, T. Yamada, M. Hhirose, T. Ohara, T. Shintani, Effect of molecular shape on rejection of uncharged organic compounds by nanofiltration membranes and on calculated pore radii, J. Membr. Sci., 358 (2010) 101-113.

167
[135] Y. Kiso, Y. Sugiura, T. Kitao, K. Nishimura, Effects of hydrophobicity and molecular size on rejection of aromatic pesticides with nanofiltration membranes, J. Membr. Sci., 192 (2001) 1-10.
[136] C. Bellona, J.E. Drewes, The role of membrane surface charge and solute physico-chemical properties in the rejection of organic acids by NF membranes, J. Membr. Sci., 249 (2005) 227-234.
[137] K.O. Agenson, T. Urase, Change in membrane performance due to organic fouling in nanofiltration (NF)/reverse osmosis (RO) applications, Sep. Purif. Technol., 55 (2007) 147-156.
[138] K. Boussu, A. Belpaire, A. Volodin, C. Van Haesendonck, P. Van der Meeren, C. Vandecasteele, B. Van der Bruggen, Influence of membrane and colloid characteristics on fouling of nanofiltration membranes, J. Membr. Sci., 289 (2007) 220-230.
[139] R.K. Henderson, N. Subhi, A. Antony, S.J. Khan, K.R. Murphy, G.L. Leslie, V. Chen, R.M. Stuetz, P. Le-Clech, Evaluation of effluent organic matter fouling in ultrafiltration treatment using advanced organic characterisation techniques, J. Membr. Sci., 382 (2011) 50-59.
[140] S.A. Huber, A. Balz, M. Abert, W. Pronk, Characterisation of aquatic humic and non-humic matter with size-exclusion chromatography – organic carbon detection – organic nitrogen detection (LC-OCD-OND), Water Res., 45 (2011) 879-885.
[141] R.K. Henderson, R.M. Stuetz, S.J. Khan, Demonstrating ultra-filtration and reverse osmosis performance using size exclusion chromatography, Water Sci. Technol., 62 (2010) 2747-2753.
[142] J. Haberkamp, M. Ernst, U. Böckelmann, U. Szewzyk, M. Jekel, Complexity of ultrafiltration membrane fouling caused by macromolecular dissolved organic compounds in secondary effluents, Water Res., 42 (2008) 3153-3161.
[143] H.K. Shon, S. Vigneswaran, R.B. Aim, H.H. Ngo, I.S. Kim, J. Cho, Influence of Flocculation and Adsorption as Pretreatment on the Fouling of Ultrafiltration and Nanofiltration Membranes: Application with Biologically Treated Sewage Effluent, Environ. Sci. Technol., 39 (2005) 3864-3871.
[144] L.D. Nghiem, P.J. Coleman, C. Espendiller, Mechanisms underlying the effects of membrane fouling on the nanofiltration of trace organic contaminants, Desalination, 250 (2010) 682-687.
[145] C.Y. Tang, Y.-N. Kwon, J.O. Leckie, Fouling of reverse osmosis and nanofiltration membranes by humic acid--Effects of solution composition and hydrodynamic conditions, J. Membr. Sci., 290 (2007) 86-94.
[146] M. Beyer, B. Lohrengel, L.D. Nghiem, Membrane fouling and chemical cleaning in water recycling applications, Desalination, 250 (2010) 977-981.
[147] S. Lee, W.S. Ang, M. Elimelech, Fouling of reverse osmosis membranes by hydrophilic organic matter: implications for water reuse, Desalination, 187 (2006) 313-321.
[148] C.Y. Tang, Y.-N. Kwon, J.O. Leckie, Characterization of humic acid fouled reverse osmosis and nanofiltration membranes by transmission electron microscopy and streaming potential measurements, Environ. Sci. Technol., 41 (2006) 942-949.

168
[149] K.L. Tu, A.R. Chivas, L.D. Nghiem, Effects of membrane fouling and scaling on boron rejection by nanofiltration and reverse osmosis membranes, Desalination, 279 (2011) 269-277.
[150] T. Fujioka, L.D. Nghiem, S.J. Khan, J.A. McDonald, Y. Poussade, J.E. Drewes, Effects of feed solution characteristics on the rejection of N-nitrosamines by reverse osmosis membranes, J. Membr. Sci., 409–410 (2012) 66-74.
[151] R. Liikanen, J. Yli-Kuivila, R. Laukkanen, Efficiency of various chemical cleanings for nanofiltration membrane fouled by conventionally-treated surface water, J. Membr. Sci., 195 (2002) 265-276.
[152] Q. Li, M. Elimelech, Organic fouling and chemical cleaning of nanofiltration membranes: measurements and mechanisms, Environ. Sci. Technol., 38 (2004) 4683-4693.
[153] W.S. Ang, A. Tiraferri, K.L. Chen, M. Elimelech, Fouling and cleaning of RO membranes fouled by mixtures of organic foulants simulating wastewater effluent, J. Membr. Sci., 376 (2011) 196-206.
[154] W.S. Ang, S. Lee, M. Elimelech, Chemical and physical aspects of cleaning of organic-fouled reverse osmosis membranes, J. Membr. Sci., 272 (2006) 198-210.
[155] A. Al-Amoudi, P. Williams, S. Mandale, R.W. Lovitt, Cleaning results of new and fouled nanofiltration membrane characterized by zeta potential and permeability, Sep. Purif. Technol., 54 (2007) 234-240.
[156] J. Benavente, M.I. Vázquez, Effect of age and chemical treatments on characteristic parameters for active and porous sublayers of polymeric composite membranes, J. Colloid Interface Sci., 273 (2004) 547-555.
[157] C.K. Kim, J.H. Kim, I.J. Roh, J.J. Kim, The changes of membrane performance with polyamide molecular structure in the reverse osmosis process, J. Membr. Sci., 165 (2000) 189-199.
[158] C.Y. Tang, Y.-N. Kwon, J.O. Leckie, Effect of membrane chemistry and coating layer on physiochemical properties of thin film composite polyamide RO and NF membranes: I. FTIR and XPS characterization of polyamide and coating layer chemistry, Desalination, 242 (2009) 149-167.
[159] Y.-N. Kwon, J.O. Leckie, Hypochlorite degradation of crosslinked polyamide membranes: II. Changes in hydrogen bonding behavior and performance, J. Membr. Sci., 282 (2006) 456-464.
[160] M.R. Teixeira, M.J. Rosa, M. Nyström, The role of membrane charge on nanofiltration performance, J. Membr. Sci., 265 (2005) 160-166.
[161] A. Al-Amoudi, Effect of chemical cleaning agents on virgin nanofiltration membrane as characterized by positron annihilation spectroscopy, Sep. Purif. Technol., (2013).
[162] A. Simon, W.E. Price, L.D. Nghiem, Influence of formulated chemical cleaning reagents on the surface properties and separation efficiency of nanofiltration membranes, J. Membr. Sci., 432 (2013) 73-82.
[163] T. Fujioka, S.J. Khan, J.A. McDonald, R.K. Henderson, Y. Poussade, J.E. Drewes, L.D. Nghiem, Effects of membrane fouling on N-nitrosamine rejection by nanofiltration and reverse osmosis membranes, J. Membr. Sci., 427 (2013) 311-319.
169
[164] S. Sobana, R. Panda, Review on modelling and control of desalination system using reverse osmosis, Reviews in Environmental Science and Biotechnology, 10 (2011) 139-150.
[165] B. Van der Bruggen, A. Verliefde, L. Braeken, E.R. Cornelissen, K. Moons, J.Q.J.C. Verberk, H.J.C. van Dijk, G. Amy, Assessment of a semi-quantitative method for estimation of the rejection of organic compounds in aqueous solution in nanofiltration, J. Chem. Technol. Biotechnol., 81 (2006) 1166-1176.
[166] B. Van der Bruggen, J. Schaep, D. Wilms, C. Vandecasteele, Influence of molecular size, polarity and charge on the retention of organic molecules by nanofiltration, J. Membr. Sci., 156 (1999) 29-41.
[167] L.D. Nghiem, A.I. Schäfer, M. Elimelech, Nanofiltration of Hormone Mimicking Trace Organic Contaminants, Separation Science and Technology, 40 (2005) 2633-2649.
[168] L.D. Nghiem, A.I. Schäfer, M. Elimelech, Pharmaceutical Retention Mechanisms by Nanofiltration Membranes, Environ. Sci. Technol., 39 (2005) 7698-7705.
[169] T. Matsuura, S. Sourirajan, Reverse osmosis transport through capillary pores under the influence of surface forces, Industrial & Engineering Chemistry Process Design and Development, 20 (1981) 273-282.
[170] D. Nanda, K.-L. Tung, W.-S. Hung, C.-H. Lo, Y.-C. Jean, K.-R. Lee, C.-C. Hu, J.-Y. Lai, Characterization of fouled nanofiltration membranes using positron annihilation spectroscopy, J. Membr. Sci., 382 (2011) 124-134.
[171] K.-L. Tung, Y.-C. Jean, D. Nanda, K.-R. Lee, W.-S. Hung, C.-H. Lo, J.-Y. Lai, Characterization of multilayer nanofiltration membranes using positron annihilation spectroscopy, J. Membr. Sci., 343 (2009) 147-156.
[172] K. Boussu, J. De Baerdemaeker, C. Dauwe, M. Weber, K.G. Lynn, D. Depla, S. Aldea, I.F.J. Vankelecom, C. Vandecasteele, B. Van der Bruggen, Physico-Chemical Characterization of Nanofiltration Membranes, ChemPhysChem, 8 (2007) 370-379.
[173] T. Shintani, A. Shimazu, S. Yahagi, H. Matsuyama, Characterization of methyl-substituted polyamides used for reverse osmosis membranes by positron annihilation lifetime spectroscopy and MD simulation, Journal of Applied Polymer Science, 113 (2009) 1757-1762.
[174] J. Lee, C.M. Doherty, A.J. Hill, S.E. Kentish, Water vapor sorption and free volume in the aromatic polyamide layer of reverse osmosis membranes, J. Membr. Sci., 425–426 (2013) 217-226.
[175] R. Suzuki, Y. Kobayashi, T. Mikado, H. Ohgaki, M. Chiwaki, T. Yamazaki, T. Tomimasu, Slow Positron Pulsing System for Variable Energy Positron Lifetime Spectroscopy, Jpn. J. Appl. Phys., 30 (1991) 532-534.
[176] Y. Ito, H.F.M. Mohamed, V.P. Shantarovich, T. Suzuki, Vacancy Spectroscopy Using Positronium : What are we Looking at by Positronium in Polymers, Membrane, 34 (2009) 164-178.
[177] Y.C. Jean, P.E. Mallon, D.M. Schrader, Principles And Applications Of Positron And Positronium Chemistry, World Scientific, Singapore, 2003.
[178] M. Eldrup, D. Lightbody, J.N. Sherwood, The temperature dependence of positron lifetimes in solid pivalic acid, Chem. Phys., 63 (1981) 51-58.

170
[179] S.J. Tao, Positronium Annihilation in Molecular Substances, J. Chem. Phys., 56 (1972) 5499-5510.
[180] K. Ito, Z. Chen, W. Zhou, N. Oshima, H. Yanagishita, R. Suzuki, Y. Kobayashi, Subnanoscopic Holes in Composite Membranes for Desalination Elucidated by Energy-Tunable Positron Annihilation, Jpn. J. Poly. Sci. Technol., 69 (2012) 443-447.
[181] V. Freger, Nanoscale Heterogeneity of Polyamide Membranes Formed by Interfacial Polymerization, Langmuir, 19 (2003) 4791-4797.
[182] A. Prakash Rao, S.V. Joshi, J.J. Trivedi, C.V. Devmurari, V.J. Shah, Structure–performance correlation of polyamide thin film composite membranes: effect of coating conditions on film formation, J. Membr. Sci., 211 (2003) 13-24.
[183] T. Fujioka, S.J. Khan, J.A. McDonald, A. Roux, Y. Poussade, J.E. Drewes, L.D. Nghiem, N-nitrosamine rejection by nanofiltration and reverse osmosis membranes: The importance of membrane characteristics, Desalination, 316 (2013) 67-75.
[184] C. Bellona, J.E. Drewes, Viability of a low-pressure nanofilter in treating recycled water for water reuse applications: A pilot-scale study, Water Res., 41 (2007) 3948-3958.
[185] K.L. Tu, L.D. Nghiem, A.R. Chivas, Boron removal by reverse osmosis membranes in seawater desalination applications, Sep. Purif. Technol., 75 (2010) 87-101.
[186] P.P. Mane, P.-K. Park, H. Hyung, J.C. Brown, J.-H. Kim, Modeling boron rejection in pilot- and full-scale reverse osmosis desalination processes, J. Membr. Sci., 338 (2009) 119-127.
[187] P.-K. Park, S. Lee, J.-S. Cho, J.-H. Kim, Full-scale simulation of seawater reverse osmosis desalination processes for boron removal: Effect of membrane fouling, Water Res., 46 (2012) 3796-3804.
[188] H. Hyung, J.-H. Kim, A mechanistic study on boron rejection by sea water reverse osmosis membranes, J. Membr. Sci., 286 (2006) 269-278.
[189] A.R.D. Verliefde, E.R. Cornelissen, S.G.J. Heijman, J.Q.J.C. Verberk, G.L. Amy, B. Van der Bruggen, J.C. van Dijk, Construction and validation of a full-scale model for rejection of organic micropollutants by NF membranes, J. Membr. Sci., 339 (2009) 10-20.
[190] G. Schock, A. Miquel, Mass transfer and pressure loss in spiral wound modules, Desalination, 64 (1987) 339-352.
[191] E.M.V. Hoek, J. Allred, T. Knoell, B.-H. Jeong, Modeling the effects of fouling on full-scale reverse osmosis processes, J. Membr. Sci., 314 (2008) 33-49.
[192] K.M. Sassi, I.M. Mujtaba, Effective design of reverse osmosis based desalination process considering wide range of salinity and seawater temperature, Desalination, 306 (2012) 8-16.
[193] S. Senthilmurugan, A. Ahluwalia, S.K. Gupta, Modeling of a spiral-wound module and estimation of model parameters using numerical techniques, Desalination, 173 (2005) 269-286.