2014 Annual Report - Goodyear
124
Transcript of 2014 Annual Report - Goodyear
GY14AR_COVER_030215F.qxp_GY14AR 3/2/15 10:42 AM Page 1

FORM 10-K AND OTHER REPORTSPaper copies of Goodyear’s Annual Report on Form 10-K are available uponrequest. Quarterly reports on Form 10-Q are also available on request.Copies of any of the above or Goodyear’s Proxy Statement may be obtainedwithout charge from:Investor Relations, Dept. 635The Goodyear Tire & Rubber Company200 Innovation WayAkron, Ohio 44316-0001(330) 796-3751
Copies of these reports may also be obtained from the company’sInvestor Web site http://investor.goodyear.com.
Goodyear has included as Exhibits 31.1, 31.2 and 32.1 to its AnnualReport on Form 10-K for the year ended December 31, 2014, filed with theSecurities and Exchange Commission, certificates of Goodyear’s ChiefExecutive Officer and Chief Financial Officer with respect to the Form 10-K.
CD COPYA CD copy of the 2014 Annual Report is available for visually impairedshareholders by contacting Goodyear Investor Relations at (330) 796-3751.
COMPUTERSHARE INVESTMENT PLANComputershare sponsors and administers a direct stock purchase and divi-dend reinvestment plan for current shareholders and new investors inGoodyear common stock. A brochure explaining the program may beobtained by contacting: ComputershareP.O. Box 30170College Station, TX 77842-3170(800) 317-4445www.computershare.com/investor
INDEPENDENT REGISTERED PUBLICACCOUNTING FIRMPricewaterhouseCoopers LLP200 Public Square, 18th FloorCleveland, Ohio 44114-2301
OTHER INFORMATIONPersons seeking information about Goodyear’s corporate sustainability initiatives can access the company’s Sustainability Web site at:www.goodyear.com/responsibility.
Persons seeking general information about Goodyear or its products can access the company’s Corporate Web site at:www.goodyear.com/corporate.
Media representatives seeking information about Goodyear or contact information for spokespersons can access the company’s Media Web site at: www.goodyearnewsroom.com.
121
SHAREHOLDER INFORMATIONCORPORATE OFFICESThe Goodyear Tire & Rubber Company200 Innovation WayAkron, Ohio 44316-0001(330) 796-2121www.goodyear.com
GOODYEAR COMMON STOCKThe principal market for Goodyear common stock is the NASDAQ GlobalSelect Market (symbol GT).
On February 18, 2015, there were 16,543 shareholders of record ofGoodyear common stock. The closing price of Goodyear common stock on the NASDAQ Global Select Market on February 18, 2015, was $27.39.Under Goodyear’s primary credit facilities, we are permitted to pay dividends on Goodyear common stock as long as no default will haveoccurred and be continuing, additional indebtedness can be incurred underthe credit facilities following the payment, and certain financial tests aresatisfied. On May 29, 2014, we announced an increase in the quarterlycash dividend on our common stock to $0.06 per share from $0.05 pershare, beginning on September 2, 2014.
ANNUAL MEETING4:30 p.m., Monday, April 13, 2015Hilton Akron-Fairlawn3180 W. Market StreetAkron, Ohio 44333Please direct meeting inquiries to:Office of the Secretary, Dept. 822The Goodyear Tire & Rubber Company200 Innovation WayAkron, Ohio 44316-0001
SHAREHOLDER INQUIRIESTransfer Agent and Registrar:Computershare Trust Company, N.A.P.O. Box 43078Providence, RI 02940-3078(800) 317-4445www.computershare.com
Inquiries concerning the issuance or transfer of stock certificates orshare account information should be directed to Computershare. ProvideSocial Security number, account number and Goodyear’s ID, GTR.Hearing-impaired shareholders can communicate directly withComputershare via a TDD by calling (800) 952-9245. Other shareholderinquiries should be directed to:Investor Relations, Dept. 635The Goodyear Tire & Rubber Company200 Innovation WayAkron, Ohio 44316-0001(330) 796-3751E-mail: [email protected]
CONTENTS To Our Shareholders
Management’s Discussion and Analysis of Financial Condition and
Results of Operations
Forward-Looking Information
Quantitative and Qualitative Disclosures about Market Risk
Consolidated Financial Statements
Notes to Consolidated Financial Statements
Management’s Report on Internal Control Over Financial Reporting
Report of Independent Registered Public Accounting Firm
Supplementary Data (unaudited)
Selected Financial Data
Performance Graph
Directors and Officers
Facilities
Shareholder Information
26
37394149110111112115118119120121
This Annual Report contains a number of forward-looking statements. For more information, please see pages 37-38.
Goodyear is one of the world’s leading tire companies, with one of the most recognizable brand names and operations in most regions of the world. Together with its U.S. and international subsidiaries and joint ventures, Goodyear develops, manufactures, markets and distributes tires for most applications. It also manufactures and markets rubber-related chemicalsfor various applications. Goodyear is one of the world’s largest operators of commercial truck service and tire retreading centers. In addition, it operates approximately 1,200 tire and auto service center outlets where it offers its products for retail sale and provides automotive repair and other services. Goodyear manufactures its products in 50 facilities in 22 countries. It has marketing operations in almost every country around the world.
THE GOODYEAR TIRE & RUBBER COMPANY200 Innovation Way
Akron, Ohio 44316-0001
www.goodyear.com
GY14AR_COVER_030215F.qxp_GY14AR 3/2/15 10:42 AM Page 3

1
FINANCIAL OVERVIEW
THREE-YEAR PERFORMANCE SUMMARY
TOTAL DIVIDENDS PAID (in millions)
60
40
20
80
2012
$29.0
2013
$41.0
2014
$75.0
0
TOTAL SHAREHOLDERS’ EQUITY (in billions)
3000
2000
1000
4000
2012
$0.625
2013
$1.868
2014
$3.845
0
CLOSING STOCK PRICE
20
10
30
2012
$13.81
2013
$23.85
2014
$28.57
0
SEGMENT OPERATING MARGIN (percent)
8
6
4
2
10
2012
5.9%
2013
8.1%
2014
9.4%
0
* Total debt includes Notes payable and overdrafts, Long term debt and capital leases due within one year, and Long term debt and capital leases.
YEAR ENDED DEC. 31 YEAR ENDED DEC. 31(in millions, except per share and associates) 2014 2013
Net Sales $ 18,138 $ 19,540Total Segment Operating Income $ 1,712 $ 1,580Goodyear Net Income $ 2,452 $ 629Goodyear Net Income Available to Common Shareholders $ 2,445 $ 600– Per Diluted Share $ 8.78 $ 2.28
Weighted Average Shares Outstanding – Basic 268 246– Diluted 279 277
Segment Operating Margin 9.4% 8.1%Gross Margin 23.3% 21.1%Capital Expenditures $ 923 $ 1,168Research and Development Expenditures $ 399 $ 390Tire Units Sold 162.0 162.3
Total Assets $ 18,109 $ 17,527Total Debt* $ 6,394 $ 6,249Goodyear Shareholders’ Equity $ 3,610 $ 1,606Total Shareholders’ Equity $ 3,845 $ 1,868Debt to Debt and Equity 62.4% 77.0%Preferred Stock Dividends Paid $ 15 $ 29Common Stock Dividends Paid $ 60 $ 12
Number of Associates 67,000 69,000Price Range of Common Stock: – High $ 28.86 $ 24.00
– Low $ 18.87 $ 11.83
GY14AR_INSIDE_030215F.qxp_GY14AR 3/2/15 1:47 PM Page 1

Over the past year, The Goodyear Tire & Rubber Companycontinued its drive toward creating sustainable value for the long term. In the midst of continued global economicvolatility that affected the tire industry, we successfully executed our strategy and delivered another year of recordsegment operating income. These results were achievedthrough outstanding leadership and strategic execution byour teams across the globe. Our momentum is strong.
Our full-year performance was enabled by capturing thevalue of the Goodyear brand, and by becoming more efficient in our operations. By using a balanced approach
TO OUR SHAREHOLDERS
of investing for growth and taking actions to reduce costswe withstood prevailing uncertainty in several of our keymarkets.
In 2014, Goodyear’s segment operating income was $1.7 billion (see next page), the most in our company’s history and an 8 percent improvement over last year’srecord. This marks the fourth consecutive year in which wehave delivered more than $1 billion in segment operatingincome, an unprecedented run of success.
In 2014, the soundness of our strategy and its disciplinedexecution led to many highlights in our global businesses.
GLOBAL BUSINESS HIGHLIGHTS
Our North America business continued to grow profitably, asit delivered record earnings for the year, finishing the yearwith the highest quarterly segment operating income ever.With steady execution of our strategy, North America continued to win with consumers and is clearly on the path to sustainable growth.
Demand for our Goodyear-brand products remains high inthe region. For example, our Assurance All-Season tire,launched in 2014, will reach 1 million sold faster than anyprevious product. Likewise, our commercial truck tire business had a strong year, as fleets continued to embraceour outstanding products and business solutions model.
In the Asia Pacific region, we had full-year volume growth,spurred by our performance in China and India. Our brandstrength continues to grow, as several of our Goodyear-brand products – including Wrangler and ExcellenceRunOnFlat – earned “Tire of the Year” honors in China.
2
RICHARD J. KRAMERChai rman & Ch ief Execut ive Of f icer
GY14AR_INSIDE_030215F.qxp_GY14AR 3/2/15 1:47 PM Page 2

We’re growing with the right mix of productsin channels where the Goodyear brand hasits greatest value. Our factory in Pulandian,China is producing industry-leading productsand providing cost efficiencies to supportour growth in the region. In addition, weearned key new original equipment fitmentsand increased our distribution to make themost of the opportunities in this expandingmarket.
Our steady introduction of new high-value-added Goodyear products in Latin America was a hit withcustomers. Though the original equipment business in Brazildeclined through the year, our replacement tire sales in thecountry were very strong. In Brazil and Mexico, we grewshare by delivering a double-digit increase in consumerreplacement volume, as we completely revamped our port-folio to take advantage of the MegaTrend shift to high-value-added products.
Increased marketing efforts in the region helped growdemand for new products such as Goodyear EfficientGripperformance tires and Wrangler ArmorTrac for SUVs. Also,we continued to invest in the region and updated ourAmericana, Brazil factory to meet increasing demand for our high-value-added products. Even with the negativeimpact of foreign currency translation in the region and theunpredictability in the Venezuelan market, our replacementvolume growth in Latin America has been gratifying.
Finally, our Europe, Middle East, and Africa business hadyear-over-year segment operating income growth, even as the economic climate remained volatile. Our productleadership in the region was confirmed by regular wins and “podium” finishes in the important magazine tests, inaddition to setting the pace in European tire labelling. In the coming year, we will introduce our first tire to earn acoveted “AA” rating, with top grades for fuel efficiency andwet handling.
Over the course of the year, we also made strides toimprove the competitiveness of our value proposition withkey European customers.
Taken in total, our full-year performanceis evidence that our underlying businessis strong, our strategy is sound, and ourbrands are valued by our customers andconsumers.
Our results in 2014 were extremely satisfying considering the ongoing challenges we faced around the world. For example:
• The increasing strength of the U.S.dollar created unfavorable foreign currency translationfor many of our businesses around the world;
• Economic instability in several of our key markets, suchas Brazil and much of Europe, had a negative effect onall elements of the automotive industry;
• Political unrest contributed to recessionary conditions insome emerging markets, such as Venezuela and EasternEurope, and led to decreased volumes in those regions;
• Record warm temperatures in Europe at the end of2014 reduced industry sales of winter tires;
• And anticipated U.S. tariffs on tires imported from China led to abnormally large advance purchases ofthese products, drastically increasing inventories inmany sales channels.
Our response to these headwinds was consistent with ourlong-term focus, as we stuck to our strategy when it wouldhave been tempting to pursue short-term gains. We did not overreact to distorted market conditions or chaseunprofitable volume. And we did not waver from our commitment to capturing the full value of our brand and our products.
We know that the tire industry is cyclical and one of theobjectives of our long-term approach is remaining profitableand creating value through the inevitable highs and lows ofthe economic cycle.
3
To Our Shareholders
SEGMENT OPERATING INCOME (in millions)
500
1000
1500
2000
2012
$1,248
2013
$1,580
2014
$1,712
0
GY14AR_INSIDE_030215F.qxp_GY14AR 3/2/15 1:47 PM Page 3

STRATEGY ROADMAP
COMMITMENT TO OUR STRATEGY
We are committed to following our Strategy Roadmap (seebelow) and executing the Key How To’s. During the year, weupdated our Roadmap to reflect both the progress we havemade to date and our focus on driving profitable volumegrowth. The Roadmap is built to take advantage of theMegaTrends that are shaping the direction of the global tireindustry. These MegaTrends include increasing consumerdemand for high-value-added tires with features thatinclude fuel saving, wet traction or ride comfort.
We will continue to innovate to meet the changing needs ofour customers and consumers. Investment in our businesswill be driven from the market back and geared toward providing the high-value-added products that differentiateGoodyear in the marketplace.
We have seen tangible results from our OperationalExcellence initiatives and will continue our journey tobecome more efficient in our supply chain, reducing costand building the capabilities necessary to serve our customers better. Our focus is still on delivering the righttire, at the right time, for the right cost.
As we have done with Operational Excellence, we are committed to building a global platform of Sales andMarketing Excellence to take full advantage of our brandand value proposition in order to drive profitable growth. The goal is to establish global programs and “One GoodyearWay” to leverage best practices in sales and marketing. This is something that we are going to continue to developas we move forward.
As we move through the year ahead, we will remain focusedon winning in profitable market segments and positioningourselves for growth. Led by our momentum in NorthAmerica, we remain committed to our target of 2015 segment operating income growth of 10 percent to 15 percent above last year’s record.
Our earnings growth targets support our capital allocationplan which balances capital investments for future earningsgrowth, continued progress towards achieving an investmentgrade credit rating, and continued return of capital to share-holders. As always, we will take a thoughtful approach toinvestment, focusing on projects that have the highestpotential for return.
4
INDUSTRYMEGATRENDS
WHERE WE AREExecuting PlanInnovation LeaderRecord Earnings
KEY STRATEGIESNorth America: Grow ProfitablyAsia: Win in China / Grow AsiaEMEA / LA: Return to Historical Profit
KEY HOW TO’SMarket-Back Innovation ExcellenceSales & Marketing ExcellenceOperational ExcellenceEnabling InvestmentsTop Talent / Top Teams
Value CreatingInvesting for GrowthUS Pension Fully Funded
OUR DESTINATIONCREATING SUSTAINABLE VALUE
Top Line / Bottom Line GrowthFirst with CustomersInnovation LeadersLeader in Targeted Segments
Competitively AdvantagedProfitable thru Economic CycleCash Flow PositiveInvestment Grade
GY14AR_INSIDE_030215F.qxp_GY14AR 3/2/15 1:47 PM Page 4

DRIVING GROWTH
Last May, we announced our plan to build a new state-of-the-art manufacturing plant to serve the Latin America andNorth America businesses. This plant will have the capacityto annually produce six million of the high-value-added tiresthat are in demand in the Americas. The location of the newfacility will be finalized this year and is expected to beginproduction in 2017.
In the meantime, we will continue to invest in our existingfactories to help us keep pace with increasing demand. We will continue to get faster and more efficient throughOperational Excellence, enabling us to supply our customerswith the Goodyear tires they want to sell and consumerswant to buy.
Finally, we unveiled a new buying option for consumers inNorth America. During 2015, Goodyear will become the first tire manufacturer to offer consumer replacement tiresfor sale on line. Consumers will be able to purchase tiresthrough Goodyear.com and have them installed at anauthorized Goodyear retailer of their choice.
This is a major step for Goodyear and our aligned dealernetwork. Consumers are shopping for many goods andservices on line already, and it’s how we believe they willincreasingly shop for tires. As consumer demographics continue to shift and 80 million millennials come into themarketplace, we have to meet their shopping expectations.
By taking the initiative and embracing this digital format to simplify the tire buying process, we believe we will be the industry leader in this space. It’s another Goodyear innovation that goes beyond just tires and a tangible example of our focus on our customers and consumersfrom the market-back, rather than the factory-out.
CONFIDENCE IN OUR STRATEGY
As I reflect on 2014, I am extremely pleased with what ourteams in all our regions accomplished over the past year.Our results are evidence that we have the right strategy inplace and are delivering record profitability through a volatileperiod of the economic cycle.
I’m not only pleased with the results we are achieving, butwith how we are achieving them. We know that the tireindustry will not grow in a straight line, and we won’t bedistracted by short-term swings in our markets. We remaincommitted to our long-term targets and are confident in ourability to reach them.
The power of our brand and the execution of our strategystrengthens our belief that we will continue to increase ourearnings and value for shareholders not only when times aregood, but when they are challenging as well.
On behalf of the men and women of Goodyear, who deliverthe highest quality products and services around the world,thank you for your continued trust, confidence, and support.
Respectfully submitted,
Richard J. KramerChairman & Chief Executive Officer
5
To Our Shareholders
GY14AR_INSIDE_030215F.qxp_GY14AR 3/2/15 1:47 PM Page 5

MANAGEMENT’S DISCUSSION AND ANALYSIS OF FINANCIAL CONDITION AND RESULTS OFOPERATIONS.
OVERVIEW
The Goodyear Tire & Rubber Company is one of the world’s leading manufacturers of tires, with one of the mostrecognizable brand names in the world and operations in most regions of the world. We have a broad globalfootprint with 50 manufacturing facilities in 22 countries, including the United States. We operate our businessthrough four operating segments representing our regional tire businesses: North America; Europe, Middle Eastand Africa; Latin America; and Asia Pacific.
We experienced volatile global industry conditions in 2014, including economic weakness in EMEA, particularlyin the fourth quarter of 2014; economic and political volatility in Latin America, particularly in Brazil andVenezuela; and slowing growth in Asia Pacific. In addition, we were also impacted by the strengthening of theU.S. dollar against most foreign currencies.
Despite these challenging industry and economic conditions, we produced record segment operating income of$1,712 million in 2014, including record segment operating income of $803 million in North America. These2014 results were delivered on tire unit shipments that were essentially flat compared to 2013. In 2014, werealized approximately $454 million of cost savings, including raw material cost saving measures ofapproximately $269 million, which exceeded the impact of general inflation. Our raw material costs decreased byapproximately 9% in 2014 compared to 2013.
In the first quarter of 2014, we made contributions of $1,167 million to fully fund our hourly U.S. pension plansand, in accordance with our master collective bargaining agreement with the United Steelworkers, the hourlyU.S. pension plans were frozen to future accruals effective April 30, 2014. We have now fully fundedsubstantially all of our U.S. pension plans. The successful execution of our pension strategy will improve ourearnings and cash flows from operating activities and provide greater transparency to our underlying tirebusiness. Refer to “Pension and Benefit Plans” for additional information.
In the first quarter of 2014, we closed one of our manufacturing facilities in Amiens, France and, in the fourthquarter of 2014, we ceased our remaining farm tire production in EMEA. As a result of these actions, we expectannualized cost savings of approximately $75 million, with savings of $55 million realized in 2014. Thesesavings realized in 2014 are in addition to the $454 million of costs savings referred to above.
Net sales were $18,138 million in 2014, compared to $19,540 million in 2013. Net sales decreased in 2014 due tounfavorable foreign currency translation, primarily in Latin America, lower sales in other tire-related businesses,primarily third-party chemical sales in North America, and a decline in price and product mix, primarily inEMEA, as a result of the impact of lower raw material costs on pricing. Product mix was also negativelyimpacted by lower OTR tire sales.
For the year ended December 31, 2014, Goodyear net income was $2,452 million, compared to Goodyear netincome of $629 million in 2013, and Goodyear net income available to common shareholders was $2,445million, or $8.78, compared to Goodyear net income available to common shareholders of $600 million, or$2.28, in 2013. The increase in Goodyear net income in 2014 compared to 2013 was driven by net income taxbenefits of $1,834 million due primarily to the release of substantially all of the valuation allowance on our netU.S. deferred tax assets and to higher segment operating income.
Our total segment operating income for 2014 was $1,712 million, compared to $1,580 million in 2013. The $132million, or 8.4%, increase in segment operating income was due primarily to a decline in raw material costs of$553 million, primarily in EMEA and North America, which more than offset the effect of lower price andproduct mix of $376 million, and lower conversion costs of $101 million. These improvements were partiallyoffset by unfavorable foreign currency translation of $77 million, primarily in Latin America, and higher selling,administrative and general expense (“SAG”) of $59 million, primarily in EMEA and Latin America. Refer to“Results of Operations — Segment Information” for additional information.
6

In order to drive future growth and address the volatile economic environment, we remain focused on our keystrategies:
• Continuing to focus on market-back product development;
• Taking a selective approach to the market, targeting profitable segments where we have competitiveadvantages;
• Improving our manufacturing efficiency and creating an advantaged supply chain focused on reducing ourtotal delivered costs, optimizing working capital levels and delivering best in industry customer service;
• Focusing on cash flow to provide funding for our capital allocation plan described below; and
• Building top talent and teams.
In May 2014, we updated our shareholder return program that is part of our 2014-2016 capital allocation plan toincrease the quarterly cash dividend on our common stock by 20% to $0.06 per share and to increase our sharerepurchase program by $350 million to allow us to acquire up to $450 million of our common stock through2016. Our capital allocation plan also provides for capital expenditures, pension funding and debt repayments,and restructuring payments. Refer to “Liquidity and Capital Resources — Overview” for additional information.
Pension and Benefit Plans
At December 31, 2014, our unfunded global pension liability was $714 million, which was principallyattributable to our non-U.S. pension plans. At December 31, 2013, our unfunded global pension liability was$1,855 million, including approximately $1,100 million attributable to our hourly U.S. pension plans.
Our U.S. pension strategy includes the accelerated funding of pension plans in conjunction with significantlyreducing exposure in the investment portfolio of those plans to future equity market movements. The fixedincome investments held for these plans are designed to offset the subsequent impact of discount rate movementson the plans’ benefit obligation so that the funded status remains stable.
During the first quarter of 2014, we contributed $1,167 million in cash to fully fund the hourly U.S. pensionplans. In addition, we made contributions of $868 million during the first quarter of 2013 to fully fund our frozenU.S. pension plans. Consistent with our pension strategy, we transitioned those plans’ asset allocations to aportfolio of substantially all fixed income securities designed to offset any subsequent changes in discount rates.
As a result of fully funding these plans in the first quarter of 2014, pension benefits for hourly associates coveredby the USW collective bargaining agreement who participate in the hourly U.S. pension plans were frozeneffective April 30, 2014 and these associates now receive Company contributions to a defined contribution planbeginning on May 1, 2014. As a result of the accrual freeze, we recognized a curtailment charge of $33 million in2014.
We expect these actions will provide stability to our funded status, improve our earnings and operating cashflow, and provide greater transparency to our underlying tire business.
The net actuarial losses in Accumulated Other Comprehensive Loss (“AOCL”) related to the U.S. pension plansincreased by $292 million, including $285 million from updated life expectancy assumptions reflecting futuremortality improvements based on recently published actuarial tables.
Globally, we expect our 2015 net periodic pension cost to be approximately $125 million to $175 million.
Liquidity
At December 31, 2014, we had $2,161 million in Cash and Cash Equivalents as well as $2,317 million of unusedavailability under our various credit agreements, compared to $2,996 million and $2,726 million, respectively, atDecember 31, 2013. The decrease in cash and cash equivalents of $835 million was driven by pensioncontributions and direct payments of $1,338 million and capital expenditures of $923 million, includingexpenditures for the modernization and expansion of our United States, Brazil, Germany and China
7
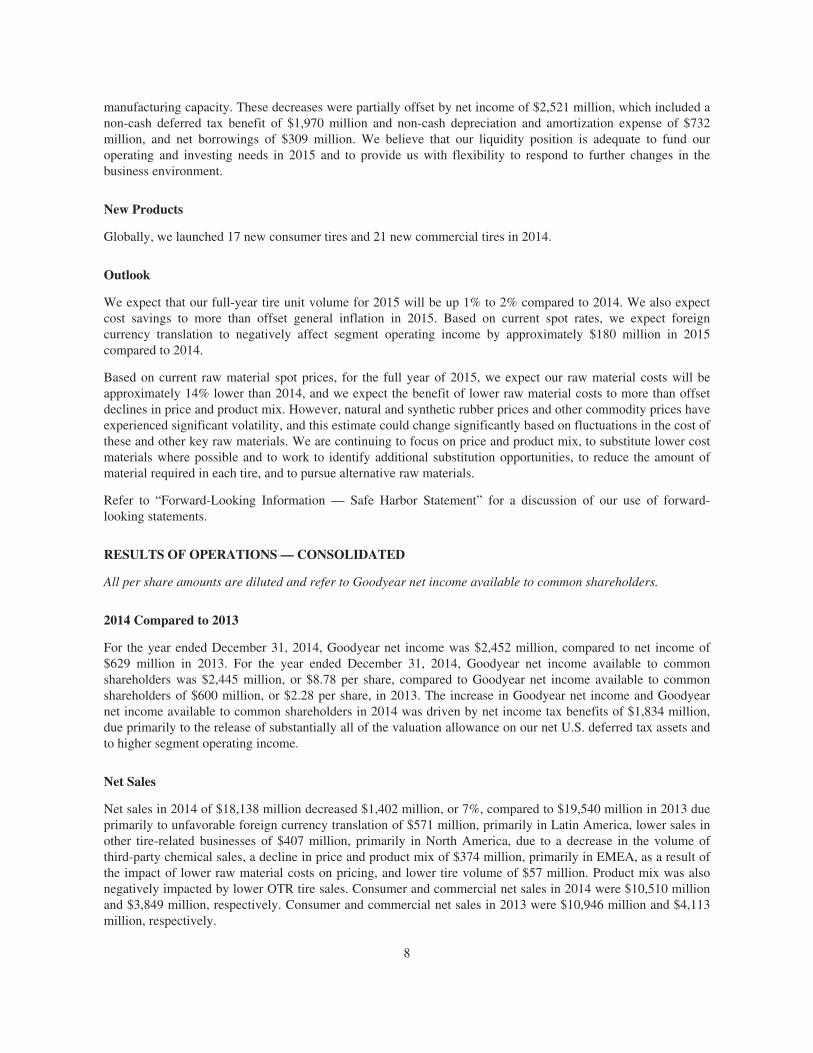
manufacturing capacity. These decreases were partially offset by net income of $2,521 million, which included anon-cash deferred tax benefit of $1,970 million and non-cash depreciation and amortization expense of $732million, and net borrowings of $309 million. We believe that our liquidity position is adequate to fund ouroperating and investing needs in 2015 and to provide us with flexibility to respond to further changes in thebusiness environment.
New Products
Globally, we launched 17 new consumer tires and 21 new commercial tires in 2014.
Outlook
We expect that our full-year tire unit volume for 2015 will be up 1% to 2% compared to 2014. We also expectcost savings to more than offset general inflation in 2015. Based on current spot rates, we expect foreigncurrency translation to negatively affect segment operating income by approximately $180 million in 2015compared to 2014.
Based on current raw material spot prices, for the full year of 2015, we expect our raw material costs will beapproximately 14% lower than 2014, and we expect the benefit of lower raw material costs to more than offsetdeclines in price and product mix. However, natural and synthetic rubber prices and other commodity prices haveexperienced significant volatility, and this estimate could change significantly based on fluctuations in the cost ofthese and other key raw materials. We are continuing to focus on price and product mix, to substitute lower costmaterials where possible and to work to identify additional substitution opportunities, to reduce the amount ofmaterial required in each tire, and to pursue alternative raw materials.
Refer to “Forward-Looking Information — Safe Harbor Statement” for a discussion of our use of forward-looking statements.
RESULTS OF OPERATIONS — CONSOLIDATED
All per share amounts are diluted and refer to Goodyear net income available to common shareholders.
2014 Compared to 2013
For the year ended December 31, 2014, Goodyear net income was $2,452 million, compared to net income of$629 million in 2013. For the year ended December 31, 2014, Goodyear net income available to commonshareholders was $2,445 million, or $8.78 per share, compared to Goodyear net income available to commonshareholders of $600 million, or $2.28 per share, in 2013. The increase in Goodyear net income and Goodyearnet income available to common shareholders in 2014 was driven by net income tax benefits of $1,834 million,due primarily to the release of substantially all of the valuation allowance on our net U.S. deferred tax assets andto higher segment operating income.
Net Sales
Net sales in 2014 of $18,138 million decreased $1,402 million, or 7%, compared to $19,540 million in 2013 dueprimarily to unfavorable foreign currency translation of $571 million, primarily in Latin America, lower sales inother tire-related businesses of $407 million, primarily in North America, due to a decrease in the volume ofthird-party chemical sales, a decline in price and product mix of $374 million, primarily in EMEA, as a result ofthe impact of lower raw material costs on pricing, and lower tire volume of $57 million. Product mix was alsonegatively impacted by lower OTR tire sales. Consumer and commercial net sales in 2014 were $10,510 millionand $3,849 million, respectively. Consumer and commercial net sales in 2013 were $10,946 million and $4,113million, respectively.
8

The following table presents our tire unit sales for the periods indicated:
Year Ended December 31,
(In millions of tires) 2014 2013 % Change
Replacement UnitsNorth America (U.S. and Canada) . . . . . . . . . . . . . . . . . . . . . . . . . . . . . . 43.0 42.9 0.2%
International . . . . . . . . . . . . . . . . . . . . . . . . . . . . . . . . . . . . . . . . . . . . . . . 69.9 69.0 1.3%
Total . . . . . . . . . . . . . . . . . . . . . . . . . . . . . . . . . . . . . . . . . . . . . . . . . 112.9 111.9 0.9%
OE UnitsNorth America (U.S. and Canada) . . . . . . . . . . . . . . . . . . . . . . . . . . . . . . 18.1 18.8 (3.7)%
International . . . . . . . . . . . . . . . . . . . . . . . . . . . . . . . . . . . . . . . . . . . . . . . 31.0 31.6 (1.9)%
Total . . . . . . . . . . . . . . . . . . . . . . . . . . . . . . . . . . . . . . . . . . . . . . . . . 49.1 50.4 (2.6)%
Goodyear worldwide tire units . . . . . . . . . . . . . . . . . . . . . . . . . . . . . 162.0 162.3 (0.2)%
The decrease in worldwide tire unit sales of 0.3 million units, or 0.2%, compared to 2013, included a decrease of1.3 million OE units, or 2.6%, primarily in the Latin America consumer business, driven primarily by weakerconsumer OE vehicle production in Brazil and our selective fitment strategy. Replacement tire volume increased1.0 million units, or 0.9%, primarily in the Latin America consumer business, driven by overall industry growth.Consumer and commercial unit sales in 2014 were 147.4 million and 12.6 million, respectively. Consumer andcommercial unit sales in 2013 were 147.5 million and 12.7 million, respectively.
Cost of Goods Sold
Cost of goods sold (“CGS”) was $13,906 million in 2014, decreasing $1,516 million, or 9.8%, compared to$15,422 million in 2013. CGS was 76.7% of sales in 2014 compared to 78.9% of sales in 2013. CGS in 2014decreased due to lower raw material costs of $553 million, primarily in EMEA and North America, lower costsin other tire-related businesses of $439 million, primarily in North America due to a decrease in the volume ofthird-party chemical sales, the effect of foreign currency translation which reduced costs by $420 million,primarily in Latin America, and lower conversion costs of $101 million. Conversion costs were favorablyimpacted by lower pension costs and lower under-absorbed fixed overhead costs of approximately $58 million.CGS in 2014 included pension expense of $123 million, excluding the pension curtailment and settlementcharges described below, which decreased from $222 million in 2013, due primarily to lower amortization ofactuarial losses resulting from 2013 actuarial gains related to our North American plans and the freeze of ourhourly U.S. pension plans.
CGS in 2014 included a pension curtailment loss of $33 million ($32 million after-tax and minority) as a result ofthe accrual freeze to pension plans in North America and a pension settlement loss of $5 million ($4 millionafter-tax and minority) related to lump sum payments to settle certain liabilities for our U.K. pension plans. CGSin 2014 also included charges for accelerated depreciation of $7 million ($5 million after-tax and minority)compared to $23 million ($17 million after-tax and minority) in 2013, primarily related to the closure of one ofour manufacturing facilities in Amiens, France. CGS also included savings from rationalization plans of $66million, of which $48 million related to the closure of one of our manufacturing facilities in Amiens, France andour exit of the farm tire business in EMEA.
Selling, Administrative and General Expense
Selling, administrative and general expense (“SAG”) was $2,720 million in 2014, decreasing $38 million, or1.4%, compared to $2,758 million in 2013. SAG was 15.0% of sales in 2014, compared to 14.1% in 2013. Thedecrease in SAG was due to the effect of foreign currency translation which reduced costs by $74 million andlower incentive compensation costs of $35 million, partially offset by higher advertising and marketing costs of$28 million, primarily in EMEA, and inflationary cost increases in wages and benefits and other costs. SAG in
9

2014 included pension expense of $52 million, compared to $63 million in 2013, primarily related to NorthAmerica. SAG also included savings from rationalization plans of $18 million, of which $7 million related to theclosure of one of our manufacturing facilities in Amiens, France and our exit of the farm tire business in EMEA.
Rationalizations
To maintain global competitiveness, we have implemented rationalization actions over the past several years toreduce excess and high-cost manufacturing capacity and to reduce selling, administrative and general expensesthrough associate headcount reductions. We recorded net rationalization charges of $95 million in 2014($66 million after-tax and minority). Net rationalization charges include charges of $74 million for associateseverance and idle plant costs, partially offset by pension curtailment gains of $22 million, related to the closureof one of our manufacturing facilities in Amiens, France. Rationalization actions initiated in 2014 primarilyconsisted of manufacturing headcount reductions related to EMEA’s plans to improve operating efficiency. Inaddition, EMEA, Latin America and Asia Pacific also initiated plans to reduce SAG headcount.
We recorded net rationalization charges of $58 million in 2013 ($41 million after-tax and minority).Rationalization actions initiated in 2013 consisted primarily of manufacturing headcount reductions related toEMEA’s plans to improve efficiency and reduce manufacturing capacity in certain Western European countries.In addition, Asia Pacific also initiated plans primarily relating to SAG headcount reductions and the closure ofretail facilities in Australia and New Zealand.
Upon completion of the 2014 plans, we estimate that annual segment operating income will improve byapproximately $18 million ($4 million CGS and $14 million SAG). The savings realized in 2014 fromrationalization plans totaled $84 million ($66 million CGS and $18 million SAG) including $55 million related tothe closure of one of our manufacturing facilities in Amiens, France and our exit of the farm tire business inEMEA.
For further information, refer to Note 2, Costs Associated with Rationalization Programs.
Interest Expense
Interest expense was $428 million in 2014, increasing $36 million compared to $392 million in 2013. Theincrease relates primarily to higher average debt balances of $6,765 million in 2014 compared to $6,330 millionin 2013 and an increase in average interest rates to 6.42% in 2014 compared to 6.19% in 2013. Interest expensein 2014 was favorably impacted by $6 million related to interest recovered on the settlement of indirect taxclaims in Latin America.
Other Expense
Other Expense in 2014 was $302 million, increasing $205 million from $97 million in 2013. The increase inOther Expense reflects higher net foreign currency exchange losses, which were $239 million in 2014 comparedto $118 million in 2013. The increase was due primarily to losses resulting from changes in the exchange rate ofthe Venezuelan bolivar fuerte against the U.S. dollar of $200 million ($175 million after-tax and minority) in2014 compared to $115 million ($92 million after-tax and minority) in 2013. For further discussion onVenezuela, refer to “Management’s Discussion and Analysis of Financial Condition and Results of Operations —Liquidity and Capital Resources.”
Other Expense reflected interest income of $28 million for 2014, compared to interest income of $41 million in2013. Interest income consists primarily of amounts earned on cash deposits. Interest income in 2014 alsoincluded $10 million earned on the settlement of indirect tax claims and in 2013 also included $11 million earnedon favorable tax judgments, both in Latin America.
Other Expense reflected charges of $25 million in 2014 related to general and product liability — discontinuedproducts, which includes charges for claims against us related primarily to asbestos personal injury claims, net ofprobable insurance recoveries, compared to $15 million in 2013. The increase in charges in 2014 was due tounfavorable changes in assumptions related to claim trends and probable insurance recoveries for asbestosclaims.
10

Other Expense included an increase in net miscellaneous expense of $27 million in 2014 compared to 2013.Miscellaneous expense in 2014 and 2013 included charges of $22 million ($22 million after-tax and minority)and $6 million ($6 million after-tax and minority), respectively, for labor claims with respect to a previouslyclosed facility in Greece. Miscellaneous expense in 2014 also included charges of $16 million ($16 million after-tax and minority) related to a government investigation involving our compliance with the U.S. Foreign CorruptPractices Act in certain countries in Africa.
Other Expense reflected a decrease in royalty income in 2014 to $35 million from $51 million in 2013, dueprimarily to a one-time royalty of $11 million related to chemical operations included in 2013. A substantialportion of royalty income results from the amortization of deferred revenue from prepaid trademark licensingroyalties associated with the sale of our former Engineered Products business to The Carlyle Group in 2007. In2014, The Carlyle Group announced that it had entered into an agreement to sell that business to Continental AG,and the transaction was completed in January 2015. We have terminated the licensing agreement and willrecognize a one-time gain on the unamortized balance of the deferred revenue in 2015. A substantial portion ofthe deferred revenue will be recognized in the first quarter of 2015, with the remaining portion recognized over asix month transition period. Thereafter, royalty income will be reduced by approximately $12 million per year.The unamortized balance at December 31, 2014 was approximately $170 million.
Other Expense in 2014 also included net gains on asset sales of $3 million ($4 million after-tax and minority)compared to net gains of $8 million ($7 million after-tax and minority) in 2013.
For further information, refer to Note 4, Other Expense.
Income Taxes
Income tax benefit in 2014 was $1,834 million on income before income taxes of $687 million. For 2013, incometax expense was $138 million on income before income taxes of $813 million. In 2014, the difference betweenour effective tax rate and the U.S. statutory rate was primarily due to the release of substantially all of thevaluation allowance on our net U.S. deferred tax assets, as discussed further below. In 2013, the differencebetween our effective tax rate and the U.S. statutory rate was primarily due to continuing to maintain a fullvaluation allowance against our net U.S. deferred tax assets and certain foreign deferred tax assets.
Income tax benefit in 2014 was favorably impacted by $1,980 million ($1,981 million after minority interest) ofdiscrete tax adjustments, including a benefit of $2,179 million from the December 31, 2014 release ofsubstantially all of the valuation allowance on our net U.S. deferred tax assets as discussed further below,partially offset by charges of $131 million to record deferred taxes on certain undistributed earnings of certainforeign subsidiaries. The 2014 income tax benefit also included charges of $37 million to establish valuationallowances on the net deferred tax assets of our Venezuelan and Brazilian subsidiaries, due to continuingoperating losses and currency devaluations in Venezuela, a charge of $9 million to establish a valuationallowance on the net deferred tax assets of a Luxembourg subsidiary, and a charge of $11 million due to arecently enacted law change in Chile. Income tax expense in 2013 included discrete net tax benefits of $43million ($37 million after minority) due primarily to a $33 million benefit from special enterprise zone taxincentives in Poland and a $13 million benefit related to changes in enacted tax laws.
At January 1, 2014, our valuation allowance on our U.S. deferred tax assets was approximately $2,400 million.Since 2002, Goodyear has maintained a full valuation allowance on its U.S. net deferred tax asset position. Ineach reporting period we have assessed the available positive and negative evidence to estimate if sufficientfuture taxable income would be generated to utilize the existing deferred tax assets. Through 2012, our history ofU.S. operating losses limited the weight we applied to other subjective evidence such as our projections forfuture profitability. Before we changed our judgment on the need for a full valuation allowance, a sustainedperiod of operating profitability was required.
At December 31, 2014, our U.S. operations were in a position of cumulative profits for the most recent three-yearperiod. We concluded that as a consequence of our three-year cumulative profits, achieving full year profitabilityin 2013 and 2014, our successful completion of labor negotiations with the United Steelworkers in 2013, our fullfunding of our U.S. pension plans during 2013 and 2014, and our business plan for 2015 and beyond showing
11

continued profitability, that it is more likely than not that a significant portion of our U.S. deferred tax assets willbe realized. Accordingly, in the fourth quarter of 2014, we released substantially all of our valuation allowanceon our net U.S. deferred tax assets, resulting in a $2,179 million benefit in our provision for income taxes.
In the periods after which our U.S. valuation allowance is released, we expect an increase in our effective tax rateas a result of recording tax expense on our U.S. earnings. Over the next five years, we estimate utilizing themajority of our tax credits and tax loss carryforwards and paying no significant federal income tax.
At December 31, 2014, our valuation allowance on certain of our U.S federal, state and local deferred tax assetswas $14 million and our valuation allowance on our foreign deferred tax assets was $618 million.
Our losses in various foreign taxing jurisdictions in recent periods represented sufficient negative evidence torequire us to maintain a full valuation allowance against certain of our net deferred tax assets. However, it isreasonably possible that sufficient positive evidence required to release all, or a portion, of certain valuationallowances will exist during 2015. This may result in a reduction of the valuation allowance and one time taxbenefit of up to $80 million ($60 million net of minority interest).
For further information, refer to Note 5, Income Taxes.
Minority Shareholders’ Net Income
Minority shareholders’ net income was $69 million in 2014, compared to $46 million in 2013. The increase wasdue to higher earnings in our joint venture in Europe.
2013 Compared to 2012
For the year ended December 31, 2013, Goodyear net income was $629 million, compared to net income of $212million in 2012. For the year ended December 31, 2013, Goodyear net income available to common shareholderswas $600 million, or $2.28 per share, compared to Goodyear net income available to common shareholders of$183 million, or $0.74 per share.
Net Sales
Net sales in 2013 of $19,540 million decreased $1,452 million, or 6.9%, compared to $20,992 million in 2012due primarily to lower sales in other tire-related businesses of $665 million, primarily in North America due to adecrease in the price and volume of third-party sales of chemical products, unfavorable foreign currencytranslation of $354 million, primarily in Latin America and Asia Pacific, lower price and product mix of $206million, primarily in North America and EMEA, and lower tire volume of $166 million, primarily in EMEA.Consumer and commercial net sales in 2013 were $10,946 million and $4,113 million, respectively. Consumerand commercial net sales in 2012 were $11,429 million and $4,202 million, respectively.
The following table presents our tire unit sales for the periods indicated:
Year Ended December 31,
(In millions of tires) 2013 2012 % Change
Replacement UnitsNorth America (U.S. and Canada) . . . . . . . . . . . . . . . . . . . . . . . . . . . . . . . . . . . . . . . . . 42.9 44.5 (3.3)%
International . . . . . . . . . . . . . . . . . . . . . . . . . . . . . . . . . . . . . . . . . . . . . . . . . . . . . . . . . . 69.0 69.9 (1.3)%
Total . . . . . . . . . . . . . . . . . . . . . . . . . . . . . . . . . . . . . . . . . . . . . . . . . . . . . . . . . . . . 111.9 114.4 (2.1)%
OE UnitsNorth America (U.S. and Canada) . . . . . . . . . . . . . . . . . . . . . . . . . . . . . . . . . . . . . . . . . 18.8 18.1 3.0%
International . . . . . . . . . . . . . . . . . . . . . . . . . . . . . . . . . . . . . . . . . . . . . . . . . . . . . . . . . . 31.6 31.5 0.3%
Total . . . . . . . . . . . . . . . . . . . . . . . . . . . . . . . . . . . . . . . . . . . . . . . . . . . . . . . . . . . . 50.4 49.6 1.4%
Goodyear worldwide tire units . . . . . . . . . . . . . . . . . . . . . . . . . . . . . . . . . . . . . . . . 162.3 164.0 (1.1)%
12
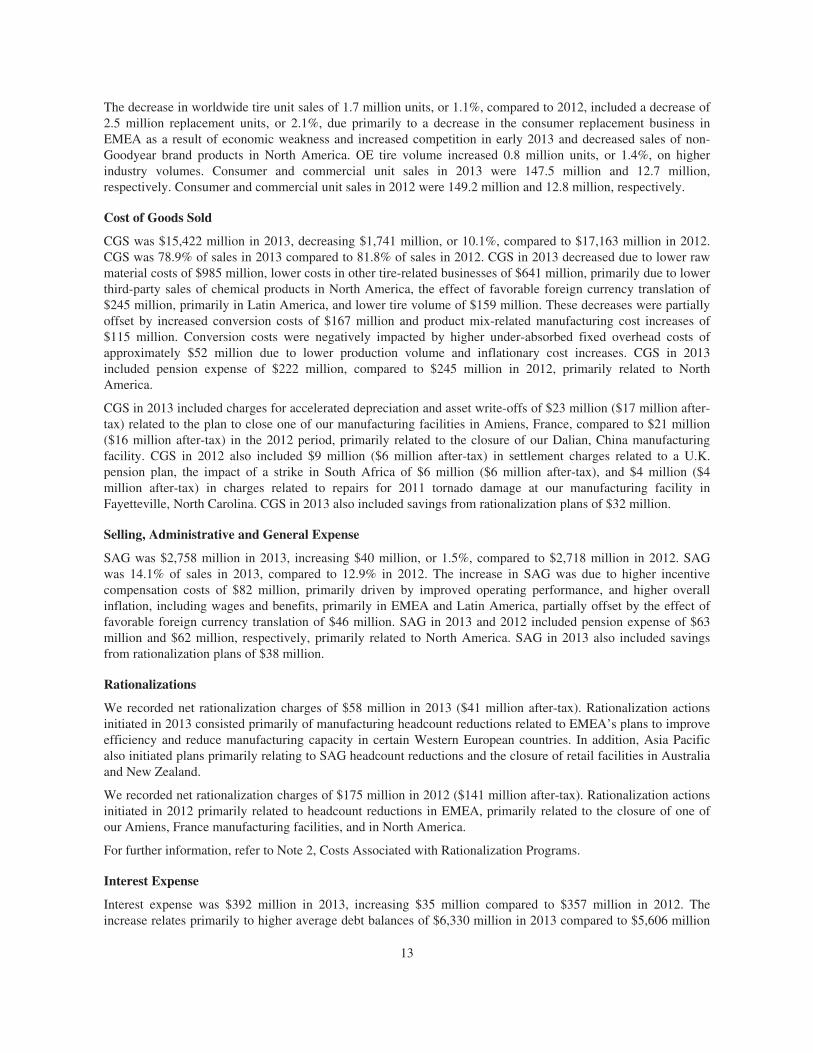
The decrease in worldwide tire unit sales of 1.7 million units, or 1.1%, compared to 2012, included a decrease of2.5 million replacement units, or 2.1%, due primarily to a decrease in the consumer replacement business inEMEA as a result of economic weakness and increased competition in early 2013 and decreased sales of non-Goodyear brand products in North America. OE tire volume increased 0.8 million units, or 1.4%, on higherindustry volumes. Consumer and commercial unit sales in 2013 were 147.5 million and 12.7 million,respectively. Consumer and commercial unit sales in 2012 were 149.2 million and 12.8 million, respectively.
Cost of Goods Sold
CGS was $15,422 million in 2013, decreasing $1,741 million, or 10.1%, compared to $17,163 million in 2012.CGS was 78.9% of sales in 2013 compared to 81.8% of sales in 2012. CGS in 2013 decreased due to lower rawmaterial costs of $985 million, lower costs in other tire-related businesses of $641 million, primarily due to lowerthird-party sales of chemical products in North America, the effect of favorable foreign currency translation of$245 million, primarily in Latin America, and lower tire volume of $159 million. These decreases were partiallyoffset by increased conversion costs of $167 million and product mix-related manufacturing cost increases of$115 million. Conversion costs were negatively impacted by higher under-absorbed fixed overhead costs ofapproximately $52 million due to lower production volume and inflationary cost increases. CGS in 2013included pension expense of $222 million, compared to $245 million in 2012, primarily related to NorthAmerica.
CGS in 2013 included charges for accelerated depreciation and asset write-offs of $23 million ($17 million after-tax) related to the plan to close one of our manufacturing facilities in Amiens, France, compared to $21 million($16 million after-tax) in the 2012 period, primarily related to the closure of our Dalian, China manufacturingfacility. CGS in 2012 also included $9 million ($6 million after-tax) in settlement charges related to a U.K.pension plan, the impact of a strike in South Africa of $6 million ($6 million after-tax), and $4 million ($4million after-tax) in charges related to repairs for 2011 tornado damage at our manufacturing facility inFayetteville, North Carolina. CGS in 2013 also included savings from rationalization plans of $32 million.
Selling, Administrative and General Expense
SAG was $2,758 million in 2013, increasing $40 million, or 1.5%, compared to $2,718 million in 2012. SAGwas 14.1% of sales in 2013, compared to 12.9% in 2012. The increase in SAG was due to higher incentivecompensation costs of $82 million, primarily driven by improved operating performance, and higher overallinflation, including wages and benefits, primarily in EMEA and Latin America, partially offset by the effect offavorable foreign currency translation of $46 million. SAG in 2013 and 2012 included pension expense of $63million and $62 million, respectively, primarily related to North America. SAG in 2013 also included savingsfrom rationalization plans of $38 million.
Rationalizations
We recorded net rationalization charges of $58 million in 2013 ($41 million after-tax). Rationalization actionsinitiated in 2013 consisted primarily of manufacturing headcount reductions related to EMEA’s plans to improveefficiency and reduce manufacturing capacity in certain Western European countries. In addition, Asia Pacificalso initiated plans primarily relating to SAG headcount reductions and the closure of retail facilities in Australiaand New Zealand.
We recorded net rationalization charges of $175 million in 2012 ($141 million after-tax). Rationalization actionsinitiated in 2012 primarily related to headcount reductions in EMEA, primarily related to the closure of one ofour Amiens, France manufacturing facilities, and in North America.
For further information, refer to Note 2, Costs Associated with Rationalization Programs.
Interest Expense
Interest expense was $392 million in 2013, increasing $35 million compared to $357 million in 2012. Theincrease relates primarily to higher average debt balances of $6,330 million in 2013 compared to $5,606 million
13

in 2012 and an increase in average interest rates to 6.19% in 2013 compared to 6.14% in 2012. In addition, werecorded $13 million of expense in 2012 to correct capitalized interest recorded in prior periods.
Other Expense
Other Expense in 2013 was $97 million, decreasing $42 million compared to $139 million in 2012. Net foreigncurrency exchange losses in 2013 included a net loss of $115 million ($92 million after-tax) resulting from thedevaluation of the Venezuelan bolivar fuerte against the U.S. dollar. Effective February 13, 2013, Venezuela’sofficial exchange rate changed from 4.3 to 6.3 bolivares fuertes to the U.S. dollar for substantially all goods. Forfurther discussion on Venezuela, refer to “Management’s Discussion and Analysis of Financial Condition andResults of Operations — Liquidity and Capital Resources.” Financing fees were $56 million in 2013 compared to$156 million in 2012. Financing fees for 2012 included $86 million ($86 million after-tax) in financing feesrelated to the redemption of $650 million in aggregate principal amount of our outstanding 10.5% senior notesdue 2016. Also included in 2012 was a charge of $24 million ($24 million after-tax) for debt issuance costs,primarily related to the amendment and restatement of our U.S. second lien term loan facility.
Royalty income in 2013 was $51 million, compared to royalty income of $38 million in 2012. Royalty income in2013 included one-time royalties of $11 million related to our chemical operations. Net gains on asset sales were$8 million ($7 million after-tax) in 2013 compared to net gains of $25 million ($20 million after-tax) in 2012.Net gains on asset sales in 2013 related primarily to the transfer of property in Dalian, China to the Chinesegovernment and the sale of property in North America. Net gains on asset sales in 2012 included gains on thesale of property in North America, the sale of a minority interest in a retail business in EMEA and the sale ofcertain assets related to our bias tire business in Latin America.
Other Expense also included interest income of $11 million earned on favorable tax judgments in Latin Americathat will be utilized against future indirect tax liabilities, and charges relating to labor claims with respect to apreviously closed facility in Greece of $6 million ($6 million after-tax) in 2013 compared to charges of $25million ($25 million after-tax) in 2012.
For further information, refer to Note 4, Other Expense.
Income Taxes
Tax expense in 2013 was $138 million on income before income taxes of $813 million. For 2012, tax expensewas $203 million on income before income taxes of $440 million. The difference between our effective tax rateand the U.S. statutory rate was primarily due to continuing to maintain a full valuation allowance against ourFederal and state and certain foreign deferred tax assets and the adjustments discussed below.
Income tax expense in 2013 included discrete net tax benefits of $43 million ($37 million after minority) dueprimarily to a $33 million benefit from special enterprise zone tax incentives in Poland and a $13 million benefitrelated to changes in enacted tax laws. Income tax expense in 2012 included discrete net tax charges of $19million ($17 million after minority) due primarily to increased tax reserves for prior years.
At December 31, 2013, our valuation allowance on our U.S. and foreign deferred tax assets was $2,400 millionand $568 million, respectively.
For further information, refer to Note 5, Income Taxes.
Minority Shareholders’ Net Income
Minority shareholders’ net income was $46 million in 2013, compared to $25 million in 2012. The increase wasdue to higher earnings in both our joint venture in Europe and in a less than wholly owned Polish subsidiary,driven by special enterprise zone tax incentives recognized in 2013.
RESULTS OF OPERATIONS — SEGMENT INFORMATION
Segment information reflects our strategic business units (“SBUs”), which are organized to meet customerrequirements and global competition and are segmented on a regional basis.
14

Results of operations are measured based on net sales to unaffiliated customers and segment operating income.Each segment exports tires to other segments. The financial results of each segment exclude sales of tiresexported to other segments, but include operating income derived from such transactions. Segment operatingincome is computed as follows: Net Sales less CGS (excluding asset write-off and accelerated depreciationcharges) and SAG (including certain allocated corporate administrative expenses). Segment operating incomealso includes certain royalties and equity in earnings of most affiliates. Segment operating income does notinclude net rationalization charges (credits), asset sales and certain other items.
Total segment operating income was $1,712 million in 2014, $1,580 million in 2013 and $1,248 million in 2012.Total segment operating margin (segment operating income divided by segment sales) in 2014 was 9.4%,compared to 8.1% in 2013 and 5.9% in 2012.
Management believes that total segment operating income is useful because it represents the aggregate value ofincome created by our SBUs and excludes items not directly related to the SBUs for performance evaluationpurposes. Total segment operating income is the sum of the individual SBUs’ segment operating income. Referto Note 7, Business Segments, for further information and for a reconciliation of total segment operating incometo Income before Income Taxes.
North America
Year Ended December 31,
(In millions) 2014 2013 2012
Tire Units . . . . . . . . . . . . . . . . . . . . . . . . . . . . . . . . . . . . . . . . . . . . . . . . . 61.1 61.7 62.6
Net Sales . . . . . . . . . . . . . . . . . . . . . . . . . . . . . . . . . . . . . . . . . . . . . . . . . . $8,085 $8,684 $9,666
Operating Income . . . . . . . . . . . . . . . . . . . . . . . . . . . . . . . . . . . . . . . . . . . 803 691 514
Operating Margin . . . . . . . . . . . . . . . . . . . . . . . . . . . . . . . . . . . . . . . . . . . 9.9% 8.0% 5.3%
2014 Compared to 2013
North America unit sales in 2014 decreased 0.6 million units, or 1.0%, to 61.1 million units. OE tire volumedecreased approximately 0.6 million units, or 3.3%, primarily in consumer OE, due to our OE selectivitystrategy. Replacement tire volume remained flat.
Net sales in 2014 were $8,085 million, decreasing $599 million, or 6.9%, compared to $8,684 million in 2013.The decrease was due primarily to lower sales in our other tire-related businesses of $384 million, driven by adecline in the volume of third-party sales of chemical products. In addition, net sales decreased due to lowerprice and product mix of $90 million, driven by the impact of lower raw material costs on pricing, unfavorableforeign currency translation of $65 million and lower tire volume of $60 million.
Operating income in 2014 was $803 million, increasing $112 million, or 16.2%, from $691 million in 2013. Theincrease in operating income was due primarily to lower conversion costs of $93 million. The decrease inconversion costs included lower pension costs of $63 million, lower labor costs due primarily to prior year one-time charges of $27 million related to our USW agreement and lower workers’ compensation costs of $13million, partially offset by increased profit sharing costs of $18 million. Operating income also benefited from adecline in raw material costs of $191 million, which more than offset the effect of lower price and product mix of$136 million, and higher income from our other tire-related businesses of $19 million, primarily in our retailbusiness. These improvements were partially offset by higher transportation costs of $27 million and lowervolume of $11 million. Conversion costs included net savings from rationalization plans of $8 million.
Operating income in 2014 excluded net pension curtailment charges of $33 million, a net reversal ofrationalization charges of $6 million and net gains on asset sales of $8 million. Operating income in 2013excluded net rationalization charges of $12 million and net gains on asset sales of $4 million.
15

2013 Compared to 2012
North America unit sales in 2013 decreased 0.9 million units, or 1.5%, to 61.7 million units. The decrease wasdue to a reduction in replacement tire volume of 1.5 million units, or 3.3%, primarily in our consumer business,reflecting decreased sales of non-Goodyear brand products. Although replacement volumes declined in 2013,fourth quarter replacement tire volume increased by 1.0%. OE tire volume increased 0.6 million units, or 3.0%.
Net sales in 2013 were $8,684 million, decreasing $982 million, or 10.2%, compared to $9,666 million in 2012.The decrease was due primarily to lower sales in our other tire-related businesses of $609 million, driven by adecline in the price and volume of third-party sales of chemical products. In addition, net sales decreased due tolower price and product mix of $259 million, driven by the impact of lower raw material costs on pricing, lowertire volume of $98 million and unfavorable foreign currency translation of $15 million.
Operating income in 2013 was $691 million, increasing $177 million, or 34.4%, from $514 million in 2012. Theincrease in operating income was due primarily to a decline in raw material costs of $483 million, which morethan offset the effect of lower price and product mix of $250 million. Improvements in operating income werepartially offset by higher conversion costs of $23 million, increased transportation costs of $18 million anddecreased tire volume of $13 million. Higher conversion costs were due primarily to $57 million of increasedunder-absorbed overhead resulting from changes in production volumes, one-time charges of $27 millionassociated with the new USW agreement and inflation, partially offset by lower profit sharing of $50 million andlower pension costs of $36 million. Conversion costs and SAG expenses included net savings fromrationalization plans of $26 million and $13 million, respectively.
Operating income in 2013 excluded net rationalization charges of $12 million and net gains on asset sales of $4million. Operating income in 2012 excluded net rationalization charges of $43 million and charges foraccelerated depreciation and asset write-offs of $1 million, primarily related to the closure of our manufacturingfacility in Union City, Tennessee, and net gains on asset sales of $9 million.
Europe, Middle East and Africa
Year Ended December 31,
(In millions) 2014 2013 2012
Tire Units . . . . . . . . . . . . . . . . . . . . . . . . . . . . . . . . . . . . . . . . . . . . . . . . . 60.5 60.8 62.7
Net Sales . . . . . . . . . . . . . . . . . . . . . . . . . . . . . . . . . . . . . . . . . . . . . . . . . . $6,180 $6,567 $6,884
Operating Income . . . . . . . . . . . . . . . . . . . . . . . . . . . . . . . . . . . . . . . . . . . 438 298 252
Operating Margin . . . . . . . . . . . . . . . . . . . . . . . . . . . . . . . . . . . . . . . . . . . 7.1% 4.5% 3.7%
2014 Compared to 2013
Europe, Middle East and Africa unit sales in 2014 decreased 0.3 million units, or 0.5%, to 60.5 million units.Replacement tire volume decreased 0.5 million units, or 1.2% while OE tire volume increased 0.2 million units,or 1.1%. These changes were primarily related to the consumer business. Decreased unit volumes in theconsumer replacement business primarily reflect the negative impact of unusually warm weather on seasonalwinter tire sales, challenging economic conditions and increased competition.
Net sales in 2014 were $6,180 million, decreasing $387 million, or 5.9%, compared to $6,567 million in 2013.Net sales decreased due primarily to unfavorable price and product mix of $240 million, driven by the impact oflower raw material costs on pricing. Net sales were also negatively impacted by unfavorable foreign currencytranslation of $113 million and lower tire volume of $39 million.
Operating income in 2014 was $438 million, increasing $140 million, or 47.0%, compared to $298 million in2013. Operating income increased due primarily to a decline in raw material costs of $250 million, which morethan offset the effect of lower price and product mix of $194 million. Operating income was also positivelyimpacted by lower conversion costs of $81 million, net savings of $55 million from the closure of one of ourAmiens, France manufacturing facilities and our exit from the farm tire business, and higher income from our
16

other tire-related businesses of $11 million, primarily in our motorcycle business. Decreased conversion costsincluded lower under-absorbed overhead of $86 million resulting from higher production volumes. Operatingincome was negatively impacted by higher SAG expenses of $37 million, driven primarily by higher advertisingand marketing costs, lower tire volume of $21 million and a charge related to a commercial tire customersatisfaction program of $12 million. Conversion costs and SAG expenses included net savings fromrationalization plans of $8 million and $7 million, respectively.
One of our Amiens, France manufacturing facilities closed in the first quarter of 2014 and our remaining farmtire production ceased in the fourth quarter of 2014. These actions are expected to improve EMEA operatingincome by approximately $75 million annually, with savings of $55 million realized in 2014.
Operating income in 2014 excluded net rationalization charges of $89 million, primarily related to the closure ofone of our Amiens, France manufacturing facilities, charges of $22 million related to labor claims with respect toa previously closed facility in Greece, net losses on asset sales of $7 million and charges for accelerateddepreciation and asset write-offs of $7 million. Operating income in 2013 excluded net rationalization charges of$26 million and charges for accelerated depreciation and asset write-offs of $23 million, primarily related to theclosure of one of our Amiens, France manufacturing facilities, charges of $6 million related to labor claims withrespect to a previously closed facility in Greece, and net gains on asset sales of $1 million.
EMEA’s results are highly dependent upon Germany, which accounted for approximately 37% and 36% ofEMEA’s net sales in 2014 and 2013 respectively. Accordingly, results of operations in Germany are expected tocontinue to have a significant impact on EMEA’s future performance.
2013 Compared to 2012
Europe, Middle East and Africa unit sales in 2013 decreased 1.9 million units, or 3.1%, to 60.8 million units.Replacement tire volume decreased 2.2 million units, or 4.9%, primarily in the consumer business, due toeconomic weakness and uncertainty in the region, which slowed retail demand, aggressive competition and hightrade inventory levels following weak dealer seasonal tire sales in 2012. The decline in replacement volumesrelates to the first quarter of 2013, as unit volume has experienced modest growth in subsequent quarters. OE tirevolume increased 0.3 million units, or 2.0%, due to continued stabilization of industry volumes, at a low level,across EMEA during 2013.
Net sales in 2013 were $6,567 million, decreasing $317 million, or 4.6%, compared to $6,884 million in 2012.Net sales decreased due primarily to lower tire volume of $185 million, unfavorable price and product mix of$122 million, driven by the impact of lower raw material costs on pricing, and lower sales in our other tire-related businesses of $43 million, primarily in our retail operations. These decreases were partially offset byfavorable foreign currency translation of $33 million.
Operating income in 2013 was $298 million, increasing $46 million, or 18.3%, compared to $252 million in2012. Operating income increased due primarily to a decline in raw material costs of $322 million, which morethan offset the effect of lower price and product mix of $213 million. Operating income also benefited fromlower SAG expenses of $18 million, driven by lower advertising and marketing costs, partially offset by higherincentive compensation costs driven by improved operating performance. These increases were partially offsetby lower tire volume of $35 million, higher conversion costs of $25 million, primarily due to wage inflation, andlower income from our other tire-related businesses of $21 million, primarily in our retail operations. Conversioncosts and SAG expenses included net savings from rationalization plans of $6 million and $8 million,respectively. Raw material costs in 2012 included a $29 million charge for a contractual obligation under anofftake agreement.
Operating income in 2013 excluded net rationalization charges of $26 million and charges for accelerateddepreciation and asset write-offs of $23 million, primarily related to the closure of one of our Amiens, Francemanufacturing facilities, charges of $6 million related to labor claims with respect to a previously closed facilityin Greece, and a net gain on asset sales of $1 million. Operating income in 2012 excluded net rationalizationcharges of $100 million, primarily related to the exit of our farm tire business in EMEA and closure of one of ourAmiens, France manufacturing facilities, a charge of $25 million related to labor claims with respect to apreviously closed facility in Greece, and net gains on asset sales of $9 million.
17
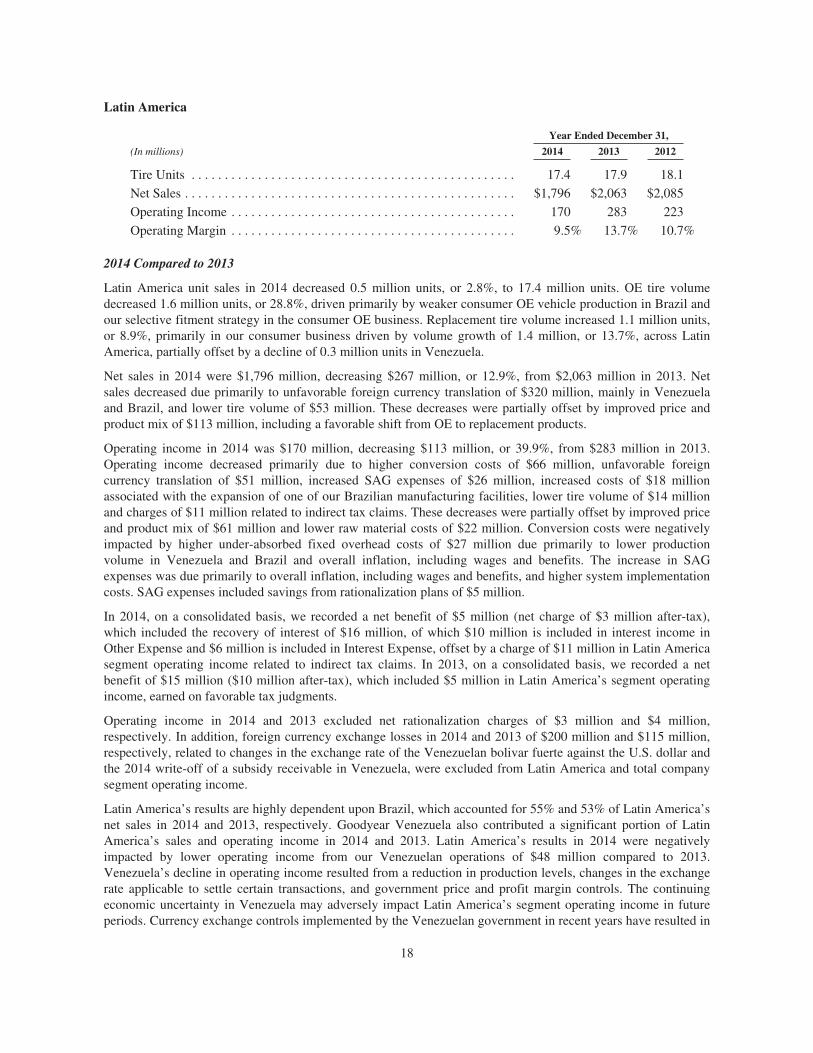
Latin America
Year Ended December 31,
(In millions) 2014 2013 2012
Tire Units . . . . . . . . . . . . . . . . . . . . . . . . . . . . . . . . . . . . . . . . . . . . . . . . . 17.4 17.9 18.1
Net Sales . . . . . . . . . . . . . . . . . . . . . . . . . . . . . . . . . . . . . . . . . . . . . . . . . . $1,796 $2,063 $2,085
Operating Income . . . . . . . . . . . . . . . . . . . . . . . . . . . . . . . . . . . . . . . . . . . 170 283 223
Operating Margin . . . . . . . . . . . . . . . . . . . . . . . . . . . . . . . . . . . . . . . . . . . 9.5% 13.7% 10.7%
2014 Compared to 2013
Latin America unit sales in 2014 decreased 0.5 million units, or 2.8%, to 17.4 million units. OE tire volumedecreased 1.6 million units, or 28.8%, driven primarily by weaker consumer OE vehicle production in Brazil andour selective fitment strategy in the consumer OE business. Replacement tire volume increased 1.1 million units,or 8.9%, primarily in our consumer business driven by volume growth of 1.4 million, or 13.7%, across LatinAmerica, partially offset by a decline of 0.3 million units in Venezuela.
Net sales in 2014 were $1,796 million, decreasing $267 million, or 12.9%, from $2,063 million in 2013. Netsales decreased due primarily to unfavorable foreign currency translation of $320 million, mainly in Venezuelaand Brazil, and lower tire volume of $53 million. These decreases were partially offset by improved price andproduct mix of $113 million, including a favorable shift from OE to replacement products.
Operating income in 2014 was $170 million, decreasing $113 million, or 39.9%, from $283 million in 2013.Operating income decreased primarily due to higher conversion costs of $66 million, unfavorable foreigncurrency translation of $51 million, increased SAG expenses of $26 million, increased costs of $18 millionassociated with the expansion of one of our Brazilian manufacturing facilities, lower tire volume of $14 millionand charges of $11 million related to indirect tax claims. These decreases were partially offset by improved priceand product mix of $61 million and lower raw material costs of $22 million. Conversion costs were negativelyimpacted by higher under-absorbed fixed overhead costs of $27 million due primarily to lower productionvolume in Venezuela and Brazil and overall inflation, including wages and benefits. The increase in SAGexpenses was due primarily to overall inflation, including wages and benefits, and higher system implementationcosts. SAG expenses included savings from rationalization plans of $5 million.
In 2014, on a consolidated basis, we recorded a net benefit of $5 million (net charge of $3 million after-tax),which included the recovery of interest of $16 million, of which $10 million is included in interest income inOther Expense and $6 million is included in Interest Expense, offset by a charge of $11 million in Latin Americasegment operating income related to indirect tax claims. In 2013, on a consolidated basis, we recorded a netbenefit of $15 million ($10 million after-tax), which included $5 million in Latin America’s segment operatingincome, earned on favorable tax judgments.
Operating income in 2014 and 2013 excluded net rationalization charges of $3 million and $4 million,respectively. In addition, foreign currency exchange losses in 2014 and 2013 of $200 million and $115 million,respectively, related to changes in the exchange rate of the Venezuelan bolivar fuerte against the U.S. dollar andthe 2014 write-off of a subsidy receivable in Venezuela, were excluded from Latin America and total companysegment operating income.
Latin America’s results are highly dependent upon Brazil, which accounted for 55% and 53% of Latin America’snet sales in 2014 and 2013, respectively. Goodyear Venezuela also contributed a significant portion of LatinAmerica’s sales and operating income in 2014 and 2013. Latin America’s results in 2014 were negativelyimpacted by lower operating income from our Venezuelan operations of $48 million compared to 2013.Venezuela’s decline in operating income resulted from a reduction in production levels, changes in the exchangerate applicable to settle certain transactions, and government price and profit margin controls. The continuingeconomic uncertainty in Venezuela may adversely impact Latin America’s segment operating income in futureperiods. Currency exchange controls implemented by the Venezuelan government in recent years have resulted in
18

our inability to remit dividends or timely and consistently settle liabilities in currencies other than the bolivarfuerte. Price and profit margin regulations, as well as strict labor laws, have eroded our ability to make keydecisions regarding our operations, including our ability to hire or terminate employees without the approval ofthe Venezuelan government. Future government controls and regulations may further erode our control over ouroperations in Venezuela and could lead us to deconsolidate our Venezuelan subsidiary from our consolidatedfinancial statements. For further information refer to “Management’s Discussion and Analysis of FinancialCondition and Results of Operations — Liquidity and Capital Resources — Overview.”
2013 Compared to 2012
Latin America unit sales in 2013 decreased 0.2 million units, or 0.9%, to 17.9 million units. Replacement tirevolume increased 0.6 million units, or 4.9%, due primarily to increased industry volumes. Replacement tirevolume in 2012 included 0.4 million units from our bias truck tire business in certain countries, which was soldin May 2012. OE tire volume decreased 0.8 million units, or 11.8%, reflecting our selective fitment strategy inthe consumer OE business.
Net sales in 2013 were $2,063 million, decreasing $22 million, or 1.1%, from $2,085 million in 2012. Net salesdecreased primarily due to unfavorable foreign currency translation of $270 million, mainly in Brazil andVenezuela, $60 million related to the sale of the bias truck tire business in certain countries in May 2012, andlower tire volume of $9 million. These decreases were partially offset by improved price and product mix of$284 million, including a favorable shift from OE to replacement products, and higher sales in other tire-relatedbusinesses of $33 million.
Operating income in 2013 was $283 million, increasing $60 million, or 26.9%, from $223 million in 2012.Operating income increased due primarily to improved price and product mix of $224 million and lower rawmaterial costs of $36 million. These increases were partially offset by higher conversion costs of $104 million,higher SAG expenses of $48 million, unfavorable foreign currency translation of $42 million and lower tirevolume of $2 million. Conversion costs were negatively impacted by overall inflation, including wages andbenefits, partially offset by lower under-absorbed fixed overhead costs of $9 million due to higher productionvolume. The increase in SAG expenses is due primarily to overall inflation, including wages and benefits andwarehousing costs. Additionally, we increased advertising and marketing activities to support new productintroductions in 2013. SAG expenses included savings from rationalization plans of $13 million.
In 2013, on a consolidated basis, we recorded a net benefit of $15 million ($10 million after-tax), which included$5 million in Latin America’s segment operating income, earned on favorable tax judgments that are beingutilized against ongoing indirect tax liabilities.
Operating income in 2013 excluded net rationalization charges of $4 million and net gains on asset sales of $1million. In addition, a first quarter 2013 foreign currency exchange loss of $115 million related to the devaluationof the Venezuelan bolivar fuerte is excluded from Latin America and total company segment operating income in2013. Operating income in 2012 excluded net rationalization charges of $6 million and net gains on asset sales of$4 million.
Asia Pacific
Year Ended December 31,
(In millions) 2014 2013 2012
Tire Units . . . . . . . . . . . . . . . . . . . . . . . . . . . . . . . . . . . . . . . . . . . . . . . . . 23.0 21.9 20.6
Net Sales . . . . . . . . . . . . . . . . . . . . . . . . . . . . . . . . . . . . . . . . . . . . . . . . . . $2,077 $2,226 $2,357
Operating Income . . . . . . . . . . . . . . . . . . . . . . . . . . . . . . . . . . . . . . . . . . . 301 308 259
Operating Margin . . . . . . . . . . . . . . . . . . . . . . . . . . . . . . . . . . . . . . . . . . . 14.5% 13.8% 11.0%
19
2014 Compared to 2013
Asia Pacific unit sales in 2014 increased 1.1 million units, or 5.0%, to 23.0 million units. OE tire volumeincreased 0.8 million units, or 8.0%, and replacement tire volume increased 0.3 million units, or 2.8%. Theincrease in unit volume was primarily due to growth in China and India, partially offset by a decline in Australiaas a result of a continued weak economic environment.
Net sales in 2014 were $2,077 million, decreasing $149 million, or 6.7%, from $2,226 million in 2013. Net salesdecreased due to lower price and product mix of $157 million, driven primarily by the impact of lower rawmaterial costs on pricing and unfavorable product mix due to lower OTR sales, unfavorable foreign currencytranslation of $73 million, primarily driven by the depreciation of the Australian dollar and Indian rupee, andlower sales in other tire-related businesses of $13 million, primarily in our retail operations. These decreaseswere partially offset by higher volumes of $95 million.
Operating income in 2014 was $301 million, decreasing $7 million, or 2.3%, from $308 million in 2013.Operating income decreased due primarily to lower price and product mix of $107 million, driven primarily bythe impact of lower raw material costs on pricing and unfavorable product mix due to lower OTR sales. Lowerprice and product mix was partially offset by the effect of lower raw material costs of $90 million. Operatingincome was also negatively impacted by unfavorable foreign currency translation of $17 million, lower insurancerecoveries of $7 million related to the fourth quarter 2011 Thailand flood and higher conversion costs of $7million. The decreases were partially offset by lower start-up expenses for our manufacturing facility inPulandian, China of $23 million and higher volume of $23 million. CGS included savings from rationalizationplans of $1 million.
In 2013, on a consolidated basis, we recorded a $9 million net benefit ($6 million after-tax), which included $7million in Asia Pacific, due to insurance recoveries for the fourth quarter 2011 flood in Thailand.
Operating income in 2014 and 2013 excluded net rationalization charges of $9 million and $16 million,respectively, primarily in Australia. Operating income in 2013 also excluded net gains on asset sales of $2million.
Asia Pacific’s results are highly dependent upon Australia, which accounted for approximately 36% and 40% ofAsia Pacific’s net sales in 2014 and 2013, respectively. Accordingly, results of operations in Australia areexpected to continue to have a significant impact on Asia Pacific’s future performance.
2013 Compared to 2012
Asia Pacific unit sales in 2013 increased 1.3 million units, or 6.3%, to 21.9 million units. Replacement tirevolume increased 0.7 million units, or 6.2%, and OE tire volume increased 0.6 million units, or 6.4%. Theincrease in unit volume throughout much of the region, including recovery from the Thailand flooding whichnegatively impacted 2012 volume, was partially offset by declines in consumer volume in Australia as a result ofa continued weak economic environment.
Net sales in 2013 were $2,226 million, decreasing $131 million, or 5.6%, from $2,357 million in 2012. Net salesdecreased due to unfavorable price and product mix of $109 million, driven primarily by the impact of lower rawmaterial costs on pricing, unfavorable foreign currency translation of $102 million, primarily driven by thedepreciation of the Australian dollar and Indian rupee, and lower sales in other tire-related businesses of $46million, primarily in our retail operations. These decreases were partially offset by higher volume of $126million.
Operating income in 2013 was $308 million, increasing $49 million, or 18.9%, from $259 million in 2012.Operating income increased due primarily to lower raw material costs of $144 million, which more than offsetthe effect of lower price and product mix of $82 million, lower start-up expenses related to our newmanufacturing facility in China of $39 million and higher volume of $26 million. These increases were partiallyoffset by unfavorable foreign currency translation of $27 million, higher conversion costs of $15 million, higherSAG expenses of $10 million, due primarily to increased incentive compensation costs, primarily driven by
20
improved operating performance, costs to support sales growth in China, lower income from other tire-relatedbusinesses of $8 million, primarily in our retail operations, and higher indirect tax surcharges of $6 million. SAGexpenses included savings from rationalization plans of $4 million.
In 2013, on a consolidated basis, we recorded a $9 million net benefit ($6 million after-tax), which included $7million in Asia Pacific, due to insurance recoveries for the fourth quarter 2011 flood in Thailand. In 2012, on aconsolidated basis, we recorded an $18 million net benefit ($15 million after-tax), which included $9 million inAsia Pacific, due to insurance recoveries exceeding incurred expenses and lost profits on sales.
Operating income in 2013 excluded net rationalization charges of $16 million, primarily in Australia, and netgains on asset sales of $2 million. Operating income in 2012 excluded net rationalization charges of $26 millionand charges for accelerated depreciation and asset write-offs of $19 million, which primarily related to theclosure of our Dalian, China manufacturing facility, and net gains on asset sales of $1 million.
CRITICAL ACCOUNTING POLICIES
The preparation of financial statements in conformity with generally accepted accounting principles requiresmanagement to make estimates and assumptions that affect the amounts reported in the consolidated financialstatements and related notes to the financial statements. On an ongoing basis, management reviews its estimates,based on currently available information. Changes in facts and circumstances may alter such estimates and affectour results of operations and financial position in future periods. Our critical accounting policies relate to:
• general and product liability and other litigation,
• workers’ compensation,
• recoverability of goodwill,
• deferred tax asset valuation allowances and uncertain income tax positions, and
• pensions and other postretirement benefits.
General and Product Liability and Other Litigation. We have recorded liabilities totaling $324 million,including related legal fees expected to be incurred, for potential product liability and other tort claims, includingasbestos claims, at December 31, 2014. General and product liability and other litigation liabilities are recordedbased on management’s assessment that a loss arising from these matters is probable. If the loss can bereasonably estimated, we record the amount of the estimated loss. If the loss is estimated within a range and nopoint within the range is more probable than another, we record the minimum amount in the range. As additionalinformation becomes available, any potential liability related to these matters is assessed and the estimates arerevised, if necessary. Loss ranges are based upon the specific facts of each claim or class of claims and aredetermined after review by counsel. Court rulings on our cases or similar cases may impact our assessment of theprobability and our estimate of the loss, which may have an impact on our reported results of operations,financial position and liquidity. We record receivables for insurance recoveries related to our litigation claimswhen it is probable that we will receive reimbursement from the insurer. Specifically, we are a defendant innumerous lawsuits alleging various asbestos-related personal injuries purported to result from alleged exposureto asbestos in certain products manufactured by us or present in certain of our facilities. Typically, these lawsuitshave been brought against multiple defendants in Federal and state courts.
A significant assumption in our estimated asbestos liability is the period over which the liability can bereasonably estimated. Due to the difficulties in making these estimates, analysis based on new data and/orchanged circumstances arising in the future may result in an increase in the recorded obligation in an amount thatcannot be reasonably estimated, and that increase may be significant. We had recorded gross liabilities for bothasserted and unasserted asbestos claims, inclusive of defense costs, totaling $151 million at December 31, 2014.The portion of the liability associated with unasserted asbestos claims and related defense costs was $84 million.
We maintain primary insurance coverage under coverage-in-place agreements, and also have excess liabilityinsurance with respect to asbestos liabilities. We record a receivable with respect to such policies when we
21

determine that recovery is probable and we can reasonably estimate the amount of a particular recovery. Thisdetermination is based on consultation with our outside legal counsel and taking into consideration agreementswith certain of our insurance carriers, the financial viability and legal obligations of our insurance carriers andother relevant factors.
As of December 31, 2014, we recorded a receivable related to asbestos claims of $71 million, and we expect thatapproximately 50% of asbestos claim related losses would be recoverable through insurance through the periodcovered by the estimated liability. Of this amount, $13 million was included in Current Assets as part ofAccounts Receivable at December 31, 2014. The recorded receivable consists of an amount we expect to collectunder coverage-in-place agreements with certain primary carriers as well as an amount we believe is probable ofrecovery from certain of our excess coverage insurance carriers. Although we believe these amounts arecollectible under primary and certain excess policies today, future disputes with insurers could result insignificant charges to operations.
Workers’ Compensation. We had recorded liabilities, on a discounted basis, of $306 million for anticipatedcosts related to U.S. workers’ compensation claims at December 31, 2014. The costs include an estimate ofexpected settlements on pending claims, defense costs and a provision for claims incurred but not reported. Theseestimates are based on our assessment of potential liability using an analysis of available information withrespect to pending claims, historical experience and current cost trends. The amount of our ultimate liability inrespect of these matters may differ from these estimates. We periodically, and at least annually, update our lossdevelopment factors based on actuarial analyses. The liability is discounted using the risk-free rate of return.
For further information on general and product liability and other litigation, and workers’ compensation, refer toNote 18, Commitments and Contingent Liabilities.
Recoverability of Goodwill. Goodwill is tested for impairment annually or more frequently if an indicator ofimpairment is present. Goodwill totaled $601 million at December 31, 2014.
We have determined our reporting units to be consistent with our operating segments comprised of four strategicbusiness units: North America, Europe, Middle East and Africa, Latin America and Asia Pacific. Goodwill isallocated to these reporting units based on the original purchase price allocation for acquisitions within thevarious reporting units. No goodwill has been allocated to our Latin America reporting unit. There have been nochanges to our reporting units or in the manner in which goodwill was allocated in 2014.
We test goodwill for impairment on at least an annual basis, with the option to perform a qualitative assessmentto determine whether further impairment testing is necessary or to perform a quantitative assessment bycomparing the fair value of a reporting unit to its carrying amount, including goodwill. Under the qualitativeassessment, an entity is not required to calculate the fair value of a reporting unit unless the entity determines thatit is more likely than not that its fair value is less than its carrying amount. If under the quantitative assessmentthe fair value of a reporting unit is less than its carrying amount, then the amount of the impairment loss, if any,must be measured.
At October 31, 2014, after considering changes to assumptions used in our most recent quantitative annualtesting for each reporting unit, including the capital markets environment, economic conditions, tire industrycompetition and trends, changes in our results of operations, the magnitude of the excess of fair value over thecarrying amount of each reporting unit as determined in our most recent quantitative annual testing, and otherfactors, we concluded that it was more likely than not that the fair value of our North America, EMEA and AsiaPacific reporting units was not less than its respective carrying value and, therefore, did not perform aquantitative analysis.
Deferred Tax Asset Valuation Allowances and Uncertain Income Tax Positions. At December 31, 2014, we hadvaluation allowances aggregating to $632 million against certain of our U.S. state and local and foreign netdeferred tax assets.
U.S. GAAP standards of accounting for income taxes require a reduction of the carrying amounts of deferred taxassets by recording a valuation allowance if, based on the available evidence, it is more likely than not (defined
22
as a likelihood of more than 50%) such assets will not be realized. The valuation of deferred tax assets requiresjudgment in assessing future profitability and the tax consequences of events that have been recognized in eitherour financial statements or tax returns.
We consider both positive and negative evidence when measuring the need for a valuation allowance. The weightgiven to the evidence is commensurate with the extent to which it may be objectively verified. Current andcumulative financial reporting results are a source of objectively verified evidence. We give operating resultsduring the most recent three-year period a significant weight in our analysis. We typically only consider forecastsof future profitability when positive cumulative operating results exist in the most recent three year period. Withrespect to our analysis of whether our U.S. deferred tax assets will be realized, we now consider our forecasts ofprofitable U.S. operations. We perform scheduling exercises to determine if sufficient taxable income of theappropriate character exists in the periods required in order to realize our deferred tax assets with limited lives(tax loss carryforwards and tax credits) prior to their expiration. We consider tax planning strategies available toaccelerate taxable amounts if required to utilize expiring deferred tax assets. A valuation allowance is notrequired to the extent that in our judgment positive evidence exists with a magnitude and duration sufficient toresult in a conclusion that it is more likely than not that our deferred tax assets will be realized.
At December 31, 2014, our U.S. operations were in a position of cumulative profits for the most recent three-yearperiod. We concluded that sufficient taxable income of the appropriate character will exist in order to realize ourdeferred tax assets. This conclusion is supported by our full year profitability in 2013 and 2014, and our businessplan for 2015 and beyond showing continued profitability. As of December 31, 2014, we have recorded a net taxbenefit of $2,179 million from the release of substantially all of the valuation allowance on our net U.S. deferredtax assets. The tax benefit for 2014 also includes a charge of $131 million to establish a provision for potentialU.S. Federal taxation of certain undistributed earnings of certain foreign subsidiaries that previously we did notintend to subject to U.S. taxation. This charge was made to account for strategies which may be implemented, ifnecessary, to utilize our otherwise expiring U.S. deferred tax assets.
The calculation of our tax liabilities involves dealing with uncertainties in the application of complex taxregulations, including those for transfer pricing. We recognize liabilities for anticipated tax audit issues based onour estimate of whether, and the extent to which, additional taxes will be due. If we ultimately determine thatpayment of these amounts is unnecessary, we reverse the liability and recognize a tax benefit during the period inwhich we determine that the liability is no longer necessary. We also recognize income tax benefits to the extentthat it is more likely than not that our positions will be sustained when challenged by the taxing authorities. Wederecognize income tax benefits when based on new information we determine that it is no longer more likelythan not that our position will be sustained. To the extent we prevail in matters for which liabilities have beenestablished, or determine we need to derecognize tax benefits recorded in prior periods, our results of operationsand effective tax rate in a given period could be materially affected. An unfavorable tax settlement would requireuse of our cash, and lead to recognition of expense to the extent the settlement amount exceeds recordedliabilities, resulting in an increase in our effective tax rate in the period of resolution. To reduce our risk of anunfavorable transfer price settlement, the Company applies consistent transfer pricing policies and practicesglobally, supports pricing with economic studies and seeks advance pricing agreements and joint audits to theextent possible. A favorable tax settlement would be recognized as a reduction of expense to the extent thesettlement amount is lower than recorded liabilities and, in the case of an income tax settlement, would result in areduction in our effective tax rate in the period of resolution. We report interest and penalties related to uncertainincome tax positions as income taxes.
For additional information regarding uncertain income tax positions and valuation allowances, refer to Note 5,Income Taxes.
Pensions and Other Postretirement Benefits. We have recorded liabilities for pension and other postretirementbenefits of $714 million and $356 million, respectively, at December 31, 2014. Our recorded liabilities and netperiodic costs for pensions and other postretirement benefits are based on a number of assumptions, including:
• life expectancies,
• retirement rates,
23

• discount rates,
• long term rates of return on plan assets,
• inflation rates,
• future compensation levels,
• future health care costs, and
• maximum company-covered benefit costs.
Certain of these assumptions are determined with the assistance of independent actuaries. Assumptions about lifeexpectancies, retirement rates, future compensation levels and future health care costs are based on pastexperience and anticipated future trends. The discount rate for our U.S. plans is based on a yield curve derivedfrom a portfolio of corporate bonds from issuers rated AA or higher as of December 31 and is reviewed annually.Our expected benefit payment cash flows are discounted based on spot rates developed from the yield curve. Themortality assumption for our U.S. plans is based on actual historical experience and an assumed long term rate offuture improvement, based on published actuarial tables. The long term rate of return on U.S. plan assets is basedon estimates of future long term rates of return similar to the target allocation of substantially all fixed incomesecurities. Actual U.S. pension fund asset allocations are reviewed on a monthly basis and the pension fund isrebalanced to target ranges on an as-needed basis. These assumptions are reviewed regularly and revised whenappropriate. Changes in one or more of them may affect the amount of our recorded liabilities and net periodiccosts for these benefits. Other assumptions involving demographic factors such as retirement age and turnoverare evaluated periodically and are updated to reflect our experience and expectations for the future. If the actualexperience differs from expectations, our financial position, results of operations and liquidity in future periodsmay be affected.
The weighted average discount rate used in estimating the total liability for our U.S. pension and otherpostretirement benefit plans was 3.89% and 3.59%, respectively, at December 31, 2014, compared to 4.51% and4.06%, respectively, at December 31, 2013. The decrease in the discount rate at December 31, 2014 was dueprimarily to lower yields on highly rated corporate bonds. Interest cost included in our U.S. net periodic pensioncost was $256 million in 2014, compared to $243 million in 2013 and $261 million in 2012. Interest costincluded in our worldwide net periodic other postretirement benefits cost was $19 million in 2014, compared to$19 million in 2013 and $24 million in 2012.
The following table presents the sensitivity of our U.S. projected pension benefit obligation, accumulated otherpostretirement benefits obligation, and annual expense to the indicated increase/decrease in key assumptions:
+ / - Change at December 31, 2014
(Dollars in millions) Change PBO/ABO Annual Expense
Pensions:Assumption:
Discount rate . . . . . . . . . . . . . . . . . . . . . . . . . . . . . . . . . . . . . +/- 0.5% $387 $ 4
Other Postretirement Benefits:Assumption:
Discount rate . . . . . . . . . . . . . . . . . . . . . . . . . . . . . . . . . . . . . +/- 0.5% $ 8 $—
Health care cost trends — total cost . . . . . . . . . . . . . . . . . . . +/- 1.0% 2 —
Changes in general interest rates and corporate (AA or better) credit spreads impact our discount rate and therebyour U.S. pension benefit obligation. Our U.S. pension plans are invested in a portfolio of substantially all fixedincome securities designed to offset the impact of future discount rate movements on liabilities for these plans. Ifcorporate (AA or better) interest rates increase or decrease in parallel (i.e., across all maturities), the investmentportfolio described above would mitigate a substantial portion of the expected change in our U.S. pension benefitobligation. For example, if corporate (AA or better) interest rates increased or decreased by 0.50%, the actionsdescribed above would mitigate more than 85% of the expected change in our U.S. pension benefit obligation.
24

A significant portion of the net actuarial loss included in AOCL of $2,985 million in our U.S. pension plans as ofDecember 31, 2014 is a result of declines in U.S. discount rates and plan asset losses that occurred prior to 2014,plus the continued impact of increases in estimated life expectancies. For purposes of determining our 2014U.S. net periodic pension cost, we recognized $114 million of the net actuarial loss in 2014. We will recognizeapproximately $110 million of net actuarial losses in 2015. If our future experience is consistent with ourassumptions as of December 31, 2014, actuarial loss recognition over the next few years will remain at anamount near that to be recognized in 2015 before it begins to gradually decline. In addition, if annual lump sumpayments from a pension plan exceed annual service and interest cost for that plan, accelerated recognition of netactuarial losses will be required through a settlement in total benefits cost.
At December 31, 2014, our U.S. pension life expectancy assumptions, which are based on actual historicalexperience, were updated to reflect future mortality improvements based on recently published actuarial tables,resulting in an increase of $285 million to our U.S. pension obligations.
The actual rate of return on our U.S. pension fund was 12.8%, 2.6% and 14.2% in 2014, 2013 and 2012,respectively, as compared to the expected rate of 5.47%, 7.16% and 8.50% in 2014, 2013 and 2012, respectively.We use the fair value of our pension assets in the calculation of pension expense for all of our U.S. pension plans.
We experienced a decrease in our U.S. discount rate at the end of 2014 and a large portion of the net actuarialloss included in AOCL of $99 million in our worldwide other postretirement benefit plans as of December 31,2014 is a result of the overall decline in U.S. discount rates over time. For purposes of determining 2014worldwide net periodic other postretirement benefits cost, we recognized $8 million of net actuarial losses in2014. We will recognize approximately $8 million of net actuarial losses in 2015. If our future experience isconsistent with our assumptions as of December 31, 2014, actuarial loss recognition over the next few years willremain at an amount near that to be recognized in 2015 before it begins to gradually decline.
The weighted average amortization period for our U.S. pension plans is approximately 21 years.
Net periodic pension costs are recorded in CGS, as part of the cost of inventory sold during the period, or SAG inour Consolidated Statements of Operations, based on the specific roles (i.e., manufacturing vs. non-manufacturing) of employee groups covered by each of our pension plans. In 2014, approximately 70% and 30%of net periodic pension costs are included in CGS and SAG, respectively, compared to approximately 80% and20%, respectively, in 2013 and 2012. The decrease in the net periodic pension costs in CGS is the result ofoverall lower net periodic pension costs in conjunction with the freezing of our hourly U.S. pension plans.
For further information on pensions and other postretirement benefits, refer to Note 16, Pension, OtherPostretirement Benefits and Savings Plans.
LIQUIDITY AND CAPITAL RESOURCES
OVERVIEW
Our primary sources of liquidity are cash generated from our operating and financing activities. Our cash flowsfrom operating activities are driven primarily by our operating results and changes in our working capitalrequirements and our cash flows from financing activities are dependent upon our ability to access credit or othercapital.
We have fully funded substantially all of our U.S. pension plans, thereby eliminating a significant legacy liabilityand effecting a significant improvement in our capital structure. The successful execution of our pension strategywill improve earnings and cash flows from operating activities and provide greater transparency to ourunderlying tire business.
In September 2013, we announced our 2014-2016 capital allocation plan, which we have periodically updated.Our capital allocation plan is intended to increase shareholder value by investing in high-return growth capitalprojects, providing for returns to shareholders and strengthening our balance sheet. The updated capital allocationplan provides for:
• Growth capital expenditures of approximately $1.15 billion, including a new plant to capture growth inthe Americas.
25
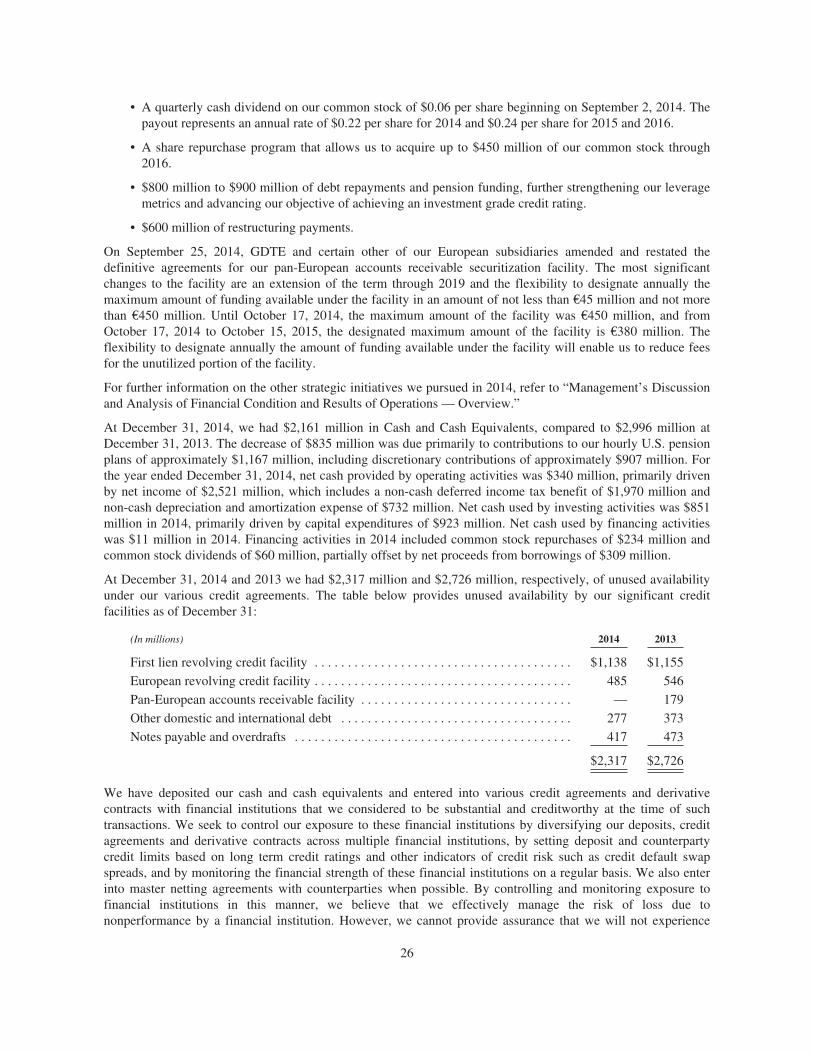
• A quarterly cash dividend on our common stock of $0.06 per share beginning on September 2, 2014. Thepayout represents an annual rate of $0.22 per share for 2014 and $0.24 per share for 2015 and 2016.
• A share repurchase program that allows us to acquire up to $450 million of our common stock through2016.
• $800 million to $900 million of debt repayments and pension funding, further strengthening our leveragemetrics and advancing our objective of achieving an investment grade credit rating.
• $600 million of restructuring payments.
On September 25, 2014, GDTE and certain other of our European subsidiaries amended and restated thedefinitive agreements for our pan-European accounts receivable securitization facility. The most significantchanges to the facility are an extension of the term through 2019 and the flexibility to designate annually themaximum amount of funding available under the facility in an amount of not less than €45 million and not morethan €450 million. Until October 17, 2014, the maximum amount of the facility was €450 million, and fromOctober 17, 2014 to October 15, 2015, the designated maximum amount of the facility is €380 million. Theflexibility to designate annually the amount of funding available under the facility will enable us to reduce feesfor the unutilized portion of the facility.
For further information on the other strategic initiatives we pursued in 2014, refer to “Management’s Discussionand Analysis of Financial Condition and Results of Operations — Overview.”
At December 31, 2014, we had $2,161 million in Cash and Cash Equivalents, compared to $2,996 million atDecember 31, 2013. The decrease of $835 million was due primarily to contributions to our hourly U.S. pensionplans of approximately $1,167 million, including discretionary contributions of approximately $907 million. Forthe year ended December 31, 2014, net cash provided by operating activities was $340 million, primarily drivenby net income of $2,521 million, which includes a non-cash deferred income tax benefit of $1,970 million andnon-cash depreciation and amortization expense of $732 million. Net cash used by investing activities was $851million in 2014, primarily driven by capital expenditures of $923 million. Net cash used by financing activitieswas $11 million in 2014. Financing activities in 2014 included common stock repurchases of $234 million andcommon stock dividends of $60 million, partially offset by net proceeds from borrowings of $309 million.
At December 31, 2014 and 2013 we had $2,317 million and $2,726 million, respectively, of unused availabilityunder our various credit agreements. The table below provides unused availability by our significant creditfacilities as of December 31:
(In millions) 2014 2013
First lien revolving credit facility . . . . . . . . . . . . . . . . . . . . . . . . . . . . . . . . . . . . . . . $1,138 $1,155
European revolving credit facility . . . . . . . . . . . . . . . . . . . . . . . . . . . . . . . . . . . . . . . 485 546
Pan-European accounts receivable facility . . . . . . . . . . . . . . . . . . . . . . . . . . . . . . . . — 179
Other domestic and international debt . . . . . . . . . . . . . . . . . . . . . . . . . . . . . . . . . . . 277 373
Notes payable and overdrafts . . . . . . . . . . . . . . . . . . . . . . . . . . . . . . . . . . . . . . . . . . 417 473
$2,317 $2,726
We have deposited our cash and cash equivalents and entered into various credit agreements and derivativecontracts with financial institutions that we considered to be substantial and creditworthy at the time of suchtransactions. We seek to control our exposure to these financial institutions by diversifying our deposits, creditagreements and derivative contracts across multiple financial institutions, by setting deposit and counterpartycredit limits based on long term credit ratings and other indicators of credit risk such as credit default swapspreads, and by monitoring the financial strength of these financial institutions on a regular basis. We also enterinto master netting agreements with counterparties when possible. By controlling and monitoring exposure tofinancial institutions in this manner, we believe that we effectively manage the risk of loss due tononperformance by a financial institution. However, we cannot provide assurance that we will not experience
26

losses or delays in accessing our deposits or lines of credit due to the nonperformance of a financial institution.Our inability to access our cash deposits or make draws on our lines of credit, or the inability of a counterparty tofulfill its contractual obligations to us, could have a material adverse effect on our liquidity, financial conditionor results of operations in the period in which it occurs.
We expect our 2015 cash flow needs to include capital expenditures of approximately $1.1 billion. We alsoexpect interest expense to range between $415 million and $440 million, dividends on our common stock to be$65 million, and contributions to our funded non-U.S. pension plans to be approximately $50 million to $75million. We do not expect working capital to be a significant source or use of cash in 2015. We intend to operatethe business in a way that allows us to address these needs with our existing cash and available credit if theycannot be funded by cash generated from operations.
Our ability to service debt and operational requirements is also dependent, in part, on the ability of oursubsidiaries to make distributions of cash to various other entities in our consolidated group, whether in the formof dividends, loans or otherwise. In certain countries where we operate, such as China, Venezuela, South Africaand Argentina, transfers of funds into or out of such countries by way of dividends, loans, advances or paymentsto third-party or affiliated suppliers are generally or periodically subject to certain requirements, such asobtaining approval from the foreign government and/or currency exchange board before net assets can betransferred out of the country. In addition, certain of our credit agreements and other debt instruments limit theability of foreign subsidiaries to make distributions of cash. Thus, we would have to repay and/or amend thesecredit agreements and other debt instruments in order to use this cash to service our consolidated debt. Becauseof the inherent uncertainty of satisfactorily meeting these requirements or limitations, we do not consider the netassets of our subsidiaries, including our Chinese, Venezuelan, South African and Argentinian subsidiaries, thatare subject to such requirements or limitations to be integral to our liquidity or our ability to service our debt andoperational requirements. At December 31, 2014, approximately $611 million of net assets, including $494million of cash and cash equivalents, were subject to such requirements, including $289 million of cash inVenezuela. The requirements we must comply with to transfer funds out of China, South Africa and Argentinahave not adversely impacted our ability to make transfers out of those countries.
Our Venezuelan subsidiary, C.A. Goodyear de Venezuela (“Goodyear Venezuela”), manufactures, markets anddistributes consumer and commercial tires throughout Venezuela. A substantial portion of the raw materials usedin the production of the tires it manufactures, including natural and synthetic rubber, are imported from otherGoodyear facilities and from third parties. Certain finished tires are also imported from other Goodyearmanufacturing facilities. In addition, Goodyear Venezuela is a party to various service and licensing agreementswith other Goodyear companies.
Since Venezuela’s economy is considered to be highly inflationary under U.S. generally accepted accountingprinciples, the U.S. dollar is the functional currency of Goodyear Venezuela. All gains and losses resulting fromthe remeasurement of its financial statements are reported in Other Expense. Effective February 13, 2013,Venezuela’s official exchange rate changed from 4.3 to 6.3 bolivares fuertes to the U.S. dollar for substantiallyall goods. As a result of the devaluation, we recorded a $115 million remeasurement loss on bolivar fuerte-denominated net monetary assets and liabilities, including deferred taxes, primarily related to cash deposits inVenezuela, in the first quarter of 2013.
Through December 31, 2013, substantially all of our transactions were subject to the approval of the Commissionfor the Administration of Currency Exchange (“CADIVI”). In January 2014, the Venezuelan governmentannounced the formation of the National Center of Foreign Trade (“CENCOEX”) to replace CADIVI. Inaddition, effective January 24, 2014, Venezuela’s exchange rate applicable to the settlement of certaintransactions, including payments of dividends and royalties, changed to an auction-based floating rate, theComplementary System of Foreign Currency Administration (“SICAD I”) rate, which was 11.4 and 12.0bolivares fuertes to the U.S. dollar at January 24, 2014 and December 31, 2014, respectively. Effective March 24,2014, the Venezuelan government implemented a third currency exchange rate, SICAD II. The SICAD II rate isalso an auction-based floating rate and was approximately 50 bolivares fuertes to the U.S. dollar at December 31,2014. Effective September 9, 2014, the official exchange rate for settling purchases of certain finished goodschanged from 6.3 bolivares fuertes to the U.S. dollar to the SICAD I rate.
27

During 2014, the official exchange rate for settling certain transactions, including imports of essential goods,such as certain raw materials needed for the production of tires, remained at 6.3 bolivares fuertes to the U.S.dollar, and in 2014 we continued to obtain approval for the import of raw materials at the official exchange rateof 6.3 bolivares fuertes to the U.S. dollar.
We are required to remeasure our bolivar-denominated monetary assets and liabilities at the rate expected to beavailable for future dividend remittances by Goodyear Venezuela. We expect that future remittances of dividendsby Goodyear Venezuela would be transacted at the SICAD I rate and, therefore, we recorded a first quarter netremeasurement loss of $157 million on bolivar fuerte-denominated net monetary assets and liabilities, includingdeferred taxes, primarily related to cash deposits in Venezuela, using the SICAD I rate of 11.4 bolivares fuertesto the U.S. dollar as of January 24, 2014. In the third quarter of 2014, we reduced by $7 million previouslyrecorded foreign currency exchange losses on our Venezuelan deferred tax assets in conjunction withestablishing a valuation allowance on those deferred tax assets. We also recorded a subsidy receivable of $50million at January 24, 2014 related to certain U.S. dollar-denominated payables for goods that were expected tobe settled at the official exchange rate of 6.3 bolivares fuertes to the U.S. dollar, based on ongoing approvals forthe importation of such goods. In the third quarter of 2014, we derecognized $5 million of the subsidy receivabledue to the change in the official exchange rate for purchases of certain finished goods from 6.3 bolivares fuertesto the U.S. dollar to the SICAD I rate. In the fourth quarter of 2014, we entered into an agreement with theVenezuelan government to settle $85 million of U.S. dollar-denominated payables at the SICAD I rate that wepreviously had expected to be settled at the official exchange rate for imports of essential goods of 6.3 bolivaresfuertes to the U.S. dollar, and, accordingly, derecognized the remaining subsidy receivable of $45 million. Goingforward, subsidies expected to be received from the government related to certain U.S. dollar-denominatedpayables to be settled at the official exchange rate for imports of essential goods of 6.3 bolivares fuertes to theU.S. dollar will only be recognized in CGS upon receipt.
During 2014, Goodyear Venezuela settled $36 million of U.S. dollar-denominated intercompany payablesthrough CADIVI/CENCOEX at the official exchange rate of 6.3 bolivares fuertes to the U.S. dollar. In 2014, weparticipated in the SICAD I auction and were approved for approximately $21 million of remittances and settled$10 million in transactions at the then-current SICAD I rate, primarily for finished goods. In 2014, we alsoentered into the agreement with the Venezuelan government described above, and have received payments of $7million of the $85 million agreed upon under that agreement. If in the future we convert bolivares fuertes at a rateother than the December 31, 2014 SICAD I rate of 12.0 bolivares fuertes to the U.S. dollar, or the officialexchange rate is revised, we may realize additional losses that would be recorded in the Statements ofOperations.
At December 31, 2014, settlements pending before CADIVI/CENCOEX were approximately $146 million, ofwhich approximately $124 million are expected to be settled at the SICAD I rate and approximately $22 millionare expected to be settled at 6.3 bolivares fuertes to the U.S. dollar. At December 31, 2014, $10 million of ourrequested settlements were pending up to 180 days, $7 million were pending from 180 to 360 days and $129million were pending over one year. Amounts pending up to 180 days include imported tires and raw materials of$10 million, amounts pending from 180 to 360 days include imported tires and raw materials of $7 million, andamounts pending over one year include imported tires and raw materials of $77 million, dividends payable of $21million, and intercompany charges of $17 million, including royalties of $6 million. Currency exchange controlsin Venezuela continue to limit our ability to remit funds from Venezuela, and this situation has deteriorated overtime.
At December 31, 2014, we had bolivar fuerte-denominated monetary assets of $300 million, which consistedprimarily of $289 million of cash and $5 million of accounts receivable, and bolivar fuerte-denominatedmonetary liabilities of $143 million, which consisted primarily of $60 million of intercompany payables,including $21 million of dividends, $40 million of long term benefits, $22 million of accounts payable — tradeand $13 million of compensation and benefits. At December 31, 2013, we had bolivar fuerte-denominatedmonetary assets of $496 million, which consisted primarily of $443 million of cash, $18 million of deferred taxassets and $17 million of accounts receivable, and bolivar fuerte-denominated monetary liabilities of $180million, which consisted primarily of $96 million of intercompany payables, including $41 million of dividends,
28

$25 million of accounts payable — trade, $24 million of long term benefits and $20 million of short termcompensation and benefits. All monetary assets and liabilities were remeasured at 12.0 and 6.3 bolivares fuertesto the U.S. dollar at December 31, 2014 and December 31, 2013, respectively.
Goodyear Venezuela’s sales were 1.6% and 2.2% of our net sales for the years ended December 31, 2014 and2013, respectively. Goodyear Venezuela’s CGS were 1.5% and 1.7% of our CGS for the years endedDecember 31, 2014 and 2013, respectively. Goodyear Venezuela’s operating income for the year endedDecember 31, 2014 declined by $48 million compared to the year ended December 31, 2013. GoodyearVenezuela’s sales are bolivar fuerte-denominated, its CGS and SAG are both approximately 70% bolivar fuerte-denominated and approximately 30% U.S. dollar-denominated. A further 10% decrease in the SICAD I rate to13.2 bolivares fuertes to the U.S. dollar would decrease Goodyear Venezuela’s operating income byapproximately $10 million on an annual basis, before any potential offsetting actions. This sensitivity assumesthe official rate for settling imports of essential goods, including certain raw materials needed for the productionof tires, remains unchanged.
In early 2015, the Venezuelan government announced certain changes to its currency exchange system, includingthe merging of the SICAD I and SICAD II auction system. In addition, a new currency exchange system, forwhich the exchange rate has been indicated to be based on market rates, opened on February 12, 2015 atapproximately 170 bolivares fuertes to the U.S. dollar. To-date, the government has published little informationrelated to these changes and, accordingly, we are not able to determine the applicability to our business,including whether such changes will result in a remeasurement loss or have any effect on our future results ofoperations, financial position or liquidity. If we remeasured our bolivar fuerte-denominated monetary assets andliabilities at the rate of approximately 170 bolivares fuertes to the U.S. dollar at December 31, 2014, we wouldhave recorded an additional remeasurement loss of approximately $200 million.
Goodyear Venezuela contributed a significant portion of Latin America’s sales and operating income in 2014.The continuing economic and political uncertainty, which has recently increased due to a significant decline inthe price of oil, which is the country’s primary export and source of U.S. dollars; difficulties importing rawmaterials and finished goods; changing foreign currency exchange rates; and government price and profit margincontrols in Venezuela may also adversely impact Latin America’s operating income in future periods. Inresponse to conditions in Venezuela, we continuously evaluate the prices for our products while remainingcompetitive and have taken steps to address our operational challenges, including securing necessary approvalsfor import licenses and increasing the local production of certain tires. Our pricing policies take into accountfactors such as fluctuations in raw material and other production costs, market demand and adherence togovernment price and profit margin controls. We will also manage our operations in Venezuela to limit our netinvestment and working capital exposure through adjustments to our production volumes, which could also resultin further earnings volatility. Specifically, continued inability to exchange bolivares fuertes to U.S. dollars to paythird-party suppliers and Goodyear affiliates for importation of basic raw materials may result in curtailment orcessation of production. In such cases, our ability to mitigate the negative impact of lower production may belimited based on government controls over reductions in staffing. These and other restrictions could limit ourability to benefit from our investment and maintain a controlling interest in Goodyear Venezuela. To the extentwe determine deconsolidation of Goodyear Venezuela to be appropriate due to a further degradation in ourability to make operating decisions in a future period, we would expect to recognize a one-time, pre-tax charge ofover $500 million and derecognize cash and cash equivalents of $290 million from our consolidated financialstatements (both reflecting December 31, 2014 balances and foreign currency exchange rates) and present ourinvestment in Goodyear Venezuela under the cost method of accounting thereafter. We will continue to reassessthe appropriateness of consolidating Goodyear Venezuela on a quarterly basis. We will also continue to assessthe information relative to available Venezuelan exchange rates and the impact on our financial position, resultsof operations and liquidity.
We believe that our liquidity position is adequate to fund our operating and investing needs and debt maturities in2015 and to provide us with flexibility to respond to further changes in the business environment.
29

Cash Position
At December 31, 2014, significant concentrations of cash and cash equivalents held by our internationalsubsidiaries included the following amounts:
• $517 million or 24% in Europe, Middle East and Africa, primarily Belgium ($696 million or 23% atDecember 31, 2013),
• $462 million or 21% in Asia, primarily China, India and Australia ($334 million or 11%), and
• $409 million or 19% in Latin America, primarily Venezuela and Brazil ($603 million or 20%).
Operating Activities
Net cash provided by operating activities was $340 million in 2014, compared to $938 million in 2013 and$1,038 million in 2012. The decrease in cash provided by operating activities in 2014 versus 2013 was primarilydue to working capital being neither a source nor use of cash in 2014, versus a source of cash of $415 million in2013, and higher pension contributions of $176 million. Pension contributions in both 2014 and 2013 wereprimarily due to discretionary contributions of $907 million and $834 million, respectively, to fully fund our U.S.pension plans.
Operating cash flows in 2013 as compared to 2012 were favorably impacted by increased earnings of $438million, despite a 2013 charge of $115 million for the devaluation of the Venezuelan bolivar fuerte. This increasein operating cash flows was partially offset by higher pension contributions of $478 million. Working capitalprovided a source of cash in 2013 and 2012 of $415 million and $457 million, respectively. The improvement inworking capital in 2013 was due primarily to lower inventory levels and lower raw materials costs. Theimprovement in working capital in 2012 was due primarily to reduced sales and production volumes and lowerraw materials costs.
Investing Activities
Net cash used in investing activities was $851 million in 2014, compared to $1,136 million in 2013 and $1,123million in 2012. Capital expenditures were $923 million in 2014, compared to $1,168 million in 2013 and $1,127million in 2012. Beyond expenditures required to sustain our facilities, capital expenditures in 2014 primarilyrelated to the modernization and expansion of manufacturing capacity in the United States, Brazil, Germany andChina. Capital expenditures in 2013 primarily related to expansion of manufacturing capacity in Japan, Braziland Chile and in 2012 primarily related to the expansion of manufacturing capacity in China and Chile. Proceedsfrom asset sales were $18 million in 2014, compared to $25 million in 2013 and $16 million in 2012.
Financing Activities
Net cash used by financing activities was $11 million in 2014, compared to net cash provided of $1,082 millionin 2013 and net cash used of $426 million in 2012. Financing activities in 2014 included net borrowings of $309million used to fund working capital needs and capital expenditures. In 2014, we paid dividends on our commonstock of $60 million and repurchased $234 million of our common stock, including $233 million of repurchasespursuant to our publicly announced share repurchase program. Financing activities in 2013 included netborrowings of $1,143 million used to fully fund our frozen U.S. pension plans and to fund working capital needsand capital expenditures. Financing activities in 2012 included net debt repayments of $265 million.
Credit Sources
In aggregate, we had total credit arrangements of $9,029 million available at December 31, 2014, of which$2,317 million were unused, compared to $9,293 million available at December 31, 2013, of which $2,726million were unused. At December 31, 2014, we had long term credit arrangements totaling $8,582 million, ofwhich $1,900 million were unused, compared to $8,806 million and $2,253 million, respectively, atDecember 31, 2013. At December 31, 2014, we had short term committed and uncommitted credit arrangements
30

totaling $447 million, of which $417 million were unused, compared to $487 million and $473 million,respectively, at December 31, 2013. The continued availability of the short term uncommitted arrangements is atthe discretion of the relevant lender and may be terminated at any time.
Outstanding Notes
At December 31, 2014, we had $3,318 million of outstanding notes, compared to $3,356 million at December 31,2013.
$2.0 Billion Amended and Restated First Lien Revolving Credit Facility due 2017
Our amended and restated $2.0 billion first lien revolving credit facility is available in the form of loans or lettersof credit, with letter of credit availability limited to $800 million. Loans under this facility bear interest at LIBORplus 150 basis points, based on our current liquidity. Availability under the facility is subject to a borrowing base,which is based on eligible accounts receivable and inventory of The Goodyear Tire & Rubber Company andcertain of its U.S. and Canadian subsidiaries. To the extent that our eligible accounts receivable and inventorydecline, our borrowing base will decrease and the availability under the facility may decrease below $2.0 billion.In addition, if the amount of outstanding borrowings and letters of credit under the facility exceeds the borrowingbase, we are required to prepay borrowings and/or cash collateralize letters of credit sufficient to eliminate theexcess. As of December 31, 2014, our borrowing base, and therefore our availability, under the facility was $485million below the facility’s stated amount of $2.0 billion.
At December 31, 2014, we had no borrowings and $377 million of letters of credit issued under the revolvingcredit facility. At December 31, 2013, we had no borrowings and $375 million of letters of credit issued underthe revolving credit facility.
$1.2 Billion Amended and Restated Second Lien Term Loan Facility due 2019
The term loan bears interest at LIBOR plus 375 basis points, subject to a minimum LIBOR rate of 100 basispoints. At December 31, 2014 and December 31, 2013, this facility was fully drawn. On February 3, 2015, werepaid $200 million of the borrowings due under this facility.
€400 Million Amended and Restated Senior Secured European Revolving Credit Facility due 2016
Our amended and restated €400 million revolving credit facility consists of a €100 million German tranche that isavailable only to Goodyear Dunlop Tires Germany GmbH (the “German borrower”) and a €300 million all-borrower tranche that is available to GDTE, the German borrower and certain of GDTE’s other subsidiaries. Upto €50 million in letters of credit are available for issuance under the all-borrower tranche. Amounts drawn underthe facility will bear interest at LIBOR plus 250 basis points for loans denominated in U.S. dollars or poundssterling and EURIBOR plus 250 basis points for loans denominated in euros.
At December 31, 2014 and 2013, there were no borrowings under the German and the all-borrower tranches.There were no letters of credit issued at December 31, 2014. Letters of credit issued under the all-borrowertranche totaled $5 million (€3 million) at December 31, 2013.
Each of our first lien revolving credit facility and our European revolving credit facility have customaryrepresentations and warranties including, as a condition to borrowing, that all such representations and warrantiesare true and correct, in all material respects, on the date of the borrowing, including representations as to nomaterial adverse change in our financial condition since December 31, 2011 under the first lien facility andDecember 31, 2010 under the European facility.
Accounts Receivable Securitization Facilities (On-Balance Sheet)
GDTE and certain of its subsidiaries are parties to a pan-European accounts receivable securitization facility thatprovides the flexibility to designate annually the maximum amount of funding available under the facility in anamount of not less than €45 million and not more than €450 million. Until October 15, 2015, the designatedmaximum amount of the facility is €380 million.
31

The facility involves an ongoing daily sale of substantially all of the trade accounts receivable of certain GDTEsubsidiaries. Utilization under the facility is based on eligible receivable balances.
The funding commitments under the facility will expire upon the earliest to occur of: (a) September 25, 2019,(b) the non-renewal and expiration (without substitution) of all of the back-up liquidity commitments, (c) theearly termination of the facility according to its terms (generally upon an Early Amortisation Event (as defined inthe facility), which includes, among other things, events similar to the events of default under our senior securedcredit facilities; certain tax law changes; or certain changes to law, regulation or accounting standards), or (d) ourrequest for early termination of the facility. The facility’s current back-up liquidity commitments will expire onOctober 15, 2015.
At December 31, 2014, the amounts available and utilized under this program totaled $343 million (€283million). At December 31, 2013, the amounts available and utilized under this program totaled $386 million(€280 million) and $207 million (€150 million), respectively. The program did not qualify for sale accounting,and accordingly, these amounts are included in Long Term Debt and Capital Leases.
In addition to the pan-European accounts receivable securitization facility discussed above, subsidiaries inAustralia have an accounts receivable securitization program that provides up to $70 million (85 millionAustralian dollars) of funding. At December 31, 2014, the amounts available and utilized under this programwere $43 million and $23 million, respectively. At December 31, 2013, the amounts available and utilized underthis program were $76 million and $18 million, respectively. The receivables sold under this program also serveas collateral for the related facility. We retain the risk of loss related to these receivables in the event of non-payment. These amounts are included in Long Term Debt and Capital Leases due Within One Year.
Accounts Receivable Factoring Facilities (Off-Balance Sheet)
Various subsidiaries sold certain of their trade receivables under off-balance sheet programs during 2014 and2013. For these programs, we have concluded that there is generally no risk of loss to us from non-payment ofthe sold receivables. At December 31, 2014 and 2013, the gross amount of receivables sold was $365 million and$301 million, respectively.
Supplier Financing
We have entered into payment processing agreements with several financial institutions. Under these agreements,the financial institution acts as our paying agent with respect to accounts payable due to our suppliers. Theseagreements also allow our suppliers to sell their receivables to the financial institutions at the sole discretion ofboth the supplier and the financial institution on terms that are negotiated between them. We are not alwaysnotified when our suppliers sell receivables under these programs. Our obligations to our suppliers, including theamounts due and scheduled payment dates, are not impacted by our suppliers’ decisions to sell their receivablesunder the program. Agreements for such supplier financing programs totaled approximately $420 million and$400 million at December 31, 2014 and December 31, 2013, respectively.
Further Information
For a further description of the terms of our outstanding notes, first lien revolving credit facility, second lien termloan facility, European revolving credit facility and pan-European accounts receivable securitization facility,please refer to Note 14, Financing Arrangements and Derivative Financial Instruments.
Covenant Compliance
Our first and second lien credit facilities and some of the indentures governing our notes contain certaincovenants that, among other things, limit our ability to incur additional debt or issue redeemable preferred stock,make certain restricted payments or investments, incur liens, sell assets, incur restrictions on the ability of oursubsidiaries to pay dividends to us, enter into affiliate transactions, engage in sale and leaseback transactions, andconsolidate, merge, sell or otherwise dispose of all or substantially all of our assets. These covenants are subject
32
to significant exceptions and qualifications. Our first and second lien credit facilities and the indenturesgoverning our notes also have customary defaults, including cross-defaults to material indebtedness of Goodyearand its subsidiaries.
We have additional financial covenants in our first and second lien credit facilities that are currently notapplicable. We only become subject to these financial covenants when certain events occur. These financialcovenants and related events are as follows:
• We become subject to the financial covenant contained in our first lien revolving credit facility when theaggregate amount of our Parent Company (The Goodyear Tire & Rubber Company) and guarantorsubsidiaries cash and cash equivalents (“Available Cash”) plus our availability under our first lienrevolving credit facility is less than $200 million. If this were to occur, our ratio of EBITDA toConsolidated Interest Expense may not be less than 2.0 to 1.0 for any period of four consecutive fiscalquarters. As of December 31, 2014, our availability under this facility of $1,138 million, plus ourAvailable Cash of $763 million, totaled $1,901 million, which is in excess of $200 million.
• We become subject to a covenant contained in our second lien credit facility upon certain asset sales. Thecovenant provides that, before we use cash proceeds from certain asset sales to repay any junior lien,senior unsecured or subordinated indebtedness, we must first offer to use such cash proceeds to prepayborrowings under the second lien credit facility unless our ratio of Consolidated Net Secured Indebtednessto EBITDA (Pro Forma Senior Secured Leverage Ratio) for any period of four consecutive fiscal quartersis equal to or less than 3.0 to 1.0.
In addition, our European revolving credit facility contains non-financial covenants similar to the non-financialcovenants in our first and second lien credit facilities that are described above and a financial covenant applicableonly to GDTE and its subsidiaries. This financial covenant provides that we are not permitted to allow GDTE’sratio of Consolidated Net J.V. Indebtedness to Consolidated European J.V. EBITDA for a period of fourconsecutive fiscal quarters to be greater than 3.0 to 1.0 at the end of any fiscal quarter. Consolidated Net J.V.Indebtedness is determined net of the sum of cash and cash equivalents in excess of $100 million held by GDTEand its subsidiaries, cash and cash equivalents in excess of $150 million held by the Parent Company and its U.S.subsidiaries and availability under our first lien revolving credit facility if the ratio of EBITDA to ConsolidatedInterest Expense described above is not applicable and the conditions to borrowing under the first lien revolvingcredit facility are met. Consolidated Net J.V. Indebtedness also excludes loans from other consolidated Goodyearentities. This financial covenant is also included in our pan-European accounts receivable securitization facility.At December 31, 2014, we were in compliance with this financial covenant.
Our credit facilities also state that we may only incur additional debt or make restricted payments that are nototherwise expressly permitted if, after giving effect to the debt incurrence or the restricted payment, our ratio ofEBITDA to Consolidated Interest Expense for the prior four fiscal quarters would exceed 2.0 to 1.0. Certain ofour senior note indentures have substantially similar limitations on incurring debt and making restrictedpayments. Our credit facilities and indentures also permit the incurrence of additional debt through otherprovisions in those agreements without regard to our ability to satisfy the ratio-based incurrence test describedabove. We believe that these other provisions provide us with sufficient flexibility to incur additional debtnecessary to meet our operating, investing and financing needs without regard to our ability to satisfy the ratio-based incurrence test.
There are no known future changes to, or new covenants in, any of our existing debt obligations other than asdescribed above. Covenants could change based upon a refinancing or amendment of an existing facility, oradditional covenants may be added in connection with the incurrence of new debt.
As of December 31, 2014, we were in compliance with the currently applicable material covenants imposed byour principal credit facilities and indentures.
The terms “Available Cash,” “EBITDA,” “Consolidated Interest Expense,” “Consolidated Net SecuredIndebtedness,” “Pro Forma Senior Secured Leverage Ratio,” “Consolidated Net J.V. Indebtedness” and“Consolidated European J.V. EBITDA” have the meanings given them in the respective credit facilities.
33

Potential Future Financings
In addition to our previous financing activities, we may seek to undertake additional financing actions whichcould include restructuring bank debt or capital markets transactions, possibly including the issuance ofadditional debt or equity. Given the challenges that we face and the uncertainties of the market conditions, accessto the capital markets cannot be assured.
Our future liquidity requirements may make it necessary for us to incur additional debt. However, a substantialportion of our assets are already subject to liens securing our indebtedness. As a result, we are limited in ourability to pledge our remaining assets as security for additional secured indebtedness. In addition, no assurancecan be given as to our ability to raise additional unsecured debt.
Dividends and Common Stock Repurchase Program
Under our primary credit facilities and some of our note indentures, we are permitted to pay dividends on andrepurchase our capital stock (which constitute restricted payments) as long as no default will have occurred andbe continuing, additional indebtedness can be incurred under the credit facilities or indentures following thepayment, and certain financial tests are satisfied.
During 2014, 2013 and 2012, we paid cash dividends of $15 million, $29 million and $29 million, respectively,on our mandatory convertible preferred stock. No further dividends will be paid on our preferred stock followingthe conversion of shares into common stock on April 1, 2014.
During 2014 and 2013, we paid cash dividends of $60 million and $12 million, respectively, on our commonstock. On January 14, 2015, the Company’s Board of Directors (or a duly authorized committee thereof) declaredcash dividends of $0.06 per share of our common stock, or approximately $16 million in the aggregate. The cashdividend will be paid on March 2, 2015 to stockholders of record as of the close of business of February 2, 2015.Future quarterly dividends are subject to Board approval.
On September 18, 2013, the Board of Directors authorized $100 million for use in our common stock repurchaseprogram. On May 27, 2014, the Board of Directors approved an increase in that authorization to $450 million.This program expires on December 31, 2016. We intend to repurchase shares of common stock in open markettransactions in order to offset new shares issued under equity compensation programs and to provide foradditional shareholder returns. During 2014, we repurchased 8,935,809 shares at an average price, includingcommissions, of $26.11 per share, or $233 million in the aggregate.
The restrictions imposed by our credit facilities and indentures did not affect our ability to pay the dividends onor repurchase our capital stock as described above, and are not expected to affect our ability to pay similardividends or make similar repurchases in the future.
Asset Dispositions
The restrictions on asset sales imposed by our material indebtedness have not affected our strategy of divestingnon-core businesses, and those divestitures have not affected our ability to comply with those restrictions.
34

COMMITMENTS AND CONTINGENT LIABILITIES
Contractual Obligations
The following table presents our contractual obligations and commitments to make future payments as ofDecember 31, 2014:
Payment Due by Period as of December 31, 2014
(In millions) Total 2015 2016 2017 2018 2019 Beyond 2019
Debt Obligations (1) . . . . . . . . . . . . . . . . . $ 6,335 $ 168 $ 446 $ 400 $ 183 $1,923 $3,215
Capital Lease Obligations (2) . . . . . . . . . . 59 10 8 7 5 2 27
Interest Payments (3) . . . . . . . . . . . . . . . . . 2,429 406 390 362 338 280 653
Operating Leases (4) . . . . . . . . . . . . . . . . . 1,266 307 233 178 128 98 322
Pension Benefits (5) . . . . . . . . . . . . . . . . . . 450 100 100 100 75 75 NA
Other Postretirement Benefits (6) . . . . . . . 252 30 27 26 26 25 118
Workers’ Compensation (7) . . . . . . . . . . . 393 71 45 34 26 21 196
Binding Commitments (8) . . . . . . . . . . . . . 4,669 1,740 846 696 692 622 73
Uncertain Income Tax Positions (9) . . . . . 40 20 15 — — — 5
$15,893 $2,852 $2,110 $1,803 $1,473 $3,046 $4,609
(1) Debt obligations include Notes Payable and Overdrafts.
(2) The minimum lease payments for capital lease obligations are $97 million.
(3) These amounts represent future interest payments related to our existing debt obligations and capital leasesbased on fixed and variable interest rates specified in the associated debt and lease agreements. The amountsprovided relate only to existing debt obligations and do not assume the refinancing or replacement of suchdebt.
(4) Operating lease obligations have not been reduced by minimum sublease rentals of $32 million, $24 million,$14 million, $7 million, $3 million and $9 million in each of the periods above, respectively, for a total of$89 million. Payments, net of minimum sublease rentals, total $1,177 million. The present value of the netoperating lease payments is $950 million. The operating leases relate to, among other things, real estate,vehicles, data processing equipment and miscellaneous other assets. No asset is leased from any relatedparty.
(5) The obligation related to pension benefits is actuarially determined and is reflective of obligations as ofDecember 31, 2014. Although subject to change, the amounts set forth in the table represent the midpoint ofthe range of our expected contributions for funded U.S. and non-U.S. pension plans, plus expected cashfunding of direct participant payments to our U.S. and non-U.S. pension plans.
We made significant contributions to fully fund our U.S. pension plans in 2013 and 2014. We have nominimum funding requirements for our funded U.S. pension plans under current ERISA law or the provisionsof our USW collective bargaining agreement, which requires us to maintain an annual ERISA funded statusfor the hourly U.S. pension plans of at least 97%.
Future U.S. pension contributions will be affected by our ability to offset changes in future interest rates withasset returns from our fixed income portfolio, and any changes to ERISA law. For further information on theU.S. pension investment strategy, refer to “Management’s Discussion and Analysis of Financial Conditionand Results of Operations — Overview — Pension and Benefits” and Note 16, Pension and OtherPostretirement Benefits.
Future non-U.S. contributions are affected by factors such as:
• future interest rate levels,
• the amount and timing of asset returns, and
35

• how contributions in excess of the minimum requirements could impact the amount and timing offuture contributions.
(6) The payments presented above are expected payments for the next 10 years. The payments for otherpostretirement benefits reflect the estimated benefit payments of the plans using the provisions currently ineffect. Under the relevant summary plan descriptions or plan documents we have the right to modify orterminate the plans. The obligation related to other postretirement benefits is actuarially determined on anannual basis. The estimated payments have been reduced to reflect the provisions of the MedicarePrescription Drug Improvement and Modernization Act of 2003.
(7) The payments for workers’ compensation obligations are based upon recent historical payment patterns onclaims. The present value of anticipated claims payments for workers’ compensation is $306 million.
(8) Binding commitments are for raw materials, capital expenditures, utilities, and various other types ofcontracts. The obligations to purchase raw materials include supply contracts at both fixed and variableprices. Those with variable prices are based on index rates for those commodities at December 31, 2014.
(9) These amounts primarily represent expected payments with interest for uncertain tax positions as ofDecember 31, 2014. We have reflected them in the period in which we believe they will be ultimately settledbased upon our experience with these matters.
Additional other long term liabilities include items such as general and product liabilities, environmentalliabilities and miscellaneous other long term liabilities. These other liabilities are not contractual obligations bynature. We cannot, with any degree of reliability, determine the years in which these liabilities might ultimatelybe settled. Accordingly, these other long term liabilities are not included in the above table.
In addition, the following contingent contractual obligations, the amounts of which cannot be estimated, are notincluded in the table above:
• We have commenced arbitration proceedings seeking the dissolution of our global alliance with SRI,damages and other appropriate relief. The arbitration is subject to uncertainties which make it difficult topredict the timing and outcome of the proceedings, or the amount of any net payment from us to SRI.Subject to those arbitration proceedings, SRI also has certain minority exit rights under the global allianceagreements that, if triggered and exercised, could require us to make a payment to acquire SRI’s interestsin GDTE and GDTNA following the determination of the fair value of SRI’s interests.
• Pursuant to certain long term agreements, we will purchase varying amounts of certain raw materials andfinished goods at agreed upon base prices that may be subject to periodic adjustments for changes in rawmaterial costs and market price adjustments, or in quantities that may be subject to periodic adjustmentsfor changes in our or our suppliers production levels.
We do not engage in the trading of commodity contracts or any related derivative contracts. We generallypurchase raw materials and energy through short term, intermediate and long term supply contracts at fixedprices or at formula prices related to market prices or negotiated prices. We may, however, from time to time,enter into contracts to hedge our energy costs.
Off-Balance Sheet Arrangements
An off-balance sheet arrangement is any transaction, agreement or other contractual arrangement involving anunconsolidated entity under which a company has:
• made guarantees,
• retained or held a contingent interest in transferred assets,
• undertaken an obligation under certain derivative instruments, or
36
• undertaken any obligation arising out of a material variable interest in an unconsolidated entity thatprovides financing, liquidity, market risk or credit risk support to the company, or that engages in leasing,hedging or research and development arrangements with the company.
We have entered into certain arrangements under which we have provided guarantees that are off-balance sheetarrangements. Those guarantees totaled approximately $7 million at December 31, 2014 and expire at varioustimes through 2023. For further information about our guarantees, refer to Note 18, Commitments andContingent Liabilities.
FORWARD-LOOKING INFORMATION — SAFE HARBOR STATEMENT
Certain information in this Annual Report (other than historical data and information) may constitute forward-looking statements regarding events and trends that may affect our future operating results and financial position.The words “estimate,” “expect,” “intend” and “project,” as well as other words or expressions of similarmeaning, are intended to identify forward-looking statements. You are cautioned not to place undue reliance onforward-looking statements, which speak only as of the date of this Annual Report. Such statements are based oncurrent expectations and assumptions, are inherently uncertain, are subject to risks and should be viewed withcaution. Actual results and experience may differ materially from the forward-looking statements as a result ofmany factors, including:
• if we do not successfully implement our strategic initiatives, our operating results, financial condition andliquidity may be materially adversely affected;
• we face significant global competition, increasingly from lower cost manufacturers, and our market sharecould decline;
• we could be negatively impacted by the decision regarding whether to impose tariffs on certain tiresimported from China;
• deteriorating economic conditions in any of our major markets, or an inability to access capital markets orthird-party financing when necessary, may materially adversely affect our operating results, financialcondition and liquidity;
• our international operations have certain risks that may materially adversely affect our operating results,financial condition and liquidity;
• we have foreign currency translation and transaction risks that may materially adversely affect ouroperating results, financial condition and liquidity;
• raw material and energy costs may materially adversely affect our operating results and financialcondition;
• if we experience a labor strike, work stoppage or other similar event our business, results of operations,financial condition and liquidity could be materially adversely affected;
• our long term ability to meet our obligations, to repay maturing indebtedness or to implement strategicinitiatives may be dependent on our ability to access capital markets in the future and to improve ouroperating results;
• financial difficulties, work stoppages, supply disruptions or economic conditions affecting our major OEcustomers, dealers or suppliers could harm our business;
• our capital expenditures may not be adequate to maintain our competitive position and may not beimplemented in a timely or cost-effective manner;
• we have a substantial amount of debt, which could restrict our growth, place us at a competitivedisadvantage or otherwise materially adversely affect our financial health;
• any failure to be in compliance with any material provision or covenant of our secured credit facilitiescould have a material adverse effect on our liquidity and operations;
37

• our variable rate indebtedness subjects us to interest rate risk, which could cause our debt serviceobligations to increase significantly;
• we have substantial fixed costs and, as a result, our operating income fluctuates disproportionately withchanges in our net sales;
• we may incur significant costs in connection with our contingent liabilities and tax matters;
• our reserves for contingent liabilities and our recorded insurance assets are subject to variousuncertainties, the outcome of which may result in our actual costs being significantly higher than theamounts recorded;
• we are subject to extensive government regulations that may materially adversely affect our operatingresults;
• the arbitration proceedings we have brought to dissolve our global alliance with SRI and the terms andconditions of the existing global alliance agreements with SRI could require us to make a substantialpayment to acquire SRI’s minority interests in GDTE and GDTNA;
• we may be adversely affected by any disruption in, or failure of, our information technology systems;
• if we are unable to attract and retain key personnel, our business could be materially adverselyaffected; and
• we may be impacted by economic and supply disruptions associated with events beyond our control, suchas war, acts of terror, political unrest, public health concerns, labor disputes or natural disasters.
It is not possible to foresee or identify all such factors. We will not revise or update any forward-lookingstatement or disclose any facts, events or circumstances that occur after the date hereof that may affect theaccuracy of any forward-looking statement.
38
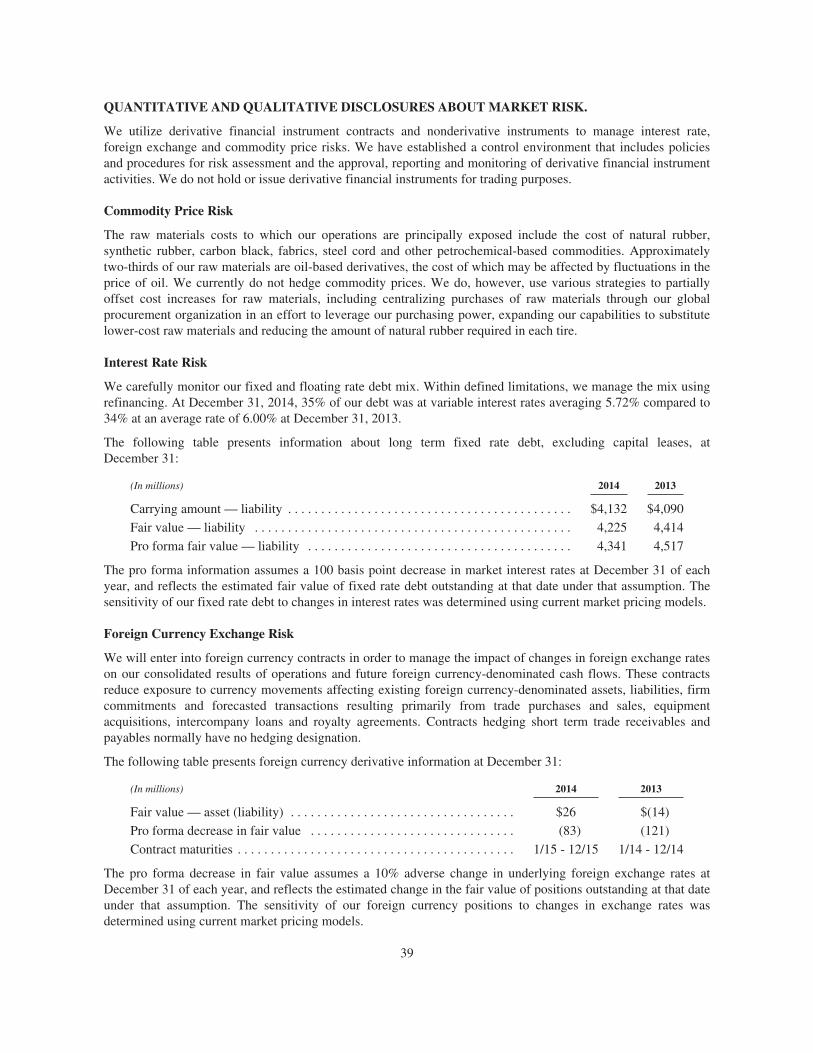
QUANTITATIVE AND QUALITATIVE DISCLOSURES ABOUT MARKET RISK.
We utilize derivative financial instrument contracts and nonderivative instruments to manage interest rate,foreign exchange and commodity price risks. We have established a control environment that includes policiesand procedures for risk assessment and the approval, reporting and monitoring of derivative financial instrumentactivities. We do not hold or issue derivative financial instruments for trading purposes.
Commodity Price Risk
The raw materials costs to which our operations are principally exposed include the cost of natural rubber,synthetic rubber, carbon black, fabrics, steel cord and other petrochemical-based commodities. Approximatelytwo-thirds of our raw materials are oil-based derivatives, the cost of which may be affected by fluctuations in theprice of oil. We currently do not hedge commodity prices. We do, however, use various strategies to partiallyoffset cost increases for raw materials, including centralizing purchases of raw materials through our globalprocurement organization in an effort to leverage our purchasing power, expanding our capabilities to substitutelower-cost raw materials and reducing the amount of natural rubber required in each tire.
Interest Rate Risk
We carefully monitor our fixed and floating rate debt mix. Within defined limitations, we manage the mix usingrefinancing. At December 31, 2014, 35% of our debt was at variable interest rates averaging 5.72% compared to34% at an average rate of 6.00% at December 31, 2013.
The following table presents information about long term fixed rate debt, excluding capital leases, atDecember 31:
(In millions) 2014 2013
Carrying amount — liability . . . . . . . . . . . . . . . . . . . . . . . . . . . . . . . . . . . . . . . . . . . $4,132 $4,090
Fair value — liability . . . . . . . . . . . . . . . . . . . . . . . . . . . . . . . . . . . . . . . . . . . . . . . . 4,225 4,414
Pro forma fair value — liability . . . . . . . . . . . . . . . . . . . . . . . . . . . . . . . . . . . . . . . . 4,341 4,517
The pro forma information assumes a 100 basis point decrease in market interest rates at December 31 of eachyear, and reflects the estimated fair value of fixed rate debt outstanding at that date under that assumption. Thesensitivity of our fixed rate debt to changes in interest rates was determined using current market pricing models.
Foreign Currency Exchange Risk
We will enter into foreign currency contracts in order to manage the impact of changes in foreign exchange rateson our consolidated results of operations and future foreign currency-denominated cash flows. These contractsreduce exposure to currency movements affecting existing foreign currency-denominated assets, liabilities, firmcommitments and forecasted transactions resulting primarily from trade purchases and sales, equipmentacquisitions, intercompany loans and royalty agreements. Contracts hedging short term trade receivables andpayables normally have no hedging designation.
The following table presents foreign currency derivative information at December 31:
(In millions) 2014 2013
Fair value — asset (liability) . . . . . . . . . . . . . . . . . . . . . . . . . . . . . . . . . . $26 $(14)
Pro forma decrease in fair value . . . . . . . . . . . . . . . . . . . . . . . . . . . . . . . (83) (121)
Contract maturities . . . . . . . . . . . . . . . . . . . . . . . . . . . . . . . . . . . . . . . . . . 1/15 - 12/15 1/14 - 12/14
The pro forma decrease in fair value assumes a 10% adverse change in underlying foreign exchange rates atDecember 31 of each year, and reflects the estimated change in the fair value of positions outstanding at that dateunder that assumption. The sensitivity of our foreign currency positions to changes in exchange rates wasdetermined using current market pricing models.
39
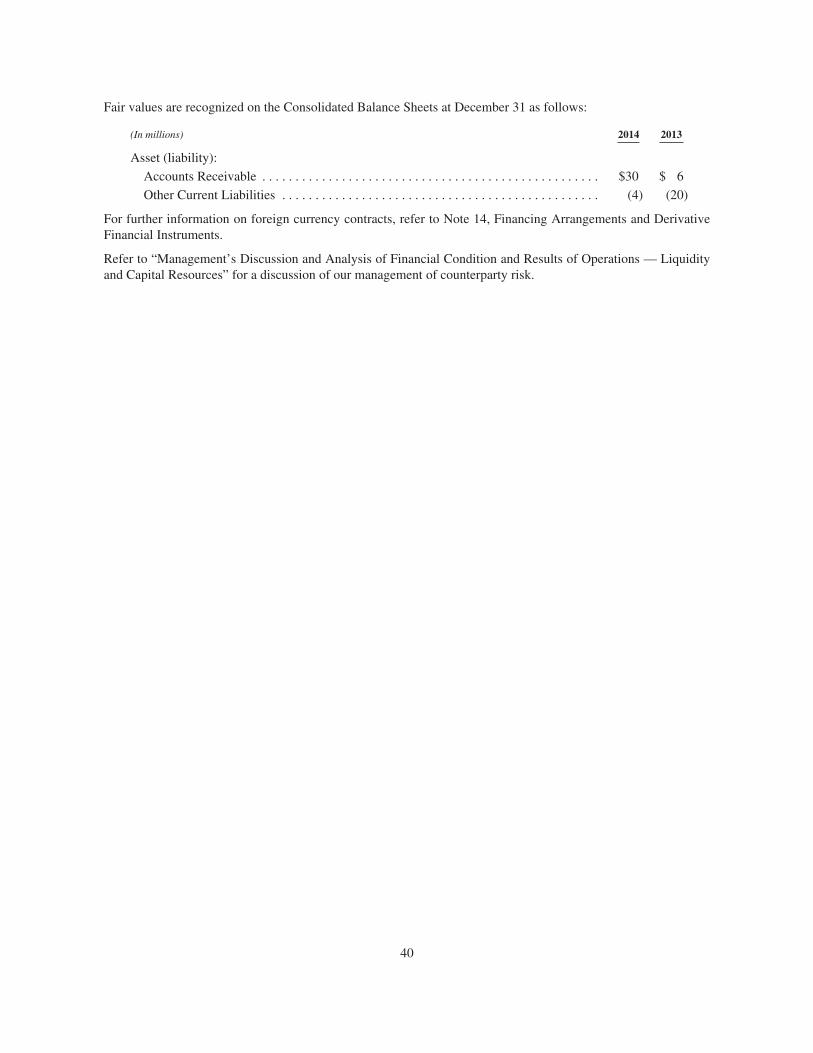
Fair values are recognized on the Consolidated Balance Sheets at December 31 as follows:
(In millions) 2014 2013
Asset (liability):
Accounts Receivable . . . . . . . . . . . . . . . . . . . . . . . . . . . . . . . . . . . . . . . . . . . . . . . . . . . $30 $ 6
Other Current Liabilities . . . . . . . . . . . . . . . . . . . . . . . . . . . . . . . . . . . . . . . . . . . . . . . . (4) (20)
For further information on foreign currency contracts, refer to Note 14, Financing Arrangements and DerivativeFinancial Instruments.
Refer to “Management’s Discussion and Analysis of Financial Condition and Results of Operations — Liquidityand Capital Resources” for a discussion of our management of counterparty risk.
40
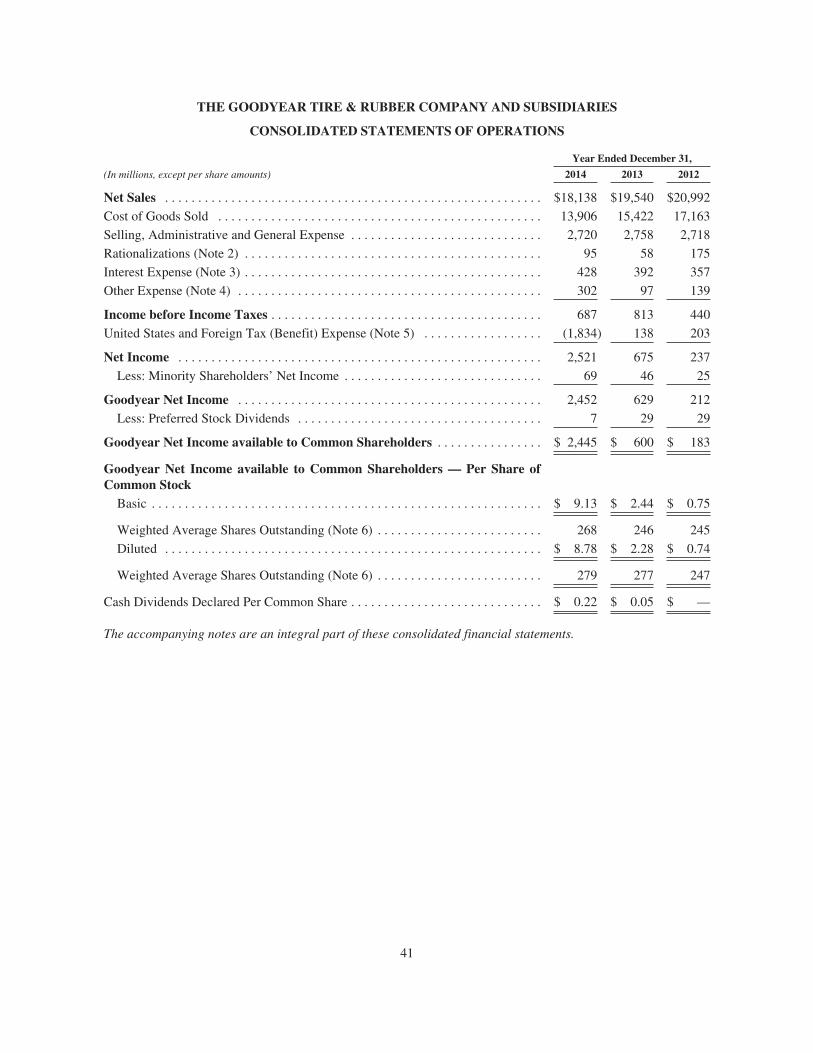
THE GOODYEAR TIRE & RUBBER COMPANY AND SUBSIDIARIES
CONSOLIDATED STATEMENTS OF OPERATIONS
Year Ended December 31,
(In millions, except per share amounts) 2014 2013 2012
Net Sales . . . . . . . . . . . . . . . . . . . . . . . . . . . . . . . . . . . . . . . . . . . . . . . . . . . . . . . . . $18,138 $19,540 $20,992
Cost of Goods Sold . . . . . . . . . . . . . . . . . . . . . . . . . . . . . . . . . . . . . . . . . . . . . . . . . 13,906 15,422 17,163
Selling, Administrative and General Expense . . . . . . . . . . . . . . . . . . . . . . . . . . . . . 2,720 2,758 2,718
Rationalizations (Note 2) . . . . . . . . . . . . . . . . . . . . . . . . . . . . . . . . . . . . . . . . . . . . . 95 58 175
Interest Expense (Note 3) . . . . . . . . . . . . . . . . . . . . . . . . . . . . . . . . . . . . . . . . . . . . . 428 392 357
Other Expense (Note 4) . . . . . . . . . . . . . . . . . . . . . . . . . . . . . . . . . . . . . . . . . . . . . . 302 97 139
Income before Income Taxes . . . . . . . . . . . . . . . . . . . . . . . . . . . . . . . . . . . . . . . . . 687 813 440
United States and Foreign Tax (Benefit) Expense (Note 5) . . . . . . . . . . . . . . . . . . (1,834) 138 203
Net Income . . . . . . . . . . . . . . . . . . . . . . . . . . . . . . . . . . . . . . . . . . . . . . . . . . . . . . . 2,521 675 237
Less: Minority Shareholders’ Net Income . . . . . . . . . . . . . . . . . . . . . . . . . . . . . . 69 46 25
Goodyear Net Income . . . . . . . . . . . . . . . . . . . . . . . . . . . . . . . . . . . . . . . . . . . . . . 2,452 629 212
Less: Preferred Stock Dividends . . . . . . . . . . . . . . . . . . . . . . . . . . . . . . . . . . . . . 7 29 29
Goodyear Net Income available to Common Shareholders . . . . . . . . . . . . . . . . $ 2,445 $ 600 $ 183
Goodyear Net Income available to Common Shareholders — Per Share ofCommon Stock
Basic . . . . . . . . . . . . . . . . . . . . . . . . . . . . . . . . . . . . . . . . . . . . . . . . . . . . . . . . . . . $ 9.13 $ 2.44 $ 0.75
Weighted Average Shares Outstanding (Note 6) . . . . . . . . . . . . . . . . . . . . . . . . . 268 246 245
Diluted . . . . . . . . . . . . . . . . . . . . . . . . . . . . . . . . . . . . . . . . . . . . . . . . . . . . . . . . . $ 8.78 $ 2.28 $ 0.74
Weighted Average Shares Outstanding (Note 6) . . . . . . . . . . . . . . . . . . . . . . . . . 279 277 247
Cash Dividends Declared Per Common Share . . . . . . . . . . . . . . . . . . . . . . . . . . . . . $ 0.22 $ 0.05 $ —
The accompanying notes are an integral part of these consolidated financial statements.
41

THE GOODYEAR TIRE & RUBBER COMPANY AND SUBSIDIARIES
CONSOLIDATED STATEMENTS OF COMPREHENSIVE INCOME (LOSS)
Year Ended December 31,
(In millions) 2014 2013 2012
Net Income . . . . . . . . . . . . . . . . . . . . . . . . . . . . . . . . . . . . . . . . . . . . . . . . . . . . . . . . . . . . $2,521 $ 675 $ 237
Other Comprehensive Income (Loss):
Foreign currency translation (net of tax benefit of $46 in 2014 and tax of $0 in 2013and 2012) . . . . . . . . . . . . . . . . . . . . . . . . . . . . . . . . . . . . . . . . . . . . . . . . . . . . . . . . . (298) (151) 83
Reclassification adjustment for amounts recognized in income (net of tax of $0 inall periods) . . . . . . . . . . . . . . . . . . . . . . . . . . . . . . . . . . . . . . . . . . . . . . . . . . . . . . 3 1 —
Defined benefit plans:
Amortization of prior service cost and unrecognized gains and losses included intotal benefit cost (net of tax of $36 in 2014, $10 in 2013 and $9 in 2012) . . . . . 79 232 209
Decrease (Increase) in net actuarial losses (net of tax benefit of $135 in 2014, taxof $34 in 2013 and tax benefit of $54 in 2012) . . . . . . . . . . . . . . . . . . . . . . . . . . (82) 519 (979)
Immediate recognition of prior service cost and unrecognized gains and lossesdue to curtailments, settlements and divestitures (net of tax of $13 in 2014, $1in 2013 and $1 in 2012) . . . . . . . . . . . . . . . . . . . . . . . . . . . . . . . . . . . . . . . . . . . . 35 2 11
Prior service credit (cost) from plan amendments (net of tax of $0 in 2014, $0 in2013 and $3 in 2012) . . . . . . . . . . . . . . . . . . . . . . . . . . . . . . . . . . . . . . . . . . . . . . — 31 73
Deferred derivative gains (losses) (net of tax of $1 in 2014, $1 in 2013 and $0 in2012) . . . . . . . . . . . . . . . . . . . . . . . . . . . . . . . . . . . . . . . . . . . . . . . . . . . . . . . . . . . . 16 1 (5)
Reclassification adjustment for amounts recognized in income (net of tax benefitof $1 in 2014, tax of $0 in 2013 and tax benefit of $3 in 2012) . . . . . . . . . . . . . 1 2 (11)
Unrealized investment gains (net of tax of $1 in 2014 and $0 in 2013 and 2012) . . . . . 2 8 —
Other Comprehensive Income (Loss) . . . . . . . . . . . . . . . . . . . . . . . . . . . . . . . . . . . . . . (244) 645 (619)
Comprehensive Income (Loss) . . . . . . . . . . . . . . . . . . . . . . . . . . . . . . . . . . . . . . . . . . . 2,277 1,320 (382)
Less: Comprehensive Income (Loss) Attributable to Minority Shareholders . . . . . . . . . 20 78 (20)
Goodyear Comprehensive Income (Loss) . . . . . . . . . . . . . . . . . . . . . . . . . . . . . . . . . . $2,257 $1,242 $(362)
The accompanying notes are an integral part of these consolidated financial statements.
42

THE GOODYEAR TIRE & RUBBER COMPANY AND SUBSIDIARIES
CONSOLIDATED BALANCE SHEETS
December 31,
(In millions, except share data) 2014 2013
AssetsCurrent Assets:
Cash and Cash Equivalents (Note 1) . . . . . . . . . . . . . . . . . . . . . . . . . . . . . . . . . . . . . . . . . . . . . . . $ 2,161 $ 2,996Accounts Receivable (Note 8) . . . . . . . . . . . . . . . . . . . . . . . . . . . . . . . . . . . . . . . . . . . . . . . . . . . 2,126 2,435Inventories (Note 9) . . . . . . . . . . . . . . . . . . . . . . . . . . . . . . . . . . . . . . . . . . . . . . . . . . . . . . . . . . . 2,671 2,816Deferred Income Taxes (Note 5) . . . . . . . . . . . . . . . . . . . . . . . . . . . . . . . . . . . . . . . . . . . . . . . . . . 570 143Prepaid Expenses and Other Current Assets . . . . . . . . . . . . . . . . . . . . . . . . . . . . . . . . . . . . . . . . . 196 254
Total Current Assets . . . . . . . . . . . . . . . . . . . . . . . . . . . . . . . . . . . . . . . . . . . . . . . . . . . . . . . . 7,724 8,644Goodwill (Note 10) . . . . . . . . . . . . . . . . . . . . . . . . . . . . . . . . . . . . . . . . . . . . . . . . . . . . . . . . . . . . . . 601 668Intangible Assets (Note 10) . . . . . . . . . . . . . . . . . . . . . . . . . . . . . . . . . . . . . . . . . . . . . . . . . . . . . . . . 138 138Deferred Income Taxes (Note 5) . . . . . . . . . . . . . . . . . . . . . . . . . . . . . . . . . . . . . . . . . . . . . . . . . . . . 1,762 157Other Assets (Note 11) . . . . . . . . . . . . . . . . . . . . . . . . . . . . . . . . . . . . . . . . . . . . . . . . . . . . . . . . . . . 731 600Property, Plant and Equipment (Note 12) . . . . . . . . . . . . . . . . . . . . . . . . . . . . . . . . . . . . . . . . . . . . . 7,153 7,320
Total Assets . . . . . . . . . . . . . . . . . . . . . . . . . . . . . . . . . . . . . . . . . . . . . . . . . . . . . . . . . . . . . . . $ 18,109 $ 17,527
LiabilitiesCurrent Liabilities:
Accounts Payable-Trade . . . . . . . . . . . . . . . . . . . . . . . . . . . . . . . . . . . . . . . . . . . . . . . . . . . . . . . . $ 2,878 $ 3,097Compensation and Benefits (Notes 16 and 17) . . . . . . . . . . . . . . . . . . . . . . . . . . . . . . . . . . . . . . . 724 758Other Current Liabilities . . . . . . . . . . . . . . . . . . . . . . . . . . . . . . . . . . . . . . . . . . . . . . . . . . . . . . . . 956 1,083Notes Payable and Overdrafts (Note 14) . . . . . . . . . . . . . . . . . . . . . . . . . . . . . . . . . . . . . . . . . . . 30 14Long Term Debt and Capital Leases due Within One Year (Note 14) . . . . . . . . . . . . . . . . . . . . . 148 73
Total Current Liabilities . . . . . . . . . . . . . . . . . . . . . . . . . . . . . . . . . . . . . . . . . . . . . . . . . 4,736 5,025Long Term Debt and Capital Leases (Note 14) . . . . . . . . . . . . . . . . . . . . . . . . . . . . . . . . . . . . . . . . 6,216 6,162Compensation and Benefits (Notes 16 and 17) . . . . . . . . . . . . . . . . . . . . . . . . . . . . . . . . . . . . . . . . . 1,676 2,673Deferred and Other Noncurrent Income Taxes (Note 5) . . . . . . . . . . . . . . . . . . . . . . . . . . . . . . . . . 181 256Other Long Term Liabilities . . . . . . . . . . . . . . . . . . . . . . . . . . . . . . . . . . . . . . . . . . . . . . . . . . . . . . . 873 966
Total Liabilities . . . . . . . . . . . . . . . . . . . . . . . . . . . . . . . . . . . . . . . . . . . . . . . . . . . . . . . . . . . . 13,682 15,082Commitments and Contingent Liabilities (Note 18)Minority Shareholders’ Equity (Note 1) . . . . . . . . . . . . . . . . . . . . . . . . . . . . . . . . . . . . . . . . . . . . . . 582 577Shareholders’ EquityGoodyear Shareholders’ EquityPreferred Stock, no par value: (Note 19)
Authorized, 50 million shares, Outstanding shares — none in 2014 (10 million in 2013),liquidation preference $50 per share . . . . . . . . . . . . . . . . . . . . . . . . . . . . . . . . . . . . . . . . . — 500
Common Stock, no par value:Authorized, 450 million shares, Outstanding shares — 269 million (248 million in 2013) . . . . . 269 248
Capital Surplus . . . . . . . . . . . . . . . . . . . . . . . . . . . . . . . . . . . . . . . . . . . . . . . . . . . . . . . . . . . . . . . . . 3,141 2,847Retained Earnings . . . . . . . . . . . . . . . . . . . . . . . . . . . . . . . . . . . . . . . . . . . . . . . . . . . . . . . . . . . . . . . 4,343 1,958Accumulated Other Comprehensive Loss (Note 20) . . . . . . . . . . . . . . . . . . . . . . . . . . . . . . . . . . . . (4,143) (3,947)
Goodyear Shareholders’ Equity . . . . . . . . . . . . . . . . . . . . . . . . . . . . . . . . . . . . . . . . . . . . . . 3,610 1,606Minority Shareholders’ Equity — Nonredeemable . . . . . . . . . . . . . . . . . . . . . . . . . . . . . . . . . . . . . 235 262
Total Shareholders’ Equity . . . . . . . . . . . . . . . . . . . . . . . . . . . . . . . . . . . . . . . . . . . . . . 3,845 1,868
Total Liabilities and Shareholders’ Equity . . . . . . . . . . . . . . . . . . . . . . . . . . . . . . . . . . $18,109 $17,527
The accompanying notes are an integral part of these consolidated financial statements.
43

THE GOODYEAR TIRE & RUBBER COMPANY AND SUBSIDIARIES
CONSOLIDATED STATEMENTS OF SHAREHOLDERS’ EQUITY
AccumulatedOther
ComprehensiveLoss
GoodyearShareholders’
Equity
MinorityShareholders’
Equity —Non-
Redeemable
TotalShareholders’
Equity
Preferred Stock Common Stock CapitalSurplus
RetainedEarnings(Dollars in millions) Shares Amount Shares Amount
Balance at December 31,2011
(after deducting 6,353,851common treasuryshares) . . . . . . . . . . . . . 10,000,000 $500 244,535,841 $245 $2,808 $1,187 $(3,991) $ 749 $268 $1,017
Comprehensive income(loss):
Net income . . . . . . . . . . 212 212 35 247Foreign currency
translation (net of taxof $0) . . . . . . . . . . . . 51 51 14 65
Amortization of priorservice cost andunrecognized gainsand losses included innet periodic benefitcost (net of tax of$9) . . . . . . . . . . . . . . 203 203 203
Increase in net actuariallosses (net of taxbenefit of $44) . . . . . (898) (898) (898)
Immediate recognitionof prior service costand unrecognizedgains and losses dueto curtailments,settlements anddivestitures (net oftax of $1) . . . . . . . . . 9 9 9
Prior service credit fromplan amendments (netof tax of $3) . . . . . . . 72 72 72
Deferred derivativelosses (net of tax of$0) . . . . . . . . . . . . . . (4) (4) (4)Reclassification
adjustment foramounts recognizedin income (net oftax benefit of $3) . . (7) (7) (7)
Othercomprehensiveincome (loss) . . . . (574) 14 (560)
Totalcomprehensiveincome (loss) . . . . (362) 49 (313)
Purchase of subsidiaryshares from minorityinterest . . . . . . . . . . . (13) 5 (8) (47) (55)
Dividends declared tominorityshareholders . . . . . . . (15) (15)
Stock-basedcompensation plans . . 17 17 17
Preferred stockdividends declared(Note 19) . . . . . . . . . (29) (29) (29)
Common stock issuedfrom treasury (Note17) . . . . . . . . . . . . . . 704,921 — 3 3 3
Balance at December 31,2012
(after deducting 5,648,930common treasuryshares) . . . . . . . . . . . . . 10,000,000 $500 245,240,762 $245 $2,815 $1,370 $(4,560) $ 370 $255 $ 625
The accompanying notes are an integral part of these consolidated financial statements.
44

THE GOODYEAR TIRE & RUBBER COMPANY AND SUBSIDIARIES
CONSOLIDATED STATEMENTS OF SHAREHOLDERS’ EQUITY — (Continued)
AccumulatedOther
ComprehensiveLoss
GoodyearShareholders’
Equity
MinorityShareholders’
Equity —Non-
Redeemable
TotalShareholders’
Equity
Preferred Stock Common Stock CapitalSurplus
RetainedEarnings(Dollars in millions) Shares Amount Shares Amount
Balance at December 31, 2012(after deducting 5,648,930 common
treasury shares) . . . . . . . . . . . . . 10,000,000 $500 245,240,762 $245 $2,815 $1,370 $(4,560) $ 370 $255 $ 625Comprehensive income (loss):
Net income . . . . . . . . . . . . . . . . 629 629 45 674Foreign currency translation
(net of tax of $0) . . . . . . . . . . (153) (153) (21) (174)Reclassification adjustment for
amounts recognized inincome (net of tax of $0) . . . 1 1 1
Amortization of prior servicecost and unrecognized gainsand losses included in totalbenefit cost (net of tax of$9) . . . . . . . . . . . . . . . . . . . . 224 224 224
Decrease in net actuarial losses(net of tax of $33) . . . . . . . . . 498 498 498
Immediate recognition of priorservice cost andunrecognized gains andlosses due to curtailments,settlements and divestitures(net of tax of $1) . . . . . . . . . . 2 2 2
Prior service credit from planamendments (net of tax of$0) . . . . . . . . . . . . . . . . . . . . 30 30 30
Deferred derivative gains (netof tax of $1) . . . . . . . . . . . . . 1 1 1Reclassification adjustment
for amounts recognized inincome (net of tax of$0) . . . . . . . . . . . . . . . . . . 2 2 2
Unrealized investment gains(net of tax of $0) . . . . . . . . . 8 8 8
Other comprehensiveincome (loss) . . . . . . . . . . 613 (21) 592
Total comprehensiveincome (loss) . . . . . . . . . . 1,242 24 1,266
Purchase of subsidiary sharesfrom minority interest . . . . . . (2) (2) (2) (4)
Dividends declared to minorityshareholders . . . . . . . . . . . . . (11) (11)
Stock-based compensationplans . . . . . . . . . . . . . . . . . . . 15 15 15
Dividends declared (Note19) . . . . . . . . . . . . . . . . . . . . (41) (41) (41)
Common stock issued fromtreasury (Note 17) . . . . . . . . . 2,512,267 3 19 22 22
Other . . . . . . . . . . . . . . . . . . . . . (4) (4)
Balance at December 31, 2013(after deducting 3,136,663
common treasury shares) . . . . . 10,000,000 $500 247,753,029 $248 $2,847 $1,958 $(3,947) $1,606 $262 $1,868
The accompanying notes are an integral part of these consolidated financial statements.
45

THE GOODYEAR TIRE & RUBBER COMPANY AND SUBSIDIARIES
CONSOLIDATED STATEMENTS OF SHAREHOLDERS’ EQUITY — (Continued)
AccumulatedOther
ComprehensiveLoss
GoodyearShareholders’
Equity
MinorityShareholders’
Equity—Non-
Redeemable
TotalShareholders’
Equity
Preferred Stock Common Stock CapitalSurplus
RetainedEarnings(Dollars in millions) Shares Amount Shares Amount
Balance at December 31, 2013(after deducting 3,136,663
common treasury shares) . . . . . 10,000,000 $ 500 247,753,029 $248 $2,847 $1,958 $(3,947) $1,606 $262 $1,868Comprehensive income (loss):
Net income . . . . . . . . . . . . . . . 2,452 2,452 23 2,475Foreign currency translation
(net of tax benefit of $46) . . (206) (206) (18) (224)Reclassification adjustment
for amounts recognized inincome (net of tax of$0) . . . . . . . . . . . . . . . . . . 3 3 3
Amortization of prior servicecost and unrecognized gainsand losses included in totalbenefit cost (net of tax of$36) . . . . . . . . . . . . . . . . . . . 74 74 74
Increase in net actuarial losses(net of tax of $129) . . . . . . . (112) (112) (112)
Immediate recognition of priorservice cost andunrecognized gains andlosses due to curtailments,settlements and divestitures(net of tax of $13) . . . . . . . . 31 31 31
Deferred derivative gains (netof tax of $1) . . . . . . . . . . . . . 13 13 13
Unrealized investment gains(net of tax of $1) . . . . . . . . . 2 2 2
Other comprehensiveincome (loss) . . . . . . . . . . (195) (18) (213)
Total comprehensiveincome (loss) . . . . . . . . . 2,257 5 2,262
Purchase of subsidiary sharesfrom minority interest . . . . . (4) (1) (5) (16) (21)
Dividends declared to minorityshareholders . . . . . . . . . . . . (16) (16)
Stock-based compensationplans . . . . . . . . . . . . . . . . . . 20 20 20
Repurchase of common stock(Note 19) . . . . . . . . . . . . . . . (8,955,107) (9) (225) (234) (234)
Dividends declared (Note19) . . . . . . . . . . . . . . . . . . . . (67) (67) (67)
Common stock issued fromtreasury (Note 17) . . . . . . . . 3,111,843 2 31 33 33
Preferred stock conversion . . . (10,000,000) (500) 27,573,735 28 472 — —
Balance at December 31, 2014(after deducting 8,979,927
common treasury shares) . . . . — $ — 269,483,500 $269 $3,141 $4,343 $(4,143) $3,610 $235 $3,845
The accompanying notes are an integral part of these consolidated financial statements.
46
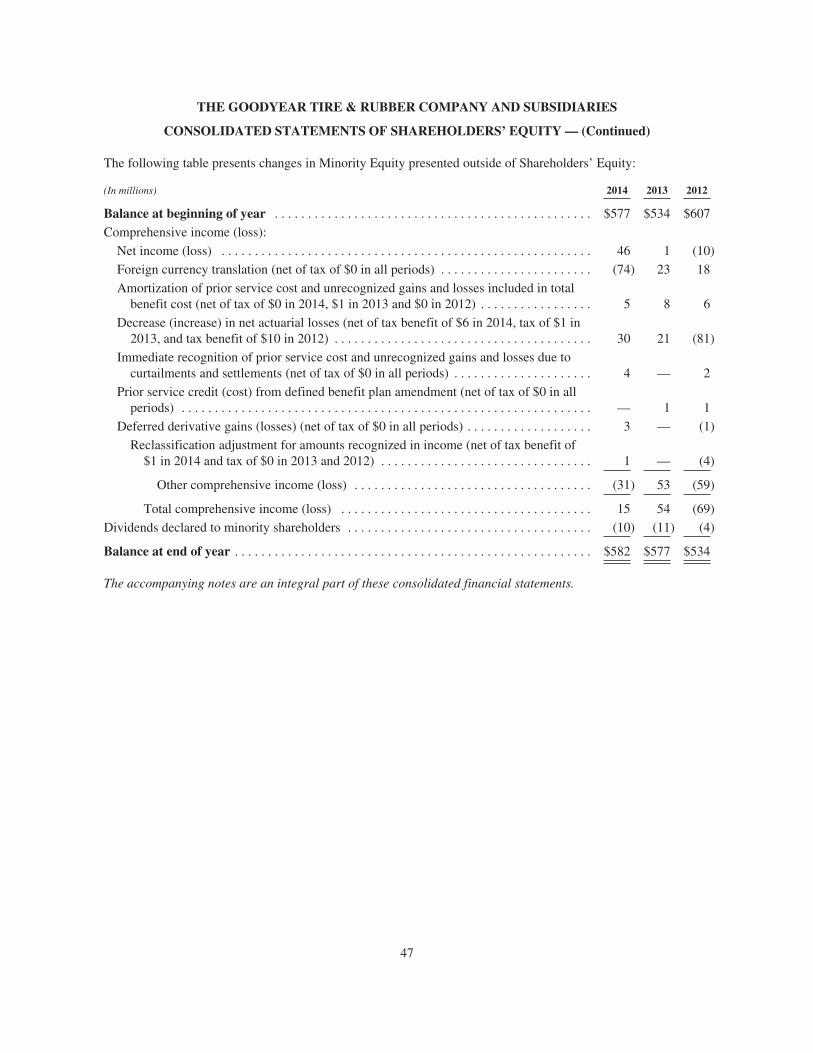
THE GOODYEAR TIRE & RUBBER COMPANY AND SUBSIDIARIES
CONSOLIDATED STATEMENTS OF SHAREHOLDERS’ EQUITY — (Continued)
The following table presents changes in Minority Equity presented outside of Shareholders’ Equity:
(In millions) 2014 2013 2012
Balance at beginning of year . . . . . . . . . . . . . . . . . . . . . . . . . . . . . . . . . . . . . . . . . . . . . . . . $577 $534 $607
Comprehensive income (loss):
Net income (loss) . . . . . . . . . . . . . . . . . . . . . . . . . . . . . . . . . . . . . . . . . . . . . . . . . . . . . . . . 46 1 (10)
Foreign currency translation (net of tax of $0 in all periods) . . . . . . . . . . . . . . . . . . . . . . . (74) 23 18
Amortization of prior service cost and unrecognized gains and losses included in totalbenefit cost (net of tax of $0 in 2014, $1 in 2013 and $0 in 2012) . . . . . . . . . . . . . . . . . 5 8 6
Decrease (increase) in net actuarial losses (net of tax benefit of $6 in 2014, tax of $1 in2013, and tax benefit of $10 in 2012) . . . . . . . . . . . . . . . . . . . . . . . . . . . . . . . . . . . . . . . 30 21 (81)
Immediate recognition of prior service cost and unrecognized gains and losses due tocurtailments and settlements (net of tax of $0 in all periods) . . . . . . . . . . . . . . . . . . . . . 4 — 2
Prior service credit (cost) from defined benefit plan amendment (net of tax of $0 in allperiods) . . . . . . . . . . . . . . . . . . . . . . . . . . . . . . . . . . . . . . . . . . . . . . . . . . . . . . . . . . . . . . — 1 1
Deferred derivative gains (losses) (net of tax of $0 in all periods) . . . . . . . . . . . . . . . . . . . 3 — (1)
Reclassification adjustment for amounts recognized in income (net of tax benefit of$1 in 2014 and tax of $0 in 2013 and 2012) . . . . . . . . . . . . . . . . . . . . . . . . . . . . . . . . 1 — (4)
Other comprehensive income (loss) . . . . . . . . . . . . . . . . . . . . . . . . . . . . . . . . . . . . (31) 53 (59)
Total comprehensive income (loss) . . . . . . . . . . . . . . . . . . . . . . . . . . . . . . . . . . . . . . 15 54 (69)
Dividends declared to minority shareholders . . . . . . . . . . . . . . . . . . . . . . . . . . . . . . . . . . . . . (10) (11) (4)
Balance at end of year . . . . . . . . . . . . . . . . . . . . . . . . . . . . . . . . . . . . . . . . . . . . . . . . . . . . . . $582 $577 $534
The accompanying notes are an integral part of these consolidated financial statements.
47

THE GOODYEAR TIRE & RUBBER COMPANY AND SUBSIDIARIES
CONSOLIDATED STATEMENTS OF CASH FLOWS
Year Ended December 31,
(In millions) 2014 2013 2012
Cash Flows from Operating Activities:Net Income . . . . . . . . . . . . . . . . . . . . . . . . . . . . . . . . . . . . . . . . . . . . . . . . . . . . . . . . . . . . . . . . . . . . . $ 2,521 $ 675 $ 237
Adjustments to Reconcile Net Income to Cash Flows from Operating Activities:Depreciation and Amortization . . . . . . . . . . . . . . . . . . . . . . . . . . . . . . . . . . . . . . . . . . . . . . . . . . 732 722 687Amortization and Write-Off of Debt Issuance Costs . . . . . . . . . . . . . . . . . . . . . . . . . . . . . . . . . . 14 18 67Provision for Deferred Income Taxes . . . . . . . . . . . . . . . . . . . . . . . . . . . . . . . . . . . . . . . . . . . . . (1,970) (34) 16Net Pension Curtailments and Settlements . . . . . . . . . . . . . . . . . . . . . . . . . . . . . . . . . . . . . . . . . 39 — —Net Rationalization Charges (Note 2) . . . . . . . . . . . . . . . . . . . . . . . . . . . . . . . . . . . . . . . . . . . . . 95 58 175Rationalization Payments . . . . . . . . . . . . . . . . . . . . . . . . . . . . . . . . . . . . . . . . . . . . . . . . . . . . . . . (226) (72) (106)Net Gains on Asset Sales (Note 4) . . . . . . . . . . . . . . . . . . . . . . . . . . . . . . . . . . . . . . . . . . . . . . . . (3) (8) (25)Pension Contributions and Direct Payments . . . . . . . . . . . . . . . . . . . . . . . . . . . . . . . . . . . . . . . . (1,338) (1,162) (684)Net Venezuela Currency Loss (Note 4) . . . . . . . . . . . . . . . . . . . . . . . . . . . . . . . . . . . . . . . . . . . . 200 115 —Customer Prepayments and Government Grants . . . . . . . . . . . . . . . . . . . . . . . . . . . . . . . . . . . . . 14 44 131Insurance Proceeds . . . . . . . . . . . . . . . . . . . . . . . . . . . . . . . . . . . . . . . . . . . . . . . . . . . . . . . . . . . . 4 17 50Changes in Operating Assets and Liabilities, Net of Asset Acquisitions and Dispositions:
Accounts Receivable . . . . . . . . . . . . . . . . . . . . . . . . . . . . . . . . . . . . . . . . . . . . . . . . . . . . . . . . 75 79 291Inventories . . . . . . . . . . . . . . . . . . . . . . . . . . . . . . . . . . . . . . . . . . . . . . . . . . . . . . . . . . . . . . . . (35) 366 619Accounts Payable — Trade . . . . . . . . . . . . . . . . . . . . . . . . . . . . . . . . . . . . . . . . . . . . . . . . . . . (41) (30) (453)Compensation and Benefits . . . . . . . . . . . . . . . . . . . . . . . . . . . . . . . . . . . . . . . . . . . . . . . . . . . 223 243 260Other Current Liabilities . . . . . . . . . . . . . . . . . . . . . . . . . . . . . . . . . . . . . . . . . . . . . . . . . . . . . (40) (28) (24)Other Assets and Liabilities . . . . . . . . . . . . . . . . . . . . . . . . . . . . . . . . . . . . . . . . . . . . . . . . . . . 76 (65) (203)
Total Cash Flows from Operating Activities . . . . . . . . . . . . . . . . . . . . . . . . . . . . . . . . . . . . . . 340 938 1,038Cash Flows from Investing Activities:
Capital Expenditures . . . . . . . . . . . . . . . . . . . . . . . . . . . . . . . . . . . . . . . . . . . . . . . . . . . . . . . . . . . . (923) (1,168) (1,127)Asset Dispositions (Note 4) . . . . . . . . . . . . . . . . . . . . . . . . . . . . . . . . . . . . . . . . . . . . . . . . . . . . . . . 18 25 16Decrease in Restricted Cash . . . . . . . . . . . . . . . . . . . . . . . . . . . . . . . . . . . . . . . . . . . . . . . . . . . . . . . 5 14 11Short Term Securities Acquired . . . . . . . . . . . . . . . . . . . . . . . . . . . . . . . . . . . . . . . . . . . . . . . . . . . . (72) (105) (57)Short Term Securities Redeemed . . . . . . . . . . . . . . . . . . . . . . . . . . . . . . . . . . . . . . . . . . . . . . . . . . . 95 89 28Other Transactions (Note 11) . . . . . . . . . . . . . . . . . . . . . . . . . . . . . . . . . . . . . . . . . . . . . . . . . . . . . . 26 9 6
Total Cash Flows from Investing Activities . . . . . . . . . . . . . . . . . . . . . . . . . . . . . . . . . . . . . . . (851) (1,136) (1,123)Cash Flows from Financing Activities:
Short Term Debt and Overdrafts Incurred . . . . . . . . . . . . . . . . . . . . . . . . . . . . . . . . . . . . . . . . . . . . 46 31 77Short Term Debt and Overdrafts Paid . . . . . . . . . . . . . . . . . . . . . . . . . . . . . . . . . . . . . . . . . . . . . . . (24) (120) (156)Long Term Debt Incurred . . . . . . . . . . . . . . . . . . . . . . . . . . . . . . . . . . . . . . . . . . . . . . . . . . . . . . . . 1,842 1,913 3,531Long Term Debt Paid . . . . . . . . . . . . . . . . . . . . . . . . . . . . . . . . . . . . . . . . . . . . . . . . . . . . . . . . . . . . (1,555) (681) (3,717)Common Stock Issued (Note 17) . . . . . . . . . . . . . . . . . . . . . . . . . . . . . . . . . . . . . . . . . . . . . . . . . . . 39 26 3Common Stock Repurchased (Note 19) . . . . . . . . . . . . . . . . . . . . . . . . . . . . . . . . . . . . . . . . . . . . . . (234) (4) —Common Stock Dividends Paid (Note 19) . . . . . . . . . . . . . . . . . . . . . . . . . . . . . . . . . . . . . . . . . . . . (60) (12) —Preferred Stock Dividends Paid (Note 19) . . . . . . . . . . . . . . . . . . . . . . . . . . . . . . . . . . . . . . . . . . . . (15) (29) (29)Transactions with Minority Interests in Subsidiaries . . . . . . . . . . . . . . . . . . . . . . . . . . . . . . . . . . . . (49) (26) (71)Debt Related Costs and Other Transactions . . . . . . . . . . . . . . . . . . . . . . . . . . . . . . . . . . . . . . . . . . . (1) (16) (64)
Total Cash Flows from Financing Activities . . . . . . . . . . . . . . . . . . . . . . . . . . . . . . . . . . . . . . (11) 1,082 (426)Effect of Exchange Rate Changes on Cash and Cash Equivalents . . . . . . . . . . . . . . . . . . . . . . . . . . . . . (313) (169) 20
Net Change in Cash and Cash Equivalents . . . . . . . . . . . . . . . . . . . . . . . . . . . . . . . . . . . . . . . . . . . . . (835) 715 (491)Cash and Cash Equivalents at Beginning of the Year . . . . . . . . . . . . . . . . . . . . . . . . . . . . . . . . . . . . . . . 2,996 2,281 2,772
Cash and Cash Equivalents at End of the Year . . . . . . . . . . . . . . . . . . . . . . . . . . . . . . . . . . . . . . . . . $ 2,161 $ 2,996 $ 2,281
The accompanying notes are an integral part of these consolidated financial statements.
48

THE GOODYEAR TIRE & RUBBER COMPANY AND SUBSIDIARIES
NOTES TO CONSOLIDATED FINANCIAL STATEMENTS
Note 1. Accounting Policies
A summary of the significant accounting policies used in the preparation of the accompanying consolidatedfinancial statements follows:
Basis of Presentation
Recently Issued Accounting Standards
In August 2014, the Financial Accounting Standards Board (“FASB”) issued an accounting standards updatewith new guidance on management’s responsibility to evaluate whether there is substantial doubt about anentity’s ability to continue as a going concern and to provide related footnote disclosures. Management mustevaluate whether it is probable that known conditions or events, considered in the aggregate, would raisesubstantial doubt about the entity’s ability to continue as a going concern within one year after the date that thefinancial statements are issued. If such conditions or events are identified, the standard requires management’smitigation plans to alleviate the doubt or a statement of the substantial doubt about the entity’s ability to continueas a going concern to be disclosed in the financial statements. The standards update is effective for fiscal yearsand interim periods beginning after December 15, 2016, with early adoption permitted. The adoption of thisstandards update is not expected to impact our consolidated financial statements.
In May 2014, the FASB issued an accounting standards update with new guidance on recognizing revenue fromcontracts with customers. The standards update outlines a single comprehensive model for entities to utilize torecognize revenue when it transfers goods or services to customers in an amount that reflects the considerationthat will be received in exchange for the goods and services. Additional disclosures will also be required toenable users to understand the nature, amount, timing, and uncertainty of revenue and cash flows arising fromcontracts with customers. The standards update is effective for fiscal years beginning after December 15, 2016,and early adoption is not permitted. We are currently evaluating the impact of adopting this standards update onour consolidated financial statements.
In April 2014, the FASB issued an accounting standards update providing new guidance on the requirements forreporting a discontinued operation. The standards update allows only those disposals representing a strategic shiftin operations with a major effect on the entity’s operations and financial results to be reported as a discontinuedoperation. It also allows companies to have significant continuing involvement and continuing cash flows withthe discontinued operations. Additional disclosures are also required for discontinued operations and individuallymaterial disposal transactions that do not meet the definition of a discontinued operation. The standards update iseffective for fiscal years beginning after December 15, 2014. We will adopt this standards update, as required,beginning with the first quarter of 2015. The adoption of this standards update affects presentation only and isnot expected to have a material impact on our consolidated financial statements.
Recently Adopted Accounting Standards
Effective November 2014, we adopted an accounting standards update providing guidance for determiningwhether and at what threshold an acquired entity can reflect the acquirer’s accounting and reporting basis(pushdown accounting) in its separate financial statements. The standards update provides guidance for anacquired entity with an option to apply pushdown accounting in its separate financial statements upon occurrenceof an event in which an acquirer obtains control of the acquired entity. The adoption of this standards update didnot impact our consolidated financial statements.
Effective January 1, 2014, we adopted an accounting standards update requiring the presentation of anunrecognized tax benefit in the financial statements as a reduction to a deferred tax asset for a net operating losscarryforward, a similar tax loss, or a tax credit carryforward. This net presentation is required unless a netoperating loss carryforward, a similar tax loss, or a tax credit carryforward is not available at the reporting date orthe tax law of the jurisdiction does not require, and the entity does not intend to use, the deferred tax asset to
49
THE GOODYEAR TIRE & RUBBER COMPANY AND SUBSIDIARIES
settle any additional income tax that would result from the disallowance of the unrecognized tax benefit. Theadoption of this standards update did not have a material impact on our consolidated financial statements.
Effective January 1, 2014, we adopted an accounting standards update providing guidance with respect to therelease of cumulative translation adjustments into net income when a parent sells either a part or all of itsinvestment in a foreign entity. The standards update also requires the release of cumulative translationadjustments when a company no longer holds a controlling financial interest in a subsidiary or group of assetsthat is a business within a foreign entity, and provides guidance for the acquisition in stages of a controllinginterest in a foreign entity. The adoption of this standards update did not impact our consolidated financialstatements.
Effective January 1, 2014, we adopted an accounting standards update requiring an entity to record obligationsresulting from joint and several liability arrangements for which the total amount of the obligation is fixed at thereporting date. The adoption of this standards update did not impact our consolidated financial statements.
Other
We are a party to shareholder agreements concerning certain of our less-than-wholly-owned consolidatedsubsidiaries. Under the terms of certain of these agreements, the minority shareholders have the right to requireus to purchase their ownership interests in the respective subsidiaries if there is a change in control of theCompany, a bankruptcy of the Company, or other circumstances. Accordingly, we have reported the minorityequity in those subsidiaries outside of shareholders’ equity.
Principles of Consolidation
The consolidated financial statements include the accounts of all legal entities in which we hold a controllingfinancial interest. A controlling financial interest generally arises from our ownership of a majority of the votingshares of our subsidiaries. We would also hold a controlling financial interest in variable interest entities if weare considered to be the primary beneficiary. Investments in companies in which we do not own a majorityinterest and we have the ability to exercise significant influence over operating and financial policies areaccounted for using the equity method. Investments in other companies are carried at cost. All intercompanybalances and transactions have been eliminated in consolidation.
Use of Estimates
The preparation of financial statements in conformity with generally accepted accounting principles requiresmanagement to make estimates and assumptions that affect the amounts reported in the consolidated financialstatements and related notes to the consolidated financial statements. Actual results could differ from thoseestimates. On an ongoing basis, management reviews its estimates, including those related to:
• recoverability of intangibles and other long-lived assets,
• deferred tax asset valuation allowances and uncertain income tax positions,
• workers’ compensation,
• general and product liabilities and other litigation,
• pension and other postretirement benefits, and
• various other operating allowances and accruals, based on currently available information.
Changes in facts and circumstances may alter such estimates and affect results of operations and financialposition in future periods.
50

THE GOODYEAR TIRE & RUBBER COMPANY AND SUBSIDIARIES
Revenue Recognition and Accounts Receivable Valuation
Revenues are recognized when finished products are shipped to unaffiliated customers, both title and the risksand rewards of ownership are transferred or services have been rendered and accepted, and collectability isreasonably assured. A provision for sales returns, discounts and allowances is recorded at the time of sale.Appropriate provisions are made for uncollectible accounts based on historical loss experience, portfolioduration, economic conditions and credit risk. The adequacy of the allowances are assessed quarterly.
Shipping and Handling Costs
Costs incurred for transportation of products to customers are recorded as a component of Cost of Goods Sold(“CGS”).
Research and Development Costs
Research and development costs include, among other things, materials, equipment, compensation and contractservices. These costs are expensed as incurred and included as a component of CGS. Research and developmentexpenditures were $399 million, $390 million, and $370 million in 2014, 2013, and 2012, respectively.
Warranty
Warranties are provided on the sale of certain of our products and services and an accrual for estimated futureclaims is recorded at the time revenue is recognized. Tire replacement under most of the warranties we offer is ona prorated basis. Warranty reserves are based on past claims experience, sales history and other considerations.Refer to Note 18.
Environmental Cleanup Matters
We expense environmental costs related to existing conditions resulting from past or current operations and fromwhich no current or future benefit is discernible. Expenditures that extend the life of the related property ormitigate or prevent future environmental contamination are capitalized. We determine our liability on a site bysite basis and record a liability at the time when it is probable and can be reasonably estimated. Our estimatedliability is reduced to reflect the anticipated participation of other potentially responsible parties in thoseinstances where it is probable that such parties are legally responsible and financially capable of paying theirrespective shares of the relevant costs. Our estimated liability is not discounted or reduced for possible recoveriesfrom insurance carriers. Refer to Note 18.
Legal Costs
We record a liability for estimated legal and defense costs related to pending general and product liability claims,environmental matters and workers’ compensation claims. Refer to Note 18.
Advertising Costs
Costs incurred for producing and communicating advertising are generally expensed when incurred as acomponent of Selling, Administrative and General Expense (“SAG”). Costs incurred under our cooperativeadvertising programs with dealers and franchisees are generally recorded as reductions of sales as relatedrevenues are recognized. Advertising costs, including costs for our cooperative advertising programs with dealersand franchisees, were $430 million, $408 million, and $435 million in 2014, 2013, and 2012, respectively.
Rationalizations
We record costs for rationalization actions implemented to reduce excess and high-cost manufacturing capacityand operating and administrative costs. Associate-related costs include severance, supplemental unemploymentcompensation and benefits, medical benefits, pension curtailments, postretirement benefits, and other termination
51

THE GOODYEAR TIRE & RUBBER COMPANY AND SUBSIDIARIES
benefits. For ongoing benefit arrangements, a liability is recognized when it is probable that employees will beentitled to benefits and the amount can be reasonably estimated. These conditions are generally met when therestructuring plan is approved by management. For one-time benefit arrangements, a liability is incurred andmust be accrued at the date the plan is communicated to employees, unless they will be retained beyond aminimum retention period. In this case, the liability is calculated at the date the plan is communicated toemployees and is accrued ratably over the future service period. Other costs generally include non-cancelablelease costs, contract terminations, and relocation costs. A liability for these costs is recognized in the period inwhich the liability is incurred. Rationalization charges related to accelerated depreciation and asset impairmentsare recorded in CGS or SAG. Refer to Note 2.
Income Taxes
Income taxes are recognized during the year in which transactions enter into the determination of financialstatement income, with deferred taxes being provided for temporary differences between amounts of assets andliabilities for financial reporting purposes and such amounts as measured under applicable tax laws. The effect ondeferred tax assets or liabilities of a change in the tax law or tax rate is recognized in the period the change isenacted. Valuation allowances are recorded to reduce net deferred tax assets to the amount that is more likelythan not to be realized. The calculation of our tax liabilities also involves considering uncertainties in theapplication of complex tax regulations. We recognize liabilities for uncertain income tax positions based on ourestimate of whether it is more likely than not that additional taxes will be required and we report related interestand penalties as income taxes. Refer to Note 5.
Cash and Cash Equivalents / Consolidated Statements of Cash Flows
Cash and cash equivalents consist of cash on hand and marketable securities with original maturities of threemonths or less. Substantially all of our cash and short-term investment securities are held with investment grade-rated counterparties. At December 31, 2014, our cash investments with any single counterparty did not exceed$420 million.
Cash flows associated with derivative financial instruments designated as hedges of identifiable transactions orevents are classified in the same category as the cash flows from the related hedged items. Cash flows associatedwith derivative financial instruments not designated as hedges are classified as operating activities. Bankoverdrafts are recorded within Notes Payable and Overdrafts. Cash flows associated with bank overdrafts areclassified as financing activities.
Customer prepayments for products and government grants received that are related to operations are reported asoperating activities. Government grants received that are solely related to capital expenditures are reported asinvesting activities. The Consolidated Statement of Cash Flows is presented net of capital leases of $12 million,$19 million and $41 million, for the years ended December 31, 2014, 2013 and 2012, respectively, whichoriginated in those years, and net of capitalized costs related to the Global and North America Headquartersfacility and parking deck of $18 million and $126 million, for the years ended December 31, 2013 and 2012,respectively. Investing activities included an $11 million decrease in accrued capital expenditures in 2014compared to 2013.
Restricted Net Assets
In certain countries where we operate, transfers of funds into or out of such countries by way of dividends, loansor advances are generally or periodically subject to various governmental regulations. In addition, certain of ourcredit agreements and other debt instruments limit the ability of foreign subsidiaries to make cash distributions.At December 31, 2014, approximately $611 million of net assets were subject to such regulations or limitations.
52

THE GOODYEAR TIRE & RUBBER COMPANY AND SUBSIDIARIES
Inventories
Inventories are stated at the lower of cost or market. Cost is determined using the first-in, first-out or the averagecost method. Costs include direct material, direct labor and applicable manufacturing and engineering overhead.We allocate fixed manufacturing overheads based on normal production capacity and recognize abnormalmanufacturing costs as period costs. We determine a provision for excess and obsolete inventory based onmanagement’s review of inventories on hand compared to estimated future usage and sales. Refer to Note 9.
Goodwill and Other Intangible Assets
Goodwill is recorded when the cost of acquired businesses exceeds the fair value of the identifiable net assetsacquired. Goodwill and intangible assets with indefinite useful lives are not amortized but are assessed forimpairment annually with the option to perform a qualitative assessment to determine whether furtherimpairment testing is necessary or to perform a quantitative assessment by comparing the fair value of thereporting unit or indefinite-lived intangible to its carrying amount. Under the qualitative assessment, an entity isnot required to calculate the fair value unless the entity determines that it is more likely than not that the fairvalue is less than the carrying amount. If under the quantitative assessment the fair value is less than the carryingamount, then the amount of the impairment loss, if any, must be measured.
In addition to annual testing, impairment testing is conducted when events occur or circumstances change thatwould more likely than not reduce the fair value of the asset below its carrying amount. Goodwill and intangibleassets with indefinite useful lives would be written down to fair value if considered impaired. Intangible assetswith finite useful lives are amortized to their estimated residual values over such finite lives, and reviewed forimpairment whenever events or circumstances warrant such a review. Refer to Note 10.
Investments
Investments in marketable securities are stated at fair value. Fair value is determined using quoted market pricesat the end of the reporting period and, when appropriate, exchange rates at that date. Unrealized gains and losseson marketable securities classified as available-for-sale are recorded in Accumulated Other Comprehensive Loss(“AOCL”), net of tax. We regularly review our investments to determine whether a decline in fair value belowthe cost basis is other than temporary. If the decline in fair value is judged to be other than temporary, the costbasis of the security is written down to fair value and the amount of the write-down is included in theConsolidated Statements of Operations. Refer to Notes 11 and 20.
Property, Plant and Equipment
Property, plant and equipment are stated at cost. Depreciation is computed using the straight-line method.Additions and improvements that substantially extend the useful life of property, plant and equipment, andinterest costs incurred during the construction period of major projects are capitalized. Government grants to usthat are solely related to capital expenditures are recorded as reductions of the cost of the associated assets.Repair and maintenance costs are expensed as incurred. Property, plant and equipment are depreciated to theirestimated residual values over their estimated useful lives, and reviewed for impairment whenever events orcircumstances warrant such a review. Depreciation expense for property, plant and equipment was $730 million,$719 million and $684 million in 2014, 2013 and 2012, respectively. Refer to Notes 3 and 12.
Foreign Currency Translation
The functional currency for most subsidiaries outside the United States is the local currency. Financial statementsof these subsidiaries are translated into U.S. dollars using the exchange rate at each balance sheet date for assetsand liabilities and a weighted average exchange rate for each period for revenues, expenses, gains and losses. TheU.S. dollar is used as the functional currency in countries with a history of high inflation, including Venezuela,
53

THE GOODYEAR TIRE & RUBBER COMPANY AND SUBSIDIARIES
and in countries that predominantly sell into the U.S. dollar export market. For all operations, gains or lossesfrom remeasuring foreign currency transactions into the functional currency are included in Other Expense.Translation adjustments are recorded in AOCL. Income taxes are generally not provided for foreign currencytranslation adjustments.
Derivative Financial Instruments and Hedging Activities
To qualify for hedge accounting, hedging instruments must be designated as hedges and meet defined correlationand effectiveness criteria. These criteria require that the anticipated cash flows and/or changes in fair value of thehedging instrument substantially offset those of the position being hedged.
Derivative contracts are reported at fair value on the Consolidated Balance Sheets as Accounts Receivable orOther Current Liabilities. Deferred gains and losses on contracts designated as cash flow hedges are recorded netof tax in AOCL. Ineffectiveness in hedging relationships is recorded in Other Expense in the current period.
Interest Rate Contracts — Gains and losses on contracts designated as cash flow hedges are initially deferred andrecorded in AOCL. Amounts are transferred from AOCL and recognized in income as Interest Expense in thesame period that the hedged item is recognized in income. Gains and losses on contracts designated as fair valuehedges are recognized in income in the current period as Interest Expense. Gains and losses on contracts with nohedging designation are recorded in the current period in Other Expense.
Foreign Currency Contracts — Gains and losses on contracts designated as cash flow hedges are initiallydeferred and recorded in AOCL. Amounts are transferred from AOCL and recognized in income in the sameperiod and on the same line that the hedged item is recognized in income. Gains and losses on contractsdesignated as fair value hedges, excluding premiums and discounts, are recorded in Other Expense in the currentperiod. Gains and losses on contracts with no hedging designation are also recorded in Other Expense in thecurrent period. We do not include premiums or discounts on forward currency contracts in our assessment ofhedge effectiveness. Premiums and discounts on contracts designated as hedges are recognized in Other Expenseover the life of the contract.
Net Investment Hedging — Nonderivative instruments denominated in foreign currencies are used from time totime to hedge net investments in foreign subsidiaries. Gains and losses on these instruments are deferred andrecorded in AOCL as Foreign Currency Translation Adjustments. These gains and losses are only recognized inincome upon the complete or partial sale of the related investment or the complete liquidation of the investment.
Termination of Contracts — Gains and losses (including deferred gains and losses in AOCL) are recognized inOther Expense when contracts are terminated concurrently with the termination of the hedged position. To theextent that such position remains outstanding, gains and losses are amortized to Interest Expense or to OtherExpense over the remaining life of that position. Gains and losses on contracts that we temporarily continue tohold after the early termination of a hedged position, or that otherwise no longer qualify for hedge accounting,are recognized in Other Expense. Refer to Note 14.
Stock-Based Compensation
We measure compensation cost arising from the grant of stock-based awards to employees at fair value andrecognize such cost in income over the period during which the service is provided, usually the vesting period.We recognize compensation expense using the straight-line approach.
Stock-based awards to employees include grants of performance share units, restricted stock units and stockoptions. We measure the fair value of grants of performance share units and restricted stock units based primarilyon the closing market price of a share of our common stock on the date of the grant, modified as appropriate totake into account the features of such grants.
54

THE GOODYEAR TIRE & RUBBER COMPANY AND SUBSIDIARIES
We estimate the fair value of stock options using the Black-Scholes valuation model. Assumptions used toestimate compensation expense are determined as follows:
• Expected term represents the period of time that options granted are expected to be outstanding based onour historical experience of option exercises;
• Expected volatility is measured using the weighted average of historical daily changes in the market priceof our common stock over the expected term of the award and implied volatility calculated for ourexchange traded options with an expiration date greater than one year;
• Risk-free interest rate is equivalent to the implied yield on zero-coupon U.S. Treasury bonds with aremaining maturity equal to the expected term of the awards; and
• Forfeitures are based substantially on the history of cancellations of similar awards granted in prior years.
Refer to Note 17.
Earnings Per Share of Common Stock
Basic earnings per share are computed based on the weighted average number of common shares outstanding.Diluted earnings per share primarily reflects the dilutive impact of outstanding stock options, mandatoryconvertible preferred stock and related dividends. All earnings per share amounts in these notes to theconsolidated financial statements are diluted, unless otherwise noted. Refer to Note 6.
Fair Value Measurements
Valuation Hierarchy
Assets and liabilities measured at fair value are classified using the following hierarchy, which is based upon thetransparency of inputs to the valuation as of the measurement date.
• Level 1 — Valuation is based upon quoted prices (unadjusted) for identical assets or liabilities in activemarkets.
• Level 2 — Valuation is based upon quoted prices for similar assets and liabilities in active markets, orother inputs that are observable for the asset or liability, either directly or indirectly, for substantially thefull term of the financial instrument.
• Level 3 — Valuation is based upon other unobservable inputs that are significant to the fair valuemeasurement.
The classification of fair value measurements within the hierarchy is based upon the lowest level of input that issignificant to the measurement. Valuation methodologies used for assets and liabilities measured at fair value areas follows:
Investments
Where quoted prices are available in an active market, investments are classified within Level 1 of the valuationhierarchy. Level 1 securities include highly liquid government bonds, certain mortgage products and exchange-traded equities. If quoted market prices are not available, fair values are estimated using quoted prices of securitieswith similar characteristics or inputs other than quoted prices that are observable for the security, and would beclassified within Level 2 of the valuation hierarchy. In certain cases where there is limited activity or lesstransparency around inputs to the valuation, securities would be classified within Level 3 of the valuation hierarchy.
Derivative Financial Instruments
Exchange-traded derivative financial instruments that are valued using quoted prices would be classified withinLevel 1 of the valuation hierarchy. Derivative financial instruments valued using internally-developed modelsthat use as their basis readily observable market parameters are classified within Level 2 of the valuation
55

THE GOODYEAR TIRE & RUBBER COMPANY AND SUBSIDIARIES
hierarchy. Derivative financial instruments that are valued based upon models with significant unobservablemarket parameters, and that are normally traded less actively, would be classified within Level 3 of the valuationhierarchy. Refer to Notes 14 and 15.
Reclassifications
Certain items previously reported in specific financial statement captions have been reclassified to conform to thecurrent presentation.
Note 2. Costs Associated with Rationalization Programs
In order to maintain our global competitiveness, we have implemented rationalization actions over the pastseveral years to reduce excess and high-cost manufacturing capacity and to reduce associate headcount.
The following table presents the roll-forward of the liability balance between periods:
(In millions)Associate-related
Costs Other Costs Total
Balance at December 31, 2011 . . . . . . . . . . . . . . . . . . . . . . . $ 166 $ 18 $ 1842012 charges . . . . . . . . . . . . . . . . . . . . . . . . . . . . . . . . . . . . . . 142 36 178Incurred, Net of Foreign Currency Translation of $3 million
and $0 million, respectively . . . . . . . . . . . . . . . . . . . . . . . . . (77) (30) (107)Reversed to the Statement of Operations . . . . . . . . . . . . . . . . . (2) (1) (3)
Balance at December 31, 2012 . . . . . . . . . . . . . . . . . . . . . . . $ 229 $ 23 $ 2522013 charges . . . . . . . . . . . . . . . . . . . . . . . . . . . . . . . . . . . . . . 58 17 75Incurred, Net of Foreign Currency Translation of $7 million
and $0 million, respectively . . . . . . . . . . . . . . . . . . . . . . . . . (42) (31) (73)Reversed to the Statement of Operations . . . . . . . . . . . . . . . . . (13) (4) (17)
Balance at December 31, 2013 . . . . . . . . . . . . . . . . . . . . . . . $ 232 $ 5 $ 2372014 charges(1) . . . . . . . . . . . . . . . . . . . . . . . . . . . . . . . . . . . . 76 52 128Incurred, Net of Foreign Currency Translation of $(18)
million and $0 million, respectively(2) . . . . . . . . . . . . . . . . (186) (49) (235)Reversed to the Statement of Operations . . . . . . . . . . . . . . . . . (5) (6) (11)
Balance at December 31, 2014 . . . . . . . . . . . . . . . . . . . . . . . $ 117 $ 2 $ 119
(1) Charges in 2014 of $128 million excludes $22 million of pension curtailment gains recorded inRationalizations in the Statement of Operations.
(2) Incurred in 2014 of $235 million excludes $20 million of rationalization payments for labor claims relatingto a previously closed facility in Greece. Refer to Note 4.
Significant rationalization actions initiated in 2014 consisted primarily of manufacturing headcount reductionsrelated to Europe, Middle East and Africa’s (“EMEA”) plans to improve operating efficiency. In addition,EMEA, Latin America and Asia Pacific also initiated plans to reduce SAG.
The accrual balance of $119 million at December 31, 2014 is expected to be substantially utilized within the next12 months and includes $84 million related to the plan to exit the farm tire business in EMEA and the closure ofone of our manufacturing facilities in Amiens, France.
56
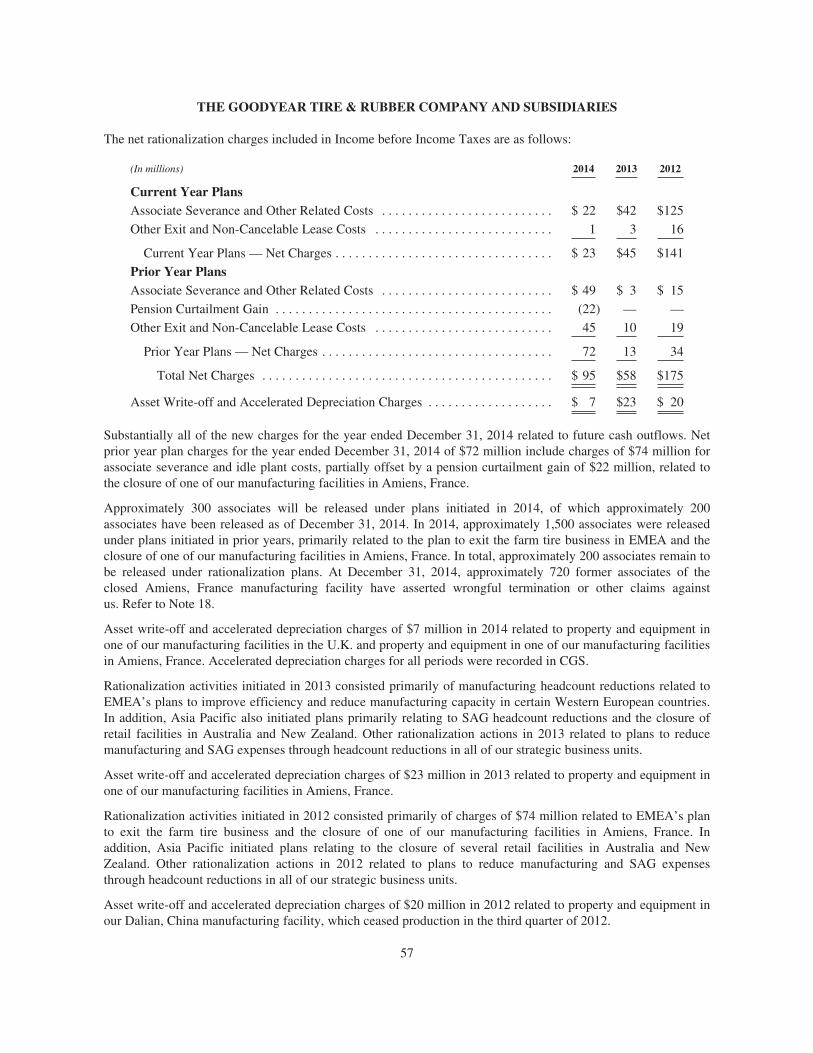
THE GOODYEAR TIRE & RUBBER COMPANY AND SUBSIDIARIES
The net rationalization charges included in Income before Income Taxes are as follows:
(In millions) 2014 2013 2012
Current Year PlansAssociate Severance and Other Related Costs . . . . . . . . . . . . . . . . . . . . . . . . . . $ 22 $42 $125
Other Exit and Non-Cancelable Lease Costs . . . . . . . . . . . . . . . . . . . . . . . . . . . 1 3 16
Current Year Plans — Net Charges . . . . . . . . . . . . . . . . . . . . . . . . . . . . . . . . . $ 23 $45 $141
Prior Year PlansAssociate Severance and Other Related Costs . . . . . . . . . . . . . . . . . . . . . . . . . . $ 49 $ 3 $ 15
Pension Curtailment Gain . . . . . . . . . . . . . . . . . . . . . . . . . . . . . . . . . . . . . . . . . . (22) — —
Other Exit and Non-Cancelable Lease Costs . . . . . . . . . . . . . . . . . . . . . . . . . . . 45 10 19
Prior Year Plans — Net Charges . . . . . . . . . . . . . . . . . . . . . . . . . . . . . . . . . . . 72 13 34
Total Net Charges . . . . . . . . . . . . . . . . . . . . . . . . . . . . . . . . . . . . . . . . . . . . $ 95 $58 $175
Asset Write-off and Accelerated Depreciation Charges . . . . . . . . . . . . . . . . . . . $ 7 $23 $ 20
Substantially all of the new charges for the year ended December 31, 2014 related to future cash outflows. Netprior year plan charges for the year ended December 31, 2014 of $72 million include charges of $74 million forassociate severance and idle plant costs, partially offset by a pension curtailment gain of $22 million, related tothe closure of one of our manufacturing facilities in Amiens, France.
Approximately 300 associates will be released under plans initiated in 2014, of which approximately 200associates have been released as of December 31, 2014. In 2014, approximately 1,500 associates were releasedunder plans initiated in prior years, primarily related to the plan to exit the farm tire business in EMEA and theclosure of one of our manufacturing facilities in Amiens, France. In total, approximately 200 associates remain tobe released under rationalization plans. At December 31, 2014, approximately 720 former associates of theclosed Amiens, France manufacturing facility have asserted wrongful termination or other claims againstus. Refer to Note 18.
Asset write-off and accelerated depreciation charges of $7 million in 2014 related to property and equipment inone of our manufacturing facilities in the U.K. and property and equipment in one of our manufacturing facilitiesin Amiens, France. Accelerated depreciation charges for all periods were recorded in CGS.
Rationalization activities initiated in 2013 consisted primarily of manufacturing headcount reductions related toEMEA’s plans to improve efficiency and reduce manufacturing capacity in certain Western European countries.In addition, Asia Pacific also initiated plans primarily relating to SAG headcount reductions and the closure ofretail facilities in Australia and New Zealand. Other rationalization actions in 2013 related to plans to reducemanufacturing and SAG expenses through headcount reductions in all of our strategic business units.
Asset write-off and accelerated depreciation charges of $23 million in 2013 related to property and equipment inone of our manufacturing facilities in Amiens, France.
Rationalization activities initiated in 2012 consisted primarily of charges of $74 million related to EMEA’s planto exit the farm tire business and the closure of one of our manufacturing facilities in Amiens, France. Inaddition, Asia Pacific initiated plans relating to the closure of several retail facilities in Australia and NewZealand. Other rationalization actions in 2012 related to plans to reduce manufacturing and SAG expensesthrough headcount reductions in all of our strategic business units.
Asset write-off and accelerated depreciation charges of $20 million in 2012 related to property and equipment inour Dalian, China manufacturing facility, which ceased production in the third quarter of 2012.
57

THE GOODYEAR TIRE & RUBBER COMPANY AND SUBSIDIARIES
Note 3. Interest Expense
Interest expense includes interest and amortization of debt discounts, less amounts capitalized, as follows:
(In millions) 2014 2013 2012
Interest expense before capitalization . . . . . . . . . . . . . . . . . . . . . . . . . . . . . . . . $452 $431 $379
Capitalized interest . . . . . . . . . . . . . . . . . . . . . . . . . . . . . . . . . . . . . . . . . . . . . . (24) (39) (22)
$428 $392 $357
Cash payments for interest, net of amounts capitalized were $419 million, $353 million and $348 million in2014, 2013 and 2012, respectively. In 2014, interest expense was favorably impacted by $6 million related tointerest recovered on the settlement of certain indirect tax claims in Latin America. In 2012, we recorded an outof period adjustment of $13 million of additional interest expense to correct capitalized interest recorded in priorperiods.
Note 4. Other Expense(In millions) Expense(Income) 2014 2013 2012
Net foreign currency exchange losses . . . . . . . . . . . . . . . . . . . . . . . . . . . . . . . . $239 $118 $ 26
Financing fees and financial instruments . . . . . . . . . . . . . . . . . . . . . . . . . . . . . 77 64 162
Royalty income . . . . . . . . . . . . . . . . . . . . . . . . . . . . . . . . . . . . . . . . . . . . . . . . . (35) (51) (38)
Interest income . . . . . . . . . . . . . . . . . . . . . . . . . . . . . . . . . . . . . . . . . . . . . . . . . (28) (41) (17)
General and product liability — discontinued products . . . . . . . . . . . . . . . . . . 25 15 8
Net (gains) losses on asset sales . . . . . . . . . . . . . . . . . . . . . . . . . . . . . . . . . . . . (3) (8) (25)
Miscellaneous . . . . . . . . . . . . . . . . . . . . . . . . . . . . . . . . . . . . . . . . . . . . . . . . . . 27 — 23
$302 $ 97 $139
Net foreign currency exchange losses in 2014 were $239 million, compared to losses of $118 million and $26million in 2013 and 2012, respectively. Net foreign currency exchange losses in 2014 and 2013 included netcharges of $200 million and $115 million, respectively, resulting from changes in the exchange rate of theVenezuelan bolivar fuerte against the U.S. dollar. Foreign currency exchange in all periods reflected net gainsand losses resulting from the effect of exchange rate changes on various foreign currency transactions worldwide.
Effective February 13, 2013, Venezuela’s official exchange rate changed from 4.3 to 6.3 bolivares fuertes to theU.S. dollar for substantially all goods. In the first quarter of 2013, we recorded a $115 million remeasurementloss on bolivar-denominated net monetary assets and liabilities, including deferred taxes, primarily related tocash deposits in Venezuela. We also recorded a one-time subsidy receivable of $13 million related to certain U.S.dollar-denominated payables that were expected to be settled at the then-official subsidy exchange rate of 4.3bolivares fuertes to the U.S. dollar applicable to certain import purchases prior to the devaluation date.
Effective January 24, 2014, Venezuela’s exchange rate applicable to the settlement of certain transactions,including payments of dividends and royalties, changed to an auction-based floating rate, the ComplementarySystem of Foreign Currency Administration (“SICAD I”) rate, which was 11.4 and 12.0 bolivares fuertes to theU.S. dollar at January 24, 2014 and December 31, 2014, respectively. The official exchange rate for imports ofessential goods, such as certain raw materials needed for the production of tires, remained at 6.3 bolivares fuertesto the U.S. dollar; however, the previously existing subsidy exchange rate of 4.3 bolivares fuertes to the U.S.dollar was eliminated and, accordingly, we derecognized $11 million of previously recognized subsidyreceivables as part of the $157 million first quarter 2014 remeasurement loss. In the third quarter of 2014, werecorded a net remeasurement loss of $5 million in Venezuela resulting from the derecognition of a portion of thesubsidy receivable established on January 24, 2014, as discussed below, and a reduction of $7 million of foreign
58
THE GOODYEAR TIRE & RUBBER COMPANY AND SUBSIDIARIES
currency exchange losses previously recorded as part of the $157 million first quarter 2014 remeasurement loss.As described in Note 5, Income Taxes, in the third quarter of 2014, we established valuation allowances on thenet deferred tax assets of our Venezuelan and Brazilian subsidiaries, and accordingly, reduced $7 million ofpreviously recorded foreign currency exchange losses related to deferred tax assets of our Venezuelan subsidiary.
We are required to remeasure our bolivar-denominated monetary assets and liabilities at the rate expected to beavailable for future dividend remittances by our Venezuelan subsidiary. We expect that future remittances ofdividends by our Venezuelan subsidiary would be transacted at the SICAD I rate and, therefore, in 2014 we haverecorded a net remeasurement loss of $155 million, using the SICAD I rate. All bolivar-denominated monetaryassets and liabilities were remeasured at 12.0 and 6.3 bolivares fuertes to the U.S. dollar at December 31, 2014and 2013, respectively.
We also recorded a subsidy receivable at January 24, 2014 of $50 million related to certain U.S. dollar-denominated payables that were expected to be settled at the official exchange rate of 6.3 bolivares fuertes to theU.S. dollar for essential goods, based on ongoing approvals for importation of such goods. EffectiveSeptember 9, 2014, the official exchange rate for settling purchases of certain finished goods changed from 6.3bolivares fuertes to the U.S. dollar to the SICAD I rate and, accordingly, in the third quarter of 2014, wederecognized $5 million of the subsidy receivable. In the fourth quarter of 2014, we entered into an agreementwith the Venezuelan government to settle $85 million of U.S. dollar-denominated payables at the SICAD I ratethat we previously had expected to be settled at the official exchange rate for imports of essential goods of 6.3bolivares fuertes to the U.S. dollar and, accordingly, derecognized the remaining subsidy receivable of $45million. As of December 31, 2014, we have received payments of $7 million under this agreement. Goingforward, subsidies expected to be received from the government related to certain U.S. dollar-denominatedpayables expected to be settled at the official exchange rate for imports of essential goods of 6.3 bolivares fuertesto the U.S. dollar will only be recognized in CGS upon receipt.
Financing fees and financial instruments expense was $77 million in 2014, compared to $64 million in 2013 and$162 million in 2012. Financing fees and financial instruments expense consists of the amortization of deferredfinancing fees, commitment fees and charges incurred in connection with financing transactions. Financing feesin 2012 included $86 million related to the redemption of $650 million in aggregate principal amount of ouroutstanding 10.5% senior notes due 2016 and $24 million of charges related to the amendment and restatement ofour U.S. second lien term loan facility.
Royalty income in 2014 was $35 million, compared to income of $51 million and $38 million in 2013 and 2012,respectively. Royalty income in 2013 included a one-time royalty of $11 million related to our chemicaloperations. Royalty income is derived primarily from licensing arrangements related to divested businesses.
Interest income consists primarily of amounts earned on cash deposits. Interest income in 2014 also included $10million earned on the settlement of indirect tax claims and in 2013 also included $11 million earned on favorabletax judgments, both in Latin America.
General and product liability — discontinued products includes charges for claims against us related primarily toasbestos personal injury claims, net of probable insurance recoveries. The increase in charges in 2014 was due tounfavorable changes in assumptions related to claim trends and probable insurance recoveries for asbestos claims.
Net gains on asset sales in 2012 included gains of $9 million in North America, primarily from the sale ofproperty, gains of $9 million in EMEA, primarily from the sale of a minority interest in a retail business, andgains of $4 million in Latin America, primarily from the sale of certain assets related to our bias truck tirebusiness.
Miscellaneous expense in 2014, 2013 and 2012 includes $22 million, $6 million and $25 million, respectively, ofcharges for labor claims relating to a previously closed facility in Greece. Miscellaneous expense in 2014 alsoincludes a charge of $16 million related to a government investigation involving our compliance with the U.S.Foreign Corrupt Practices Act in certain countries in Africa.
59

THE GOODYEAR TIRE & RUBBER COMPANY AND SUBSIDIARIES
Note 5. Income Taxes
The components of Income before Income Taxes follow:
(In millions) 2014 2013 2012
U.S. . . . . . . . . . . . . . . . . . . . . . . . . . . . . . . . . . . . . . . . . . . . . . . . . . . . . . . . . . . $400 $396 $146
Foreign . . . . . . . . . . . . . . . . . . . . . . . . . . . . . . . . . . . . . . . . . . . . . . . . . . . . . . . 287 417 294
$687 $813 $440
A reconciliation of income taxes at the U.S. statutory rate to United States and Foreign Tax (Benefit) Expensefollows:
(In millions) 2014 2013 2012
U.S. Federal income tax expense (benefit) at the statutory rate of 35% . . . $ 240 $ 284 $154
Release of U.S. valuation allowance . . . . . . . . . . . . . . . . . . . . . . . . . . . . . . (2,318) — —
Provision for undistributed foreign earnings . . . . . . . . . . . . . . . . . . . . . . . . 131 — —
Net establishment (release) of foreign valuation allowances . . . . . . . . . . . 51 (8) 4
Deferred tax impact of enacted tax rate and law changes . . . . . . . . . . . . . . 33 (13) 2
Net foreign losses with no tax benefit due to valuation allowances . . . . . . 49 42 83
Adjustment for foreign income taxed at different rates . . . . . . . . . . . . . . . (37) (2) (6)
State income taxes, net of U.S. Federal benefit . . . . . . . . . . . . . . . . . . . . . . 12 — —
Net (resolution) establishment of uncertain tax positions . . . . . . . . . . . . . . 3 10 10
U.S. (income) with no tax due to valuation allowance . . . . . . . . . . . . . . . . — (136) (49)
Poland special enterprise zone tax credit . . . . . . . . . . . . . . . . . . . . . . . . . . . — (42) —
Other . . . . . . . . . . . . . . . . . . . . . . . . . . . . . . . . . . . . . . . . . . . . . . . . . . . . . . 2 3 5
United States and Foreign Tax (Benefit) Expense . . . . . . . . . . . . . . . . . $(1,834) $ 138 $203
The components of United States and Foreign Tax (Benefit) Expense by taxing jurisdiction, follow:
(In millions) 2014 2013 2012
Current:
Federal . . . . . . . . . . . . . . . . . . . . . . . . . . . . . . . . . . . . . . . . . . . . . . . . . . . . $ — $ (6) $ —
Foreign . . . . . . . . . . . . . . . . . . . . . . . . . . . . . . . . . . . . . . . . . . . . . . . . . . . 135 176 184
State . . . . . . . . . . . . . . . . . . . . . . . . . . . . . . . . . . . . . . . . . . . . . . . . . . . . . . 1 2 3
136 172 187
Deferred:
Federal . . . . . . . . . . . . . . . . . . . . . . . . . . . . . . . . . . . . . . . . . . . . . . . . . . . . (2,103) 2 2
Foreign . . . . . . . . . . . . . . . . . . . . . . . . . . . . . . . . . . . . . . . . . . . . . . . . . . . 84 (36) 13
State . . . . . . . . . . . . . . . . . . . . . . . . . . . . . . . . . . . . . . . . . . . . . . . . . . . . . . 49 — 1
(1,970) (34) 16
United States and Foreign Tax (Benefit) Expense . . . . . . . . . . . . . . . . . . $(1,834) $138 $203
At December 31, 2014, our U.S. operations were in a position of cumulative profits for the most recent three-yearperiod. We concluded that as a consequence of our three-year cumulative profits, achieving full year profitabilityin 2013 and 2014, our successful completion of labor negotiations with the United Steelworkers in 2013, our full
60
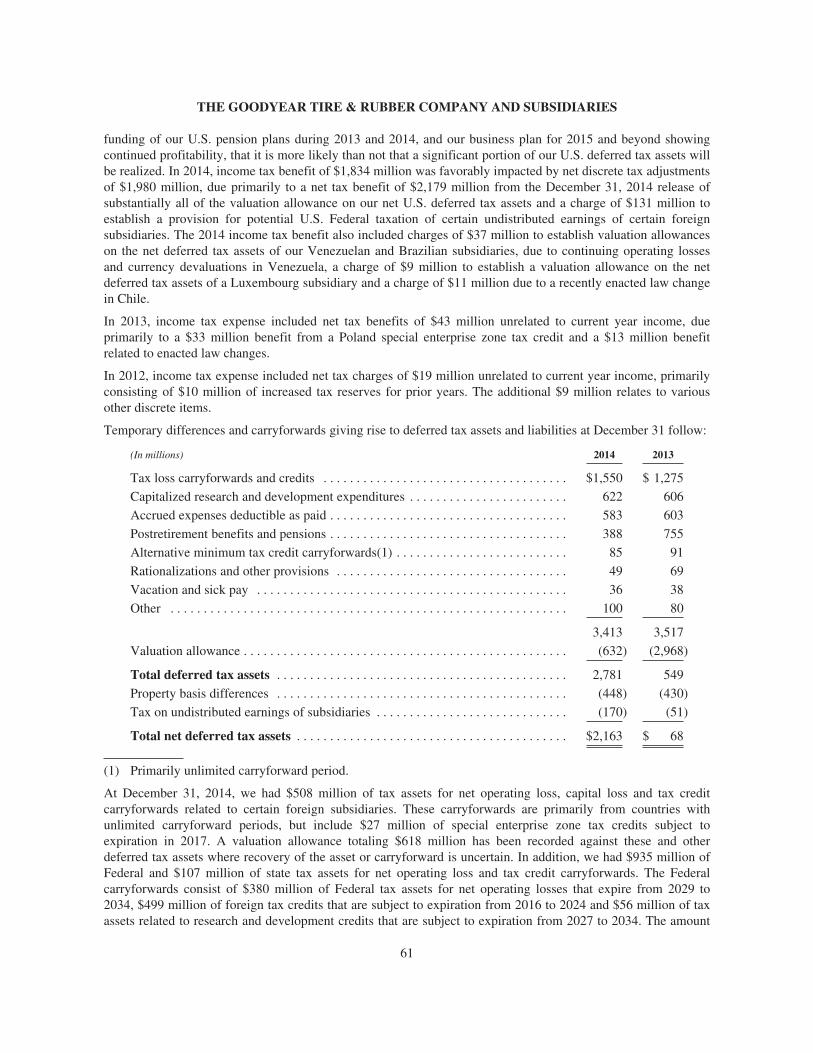
THE GOODYEAR TIRE & RUBBER COMPANY AND SUBSIDIARIES
funding of our U.S. pension plans during 2013 and 2014, and our business plan for 2015 and beyond showingcontinued profitability, that it is more likely than not that a significant portion of our U.S. deferred tax assets willbe realized. In 2014, income tax benefit of $1,834 million was favorably impacted by net discrete tax adjustmentsof $1,980 million, due primarily to a net tax benefit of $2,179 million from the December 31, 2014 release ofsubstantially all of the valuation allowance on our net U.S. deferred tax assets and a charge of $131 million toestablish a provision for potential U.S. Federal taxation of certain undistributed earnings of certain foreignsubsidiaries. The 2014 income tax benefit also included charges of $37 million to establish valuation allowanceson the net deferred tax assets of our Venezuelan and Brazilian subsidiaries, due to continuing operating lossesand currency devaluations in Venezuela, a charge of $9 million to establish a valuation allowance on the netdeferred tax assets of a Luxembourg subsidiary and a charge of $11 million due to a recently enacted law changein Chile.
In 2013, income tax expense included net tax benefits of $43 million unrelated to current year income, dueprimarily to a $33 million benefit from a Poland special enterprise zone tax credit and a $13 million benefitrelated to enacted law changes.
In 2012, income tax expense included net tax charges of $19 million unrelated to current year income, primarilyconsisting of $10 million of increased tax reserves for prior years. The additional $9 million relates to variousother discrete items.
Temporary differences and carryforwards giving rise to deferred tax assets and liabilities at December 31 follow:
(In millions) 2014 2013
Tax loss carryforwards and credits . . . . . . . . . . . . . . . . . . . . . . . . . . . . . . . . . . . . . $1,550 $ 1,275
Capitalized research and development expenditures . . . . . . . . . . . . . . . . . . . . . . . . 622 606
Accrued expenses deductible as paid . . . . . . . . . . . . . . . . . . . . . . . . . . . . . . . . . . . . 583 603
Postretirement benefits and pensions . . . . . . . . . . . . . . . . . . . . . . . . . . . . . . . . . . . . 388 755
Alternative minimum tax credit carryforwards(1) . . . . . . . . . . . . . . . . . . . . . . . . . . 85 91
Rationalizations and other provisions . . . . . . . . . . . . . . . . . . . . . . . . . . . . . . . . . . . 49 69
Vacation and sick pay . . . . . . . . . . . . . . . . . . . . . . . . . . . . . . . . . . . . . . . . . . . . . . . 36 38
Other . . . . . . . . . . . . . . . . . . . . . . . . . . . . . . . . . . . . . . . . . . . . . . . . . . . . . . . . . . . . 100 80
3,413 3,517
Valuation allowance . . . . . . . . . . . . . . . . . . . . . . . . . . . . . . . . . . . . . . . . . . . . . . . . . (632) (2,968)
Total deferred tax assets . . . . . . . . . . . . . . . . . . . . . . . . . . . . . . . . . . . . . . . . . . . . 2,781 549
Property basis differences . . . . . . . . . . . . . . . . . . . . . . . . . . . . . . . . . . . . . . . . . . . . (448) (430)
Tax on undistributed earnings of subsidiaries . . . . . . . . . . . . . . . . . . . . . . . . . . . . . (170) (51)
Total net deferred tax assets . . . . . . . . . . . . . . . . . . . . . . . . . . . . . . . . . . . . . . . . . $2,163 $ 68
(1) Primarily unlimited carryforward period.
At December 31, 2014, we had $508 million of tax assets for net operating loss, capital loss and tax creditcarryforwards related to certain foreign subsidiaries. These carryforwards are primarily from countries withunlimited carryforward periods, but include $27 million of special enterprise zone tax credits subject toexpiration in 2017. A valuation allowance totaling $618 million has been recorded against these and otherdeferred tax assets where recovery of the asset or carryforward is uncertain. In addition, we had $935 million ofFederal and $107 million of state tax assets for net operating loss and tax credit carryforwards. The Federalcarryforwards consist of $380 million of Federal tax assets for net operating losses that expire from 2029 to2034, $499 million of foreign tax credits that are subject to expiration from 2016 to 2024 and $56 million of taxassets related to research and development credits that are subject to expiration from 2027 to 2034. The amount
61
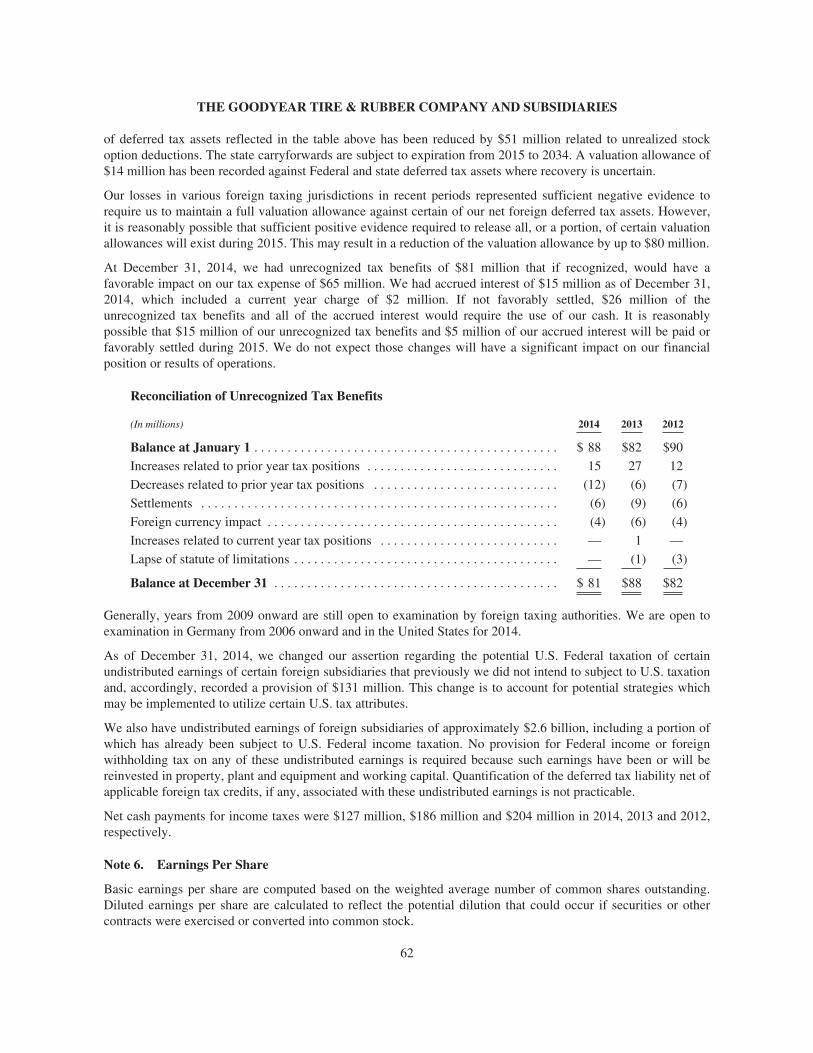
THE GOODYEAR TIRE & RUBBER COMPANY AND SUBSIDIARIES
of deferred tax assets reflected in the table above has been reduced by $51 million related to unrealized stockoption deductions. The state carryforwards are subject to expiration from 2015 to 2034. A valuation allowance of$14 million has been recorded against Federal and state deferred tax assets where recovery is uncertain.
Our losses in various foreign taxing jurisdictions in recent periods represented sufficient negative evidence torequire us to maintain a full valuation allowance against certain of our net foreign deferred tax assets. However,it is reasonably possible that sufficient positive evidence required to release all, or a portion, of certain valuationallowances will exist during 2015. This may result in a reduction of the valuation allowance by up to $80 million.
At December 31, 2014, we had unrecognized tax benefits of $81 million that if recognized, would have afavorable impact on our tax expense of $65 million. We had accrued interest of $15 million as of December 31,2014, which included a current year charge of $2 million. If not favorably settled, $26 million of theunrecognized tax benefits and all of the accrued interest would require the use of our cash. It is reasonablypossible that $15 million of our unrecognized tax benefits and $5 million of our accrued interest will be paid orfavorably settled during 2015. We do not expect those changes will have a significant impact on our financialposition or results of operations.
Reconciliation of Unrecognized Tax Benefits
(In millions) 2014 2013 2012
Balance at January 1 . . . . . . . . . . . . . . . . . . . . . . . . . . . . . . . . . . . . . . . . . . . . . . $ 88 $82 $90
Increases related to prior year tax positions . . . . . . . . . . . . . . . . . . . . . . . . . . . . . 15 27 12
Decreases related to prior year tax positions . . . . . . . . . . . . . . . . . . . . . . . . . . . . (12) (6) (7)
Settlements . . . . . . . . . . . . . . . . . . . . . . . . . . . . . . . . . . . . . . . . . . . . . . . . . . . . . . (6) (9) (6)
Foreign currency impact . . . . . . . . . . . . . . . . . . . . . . . . . . . . . . . . . . . . . . . . . . . . (4) (6) (4)
Increases related to current year tax positions . . . . . . . . . . . . . . . . . . . . . . . . . . . — 1 —
Lapse of statute of limitations . . . . . . . . . . . . . . . . . . . . . . . . . . . . . . . . . . . . . . . . — (1) (3)
Balance at December 31 . . . . . . . . . . . . . . . . . . . . . . . . . . . . . . . . . . . . . . . . . . . $ 81 $88 $82
Generally, years from 2009 onward are still open to examination by foreign taxing authorities. We are open toexamination in Germany from 2006 onward and in the United States for 2014.
As of December 31, 2014, we changed our assertion regarding the potential U.S. Federal taxation of certainundistributed earnings of certain foreign subsidiaries that previously we did not intend to subject to U.S. taxationand, accordingly, recorded a provision of $131 million. This change is to account for potential strategies whichmay be implemented to utilize certain U.S. tax attributes.
We also have undistributed earnings of foreign subsidiaries of approximately $2.6 billion, including a portion ofwhich has already been subject to U.S. Federal income taxation. No provision for Federal income or foreignwithholding tax on any of these undistributed earnings is required because such earnings have been or will bereinvested in property, plant and equipment and working capital. Quantification of the deferred tax liability net ofapplicable foreign tax credits, if any, associated with these undistributed earnings is not practicable.
Net cash payments for income taxes were $127 million, $186 million and $204 million in 2014, 2013 and 2012,respectively.
Note 6. Earnings Per Share
Basic earnings per share are computed based on the weighted average number of common shares outstanding.Diluted earnings per share are calculated to reflect the potential dilution that could occur if securities or othercontracts were exercised or converted into common stock.
62

THE GOODYEAR TIRE & RUBBER COMPANY AND SUBSIDIARIES
Basic and diluted earnings per common share are calculated as follows:
(In millions, except per share amounts) 2014 2013 2012
Earnings per share — basic:
Goodyear net income . . . . . . . . . . . . . . . . . . . . . . . . . . . . . . . . . . . . . . . . $2,452 $ 629 $ 212
Less: Preferred stock dividends . . . . . . . . . . . . . . . . . . . . . . . . . . . . . . . . 7 29 29
Goodyear net income available to common shareholders . . . . . . . . . . . . $2,445 $ 600 $ 183
Weighted average shares outstanding . . . . . . . . . . . . . . . . . . . . . . . . . . . 268 246 245
Earnings per common share — basic . . . . . . . . . . . . . . . . . . . . . . . . . . . . $ 9.13 $2.44 $0.75
Earnings per share — diluted:
Goodyear net income . . . . . . . . . . . . . . . . . . . . . . . . . . . . . . . . . . . . . . . . $2,452 $ 629 $ 212
Less: Preferred stock dividends . . . . . . . . . . . . . . . . . . . . . . . . . . . . . . . . — — 29
Goodyear net income available to common shareholders . . . . . . . . . . . . $2,452 $ 629 $ 183
Weighted average shares outstanding . . . . . . . . . . . . . . . . . . . . . . . . . . . 268 246 245
Dilutive effect of mandatory convertible preferred stock . . . . . . . . . . . . 7 28 —
Dilutive effect of stock options and other dilutive securities . . . . . . . . . . 4 3 2
Weighted average shares outstanding — diluted . . . . . . . . . . . . . . . . . . . 279 277 247
Earnings per common share — diluted . . . . . . . . . . . . . . . . . . . . . . . . . . $ 8.78 $2.28 $0.74
On April 1, 2014, all outstanding shares of mandatory convertible preferred stock automatically converted into27,573,735 shares of common stock, net of fractional shares, at a conversion rate of 2.7574 shares of commonstock per share of preferred stock.
Weighted average shares outstanding — diluted for the year ended December 31, 2012 excludes the effect ofapproximately 34 million equivalent shares related to the mandatory convertible preferred stock as their inclusionwould have been anti-dilutive. In addition, Goodyear net income used to compute earnings per share — dilutedfor the year ended December 31, 2012 is reduced by $29 million of preferred stock dividends since the inclusionof the related shares of preferred stock would have been anti-dilutive.
Weighted average shares outstanding — diluted for 2014, 2013 and 2012 excludes approximately 2 million,3 million and 11 million equivalent shares, respectively, related to options with exercise prices greater than theaverage market price of our common stock (i.e., “underwater” options).
Note 7. Business Segments
Segment information reflects our strategic business units (“SBUs”), which are organized to meet customerrequirements and global competition. We operate our business through four operating segments representing ourregional tire businesses: North America; Europe, Middle East and Africa; Latin America; and Asia Pacific.Segment information is reported on the basis used for reporting to our Chief Executive Officer. Each of the fourregional business segments is involved in the development, manufacture, distribution and sale of tires. Certain ofthe business segments also provide related products and services, which include retreads, automotive andcommercial truck repair services and merchandise purchased for resale. Each segment also exports tires to othersegments.
North America manufactures and sells tires for automobiles, trucks, motorcycles, buses, earthmoving and miningequipment, commercial and military aviation, and industrial equipment in the United States and Canada. North
63

THE GOODYEAR TIRE & RUBBER COMPANY AND SUBSIDIARIES
America also provides related products and services including retread tires, tread rubber, automotive andcommercial truck maintenance and repair services, as well as sells chemical and natural rubber products to ourother business segments and to unaffiliated customers.
Europe, Middle East and Africa manufactures and sells tires for automobiles, trucks, motorcycles andconstruction equipment throughout Europe, the Middle East and Africa. EMEA also sells new and retreadedaviation tires, retreading and related services for commercial truck and construction and mining equipment, andautomotive maintenance and repair services.
Latin America manufactures and sells tires for automobiles, truck and construction equipment throughout Centraland South America and in Mexico. Latin America also provides related products and services including retreadedtires and tread rubber for truck tires.
Asia Pacific manufactures and sells tires for automobiles, trucks, farm, construction and mining equipment, andthe aviation industry throughout the Asia Pacific region. Asia Pacific also provides related products and servicesincluding retreaded truck and aviation tires, tread rubber, and automotive maintenance and repair services.
The following table presents segment sales and operating income, and the reconciliation of segment operatingincome to Income before Income Taxes:
(In millions) 2014 2013 2012
SalesNorth America . . . . . . . . . . . . . . . . . . . . . . . . . . . . . . . . . . . . . . . . . . . . . . . . . . . $ 8,085 $ 8,684 $ 9,666Europe, Middle East and Africa . . . . . . . . . . . . . . . . . . . . . . . . . . . . . . . . . . . . . . 6,180 6,567 6,884Latin America . . . . . . . . . . . . . . . . . . . . . . . . . . . . . . . . . . . . . . . . . . . . . . . . . . . . 1,796 2,063 2,085Asia Pacific . . . . . . . . . . . . . . . . . . . . . . . . . . . . . . . . . . . . . . . . . . . . . . . . . . . . . 2,077 2,226 2,357
Net Sales . . . . . . . . . . . . . . . . . . . . . . . . . . . . . . . . . . . . . . . . . . . . . . . . . . . . . $18,138 $19,540 $20,992
Segment Operating IncomeNorth America . . . . . . . . . . . . . . . . . . . . . . . . . . . . . . . . . . . . . . . . . . . . . . . . . . . $ 803 $ 691 $ 514Europe, Middle East and Africa . . . . . . . . . . . . . . . . . . . . . . . . . . . . . . . . . . . . . . 438 298 252Latin America . . . . . . . . . . . . . . . . . . . . . . . . . . . . . . . . . . . . . . . . . . . . . . . . . . . . 170 283 223Asia Pacific . . . . . . . . . . . . . . . . . . . . . . . . . . . . . . . . . . . . . . . . . . . . . . . . . . . . . 301 308 259
Total Segment Operating Income . . . . . . . . . . . . . . . . . . . . . . . . . . . . . . . . . 1,712 1,580 1,248Less:Rationalizations . . . . . . . . . . . . . . . . . . . . . . . . . . . . . . . . . . . . . . . . . . . . . . . . . . 95 58 175Interest expense . . . . . . . . . . . . . . . . . . . . . . . . . . . . . . . . . . . . . . . . . . . . . . . . . . 428 392 357Other expense . . . . . . . . . . . . . . . . . . . . . . . . . . . . . . . . . . . . . . . . . . . . . . . . . . . . 302 97 139Asset write-offs and accelerated depreciation . . . . . . . . . . . . . . . . . . . . . . . . . . . 7 23 20Corporate incentive compensation plans . . . . . . . . . . . . . . . . . . . . . . . . . . . . . . . 97 108 69Corporate pension curtailments/settlements . . . . . . . . . . . . . . . . . . . . . . . . . . . . 33 — 1Intercompany profit elimination . . . . . . . . . . . . . . . . . . . . . . . . . . . . . . . . . . . . . (4) (4) (1)Retained expenses of divested operations . . . . . . . . . . . . . . . . . . . . . . . . . . . . . . 16 24 14Other(1) . . . . . . . . . . . . . . . . . . . . . . . . . . . . . . . . . . . . . . . . . . . . . . . . . . . . . . . . 51 69 34
Income before Income Taxes . . . . . . . . . . . . . . . . . . . . . . . . . . . . . . . . . . . . . $ 687 $ 813 $ 440
(1) For the years ended December 31, 2014, 2013, and 2012, Other includes the elimination of $24 million, $39million, and $26 million, respectively, of royalty income attributable to the strategic business units. In 2012,we negotiated a waiver of certain performance obligations under an offtake agreement for tires andrecognized a $24 million reduction in CGS. The benefit was recognized in Corporate, which is excludedfrom segment operating income, and included in Other above.
64

THE GOODYEAR TIRE & RUBBER COMPANY AND SUBSIDIARIES
Substantially all of the pension curtailment charges of $33 million for the year ended December 31, 2014 notedabove related to our North America SBU; however, such costs were not included in North America segmentoperating income for purposes of management’s assessment of SBU operating performance.
The following table presents segment assets at December 31:
(In millions) 2014 2013 2012
AssetsNorth America . . . . . . . . . . . . . . . . . . . . . . . . . . . . . . . . . . . . . . . . $ 4,929 $ 4,979 $ 5,170
Europe, Middle East and Africa . . . . . . . . . . . . . . . . . . . . . . . . . . . 4,996 5,559 5,415
Latin America . . . . . . . . . . . . . . . . . . . . . . . . . . . . . . . . . . . . . . . . . 2,104 2,402 2,367
Asia Pacific . . . . . . . . . . . . . . . . . . . . . . . . . . . . . . . . . . . . . . . . . . 2,603 2,624 2,601
Total Segment Assets . . . . . . . . . . . . . . . . . . . . . . . . . . . . . . . . 14,632 15,564 15,553
Corporate(1) . . . . . . . . . . . . . . . . . . . . . . . . . . . . . . . . . . . . . . . . . . 3,477 1,963 1,420
$18,109 $17,527 $16,973
(1) Corporate includes substantially all of our U.S. net deferred tax assets. Corporate assets have increased by$2,084 million due primarily to the release of substantially all of the valuation allowance on our net U.S.deferred tax assets.
Results of operations are measured based on net sales to unaffiliated customers and segment operating income.Each segment exports tires to other segments. The financial results of each segment exclude sales of tiresexported to other segments, but include operating income derived from such transactions. Segment operatingincome is computed as follows: Net sales less CGS (excluding asset write-offs and accelerated depreciationcharges) and SAG (including certain allocated corporate administrative expenses). Segment operating incomealso includes certain royalties and equity in earnings of most affiliates. Segment operating income does notinclude net rationalization charges, asset sales and certain other items.
The following table presents geographic information. Net sales by country were determined based on the locationof the selling subsidiary. Long-lived assets consisted of property, plant and equipment. Besides Germany,management did not consider the net sales of any other individual countries outside the United States to besignificant to the consolidated financial statements. For long-lived assets only China and Germany wereconsidered to be significant.
(In millions) 2014 2013 2012
Net SalesUnited States . . . . . . . . . . . . . . . . . . . . . . . . . . . . . . . . . . . . . . . . . $ 7,558 $ 7,820 $ 8,416
Germany . . . . . . . . . . . . . . . . . . . . . . . . . . . . . . . . . . . . . . . . . . . . . 2,288 2,372 2,541
Other international . . . . . . . . . . . . . . . . . . . . . . . . . . . . . . . . . . . . . 8,292 9,348 10,035
$18,138 $19,540 $20,992
Long-Lived AssetsUnited States . . . . . . . . . . . . . . . . . . . . . . . . . . . . . . . . . . . . . . . . . $ 2,464 $ 2,389 $ 2,424
China . . . . . . . . . . . . . . . . . . . . . . . . . . . . . . . . . . . . . . . . . . . . . . . 809 821 796
Germany . . . . . . . . . . . . . . . . . . . . . . . . . . . . . . . . . . . . . . . . . . . . . 833 891 788
Other international . . . . . . . . . . . . . . . . . . . . . . . . . . . . . . . . . . . . . 3,047 3,219 2,948
$ 7,153 $ 7,320 $ 6,956
65

THE GOODYEAR TIRE & RUBBER COMPANY AND SUBSIDIARIES
At December 31, 2014, significant concentrations of cash and cash equivalents held by our internationalsubsidiaries included the following amounts:
• $517 million or 24% in Europe, Middle East and Africa, primarily Belgium ($696 million or 23% atDecember 31, 2013),
• $462 million or 21% in Asia, primarily China, India and Australia ($334 million or 11%), and
• $409 million or 19% in Latin America, primarily Venezuela and Brazil ($603 million or 20%).
Rationalizations, as described in Note 2, Costs Associated with Rationalization Programs, Net (gains) losses onasset sales, as described in Note 4, Other Expense, and Asset write-offs and accelerated depreciation were notcharged (credited) to the SBUs for performance evaluation purposes but were attributable to the SBUs asfollows:
(In millions) 2014 2013 2012
RationalizationsNorth America . . . . . . . . . . . . . . . . . . . . . . . . . . . . . . . . . . . . . . . . . . . . . . . . . $ (6) $12 $ 43
Europe, Middle East and Africa . . . . . . . . . . . . . . . . . . . . . . . . . . . . . . . . . . . . 89 26 100
Latin America . . . . . . . . . . . . . . . . . . . . . . . . . . . . . . . . . . . . . . . . . . . . . . . . . . 3 4 6
Asia Pacific . . . . . . . . . . . . . . . . . . . . . . . . . . . . . . . . . . . . . . . . . . . . . . . . . . . . 9 16 26
Total Segment Rationalizations . . . . . . . . . . . . . . . . . . . . . . . . . . . . . . . . $95 $58 $175
(In millions) 2014 2013 2012
Net (Gains) Losses on Asset SalesNorth America . . . . . . . . . . . . . . . . . . . . . . . . . . . . . . . . . . . . . . . . . . . . . . . . . . $ (8) $ (4) $ (9)
Europe, Middle East and Africa . . . . . . . . . . . . . . . . . . . . . . . . . . . . . . . . . . . . 7 (1) (9)
Latin America . . . . . . . . . . . . . . . . . . . . . . . . . . . . . . . . . . . . . . . . . . . . . . . . . . — (1) (4)
Asia Pacific . . . . . . . . . . . . . . . . . . . . . . . . . . . . . . . . . . . . . . . . . . . . . . . . . . . . — (2) (1)
Total Segment Asset Sales . . . . . . . . . . . . . . . . . . . . . . . . . . . . . . . . . . . . . (1) (8) (23)
Corporate . . . . . . . . . . . . . . . . . . . . . . . . . . . . . . . . . . . . . . . . . . . . . . . . . . . . . . (2) — (2)
$ (3) $ (8) $(25)
(In millions) 2014 2013 2012
Asset Write-offs and Accelerated DepreciationNorth America . . . . . . . . . . . . . . . . . . . . . . . . . . . . . . . . . . . . . . . . . . . . . . . . . . $— $— $ 1
Europe, Middle East and Africa . . . . . . . . . . . . . . . . . . . . . . . . . . . . . . . . . . . . . 7 23 —
Asia Pacific . . . . . . . . . . . . . . . . . . . . . . . . . . . . . . . . . . . . . . . . . . . . . . . . . . . . — — 19
Total Segment Asset Write-offs and Accelerated Depreciation . . . . . . . $ 7 $23 $20
66

THE GOODYEAR TIRE & RUBBER COMPANY AND SUBSIDIARIES
The following tables present segment capital expenditures, depreciation and amortization:
(In millions) 2014 2013 2012
Capital ExpendituresNorth America . . . . . . . . . . . . . . . . . . . . . . . . . . . . . . . . . . . . . . . . . . . . . $282 $ 262 $ 212
Europe, Middle East and Africa . . . . . . . . . . . . . . . . . . . . . . . . . . . . . . . 266 332 344
Latin America . . . . . . . . . . . . . . . . . . . . . . . . . . . . . . . . . . . . . . . . . . . . . 152 243 250
Asia Pacific . . . . . . . . . . . . . . . . . . . . . . . . . . . . . . . . . . . . . . . . . . . . . . . 154 257 286
Total Segment Capital Expenditures . . . . . . . . . . . . . . . . . . . . . . . . 854 1,094 1,092
Corporate . . . . . . . . . . . . . . . . . . . . . . . . . . . . . . . . . . . . . . . . . . . . . . . . . 69 74 35
$923 $1,168 $1,127
(In millions) 2014 2013 2012
Depreciation and AmortizationNorth America . . . . . . . . . . . . . . . . . . . . . . . . . . . . . . . . . . . . . . . . . . . . . . . . $274 $275 $275Europe, Middle East and Africa . . . . . . . . . . . . . . . . . . . . . . . . . . . . . . . . . . 220 228 215Latin America . . . . . . . . . . . . . . . . . . . . . . . . . . . . . . . . . . . . . . . . . . . . . . . . 102 84 72Asia Pacific . . . . . . . . . . . . . . . . . . . . . . . . . . . . . . . . . . . . . . . . . . . . . . . . . . 105 93 89
Total Segment Depreciation and Amortization . . . . . . . . . . . . . . . . . . 701 680 651Corporate . . . . . . . . . . . . . . . . . . . . . . . . . . . . . . . . . . . . . . . . . . . . . . . . . . . . 31 42 36
$732 $722 $687
The following table presents segment equity in the net income of investees accounted for by the equity method:
(In millions) 2014 2013 2012
Equity in (Income)North America . . . . . . . . . . . . . . . . . . . . . . . . . . . . . . . . . . . . . . . . . . . . . . . . . $ (5) $ (8) $ (6)
Asia Pacific . . . . . . . . . . . . . . . . . . . . . . . . . . . . . . . . . . . . . . . . . . . . . . . . . . . (23) (23) (28)
Total Segment Equity in (Income) . . . . . . . . . . . . . . . . . . . . . . . . . . . . . . $(28) $(31) $(34)
Note 8. Accounts Receivable
(In millions) 2014 2013
Accounts receivable . . . . . . . . . . . . . . . . . . . . . . . . . . . . . . . . . . . . . . . . . . . . . . . . . $2,215 $2,534Allowance for doubtful accounts . . . . . . . . . . . . . . . . . . . . . . . . . . . . . . . . . . . . . . . (89) (99)
$2,126 $2,435
Note 9. Inventories
(In millions) 2014 2013
Raw materials . . . . . . . . . . . . . . . . . . . . . . . . . . . . . . . . . . . . . . . . . . . . . . . . . . . . . . $ 535 $ 592Work in process . . . . . . . . . . . . . . . . . . . . . . . . . . . . . . . . . . . . . . . . . . . . . . . . . . . . . 149 164Finished goods . . . . . . . . . . . . . . . . . . . . . . . . . . . . . . . . . . . . . . . . . . . . . . . . . . . . . . 1,987 2,060
$2,671 $2,816
67

THE GOODYEAR TIRE & RUBBER COMPANY AND SUBSIDIARIES
Note 10. Goodwill and Intangible Assets
The following table presents the net carrying amount of goodwill allocated by reporting unit, and changes during2014:
(In millions)
Balance atDecember 31,
2013 Divestitures Translation
Balance atDecember 31,
2014
North America . . . . . . . . . . . . . . . . . . . . . . . . $ 93 $— $ — $ 93
Europe, Middle East and Africa . . . . . . . . . . 511 — (63) 448
Asia Pacific . . . . . . . . . . . . . . . . . . . . . . . . . . 64 — (4) 60
$668 $— $(67) $601
The following table presents the net carrying amount of goodwill allocated by reporting unit, and changes during2013:
(In millions)
Balance atDecember 31,
2012 Divestitures Translation
Balance atDecember 31,
2013
North America . . . . . . . . . . . . . . . . . . . . . . . . $ 93 $— $ — $ 93
Europe, Middle East and Africa . . . . . . . . . . 497 (1) 15 511
Asia Pacific . . . . . . . . . . . . . . . . . . . . . . . . . . 74 — (10) 64
$664 $ (1) $ 5 $668
The following table presents information about intangible assets:
2014 2013
(In millions)
GrossCarrying
Amount(1)Accumulated
Amortization(1)
NetCarryingAmount
GrossCarrying
Amount(1)Accumulated
Amortization(1)
NetCarryingAmount
Intangible assets with indefinite lives . . . . $127 $ (6) $121 $128 $ (6) $122
Trademarks and patents . . . . . . . . . . . . . . . 15 (10) 5 17 (10) 7
Other intangible assets . . . . . . . . . . . . . . . . 21 (9) 12 22 (13) 9
$163 $(25) $138 $167 $(29) $138
(1) Includes impact of foreign currency translation.
Intangible assets primarily comprise the right to use certain brand names and trademarks on a non-competitivebasis related to our global alliance with Sumitomo Rubber Industries, Ltd.
Amortization expense for intangible assets totaled $2 million, $3 million and $3 million in 2014, 2013 and 2012,respectively. We estimate that annual amortization expense related to intangible assets will be approximately $1million in 2015 through 2019, and the weighted average remaining amortization period is approximately 30years.
Our annual impairment analyses for 2014, 2013 and 2012 indicated no impairment of goodwill or intangibleassets with indefinite lives. In addition, there were no events or circumstances that indicated the impairment testshould be re-performed for goodwill or for intangible assets with indefinite lives for any segment atDecember 31, 2014.
68
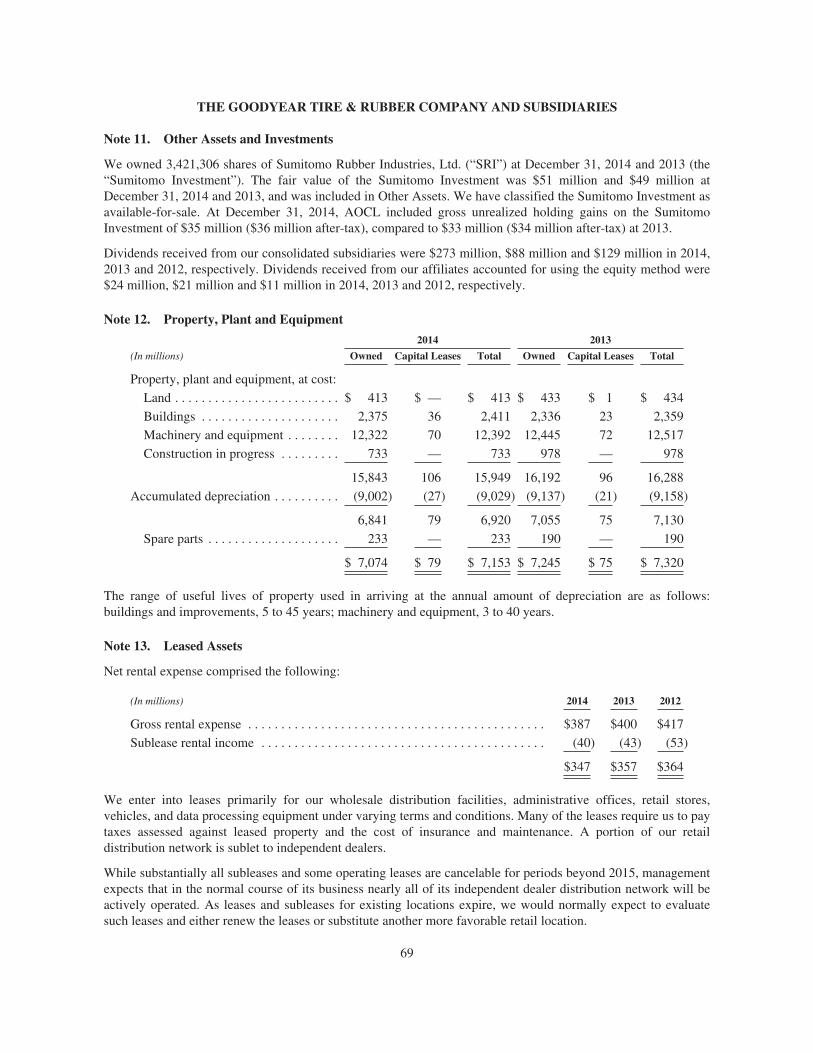
THE GOODYEAR TIRE & RUBBER COMPANY AND SUBSIDIARIES
Note 11. Other Assets and Investments
We owned 3,421,306 shares of Sumitomo Rubber Industries, Ltd. (“SRI”) at December 31, 2014 and 2013 (the“Sumitomo Investment”). The fair value of the Sumitomo Investment was $51 million and $49 million atDecember 31, 2014 and 2013, and was included in Other Assets. We have classified the Sumitomo Investment asavailable-for-sale. At December 31, 2014, AOCL included gross unrealized holding gains on the SumitomoInvestment of $35 million ($36 million after-tax), compared to $33 million ($34 million after-tax) at 2013.
Dividends received from our consolidated subsidiaries were $273 million, $88 million and $129 million in 2014,2013 and 2012, respectively. Dividends received from our affiliates accounted for using the equity method were$24 million, $21 million and $11 million in 2014, 2013 and 2012, respectively.
Note 12. Property, Plant and Equipment
2014 2013
(In millions) Owned Capital Leases Total Owned Capital Leases Total
Property, plant and equipment, at cost:
Land . . . . . . . . . . . . . . . . . . . . . . . . . $ 413 $ — $ 413 $ 433 $ 1 $ 434
Buildings . . . . . . . . . . . . . . . . . . . . . 2,375 36 2,411 2,336 23 2,359
Machinery and equipment . . . . . . . . 12,322 70 12,392 12,445 72 12,517
Construction in progress . . . . . . . . . 733 — 733 978 — 978
15,843 106 15,949 16,192 96 16,288
Accumulated depreciation . . . . . . . . . . (9,002) (27) (9,029) (9,137) (21) (9,158)
6,841 79 6,920 7,055 75 7,130
Spare parts . . . . . . . . . . . . . . . . . . . . 233 — 233 190 — 190
$ 7,074 $ 79 $ 7,153 $ 7,245 $ 75 $ 7,320
The range of useful lives of property used in arriving at the annual amount of depreciation are as follows:buildings and improvements, 5 to 45 years; machinery and equipment, 3 to 40 years.
Note 13. Leased Assets
Net rental expense comprised the following:
(In millions) 2014 2013 2012
Gross rental expense . . . . . . . . . . . . . . . . . . . . . . . . . . . . . . . . . . . . . . . . . . . . . $387 $400 $417
Sublease rental income . . . . . . . . . . . . . . . . . . . . . . . . . . . . . . . . . . . . . . . . . . . (40) (43) (53)
$347 $357 $364
We enter into leases primarily for our wholesale distribution facilities, administrative offices, retail stores,vehicles, and data processing equipment under varying terms and conditions. Many of the leases require us to paytaxes assessed against leased property and the cost of insurance and maintenance. A portion of our retaildistribution network is sublet to independent dealers.
While substantially all subleases and some operating leases are cancelable for periods beyond 2015, managementexpects that in the normal course of its business nearly all of its independent dealer distribution network will beactively operated. As leases and subleases for existing locations expire, we would normally expect to evaluatesuch leases and either renew the leases or substitute another more favorable retail location.
69

THE GOODYEAR TIRE & RUBBER COMPANY AND SUBSIDIARIES
The following table presents minimum future lease payments:
(In millions) 2015 2016 2017 2018 20192020 andBeyond Total
Capital LeasesMinimum lease payments . . . . . . . . . . . . . . . . . . . . . . . $ 14 $ 12 $ 10 $ 8 $ 5 $ 48 $ 97
Imputed interest . . . . . . . . . . . . . . . . . . . . . . . . . . . . . . . (4) (4) (3) (3) (3) (21) (38)
Present value . . . . . . . . . . . . . . . . . . . . . . . . . . . . . . . . . $ 10 $ 8 $ 7 $ 5 $ 2 $ 27 $ 59
Operating LeasesMinimum lease payments . . . . . . . . . . . . . . . . . . . . . . . $307 $233 $178 $128 $98 $322 $1,266
Minimum sublease rentals . . . . . . . . . . . . . . . . . . . . . . . (32) (24) (14) (7) (3) (9) (89)
$275 $209 $164 $121 $95 $313 $1,177
Imputed interest . . . . . . . . . . . . . . . . . . . . . . . . . . . . . . . . . (227)
Present value . . . . . . . . . . . . . . . . . . . . . . . . . . . . . . . . . . . $ 950
Note 14. Financing Arrangements and Derivative Financial Instruments
At December 31, 2014, we had total credit arrangements of $9,029 million, of which $2,317 million wereunused. At that date, 35% of our debt was at variable interest rates averaging 5.72%.
Notes Payable and Overdrafts, Long Term Debt and Capital Leases due Within One Year and Short TermFinancing Arrangements
At December 31, 2014, we had short term committed and uncommitted credit arrangements totaling $447million, of which $417 million were unused. These arrangements are available primarily to certain of our foreignsubsidiaries through various banks at quoted market interest rates.
The following table presents amounts due within one year:
(In millions)December 31,
2014December 31,
2013
Notes payable and overdrafts: . . . . . . . . . . . . . . . . . . . . . . . . . . . . . . . . $ 30 $ 14
Weighted average interest rate . . . . . . . . . . . . . . . . . . . . . . . . . . . . . . . . 10.63% 3.40%
Long term debt and capital leases due within one year:Other domestic and foreign debt (including capital leases) . . . . . . . . . . $ 148 $ 73
Weighted average interest rate . . . . . . . . . . . . . . . . . . . . . . . . . . . . . . . . 7.75% 6.91%
Total obligations due within one year . . . . . . . . . . . . . . . . . . . . . . . . . . $ 178 $ 87
Long Term Debt and Capital Leases and Financing Arrangements
At December 31, 2014, we had long term credit arrangements totaling $8,582 million, of which $1,900 millionwere unused.
70

THE GOODYEAR TIRE & RUBBER COMPANY AND SUBSIDIARIES
The following table presents long term debt and capital leases, net of unamortized discounts, and interest rates:
December 31, 2014 December 31, 2013
InterestRate
InterestRate(In millions) Amount Amount
Notes:
6.75% Euro Notes due 2019 . . . . . . . . . . . . . . . . . . . . . . . . $ 303 $ 344
8.25% due 2020 . . . . . . . . . . . . . . . . . . . . . . . . . . . . . . . . . . 996 995
8.75% due 2020 . . . . . . . . . . . . . . . . . . . . . . . . . . . . . . . . . . 269 267
6.5% due 2021 . . . . . . . . . . . . . . . . . . . . . . . . . . . . . . . . . . . 900 900
7% due 2022 . . . . . . . . . . . . . . . . . . . . . . . . . . . . . . . . . . . . 700 700
7% due 2028 . . . . . . . . . . . . . . . . . . . . . . . . . . . . . . . . . . . . 150 150
Credit Facilities:
$2.0 billion first lien revolving credit facility due 2017 . . . — — — —
$1.2 billion second lien term loan facility due 2019 . . . . . . 1,196 4.75% 1,195 4.75%
€400 million revolving credit facility due 2016 . . . . . . . . . — — — —
Pan-European accounts receivable facility . . . . . . . . . . . . . . . 343 1.54% 207 3.19%
Chinese credit facilities . . . . . . . . . . . . . . . . . . . . . . . . . . . . . . 535 5.65% 537 5.86%
Other foreign and domestic debt (1) . . . . . . . . . . . . . . . . . . . . 913 8.70% 878 8.97%
6,305 6,173
Capital lease obligations . . . . . . . . . . . . . . . . . . . . . . . . . . . . . 59 62
6,364 6,235
Less portion due within one year . . . . . . . . . . . . . . . . . . . . . . . (148) (73)
$6,216 $6,162
(1) Interest rates are weighted average interest rates related to various foreign credit facilities with customaryterms and conditions and domestic debt related to our Global and North America Headquarters.
NOTES
€250 million 6.75% Senior Notes due 2019 of Goodyear Dunlop Tires Europe B.V. (“GDTE”)
At December 31, 2014, €250 million aggregate principal amount of GDTE’s 6.75% senior notes due 2019 wereoutstanding. These notes were sold at 100% of the principal amount and will mature on April 15, 2019. Thesenotes are unsecured senior obligations of GDTE and are guaranteed, on an unsecured senior basis, by theCompany and our U.S. and Canadian subsidiaries that also guarantee our obligations under our U.S. seniorsecured credit facilities described below.
We have the option to redeem these notes, in whole or in part, at any time on or after April 15, 2015 at aredemption price of 103.375%, 101.688% and 100% during the 12-month periods commencing on April 15,2015, 2016 and 2017 and thereafter, respectively, plus accrued and unpaid interest to the redemption date. Priorto April 15, 2015, we may redeem these notes, in whole or in part, at a redemption price equal to 100% of theprincipal amount plus a make-whole premium and accrued and unpaid interest to the redemption date.
The terms of the indenture for these notes, among other things, limit the ability of the Company and certain of itssubsidiaries, including GDTE, to (i) incur additional debt or issue redeemable preferred stock, (ii) pay dividendsor make certain other restricted payments or investments, (iii) incur liens, (iv) sell assets, (v) incur restrictions onthe ability of our subsidiaries to pay dividends to us, (vi) enter into affiliate transactions, (vii) engage in sale and
71

THE GOODYEAR TIRE & RUBBER COMPANY AND SUBSIDIARIES
leaseback transactions, and (viii) consolidate, merge, sell or otherwise dispose of all or substantially all of ourassets. These covenants are subject to significant exceptions and qualifications. For example, if these notes areassigned an investment grade rating by Moody’s and Standard & Poor’s and no default has occurred or iscontinuing, certain covenants will be suspended. The indenture has customary defaults, including a cross-defaultto material indebtedness of Goodyear and our subsidiaries.
$1.0 billion 8.25% Senior Notes due 2020
At December 31, 2014, $1.0 billion aggregate principal amount of 8.25% senior notes due 2020 wereoutstanding. These notes had an effective yield of 8.349% at issuance. These notes are unsecured seniorobligations, are guaranteed by our U.S. and Canadian subsidiaries that also guarantee our obligations under ourU.S. senior secured credit facilities described below, and will mature on August 15, 2020.
We have the option to redeem these notes, in whole or in part, at any time on or after August 15, 2015 at aredemption price of 104.125%, 102.75%, 101.375% and 100% during the 12-month periods commencing onAugust 15, 2015, 2016, 2017 and 2018 and thereafter, respectively, plus accrued and unpaid interest to theredemption date. Prior to August 15, 2015, we may redeem these notes, in whole or in part, at a redemption priceequal to 100% of the principal amount plus a make-whole premium and accrued and unpaid interest to theredemption date.
The indenture for these notes includes covenants that are substantially similar to those contained in the indenturegoverning our 6.75% senior notes due 2019, described above.
$282 million 8.75% Senior Notes due 2020
At December 31, 2014, $282 million aggregate principal amount of 8.75% notes due 2020 were outstanding.These notes had an effective yield of 9.20% at issuance. These notes are unsecured senior obligations, areguaranteed by our U.S. and Canadian subsidiaries that also guarantee our obligations under our U.S. seniorsecured credit facilities described below, and will mature on August 15, 2020.
We have the option to redeem these notes, in whole or in part, at any time at a redemption price equal to thegreater of 100% of the principal amount of these notes or the sum of the present values of the remainingscheduled payments on these notes, discounted using a defined treasury rate plus 50 basis points, plus in eithercase accrued and unpaid interest to the redemption date.
The terms of the indenture for these notes, among other things, limit our ability and the ability of certain of oursubsidiaries to (i) incur secured debt, (ii) engage in sale and leaseback transactions, and (iii) consolidate, merge,sell or otherwise dispose of all or substantially all of our assets. These covenants are subject to significantexceptions and qualifications.
$900 million 6.5% Senior Notes due 2021
At December 31, 2014, $900 million aggregate principal amount of 6.5% senior notes due 2021 wereoutstanding. These notes were sold at 100% of the principal amount and will mature on March 1, 2021. Thesenotes are unsecured senior obligations and are guaranteed by our U.S. and Canadian subsidiaries that alsoguarantee our obligations under our U.S. senior secured credit facilities described below.
We have the option to redeem these notes, in whole or in part, at any time on or after March 1, 2016 at aredemption price of 104.875%, 103.25%, 101.625% and 100% during the 12-month periods commencing onMarch 1, 2016, 2017, 2018 and 2019 and thereafter, respectively, plus accrued and unpaid interest to theredemption date. Prior to March 1, 2016, we may redeem these notes, in whole or in part, at a redemption priceequal to 100% of the principal amount plus a make-whole premium and accrued and unpaid interest to theredemption date. In addition, prior to March 1, 2016, we may redeem up to 35% of the original aggregateprincipal amount of these notes from the net cash proceeds of certain equity offerings at a redemption price equalto 106.5% of the principal amount plus accrued and unpaid interest to the redemption date.
72

THE GOODYEAR TIRE & RUBBER COMPANY AND SUBSIDIARIES
The indenture for these notes includes covenants that are substantially similar to those contained in the indenturegoverning our 6.75% senior notes due 2019, described above.
$700 million 7% Senior Notes due 2022
At December 31, 2014, $700 million aggregate principal amount of 7% senior notes due 2022 were outstanding.These notes were sold at 100% of the principal amount and will mature on May 15, 2022. These notes areunsecured senior obligations and are guaranteed by our U.S. and Canadian subsidiaries that also guarantee ourobligations under our U.S. senior secured credit facilities described below.
We have the option to redeem these notes, in whole or in part, at any time on or after May 15, 2017 at aredemption price of 103.5%, 102.333%, 101.167% and 100% during the 12-month periods commencing onMay 15, 2017, 2018, 2019 and 2020 and thereafter, respectively, plus accrued and unpaid interest to theredemption date. Prior to May 15, 2017, we may redeem these notes, in whole or in part, at a redemption priceequal to 100% of the principal amount plus a make-whole premium and accrued and unpaid interest to theredemption date. In addition, prior to May 15, 2015, we may redeem up to 35% of the original aggregateprincipal amount of these notes from the net cash proceeds of certain equity offerings at a redemption price equalto 107% of the principal amount plus accrued and unpaid interest to the redemption date.
The indenture for these notes includes covenants that are substantially similar to those contained in the indenturegoverning our 6.75% senior notes due 2019, described above.
$150 million 7% Senior Notes due 2028
At December 31, 2014, $150 million aggregate principal amount of our 7% notes due 2028 were outstanding.These notes are unsecured senior obligations and will mature on March 15, 2028.
We have the option to redeem these notes, in whole or in part, at any time at a redemption price equal to thegreater of 100% of the principal amount thereof or the sum of the present values of the remaining scheduledpayments thereon, discounted using a defined treasury rate plus 15 basis points, plus in either case accrued andunpaid interest to the redemption date.
The terms of the indenture for these notes, among other things, limit our ability and the ability of certain of oursubsidiaries to (i) incur secured debt, (ii) engage in sale and leaseback transactions, and (iii) consolidate, merge,sell or otherwise dispose of all or substantially all of our assets. These covenants are subject to significantexceptions and qualifications.
CREDIT FACILITIES
$2.0 billion Amended and Restated First Lien Revolving Credit Facility due 2017
Our amended and restated first lien revolving credit facility is available in the form of loans or letters of credit,with letter of credit availability limited to $800 million. Subject to the consent of the lenders whose commitmentsare to be increased, we may request that the facility be increased by up to $250 million. Loans under this facilitybear interest at LIBOR plus 150 basis points, based on our current liquidity as described below.
Our obligations under the facility are guaranteed by most of our wholly-owned U.S. and Canadian subsidiaries.Our obligations under the facility and our subsidiaries’ obligations under the related guarantees are secured byfirst priority security interests in collateral that includes, subject to certain exceptions:
• U.S. and Canadian accounts receivable and inventory;
• certain of our U.S. manufacturing facilities;
• equity interests in our U.S. subsidiaries and up to 65% of the equity interests in our directly owned foreignsubsidiaries, excluding GDTE and its subsidiaries; and
73

THE GOODYEAR TIRE & RUBBER COMPANY AND SUBSIDIARIES
• substantially all other tangible and intangible assets, including equipment, contract rights and intellectualproperty.
Availability under the facility is subject to a borrowing base, which is based on eligible accounts receivable andinventory of The Goodyear Tire & Rubber Company and certain of its U.S. and Canadian subsidiaries, afteradjusting for customary factors that are subject to modification from time to time by the administrative agent orthe majority lenders at their discretion (not to be exercised unreasonably). Modifications are based on the resultsof periodic collateral and borrowing base evaluations and appraisals. To the extent that our eligible accountsreceivable and inventory decline, our borrowing base will decrease and the availability under the facility maydecrease below $2.0 billion. In addition, if the amount of outstanding borrowings and letters of credit under thefacility exceeds the borrowing base, we are required to prepay borrowings and/or cash collateralize letters ofcredit sufficient to eliminate the excess. As of December 31, 2014, our borrowing base, and therefore ouravailability, under this facility was $485 million below the facility’s stated amount of $2.0 billion.
The facility, which matures on April 30, 2017, contains certain covenants that, among other things, limit ourability and the ability of certain of our subsidiaries to (i) incur additional debt or issue redeemable preferredstock, (ii) pay dividends or make certain other restricted payments or investments, (iii) incur liens, (iv) sell assets,(v) incur restrictions on the ability of our subsidiaries to pay dividends to us, (vi) enter into affiliate transactions,(vii) engage in sale and leaseback transactions, and (viii) consolidate, merge, sell or otherwise dispose of all orsubstantially all of our assets. These covenants are subject to significant exceptions and qualifications. Inaddition, in the event that the availability under the facility plus the aggregate amount of our Available Cash isless than $200 million, we will not be permitted to allow our ratio of EBITDA to Consolidated Interest Expenseto be less than 2.0 to 1.0 for any period of four consecutive fiscal quarters. “Available Cash,” “EBITDA” and“Consolidated Interest Expense” have the meanings given them in the facility.
The facility has customary representations and warranties including, as a condition to borrowing, that all suchrepresentations and warranties are true and correct, in all material respects, on the date of the borrowing,including representations as to no material adverse change in our financial condition since December 31, 2011.The facility also has customary defaults, including a cross-default to material indebtedness of Goodyear and oursubsidiaries.
If Available Cash (as defined in the facility) plus the availability under the facility is greater than $1.0 billion,amounts drawn under the facility will bear interest, at our option, at (i) 150 basis points over LIBOR or (ii) 50basis points over an alternative base rate (the higher of the prime rate, the federal funds rate plus 50 basis pointsor LIBOR plus 100 basis points), and undrawn amounts under the facility will be subject to an annualcommitment fee of 37.5 basis points. If Available Cash plus the availability under the facility is equal to or lessthan $1.0 billion, then amounts drawn under the facility will bear interest, at our option, at (i) 175 basis pointsover LIBOR or (ii) 75 basis points over an alternative base rate, and undrawn amounts under the facility will besubject to an annual commitment fee of 25 basis points.
At December 31, 2014, we had no borrowings and $377 million of letters of credit issued under the revolvingcredit facility. At December 31, 2013, we had no borrowings and $375 million of letters of credit issued underthe revolving credit facility.
$1.2 billion Amended and Restated Second Lien Term Loan Facility due 2019
Our amended and restated second lien term loan facility may be increased by up to $300 million at our request,subject to the consent of the lenders making such additional term loans. The term loan bears interest at LIBORplus 375 basis points, subject to a minimum LIBOR rate of 100 basis points. Our obligations under this facilityare guaranteed by most of our wholly-owned U.S. and Canadian subsidiaries and are secured by second prioritysecurity interests in the same collateral securing the $2.0 billion first lien revolving credit facility.
The facility, which matures on April 30, 2019, contains covenants, representations, warranties and defaultssimilar to those in the $2.0 billion first lien revolving credit facility. In addition, if our Pro Forma Senior Secured
74

THE GOODYEAR TIRE & RUBBER COMPANY AND SUBSIDIARIES
Leverage Ratio (the ratio of Consolidated Net Secured Indebtedness to EBITDA) for any period of fourconsecutive fiscal quarters is greater than 3.0 to 1.0, before we may use cash proceeds from certain asset sales torepay any junior lien, senior unsecured or subordinated indebtedness, we must first offer to use such cashproceeds to prepay borrowings under the second lien term loan facility. “Pro Forma Senior Secured LeverageRatio,” “Consolidated Net Secured Indebtedness” and “EBITDA” have the meanings given them in the facility.Loans under this facility bear interest, at our option, at (i) 375 basis points over LIBOR (subject to a minimumLIBOR rate of 100 basis points) or (ii) 275 basis points over an alternative base rate (the higher of the prime rate,the federal funds rate plus 50 basis points or LIBOR plus 100 basis points).
At December 31, 2014 and December 31, 2013, this facility was fully drawn. On February 3, 2015, we repaid$200 million of the borrowings due under this facility.
€400 million Amended and Restated Senior Secured European Revolving Credit Facility due 2016
Our amended and restated €400 million European revolving credit facility consists of (i) a €100 million Germantranche that is available only to Goodyear Dunlop Tires Germany GmbH (the “German borrower”) and (ii) a€300 million all-borrower tranche that is available to GDTE, the German borrower and certain of GDTE’s othersubsidiaries. Up to €50 million in letters of credit are available for issuance under the all-borrower tranche.Amounts drawn under the facility will bear interest at LIBOR plus 250 basis points for loans denominated inU.S. dollars or pounds sterling and EURIBOR plus 250 basis points for loans denominated in euros, and undrawnamounts under the facility will be subject to an annual commitment fee of 50 basis points.
GDTE and certain of its subsidiaries in the United Kingdom, Luxembourg, France and Germany provideguarantees to support the facility. GDTE’s obligations under the facility and the obligations of its subsidiariesunder the related guarantees are secured by security interests in collateral that includes, subject to certainexceptions:
• the capital stock of the principal subsidiaries of GDTE; and
• a substantial portion of the tangible and intangible assets of GDTE and GDTE’s subsidiaries in the UnitedKingdom, Luxembourg, France and Germany, including certain accounts receivable, inventory, realproperty, equipment, contract rights and cash accounts, but excluding certain accounts receivable and cashaccounts in subsidiaries that are or may become parties to securitization programs.
The German guarantors secure the German tranche on a first-lien basis and the all-borrower tranche on a second-lien basis. GDTE and its other subsidiaries that provide guarantees secure the all-borrower tranche on a first-lienbasis and do not provide collateral support for the German tranche. The Company and its U.S. subsidiaries andprimary Canadian subsidiary that guarantee our U.S. senior secured credit facilities described above also provideunsecured guarantees in support of the facility.
The facility, which matures on April 20, 2016, contains covenants similar to those in our first lien revolvingcredit facility, with additional limitations applicable to GDTE and its subsidiaries. In addition, under the facility,GDTE’s ratio of Consolidated Net J.V. Indebtedness to Consolidated European J.V. EBITDA for a period of fourconsecutive fiscal quarters is not permitted to be greater than 3.0 to 1.0 at the end of any fiscal quarter.Consolidated Net J.V. Indebtedness is determined net of the sum of (1) cash and cash equivalents in excess of$100 million held by GDTE and its subsidiaries, (2) cash and cash equivalents in excess of $150 million held bythe Company and its U.S. subsidiaries and (3) availability under our first lien revolving credit facility if availableborrowings under our first lien revolving credit facility plus Available Cash (as defined thereunder) is equal to orgreater than $150 million and the conditions to borrowing thereunder are met. Consolidated Net J.V.Indebtedness also excludes loans from other consolidated Goodyear entities. “Consolidated Net J.V.Indebtedness” and “Consolidated European J.V. EBITDA” have the meanings given them in the facility.
The facility has customary representations and warranties including, as a condition to borrowing, that all suchrepresentations and warranties are true and correct, in all material respects, on the date of the borrowing,
75
THE GOODYEAR TIRE & RUBBER COMPANY AND SUBSIDIARIES
including representations as to no material adverse change in our financial condition since December 31, 2010.The facility also has customary defaults, including a cross-default to material indebtedness of Goodyear and oursubsidiaries.
At December 31, 2014 and 2013 there were no borrowings outstanding under the German and the all-borrowertranches. There were no letters of credit issued at December 31, 2014. Letters of credit issued under the all-borrower tranche totaled $5 million (€3 million) at December 31, 2013.
Accounts Receivable Securitization Facilities (On-Balance Sheet)
On September 25, 2014, GDTE and certain other of our European subsidiaries amended and restated thedefinitive agreements for our pan-European accounts receivable securitization facility. The most significantchanges to the facility were an extension of the term through 2019 and the flexibility to designate annually themaximum amount of funding available under the facility in an amount of not less than €45 million and not morethan €450 million. Until October 17, 2014, the maximum amount of the facility was €450 million, and fromOctober 17, 2014 to October 15, 2015, the designated maximum amount of the facility is €380 million.
The facility involves an ongoing daily sale of substantially all of the trade accounts receivable of certain GDTEsubsidiaries to a bankruptcy-remote French company controlled by one of the liquidity banks in the facility.These subsidiaries retain servicing responsibilities. Utilization under this facility is based on eligible receivablebalances.
The funding commitments under the facility will expire upon the earliest to occur of: (a) September 25, 2019,(b) the non-renewal and expiration (without substitution) of all of the back-up liquidity commitments, (c) theearly termination of the facility according to its terms (generally upon an Early Amortisation Event (as defined inthe facility), which includes, among other things, events similar to the events of default under our senior securedcredit facilities; certain tax law changes; or certain changes to law, regulation or accounting standards), or (d) ourrequest for early termination of the facility. The facility’s current back-up liquidity commitments will expire onOctober 15, 2015.
At December 31, 2014, the amounts available and utilized under this program totaled $343 million (€283million). At December 31, 2013, the amounts available and utilized under this program totaled $386 million(€280 million) and $207 million (€150 million), respectively. The program did not qualify for sale accounting,and accordingly, these amounts are included in Long Term Debt and Capital Leases.
In addition to the pan-European accounts receivable securitization facility discussed above, subsidiaries inAustralia have an accounts receivable securitization program that provides up to $70 million (85 millionAustralian dollars) of funding. At December 31, 2014, the amounts available and utilized under this programwere $43 million and $23 million, respectively. At December 31, 2013, the amounts available and utilized underthis program were $76 million and $18 million, respectively. The receivables sold under this program also serveas collateral for the related facility. We retain the risk of loss related to these receivables in the event of non-payment. These amounts are included in Long Term Debt and Capital Leases due Within One Year.
Accounts Receivable Factoring Facilities (Off-Balance Sheet)
Various subsidiaries sold certain of their trade receivables under off-balance sheet programs during 2014 and2013. For these programs, we have concluded that there is generally no risk of loss to us from non-payment ofthe sold receivables. At December 31, 2014 and 2013, the gross amount of receivables sold was $365 million and$301 million, respectively.
Other Foreign Credit Facilities
Our Chinese subsidiary has several financing arrangements in China. At December 31, 2014, these non-revolvingcredit facilities were fully drawn and can only be used to finance the expansion of our manufacturing facility inChina. There were $535 million and $537 million of borrowings outstanding under these facilities at
76
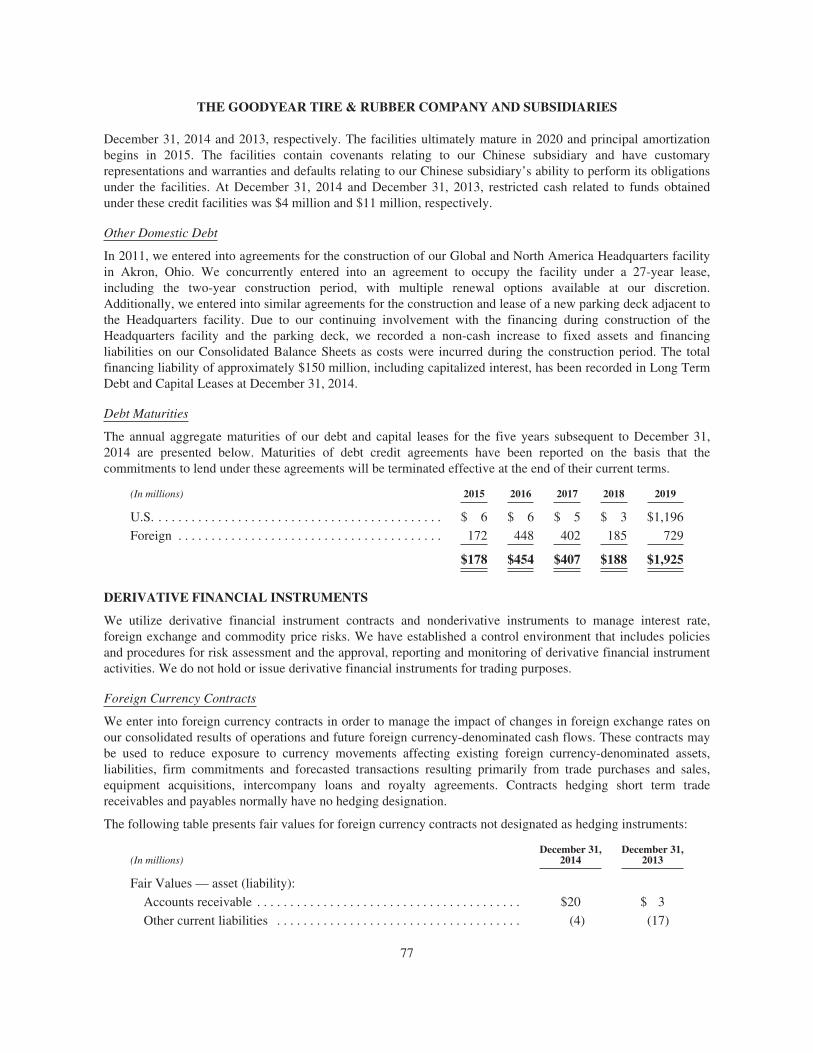
THE GOODYEAR TIRE & RUBBER COMPANY AND SUBSIDIARIES
December 31, 2014 and 2013, respectively. The facilities ultimately mature in 2020 and principal amortizationbegins in 2015. The facilities contain covenants relating to our Chinese subsidiary and have customaryrepresentations and warranties and defaults relating to our Chinese subsidiary’s ability to perform its obligationsunder the facilities. At December 31, 2014 and December 31, 2013, restricted cash related to funds obtainedunder these credit facilities was $4 million and $11 million, respectively.
Other Domestic Debt
In 2011, we entered into agreements for the construction of our Global and North America Headquarters facilityin Akron, Ohio. We concurrently entered into an agreement to occupy the facility under a 27-year lease,including the two-year construction period, with multiple renewal options available at our discretion.Additionally, we entered into similar agreements for the construction and lease of a new parking deck adjacent tothe Headquarters facility. Due to our continuing involvement with the financing during construction of theHeadquarters facility and the parking deck, we recorded a non-cash increase to fixed assets and financingliabilities on our Consolidated Balance Sheets as costs were incurred during the construction period. The totalfinancing liability of approximately $150 million, including capitalized interest, has been recorded in Long TermDebt and Capital Leases at December 31, 2014.
Debt Maturities
The annual aggregate maturities of our debt and capital leases for the five years subsequent to December 31,2014 are presented below. Maturities of debt credit agreements have been reported on the basis that thecommitments to lend under these agreements will be terminated effective at the end of their current terms.
(In millions) 2015 2016 2017 2018 2019
U.S. . . . . . . . . . . . . . . . . . . . . . . . . . . . . . . . . . . . . . . . . . . . $ 6 $ 6 $ 5 $ 3 $1,196
Foreign . . . . . . . . . . . . . . . . . . . . . . . . . . . . . . . . . . . . . . . . 172 448 402 185 729
$178 $454 $407 $188 $1,925
DERIVATIVE FINANCIAL INSTRUMENTS
We utilize derivative financial instrument contracts and nonderivative instruments to manage interest rate,foreign exchange and commodity price risks. We have established a control environment that includes policiesand procedures for risk assessment and the approval, reporting and monitoring of derivative financial instrumentactivities. We do not hold or issue derivative financial instruments for trading purposes.
Foreign Currency Contracts
We enter into foreign currency contracts in order to manage the impact of changes in foreign exchange rates onour consolidated results of operations and future foreign currency-denominated cash flows. These contracts maybe used to reduce exposure to currency movements affecting existing foreign currency-denominated assets,liabilities, firm commitments and forecasted transactions resulting primarily from trade purchases and sales,equipment acquisitions, intercompany loans and royalty agreements. Contracts hedging short term tradereceivables and payables normally have no hedging designation.
The following table presents fair values for foreign currency contracts not designated as hedging instruments:
(In millions)December 31,
2014December 31,
2013
Fair Values — asset (liability):
Accounts receivable . . . . . . . . . . . . . . . . . . . . . . . . . . . . . . . . . . . . . . . . $20 $ 3
Other current liabilities . . . . . . . . . . . . . . . . . . . . . . . . . . . . . . . . . . . . . (4) (17)
77

THE GOODYEAR TIRE & RUBBER COMPANY AND SUBSIDIARIES
At December 31, 2014 and 2013, these outstanding foreign currency derivatives had notional amounts of $878million and $1,231 million, respectively, and were primarily related to intercompany loans. Other Expenseincluded net transaction gains of $54 million and net transaction losses of $38 million in 2014 and 2013,respectively, on foreign currency derivatives. These amounts were substantially offset in Other Expense by theeffect of changing exchange rates on the underlying currency exposures.
The following table presents fair values for foreign currency contracts designated as cash flow hedginginstruments:
(In millions)December 31,
2014December 31,
2013
Fair Values — asset (liability):
Accounts receivable . . . . . . . . . . . . . . . . . . . . . . . . . . . . . . . . . . . . . . . . $10 $ 3
Other current liabilities . . . . . . . . . . . . . . . . . . . . . . . . . . . . . . . . . . . . . — (3)
At December 31, 2014 and 2013, these outstanding foreign currency derivatives had notional amounts of $157million and $171 million, respectively, and primarily related to U.S. dollar denominated intercompanytransactions.
We enter into master netting agreements with counterparties. The amounts eligible for offset under the masternetting agreements are not material and we have elected a gross presentation of foreign currency contracts in theConsolidated Balance Sheets.
The following table presents the classification of changes in fair values of foreign currency contracts designatedas cash flow hedging instruments (before tax and minority):
Year EndedDecember 31,
(In millions) (Income) Expense 2014 2013
Amounts deferred to AOCL . . . . . . . . . . . . . . . . . . . . . . . . . . . . . . . . . . . . . . . . . . . . . . . $(17) $ (2)
Amount of deferred loss (gain) reclassified from AOCL into CGS . . . . . . . . . . . . . . . . . — 2
Amounts excluded from effectiveness testing . . . . . . . . . . . . . . . . . . . . . . . . . . . . . . . . . . 1 —
The estimated net amount of the deferred gains at December 31, 2014 that is expected to be reclassified toearnings within the next twelve months is $12 million.
The counterparties to our foreign currency contracts were considered by us to be substantial and creditworthyfinancial institutions that are recognized market makers at the time we entered into those contracts. We seek tocontrol our credit exposure to these counterparties by diversifying across multiple counterparties, by settingcounterparty credit limits based on long term credit ratings and other indicators of counterparty credit risk suchas credit default swap spreads, and by monitoring the financial strength of these counterparties on a regular basis.We also enter into master netting agreements with counterparties when possible. By controlling and monitoringexposure to counterparties in this manner, we believe that we effectively manage the risk of loss due tononperformance by a counterparty. However, the inability of a counterparty to fulfill its contractual obligationsto us could have a material adverse effect on our liquidity, financial position or results of operations in the periodin which it occurs.
78
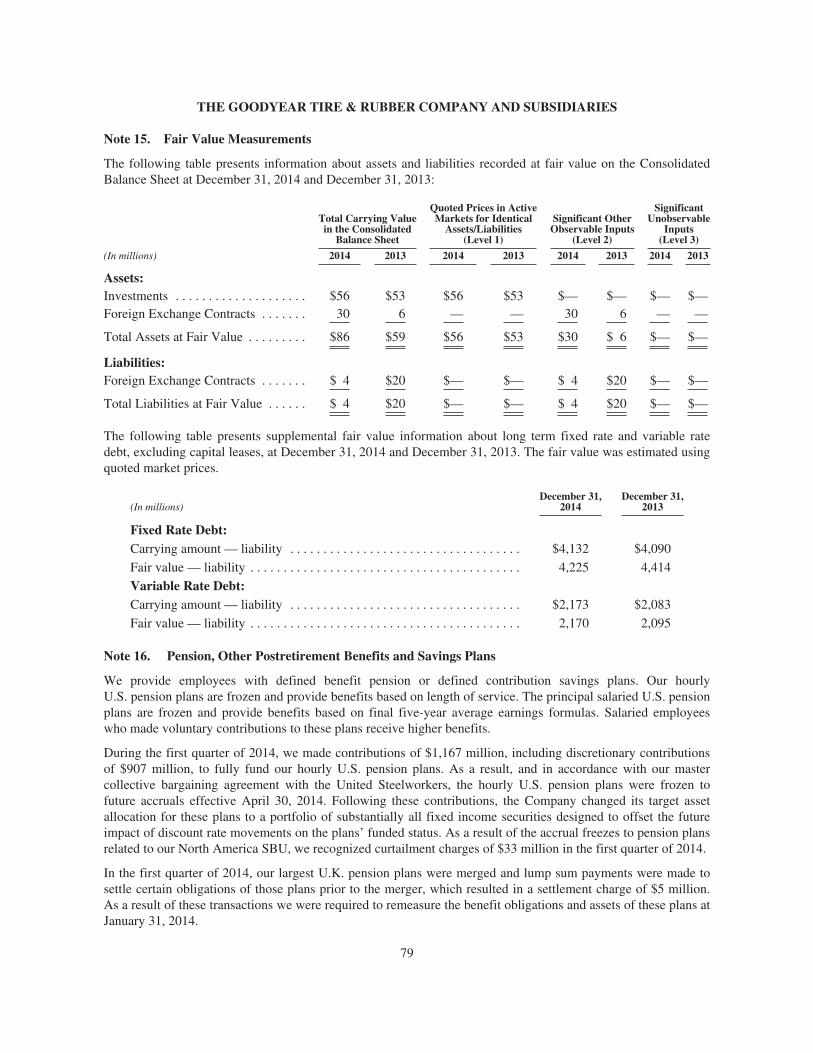
THE GOODYEAR TIRE & RUBBER COMPANY AND SUBSIDIARIES
Note 15. Fair Value Measurements
The following table presents information about assets and liabilities recorded at fair value on the ConsolidatedBalance Sheet at December 31, 2014 and December 31, 2013:
Total Carrying Valuein the Consolidated
Balance Sheet
Quoted Prices in ActiveMarkets for Identical
Assets/Liabilities(Level 1)
Significant OtherObservable Inputs
(Level 2)
SignificantUnobservable
Inputs(Level 3)
(In millions) 2014 2013 2014 2013 2014 2013 2014 2013
Assets:Investments . . . . . . . . . . . . . . . . . . . . $56 $53 $56 $53 $— $— $— $—Foreign Exchange Contracts . . . . . . . 30 6 — — 30 6 — —
Total Assets at Fair Value . . . . . . . . . $86 $59 $56 $53 $30 $ 6 $— $—
Liabilities:Foreign Exchange Contracts . . . . . . . $ 4 $20 $— $— $ 4 $20 $— $—
Total Liabilities at Fair Value . . . . . . $ 4 $20 $— $— $ 4 $20 $— $—
The following table presents supplemental fair value information about long term fixed rate and variable ratedebt, excluding capital leases, at December 31, 2014 and December 31, 2013. The fair value was estimated usingquoted market prices.
(In millions)December 31,
2014December 31,
2013
Fixed Rate Debt:Carrying amount — liability . . . . . . . . . . . . . . . . . . . . . . . . . . . . . . . . . . . $4,132 $4,090
Fair value — liability . . . . . . . . . . . . . . . . . . . . . . . . . . . . . . . . . . . . . . . . . 4,225 4,414
Variable Rate Debt:Carrying amount — liability . . . . . . . . . . . . . . . . . . . . . . . . . . . . . . . . . . . $2,173 $2,083
Fair value — liability . . . . . . . . . . . . . . . . . . . . . . . . . . . . . . . . . . . . . . . . . 2,170 2,095
Note 16. Pension, Other Postretirement Benefits and Savings Plans
We provide employees with defined benefit pension or defined contribution savings plans. Our hourlyU.S. pension plans are frozen and provide benefits based on length of service. The principal salaried U.S. pensionplans are frozen and provide benefits based on final five-year average earnings formulas. Salaried employeeswho made voluntary contributions to these plans receive higher benefits.
During the first quarter of 2014, we made contributions of $1,167 million, including discretionary contributionsof $907 million, to fully fund our hourly U.S. pension plans. As a result, and in accordance with our mastercollective bargaining agreement with the United Steelworkers, the hourly U.S. pension plans were frozen tofuture accruals effective April 30, 2014. Following these contributions, the Company changed its target assetallocation for these plans to a portfolio of substantially all fixed income securities designed to offset the futureimpact of discount rate movements on the plans’ funded status. As a result of the accrual freezes to pension plansrelated to our North America SBU, we recognized curtailment charges of $33 million in the first quarter of 2014.
In the first quarter of 2014, our largest U.K. pension plans were merged and lump sum payments were made tosettle certain obligations of those plans prior to the merger, which resulted in a settlement charge of $5 million.As a result of these transactions we were required to remeasure the benefit obligations and assets of these plans atJanuary 31, 2014.
79

THE GOODYEAR TIRE & RUBBER COMPANY AND SUBSIDIARIES
In the first quarter of 2014, we also ceased production at one of our manufacturing facilities in Amiens, Franceand recorded curtailment gains of $22 million during 2014, which is included in rationalization charges, relatedto the termination of employees at that facility who were participants in France’s retirement indemnity plan.
During the first quarter of 2013, we made $34 million of required contributions and $834 million of discretionarycontributions to fully fund our salaried U.S. pension plans. Following these contributions, the Company changedits target asset allocation for these plans to a portfolio of substantially all fixed income securities designed tooffset the future impact of discount rate movements on the plans’ funded status. As a result of the asset allocationchange, we were required to remeasure the benefit obligations and assets of the affected plans at February 28,2013.
During 2012, we recognized a settlement charge of $9 million related to the purchase of annuities from existingplan assets to settle obligations of one of our U.K. pension plans.
We also provide certain U.S. employees and employees at certain non-U.S. subsidiaries with health care benefitsor life insurance benefits upon retirement. Substantial portions of the health care benefits for U.S. salariedretirees are not insured and are funded from operations.
During 2012, we announced certain changes to our U.S. and Canadian salaried other postretirement benefit plans,primarily the elimination of coverage in 2013 for participants who are or become at least age 65 and eligible forgovernment subsidized programs.
80

THE GOODYEAR TIRE & RUBBER COMPANY AND SUBSIDIARIES
Total benefits cost and amounts recognized in other comprehensive (income) loss follows:
Pension Plans
U.S. Non-U.S. Other Postretirement Benefits
(In millions) 2014 2013 2012 2014 2013 2012 2014 2013 2012
Benefits cost:Service cost . . . . . . . . . . . . . . . . $ 15 $ 45 $ 39 $ 34 $ 39 $ 31 $ 4 $ 6 $ 6Interest cost . . . . . . . . . . . . . . . . 256 243 261 131 131 143 19 19 24Expected return on plan
assets . . . . . . . . . . . . . . . . . . . (311) (335) (299) (118) (111) (117) (1) (1) (1)Amortization of prior service
cost (credit) . . . . . . . . . . . . . . 1 17 23 1 1 2 (45) (45) (40)Amortization of net losses . . . . 114 205 179 35 50 45 8 12 11
Net periodic cost . . . . . . . . . 75 175 203 83 110 104 (15) (9) —Curtailments/settlements . . . . . . 32 — 1 (13) 4 11 — — —Termination benefits . . . . . . . . . — — — — — 1 — — —
Total benefits cost . . . . . . . . $ 107 $ 175 $ 204 $ 70 $ 114 $ 116 $(15) $ (9) $ —Recognized in other
comprehensive (income)loss before tax andminority:
Prior service (credit) cost fromplan amendments . . . . . . . . . $ (1) $ (30) $ — $ 1 $ (1) $ 6 $ — $ — $(82)
Increase (decrease) in netactuarial losses . . . . . . . . . . . 292 (374) 665 (78) (128) 372 3 (51) (4)
Amortization of prior service(cost) credit in net periodiccost . . . . . . . . . . . . . . . . . . . . (1) (17) (23) (1) (1) (2) 45 47 40
Amortization of net losses innet periodic cost . . . . . . . . . . (114) (205) (179) (36) (53) (43) (8) (13) (11)
Immediate recognition of priorservice cost andunrecognized gains andlosses due to curtailments,settlements, anddivestitures . . . . . . . . . . . . . . (32) — (1) (16) (3) (11) — — —
Total recognized in othercomprehensive loss(income) before tax andminority . . . . . . . . . . . . . . . . 144 (626) 462 (130) (186) 322 40 (17) (57)
Total recognized in totalbenefits cost and othercomprehensive loss(income) before tax andminority . . . . . . . . . . . . . . $ 251 $(451) $ 666 $ (60) $ (72) $ 438 $ 25 $(26) $(57)
Total benefits (credit) cost for our other postretirement benefits was $(24) million, $(24) million and $(17)million for our U.S. plans in 2014, 2013 and 2012, respectively, and $9 million, $15 million and $17 million forour non-U.S. plans in 2014, 2013 and 2012, respectively.
We use the fair value of our pension assets in the calculation of pension expense for substantially all of ourpension plans.
81
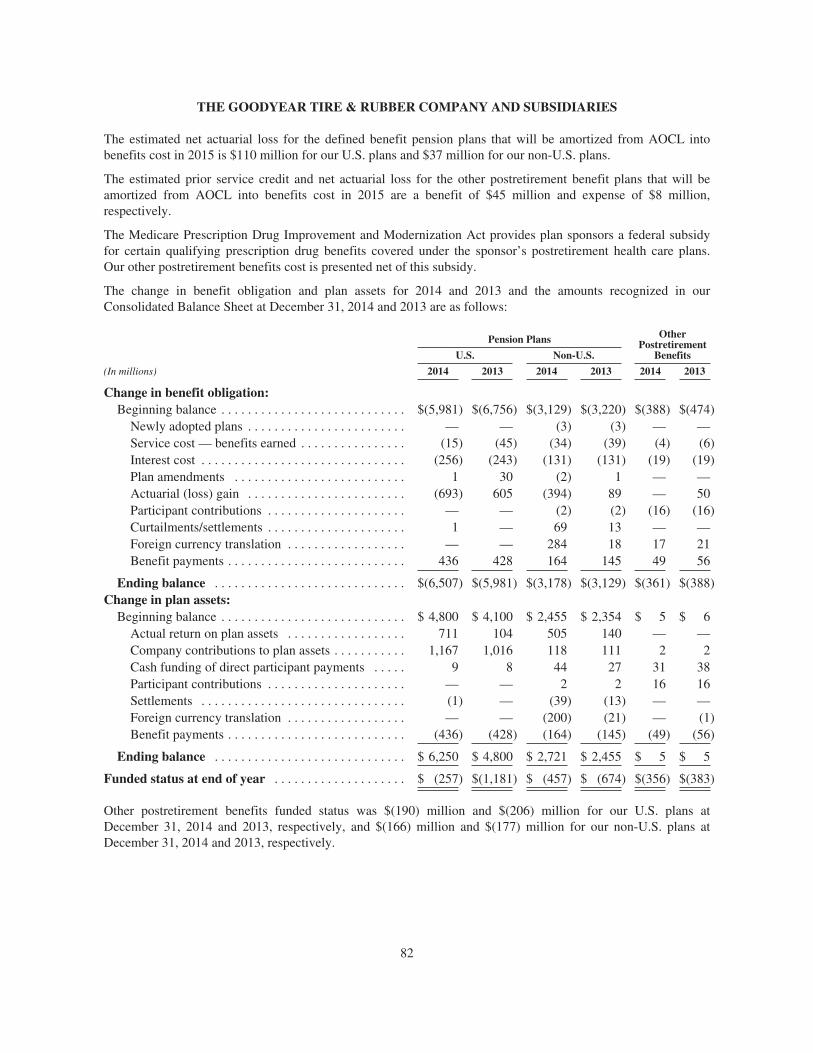
THE GOODYEAR TIRE & RUBBER COMPANY AND SUBSIDIARIES
The estimated net actuarial loss for the defined benefit pension plans that will be amortized from AOCL intobenefits cost in 2015 is $110 million for our U.S. plans and $37 million for our non-U.S. plans.
The estimated prior service credit and net actuarial loss for the other postretirement benefit plans that will beamortized from AOCL into benefits cost in 2015 are a benefit of $45 million and expense of $8 million,respectively.
The Medicare Prescription Drug Improvement and Modernization Act provides plan sponsors a federal subsidyfor certain qualifying prescription drug benefits covered under the sponsor’s postretirement health care plans.Our other postretirement benefits cost is presented net of this subsidy.
The change in benefit obligation and plan assets for 2014 and 2013 and the amounts recognized in ourConsolidated Balance Sheet at December 31, 2014 and 2013 are as follows:
Pension Plans OtherPostretirement
BenefitsU.S. Non-U.S.
(In millions) 2014 2013 2014 2013 2014 2013
Change in benefit obligation:Beginning balance . . . . . . . . . . . . . . . . . . . . . . . . . . . . $(5,981) $(6,756) $(3,129) $(3,220) $(388) $(474)
Newly adopted plans . . . . . . . . . . . . . . . . . . . . . . . . — — (3) (3) — —Service cost — benefits earned . . . . . . . . . . . . . . . . (15) (45) (34) (39) (4) (6)Interest cost . . . . . . . . . . . . . . . . . . . . . . . . . . . . . . . (256) (243) (131) (131) (19) (19)Plan amendments . . . . . . . . . . . . . . . . . . . . . . . . . . 1 30 (2) 1 — —Actuarial (loss) gain . . . . . . . . . . . . . . . . . . . . . . . . (693) 605 (394) 89 — 50Participant contributions . . . . . . . . . . . . . . . . . . . . . — — (2) (2) (16) (16)Curtailments/settlements . . . . . . . . . . . . . . . . . . . . . 1 — 69 13 — —Foreign currency translation . . . . . . . . . . . . . . . . . . — — 284 18 17 21Benefit payments . . . . . . . . . . . . . . . . . . . . . . . . . . . 436 428 164 145 49 56
Ending balance . . . . . . . . . . . . . . . . . . . . . . . . . . . . . $(6,507) $(5,981) $(3,178) $(3,129) $(361) $(388)Change in plan assets:
Beginning balance . . . . . . . . . . . . . . . . . . . . . . . . . . . . $ 4,800 $ 4,100 $ 2,455 $ 2,354 $ 5 $ 6Actual return on plan assets . . . . . . . . . . . . . . . . . . 711 104 505 140 — —Company contributions to plan assets . . . . . . . . . . . 1,167 1,016 118 111 2 2Cash funding of direct participant payments . . . . . 9 8 44 27 31 38Participant contributions . . . . . . . . . . . . . . . . . . . . . — — 2 2 16 16Settlements . . . . . . . . . . . . . . . . . . . . . . . . . . . . . . . (1) — (39) (13) — —Foreign currency translation . . . . . . . . . . . . . . . . . . — — (200) (21) — (1)Benefit payments . . . . . . . . . . . . . . . . . . . . . . . . . . . (436) (428) (164) (145) (49) (56)
Ending balance . . . . . . . . . . . . . . . . . . . . . . . . . . . . . $ 6,250 $ 4,800 $ 2,721 $ 2,455 $ 5 $ 5
Funded status at end of year . . . . . . . . . . . . . . . . . . . . $ (257) $(1,181) $ (457) $ (674) $(356) $(383)
Other postretirement benefits funded status was $(190) million and $(206) million for our U.S. plans atDecember 31, 2014 and 2013, respectively, and $(166) million and $(177) million for our non-U.S. plans atDecember 31, 2014 and 2013, respectively.
82
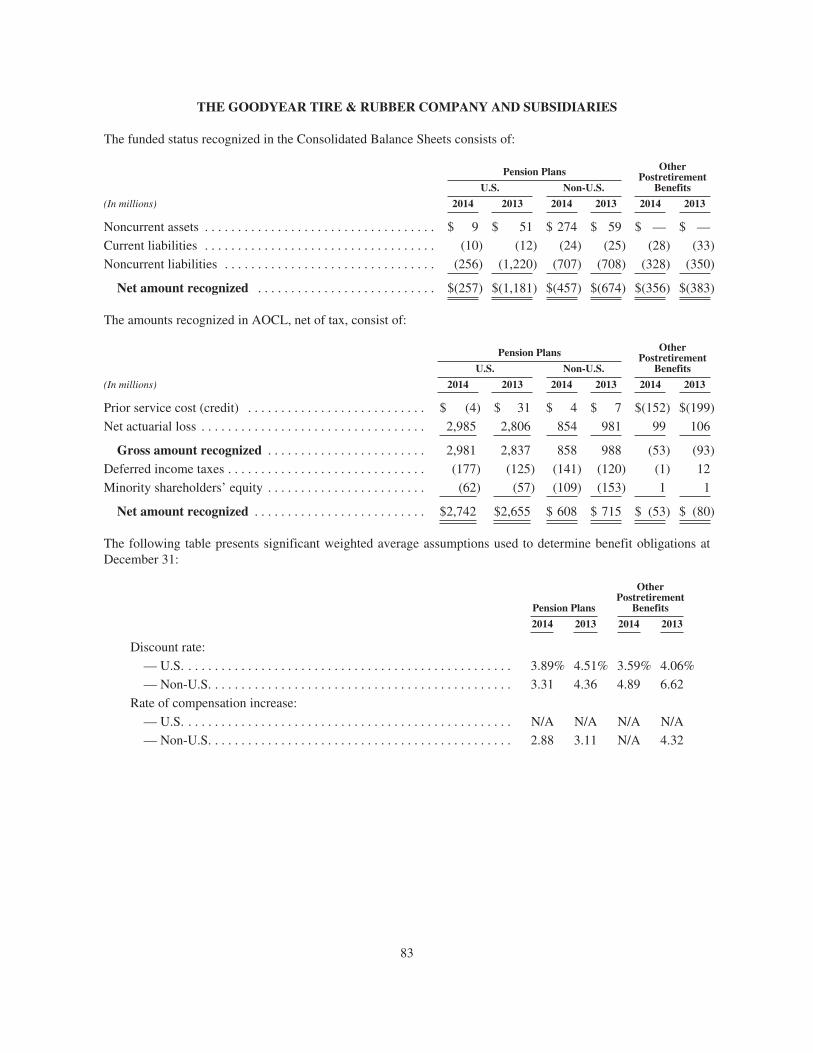
THE GOODYEAR TIRE & RUBBER COMPANY AND SUBSIDIARIES
The funded status recognized in the Consolidated Balance Sheets consists of:
Pension Plans OtherPostretirement
BenefitsU.S. Non-U.S.
(In millions) 2014 2013 2014 2013 2014 2013
Noncurrent assets . . . . . . . . . . . . . . . . . . . . . . . . . . . . . . . . . . . $ 9 $ 51 $ 274 $ 59 $ — $ —
Current liabilities . . . . . . . . . . . . . . . . . . . . . . . . . . . . . . . . . . . (10) (12) (24) (25) (28) (33)
Noncurrent liabilities . . . . . . . . . . . . . . . . . . . . . . . . . . . . . . . . (256) (1,220) (707) (708) (328) (350)
Net amount recognized . . . . . . . . . . . . . . . . . . . . . . . . . . . $(257) $(1,181) $(457) $(674) $(356) $(383)
The amounts recognized in AOCL, net of tax, consist of:
Pension Plans OtherPostretirement
BenefitsU.S. Non-U.S.
(In millions) 2014 2013 2014 2013 2014 2013
Prior service cost (credit) . . . . . . . . . . . . . . . . . . . . . . . . . . . $ (4) $ 31 $ 4 $ 7 $(152) $(199)
Net actuarial loss . . . . . . . . . . . . . . . . . . . . . . . . . . . . . . . . . . 2,985 2,806 854 981 99 106
Gross amount recognized . . . . . . . . . . . . . . . . . . . . . . . . 2,981 2,837 858 988 (53) (93)
Deferred income taxes . . . . . . . . . . . . . . . . . . . . . . . . . . . . . . (177) (125) (141) (120) (1) 12
Minority shareholders’ equity . . . . . . . . . . . . . . . . . . . . . . . . (62) (57) (109) (153) 1 1
Net amount recognized . . . . . . . . . . . . . . . . . . . . . . . . . . $2,742 $2,655 $ 608 $ 715 $ (53) $ (80)
The following table presents significant weighted average assumptions used to determine benefit obligations atDecember 31:
Pension Plans
OtherPostretirement
Benefits
2014 2013 2014 2013
Discount rate:
— U.S. . . . . . . . . . . . . . . . . . . . . . . . . . . . . . . . . . . . . . . . . . . . . . . . . . 3.89% 4.51% 3.59% 4.06%
— Non-U.S. . . . . . . . . . . . . . . . . . . . . . . . . . . . . . . . . . . . . . . . . . . . . . 3.31 4.36 4.89 6.62
Rate of compensation increase:
— U.S. . . . . . . . . . . . . . . . . . . . . . . . . . . . . . . . . . . . . . . . . . . . . . . . . . N/A N/A N/A N/A
— Non-U.S. . . . . . . . . . . . . . . . . . . . . . . . . . . . . . . . . . . . . . . . . . . . . . 2.88 3.11 N/A 4.32
83

THE GOODYEAR TIRE & RUBBER COMPANY AND SUBSIDIARIES
The following table presents significant weighted average assumptions used to determine benefits cost for theyears ended December 31:
Pension PlansOther Postretirement
Benefits
2014 2013 2012 2014 2013 2012
Discount rate:
— U.S. . . . . . . . . . . . . . . . . . . . . . . . . . . . . . . . . . . . . . . . 4.40% 3.77% 4.52% 4.06% 3.30% 3.98%
— Non-U.S. . . . . . . . . . . . . . . . . . . . . . . . . . . . . . . . . . . . 4.36 4.12 5.07 6.62 5.64 5.91
Expected long term return on plan assets:
— U.S. . . . . . . . . . . . . . . . . . . . . . . . . . . . . . . . . . . . . . . . 5.47 7.16 8.50 N/A N/A N/A
— Non-U.S. . . . . . . . . . . . . . . . . . . . . . . . . . . . . . . . . . . . 5.12 5.01 5.56 N/A N/A N/A
Rate of compensation increase:
— U.S. . . . . . . . . . . . . . . . . . . . . . . . . . . . . . . . . . . . . . . . N/A N/A N/A N/A N/A N/A
— Non-U.S. . . . . . . . . . . . . . . . . . . . . . . . . . . . . . . . . . . . 3.11 3.23 3.36 4.32 4.12 3.71
For 2014, a weighted average discount rate of 4.40% was used for the U.S. pension plans. This rate wasdeveloped from a portfolio of bonds from issuers rated AA or higher by established rating agencies as ofDecember 31, 2013 and the applicable interim remeasurement date, with cash flows similar to the timing of ourexpected benefit payment cash flows. For our non-U.S. locations, a weighted average discount rate of 4.36% wasused. This rate was developed based on the nature of the liabilities and local environments, using available bondindices, yield curves, and long term inflation.
For 2014, an assumed weighted average long term rate of return of 5.47% was used for the U.S. pension plans. Indeveloping the long term rate of return, we evaluated input from our pension fund consultant on asset class returnexpectations, including determining the appropriate rate of return for our plans, which are primarily invested infixed income securities. For our non-U.S. locations, an assumed weighted average long term rate of return of5.12% was used. Input from local pension fund consultants concerning asset class return expectations and longterm inflation form the basis of this assumption.
The U.S. pension plan mortality assumption is based on our actual historical experience. At December 31, 2014,this assumption was updated to reflect future mortality improvements based on recently published actuarialtables. For our non-U.S. locations, mortality assumptions are based on published actuarial tables which includeprojections of future mortality improvements.
The following table presents estimated future benefit payments from the plans as of December 31, 2014. Benefitpayments for other postretirement benefits are presented net of retiree contributions:
Pension Plans Other Postretirement Benefits
(In millions) U.S. Non-U.S.Without Medicare
Part D SubsidyMedicare Part DSubsidy Receipts
2015 . . . . . . . . . . . . . . . . . . . . . . . . . . . . . . . $ 458 $143 $ 31 $1
2016 . . . . . . . . . . . . . . . . . . . . . . . . . . . . . . . 447 144 28 1
2017 . . . . . . . . . . . . . . . . . . . . . . . . . . . . . . . 434 150 27 1
2018 . . . . . . . . . . . . . . . . . . . . . . . . . . . . . . . 431 157 27 1
2019 . . . . . . . . . . . . . . . . . . . . . . . . . . . . . . . 422 163 26 1
2020-2024 . . . . . . . . . . . . . . . . . . . . . . . . . . 2,032 991 124 6
84

THE GOODYEAR TIRE & RUBBER COMPANY AND SUBSIDIARIES
The following table presents selected information on our pension plans:
U.S. Non-U.S.
(In millions) 2014 2013 2014 2013
All plans:
Accumulated benefit obligation . . . . . . . . . . . . . . . . . . . . . $6,495 $5,966 $3,040 $3,008
Plans not fully-funded:
Projected benefit obligation . . . . . . . . . . . . . . . . . . . . . . . . $5,087 $4,101 $1,112 $2,106
Accumulated benefit obligation . . . . . . . . . . . . . . . . . . . . . 5,076 4,086 994 2,004
Fair value of plan assets . . . . . . . . . . . . . . . . . . . . . . . . . . . 4,822 2,869 384 1,375
Certain non-U.S. subsidiaries maintain unfunded pension plans consistent with local practices and requirements.At December 31, 2014, these plans accounted for $288 million of our accumulated pension benefit obligation,$348 million of our projected pension benefit obligation, and $132 million of our AOCL adjustment. AtDecember 31, 2013, these plans accounted for $303 million of our accumulated pension benefit obligation, $352million of our projected pension benefit obligation, and $73 million of our AOCL adjustment.
We expect to contribute approximately $50 million to $75 million to our funded non-U.S. pension plans in 2015.
Assumed health care cost trend rates at December 31 follow:
2014 2013
Health care cost trend rate assumed for the next year . . . . . . . . . . . . . . . . . . . . . . . . . . . 7.0% 7.5%
Rate to which the cost trend rate is assumed to decline (the ultimate trend rate) . . . . . . 5.0 5.0
Year that the rate reaches the ultimate trend rate . . . . . . . . . . . . . . . . . . . . . . . . . . . . . . 2022 2022
A 1% change in the assumed health care cost trend would have increased (decreased) the accumulated otherpostretirement benefits obligation at December 31, 2014 and the aggregate service and interest cost for the yearthen ended as follows:
(In millions) 1% Increase 1% Decrease
Accumulated other postretirement benefits obligation . . . . . . . . . . . . . . . . $22 $(18)
Aggregate service and interest cost . . . . . . . . . . . . . . . . . . . . . . . . . . . . . . . 2 (2)
Our pension plan weighted average investment allocation at December 31, by asset category, follows:
U.S. Non-U.S.
2014 2013 2014 2013
Cash and short term securities . . . . . . . . . . . . . . . . . . . . . . . . . . . . . . . . . . 4% 3% 1% 3%
Equity securities . . . . . . . . . . . . . . . . . . . . . . . . . . . . . . . . . . . . . . . . . . . . 6 41 15 23
Debt securities . . . . . . . . . . . . . . . . . . . . . . . . . . . . . . . . . . . . . . . . . . . . . . 90 55 73 59
Alternatives . . . . . . . . . . . . . . . . . . . . . . . . . . . . . . . . . . . . . . . . . . . . . . . . — 1 11 15
Total . . . . . . . . . . . . . . . . . . . . . . . . . . . . . . . . . . . . . . . . . . . . . . . . . . . . 100% 100% 100% 100%
Our pension investment policy recognizes the long term nature of pension liabilities, the benefits ofdiversification across asset classes and the effects of inflation. The portfolio for plans that are fully funded isdesigned to offset the future impact of discount rate movements on the funded status for those plans. Thediversified portfolio for plans that are not fully funded is designed to maximize returns consistent with levels ofliquidity and investment risk that are prudent and reasonable. All assets are managed externally according to
85
THE GOODYEAR TIRE & RUBBER COMPANY AND SUBSIDIARIES
target asset allocation guidelines we have established. Manager guidelines prohibit the use of any type ofinvestment derivative without our prior approval. Portfolio risk is controlled by having managers comply withguidelines, establishing the maximum size of any single holding in their portfolios and by using managers withdifferent investment styles. We periodically undertake asset and liability modeling studies to determine theappropriateness of the investments.
The portfolio of our U.S. pension plan assets includes holdings of global high quality and high yield fixedincome securities, short term interest bearing deposits, and private equities. The target asset allocation of ourU.S. pension plans is 94% in duration-matched fixed income securities and 6% in equity securities. ActualU.S. pension fund asset allocations are reviewed on a periodic basis and the pension funds are rebalanced totarget ranges on an as needed basis.
Prior to the funding and change in target asset allocation of our hourly U.S. pension plans in 2014, we utilizedcertain derivative instruments to reduce the short-term funded status volatility of those plans. Equity volatilitywas managed by entering into equity collars with a zero net cost at initiation. The equity collar strategy wasdesigned to limit downside risk and cap upside benefits, resulting in lower equity volatility for the hourly U.S.pension plans. As of December 31, 2013, equity collars were in place on approximately 75% of the hourly U.S.pension plans’ equity allocation of $1.8 billion and as of that date were in a liability position of $129 million.Interest rate volatility was managed by entering into short term zero cost interest rate swaptions. As ofDecember 31, 2013, interest rate swaptions were in place on approximately 55% of the hourly U.S. pensionplans’ obligation of $4.0 billion and as of that date were in a liability position of $125 million.
The portfolios of our non-U.S. pension plans include holdings of U.S. and non-U.S. equities, global high qualityand high yield fixed income securities, hedge funds, currency derivatives, insurance contracts, and short terminterest bearing deposits. The weighted average target asset allocation of the non-U.S. pension funds isapproximately 15% equities, 75% fixed income, and 10% alternative investments.
86
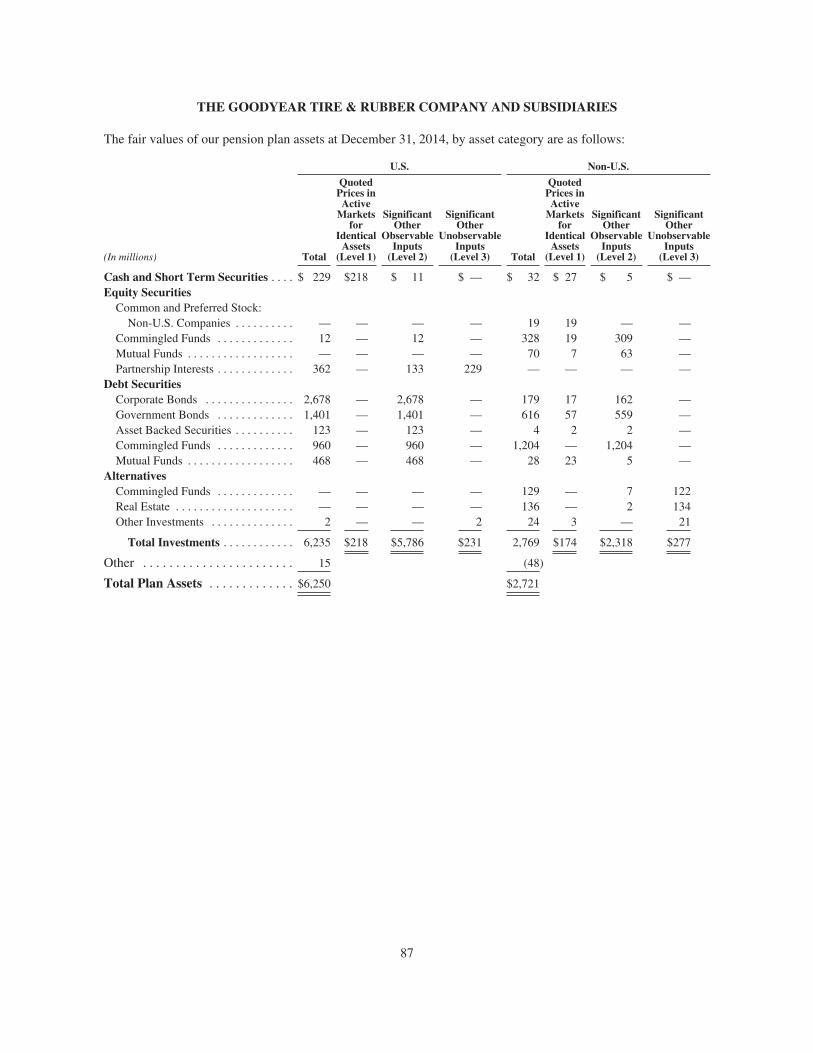
THE GOODYEAR TIRE & RUBBER COMPANY AND SUBSIDIARIES
The fair values of our pension plan assets at December 31, 2014, by asset category are as follows:
U.S. Non-U.S.
(In millions) Total
QuotedPrices inActive
Marketsfor
IdenticalAssets
(Level 1)
SignificantOther
ObservableInputs
(Level 2)
SignificantOther
UnobservableInputs
(Level 3) Total
QuotedPrices inActive
Marketsfor
IdenticalAssets
(Level 1)
SignificantOther
ObservableInputs
(Level 2)
SignificantOther
UnobservableInputs
(Level 3)
Cash and Short Term Securities . . . . $ 229 $218 $ 11 $ — $ 32 $ 27 $ 5 $ —Equity Securities
Common and Preferred Stock:Non-U.S. Companies . . . . . . . . . . — — — — 19 19 — —
Commingled Funds . . . . . . . . . . . . . 12 — 12 — 328 19 309 —Mutual Funds . . . . . . . . . . . . . . . . . . — — — — 70 7 63 —Partnership Interests . . . . . . . . . . . . . 362 — 133 229 — — — —
Debt SecuritiesCorporate Bonds . . . . . . . . . . . . . . . 2,678 — 2,678 — 179 17 162 —Government Bonds . . . . . . . . . . . . . 1,401 — 1,401 — 616 57 559 —Asset Backed Securities . . . . . . . . . . 123 — 123 — 4 2 2 —Commingled Funds . . . . . . . . . . . . . 960 — 960 — 1,204 — 1,204 —Mutual Funds . . . . . . . . . . . . . . . . . . 468 — 468 — 28 23 5 —
AlternativesCommingled Funds . . . . . . . . . . . . . — — — — 129 — 7 122Real Estate . . . . . . . . . . . . . . . . . . . . — — — — 136 — 2 134Other Investments . . . . . . . . . . . . . . 2 — — 2 24 3 — 21
Total Investments . . . . . . . . . . . . 6,235 $218 $5,786 $231 2,769 $174 $2,318 $277
Other . . . . . . . . . . . . . . . . . . . . . . . 15 (48)
Total Plan Assets . . . . . . . . . . . . . $6,250 $2,721
87
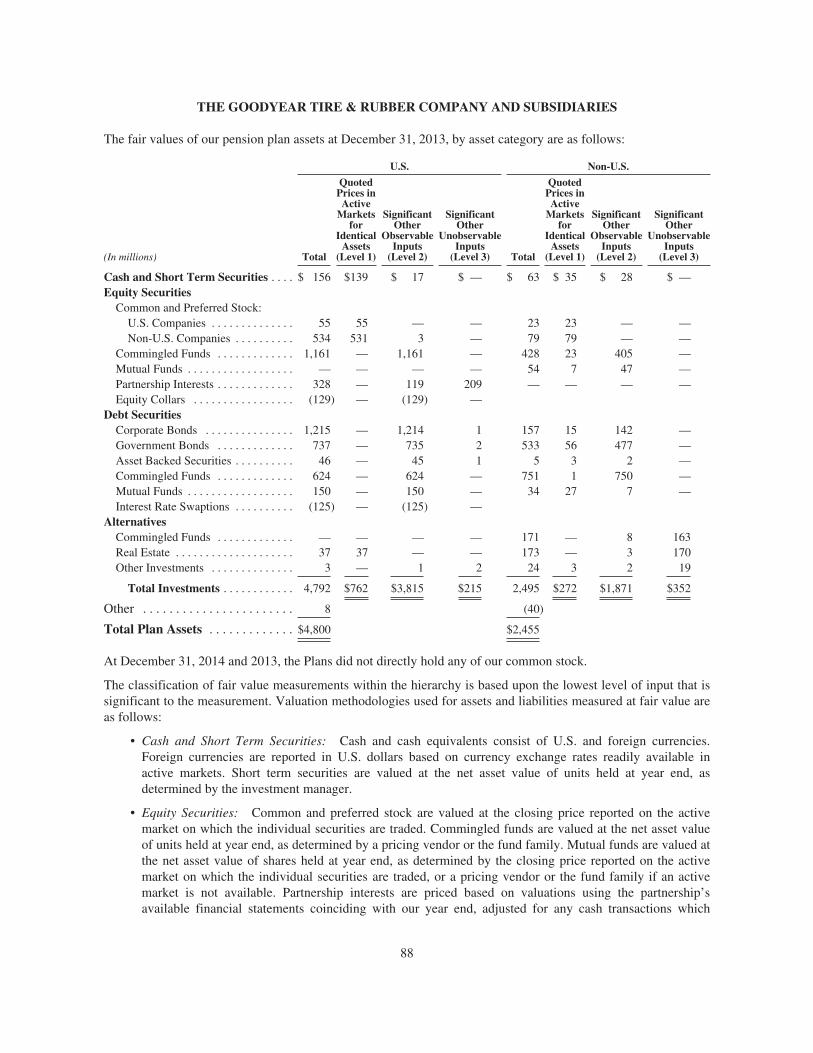
THE GOODYEAR TIRE & RUBBER COMPANY AND SUBSIDIARIES
The fair values of our pension plan assets at December 31, 2013, by asset category are as follows:
U.S. Non-U.S.
(In millions) Total
QuotedPrices inActive
Marketsfor
IdenticalAssets
(Level 1)
SignificantOther
ObservableInputs
(Level 2)
SignificantOther
UnobservableInputs
(Level 3) Total
QuotedPrices inActive
Marketsfor
IdenticalAssets
(Level 1)
SignificantOther
ObservableInputs
(Level 2)
SignificantOther
UnobservableInputs
(Level 3)
Cash and Short Term Securities . . . . $ 156 $139 $ 17 $ — $ 63 $ 35 $ 28 $ —Equity Securities
Common and Preferred Stock:U.S. Companies . . . . . . . . . . . . . . 55 55 — — 23 23 — —Non-U.S. Companies . . . . . . . . . . 534 531 3 — 79 79 — —
Commingled Funds . . . . . . . . . . . . . 1,161 — 1,161 — 428 23 405 —Mutual Funds . . . . . . . . . . . . . . . . . . — — — — 54 7 47 —Partnership Interests . . . . . . . . . . . . . 328 — 119 209 — — — —Equity Collars . . . . . . . . . . . . . . . . . (129) — (129) —
Debt SecuritiesCorporate Bonds . . . . . . . . . . . . . . . 1,215 — 1,214 1 157 15 142 —Government Bonds . . . . . . . . . . . . . 737 — 735 2 533 56 477 —Asset Backed Securities . . . . . . . . . . 46 — 45 1 5 3 2 —Commingled Funds . . . . . . . . . . . . . 624 — 624 — 751 1 750 —Mutual Funds . . . . . . . . . . . . . . . . . . 150 — 150 — 34 27 7 —Interest Rate Swaptions . . . . . . . . . . (125) — (125) —
AlternativesCommingled Funds . . . . . . . . . . . . . — — — — 171 — 8 163Real Estate . . . . . . . . . . . . . . . . . . . . 37 37 — — 173 — 3 170Other Investments . . . . . . . . . . . . . . 3 — 1 2 24 3 2 19
Total Investments . . . . . . . . . . . . 4,792 $762 $3,815 $215 2,495 $272 $1,871 $352
Other . . . . . . . . . . . . . . . . . . . . . . . 8 (40)
Total Plan Assets . . . . . . . . . . . . . $4,800 $2,455
At December 31, 2014 and 2013, the Plans did not directly hold any of our common stock.
The classification of fair value measurements within the hierarchy is based upon the lowest level of input that issignificant to the measurement. Valuation methodologies used for assets and liabilities measured at fair value areas follows:
• Cash and Short Term Securities: Cash and cash equivalents consist of U.S. and foreign currencies.Foreign currencies are reported in U.S. dollars based on currency exchange rates readily available inactive markets. Short term securities are valued at the net asset value of units held at year end, asdetermined by the investment manager.
• Equity Securities: Common and preferred stock are valued at the closing price reported on the activemarket on which the individual securities are traded. Commingled funds are valued at the net asset valueof units held at year end, as determined by a pricing vendor or the fund family. Mutual funds are valued atthe net asset value of shares held at year end, as determined by the closing price reported on the activemarket on which the individual securities are traded, or a pricing vendor or the fund family if an activemarket is not available. Partnership interests are priced based on valuations using the partnership’savailable financial statements coinciding with our year end, adjusted for any cash transactions which
88
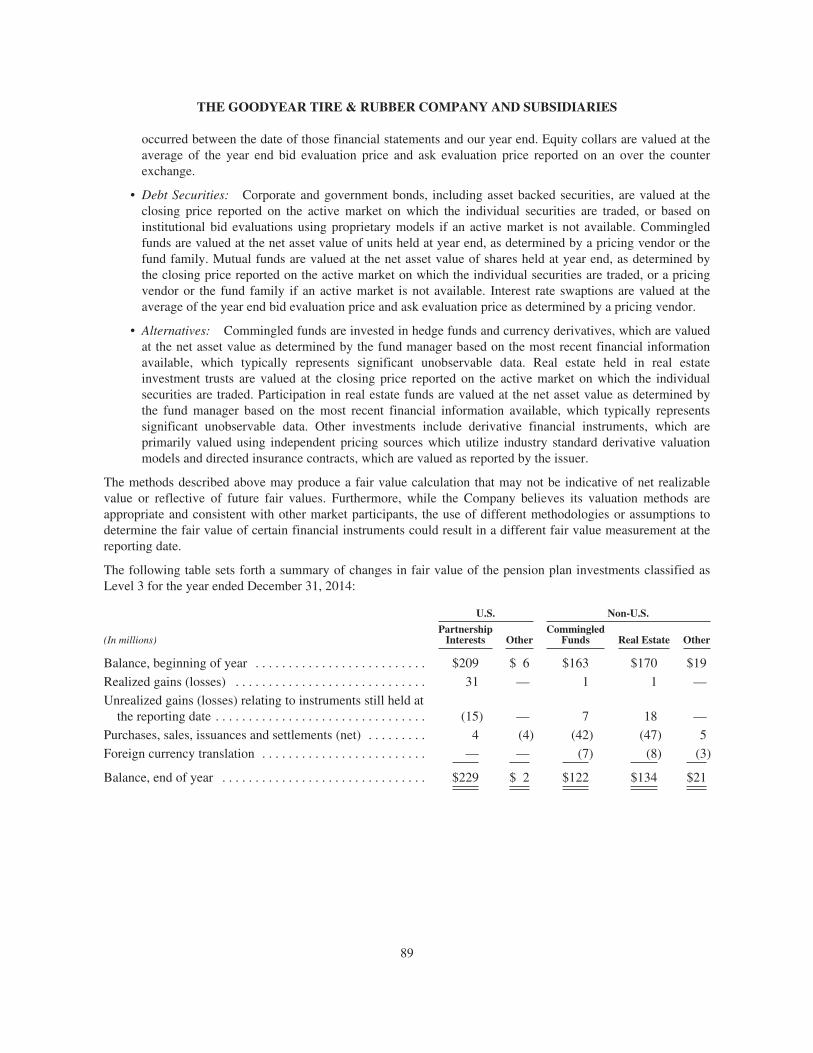
THE GOODYEAR TIRE & RUBBER COMPANY AND SUBSIDIARIES
occurred between the date of those financial statements and our year end. Equity collars are valued at theaverage of the year end bid evaluation price and ask evaluation price reported on an over the counterexchange.
• Debt Securities: Corporate and government bonds, including asset backed securities, are valued at theclosing price reported on the active market on which the individual securities are traded, or based oninstitutional bid evaluations using proprietary models if an active market is not available. Commingledfunds are valued at the net asset value of units held at year end, as determined by a pricing vendor or thefund family. Mutual funds are valued at the net asset value of shares held at year end, as determined bythe closing price reported on the active market on which the individual securities are traded, or a pricingvendor or the fund family if an active market is not available. Interest rate swaptions are valued at theaverage of the year end bid evaluation price and ask evaluation price as determined by a pricing vendor.
• Alternatives: Commingled funds are invested in hedge funds and currency derivatives, which are valuedat the net asset value as determined by the fund manager based on the most recent financial informationavailable, which typically represents significant unobservable data. Real estate held in real estateinvestment trusts are valued at the closing price reported on the active market on which the individualsecurities are traded. Participation in real estate funds are valued at the net asset value as determined bythe fund manager based on the most recent financial information available, which typically representssignificant unobservable data. Other investments include derivative financial instruments, which areprimarily valued using independent pricing sources which utilize industry standard derivative valuationmodels and directed insurance contracts, which are valued as reported by the issuer.
The methods described above may produce a fair value calculation that may not be indicative of net realizablevalue or reflective of future fair values. Furthermore, while the Company believes its valuation methods areappropriate and consistent with other market participants, the use of different methodologies or assumptions todetermine the fair value of certain financial instruments could result in a different fair value measurement at thereporting date.
The following table sets forth a summary of changes in fair value of the pension plan investments classified asLevel 3 for the year ended December 31, 2014:
U.S. Non-U.S.
(In millions)Partnership
Interests OtherCommingled
Funds Real Estate Other
Balance, beginning of year . . . . . . . . . . . . . . . . . . . . . . . . . . $209 $ 6 $163 $170 $19
Realized gains (losses) . . . . . . . . . . . . . . . . . . . . . . . . . . . . . 31 — 1 1 —
Unrealized gains (losses) relating to instruments still held atthe reporting date . . . . . . . . . . . . . . . . . . . . . . . . . . . . . . . . (15) — 7 18 —
Purchases, sales, issuances and settlements (net) . . . . . . . . . 4 (4) (42) (47) 5
Foreign currency translation . . . . . . . . . . . . . . . . . . . . . . . . . — — (7) (8) (3)
Balance, end of year . . . . . . . . . . . . . . . . . . . . . . . . . . . . . . . $229 $ 2 $122 $134 $21
89

THE GOODYEAR TIRE & RUBBER COMPANY AND SUBSIDIARIES
The following table sets forth a summary of changes in fair value of the pension plan investments classified asLevel 3 for the year ended December 31, 2013:
U.S. Non-U.S.
(In millions)Partnership
Interests OtherCommingled
Funds Real Estate Other
Balance, beginning of year . . . . . . . . . . . . . . . . . . . . . . . . . . $191 $ 3 $143 $138 $19
Realized gains (losses) . . . . . . . . . . . . . . . . . . . . . . . . . . . . . 6 — — — —
Unrealized gains relating to instruments still held at thereporting date . . . . . . . . . . . . . . . . . . . . . . . . . . . . . . . . . . . 12 — 16 9 —
Purchases, sales, issuances and settlements (net) . . . . . . . . . — 3 — 19 —
Foreign currency translation . . . . . . . . . . . . . . . . . . . . . . . . . — — 4 4 —
Balance, end of year . . . . . . . . . . . . . . . . . . . . . . . . . . . . . . . $209 $ 6 $163 $170 $19
Other postretirement benefits plan assets at December 31, 2014 and 2013, which relate to a non-U.S. plan, areinvested primarily in mutual funds and are considered a Level 1 investment.
Savings Plans
Substantially all employees in the U.S. and employees of certain non-U.S. locations are eligible to participate in adefined contribution savings plan. Expenses recognized for contributions to these plans were $112 million, $106million and $97 million for 2014, 2013 and 2012, respectively.
Note 17. Stock Compensation Plans
Our stock compensation plans (collectively, the “Plans”) permit the grant of stock options, stock appreciationrights (“SARs”), performance share units, restricted stock, restricted stock units and other stock-based awards toemployees and directors. Our current stock compensation plan, the 2013 Performance Plan, was adopted onApril 15, 2013 and expires on April 14, 2023. A total of 11,000,000 shares of our common stock may be issuedin respect of grants made under the 2013 Performance Plan. Any shares of common stock that are subject toawards of stock options or SARs will be counted as one share for each share granted for purposes of theaggregate share limit and any shares of common stock that are subject to any other awards will be counted as1.61 shares for each share granted for purposes of the aggregate share limit. In addition, shares of common stockthat are subject to awards issued under the 2013 Performance Plan or certain prior stock compensation plans thatexpire according to their terms or are forfeited, terminated, canceled or surrendered or are settled, or can be paid,only in cash, or are surrendered in payment of taxes associated with such awards (other than stock options orSARs) will be available for issuance pursuant to a new award under the 2013 Performance Plan. Shares issuedunder our stock compensation plans are usually issued from shares of our common stock held in treasury.
Stock Options
Grants of stock options and SARs (collectively referred to as “options”) under the Plans generally have a gradedvesting period of four years whereby one-fourth of the awards vest on each of the first four anniversaries of thegrant date, an exercise price equal to the fair market value of one share of our common stock on the date of grant(calculated as the average of the high and low price or the closing market price on that date depending on theterms of the related Plan) and a contractual term of ten years. The exercise of tandem SARs cancels an equivalentnumber of stock options and conversely, the exercise of stock options cancels an equivalent number of tandemSARs. Option grants are cancelled on, or 90 days following, termination of employment unless termination is dueto retirement, death or disability under certain circumstances, in which case, all outstanding options vest fullyand remain outstanding for a term set forth in the related grant agreement.
90

THE GOODYEAR TIRE & RUBBER COMPANY AND SUBSIDIARIES
With respect to stock options granted prior to 2008, the exercise of those stock options through a share swap,whereby the employee exercising the stock options tenders shares of our common stock then owned by suchemployee towards the exercise price plus taxes, if any, due from such employee, results in an immediate grant ofnew options (hereinafter referred to as “reload” options) equal to the number of shares so tendered plus anyshares tendered to satisfy the employee’s income tax obligations on the transaction. Each such grant of reloadoptions vests on the first anniversary of its respective grant date, has an exercise price equal to the fair marketvalue of one share of our common stock on the date of grant (calculated as the average of the high and low priceon that date) and a contractual term equal to the remaining contractual term of the original option. Thesubsequent exercise of such reload options through a share swap does not result in the grant of any additionalreload options. The 2013 Performance Plan does not permit the grant of reload options.
The following table summarizes the activity related to options during 2014:
OptionsWeighted Average
Exercise Price
Weighted AverageRemaining
Contractual Term(Years)
AggregateIntrinsic
Value (In millions)
Outstanding at January 1 . . . . . . . . 12,787,545 $15.45Options granted . . . . . . . . . . . . . 816,713 26.22Options exercised . . . . . . . . . . . (2,941,178) 13.82 $ 37Options expired . . . . . . . . . . . . . (107,909) 12.54Options cancelled . . . . . . . . . . . (204,538) 17.77
Outstanding at December 31 . . . . . 10,350,633 16.75 5.7 123
Vested and expected to vest atDecember 31 . . . . . . . . . . . . . . . 9,954,431 16.77 5.6 119
Exercisable at December 31 . . . . . 6,748,799 16.95 4.4 79
Available for grant atDecember 31 . . . . . . . . . . . . . . . 9,954,317
In addition, the aggregate intrinsic value of options exercised in 2013 and 2012 was $23 million and $2 million,respectively.
Significant option groups outstanding at December 31, 2014 and related weighted average exercise price andremaining contractual term information follows:
Grant DateOptions
OutstandingOptions
ExercisableExercise
Price
RemainingContractual
Term (Years)
2/24/2014 . . . . . . . . . . . . . . . . . . . . . . . . . . . . . . . 600,801 — $26.44 9.22/28/2013 . . . . . . . . . . . . . . . . . . . . . . . . . . . . . . . 1,815,818 422,219 12.98 8.22/27/2012 . . . . . . . . . . . . . . . . . . . . . . . . . . . . . . . 1,433,627 666,348 12.94 7.22/22/2011 . . . . . . . . . . . . . . . . . . . . . . . . . . . . . . . 995,776 712,524 13.91 6.22/23/2010 . . . . . . . . . . . . . . . . . . . . . . . . . . . . . . . 771,769 771,769 12.74 5.22/26/2009 . . . . . . . . . . . . . . . . . . . . . . . . . . . . . . . 707,972 707,972 4.81 4.22/21/2008 . . . . . . . . . . . . . . . . . . . . . . . . . . . . . . . 976,043 976,043 26.74 3.22/27/2007 . . . . . . . . . . . . . . . . . . . . . . . . . . . . . . . 1,039,847 1,039,847 24.71 2.212/6/2005 . . . . . . . . . . . . . . . . . . . . . . . . . . . . . . . 405,944 405,944 17.15 0.9All other . . . . . . . . . . . . . . . . . . . . . . . . . . . . . . . 1,603,036 1,046,133 (1) (1)
10,350,633 6,748,799
91
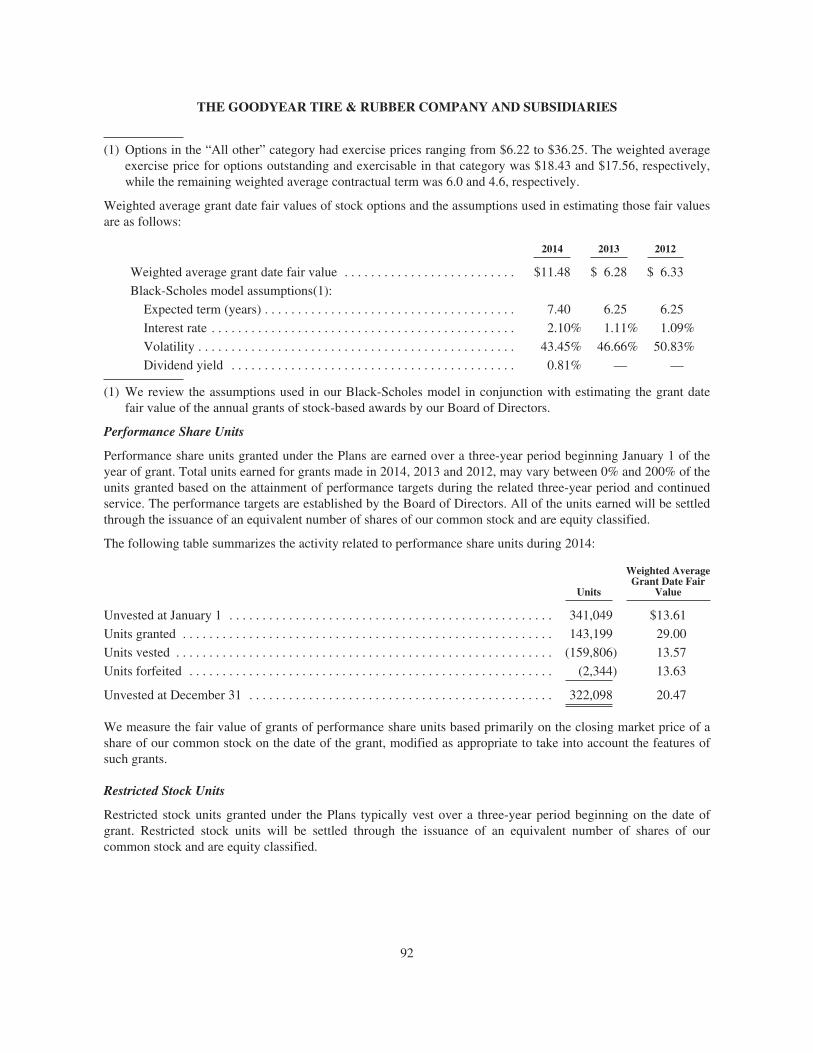
THE GOODYEAR TIRE & RUBBER COMPANY AND SUBSIDIARIES
(1) Options in the “All other” category had exercise prices ranging from $6.22 to $36.25. The weighted averageexercise price for options outstanding and exercisable in that category was $18.43 and $17.56, respectively,while the remaining weighted average contractual term was 6.0 and 4.6, respectively.
Weighted average grant date fair values of stock options and the assumptions used in estimating those fair valuesare as follows:
2014 2013 2012
Weighted average grant date fair value . . . . . . . . . . . . . . . . . . . . . . . . . . $11.48 $ 6.28 $ 6.33
Black-Scholes model assumptions(1):
Expected term (years) . . . . . . . . . . . . . . . . . . . . . . . . . . . . . . . . . . . . . . 7.40 6.25 6.25
Interest rate . . . . . . . . . . . . . . . . . . . . . . . . . . . . . . . . . . . . . . . . . . . . . . 2.10% 1.11% 1.09%
Volatility . . . . . . . . . . . . . . . . . . . . . . . . . . . . . . . . . . . . . . . . . . . . . . . . 43.45% 46.66% 50.83%
Dividend yield . . . . . . . . . . . . . . . . . . . . . . . . . . . . . . . . . . . . . . . . . . . 0.81% — —
(1) We review the assumptions used in our Black-Scholes model in conjunction with estimating the grant datefair value of the annual grants of stock-based awards by our Board of Directors.
Performance Share Units
Performance share units granted under the Plans are earned over a three-year period beginning January 1 of theyear of grant. Total units earned for grants made in 2014, 2013 and 2012, may vary between 0% and 200% of theunits granted based on the attainment of performance targets during the related three-year period and continuedservice. The performance targets are established by the Board of Directors. All of the units earned will be settledthrough the issuance of an equivalent number of shares of our common stock and are equity classified.
The following table summarizes the activity related to performance share units during 2014:
Units
Weighted AverageGrant Date Fair
Value
Unvested at January 1 . . . . . . . . . . . . . . . . . . . . . . . . . . . . . . . . . . . . . . . . . . . . . . . . . 341,049 $13.61
Units granted . . . . . . . . . . . . . . . . . . . . . . . . . . . . . . . . . . . . . . . . . . . . . . . . . . . . . . . . 143,199 29.00
Units vested . . . . . . . . . . . . . . . . . . . . . . . . . . . . . . . . . . . . . . . . . . . . . . . . . . . . . . . . . (159,806) 13.57
Units forfeited . . . . . . . . . . . . . . . . . . . . . . . . . . . . . . . . . . . . . . . . . . . . . . . . . . . . . . . (2,344) 13.63
Unvested at December 31 . . . . . . . . . . . . . . . . . . . . . . . . . . . . . . . . . . . . . . . . . . . . . . 322,098 20.47
We measure the fair value of grants of performance share units based primarily on the closing market price of ashare of our common stock on the date of the grant, modified as appropriate to take into account the features ofsuch grants.
Restricted Stock Units
Restricted stock units granted under the Plans typically vest over a three-year period beginning on the date ofgrant. Restricted stock units will be settled through the issuance of an equivalent number of shares of ourcommon stock and are equity classified.
92

THE GOODYEAR TIRE & RUBBER COMPANY AND SUBSIDIARIES
The following table summarizes the activity related to restricted stock units during 2014:
Units
Weighted AverageGrant Date Fair
Value
Unvested at January 1 . . . . . . . . . . . . . . . . . . . . . . . . . . . . . . . . . . . . . . . . . . . . . . . . . 439,952 $16.35
Units granted . . . . . . . . . . . . . . . . . . . . . . . . . . . . . . . . . . . . . . . . . . . . . . . . . . . . . . . . 259,869 25.49
Units vested and settled . . . . . . . . . . . . . . . . . . . . . . . . . . . . . . . . . . . . . . . . . . . . . . . . (214,943) 13.71
Units forfeited . . . . . . . . . . . . . . . . . . . . . . . . . . . . . . . . . . . . . . . . . . . . . . . . . . . . . . . (2,701) 26.40
Unvested at December 31 . . . . . . . . . . . . . . . . . . . . . . . . . . . . . . . . . . . . . . . . . . . . . . 482,177 22.36
We measure the fair value of grants of restricted stock units based on the closing market price of a share of ourcommon stock on the date of the grant.
Other Information
Stock-based compensation expense, cash payments made to settle SARs and cash received from the exercise ofstock options follows:
(In millions) 2014 2013 2012
Stock-based compensation expense recognized . . . . . . . . . . . . . . . . . . . . . . . . . . $20 $18 $15
Tax benefit . . . . . . . . . . . . . . . . . . . . . . . . . . . . . . . . . . . . . . . . . . . . . . . . . . . . . . . (7) — —
After-tax stock-based compensation expense . . . . . . . . . . . . . . . . . . . . . . . . . . . . $13 $18 $15
Cash payments to settle SARs . . . . . . . . . . . . . . . . . . . . . . . . . . . . . . . . . . . . . . . . $ 2 $ 1 $—
Cash received from stock option exercises . . . . . . . . . . . . . . . . . . . . . . . . . . . . . . $39 $22 $ 4
As of December 31, 2014, unearned compensation cost related to the unvested portion of all stock-based awardswas approximately $29 million and is expected to be recognized over the remaining vesting period of therespective grants, through October 2020.
Note 18. Commitments and Contingent Liabilities
Environmental Matters
We have recorded liabilities totaling $46 million and $45 million at December 31, 2014 and December 31, 2013,respectively, for anticipated costs related to various environmental matters, primarily the remediation ofnumerous waste disposal sites and certain properties sold by us. Of these amounts, $9 million and $11 millionwere included in Other Current Liabilities at December 31, 2014 and December 31, 2013, respectively. The costsinclude legal and consulting fees, site studies, the design and implementation of remediation plans, post-remediation monitoring and related activities, and will be paid over several years. The amount of our ultimateliability in respect of these matters may be affected by several uncertainties, primarily the ultimate cost ofrequired remediation and the extent to which other responsible parties contribute. We have limited potentialinsurance coverage for future environmental claims.
Since many of the remediation activities related to environmental matters vary substantially in duration and costfrom site to site and the associated costs for each vary depending on the mix of unique site characteristics, insome cases we cannot reasonably estimate a range of possible losses. Although it is not possible to estimate withcertainty the outcome of all of our environmental matters, management believes that potential losses in excess ofcurrent reserves for environmental matters, individually and in the aggregate, will not have a material adverseeffect on our financial position, cash flows or results of operations.
93

THE GOODYEAR TIRE & RUBBER COMPANY AND SUBSIDIARIES
Workers’ Compensation
We have recorded liabilities, on a discounted basis, totaling $306 million and $310 million for anticipated costsrelated to workers’ compensation at December 31, 2014 and December 31, 2013, respectively. Of these amounts,$71 million and $79 million were included in Current Liabilities as part of Compensation and Benefits atDecember 31, 2014 and December 31, 2013, respectively. The costs include an estimate of expected settlementson pending claims, defense costs and a provision for claims incurred but not reported. These estimates are basedon our assessment of potential liability using an analysis of available information with respect to pending claims,historical experience, and current cost trends. The amount of our ultimate liability in respect of these matters maydiffer from these estimates. We periodically, and at least annually, update our loss development factors based onactuarial analyses. At December 31, 2014 and December 31, 2013, the liability was discounted using a risk-freerate of return. At December 31, 2014, we estimate that it is reasonably possible that the liability could exceed ourrecorded amounts by approximately $30 million.
General and Product Liability and Other Litigation
We have recorded liabilities totaling $324 million and $305 million, including related legal fees expected to beincurred, for potential product liability and other tort claims, including asbestos claims, at December 31, 2014and December 31, 2013, respectively. Of these amounts, $46 million and $45 million were included in OtherCurrent Liabilities at December 31, 2014 and December 31, 2013, respectively. The amounts recorded wereestimated based on an assessment of potential liability using an analysis of available information with respect topending claims, historical experience and, where available, recent and current trends. Based upon thatassessment, at December 31, 2014, we do not believe that estimated reasonably possible losses associated withgeneral and product liability claims in excess of the amounts recorded will have a material adverse effect on ourfinancial position, cash flows or results of operations. However, the amount of our ultimate liability in respect ofthese matters may differ from these estimates.
Asbestos. We are a defendant in numerous lawsuits alleging various asbestos-related personal injuriespurported to result from alleged exposure to asbestos in certain products manufactured by us or present in certainof our facilities. Typically, these lawsuits have been brought against multiple defendants in state and Federalcourts. To date, we have disposed of approximately 109,500 claims by defending and obtaining the dismissalthereof or by entering into a settlement. The sum of our accrued asbestos-related liability and gross payments todate, including legal costs, by us and our insurers totaled approximately $458 million through December 31,2014 and $432 million through December 31, 2013.
A summary of recent approximate asbestos claims activity follows. Because claims are often filed and disposedof by dismissal or settlement in large numbers, the amount and timing of settlements and the number of openclaims during a particular period can fluctuate significantly.
(Dollars in millions) 2014 2013 2012
Pending claims, beginning of year . . . . . . . . . . . . . . . . . . . . . . . . . . . 74,000 73,200 78,500
New claims filed during the year . . . . . . . . . . . . . . . . . . . . . . . . . . . . 1,900 2,600 2,200
Claims settled/dismissed during the year . . . . . . . . . . . . . . . . . . . . . . (2,100) (1,800) (7,500)
Pending claims, end of year . . . . . . . . . . . . . . . . . . . . . . . . . . . . . . . . 73,800 74,000 73,200
Payments (1) . . . . . . . . . . . . . . . . . . . . . . . . . . . . . . . . . . . . . . . . . . . . $ 20 $ 19 $ 18
(1) Represents amount spent by us and our insurers on asbestos litigation defense and claim resolution.
We periodically, and at least annually, review our existing reserves for pending claims, including a reasonableestimate of the liability associated with unasserted asbestos claims, and estimate our receivables from probableinsurance recoveries. We had recorded gross liabilities for both asserted and unasserted claims, inclusive of
94
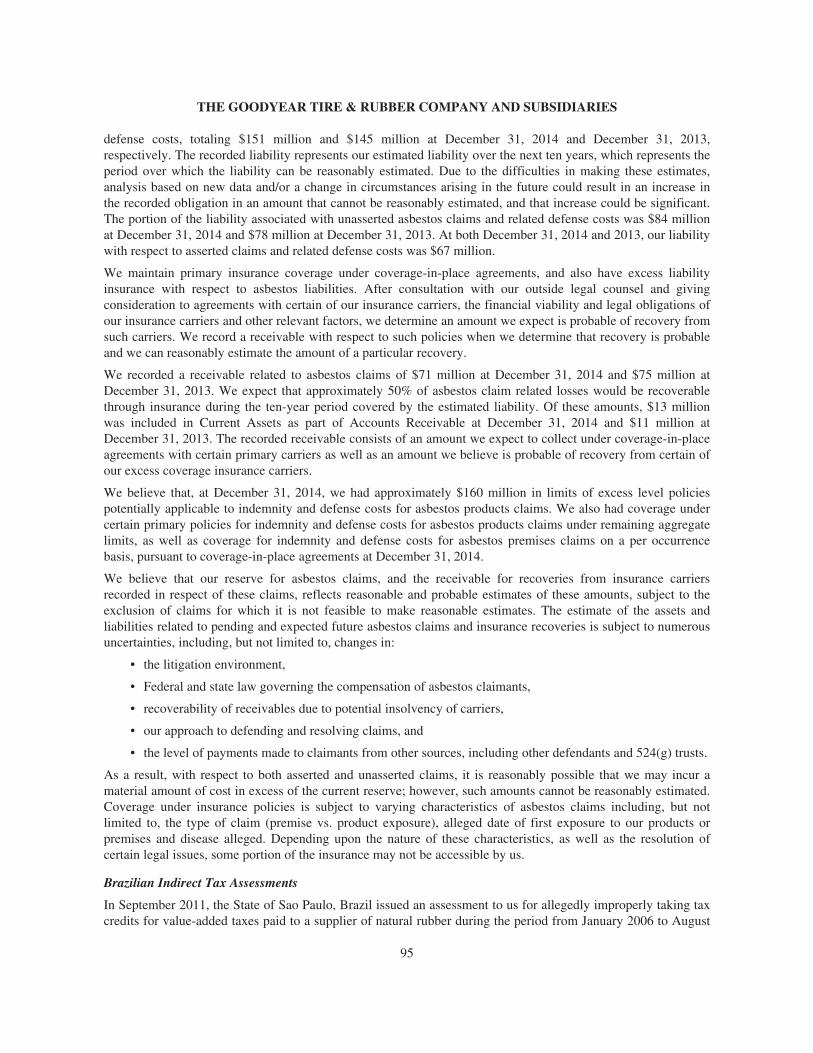
THE GOODYEAR TIRE & RUBBER COMPANY AND SUBSIDIARIES
defense costs, totaling $151 million and $145 million at December 31, 2014 and December 31, 2013,respectively. The recorded liability represents our estimated liability over the next ten years, which represents theperiod over which the liability can be reasonably estimated. Due to the difficulties in making these estimates,analysis based on new data and/or a change in circumstances arising in the future could result in an increase inthe recorded obligation in an amount that cannot be reasonably estimated, and that increase could be significant.The portion of the liability associated with unasserted asbestos claims and related defense costs was $84 millionat December 31, 2014 and $78 million at December 31, 2013. At both December 31, 2014 and 2013, our liabilitywith respect to asserted claims and related defense costs was $67 million.
We maintain primary insurance coverage under coverage-in-place agreements, and also have excess liabilityinsurance with respect to asbestos liabilities. After consultation with our outside legal counsel and givingconsideration to agreements with certain of our insurance carriers, the financial viability and legal obligations ofour insurance carriers and other relevant factors, we determine an amount we expect is probable of recovery fromsuch carriers. We record a receivable with respect to such policies when we determine that recovery is probableand we can reasonably estimate the amount of a particular recovery.
We recorded a receivable related to asbestos claims of $71 million at December 31, 2014 and $75 million atDecember 31, 2013. We expect that approximately 50% of asbestos claim related losses would be recoverablethrough insurance during the ten-year period covered by the estimated liability. Of these amounts, $13 millionwas included in Current Assets as part of Accounts Receivable at December 31, 2014 and $11 million atDecember 31, 2013. The recorded receivable consists of an amount we expect to collect under coverage-in-placeagreements with certain primary carriers as well as an amount we believe is probable of recovery from certain ofour excess coverage insurance carriers.
We believe that, at December 31, 2014, we had approximately $160 million in limits of excess level policiespotentially applicable to indemnity and defense costs for asbestos products claims. We also had coverage undercertain primary policies for indemnity and defense costs for asbestos products claims under remaining aggregatelimits, as well as coverage for indemnity and defense costs for asbestos premises claims on a per occurrencebasis, pursuant to coverage-in-place agreements at December 31, 2014.
We believe that our reserve for asbestos claims, and the receivable for recoveries from insurance carriersrecorded in respect of these claims, reflects reasonable and probable estimates of these amounts, subject to theexclusion of claims for which it is not feasible to make reasonable estimates. The estimate of the assets andliabilities related to pending and expected future asbestos claims and insurance recoveries is subject to numerousuncertainties, including, but not limited to, changes in:
• the litigation environment,
• Federal and state law governing the compensation of asbestos claimants,
• recoverability of receivables due to potential insolvency of carriers,
• our approach to defending and resolving claims, and
• the level of payments made to claimants from other sources, including other defendants and 524(g) trusts.
As a result, with respect to both asserted and unasserted claims, it is reasonably possible that we may incur amaterial amount of cost in excess of the current reserve; however, such amounts cannot be reasonably estimated.Coverage under insurance policies is subject to varying characteristics of asbestos claims including, but notlimited to, the type of claim (premise vs. product exposure), alleged date of first exposure to our products orpremises and disease alleged. Depending upon the nature of these characteristics, as well as the resolution ofcertain legal issues, some portion of the insurance may not be accessible by us.
Brazilian Indirect Tax Assessments
In September 2011, the State of Sao Paulo, Brazil issued an assessment to us for allegedly improperly taking taxcredits for value-added taxes paid to a supplier of natural rubber during the period from January 2006 to August
95

THE GOODYEAR TIRE & RUBBER COMPANY AND SUBSIDIARIES
2008. The assessment, including interest and penalties, totals 92 million Brazilian real (approximately $35million). We have filed a response contesting this assessment and are defending the matter. In the event we areunsuccessful in defending the assessment, our results of operations could be materially affected.
Greek Labor Cases
Approximately 320 former employees of a factory in Thessaloniki, Greece that was closed in 1996 suedGoodyear Dunlop Tires Hellas S.A.I.C. (“Goodyear Dunlop Greece”) seeking compensation in arrears allegingthe absence of consultation prior to the closure under applicable European law. In March 2013, the formeremployees also filed a separate claim for severance payments. During the fourth quarter of 2014, we entered intosettlement agreements with the former employees with an aggregate value of approximately €27 million ($32million), which includes salaries in arrears, related payroll taxes, severance and related expenses. In the fourthquarter of 2014, we made payments pursuant to the settlement agreements totaling €16 million ($20 million). Theremaining scheduled payments are due in installments through 2016. In addition, Goodyear Dunlop Greece maybe required to pay social security contributions of approximately €11 million ($13 million). We do not expectthis matter to materially affect our future results of operations, financial position or cash flows.
Amiens Labor Claims
Approximately 720 former employees of the closed Amiens, France manufacturing facility have assertedwrongful termination or other claims totaling €98 million ($119 million) against Goodyear Dunlop Tires France.In January 2015, these claims were dismissed without prejudice. The former employees may re-file these claimswithin two years. In the event these claims are re-filed or additional claims are asserted against us, we intend tovigorously defend ourselves and cannot estimate the amounts, if any, that we may ultimately pay in respect ofsuch claims.
Other Actions
We are currently a party to various claims, indirect tax assessments and legal proceedings in addition to thosenoted above. If management believes that a loss arising from these matters is probable and can reasonably beestimated, we record the amount of the loss, or the minimum estimated liability when the loss is estimated usinga range, and no point within the range is more probable than another. As additional information becomesavailable, any potential liability related to these matters is assessed and the estimates are revised, if necessary.Based on currently available information, management believes that the ultimate outcome of these matters,individually and in the aggregate, will not have a material adverse effect on our financial position or overalltrends in results of operations.
Our recorded liabilities and estimates of reasonably possible losses for the contingent liabilities described aboveare based on our assessment of potential liability using the information available to us at the time and, whereapplicable, any past experience and recent and current trends with respect to similar matters. Our contingentliabilities are subject to inherent uncertainties, and unfavorable judicial or administrative decisions could occurwhich we did not anticipate. Such an unfavorable decision could include monetary damages, fines or otherpenalties or an injunction prohibiting us from taking certain actions or selling certain products. If such anunfavorable decision were to occur, it could result in a material adverse impact on our financial position andresults of operations in the period in which the decision occurs, or in future periods.
Income Tax Matters
The calculation of our income tax liabilities involves dealing with uncertainties in the application of complex taxregulations. We recognize liabilities for anticipated tax audit issues based on our estimate of whether, and theextent to which, additional taxes will be due. If we ultimately determine that payment of these amounts isunnecessary, we reverse the liability and recognize a tax benefit during the period in which we determine that theliability is no longer necessary. We also recognize income tax benefits to the extent that it is more likely than not
96

THE GOODYEAR TIRE & RUBBER COMPANY AND SUBSIDIARIES
that our positions will be sustained when challenged by the taxing authorities. We derecognize income taxbenefits when based on new information we determine that it is no longer more likely than not that our positionwill be sustained. To the extent we prevail in matters for which liabilities have been established, or determine weneed to derecognize tax benefits recorded in prior periods, our results of operations and effective tax rate in agiven period could be materially affected. An unfavorable tax settlement would require use of our cash, and leadto recognition of expense to the extent the settlement amount exceeds recorded liabilities and would result in anincrease in our effective tax rate in the period of resolution. A favorable tax settlement would be recognized as areduction of expense to the extent the settlement amount is lower than recorded liabilities and would result in areduction in our effective tax rate in the period of resolution.
While the Company applies consistent transfer pricing policies and practices globally, supports transfer pricesthrough economic studies, seeks advance pricing agreements and joint audits to the extent possible and believesits transfer prices to be appropriate, such transfer prices, and related interpretations of tax laws, are occasionallychallenged by various taxing authorities globally. We have received various tax assessments challenging ourinterpretations of applicable tax laws in various jurisdictions. Although we believe we have complied withapplicable tax laws, have strong positions and defenses and have historically been successful in defending suchclaims, our results of operations could be materially adversely affected in the case we are unsuccessful in thedefense of existing or future claims.
Binding Commitments and Guarantees
At December 31, 2014, we had binding commitments for raw materials, capital expenditures, utilities, andvarious other types of contracts. Total commitments on contracts that extend beyond 2015 are expected to totalapproximately $3,900 million. In addition, we have other contractual commitments, the amounts of which cannotbe estimated, pursuant to certain long term agreements under which we will purchase varying amounts of certainraw materials and finished goods at agreed upon base prices that may be subject to periodic adjustments forchanges in raw material costs and market price adjustments, or in quantities that may be subject to periodicadjustments for changes in our or our suppliers’ production levels.
We have off-balance sheet financial guarantees written and other commitments totaling approximately $7 millionat December 31, 2014, compared to $14 million at December 31, 2013. In addition, we will from time to timeissue guarantees to financial institutions or other entities on behalf of certain of our affiliates, lessors orcustomers. Normally there is no separate premium received by us as consideration for the issuance of guarantees.We also generally do not require collateral in connection with the issuance of these guarantees. If ourperformance under these guarantees is triggered by non-payment or another specified event, we would beobligated to make payment to the financial institution or the other entity, and would typically have recourse tothe affiliate, lessor or customer. The guarantees expire at various times through 2023. We are unable to estimatethe extent to which our affiliates’, lessors’ or customers’ assets would be adequate to recover any payments madeby us under the related guarantees.
Indemnifications
At December 31, 2014, we were a party to various agreements under which we had assumed obligations toindemnify the counterparties from certain potential claims and losses. These agreements typically involvestandard commercial activities undertaken by us in the normal course of business; the sale of assets by us; theformation of joint venture businesses to which we had contributed assets in exchange for ownership interests; andother financial transactions. Indemnifications provided by us pursuant to these agreements relate to variousmatters including, among other things, environmental, tax and shareholder matters; intellectual property rights;government regulations and employment-related matters; and dealer, supplier and other commercial matters.
Certain indemnifications expire from time to time, and certain other indemnifications are not subject to anexpiration date. In addition, our potential liability under certain indemnifications is subject to maximum caps,
97

THE GOODYEAR TIRE & RUBBER COMPANY AND SUBSIDIARIES
while other indemnifications are not subject to caps. Although we have been subject to indemnification claims inthe past, we cannot reasonably estimate the number, type and size of indemnification claims that may arise in thefuture. Due to these and other uncertainties associated with the indemnifications, our maximum exposure to lossunder these agreements cannot be estimated.
We have determined that there are no indemnifications or guarantees other than liabilities for which amounts arealready recorded or reserved in our consolidated financial statements under which it is probable that we haveincurred a liability.
Warranty
We recorded $17 million and $21 million for potential claims under warranties offered by us at December 31,2014 and 2013, respectively, the majority of which is recorded in Other Current Liabilities.
The following table presents changes in the warranty reserve during 2014 and 2013:
(in millions) 2014 2013
Balance at January 1 . . . . . . . . . . . . . . . . . . . . . . . . . . . . . . . . . . . . . . . . . . . . . . . . . . . $ 21 $ 24
Payments made during the period . . . . . . . . . . . . . . . . . . . . . . . . . . . . . . . . . . . . . . . . (39) (32)
Expense recorded during the period . . . . . . . . . . . . . . . . . . . . . . . . . . . . . . . . . . . . . . . 36 29
Translation adjustment . . . . . . . . . . . . . . . . . . . . . . . . . . . . . . . . . . . . . . . . . . . . . . . . . (1) —
Balance at December 31 . . . . . . . . . . . . . . . . . . . . . . . . . . . . . . . . . . . . . . . . . . . . . . . . . $ 17 $ 21
Note 19. Capital Stock
Mandatory Convertible Preferred Stock
On April 1, 2014, all outstanding shares of mandatory convertible preferred stock automatically converted into27,573,735 shares of common stock, net of fractional shares, at a conversion rate of 2.7574 shares of commonstock per share of preferred stock.
Dividends
During 2014, 2013 and 2012, we paid cash dividends of $15 million, $29 million, and $29 million, respectively,on our mandatory convertible preferred stock. No further dividends will be paid on our preferred stock followingthe conversion of shares into common stock on April 1, 2014.
During 2014 and 2013, we paid cash dividends of $60 million and $12 million, respectively, on our commonstock. On January 14, 2015, the Company’s Board of Directors (or a duly authorized committee thereof) declaredcash dividends of $0.06 per share of our common stock, or approximately $16 million in the aggregate. The cashdividend will be paid on March 2, 2015 to stockholders of record as of the close of business of February 2, 2015.Future quarterly dividends are subject to Board approval.
Common Stock Repurchases
On September 18, 2013, the Board of Directors authorized $100 million for use in our common stock repurchaseprogram. On May 27, 2014, the Board of Directors approved an increase in that authorization to $450 million.This program expires on December 31, 2016. We intend to repurchase shares of common stock in open markettransactions in order to offset new shares issued under equity compensation programs and to provide foradditional shareholder returns. During 2014, we repurchased 8,935,809 shares at an average price, includingcommissions, of $26.11 per share, or $233 million in the aggregate.
98

THE GOODYEAR TIRE & RUBBER COMPANY AND SUBSIDIARIES
In addition, we repurchase shares delivered to us by employees as payment for the exercise price of stock optionsand the withholding taxes due upon the exercise of stock options or the vesting or payment of stock awards. Inthe fourth quarter of 2014, we reassessed transactions that we consider to be repurchases of shares under ourstock compensation programs. During 2014, we repurchased 19,298 shares at an average price of $21.80 pershare, or $0.4 million in the aggregate.
Note 20. Reclassifications out of Accumulated Other Comprehensive Loss
The following table presents changes in Accumulated Other Comprehensive Loss (AOCL) by component, for theyear ended December 31, 2014 and 2013:
(In millions) Income (Loss)
Foreign CurrencyTranslationAdjustment
Unrecognized NetActuarial Losses andPrior Service Costs
Deferred DerivativeGains (Losses)
UnrealizedInvestment Gains Total
Balance at December 31, 2012 . . . . . . $(538) $(4,044) $ (4) $26 $(4,560)
Other comprehensive income (loss)before reclassifications . . . . . . . . (153) 528 1 8 384
Amounts reclassified fromaccumulated othercomprehensive loss . . . . . . . . . . . 1 226 2 — 229
Balance at December 31, 2013 . . . . . . $(690) $(3,290) $ (1) $34 $(3,947)
Other comprehensive income (loss)before reclassifications . . . . . . . . (206) (112) 13 2 (303)
Amounts reclassified fromaccumulated othercomprehensive loss . . . . . . . . . . . 3 105 — — 108
Purchase of subsidiary shares fromminority interest . . . . . . . . . . . . . (1) — — — (1)
Balance at December 31, 2014 . . . . . . $(894) $(3,297) $12 $36 $(4,143)
99

THE GOODYEAR TIRE & RUBBER COMPANY AND SUBSIDIARIES
The following table presents reclassifications out of AOCL for the year ended December 31, 2014 and 2013:
Year EndedDecember 31,
(In millions) (Income) Expense 2014 2013
Component of AOCLAmount Reclassified
from AOCLAffected Line Item in the Consolidated
Statements of Operations
Foreign Currency Translation Adjustment,before tax . . . . . . . . . . . . . . . . . . . . . . . . . . $ 3 $ 1 Other ExpenseTax effect . . . . . . . . . . . . . . . . . . . . . . . . . . — — United States and Foreign TaxesMinority interest . . . . . . . . . . . . . . . . . . . . . — — Minority Shareholders’ Net Income
Net of tax . . . . . . . . . . . . . . . . . . . . . . . . $ 3 $ 1 Goodyear Net IncomeAmortization of prior service cost and
unrecognized gains and losses . . . . . . . . . . $115 $242 Total Benefit CostImmediate recognition of prior service cost
and unrecognized gains and losses due tocurtailments, settlements, anddivestitures . . . . . . . . . . . . . . . . . . . . . . . . . 48 3 Total Benefit Cost
Unrecognized Net Actuarial Losses andPrior Service Costs, before tax . . . . . . . . $163 $245
Tax effect . . . . . . . . . . . . . . . . . . . . . . . . . . (49) (11) United States and Foreign TaxesMinority interest . . . . . . . . . . . . . . . . . . . . . (9) (8) Minority Shareholders’ Net Income
Net of tax . . . . . . . . . . . . . . . . . . . . . . . . $105 $226 Goodyear Net Income
Deferred Derivative (Gains) Losses, beforetax . . . . . . . . . . . . . . . . . . . . . . . . . . . . . . . . $ — $ 2 Cost of Goods SoldTax effect . . . . . . . . . . . . . . . . . . . . . . . . . . 1 — United States and Foreign TaxesMinority interest . . . . . . . . . . . . . . . . . . . . . (1) — Minority Shareholders’ Net Income
Net of tax . . . . . . . . . . . . . . . . . . . . . . . . $ — $ 2 Goodyear Net Income
Total reclassifications . . . . . . . . . . . . . . . . . . . $108 $229 Goodyear Net Income
Amortization of prior service cost and unrecognized gains and losses and immediate recognition of prior servicecost and unrecognized gains and losses due to curtailments, settlements, and divestitures are included in thecomputation of total benefit cost. For further information, refer to Note 16, Pension, Other PostretirementBenefits and Savings Plans.
Note 21. Investments in Unconsolidated Affiliates
The following tables present summarized financial information for financial position and results of operations ofour investments accounted for under the equity method:
(In millions) 2014 2013
Financial Position:
Current assets . . . . . . . . . . . . . . . . . . . . . . . . . . . . . . . . . . . . . . . . . . . . . . . . . . . . . . . $534 $614
Noncurrent assets . . . . . . . . . . . . . . . . . . . . . . . . . . . . . . . . . . . . . . . . . . . . . . . . . . . . 78 84
Current liabilities . . . . . . . . . . . . . . . . . . . . . . . . . . . . . . . . . . . . . . . . . . . . . . . . . . . . . 394 384
Noncurrent liabilities . . . . . . . . . . . . . . . . . . . . . . . . . . . . . . . . . . . . . . . . . . . . . . . . . . 16 16
Noncontrolling interests . . . . . . . . . . . . . . . . . . . . . . . . . . . . . . . . . . . . . . . . . . . . . . . 46 48
100
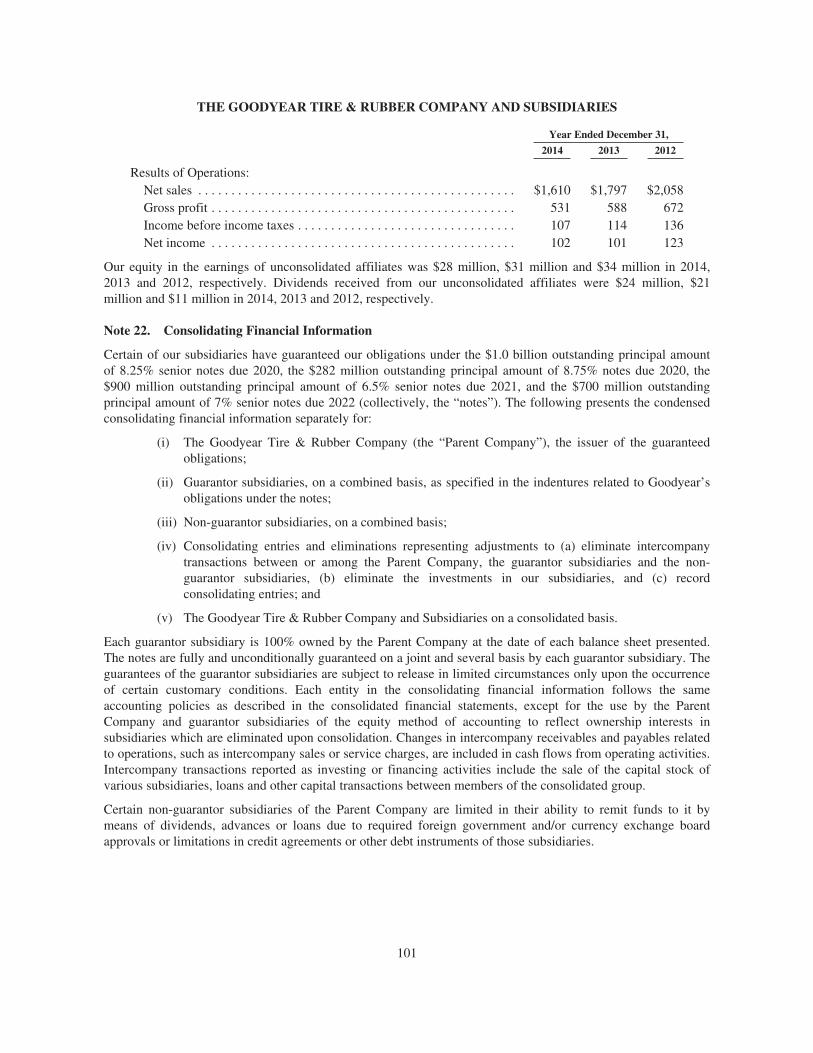
THE GOODYEAR TIRE & RUBBER COMPANY AND SUBSIDIARIES
Year Ended December 31,
2014 2013 2012
Results of Operations:Net sales . . . . . . . . . . . . . . . . . . . . . . . . . . . . . . . . . . . . . . . . . . . . . . . . $1,610 $1,797 $2,058Gross profit . . . . . . . . . . . . . . . . . . . . . . . . . . . . . . . . . . . . . . . . . . . . . . 531 588 672Income before income taxes . . . . . . . . . . . . . . . . . . . . . . . . . . . . . . . . . 107 114 136Net income . . . . . . . . . . . . . . . . . . . . . . . . . . . . . . . . . . . . . . . . . . . . . . 102 101 123
Our equity in the earnings of unconsolidated affiliates was $28 million, $31 million and $34 million in 2014,2013 and 2012, respectively. Dividends received from our unconsolidated affiliates were $24 million, $21million and $11 million in 2014, 2013 and 2012, respectively.
Note 22. Consolidating Financial Information
Certain of our subsidiaries have guaranteed our obligations under the $1.0 billion outstanding principal amountof 8.25% senior notes due 2020, the $282 million outstanding principal amount of 8.75% notes due 2020, the$900 million outstanding principal amount of 6.5% senior notes due 2021, and the $700 million outstandingprincipal amount of 7% senior notes due 2022 (collectively, the “notes”). The following presents the condensedconsolidating financial information separately for:
(i) The Goodyear Tire & Rubber Company (the “Parent Company”), the issuer of the guaranteedobligations;
(ii) Guarantor subsidiaries, on a combined basis, as specified in the indentures related to Goodyear’sobligations under the notes;
(iii) Non-guarantor subsidiaries, on a combined basis;
(iv) Consolidating entries and eliminations representing adjustments to (a) eliminate intercompanytransactions between or among the Parent Company, the guarantor subsidiaries and the non-guarantor subsidiaries, (b) eliminate the investments in our subsidiaries, and (c) recordconsolidating entries; and
(v) The Goodyear Tire & Rubber Company and Subsidiaries on a consolidated basis.
Each guarantor subsidiary is 100% owned by the Parent Company at the date of each balance sheet presented.The notes are fully and unconditionally guaranteed on a joint and several basis by each guarantor subsidiary. Theguarantees of the guarantor subsidiaries are subject to release in limited circumstances only upon the occurrenceof certain customary conditions. Each entity in the consolidating financial information follows the sameaccounting policies as described in the consolidated financial statements, except for the use by the ParentCompany and guarantor subsidiaries of the equity method of accounting to reflect ownership interests insubsidiaries which are eliminated upon consolidation. Changes in intercompany receivables and payables relatedto operations, such as intercompany sales or service charges, are included in cash flows from operating activities.Intercompany transactions reported as investing or financing activities include the sale of the capital stock ofvarious subsidiaries, loans and other capital transactions between members of the consolidated group.
Certain non-guarantor subsidiaries of the Parent Company are limited in their ability to remit funds to it bymeans of dividends, advances or loans due to required foreign government and/or currency exchange boardapprovals or limitations in credit agreements or other debt instruments of those subsidiaries.
101

THE GOODYEAR TIRE & RUBBER COMPANY AND SUBSIDIARIES
Condensed Consolidating Balance SheetDecember 31, 2014
(In millions)Parent
CompanyGuarantor
Subsidiaries
Non-Guarantor
Subsidiaries
ConsolidatingEntries andEliminations Consolidated
Assets:Current Assets:
Cash and Cash Equivalents . . . . . . . . . . . . . . . . . . . . . . . . . . . $ 674 $ 89 $1,398 $ — $ 2,161Accounts Receivable . . . . . . . . . . . . . . . . . . . . . . . . . . . . . . . . 833 166 1,127 — 2,126Accounts Receivable From Affiliates . . . . . . . . . . . . . . . . . . . — 623 — (623) —Inventories . . . . . . . . . . . . . . . . . . . . . . . . . . . . . . . . . . . . . . . . 1,151 148 1,410 (38) 2,671Deferred Income Taxes . . . . . . . . . . . . . . . . . . . . . . . . . . . . . . 496 6 66 2 570Prepaid Expenses and Other Current Assets . . . . . . . . . . . . . . 39 2 156 (1) 196
Total Current Assets . . . . . . . . . . . . . . . . . . . . . . . . . . . . . 3,193 1,034 4,157 (660) 7,724Goodwill . . . . . . . . . . . . . . . . . . . . . . . . . . . . . . . . . . . . . . . . . . . — 24 462 115 601Intangible Assets . . . . . . . . . . . . . . . . . . . . . . . . . . . . . . . . . . . . . 114 — 24 — 138Deferred Income Taxes . . . . . . . . . . . . . . . . . . . . . . . . . . . . . . . . 1,633 24 96 9 1,762Other Assets . . . . . . . . . . . . . . . . . . . . . . . . . . . . . . . . . . . . . . . . . 234 86 411 — 731Investments in Subsidiaries . . . . . . . . . . . . . . . . . . . . . . . . . . . . . 4,054 416 — (4,470) —Property, Plant and Equipment . . . . . . . . . . . . . . . . . . . . . . . . . . 2,329 132 4,721 (29) 7,153
Total Assets . . . . . . . . . . . . . . . . . . . . . . . . . . . . . . . . . . . . . $11,557 $1,716 $9,871 $(5,035) $18,109
Liabilities:Current Liabilities:
Accounts Payable-Trade . . . . . . . . . . . . . . . . . . . . . . . . . . . . . $ 910 $ 191 $1,777 $ — $ 2,878Accounts Payable to Affiliates . . . . . . . . . . . . . . . . . . . . . . . . . 557 — 66 (623) —Compensation and Benefits . . . . . . . . . . . . . . . . . . . . . . . . . . . 392 31 301 — 724Other Current Liabilities . . . . . . . . . . . . . . . . . . . . . . . . . . . . . 350 23 589 (6) 956Notes Payable and Overdrafts . . . . . . . . . . . . . . . . . . . . . . . . . — — 30 — 30Long Term Debt and Capital Leases Due Within One
Year . . . . . . . . . . . . . . . . . . . . . . . . . . . . . . . . . . . . . . . . . . . 6 — 142 — 148
Total Current Liabilities . . . . . . . . . . . . . . . . . . . . . . . . . . 2,215 245 2,905 (629) 4,736Long Term Debt and Capital Leases . . . . . . . . . . . . . . . . . . . . . . 4,375 — 1,841 — 6,216Compensation and Benefits . . . . . . . . . . . . . . . . . . . . . . . . . . . . . 666 127 883 — 1,676Deferred and Other Noncurrent Income Taxes . . . . . . . . . . . . . . 3 5 179 (6) 181Other Long Term Liabilities . . . . . . . . . . . . . . . . . . . . . . . . . . . . 688 30 155 — 873
Total Liabilities . . . . . . . . . . . . . . . . . . . . . . . . . . . . . . . . . 7,947 407 5,963 (635) 13,682Commitments and Contingent LiabilitiesMinority Shareholders’ Equity . . . . . . . . . . . . . . . . . . . . . . . . . . — — 392 190 582Shareholders’ Equity:Goodyear Shareholders’ Equity:
Common Stock . . . . . . . . . . . . . . . . . . . . . . . . . . . . . . . . . . . . . 269 — — — 269Other Equity . . . . . . . . . . . . . . . . . . . . . . . . . . . . . . . . . . . . . . . 3,341 1,309 3,281 (4,590) 3,341
Goodyear Shareholders’ Equity . . . . . . . . . . . . . . . . . . . . 3,610 1,309 3,281 (4,590) 3,610Minority Shareholders’ Equity — Nonredeemable . . . . . . . . . . . — — 235 — 235
Total Shareholders’ Equity . . . . . . . . . . . . . . . . . . . . . . . . 3,610 1,309 3,516 (4,590) 3,845
Total Liabilities and Shareholders’ Equity . . . . . . . . . . . $11,557 $1,716 $9,871 $(5,035) $18,109
102
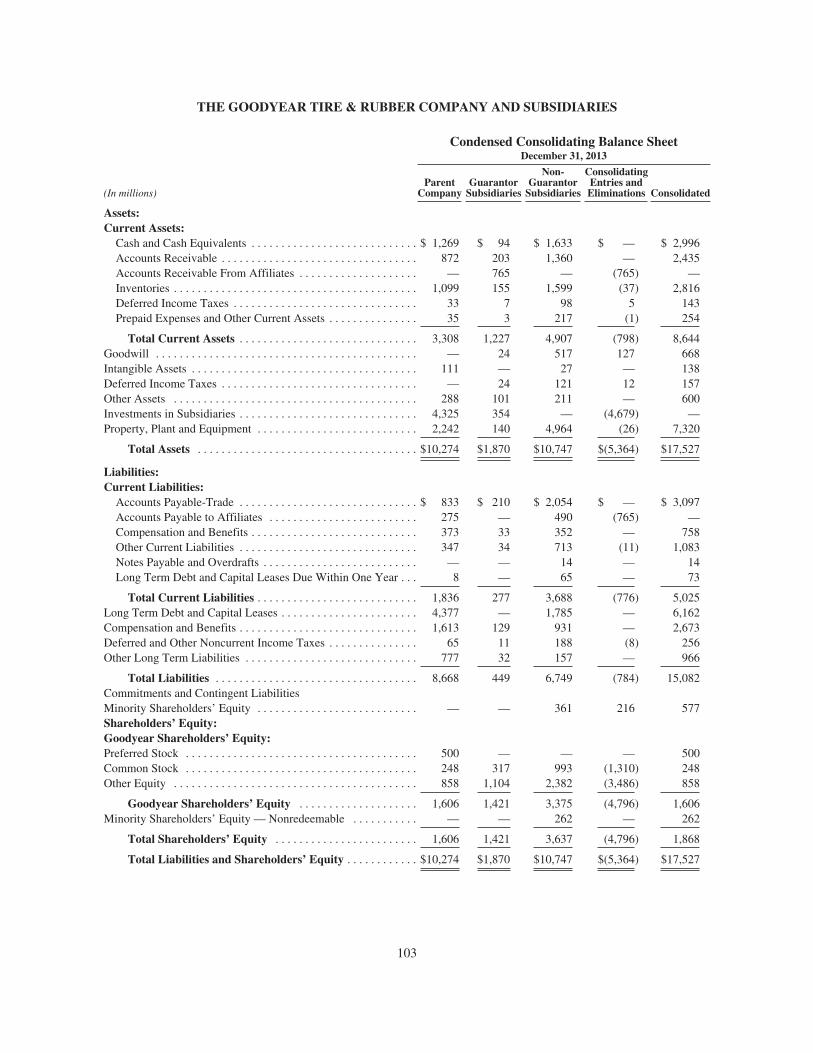
THE GOODYEAR TIRE & RUBBER COMPANY AND SUBSIDIARIES
Condensed Consolidating Balance SheetDecember 31, 2013
(In millions)Parent
CompanyGuarantor
Subsidiaries
Non-Guarantor
Subsidiaries
ConsolidatingEntries andEliminations Consolidated
Assets:Current Assets:
Cash and Cash Equivalents . . . . . . . . . . . . . . . . . . . . . . . . . . . . $ 1,269 $ 94 $ 1,633 $ — $ 2,996Accounts Receivable . . . . . . . . . . . . . . . . . . . . . . . . . . . . . . . . . 872 203 1,360 — 2,435Accounts Receivable From Affiliates . . . . . . . . . . . . . . . . . . . . — 765 — (765) —Inventories . . . . . . . . . . . . . . . . . . . . . . . . . . . . . . . . . . . . . . . . . 1,099 155 1,599 (37) 2,816Deferred Income Taxes . . . . . . . . . . . . . . . . . . . . . . . . . . . . . . . 33 7 98 5 143Prepaid Expenses and Other Current Assets . . . . . . . . . . . . . . . 35 3 217 (1) 254
Total Current Assets . . . . . . . . . . . . . . . . . . . . . . . . . . . . . . 3,308 1,227 4,907 (798) 8,644Goodwill . . . . . . . . . . . . . . . . . . . . . . . . . . . . . . . . . . . . . . . . . . . . — 24 517 127 668Intangible Assets . . . . . . . . . . . . . . . . . . . . . . . . . . . . . . . . . . . . . . 111 — 27 — 138Deferred Income Taxes . . . . . . . . . . . . . . . . . . . . . . . . . . . . . . . . . — 24 121 12 157Other Assets . . . . . . . . . . . . . . . . . . . . . . . . . . . . . . . . . . . . . . . . . 288 101 211 — 600Investments in Subsidiaries . . . . . . . . . . . . . . . . . . . . . . . . . . . . . . 4,325 354 — (4,679) —Property, Plant and Equipment . . . . . . . . . . . . . . . . . . . . . . . . . . . 2,242 140 4,964 (26) 7,320
Total Assets . . . . . . . . . . . . . . . . . . . . . . . . . . . . . . . . . . . . . $10,274 $1,870 $10,747 $(5,364) $17,527
Liabilities:Current Liabilities:
Accounts Payable-Trade . . . . . . . . . . . . . . . . . . . . . . . . . . . . . . $ 833 $ 210 $ 2,054 $ — $ 3,097Accounts Payable to Affiliates . . . . . . . . . . . . . . . . . . . . . . . . . 275 — 490 (765) —Compensation and Benefits . . . . . . . . . . . . . . . . . . . . . . . . . . . . 373 33 352 — 758Other Current Liabilities . . . . . . . . . . . . . . . . . . . . . . . . . . . . . . 347 34 713 (11) 1,083Notes Payable and Overdrafts . . . . . . . . . . . . . . . . . . . . . . . . . . — — 14 — 14Long Term Debt and Capital Leases Due Within One Year . . . 8 — 65 — 73
Total Current Liabilities . . . . . . . . . . . . . . . . . . . . . . . . . . . 1,836 277 3,688 (776) 5,025Long Term Debt and Capital Leases . . . . . . . . . . . . . . . . . . . . . . . 4,377 — 1,785 — 6,162Compensation and Benefits . . . . . . . . . . . . . . . . . . . . . . . . . . . . . . 1,613 129 931 — 2,673Deferred and Other Noncurrent Income Taxes . . . . . . . . . . . . . . . 65 11 188 (8) 256Other Long Term Liabilities . . . . . . . . . . . . . . . . . . . . . . . . . . . . . 777 32 157 — 966
Total Liabilities . . . . . . . . . . . . . . . . . . . . . . . . . . . . . . . . . . 8,668 449 6,749 (784) 15,082Commitments and Contingent LiabilitiesMinority Shareholders’ Equity . . . . . . . . . . . . . . . . . . . . . . . . . . . — — 361 216 577Shareholders’ Equity:Goodyear Shareholders’ Equity:Preferred Stock . . . . . . . . . . . . . . . . . . . . . . . . . . . . . . . . . . . . . . . 500 — — — 500Common Stock . . . . . . . . . . . . . . . . . . . . . . . . . . . . . . . . . . . . . . . 248 317 993 (1,310) 248Other Equity . . . . . . . . . . . . . . . . . . . . . . . . . . . . . . . . . . . . . . . . . 858 1,104 2,382 (3,486) 858
Goodyear Shareholders’ Equity . . . . . . . . . . . . . . . . . . . . 1,606 1,421 3,375 (4,796) 1,606Minority Shareholders’ Equity — Nonredeemable . . . . . . . . . . . — — 262 — 262
Total Shareholders’ Equity . . . . . . . . . . . . . . . . . . . . . . . . 1,606 1,421 3,637 (4,796) 1,868
Total Liabilities and Shareholders’ Equity . . . . . . . . . . . . $10,274 $1,870 $10,747 $(5,364) $17,527
103
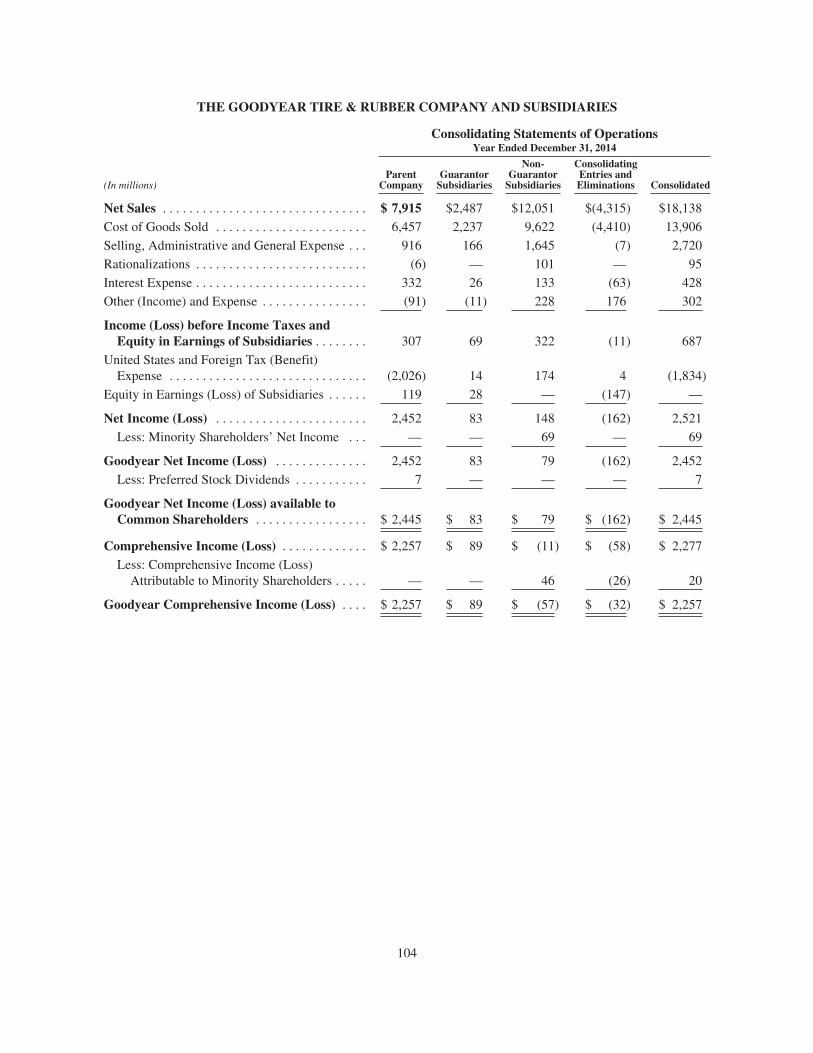
THE GOODYEAR TIRE & RUBBER COMPANY AND SUBSIDIARIES
Consolidating Statements of OperationsYear Ended December 31, 2014
(In millions)Parent
CompanyGuarantor
Subsidiaries
Non-Guarantor
Subsidiaries
ConsolidatingEntries andEliminations Consolidated
Net Sales . . . . . . . . . . . . . . . . . . . . . . . . . . . . . . . $ 7,915 $2,487 $12,051 $(4,315) $18,138
Cost of Goods Sold . . . . . . . . . . . . . . . . . . . . . . . 6,457 2,237 9,622 (4,410) 13,906
Selling, Administrative and General Expense . . . 916 166 1,645 (7) 2,720
Rationalizations . . . . . . . . . . . . . . . . . . . . . . . . . . (6) — 101 — 95
Interest Expense . . . . . . . . . . . . . . . . . . . . . . . . . . 332 26 133 (63) 428
Other (Income) and Expense . . . . . . . . . . . . . . . . (91) (11) 228 176 302
Income (Loss) before Income Taxes andEquity in Earnings of Subsidiaries . . . . . . . . 307 69 322 (11) 687
United States and Foreign Tax (Benefit)Expense . . . . . . . . . . . . . . . . . . . . . . . . . . . . . . (2,026) 14 174 4 (1,834)
Equity in Earnings (Loss) of Subsidiaries . . . . . . 119 28 — (147) —
Net Income (Loss) . . . . . . . . . . . . . . . . . . . . . . . 2,452 83 148 (162) 2,521
Less: Minority Shareholders’ Net Income . . . — — 69 — 69
Goodyear Net Income (Loss) . . . . . . . . . . . . . . 2,452 83 79 (162) 2,452
Less: Preferred Stock Dividends . . . . . . . . . . . 7 — — — 7
Goodyear Net Income (Loss) available toCommon Shareholders . . . . . . . . . . . . . . . . . $ 2,445 $ 83 $ 79 $ (162) $ 2,445
Comprehensive Income (Loss) . . . . . . . . . . . . . $ 2,257 $ 89 $ (11) $ (58) $ 2,277
Less: Comprehensive Income (Loss)Attributable to Minority Shareholders . . . . . — — 46 (26) 20
Goodyear Comprehensive Income (Loss) . . . . $ 2,257 $ 89 $ (57) $ (32) $ 2,257
104
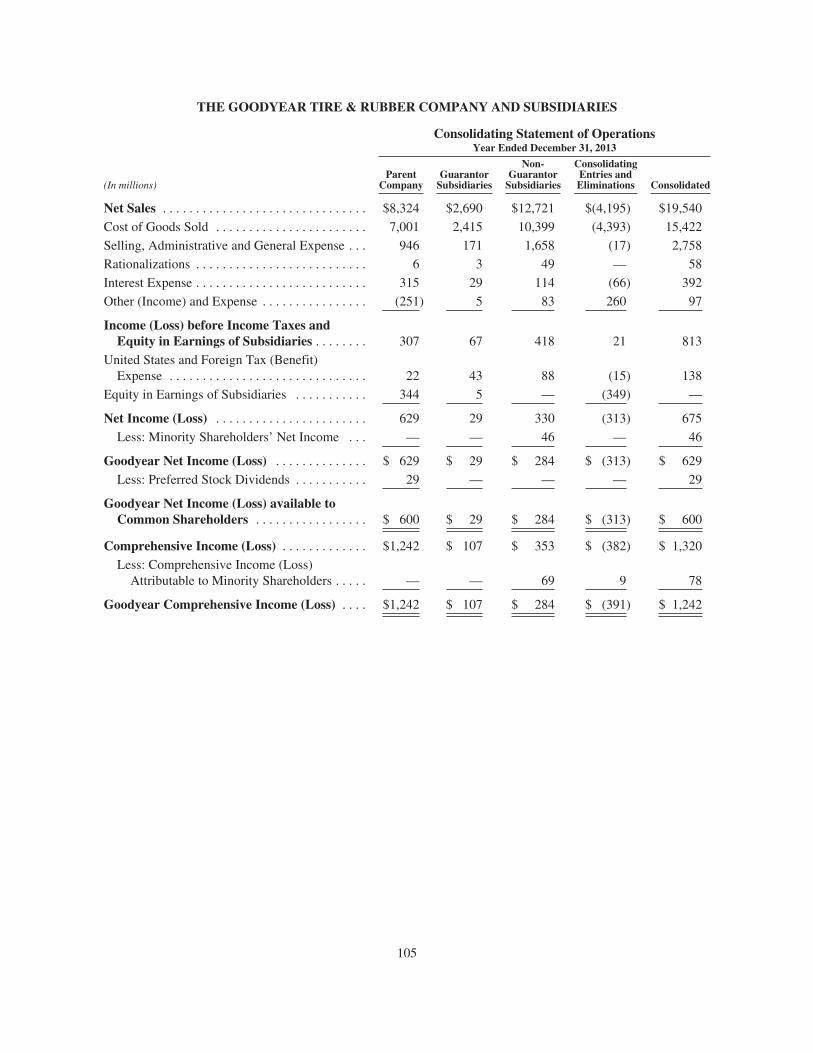
THE GOODYEAR TIRE & RUBBER COMPANY AND SUBSIDIARIES
Consolidating Statement of OperationsYear Ended December 31, 2013
(In millions)Parent
CompanyGuarantor
Subsidiaries
Non-Guarantor
Subsidiaries
ConsolidatingEntries andEliminations Consolidated
Net Sales . . . . . . . . . . . . . . . . . . . . . . . . . . . . . . . $8,324 $2,690 $12,721 $(4,195) $19,540
Cost of Goods Sold . . . . . . . . . . . . . . . . . . . . . . . 7,001 2,415 10,399 (4,393) 15,422
Selling, Administrative and General Expense . . . 946 171 1,658 (17) 2,758
Rationalizations . . . . . . . . . . . . . . . . . . . . . . . . . . 6 3 49 — 58
Interest Expense . . . . . . . . . . . . . . . . . . . . . . . . . . 315 29 114 (66) 392
Other (Income) and Expense . . . . . . . . . . . . . . . . (251) 5 83 260 97
Income (Loss) before Income Taxes andEquity in Earnings of Subsidiaries . . . . . . . . 307 67 418 21 813
United States and Foreign Tax (Benefit)Expense . . . . . . . . . . . . . . . . . . . . . . . . . . . . . . 22 43 88 (15) 138
Equity in Earnings of Subsidiaries . . . . . . . . . . . 344 5 — (349) —
Net Income (Loss) . . . . . . . . . . . . . . . . . . . . . . . 629 29 330 (313) 675
Less: Minority Shareholders’ Net Income . . . — — 46 — 46
Goodyear Net Income (Loss) . . . . . . . . . . . . . . $ 629 $ 29 $ 284 $ (313) $ 629
Less: Preferred Stock Dividends . . . . . . . . . . . 29 — — — 29
Goodyear Net Income (Loss) available toCommon Shareholders . . . . . . . . . . . . . . . . . $ 600 $ 29 $ 284 $ (313) $ 600
Comprehensive Income (Loss) . . . . . . . . . . . . . $1,242 $ 107 $ 353 $ (382) $ 1,320
Less: Comprehensive Income (Loss)Attributable to Minority Shareholders . . . . . — — 69 9 78
Goodyear Comprehensive Income (Loss) . . . . $1,242 $ 107 $ 284 $ (391) $ 1,242
105

THE GOODYEAR TIRE & RUBBER COMPANY AND SUBSIDIARIES
Consolidating Statements of OperationsYear Ended December 31, 2012
(In millions)Parent
CompanyGuarantor
Subsidiaries
Non-Guarantor
Subsidiaries
ConsolidatingEntries andEliminations Consolidated
Net Sales . . . . . . . . . . . . . . . . . . . . . . . . . . . . . . . $8,898 $2,883 $13,665 $(4,454) $20,992
Cost of Goods Sold . . . . . . . . . . . . . . . . . . . . . . . 7,792 2,587 11,439 (4,655) 17,163
Selling, Administrative and General Expense . . . 895 182 1,652 (11) 2,718
Rationalizations . . . . . . . . . . . . . . . . . . . . . . . . . . 38 7 130 — 175
Interest Expense . . . . . . . . . . . . . . . . . . . . . . . . . . 258 26 137 (64) 357
Other (Income) and Expense . . . . . . . . . . . . . . . . (152) (30) 30 291 139
Income (Loss) before Income Taxes andEquity in Earnings of Subsidiaries . . . . . . . . 67 111 277 (15) 440
United States and Foreign Tax (Benefit)Expense . . . . . . . . . . . . . . . . . . . . . . . . . . . . . . 23 29 152 (1) 203
Equity in Earnings of Subsidiaries . . . . . . . . . . . 168 (14) — (154) —
Net Income (Loss) . . . . . . . . . . . . . . . . . . . . . . . 212 68 125 (168) 237
Less: Minority Shareholders’ Net Income . . . — — 25 — 25
Goodyear Net Income (Loss) . . . . . . . . . . . . . . $ 212 $ 68 $ 100 $ (168) $ 212
Less: Preferred Stock Dividends . . . . . . . . . . . 29 — — — 29
Goodyear Net Income (Loss) available toCommon Shareholders . . . . . . . . . . . . . . . . . $ 183 $ 68 $ 100 $ (168) $ 183
Comprehensive Income (Loss) . . . . . . . . . . . . . $ (362) $ 67 $ (144) $ 57 $ (382)
Less: Comprehensive Income (Loss)Attributable to Minority Shareholders . . . . . — — (24) 4 (20)
Goodyear Comprehensive Income (Loss) . . . . $ (362) $ 67 $ (120) $ 53 $ (362)
106

THE GOODYEAR TIRE & RUBBER COMPANY AND SUBSIDIARIES
Condensed Consolidating Statement of Cash FlowsYear Ended December 31, 2014
(In millions)Parent
CompanyGuarantor
Subsidiaries
Non-Guarantor
Subsidiaries
ConsolidatingEntries andEliminations Consolidated
Cash Flows from Operating Activities:Total Cash Flows from Operating
Activities . . . . . . . . . . . . . . . . . . . . . . . . . $ (334) $ 195 $ 758 $(279) $ 340Cash Flows from Investing Activities:
Capital Expenditures . . . . . . . . . . . . . . . . . . . . (303) (19) (607) 6 (923)Asset Dispositions . . . . . . . . . . . . . . . . . . . . . . 9 2 7 — 18Decrease (Increase) in Restricted Cash . . . . . . (1) — 6 — 5Short Term Securities Acquired . . . . . . . . . . . — — (72) — (72)Short Term Securities Redeemed . . . . . . . . . . — — 95 — 95Capital Contributions Received and Loans
Incurred . . . . . . . . . . . . . . . . . . . . . . . . . . . . (382) — (457) 839 —Capital Redemptions and Loans Paid . . . . . . . 459 — 244 (703) —Other Transactions . . . . . . . . . . . . . . . . . . . . . . 13 — 13 — 26
Total Cash Flows from InvestingActivities . . . . . . . . . . . . . . . . . . . . . . . . . (205) (17) (771) 142 (851)
Cash Flows from Financing Activities:Short Term Debt and Overdrafts Incurred . . . . 22 — 60 (36) 46Short Term Debt and Overdrafts Paid . . . . . . . (14) (22) (24) 36 (24)Long Term Debt Incurred . . . . . . . . . . . . . . . . 601 — 1,241 — 1,842Long Term Debt Paid . . . . . . . . . . . . . . . . . . . (608) — (947) — (1,555)Common Stock Issued . . . . . . . . . . . . . . . . . . . 39 — — — 39Common Stock Repurchased . . . . . . . . . . . . . . (234) — — — (234)Common Stock Dividends Paid . . . . . . . . . . . . (60) — — — (60)Preferred Stock Dividends Paid . . . . . . . . . . . . (15) — — — (15)Capital Contributions Received and Loans
Incurred . . . . . . . . . . . . . . . . . . . . . . . . . . . . 457 47 335 (839) —Capital Redemptions and Loans Paid . . . . . . . (244) — (459) 703 —Intercompany Dividends Paid . . . . . . . . . . . . . — (203) (70) 273 —Transactions with Minority Interests in
Subsidiaries . . . . . . . . . . . . . . . . . . . . . . . . . — — (49) — (49)Debt Related Costs and Other Transactions . . — — (1) — (1)
Total Cash Flows from FinancingActivities . . . . . . . . . . . . . . . . . . . . . . . . . (56) (178) 86 137 (11)
Effect of Exchange Rate Changes on Cash andCash Equivalents . . . . . . . . . . . . . . . . . . . . . . . — (5) (308) — (313)
Net Change in Cash and Cash Equivalents . . . (595) (5) (235) — (835)Cash and Cash Equivalents at Beginning of the
Year . . . . . . . . . . . . . . . . . . . . . . . . . . . . . . . . . 1,269 94 1,633 — 2,996
Cash and Cash Equivalents at End of theYear . . . . . . . . . . . . . . . . . . . . . . . . . . . . . . . . . $ 674 $ 89 $1,398 $ — $ 2,161
107

THE GOODYEAR TIRE & RUBBER COMPANY AND SUBSIDIARIES
Condensed Consolidating Statement of Cash FlowsYear Ended December 31, 2013
(In millions)Parent
CompanyGuarantor
Subsidiaries
Non-Guarantor
Subsidiaries
ConsolidatingEntries andEliminations Consolidated
Cash Flows from Operating Activities:Total Cash Flows from Operating Activities . . $ 17 $ 16 $1,009 $(104) $ 938
Cash Flows from Investing Activities:Capital Expenditures . . . . . . . . . . . . . . . . . . . . . . . . . (220) (19) (940) 11 (1,168)
Asset Dispositions . . . . . . . . . . . . . . . . . . . . . . . . . . . 2 — 23 — 25
Decrease (Increase) in Restricted Cash . . . . . . . . . . . — — 14 — 14
Short Term Securities Acquired . . . . . . . . . . . . . . . . — — (105) — (105)
Short Term Securities Redeemed . . . . . . . . . . . . . . . — — 89 — 89
Capital Contributions Received and LoansIncurred . . . . . . . . . . . . . . . . . . . . . . . . . . . . . . . . . (91) (11) (170) 272 —
Capital Redemptions and Loans Paid . . . . . . . . . . . . 214 — 403 (617) —
Other Transactions . . . . . . . . . . . . . . . . . . . . . . . . . . . — — 9 — 9
Total Cash Flows from Investing Activities . . . $ (95) $(30) $ (677) $(334) $(1,136)
Cash Flows from Financing Activities:Short Term Debt and Overdrafts Incurred . . . . . . . . . 14 — 121 (104) 31
Short Term Debt and Overdrafts Paid . . . . . . . . . . . . (90) (14) (120) 104 (120)
Long Term Debt Incurred . . . . . . . . . . . . . . . . . . . . . 900 — 1,013 — 1,913
Long Term Debt Paid . . . . . . . . . . . . . . . . . . . . . . . . (11) — (670) — (681)
Common Stock Issued . . . . . . . . . . . . . . . . . . . . . . . . 26 — — — 26
Common Stock Repurchased . . . . . . . . . . . . . . . . . . . (4) — — — (4)
Common Stock Dividends Paid . . . . . . . . . . . . . . . . . (12) — — — (12)
Preferred Stock Dividends Paid . . . . . . . . . . . . . . . . . (29) — — — (29)
Capital Contributions Received and LoansIncurred . . . . . . . . . . . . . . . . . . . . . . . . . . . . . . . . . 170 58 44 (272) —
Capital Redemptions and Loans Paid . . . . . . . . . . . . (403) — (214) 617 —
Intercompany Dividends Paid . . . . . . . . . . . . . . . . . . — — (93) 93 —
Transactions with Minority Interests inSubsidiaries . . . . . . . . . . . . . . . . . . . . . . . . . . . . . . — — (26) — (26)
Debt Related Costs and Other Transactions . . . . . . . (16) — — — (16)
Total Cash Flows from Financing Activities . . . 545 44 55 438 1,082
Effect of Exchange Rate Changes on Cash and CashEquivalents . . . . . . . . . . . . . . . . . . . . . . . . . . . . . . . . — (4) (165) — (169)
Net Change in Cash and Cash Equivalents . . . . . . . . 467 26 222 — 715
Cash and Cash Equivalents at Beginning of theYear . . . . . . . . . . . . . . . . . . . . . . . . . . . . . . . . . . . . . . 802 68 1,411 — 2,281
Cash and Cash Equivalents at End of the Year . . . . $1,269 $ 94 $1,633 $ — $ 2,996
108
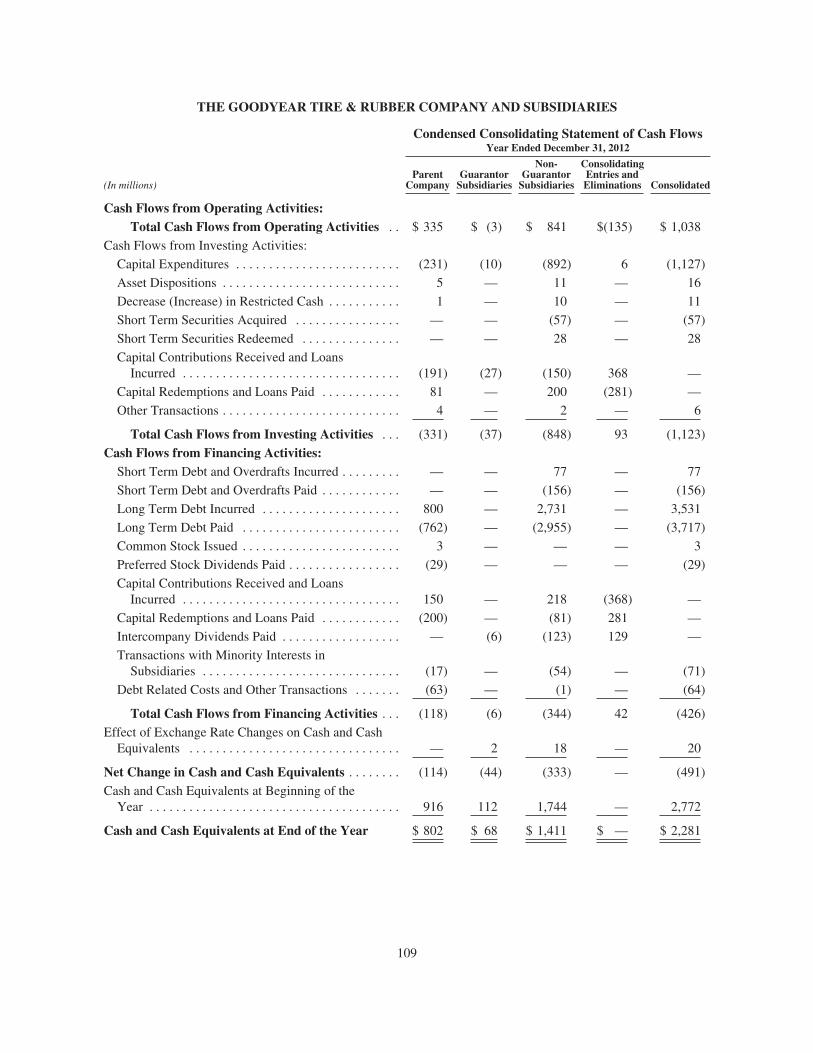
THE GOODYEAR TIRE & RUBBER COMPANY AND SUBSIDIARIES
Condensed Consolidating Statement of Cash FlowsYear Ended December 31, 2012
(In millions)Parent
CompanyGuarantor
Subsidiaries
Non-Guarantor
Subsidiaries
ConsolidatingEntries andEliminations Consolidated
Cash Flows from Operating Activities:Total Cash Flows from Operating Activities . . $ 335 $ (3) $ 841 $(135) $ 1,038
Cash Flows from Investing Activities:
Capital Expenditures . . . . . . . . . . . . . . . . . . . . . . . . . (231) (10) (892) 6 (1,127)
Asset Dispositions . . . . . . . . . . . . . . . . . . . . . . . . . . . 5 — 11 — 16
Decrease (Increase) in Restricted Cash . . . . . . . . . . . 1 — 10 — 11
Short Term Securities Acquired . . . . . . . . . . . . . . . . — — (57) — (57)
Short Term Securities Redeemed . . . . . . . . . . . . . . . — — 28 — 28
Capital Contributions Received and LoansIncurred . . . . . . . . . . . . . . . . . . . . . . . . . . . . . . . . . (191) (27) (150) 368 —
Capital Redemptions and Loans Paid . . . . . . . . . . . . 81 — 200 (281) —
Other Transactions . . . . . . . . . . . . . . . . . . . . . . . . . . . 4 — 2 — 6
Total Cash Flows from Investing Activities . . . (331) (37) (848) 93 (1,123)
Cash Flows from Financing Activities:Short Term Debt and Overdrafts Incurred . . . . . . . . . — — 77 — 77
Short Term Debt and Overdrafts Paid . . . . . . . . . . . . — — (156) — (156)
Long Term Debt Incurred . . . . . . . . . . . . . . . . . . . . . 800 — 2,731 — 3,531
Long Term Debt Paid . . . . . . . . . . . . . . . . . . . . . . . . (762) — (2,955) — (3,717)
Common Stock Issued . . . . . . . . . . . . . . . . . . . . . . . . 3 — — — 3
Preferred Stock Dividends Paid . . . . . . . . . . . . . . . . . (29) — — — (29)
Capital Contributions Received and LoansIncurred . . . . . . . . . . . . . . . . . . . . . . . . . . . . . . . . . 150 — 218 (368) —
Capital Redemptions and Loans Paid . . . . . . . . . . . . (200) — (81) 281 —
Intercompany Dividends Paid . . . . . . . . . . . . . . . . . . — (6) (123) 129 —
Transactions with Minority Interests inSubsidiaries . . . . . . . . . . . . . . . . . . . . . . . . . . . . . . (17) — (54) — (71)
Debt Related Costs and Other Transactions . . . . . . . (63) — (1) — (64)
Total Cash Flows from Financing Activities . . . (118) (6) (344) 42 (426)
Effect of Exchange Rate Changes on Cash and CashEquivalents . . . . . . . . . . . . . . . . . . . . . . . . . . . . . . . . — 2 18 — 20
Net Change in Cash and Cash Equivalents . . . . . . . . (114) (44) (333) — (491)
Cash and Cash Equivalents at Beginning of theYear . . . . . . . . . . . . . . . . . . . . . . . . . . . . . . . . . . . . . . 916 112 1,744 — 2,772
Cash and Cash Equivalents at End of the Year $ 802 $ 68 $ 1,411 $ — $ 2,281
109

MANAGEMENT’S REPORT ON INTERNAL CONTROL OVER FINANCIAL REPORTING
Management of the Company is responsible for establishing and maintaining adequate internal control overfinancial reporting as such term is defined under Rule 13a-15(f) promulgated under the Securities Exchange Actof 1934, as amended.
Internal control over financial reporting is a process designed to provide reasonable assurance regarding thereliability of financial reporting and the preparation of the Company’s consolidated financial statements forexternal purposes in accordance with generally accepted accounting principles.
Internal control over financial reporting includes those policies and procedures that (i) pertain to the maintenanceof records that, in reasonable detail, accurately and fairly reflect the transactions and dispositions of the assets ofthe Company; (ii) provide reasonable assurance that transactions are recorded as necessary to permit thepreparation of the consolidated financial statements in accordance with generally accepted accounting principles,and that receipts and expenditures of the Company are being made only in accordance with appropriateauthorizations of management and directors of the Company; and (iii) provide reasonable assurance regardingprevention or timely detection of unauthorized acquisition, use or disposition of the Company’s assets that couldhave a material effect on the consolidated financial statements.
Because of its inherent limitations, internal control over financial reporting may not prevent or detectmisstatements. Also, projections of any evaluation of effectiveness to future periods are subject to the risk thatcontrols may become inadequate because of changes in conditions, or that the degree of compliance with thepolicies or procedures may deteriorate.
Management conducted an assessment of the Company’s internal control over financial reporting as ofDecember 31, 2014 using the framework specified in Internal Control — Integrated Framework (2013),published by the Committee of Sponsoring Organizations of the Treadway Commission. Based on suchassessment, management has concluded that the Company’s internal control over financial reporting waseffective as of December 31, 2014.
The effectiveness of the Company’s internal control over financial reporting as of December 31, 2014 has beenaudited by PricewaterhouseCoopers LLP, an independent registered public accounting firm, as stated in theirreport which is presented in this Annual Report.
110

REPORT OF INDEPENDENT REGISTERED PUBLIC ACCOUNTING FIRM
To The Board of Directors and Shareholders of The Goodyear Tire & Rubber Company
In our opinion, the accompanying consolidated balance sheets and the related consolidated statements ofoperations, comprehensive income (loss), shareholders’ equity and cash flows present fairly, in all materialrespects, the financial position of The Goodyear Tire & Rubber Company and its subsidiaries at December 31,2014 and 2013, and the results of their operations and their cash flows for each of the three years in the periodended December 31, 2014 in conformity with accounting principles generally accepted in the United States ofAmerica. Also in our opinion, the Company maintained, in all material respects, effective internal control overfinancial reporting as of December 31, 2014, based on criteria established in Internal Control — IntegratedFramework (2013) issued by the Committee of Sponsoring Organizations of the Treadway Commission (COSO).The Company’s management is responsible for these financial statements, for maintaining effective internalcontrol over financial reporting and for its assessment of the effectiveness of internal control over financialreporting, included in the accompanying Management’s Report on Internal Control over Financial Reporting.Our responsibility is to express opinions on these financial statements and on the Company’s internal controlover financial reporting based on our integrated audits. We conducted our audits in accordance with the standardsof the Public Company Accounting Oversight Board (United States). Those standards require that we plan andperform the audits to obtain reasonable assurance about whether the financial statements are free of materialmisstatement and whether effective internal control over financial reporting was maintained in all materialrespects. Our audits of the financial statements included examining, on a test basis, evidence supporting theamounts and disclosures in the financial statements, assessing the accounting principles used and significantestimates made by management, and evaluating the overall financial statement presentation. Our audit of internalcontrol over financial reporting included obtaining an understanding of internal control over financial reporting,assessing the risk that a material weakness exists, and testing and evaluating the design and operatingeffectiveness of internal control based on the assessed risk. Our audits also included performing such otherprocedures as we considered necessary in the circumstances. We believe that our audits provide a reasonablebasis for our opinions.
A company’s internal control over financial reporting is a process designed to provide reasonable assuranceregarding the reliability of financial reporting and the preparation of financial statements for external purposes inaccordance with generally accepted accounting principles. A company’s internal control over financial reportingincludes those policies and procedures that (i) pertain to the maintenance of records that, in reasonable detail,accurately and fairly reflect the transactions and dispositions of the assets of the company; (ii) provide reasonableassurance that transactions are recorded as necessary to permit preparation of financial statements in accordancewith generally accepted accounting principles, and that receipts and expenditures of the company are being madeonly in accordance with authorizations of management and directors of the company; and (iii) provide reasonableassurance regarding prevention or timely detection of unauthorized acquisition, use, or disposition of thecompany’s assets that could have a material effect on the financial statements.
Because of its inherent limitations, internal control over financial reporting may not prevent or detectmisstatements. Also, projections of any evaluation of effectiveness to future periods are subject to the risk thatcontrols may become inadequate because of changes in conditions, or that the degree of compliance with thepolicies or procedures may deteriorate.
PRICEWATERHOUSECOOPERS LLP
Cleveland, Ohio
February 17, 2015
111

Supplementary Data
(Unaudited)
Quarterly Data and Market Price Information
Quarter
(In millions, except per share amounts) First Second Third Fourth Year
2014Net Sales . . . . . . . . . . . . . . . . . . . . . . . . . . . . . . . . . . . . . . . . . . . . . . . . . . $ 4,469 $ 4,656 $ 4,657 $ 4,356 $18,138Gross Profit . . . . . . . . . . . . . . . . . . . . . . . . . . . . . . . . . . . . . . . . . . . . . . . . 951 1,124 1,141 1,016 4,232Net Income (Loss) . . . . . . . . . . . . . . . . . . . . . . . . . . . . . . . . . . . . . . . . . . (38) 232 199 2,128 2,521
Less: Minority Shareholders’ Net Income (Loss) . . . . . . . . . . . . . . . . 13 19 38 (1) 69
Goodyear Net Income (Loss) . . . . . . . . . . . . . . . . . . . . . . . . . . . . . . . . . . (51) 213 161 2,129 2,452Less: Preferred Stock Dividends . . . . . . . . . . . . . . . . . . . . . . . . . . . . . 7 — — — 7
Goodyear Net Income (Loss) available to Common Shareholders . . . . . $ (58) $ 213 $ 161 $ 2,129 $ 2,445
Goodyear Net Income (Loss) available to Common Shareholders — PerShare of Common Stock:— Basic . . . . . . . . . . . . . . . . . . . . . . . . . . . . . . . . . . . . . . . . . . . . . . . . $ (0.23) $ 0.77 $ 0.58 $ 7.82 $ 9.13
— Diluted * . . . . . . . . . . . . . . . . . . . . . . . . . . . . . . . . . . . . . . . . . . . . . $ (0.23) $ 0.76 $ 0.58 $ 7.68 $ 8.78
Weighted Average Shares Outstanding — Basic . . . . . . . . . . . . . . . . . . . 248 276 275 272 268— Diluted . . . . . . . . . . . . . . . . . 248 281 279 277 279
Dividends Declared per Share of Common Stock . . . . . . . . . . . . . . . . . . $ 0.05 $ 0.05 $ 0.06 $ 0.06 $ 0.22Price Range of Common Stock: High . . . . . . . . . . . . . . . . . . . . . . . . . . . $ 28.32 $ 28.48 $ 28.70 $ 28.86 $ 28.86
Low . . . . . . . . . . . . . . . . . . . . . . . . . . . . 22.33 23.79 22.32 18.87 18.87Selected Balance Sheet Items at Quarter-End:
Total Assets . . . . . . . . . . . . . . . . . . . . . . . . . . . . . . . . . . . . . . . . . . . . . $17,092 $16,942 $16,656 $18,109Total Debt and Capital Leases . . . . . . . . . . . . . . . . . . . . . . . . . . . . . . . 7,120 6,762 6,855 6,394Goodyear Shareholders’ Equity . . . . . . . . . . . . . . . . . . . . . . . . . . . . . . 1,593 1,825 1,862 3,610Total Shareholders’ Equity . . . . . . . . . . . . . . . . . . . . . . . . . . . . . . . . . . 1,837 2,069 2,103 3,845
* Due to the anti-dilutive impact of potentially dilutive securities, the quarterly earnings per share amounts donot add to the full year.
All numbers presented below are after-tax and minority.
The first quarter of 2014 included net charges of $132 million related to a foreign currency remeasurement lossresulting from the devaluation of the Venezuelan bolivar fuerte, a pension curtailment loss of $32 million as aresult of the future accrual freezes to pension plans in North America, net rationalization charges of $29 millionprimarily due to the closure of one of our manufacturing facilities in Amiens, France, charges of $7 millionrelated to a previously closed facility in Greece, a settlement loss of $4 million related to lump sum payments tosettle certain liabilities for our U.K. pension plans, net losses on asset sales of $2 million and asset write-offs andaccelerated depreciation related to the closure of one of our Amiens, France manufacturing facilities of $1million.
The second quarter of 2014 included net rationalization charges of $17 million primarily due to the closure ofone of our manufacturing facilities in Amiens, France, charges of $10 million related to a previously closedfacility in Greece, and asset write-offs and accelerated depreciation related to property and equipment in one ofour manufacturing facilities in the United Kingdom of $2 million. Net gains resulting from the settlement ofindirect tax claims were $13 million and net gains from asset sales were $4 million.
The third quarter of 2014 included net tax charges of $47 million related to discrete tax items, including theestablishment of valuation allowances on the net deferred tax assets of our Venezuelan and Braziliansubsidiaries, charges of $16 million related to a government investigation involving our compliance with the U.S.Foreign Corrupt Practices Act in certain countries in Africa, net rationalization charges of $9 million primarily
112
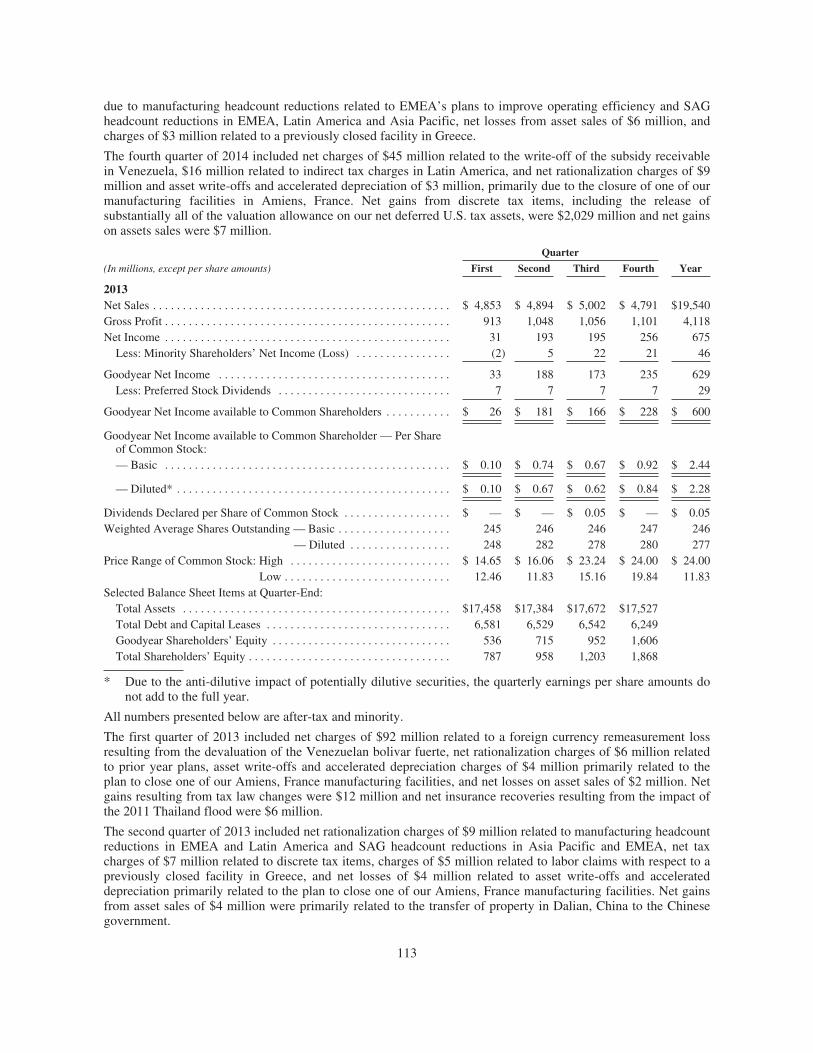
due to manufacturing headcount reductions related to EMEA’s plans to improve operating efficiency and SAGheadcount reductions in EMEA, Latin America and Asia Pacific, net losses from asset sales of $6 million, andcharges of $3 million related to a previously closed facility in Greece.
The fourth quarter of 2014 included net charges of $45 million related to the write-off of the subsidy receivablein Venezuela, $16 million related to indirect tax charges in Latin America, and net rationalization charges of $9million and asset write-offs and accelerated depreciation of $3 million, primarily due to the closure of one of ourmanufacturing facilities in Amiens, France. Net gains from discrete tax items, including the release ofsubstantially all of the valuation allowance on our net deferred U.S. tax assets, were $2,029 million and net gainson assets sales were $7 million.
Quarter
(In millions, except per share amounts) First Second Third Fourth Year
2013Net Sales . . . . . . . . . . . . . . . . . . . . . . . . . . . . . . . . . . . . . . . . . . . . . . . . . . $ 4,853 $ 4,894 $ 5,002 $ 4,791 $19,540Gross Profit . . . . . . . . . . . . . . . . . . . . . . . . . . . . . . . . . . . . . . . . . . . . . . . . 913 1,048 1,056 1,101 4,118Net Income . . . . . . . . . . . . . . . . . . . . . . . . . . . . . . . . . . . . . . . . . . . . . . . . 31 193 195 256 675
Less: Minority Shareholders’ Net Income (Loss) . . . . . . . . . . . . . . . . (2) 5 22 21 46
Goodyear Net Income . . . . . . . . . . . . . . . . . . . . . . . . . . . . . . . . . . . . . . . 33 188 173 235 629Less: Preferred Stock Dividends . . . . . . . . . . . . . . . . . . . . . . . . . . . . . 7 7 7 7 29
Goodyear Net Income available to Common Shareholders . . . . . . . . . . . $ 26 $ 181 $ 166 $ 228 $ 600
Goodyear Net Income available to Common Shareholder — Per Shareof Common Stock:— Basic . . . . . . . . . . . . . . . . . . . . . . . . . . . . . . . . . . . . . . . . . . . . . . . . $ 0.10 $ 0.74 $ 0.67 $ 0.92 $ 2.44
— Diluted* . . . . . . . . . . . . . . . . . . . . . . . . . . . . . . . . . . . . . . . . . . . . . . $ 0.10 $ 0.67 $ 0.62 $ 0.84 $ 2.28
Dividends Declared per Share of Common Stock . . . . . . . . . . . . . . . . . . $ — $ — $ 0.05 $ — $ 0.05Weighted Average Shares Outstanding — Basic . . . . . . . . . . . . . . . . . . . 245 246 246 247 246
— Diluted . . . . . . . . . . . . . . . . . 248 282 278 280 277Price Range of Common Stock: High . . . . . . . . . . . . . . . . . . . . . . . . . . . $ 14.65 $ 16.06 $ 23.24 $ 24.00 $ 24.00
Low . . . . . . . . . . . . . . . . . . . . . . . . . . . . 12.46 11.83 15.16 19.84 11.83Selected Balance Sheet Items at Quarter-End:
Total Assets . . . . . . . . . . . . . . . . . . . . . . . . . . . . . . . . . . . . . . . . . . . . . $17,458 $17,384 $17,672 $17,527Total Debt and Capital Leases . . . . . . . . . . . . . . . . . . . . . . . . . . . . . . . 6,581 6,529 6,542 6,249Goodyear Shareholders’ Equity . . . . . . . . . . . . . . . . . . . . . . . . . . . . . . 536 715 952 1,606Total Shareholders’ Equity . . . . . . . . . . . . . . . . . . . . . . . . . . . . . . . . . . 787 958 1,203 1,868
* Due to the anti-dilutive impact of potentially dilutive securities, the quarterly earnings per share amounts donot add to the full year.
All numbers presented below are after-tax and minority.
The first quarter of 2013 included net charges of $92 million related to a foreign currency remeasurement lossresulting from the devaluation of the Venezuelan bolivar fuerte, net rationalization charges of $6 million relatedto prior year plans, asset write-offs and accelerated depreciation charges of $4 million primarily related to theplan to close one of our Amiens, France manufacturing facilities, and net losses on asset sales of $2 million. Netgains resulting from tax law changes were $12 million and net insurance recoveries resulting from the impact ofthe 2011 Thailand flood were $6 million.
The second quarter of 2013 included net rationalization charges of $9 million related to manufacturing headcountreductions in EMEA and Latin America and SAG headcount reductions in Asia Pacific and EMEA, net taxcharges of $7 million related to discrete tax items, charges of $5 million related to labor claims with respect to apreviously closed facility in Greece, and net losses of $4 million related to asset write-offs and accelerateddepreciation primarily related to the plan to close one of our Amiens, France manufacturing facilities. Net gainsfrom asset sales of $4 million were primarily related to the transfer of property in Dalian, China to the Chinesegovernment.
113

The third quarter of 2013 included net rationalization charges of $15 million primarily related to manufacturingheadcount reductions in EMEA and SAG headcount reductions in Asia Pacific and EMEA and asset write offsand accelerated depreciation charges of $5 million primarily related to the plan to close one of our Amiens,France manufacturing facilities. Net gains from asset sales of $2 million were primarily related to the sale ofproperties in North America.
The fourth quarter of 2013 included net rationalization charges of $11 million primarily related to manufacturingheadcount reductions in EMEA and asset write-offs and accelerated depreciation of $6 million primarily relatedto the plan to close one of our Amiens, France manufacturing facilities. Net tax benefits of $31 million primarilyrelated to a Polish enterprise zone tax credit, interest of $10 million earned on favorable tax judgments in LatinAmerica, and net gains on assets sales of $2 million.
114

SELECTED FINANCIAL DATA.
Year Ended December 31,(1)
(In millions, except per share amounts) 2014(2) 2013(3) 2012(4) 2011(5) 2010(6)
Net Sales . . . . . . . . . . . . . . . . . . . . . . . . . . . . . . . . . . . . . . . . . $18,138 $19,540 $20,992 $22,767 $18,832Net Income (Loss) . . . . . . . . . . . . . . . . . . . . . . . . . . . . . . . . . 2,521 675 237 417 (164)
Less: Minority Shareholders’ Net Income . . . . . . . . . . . . . 69 46 25 74 52
Goodyear Net Income (Loss) . . . . . . . . . . . . . . . . . . . . . . . . . $ 2,452 $ 629 $ 212 $ 343 $ (216)Less: Preferred Stock Dividends . . . . . . . . . . . . . . . . . . . . 7 29 29 22 —
Goodyear Net Income (Loss) available to CommonShareholders . . . . . . . . . . . . . . . . . . . . . . . . . . . . . . . . . . . . $ 2,445 $ 600 $ 183 $ 321 $ (216)
Goodyear Net Income (Loss) available to CommonShareholders — Per Share of Common Stock:Basic . . . . . . . . . . . . . . . . . . . . . . . . . . . . . . . . . . . . . . . . . . $ 9.13 $ 2.44 $ 0.75 $ 1.32 $ (0.89)
Diluted . . . . . . . . . . . . . . . . . . . . . . . . . . . . . . . . . . . . . . . . $ 8.78 $ 2.28 $ 0.74 $ 1.26 $ (0.89)
Cash Dividends Declared per Common Share . . . . . . . . . . . . $ 0.22 $ 0.05 $ — $ — $ —
Total Assets . . . . . . . . . . . . . . . . . . . . . . . . . . . . . . . . . . . . . . $18,109 $17,527 $16,973 $17,629 $15,630Long Term Debt and Capital Leases Due Within One
Year . . . . . . . . . . . . . . . . . . . . . . . . . . . . . . . . . . . . . . . . . . 148 73 96 156 188Long Term Debt and Capital Leases . . . . . . . . . . . . . . . . . . . 6,216 6,162 4,888 4,789 4,319Goodyear Shareholders’ Equity . . . . . . . . . . . . . . . . . . . . . . . 3,610 1,606 370 749 644Total Shareholders’ Equity . . . . . . . . . . . . . . . . . . . . . . . . . . . 3,845 1,868 625 1,017 921
(1) Refer to “Basis of Presentation” and “Principles of Consolidation” in Note 1, Accounting Policies.
(2) Goodyear net income in 2014 included net charges after-tax and minority of $323 million due to changes inthe exchange rate of the Venezuelan bolivar fuerte against the U.S. dollar; rationalization charges, includingaccelerated depreciation and asset write-offs; curtailment and settlement losses related to pension plans inNorth America and the UK; charges related to labor claims with respect to a previously closed facility inGreece; charges related to a government investigation in Africa; and the settlement of certain indirect taxclaims in Latin America. Goodyear net income in 2014 also included net gains after-tax and minority of$1,985 million resulting from discrete income tax items, including the release of substantially all of thevaluation allowance on our net deferred U.S. tax assets and net gains on assets sales.
(3) Goodyear net income in 2013 included net charges after-tax and minority of $156 million due to thedevaluation of the Venezuelan bolivar fuerte against the U.S. dollar; rationalization charges, includingaccelerated depreciation and asset write-offs; and charges related to labor claims with respect to apreviously closed facility in Greece. Goodyear net income in 2013 also included net gains after-tax andminority of $59 million resulting from certain foreign government tax incentives, tax law changes andinterest earned on favorable tax judgments; insurance recoveries for a flood in Thailand; and gains on assetsales.
(4) Goodyear net income in 2012 included net charges after-tax and minority of $325 million due torationalization charges, including accelerated depreciation and asset write-offs; charges related to the earlyredemption of debt and a credit facility amendment and restatement; charges related to labor claims withrespect to a previously closed facility in Greece; charges related to a tornado in the United States; settlementcharges related to a pension plan; discrete charges related to income taxes; and charges related to a strike inSouth Africa. Goodyear net income in 2012 also included net gains after-tax and minority of $35 millionrelated to insurance recoveries for a flood in Thailand and gains on asset sales.
115

(5) Goodyear net income in 2011 included net charges after-tax and minority of $217 million due torationalization charges, including accelerated depreciation and asset write-offs; charges related to the earlyredemption of debt; charges related to a flood in Thailand; and charges related to a tornado in the UnitedStates. Goodyear net income in 2011 also included net gains after-tax and minority of $51 million from thebenefit of certain tax adjustments and gains on asset sales.
(6) Goodyear net loss in 2010 included net charges after-tax and minority of $445 million due to rationalizationcharges, including accelerated depreciation and asset write-offs; the devaluation of the Venezuelan bolivarfuerte against the U.S. dollar; charges related to the early redemption of debt and a debt exchange offer;charges related to the disposal of a building in the Philippines; a one-time importation cost adjustment;supplier disruption costs; a charge related to a claim regarding the use of value-added tax credits in priorperiods; and charges related to a strike in South Africa. Goodyear net loss in 2010 also included net gainsafter-tax and minority of $104 million from gains on asset sales; favorable settlements with suppliers; aninsurance recovery; and the benefit of certain tax adjustments.
116

GENERAL INFORMATION REGARDING OUR SEGMENTS
Our principal business is the development, manufacture, distribution and sale of tires and related products andservices worldwide. We manufacture and market numerous lines of rubber tires for:
• automobiles
• trucks
• buses
• aircraft
• motorcycles
• farm implements
• earthmoving and mining equipment
• industrial equipment, and
• various other applications.
In each case, our tires are offered for sale to vehicle manufacturers for mounting as original equipment (“OE”)and for replacement worldwide. We manufacture and sell tires under the Goodyear, Dunlop, Kelly, Debica, Savaand Fulda brands and various other Goodyear owned “house” brands, and the private-label brands of certaincustomers. In certain geographic areas we also:
• retread truck, aviation and off-the-road, or OTR, tires,
• manufacture and sell tread rubber and other tire retreading materials,
• sell chemical products, and
• provide automotive repair services and miscellaneous other products and services.
Our principal products are new tires for most applications. Approximately 87% of our sales in 2014 were for newtires, compared to 86% and 84% in 2013 and 2012, respectively. Sales of chemical products and natural rubber tounaffiliated customers were 3% in 2014, 4% in 2013 and 6% in 2012 of our consolidated sales (7%, 9% and 13%of North America’s total sales in 2014, 2013 and 2012, respectively). The percentages of each segment’s salesattributable to new tires during the periods indicated were:
Year Ended December 31,
Sales of New Tires By 2014 2013 2012
North America . . . . . . . . . . . . . . . . . . . . . . . . . . . . . . . . . . . . . . . . . . . . . . . . 80% 78% 76%
Europe, Middle East and Africa . . . . . . . . . . . . . . . . . . . . . . . . . . . . . . . . . . . 94 94 94
Latin America . . . . . . . . . . . . . . . . . . . . . . . . . . . . . . . . . . . . . . . . . . . . . . . . 92 92 92
Asia Pacific . . . . . . . . . . . . . . . . . . . . . . . . . . . . . . . . . . . . . . . . . . . . . . . . . . 88 87 86
Each segment exports tires to other segments. The financial results of each segment exclude sales of tiresexported to other segments, but include operating income derived from such transactions.
117

PERFORMANCE GRAPH
The graph below compares the cumulative total shareholder returns of Goodyear Common Stock, theStandard & Poor’s 500 Composite Stock Index (the “S&P 500”) and the Dow Jones US Auto Parts Index (the“Dow Auto Parts”) at each December 31 during the period beginning December 31, 2009 and endingDecember 31, 2014. The graph assumes the investment of $100 on December 31, 2009 in Goodyear CommonStock, in the S&P 500 and in the Dow Auto Parts. Total shareholder return was calculated on the basis that ineach case all dividends were reinvested.
COMPARISON OF 5 YEAR CUMULATIVE TOTAL RETURN*Among The Goodyear Tire & Rubber Company, the S&P 500 Index
and the Dow Jones US Auto Parts Index
$0
$50
$100
$150
$200
$250
$300
12/09 12/10 12/11 12/12 12/13 12/14
Goodyear Tire & Rubber Company S&P 500 Dow Jones US Auto Parts
* $100 invested on 12/31/09 in stock or index, including reinvestment of dividends. Fiscal year endingDecember 31.
118

* Also a director
1 Audit Committee 2 Compensation Committee 3 Committee on Corporate Responsibility and Compliance 4 Finance Committee 5 Governance Committee
119
DIRECTORS AND OFFICERS
William J. Conaty, 69Retired Senior Vice President, Human ResourcesGeneral Electric CompanyElected 2011 2, 5
James A. Firestone, 60Executive Vice President and President,Corporate Strategy and Asia OperationsXerox CorporationElected 2007 1, 4
Werner Geissler, 61Retired Vice Chairman, Global OperationsThe Procter & Gamble CompanyElected 2011 1, 3
Peter S. Hellman, 65Retired PresidentNordson CorporationElected 2010 1, 4
Laurette T. Koellner, 60Retired PresidentBoeing InternationalElected 2015
Richard J. Kramer, 51Chairman of the Board, Chief Executive Officer and PresidentThe Goodyear Tire & Rubber CompanyElected 2010
W. Alan McCollough, 65Retired Chairman and Chief Executive OfficerCircuit City Stores, Inc.Elected 2007 1, 2
John E. McGlade, 61Retired Chairman, President and Chief Executive OfficerAir Products and Chemicals, Inc.Elected 2012 2, 5
Michael J. Morell, 56Retired Deputy DirectorCentral Intelligence AgencyElected 2014 1, 3
Roderick A. Palmore, 63Retired Executive Vice President, General Counsel, Chief Compliance and Risk Management Officer and SecretaryGeneral Mills, Inc.Elected 2012 4, 5
Stephanie A. Streeter, 57Chief Executive OfficerLibbey Inc.Elected 2008 2, 5
Thomas H. Weidemeyer, 67Retired Senior Vice President and Chief Operating OfficerUnited Parcel Service, and President, UPS AirlinesElected 2004 3, 4
Michael R. Wessel, 55PresidentThe Wessel Group Inc.Elected 2005 3
BOARD OF DIRECTORS
CORPORATE OFFICERS BUSINESS UNIT OFFICERSRichard J. Kramer, 51*
Chairman of the Board, Chief ExecutiveOfficer and President15 years of service, officer since 2000
Laura K. Thompson, 50Executive Vice President and Chief Financial Officer31 years of service, officer since 2008
David L. Bialosky, 57Senior Vice President, General Counsel and SecretaryFive years of service, officer since 2009
Paul Fitzhenry, 55Senior Vice President, Global CommunicationsTwo years of service, officer since 2012
Richard Kellam, 53Senior Vice President, Sales and Marketing ExcellenceSix months of service, officer since 2014
John T. Lucas, 55Senior Vice President, Global Human ResourcesOne month of service, officer since 2015
Gregory L. Smith, 51Senior Vice President, Global OperationsThree years of service, officer since 2011
Jaime C. Szulc, 52Senior Vice President, Strategic InitiativesFour years of service, officer since 2010
Joseph Zekoski, 64Senior Vice President and Chief Technical Officer35 years of service, officer since 2015
Bertram Bell, 63Assistant Secretary and Associate General Counsel32 years of service, officer since 2000
Scott A. Honnold, 50Vice President, Business DevelopmentSeven years of service, officer since 2010
Thomas Kaczynski, 53Vice President and TreasurerOne year of service, officer since 2014
Anthony E. Miller, 64Assistant Secretary and Associate General Counsel29 years of service, officer since 2000
Richard J. Noechel, 46Vice President and Controller10 years of service, officer since 2008
Mark W. Purtilar, 54Vice President and Chief Procurement OfficerSeven years of service, officer since 2007
Jean-Claude Kihn, 55President, Latin America26 years of service, officer since 2008
Stephen R. McClellan, 49President, North America27 years of service, officer since 2008
Daniel L. Smytka, 52President, Asia PacificSix years of service, officer since 2010
Darren R. Wells, 49President, Europe, Middle East and Africa12 years of service, officer since 2002
Damon J. Audia, 44Senior Vice President, Finance, North America10 years of service, officer since 2005
Michel Rzonzef, 51Vice President, Commercial, Europe, Middle East & Africa26 years of service, officer since 2008
GY14AR_INSIDE_030215F.qxp_GY14AR 3/2/15 1:47 PM Page 6
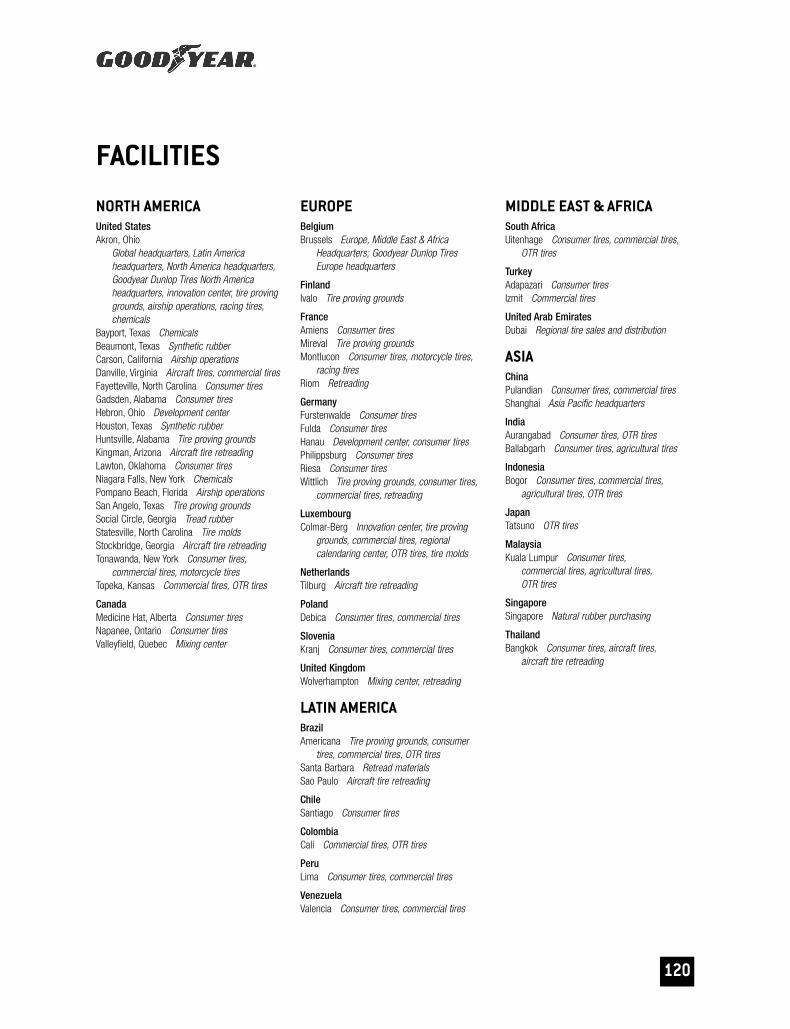
120
FACILITIES
NORTH AMERICAUnited StatesAkron, Ohio
Global headquarters, Latin America headquarters, North America headquarters,Goodyear Dunlop Tires North America headquarters, innovation center, tire provinggrounds, airship operations, racing tires,chemicals
Bayport, Texas ChemicalsBeaumont, Texas Synthetic rubberCarson, California Airship operationsDanville, Virginia Aircraft tires, commercial tiresFayetteville, North Carolina Consumer tiresGadsden, Alabama Consumer tiresHebron, Ohio Development centerHouston, Texas Synthetic rubberHuntsville, Alabama Tire proving groundsKingman, Arizona Aircraft tire retreadingLawton, Oklahoma Consumer tiresNiagara Falls, New York ChemicalsPompano Beach, Florida Airship operationsSan Angelo, Texas Tire proving groundsSocial Circle, Georgia Tread rubberStatesville, North Carolina Tire moldsStockbridge, Georgia Aircraft tire retreadingTonawanda, New York Consumer tires,
commercial tires, motorcycle tiresTopeka, Kansas Commercial tires, OTR tires
CanadaMedicine Hat, Alberta Consumer tiresNapanee, Ontario Consumer tiresValleyfield, Quebec Mixing center
EUROPEBelgiumBrussels Europe, Middle East & Africa
Headquarters; Goodyear Dunlop Tires Europe headquarters
FinlandIvalo Tire proving grounds
FranceAmiens Consumer tiresMireval Tire proving groundsMontlucon Consumer tires, motorcycle tires,
racing tiresRiom Retreading
GermanyFurstenwalde Consumer tiresFulda Consumer tiresHanau Development center, consumer tiresPhilippsburg Consumer tiresRiesa Consumer tiresWittlich Tire proving grounds, consumer tires,
commercial tires, retreading
LuxembourgColmar-Berg Innovation center, tire proving
grounds, commercial tires, regional calendaring center, OTR tires, tire molds
NetherlandsTilburg Aircraft tire retreading
PolandDebica Consumer tires, commercial tires
SloveniaKranj Consumer tires, commercial tires
United KingdomWolverhampton Mixing center, retreading
LATIN AMERICABrazilAmericana Tire proving grounds, consumer
tires, commercial tires, OTR tiresSanta Barbara Retread materialsSao Paulo Aircraft tire retreading
ChileSantiago Consumer tires
ColombiaCali Commercial tires, OTR tires
PeruLima Consumer tires, commercial tires
VenezuelaValencia Consumer tires, commercial tires
MIDDLE EAST & AFRICASouth AfricaUitenhage Consumer tires, commercial tires,
OTR tires
TurkeyAdapazari Consumer tiresIzmit Commercial tires
United Arab EmiratesDubai Regional tire sales and distribution
ASIAChinaPulandian Consumer tires, commercial tiresShanghai Asia Pacific headquarters
IndiaAurangabad Consumer tires, OTR tiresBallabgarh Consumer tires, agricultural tires
IndonesiaBogor Consumer tires, commercial tires,
agricultural tires, OTR tires
JapanTatsuno OTR tires
MalaysiaKuala Lumpur Consumer tires,
commercial tires, agricultural tires, OTR tires
SingaporeSingapore Natural rubber purchasing
ThailandBangkok Consumer tires, aircraft tires,
aircraft tire retreading
GY14AR_INSIDE_030215F.qxp_GY14AR 3/2/15 1:47 PM Page 7

FORM 10-K AND OTHER REPORTSPaper copies of Goodyear’s Annual Report on Form 10-K are available uponrequest. Quarterly reports on Form 10-Q are also available on request.Copies of any of the above or Goodyear’s Proxy Statement may be obtainedwithout charge from:Investor Relations, Dept. 635The Goodyear Tire & Rubber Company200 Innovation WayAkron, Ohio 44316-0001(330) 796-3751
Copies of these reports may also be obtained from the company’sInvestor Web site http://investor.goodyear.com.
Goodyear has included as Exhibits 31.1, 31.2 and 32.1 to its AnnualReport on Form 10-K for the year ended December 31, 2014, filed with theSecurities and Exchange Commission, certificates of Goodyear’s ChiefExecutive Officer and Chief Financial Officer with respect to the Form 10-K.
CD COPYA CD copy of the 2014 Annual Report is available for visually impairedshareholders by contacting Goodyear Investor Relations at (330) 796-3751.
COMPUTERSHARE INVESTMENT PLANComputershare sponsors and administers a direct stock purchase and divi-dend reinvestment plan for current shareholders and new investors inGoodyear common stock. A brochure explaining the program may beobtained by contacting: ComputershareP.O. Box 30170College Station, TX 77842-3170(800) 317-4445www.computershare.com/investor
INDEPENDENT REGISTERED PUBLICACCOUNTING FIRMPricewaterhouseCoopers LLP200 Public Square, 18th FloorCleveland, Ohio 44114-2301
OTHER INFORMATIONPersons seeking information about Goodyear’s corporate sustainability initiatives can access the company’s Sustainability Web site at:www.goodyear.com/responsibility.
Persons seeking general information about Goodyear or its products can access the company’s Corporate Web site at:www.goodyear.com/corporate.
Media representatives seeking information about Goodyear or contact information for spokespersons can access the company’s Media Web site at: www.goodyearnewsroom.com.
121
SHAREHOLDER INFORMATIONCORPORATE OFFICESThe Goodyear Tire & Rubber Company200 Innovation WayAkron, Ohio 44316-0001(330) 796-2121www.goodyear.com
GOODYEAR COMMON STOCKThe principal market for Goodyear common stock is the NASDAQ GlobalSelect Market (symbol GT).
On February 18, 2015, there were 16,543 shareholders of record ofGoodyear common stock. The closing price of Goodyear common stock on the NASDAQ Global Select Market on February 18, 2015, was $27.39.Under Goodyear’s primary credit facilities, we are permitted to pay dividends on Goodyear common stock as long as no default will haveoccurred and be continuing, additional indebtedness can be incurred underthe credit facilities following the payment, and certain financial tests aresatisfied. On May 29, 2014, we announced an increase in the quarterlycash dividend on our common stock to $0.06 per share from $0.05 pershare, beginning on September 2, 2014.
ANNUAL MEETING4:30 p.m., Monday, April 13, 2015Hilton Akron-Fairlawn3180 W. Market StreetAkron, Ohio 44333Please direct meeting inquiries to:Office of the Secretary, Dept. 822The Goodyear Tire & Rubber Company200 Innovation WayAkron, Ohio 44316-0001
SHAREHOLDER INQUIRIESTransfer Agent and Registrar:Computershare Trust Company, N.A.P.O. Box 43078Providence, RI 02940-3078(800) 317-4445www.computershare.com
Inquiries concerning the issuance or transfer of stock certificates orshare account information should be directed to Computershare. ProvideSocial Security number, account number and Goodyear’s ID, GTR.Hearing-impaired shareholders can communicate directly withComputershare via a TDD by calling (800) 952-9245. Other shareholderinquiries should be directed to:Investor Relations, Dept. 635The Goodyear Tire & Rubber Company200 Innovation WayAkron, Ohio 44316-0001(330) 796-3751E-mail: [email protected]
CONTENTS To Our Shareholders
Management’s Discussion and Analysis of Financial Condition and
Results of Operations
Forward-Looking Information
Quantitative and Qualitative Disclosures about Market Risk
Consolidated Financial Statements
Notes to Consolidated Financial Statements
Management’s Report on Internal Control Over Financial Reporting
Report of Independent Registered Public Accounting Firm
Supplementary Data (unaudited)
Selected Financial Data
Performance Graph
Directors and Officers
Facilities
Shareholder Information
26
37394149110111112115118119120121
This Annual Report contains a number of forward-looking statements. For more information, please see pages 37-38.
Goodyear is one of the world’s leading tire companies, with one of the most recognizable brand names and operations in most regions of the world. Together with its U.S. and international subsidiaries and joint ventures, Goodyear develops, manufactures, markets and distributes tires for most applications. It also manufactures and markets rubber-related chemicalsfor various applications. Goodyear is one of the world’s largest operators of commercial truck service and tire retreading centers. In addition, it operates approximately 1,200 tire and auto service center outlets where it offers its products for retail sale and provides automotive repair and other services. Goodyear manufactures its products in 50 facilities in 22 countries. It has marketing operations in almost every country around the world.
THE GOODYEAR TIRE & RUBBER COMPANY200 Innovation Way
Akron, Ohio 44316-0001
www.goodyear.com
GY14AR_COVER_030215F.qxp_GY14AR 3/2/15 10:42 AM Page 3

GY14AR_COVER_030215F.qxp_GY14AR 3/2/15 10:42 AM Page 1