2014 Alexander Group Webinar - Is your sales comp plan working?
42
Atlanta | Chicago | San Francisco | Scottsdale | Stamford Is Your Sales Compensation Plan Working? How to Assess Your Compensation Plan and Prepare for 2013 September 24, 2013 Rachel Parrinello Principal, Sales Compensation Practice 415-276-5664 [email protected] Paul Vinogradov Vice President 415-276-5670 [email protected]
-
Upload
the-alexander-group -
Category
Business
-
view
2.362 -
download
1
Transcript of 2014 Alexander Group Webinar - Is your sales comp plan working?

Atlanta | Chicago | San Francisco | Scottsdale | Stamford
Is Your Sales Compensation Plan Working?
How to Assess Your Compensation Plan and Prepare for 2013
September 24, 2013
Rachel Parrinello
Principal, Sales Compensation Practice
415-276-5664
Paul Vinogradov
Vice President
415-276-5670

© 2013 The Alexander Group, Inc.® 2
Welcome!
Introductions – Us and You!
Is Your Plan Working?
AGI Framework and Guidance
Questions and Answers

© 2013 The Alexander Group, Inc.® 3
About Us
Rachel Parrinello Principal, Sales Compensation Practice
Paul Vinogradov Vice President
16+ years of sales effectiveness consulting
Runs AGI’s western region office
Runs AGI’s benchmarking practice
Sales compensation speaker
13+ years of sales compensation consulting
Manages AGI’s sales compensation benchmarking
Sales compensation speaker

© 2013 The Alexander Group, Inc.® 4
About You – Industries

© 2013 The Alexander Group, Inc.® 5
About You – How Many Sales Roles

© 2013 The Alexander Group, Inc.® 6
About You – How Many Compensation Plans

© 2013 The Alexander Group, Inc.® 7
About You – Plans to Roles
© 2013 The Alexander Group, Inc.® 8
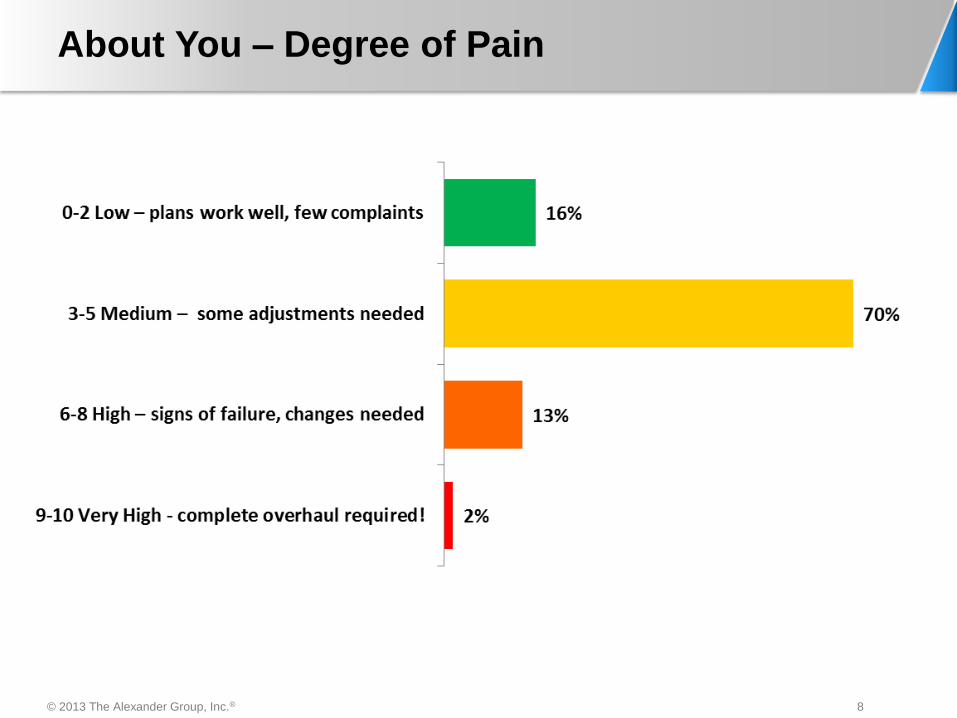
About You – Degree of Pain

© 2013 The Alexander Group, Inc.® 9
Sales Compensation is a Material Cost
Source: Alexander Group Benchmark Database. Costs include all sales and sales related roles that participate in the sales
compensation program, including sales management.
Compensation Cost of Sales Figures

© 2013 The Alexander Group, Inc.® 10
9%
51%
27%
13%
No changes will bemade
Minor changes tosome of the plans
Significant changesaffecting some of the
plans
Major changesaffecting most allincentive plans
Most Companies Update Their Plans Each Year
91% plan to make program
changes for 2013
For 2013, the extent of changes you plan to make to your sales compensation program are:
*Source: Alexander Group 2013 Survey

© 2013 The Alexander Group, Inc.® 11
Laggard
World Class
Where does your company’s compensation
plan fit along this continuum?

© 2013 The Alexander Group, Inc.® 12
What Is a World Class Sales Compensation
Plan?
The Sales Compensation Plan
is a Valuable Management
Tool to Drive Sales Results if
Done Correctly
Drives business goals and sales strategy
Aligns with each sales job’s role and objectives
Closely links pay to performance
Motivates and rewards higher levels of achievement
Provides market-competitive pay to attract and retain appropriate level of talent
Is simple to understand

© 2013 The Alexander Group, Inc.® 13
What is a World Class Sales Compensation
Program?
Linked with fair, equitable and stretch goals
Effectively communicated and documented
Sale force understands the plan
Sales leadership messages how the plan supports strategy
Is fiscally responsible and aligns with budget
Efficiently administrated to provide consistent, accurate, and timely pay
Provides the right level of alignment / equity across the organization
Includes ongoing governance to ensure program integrity
Designed by a collaborative process with key stakeholders from sales, finance, human resources, and sales operations
The Plan’s Effectiveness
Depends on the Support of
People, Processes, and
Systems

© 2013 The Alexander Group, Inc.® 14
Assessment Angles
Program
Effectiveness
Strategic
Alignment
Market
Alignment
Principle
Alignment
Does your program
drive your company’s
strategy and align with
its job roles?
Does your program
align to best in class
principles?
How aligned is your
program to the
market?

© 2013 The Alexander Group, Inc.® 15
Overall Strategic Goal
Component
Guidelines
Execution
Principles
Goal
Rules To Govern Design Solutions
Guidelines for Specific Program Components
Supporting Programs: Required for Any Sales
Compensation Plan
Design Framework

© 2013 The Alexander Group, Inc.® 16
Rules To Govern Design Solutions
Guidelines for Specific Program Components
Supporting Programs: Required for Any Sales
Compensation Plan
Design Framework
Attract, Retain and Reward Sales Resources To Drive Sales Results
Component
Guidelines
Execution
Principles
Goal

© 2013 The Alexander Group, Inc.® 17
Guidelines for Specific Program Components
Supporting Programs: Required for Any Sales
Compensation Plan
Design Framework
Strategy & Job
Alignment
Sales Force
Motivation
Pay for
Performance
1 2 3
Attract, Retain and Reward Sales Resources To Drive Sales Results
Component
Guidelines
Execution
Principles
Goal

© 2013 The Alexander Group, Inc.® 18
Supporting Programs: Required for Any Sales
Compensation Plan
Design Framework
Strategy & Job
Alignment
Sales Force
Motivation
Pay for
Performance
1 2 3
Attract, Retain and Reward Sales Resources To Drive Sales Results
Eligibility Pay
Levels
Pay
Mix Leverage Measures
Mechanics
& Pay
Curve
Perf &
Payout
Periods
Quotas/
Targets
Special
Incentives
Crediting
& Policies
1 2 3 4 5 6 7 8 9 10
Component
Guidelines
Execution
Principles
Goal

© 2013 The Alexander Group, Inc.® 19
Design Framework
Strategy & Job
Alignment
Sales Force
Motivation
Pay for
Performance
1 2 3
Attract, Retain and Reward Sales Resources To Drive Sales Results
Eligibility Pay
Levels
Pay
Mix Leverage Measures
Mechanics
& Pay
Curve
Perf &
Payout
Periods
Quotas/
Targets
Special
Incentives
Crediting
& Policies
1 2 3 4 5 6 7 8 9 10
Investment ROI Communication Administration Governance and
Process
1 2 3 4
Component
Guidelines
Execution
Principles
Goal

© 2013 The Alexander Group, Inc.® 20
Assessment Tools
1
2
3
4
5
Job Confirmation
Sales Force Survey
Pay and Performance Analytics
Market Benchmark Data
Philosophy

© 2013 The Alexander Group, Inc.® 21
Low Performers Median Performers High Performers
75th
50th
25th
What is Your Pay For Performance
Philosophy? 1
Ma
rket
Com
parison

© 2013 The Alexander Group, Inc.® 22
Illustrative Segmentation and Coverage Map 2
Strategic
Enterprise
Small and Medium
Business
Sales Engineer
Account Manager
Inside Sales
Sales Support
Product Specialist
Channel Manager

© 2013 The Alexander Group, Inc.® 23
Primary Input – Job Design
Customer:
Target Segments
Target Accounts
Buyer Needs
Sales Potential
Sales Process:
Lead Generation
Account Development
Propose/Close
After Sales Service
Conversion, Penetration, Retention
Products and Services:
Product Type and Complexity
Knowledge Required
New Versus Current Product Job
Bandwidth
2

© 2013 The Alexander Group, Inc.® 24
Inventory Sales Roles—Confirm Job Focus
Example Roles By Sales Strategy
Sales Support
Account Executive
Product Specialist
Vertical Specialist
Supports seller with orders, systems, data requests, etc.
Sells to and services current and new accounts
Focus on set of named accounts, generally within a vertical industry
Overlay specialist called upon by the Account Executive to help sell specific product to current and new accounts
Develops vertical industry strategy and evangelizes company to that vertical market
Acts as an SME and overlay specialist on an as-needed basis
Account Manager
Teamed with assigned seller to provide pre-sales and service to assigned accounts
Generally focused on selling existing products to existing accounts
Products
Current New/Different
Buyers
Prospects
Customers
Retention
Selling
Conversion
Selling
Penetration
Selling
New Market
Selling
Sales Strategy Matrix® Line of
Specialization
2

© 2013 The Alexander Group, Inc.® 25
Job Profile Example – Strategic AM
Job Summary
Responsible for end user sales of Company
products and services to new and existing
strategic (5,000+ employees) accounts
Executes complex sales and effectively
manage the sales process and activities
Effectively engages other sales resources as
required
Primary Secondary
Teaming
Independent Small Team Large Team
Product Type
Point Product Solution Architecture
Job Category
Technical
Account
Partner
Product
Sales Motion
Market Coverage
Mature Emerging
Segment
Generalist Specialist
Selling Type
Inside
Field Hybrid
Sales Strategy
Identify / Qualify Lead
Qualify & Develop Oppty
Validate & Approve Solution
Fulfill
Renew Sell-Thru /
Enablement
Sales Cycle
0 Months 18 Months 24+ Months 6 Months
Sales Process Complexity
Low Medium High
Sales Process
Management
People Manager
None
Global
No / Minimal Focus
Strategic Enterprise Commercial SMB
Specialization
Quota $4M - $10M
Account Load 3 – 5 Accounts
New Opportunities in
Existing Accounts
Renewal / Recurring
in Existing Accounts
New Business in New
Accounts
Sales Process Sales Focus
Type of Sale
Channel-led Strategic Transactional
Key Metrics
Renewal Bookings
New Bookings
E/B
2

© 2013 The Alexander Group, Inc.® 26
Complete a Survey to Capture Sellers
Sentiments
Competitive
TTC
Motivates
Overachievement
Challenging,
Achievable
Quotas
Clearly
Communicated
Easily Track
Comm. Earned
Overall
Rating
3.4 3.6 2.8 3.7 3.1 3.2
Strongly Agree Agree Disagree Strongly Disagree
3
-13% -9%
-28%
-10% -23% -19%
-5% -9%
-13%
-4%
-10% -5%
51% 49% 31%
53% 36%
38%
7% 16%
4%
19%
9% 5%

© 2013 The Alexander Group, Inc.® 27
Use Time To Drive Design & Measure Success
Selling Time
Product B
Selling Time
Product A 80%
20%
55%
45% Selling Time
Product B
Selling Time
Product A
3
FY12 Time Profile FY13 Time Profile New Plan
0%
100%
200%
300%
400%
0% 100% 200%
% T
arg
et
Inc
en
tive
% of Quota Achievement
5x
3x
5x Accelerator if Achieve
Product B Quota

© 2013 The Alexander Group, Inc.® 28
5 Must Do Pay and Performance Analyses 4
A
B
C
D
E
Pay Vs. Performance Scatter Plot
Incentive Payout Percentile Distributions
Quota Size Correlation Scatter Plot
Quota Performance Distributions
Quota Performance Percentile Distributions

© 2013 The Alexander Group, Inc.® 29
A) Pay vs. Performance Scatter Plots 4
What: Correlation of incentive pay and sales performance.
Purpose: Identify inconsistencies between pay and performance.

© 2013 The Alexander Group, Inc.® 30
B) Incentive Payout Percentile Distributions 4
What: Range of incentive payouts across incumbents by percentile.
Purpose: Examine pay discrimination and assess upside opportunity.
© 2013 The Alexander Group, Inc.® 31
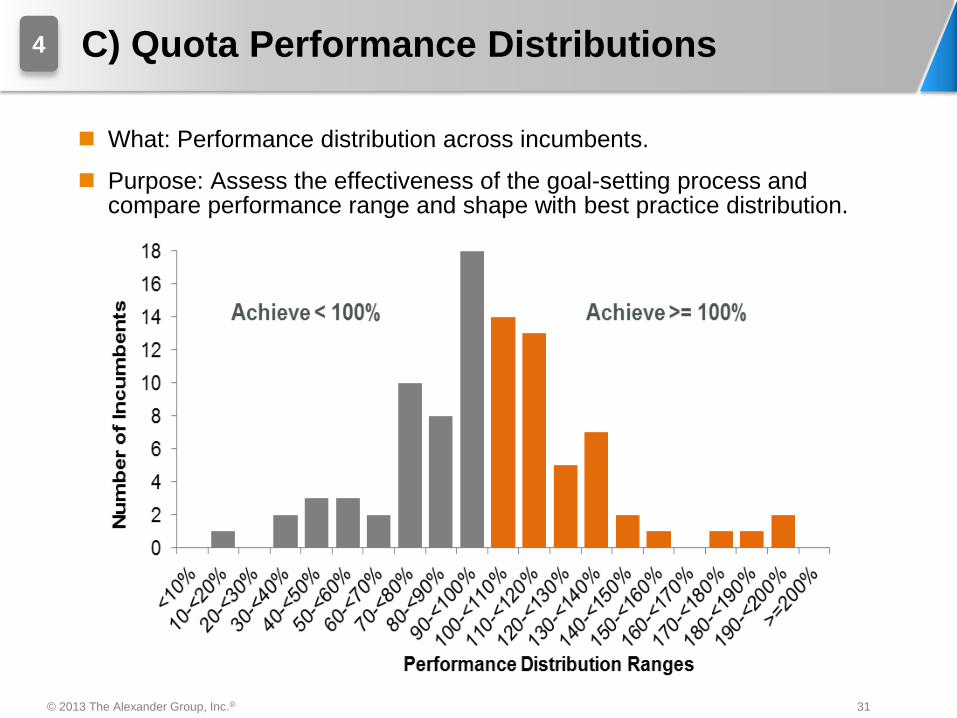
C) Quota Performance Distributions 4
What: Performance distribution across incumbents.
Purpose: Assess the effectiveness of the goal-setting process and compare performance range and shape with best practice distribution.

© 2013 The Alexander Group, Inc.® 32
D) Quota Size Correlation Scatter Plots 4
What: Effect of quota size on target achievability.
Purpose: Assess the effectiveness of the goal allocation process and need varied accelerator structures based on quota size.

© 2013 The Alexander Group, Inc.® 33
E) Quota Performance Percentile Distributions 4
What: Range of quota performance across incumbents by percentile.
Purpose: Assess current threshold and excellence levels; determine percent of incumbents above and below target performance levels.

© 2013 The Alexander Group, Inc.® 34
Illustrative Market Data
Plan Type
Sales Incentive
Plan
Mgmt. Incentive
Plan
Profit Sharing
Pay Levels
Pay Mix
New Hire Practices
Excessive Payout
Practices
5
Measures
At-Risk
Add-On
Linked
Pay Curve
Thresholds
Excellence
Caps
Formula / Calculation
Methodology
Performance Period
Payout Frequency
Crediting Rules
Policies
HR Changes
Quota Changes
Cost Metrics
Plan
Administration
Administration
Tool
FTE
Ticket
Accuracy Rate
Processing
Communication
Plan Data at Job Measure Level Data Program Data

© 2013 The Alexander Group, Inc.® 35
Analyze All Plan Design Components
Plan Design Components
Pay Mix
Performance
Measures/Weights
Plan Mechanics (Bonus,
ICR, etc.)
Payout Curves & Rates
Thresholds
Excellence Points
Upside/Leverage
Caps
Linkages, Hurdles
Performance Period
Payout Frequency
Add-on Bonuses
Sales Quota Crediting
Sample Plan Component Analysis
5

© 2013 The Alexander Group, Inc.® 36
Illustrative Market Alignment Comparison
Aligned w/ Market Minor Misalignment w/ Market Major Misalignment w/ Market To Be Determined Legend:
Plan Component Market
Comparison Comparison Details
Pay Mix • Pay mix is on par with benchmark companies
Measures • Benchmark companies use between 2-3 measures, including linked metrics
Mechanics • All benchmark companies use a quota based mechanic
# of Pay Curves • More pay curves than benchmark companies
Thresholds • Most benchmark companies pay from the first dollar
Payout Limits • Most benchmark companies do not use a deceleration rate and/or cap
Leverage • Equal upside opportunity than the benchmark companies
Excellence • Calculated excellence points appear aligned to market
Pay Curve • Rates >100% are below average relative to benchmark companies
Performance Period • Most benchmark companies use annual performance period
Payout Frequency • Most benchmark companies provide monthly payouts
Calc. Methodology • Most companies use cumulative methodology; some use cumulative-period-to-date
Crediting • Sales crediting at bookings aligns; however shipment/invoice payment credit does not
Key areas of misalignment include # of accelerator rates, the rates and
crediting.
Summary Benchmark Findings
AM
Overall Comparison
5

© 2013 The Alexander Group, Inc.® 37
Investment ROI Communication Administration Governance and
Process
Attract, Retain and Reward Sales Resources To Drive Sales Results
Eligibility Pay
Levels
Pay
Mix Leverage Measures
Mechanics
& Pay
Curve
Perf &
Payout
Periods
Strategy & Job
Alignment
Sales Force
Motivation
Pay for
Performance
1 2 3
1 2 3 4
Quotas/
Targets
Special
Incentives
Crediting
& Policies
1 2 3 4 5 6 7 8 9 10
Illustrative Assessment Using the Framework
= Working Well = Minor Area for Improvement = Major Area for Improvement
Component
Guidelines
Execution
Principles
Goal

© 2013 The Alexander Group, Inc.® 38
AGI’s Sales Compensation Services
Sales Compensation Process
Design and Optimization 2
Sales Compensation Design
Principles 3
Sales Compensation
Scorecard 4
Sales Compensation
Benchmarking 5
Surveys / Custom Studies 6
On-Going Advisory
Services 7
Plan Design 1

© 2013 The Alexander Group, Inc.® 39
Closing Remarks
Convene a design team with the right stakeholders
Develop a work plan of activities and events – typical
process takes 8-12 weeks depending on # of jobs &
payees and degree of change
Develop a scorecard to assess your overall program
and drive continual improvements
The difference between an average program and a best-in-class
program can drive .5% - 5% difference in sales results.
Don’t miss your opportunity to leverage one of the most
powerful levers the sales organization has to drive results!

© 2013 The Alexander Group, Inc.® 40
Great sales organizations add value to the products they sell
The 2013 Chief Sales Executive Annual Forum will recognize the value
creators - select companies and sales leaders with the creativity, agility and
foresight to build and execute a value centric growth strategy around the
unique capability of the sales force. We will explore in detail both the
leadership elements and tactical dimensions of their approach.
The 2013 Chief Sales Executive Annual Forum is for top sales executives
who are charged with launching a value centric growth strategy and building
a sales organization to support their sales growth objective.
As a sales or sales operations leader, you will have the opportunity to:
• Test your thinking on how to instill value in your sales force
• Compare yourself with skilled value creators
• Learn new approaches to address specific value challenges
www.alexandergroup.com/events/cse-annual-forum
Executive Level
Networking
Facilitated
Roundtables
Keynote
Sessions
St. Regis
Monarch Beach, CA
November 11-13

© 2013 The Alexander Group, Inc.® 41
Questions?

© 2013 The Alexander Group, Inc.® 42
Rachel Parrinello
Principal, Sales Compensation Practice
415-276-5664
Please contact either of us for any additional
information or questions.
Paul Vinogradov
Vice President
415-276-5670


![index [] · index p 02—09 comp. 175 p 10—19 comp. 176 p 20—25 comp. 177 p 26—31 comp. 178 p 32—37 comp. 179 p 38—43 comp. 180 p 44—49 comp. 181 p 50—55 comp. 182 p](https://static.fdocuments.net/doc/165x107/5c66627e09d3f252168c4378/index-index-p-0209-comp-175-p-1019-comp-176-p-2025-comp-177.jpg)