2014-15 Sample Benchmark Report · About this document 2 ... discrimination on the basis of gender...
49
SAMPLE ONLY A confidential report customised for: ABC Manufacturing (fictitious sample only) 2014 - 15
-
Upload
truongnhan -
Category
Documents
-
view
213 -
download
0
Transcript of 2014-15 Sample Benchmark Report · About this document 2 ... discrimination on the basis of gender...
SAMPLE ONLY
A confidential report customised for: ABC Manufacturing (fictitious sample only)2014 - 15
SAMPLE ONLY
ABC Manufacturing ABN 47641643874 Comparison group contains 289 organisations in the 2014 - 15 reporting period
Gender equality benchmarks About this document This Workplace Gender Equality Agency ('the WGEA' or ‘the Agency’) benchmark report provides a comparison of gender equality indicators (six GEIs as defined in the Workplace Gender Equality Act 2012) for women and men in your organisation and selected comparison group. This report is intended to help you identify areas where your organisation is performing strongly and other areas where you may be able to make improvements in gender equality. It is based on reporting data supplied to the WGEA for the reporting year 2014 - 15, and includes data supplied as part of the workplace profile and the reporting questionnaire. The data that your organisation supplied is presented in yellow alongside the comparison group you have chosen in grey. Benchmark comparison groups can be chosen by ANZSIC (Australian and New Zealand Standard Industry Classification) and by organisation size (number of employees). This benchmark report provides a profile of gender equality at ABC Manufacturing compared to the average for the comparison group that you have chosen:
Organisation size: 0-249 employees
Industry category: Manufacturing (C)
The comparison group you have chosen contains 289 organisations and employs 43,681 individuals. Other comparison groups that you could choose to run as separate reports (under the benchmarks tab on the reporting portal) include organisations with:
→ Basic Chemical and Chemical Product Manufacturing (ANZSIC: 18)
→ 0-249 employees - Basic Chemical and Chemical Product Manufacturing (ANZSIC: 18)
→ Basic Chemical Manufacturing (ANZSIC: 181)
→ All reporting organisations
→ Manufacturing (ANZSIC: C)
Please note that some benchmarks may not be available in all report formats. Any benchmarks that are unavailable have been noted in the document.
Further information A Benchmarks Technical User Manual has also been prepared to help you with understanding the development of this report and the ways in which the data have been used. It also contains detailed information about how the calculations were made and the statistical analyses undertaken. A Benchmarks Insights Guide has been developed and is available on the website. It is designed to assist you in interpreting this report and includes suggestions about how to use the benchmarks to build strategies and achieve optimal performance in gender equality. To explore the data further, see the WGEA’s data explorer. For further advice or assistance, including accessibility issues, please contact the Agency via email [email protected] or telephone 02 9432 7000 or 1800 730 233.
Workplace Gender Equality Agency | Gender equality benchmarks | www.wgea.gov.au - 2
SAMPLE ONLY
Table of contents
Gender equality benchmarks 2
About this document 2
Further information 2
About workplace gender equality 4
GEI 1: Gender composition of the workforce 6
GEI 2: Gender composition of governing bodies/boards 17
GEI 3: Equal remuneration between women and men 19
GEI 4: Flexible working arrangements and working arrangements supporting carers 37
GEI 5: Consultation on gender equality 42
GEI 6: Sex-based harassment and discrimination 45
Workplace Gender Equality Agency | Gender equality benchmarks | www.wgea.gov.au - 3
SAMPLE ONLY
ABC Manufacturing ABN 47641643874 Comparison group contains 289 organisations in the 2014 - 15 reporting period
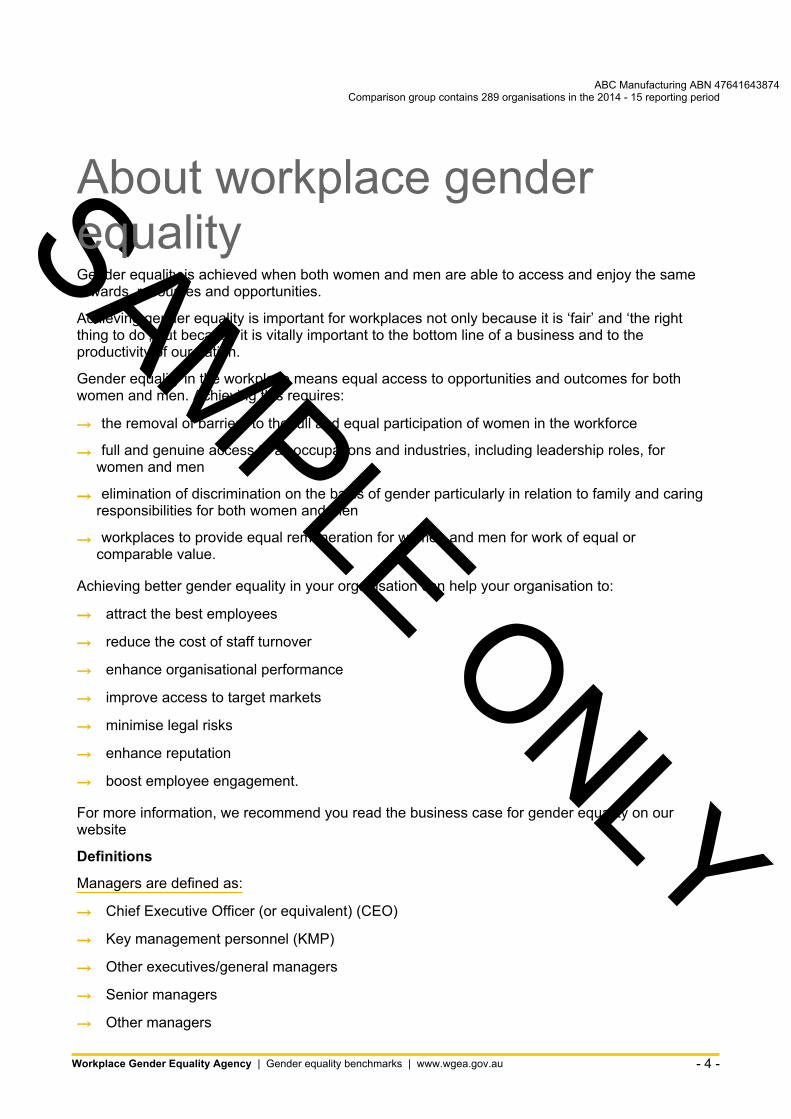
About workplace gender equality Gender equality is achieved when both women and men are able to access and enjoy the same rewards, resources and opportunities.
Achieving gender equality is important for workplaces not only because it is ‘fair’ and ‘the right thing to do’, but because it is vitally important to the bottom line of a business and to the productivity of our nation.
Gender equality in the workplace means equal access to opportunities and outcomes for both women and men. Achieving this requires:
→ the removal of barriers to the full and equal participation of women in the workforce
→ full and genuine access to all occupations and industries, including leadership roles, for women and men
→ elimination of discrimination on the basis of gender particularly in relation to family and caring responsibilities for both women and men
→ workplaces to provide equal remuneration for women and men for work of equal or comparable value.
Achieving better gender equality in your organisation can help your organisation to:
→ attract the best employees
→ reduce the cost of staff turnover
→ enhance organisational performance
→ improve access to target markets
→ minimise legal risks
→ enhance reputation
→ boost employee engagement.
For more information, we recommend you read the business case for gender equality on our website
Definitions
Managers are defined as:
→ Chief Executive Officer (or equivalent) (CEO)
→ Key management personnel (KMP)
→ Other executives/general managers
→ Senior managers
→ Other managers
Workplace Gender Equality Agency | Gender equality benchmarks | www.wgea.gov.au - 4
SAMPLE ONLY
ABC Manufacturing ABN 47641643874 Comparison group contains 289 organisations in the 2014 - 15 reporting period
Non-managers are classified against seven occupational categories:
→ Professionals
→ Technicians and trade employees
→ Community and personal service employees
→ Clerical and administrative employees
→ Sales employees
→ Machinery operators and drivers
→ Labourers
Please refer to the accompanying Benchmarks Technical User Manual for the detailed definitions of each category above.
Workplace Gender Equality Agency | Gender equality benchmarks | www.wgea.gov.au - 5
SAMPLE ONLY
ABC Manufacturing ABN 47641643874 Comparison group contains 289 organisations in the 2014 - 15 reporting period
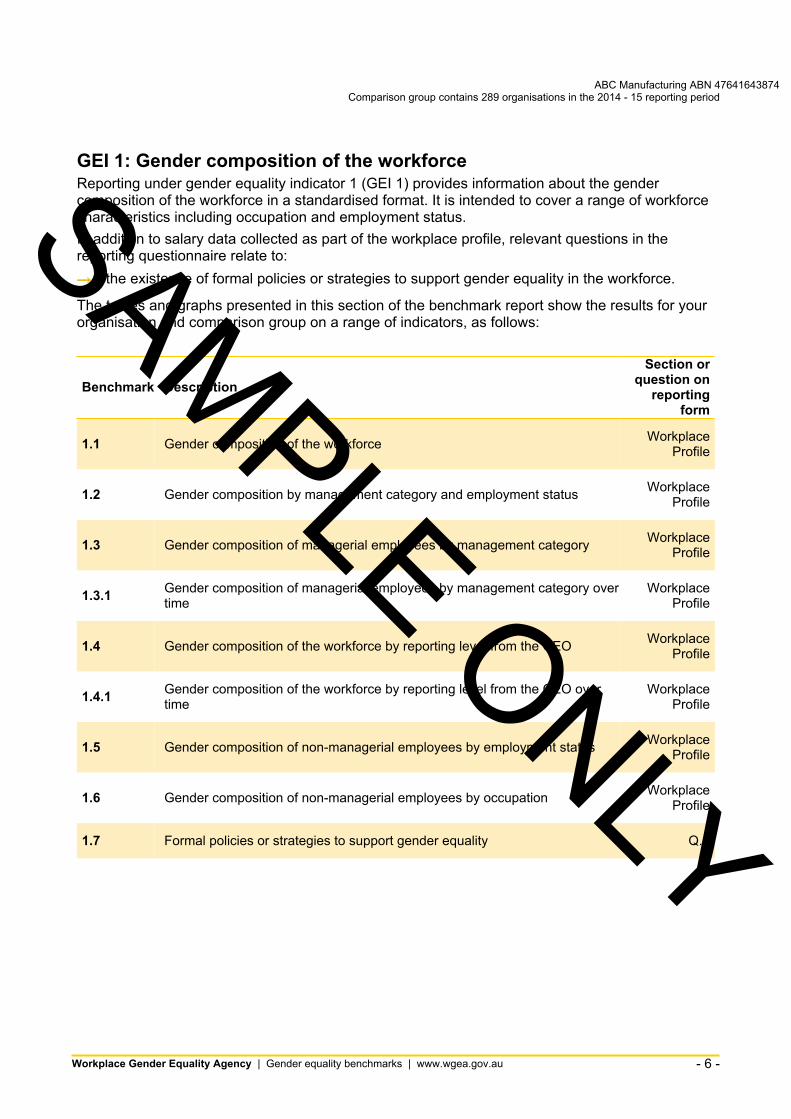
GEI 1: Gender composition of the workforce Reporting under gender equality indicator 1 (GEI 1) provides information about the gender composition of the workforce in a standardised format. It is intended to cover a range of workforce characteristics including occupation and employment status. In addition to salary data collected as part of the workplace profile, relevant questions in the reporting questionnaire relate to: → the existence of formal policies or strategies to support gender equality in the workforce.
The tables and graphs presented in this section of the benchmark report show the results for your organisation and comparison group on a range of indicators, as follows:
Section or question onBenchmark Description reporting
form
Workplace1.1 Gender composition of the workforce Profile
Workplace1.2 Gender composition by management category and employment status Profile
Workplace1.3 Gender composition of managerial employees by management category Profile
Gender composition of managerial employees by management category over Workplace1.3.1 time Profile
Workplace1.4 Gender composition of the workforce by reporting level from the CEO Profile
Gender composition of the workforce by reporting level from the CEO over Workplace1.4.1 time Profile
Workplace1.5 Gender composition of non-managerial employees by employment status Profile
Workplace1.6 Gender composition of non-managerial employees by occupation Profile
1.7 Formal policies or strategies to support gender equality Q.1
Workplace Gender Equality Agency | Gender equality benchmarks | www.wgea.gov.au - 6
ABC Manufacturing ABN 47641643874 Comparison group contains 289 organisations in the 2014 - 15 reporting period
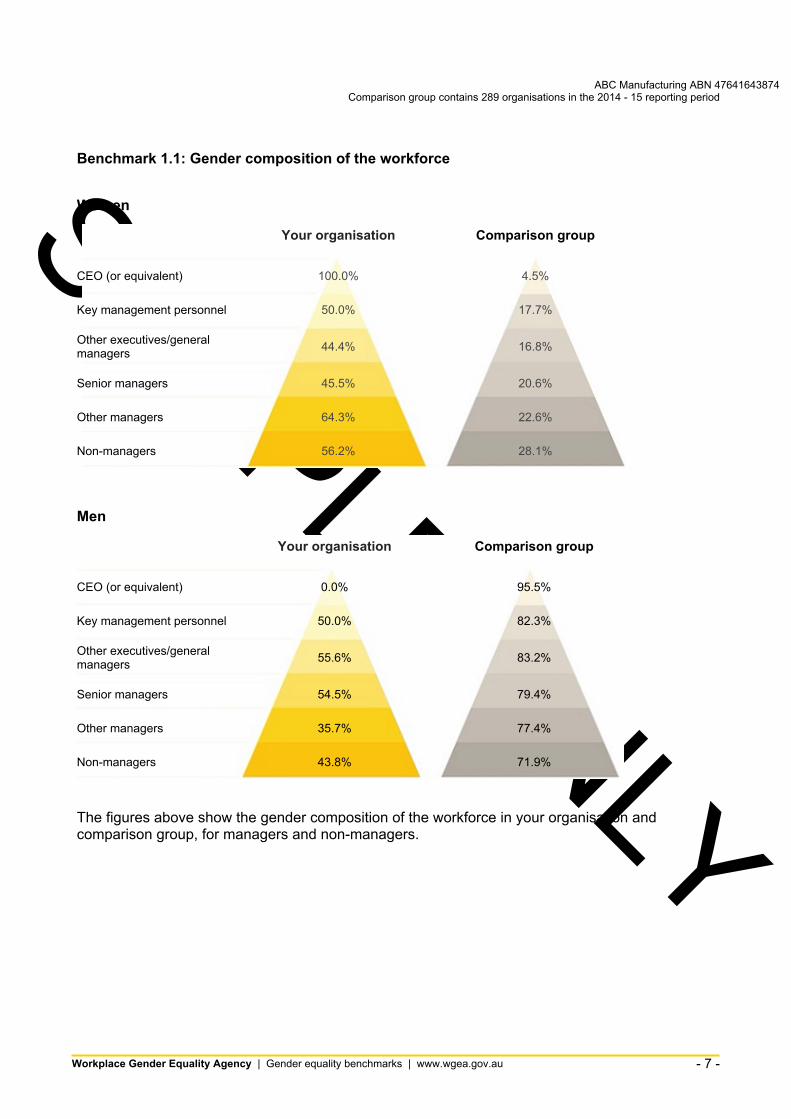
Benchmark 1.1: Gender composition of the workforce
Women SAMPLE ONLY
Your organisation Comparison group
CEO (or equivalent) 100.0% 4.5%
Key management personnel 50.0% 17.7%
Other executives/general managers 44.4% 16.8%
Senior managers 45.5% 20.6%
Other managers 64.3% 22.6%
Non-managers 56.2% 28.1%
Men
Your organisation Comparison group
CEO (or equivalent) 0.0% 95.5%
Key management personnel 50.0% 82.3%
Other executives/general managers 55.6% 83.2%
Senior managers 54.5% 79.4%
Other managers 35.7% 77.4%
Non-managers 43.8% 71.9%
The figures above show the gender composition of the workforce in your organisation and comparison group, for managers and non-managers.
Workplace Gender Equality Agency | Gender equality benchmarks | www.wgea.gov.au - 7
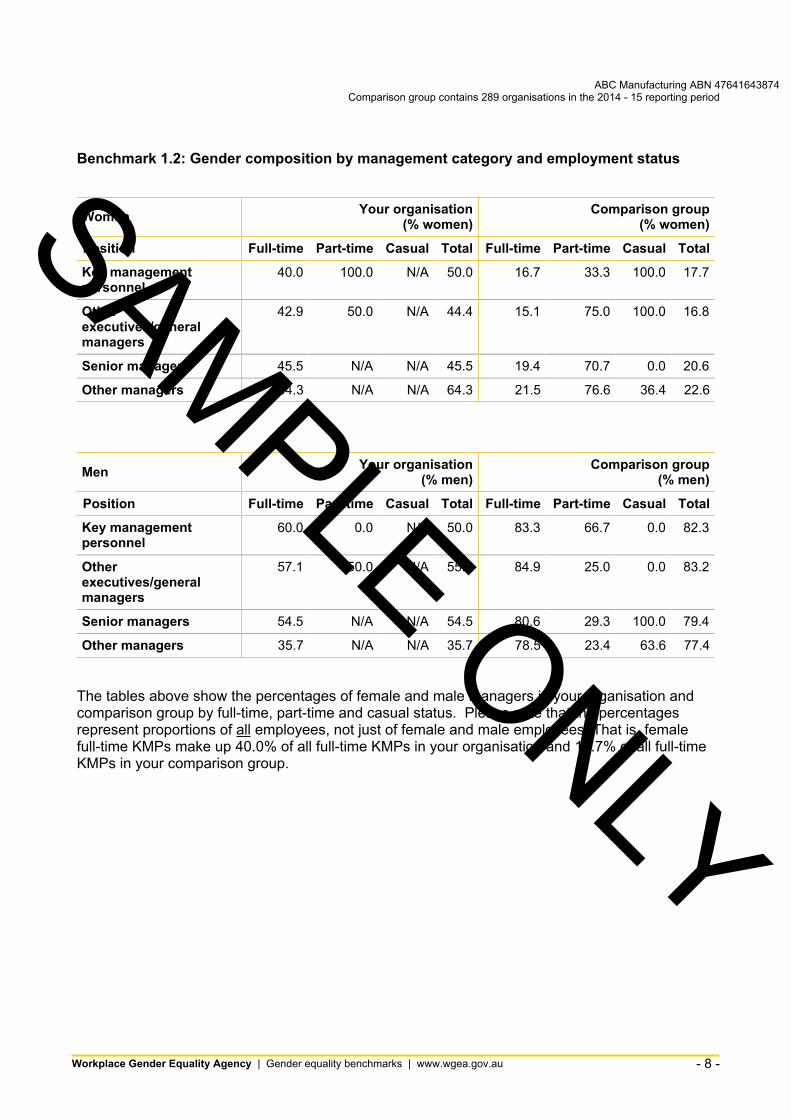
Benchmark 1.2: Gender composition by management category and employment status SAMPLE ONLY
ABC Manufacturing ABN 47641643874 Comparison group contains 289 organisations in the 2014 - 15 reporting period
Your organisation Comparison groupWomen (% women) (% women)
Position Full-time Part-time Casual Total Full-time Part-time Casual Total
Key management 40.0 100.0 N/A 50.0 16.7 33.3 100.0 17.7 personnel
Other 42.9 50.0 N/A 44.4 15.1 75.0 100.0 16.8 executives/general managers
Senior managers 45.5 N/A N/A 45.5 19.4 70.7 0.0 20.6
Other managers 64.3 N/A N/A 64.3 21.5 76.6 36.4 22.6
Your organisation Comparison groupMen (% men) (% men)
Position Full-time Part-time Casual Total Full-time Part-time Casual Total
Key management 60.0 0.0 N/A 50.0 83.3 66.7 0.0 82.3 personnel
Other 57.1 50.0 N/A 55.6 84.9 25.0 0.0 83.2 executives/general managers
Senior managers 54.5 N/A N/A 54.5 80.6 29.3 100.0 79.4
Other managers 35.7 N/A N/A 35.7 78.5 23.4 63.6 77.4
The tables above show the percentages of female and male managers in your organisation and comparison group by full-time, part-time and casual status. Please note that the percentages represent proportions of all employees, not just of female and male employees. That is, female full-time KMPs make up 40.0% of all full-time KMPs in your organisation and 16.7% of all full-time KMPs in your comparison group.
Workplace Gender Equality Agency | Gender equality benchmarks | www.wgea.gov.au - 8
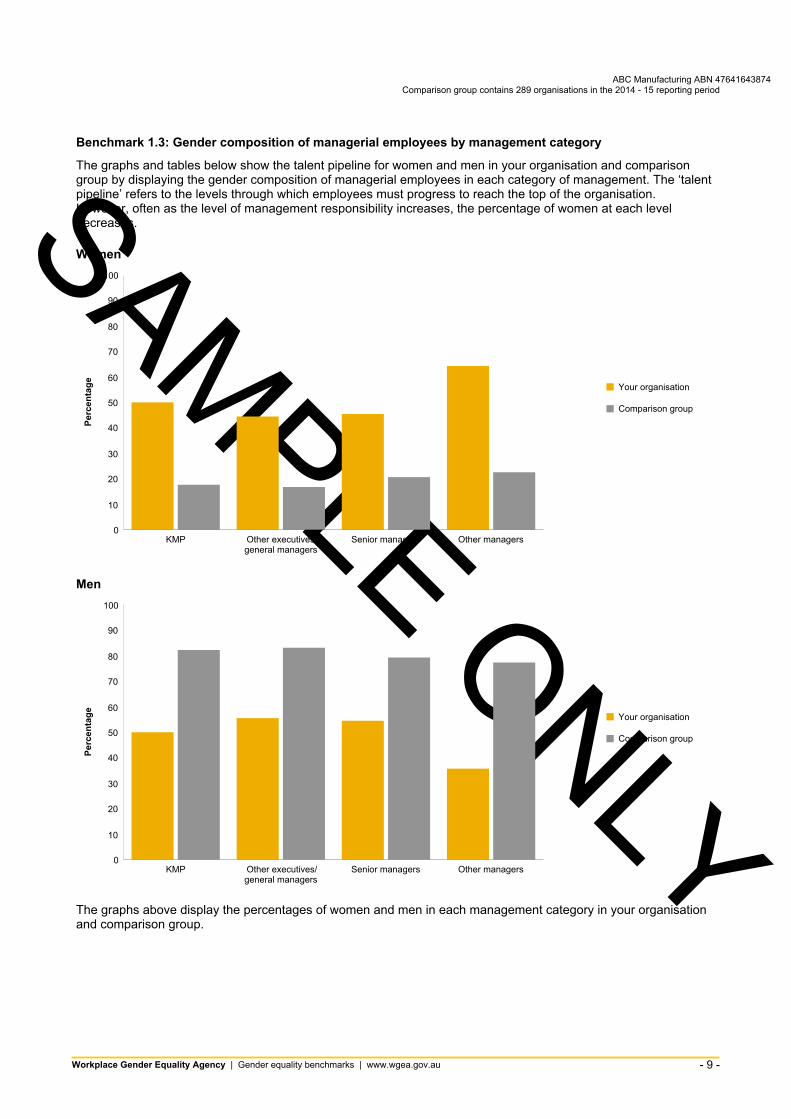
The graphs and tables below show the talent pipeline for women and men in your organisation and comparison group by displaying the gender composition of managerial employees in each category of management. The ‘talent pipeline’ refers to the levels through which employees must progress to reach the top of the organisation. However, often as the level of management responsibility increases, the percentage of women at each level decreases. SAMPLE ONLY
ABC Manufacturing ABN 47641643874 Comparison group contains 289 organisations in the 2014 - 15 reporting period
Benchmark 1.3: Gender composition of managerial employees by management category
Women
0
10
20
30
40
50
60
70
80
90
100
KMP Other executives/general managers
Senior managers Other managers
Your organisation
Comparison group
Perc
enta
ge
Men
0
10
20
30
40
50
60
70
80
90
100
KMP Other executives/general managers
Senior managers Other managers
Your organisation
Comparison group
Perc
enta
ge
The graphs above display the percentages of women and men in each management category in your organisation and comparison group.
Workplace Gender Equality Agency | Gender equality benchmarks | www.wgea.gov.au - 9
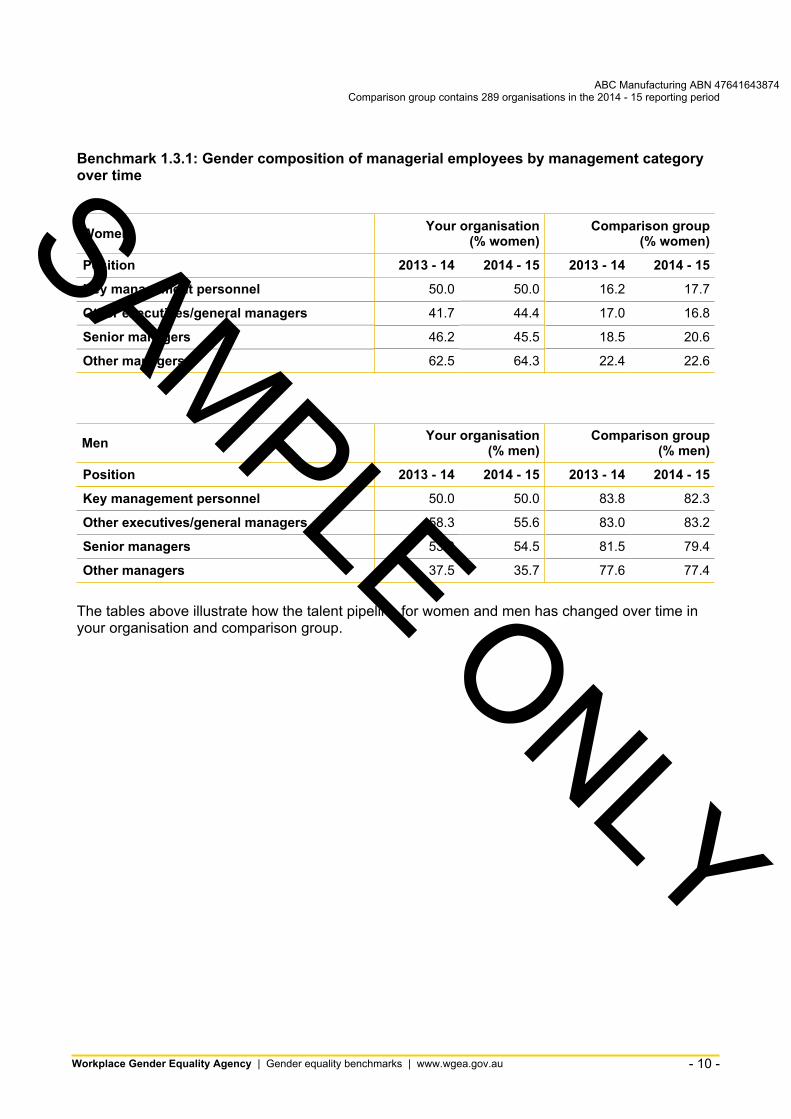
Benchmark 1.3.1: Gender composition of managerial employees by management category over time SAMPLE ONLY
ABC Manufacturing ABN 47641643874 Comparison group contains 289 organisations in the 2014 - 15 reporting period
Your organisation Comparison groupWomen (% women) (% women)
Position 2013 - 14 2014 - 15 2013 - 14 2014 - 15
Key management personnel 50.0 50.0 16.2 17.7
Other executives/general managers 41.7 44.4 17.0 16.8
Senior managers 46.2 45.5 18.5 20.6
Other managers 62.5 64.3 22.4 22.6
Your organisation Comparison groupMen (% men) (% men)
Position 2013 - 14 2014 - 15 2013 - 14 2014 - 15
Key management personnel 50.0 50.0 83.8 82.3
Other executives/general managers 58.3 55.6 83.0 83.2
Senior managers 53.8 54.5 81.5 79.4
Other managers 37.5 35.7 77.6 77.4
The tables above illustrate how the talent pipeline for women and men has changed over time in your organisation and comparison group.
Workplace Gender Equality Agency | Gender equality benchmarks | www.wgea.gov.au - 10
Women SAMPLE ONLY
ABC Manufacturing ABN 47641643874 Comparison group contains 289 organisations in the 2014 - 15 reporting period
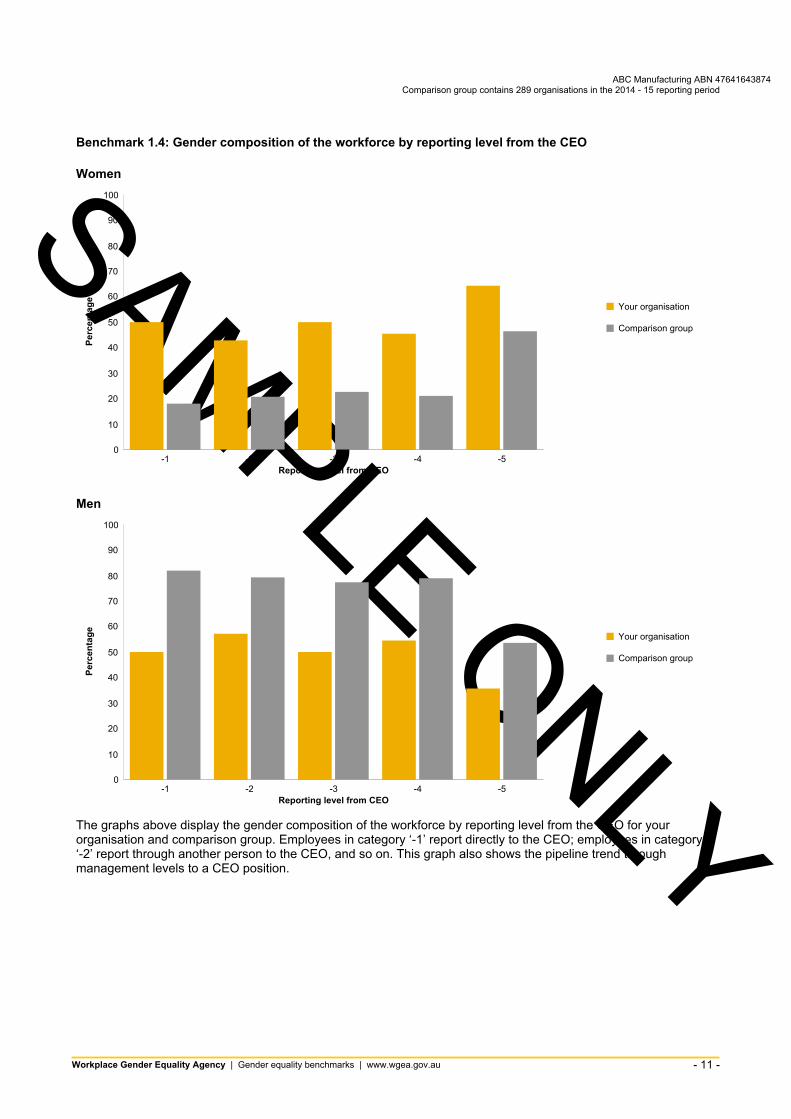
Benchmark 1.4: Gender composition of the workforce by reporting level from the CEO
0
10
20
30
40
50
60
70
80
90
100
-1 -2 -3 -4 -5
Your organisation
Comparison group
Reporting level from CEO
Perc
enta
ge
Men
0
10
20
30
40
50
60
70
80
90
100
-1 -2 -3 -4 -5
Your organisation
Comparison group
Reporting level from CEO
Perc
enta
ge
The graphs above display the gender composition of the workforce by reporting level from the CEO for your organisation and comparison group. Employees in category ‘-1’ report directly to the CEO; employees in category ‘-2’ report through another person to the CEO, and so on. This graph also shows the pipeline trend through management levels to a CEO position.
Workplace Gender Equality Agency | Gender equality benchmarks | www.wgea.gov.au - 11
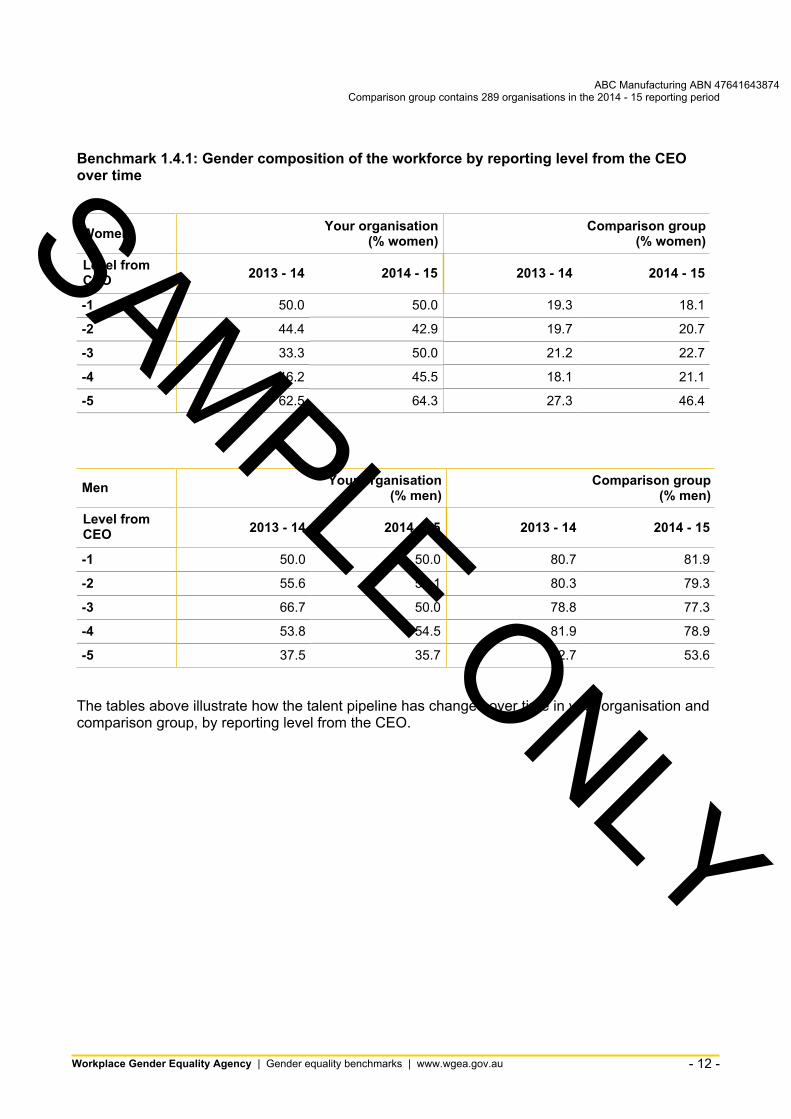
Benchmark 1.4.1: Gender composition of the workforce by reporting level from the CEO over time SAMPLE ONLY
Your organisation(% women)
Comparison group(% women)
-1
-2
-3
-4
-5
ABC Manufacturing ABN 47641643874 Comparison group contains 289 organisations in the 2014 - 15 reporting period
Women Your organisation(% women)
Comparison group(% women)
Level from CEO 2013 - 14 2014 - 15 2013 - 14 2014 - 15
-1 50.0 50.0 19.3 18.1
-2 44.4 42.9 19.7 20.7
-3 33.3 50.0 21.2 22.7
-4 46.2 45.5 18.1 21.1
-5 62.5 64.3 27.3 46.4
Your organisation Comparison groupMen (% men) (% men) Level from 2013 - 14 2014 - 15 2013 - 14 2014 - 15CEO
-1 50.0 50.0 80.7 81.9
-2 55.6 57.1 80.3 79.3
-3 66.7 50.0 78.8 77.3
-4 53.8 54.5 81.9 78.9
-5 37.5 35.7 72.7 53.6
The tables above illustrate how the talent pipeline has changed over time in your organisation and comparison group, by reporting level from the CEO.
Workplace Gender Equality Agency | Gender equality benchmarks | www.wgea.gov.au - 12
Women SAMPLE ONLY
WABC Manufacturing ABN 47641643874 Comparison group contains 289 organisations in the 2014 - 15 reporting period
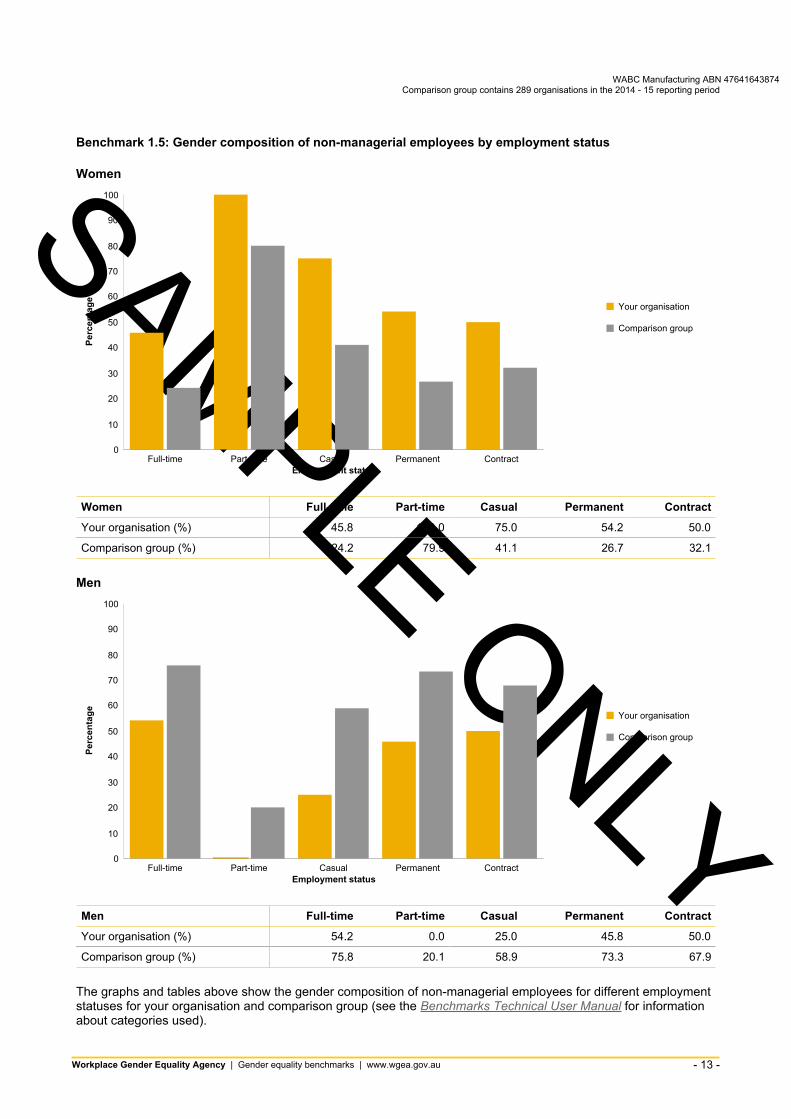
Benchmark 1.5: Gender composition of non-managerial employees by employment status
0
10
20
30
40
50
60
70
80
90
100
Full-time Part-time Casual Permanent Contract
Your organisation
Comparison group
Employment status
Perc
enta
ge
Women Full-time Part-time Casual Permanent Contract
Your organisation (%) 45.8 100.0 75.0 54.2 50.0
Comparison group (%) 24.2 79.9 41.1 26.7 32.1
Men
0
10
20
30
40
50
60
70
80
90
100
Full-time Part-time Casual Permanent Contract
Your organisation
Comparison group
Employment status
Perc
enta
ge
Men Full-time Part-time Casual Permanent Contract
Your organisation (%) 54.2 0.0 25.0 45.8 50.0
Comparison group (%) 75.8 20.1 58.9 73.3 67.9
The graphs and tables above show the gender composition of non-managerial employees for different employment statuses for your organisation and comparison group (see the Benchmarks Technical User Manual for information about categories used).
Workplace Gender Equality Agency | Gender equality benchmarks | www.wgea.gov.au - 13
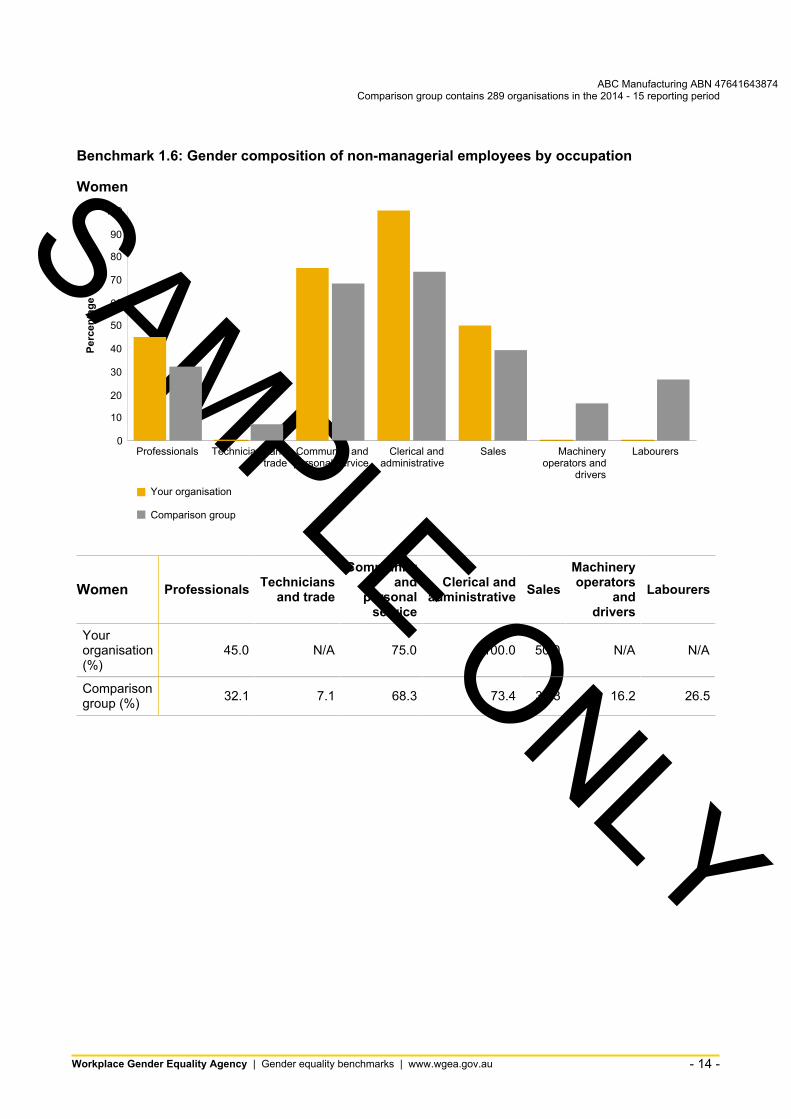
Benchmark 1.6: Gender composition of non-managerial employees by occupation
Women SAMPLE ONLY
ABC Manufacturing ABN 47641643874 Comparison group contains 289 organisations in the 2014 - 15 reporting period
0
10
20
30
40
50
60
70
80
90
100
Professionals Technicians andtrade
Community andpersonal service
Clerical andadministrative
Sales Machineryoperators and
drivers
Labourers
Your organisation
Comparison group
Perc
enta
ge
Community MachineryTechnicians and Clerical and operatorsProfessionals Sales Labourers Women and trade personal administrative and
service drivers
Your organisation 45.0 N/A 75.0 100.0 50.0 N/A N/A (%)
Comparison 32.1 7.1 68.3 73.4 39.3 16.2 26.5group (%)
Workplace Gender Equality Agency | Gender equality benchmarks | www.wgea.gov.au - 14
Men SAMPLE ONLY
ABC Manufacturing ABN 47641643874 Comparison group contains 289 organisations in the 2014 - 15 reporting period
0
10
20
30
40
50
60
70
80
90
100
Professionals Technicians andtrade
Community andpersonal service
Clerical andadministrative
Sales Machineryoperators and
drivers
Labourers
Your organisation
Comparison group
Perc
enta
ge
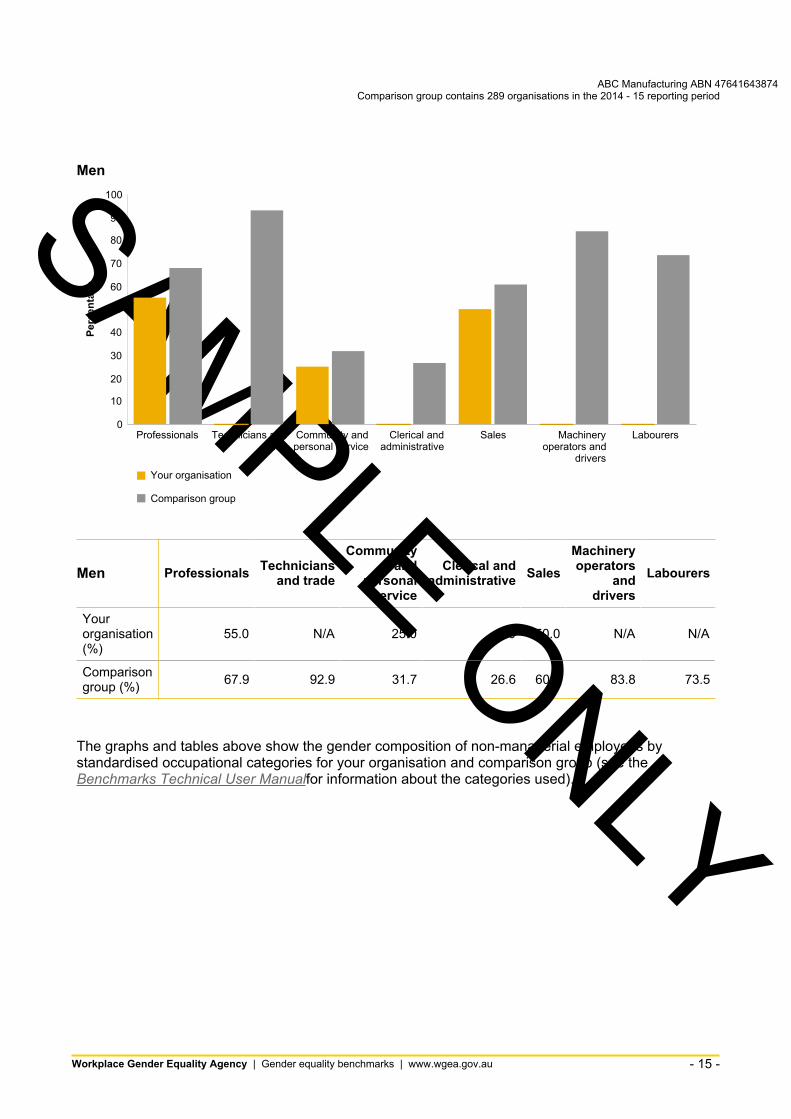
Men Professionals Technicians and trade
Communityand
personalservice
Clerical and administrative Sales
Machinery operators
and drivers
Labourers
Your organisation 55.0 N/A 25.0 0.0 50.0 N/A N/A (%)
Comparison 67.9 92.9 31.7 26.6 60.7 83.8 73.5group (%)
The graphs and tables above show the gender composition of non-managerial employees by standardised occupational categories for your organisation and comparison group (see the Benchmarks Technical User Manualfor information about the categories used).
Workplace Gender Equality Agency | Gender equality benchmarks | www.wgea.gov.au - 15
ABC Manufacturing ABN 47641643874 Comparison group contains 289 organisations in the 2014 - 15 reporting period
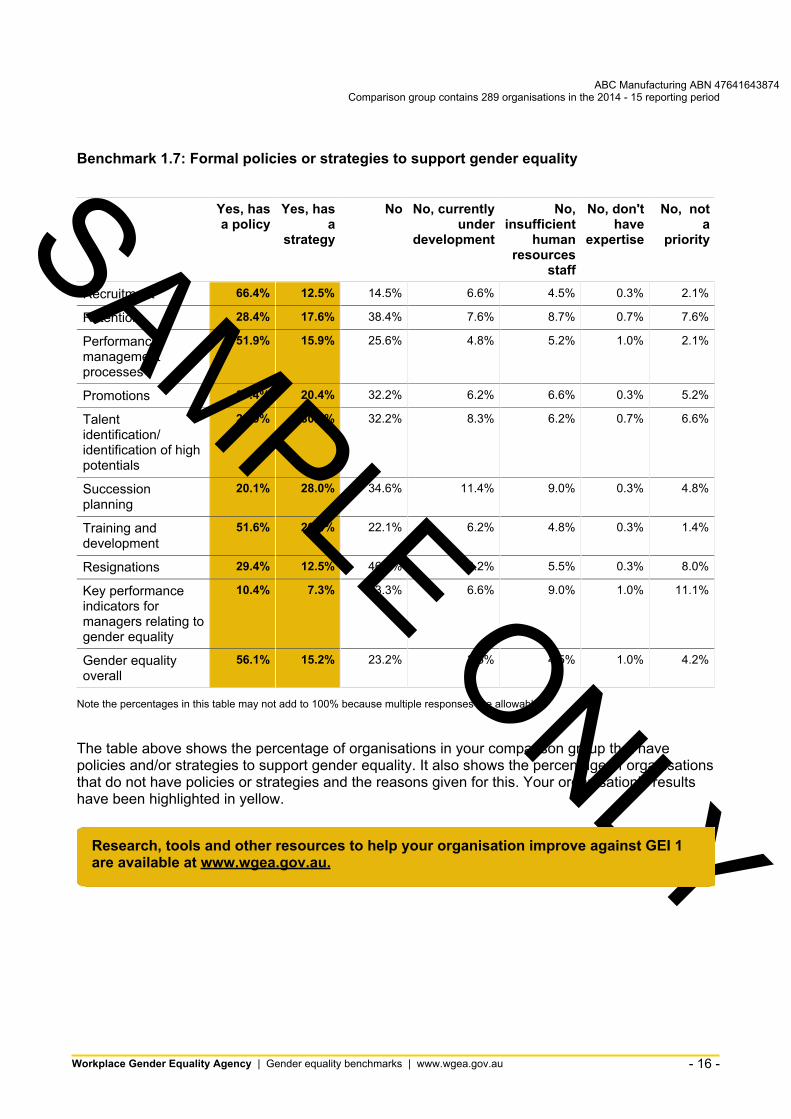
Benchmark 1.7: Formal policies or strategies to support gender equality SAMPLE ONLY
Yes, has Yes, has No No, currently No, No, don't No, not a policy a under insufficient have a
strategy development human expertise priority resources
staff 66.4% 12.5% 14.5% 6.6% 4.5% 0.3% 2.1%
28.4% 17.6% 38.4% 7.6% 8.7% 0.7% 7.6%
51.9% 15.9% 25.6% 4.8% 5.2% 1.0% 2.1%
37.4% 20.4% 32.2% 6.2% 6.6% 0.3% 5.2%
23.9% 30.4% 32.2% 8.3% 6.2% 0.7% 6.6%
20.1% 28.0% 34.6% 11.4% 9.0% 0.3% 4.8%
51.6% 20.4% 22.1% 6.2% 4.8% 0.3% 1.4%
29.4% 12.5% 46.7% 6.2% 5.5% 0.3% 8.0%
10.4% 7.3% 63.3% 6.6% 9.0% 1.0% 11.1%
56.1% 15.2% 23.2% 3.5% 4.5% 1.0% 4.2%
Recruitment
Retention
Performance management processes
Promotions
Talent identification/ identification of high potentials
Succession planning
Training and development
Resignations
Key performance indicators for managers relating to gender equality
Gender equality overall
Note the percentages in this table may not add to 100% because multiple responses are allowable.
The table above shows the percentage of organisations in your comparison group that have policies and/or strategies to support gender equality. It also shows the percentage of organisations that do not have policies or strategies and the reasons given for this. Your organisation’s results have been highlighted in yellow.
Research, tools and other resources to help your organisation improve against GEI 1are available at www.wgea.gov.au.
Workplace Gender Equality Agency | Gender equality benchmarks | www.wgea.gov.au - 16
ABC Manufacturing ABN 47641643874 Comparison group contains 289 organisations in the 2014 - 15 reporting period
SAMPLE ONLY
GEI 2: Gender composition of governing bodies/boards Reporting under gender equality indicator 2 (GEI 2) provides information about the gender composition of the governing body in a standardised format. The term ‘governing body’ used in this indicator is broad, and means a board of directors, trustees, committee of management, council or other governing authority of the employer. Governing bodies represent the highest level of decision-making responsibility in organisations.
Relevant questions in the reporting questionnaire relate to:
→ the existence of governing bodies/boards → the gender composition of the governing bodies/boards and any gender targets set for them.
The tables and graphs presented in this section of the benchmark report show the results for your organisation and comparison group on a range of indicators, as follows:
Section or Benchmark Description question on
reporting form
2.1 Gender composition of the governing body/board Q.2.1
2.1.1 Percentage of women on the governing body/board over time Q.2.1
2.2 Target set for gender composition of governing bodies/boards Q.2.1
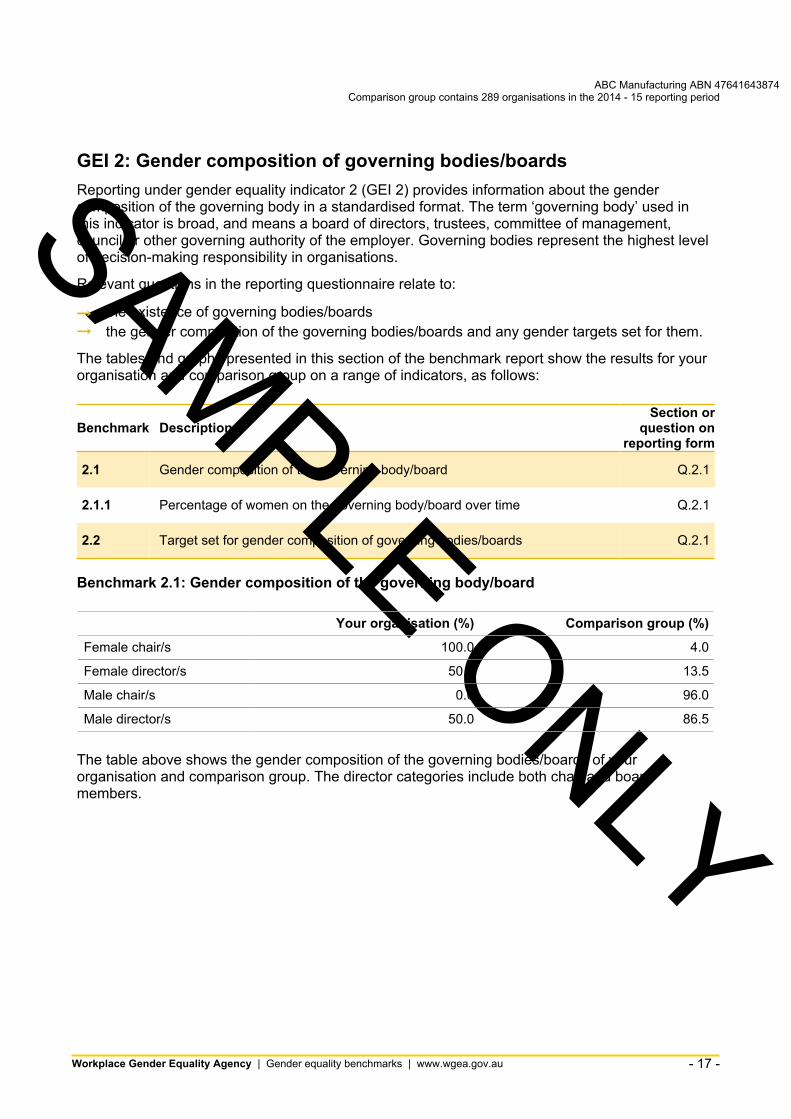
Benchmark 2.1: Gender composition of the governing body/board
Your organisation (%) Comparison group (%)
Female chair/s 100.0 4.0
Female director/s 50.0 13.5
Male chair/s 0.0 96.0
Male director/s 50.0 86.5
The table above shows the gender composition of the governing bodies/boards of your organisation and comparison group. The director categories include both chair and board members.
Workplace Gender Equality Agency | Gender equality benchmarks | www.wgea.gov.au - 17
ABC Manufacturing ABN 47641643874 Comparison group contains 289 organisations in the 2014 - 15 reporting period
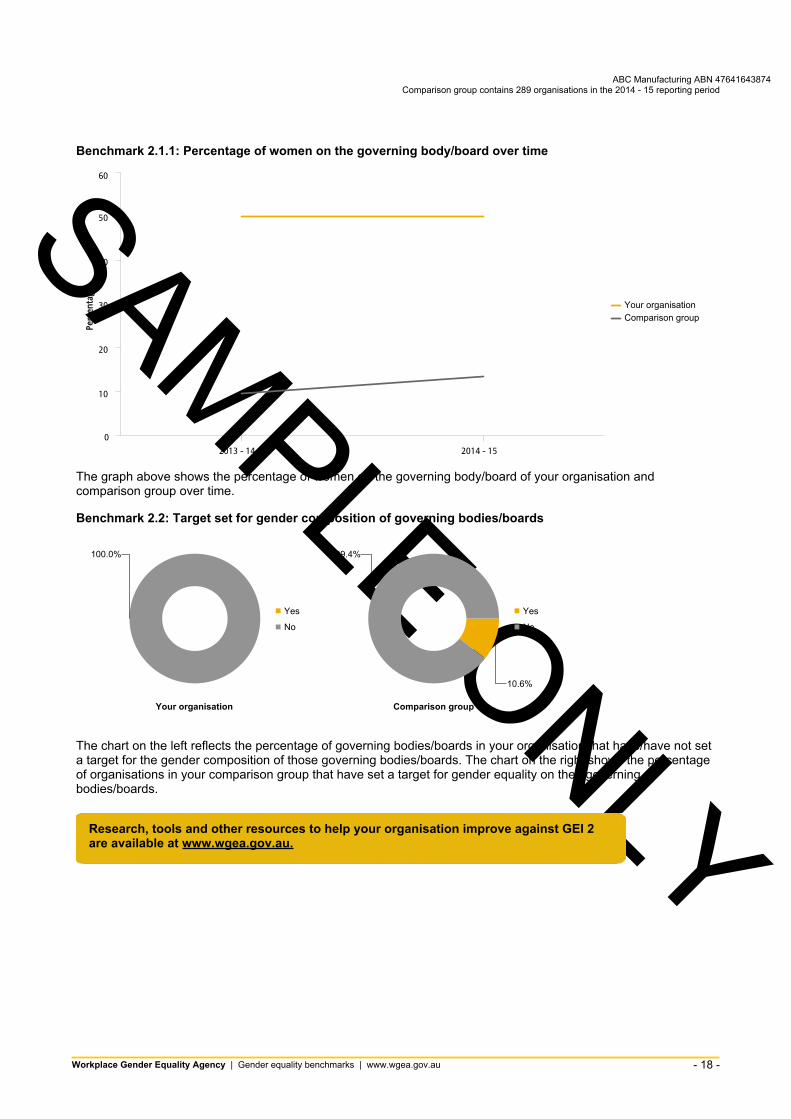
Benchmark 2.1.1: Percentage of women on the governing body/board over time
SAMPLE ONLY
0
10
20
30
40
50
60
Perc
enta
ge
2013 - 14 2014 - 15
Your organisationComparison group
The graph above shows the percentage of women on the governing body/board of your organisation and comparison group over time.
Benchmark 2.2: Target set for gender composition of governing bodies/boards
100.0%
Yes
No
Your organisation
10.6%
89.4%
Yes
No
Comparison group
The chart on the left reflects the percentage of governing bodies/boards in your organisation that have/have not set a target for the gender composition of those governing bodies/boards. The chart on the right shows the percentage of organisations in your comparison group that have set a target for gender equality on their governing bodies/boards.
Research, tools and other resources to help your organisation improve against GEI 2are available at www.wgea.gov.au.
Workplace Gender Equality Agency | Gender equality benchmarks | www.wgea.gov.au - 18
SAMPLE ONLY
ABC Manufacturing ABN 47641643874 Comparison group contains 289 organisations in the 2014 - 15 reporting period
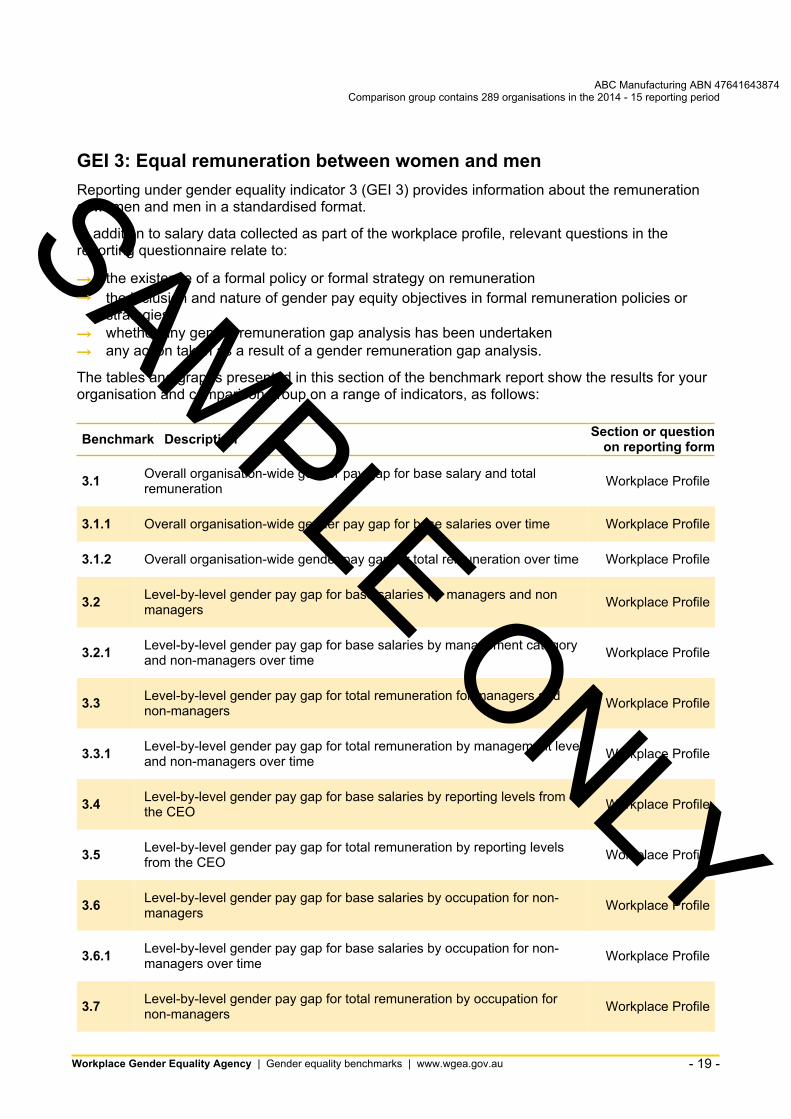
GEI 3: Equal remuneration between women and men Reporting under gender equality indicator 3 (GEI 3) provides information about the remuneration of women and men in a standardised format.
In addition to salary data collected as part of the workplace profile, relevant questions in the reporting questionnaire relate to:
→ the existence of a formal policy or formal strategy on remuneration → the inclusion and nature of gender pay equity objectives in formal remuneration policies or
strategies → whether any gender remuneration gap analysis has been undertaken → any action taken as a result of a gender remuneration gap analysis.
The tables and graphs presented in this section of the benchmark report show the results for your organisation and comparison group on a range of indicators, as follows:
Section or questionBenchmark Description on reporting form
Overall organisation-wide gender pay gap for base salary and total3.1 Workplace Profileremuneration
3.1.1 Overall organisation-wide gender pay gap for base salaries over time Workplace Profile
3.1.2 Overall organisation-wide gender pay gap for total remuneration over time Workplace Profile
Level-by-level gender pay gap for base salaries for managers and non3.2 Workplace Profilemanagers
Level-by-level gender pay gap for base salaries by management category3.2.1 Workplace Profileand non-managers over time
Level-by-level gender pay gap for total remuneration for managers and3.3 Workplace Profilenon-managers
Level-by-level gender pay gap for total remuneration by management level3.3.1 Workplace Profileand non-managers over time
Level-by-level gender pay gap for base salaries by reporting levels from3.4 Workplace Profilethe CEO
Level-by-level gender pay gap for total remuneration by reporting levels3.5 Workplace Profilefrom the CEO
Level-by-level gender pay gap for base salaries by occupation for non3.6 Workplace Profilemanagers
Level-by-level gender pay gap for base salaries by occupation for non3.6.1 Workplace Profilemanagers over time
Level-by-level gender pay gap for total remuneration by occupation for3.7 Workplace Profilenon-managers
Workplace Gender Equality Agency | Gender equality benchmarks | www.wgea.gov.au - 19
SAMPLE ONLY
ABC Manufacturing ABN 47641643874 Comparison group contains 289 organisations in the 2014 - 15 reporting period
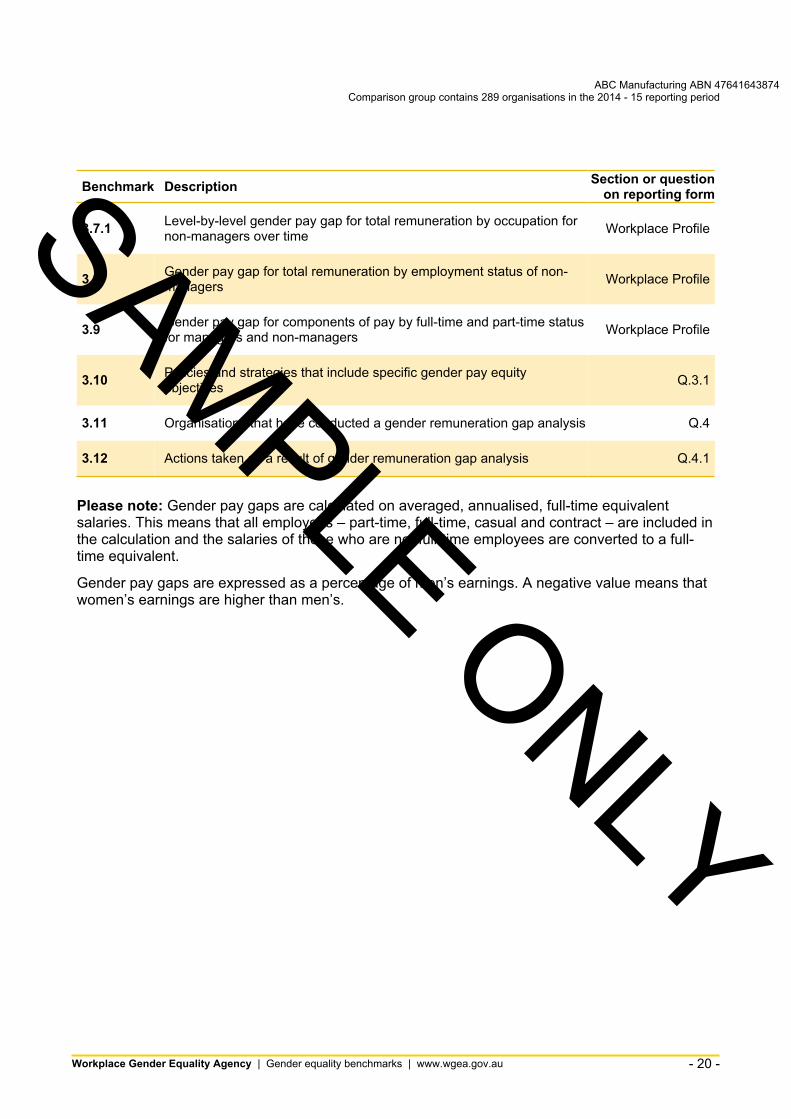
Section or questionBenchmark Description on reporting form
Level-by-level gender pay gap for total remuneration by occupation for3.7.1 Workplace Profilenon-managers over time
Gender pay gap for total remuneration by employment status of non3.8 Workplace Profilemanagers
Gender pay gap for components of pay by full-time and part-time status3.9 Workplace Profilefor managers and non-managers
Policies and strategies that include specific gender pay equity3.10 Q.3.1objectives
3.11 Organisations that have conducted a gender remuneration gap analysis Q.4
3.12 Actions taken as a result of gender remuneration gap analysis Q.4.1
Please note: Gender pay gaps are calculated on averaged, annualised, full-time equivalent salaries. This means that all employees – part-time, full-time, casual and contract – are included in the calculation and the salaries of those who are not full-time employees are converted to a full-time equivalent.
Gender pay gaps are expressed as a percentage of men’s earnings. A negative value means that women’s earnings are higher than men’s.
Workplace Gender Equality Agency | Gender equality benchmarks | www.wgea.gov.au - 20
SAMPLE ONLY
ABC Manufacturing ABN 47641643874 Comparison group contains 289 organisations in the 2014 - 15 reporting period
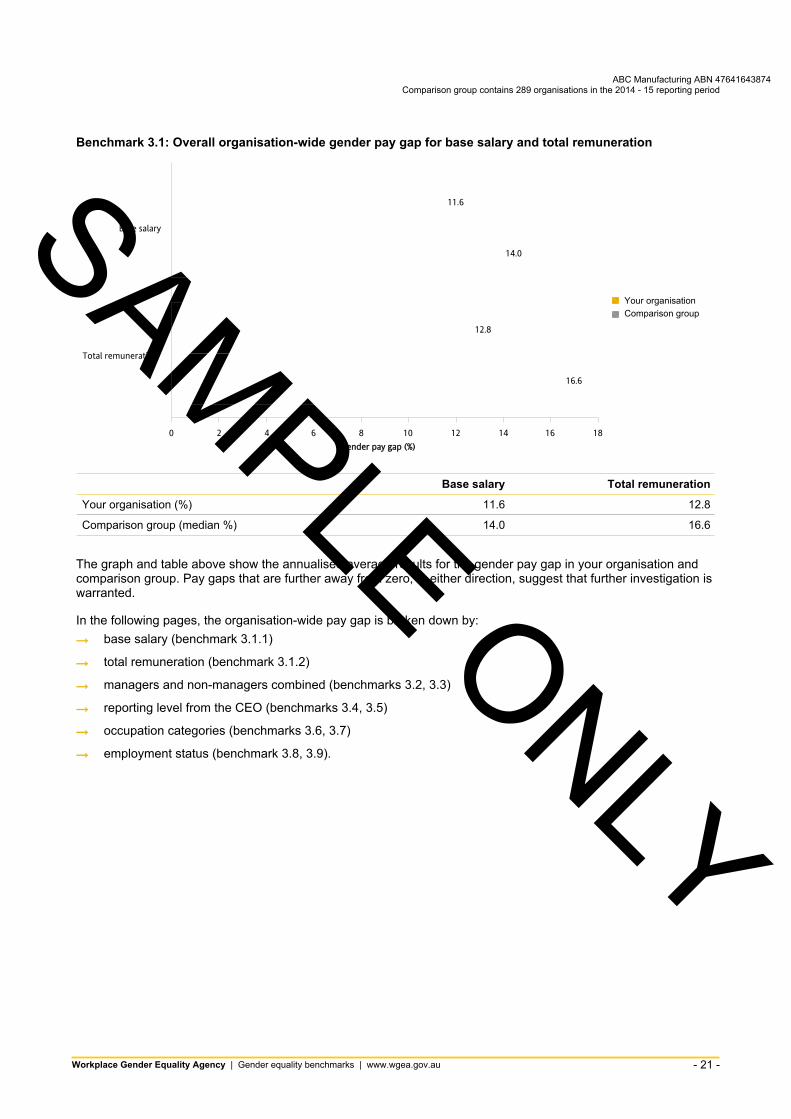
Benchmark 3.1: Overall organisation-wide gender pay gap for base salary and total remuneration
16.6
14.0
12.8
11.6
0 2 4 6 8 10 12 14 16 18Gender pay gap (%)
Total remuneration
Base salary
Your organisationComparison group
Base salary Total remuneration
Your organisation (%) 11.6 12.8
Comparison group (median %) 14.0 16.6
The graph and table above show the annualised average results for the gender pay gap in your organisation and comparison group. Pay gaps that are further away from zero, in either direction, suggest that further investigation is warranted.
In the following pages, the organisation-wide pay gap is broken down by: → base salary (benchmark 3.1.1)
→ total remuneration (benchmark 3.1.2)
→ managers and non-managers combined (benchmarks 3.2, 3.3)
→ reporting level from the CEO (benchmarks 3.4, 3.5)
→ occupation categories (benchmarks 3.6, 3.7)
→ employment status (benchmark 3.8, 3.9).
Workplace Gender Equality Agency | Gender equality benchmarks | www.wgea.gov.au - 21
SAMPLE ONLY
ABC Manufacturing ABN 47641643874 Comparison group contains 289 organisations in the 2014 - 15 reporting period
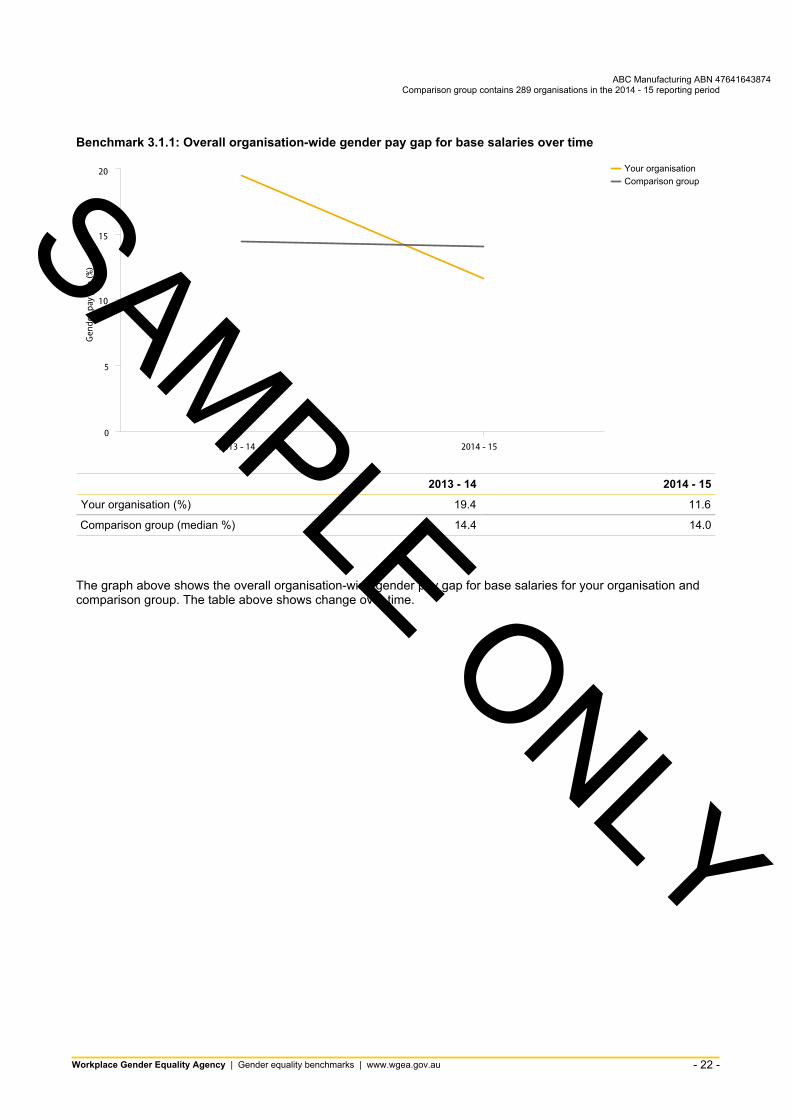
Benchmark 3.1.1: Overall organisation-wide gender pay gap for base salaries over time
0
5
10
15
20
Gend
er p
ay g
ap (%
)
2013 - 14 2014 - 15
Your organisationComparison group
2013 - 14 2014 - 15
Your organisation (%) 19.4 11.6
Comparison group (median %) 14.4 14.0
The graph above shows the overall organisation-wide gender pay gap for base salaries for your organisation and comparison group. The table above shows change over time.
Workplace Gender Equality Agency | Gender equality benchmarks | www.wgea.gov.au - 22
SAMPLE ONLY
ABC Manufacturing ABN 47641643874 Comparison group contains 289 organisations in the 2014 - 15 reporting period
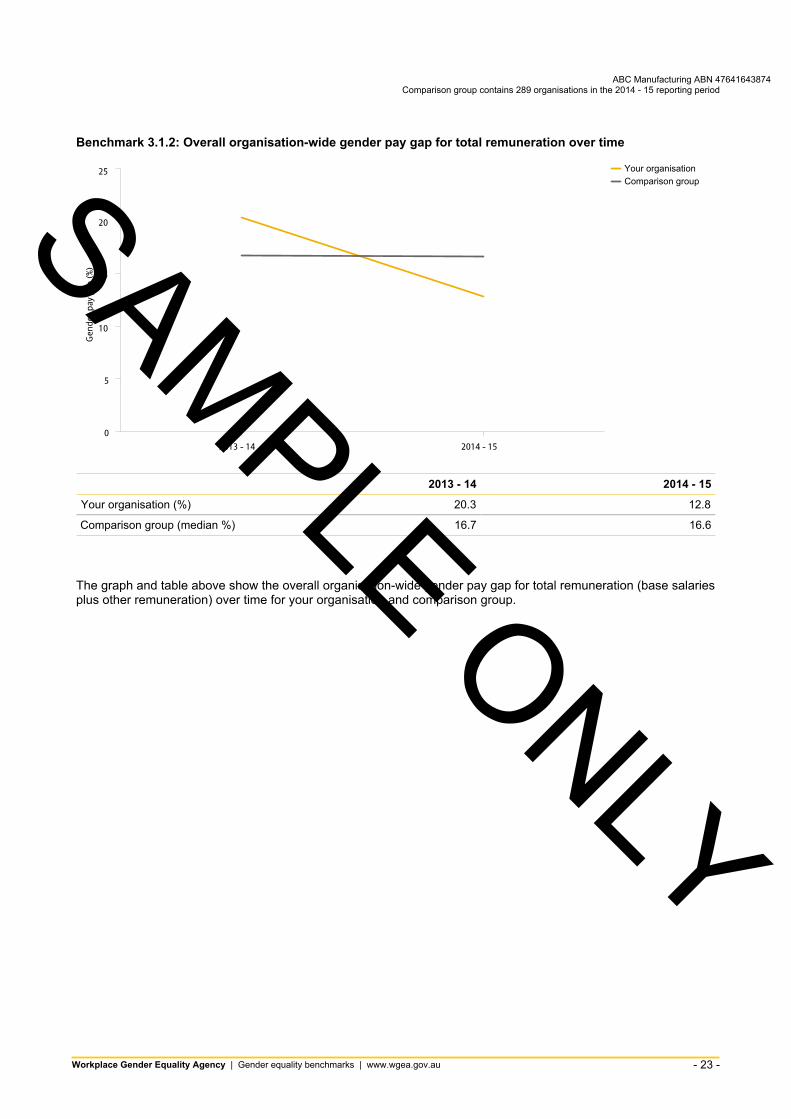
Benchmark 3.1.2: Overall organisation-wide gender pay gap for total remuneration over time
0
5
10
15
20
25
Gend
er p
ay g
ap (%
)
2013 - 14 2014 - 15
Your organisationComparison group
2013 - 14 2014 - 15
Your organisation (%) 20.3 12.8
Comparison group (median %) 16.7 16.6
The graph and table above show the overall organisation-wide gender pay gap for total remuneration (base salaries plus other remuneration) over time for your organisation and comparison group.
Workplace Gender Equality Agency | Gender equality benchmarks | www.wgea.gov.au - 23
SAMPLE ONLY
ABC Manufacturing ABN 47641643874 Comparison group contains 289 organisations in the 2014 - 15 reporting period
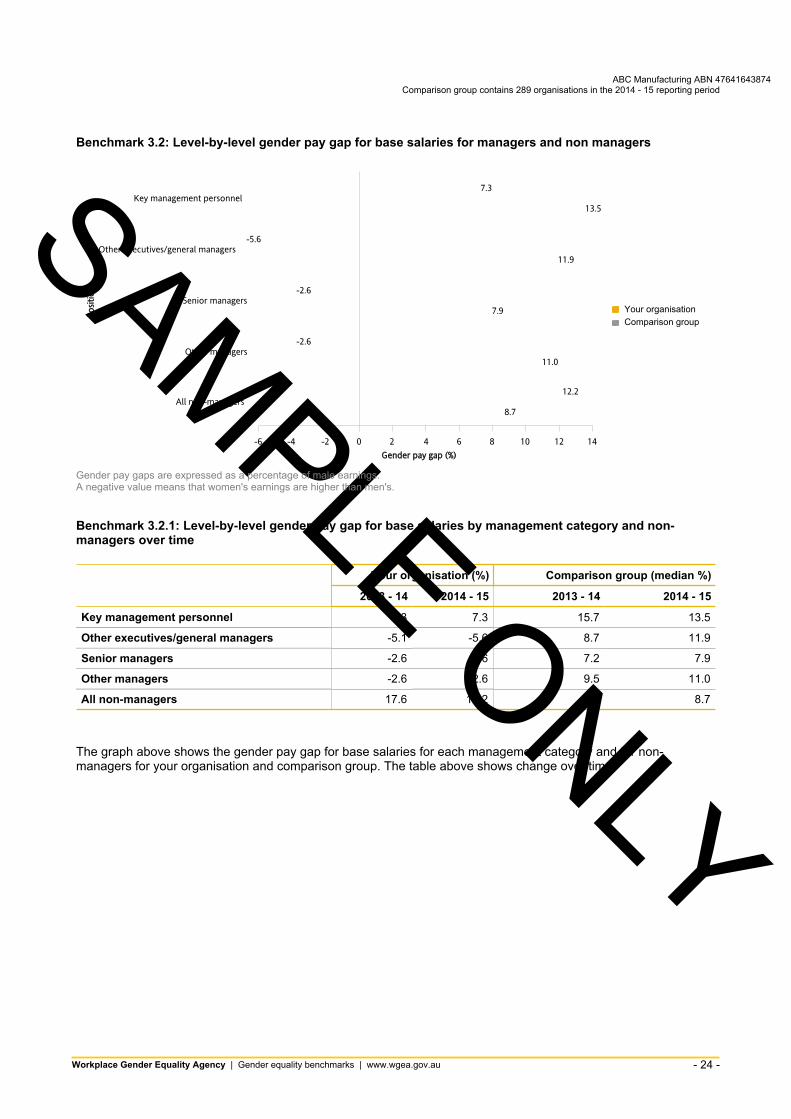
Benchmark 3.2: Level-by-level gender pay gap for base salaries for managers and non managers
8.7
11.0
7.9
11.9
13.5
12.2
-2.6
-2.6
-5.6
7.3
-6 -4 -2 0 2 4 6 8 10 12 14Gender pay gap (%)
All non-managers
Other managers
Senior managers
Other executives/general managers
Key management personnel
Posit
ion
Your organisationComparison group
Gender pay gaps are expressed as a percentage of male earnings. A negative value means that women's earnings are higher than men's.
Benchmark 3.2.1: Level-by-level gender pay gap for base salaries by management category and non-managers over time
Your organisation (%) Comparison group (median %)
2013 - 14 2014 - 15 2013 - 14 2014 - 15
Key management personnel 7.3 7.3 15.7 13.5
Other executives/general managers -5.1 -5.6 8.7 11.9
Senior managers -2.6 -2.6 7.2 7.9
Other managers -2.6 -2.6 9.5 11.0
All non-managers 17.6 12.2 9.2 8.7
The graph above shows the gender pay gap for base salaries for each management category and for non-managers for your organisation and comparison group. The table above shows change over time.
Workplace Gender Equality Agency | Gender equality benchmarks | www.wgea.gov.au - 24
SAMPLE ONLY
ABC Manufacturing ABN 47641643874 Comparison group contains 289 organisations in the 2014 - 15 reporting period
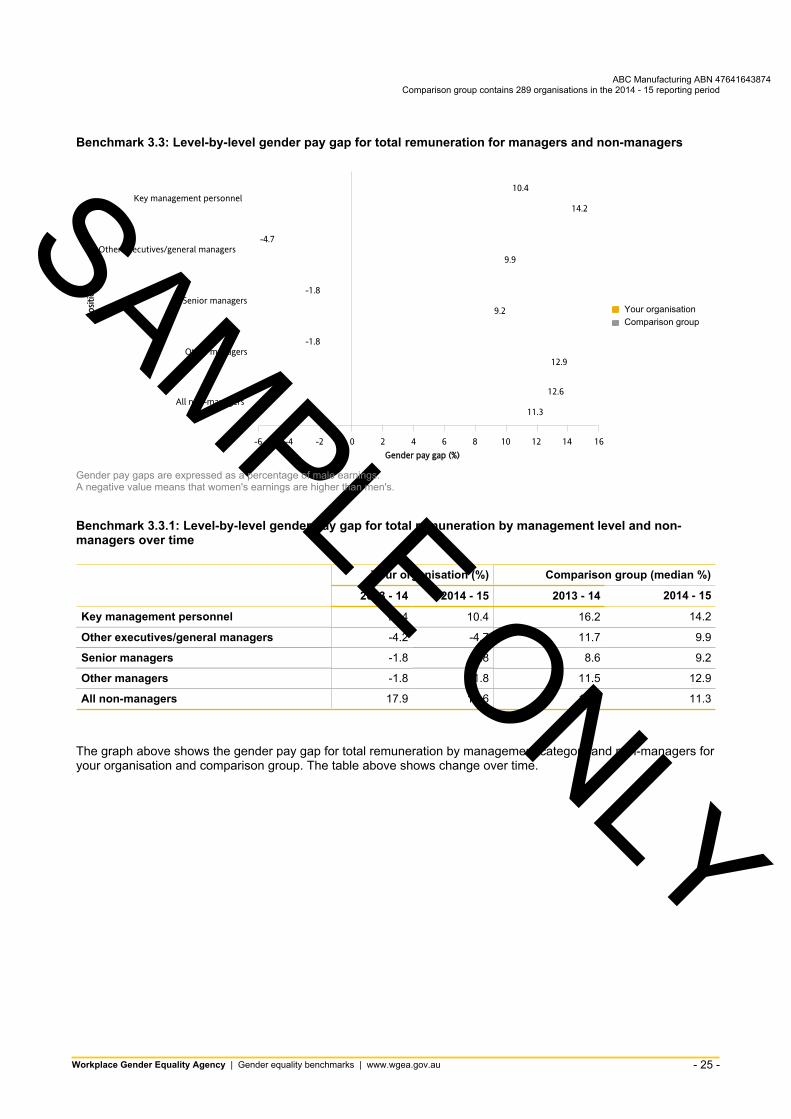
Benchmark 3.3: Level-by-level gender pay gap for total remuneration for managers and non-managers
11.3
12.9
9.2
9.9
14.2
12.6
-1.8
-1.8
-4.7
10.4
-6 -4 -2 0 2 4 6 8 10 12 14 16Gender pay gap (%)
All non-managers
Other managers
Senior managers
Other executives/general managers
Key management personnel
Posit
ion
Your organisationComparison group
Gender pay gaps are expressed as a percentage of male earnings. A negative value means that women's earnings are higher than men's.
Benchmark 3.3.1: Level-by-level gender pay gap for total remuneration by management level and non-managers over time
Your organisation (%) Comparison group (median %)
2013 - 14 2014 - 15 2013 - 14 2014 - 15
Key management personnel 10.4 10.4 16.2 14.2
Other executives/general managers -4.2 -4.7 11.7 9.9
Senior managers -1.8 -1.8 8.6 9.2
Other managers -1.8 -1.8 11.5 12.9
All non-managers 17.9 12.6 11.2 11.3
The graph above shows the gender pay gap for total remuneration by management category and non-managers for your organisation and comparison group. The table above shows change over time.
Workplace Gender Equality Agency | Gender equality benchmarks | www.wgea.gov.au - 25
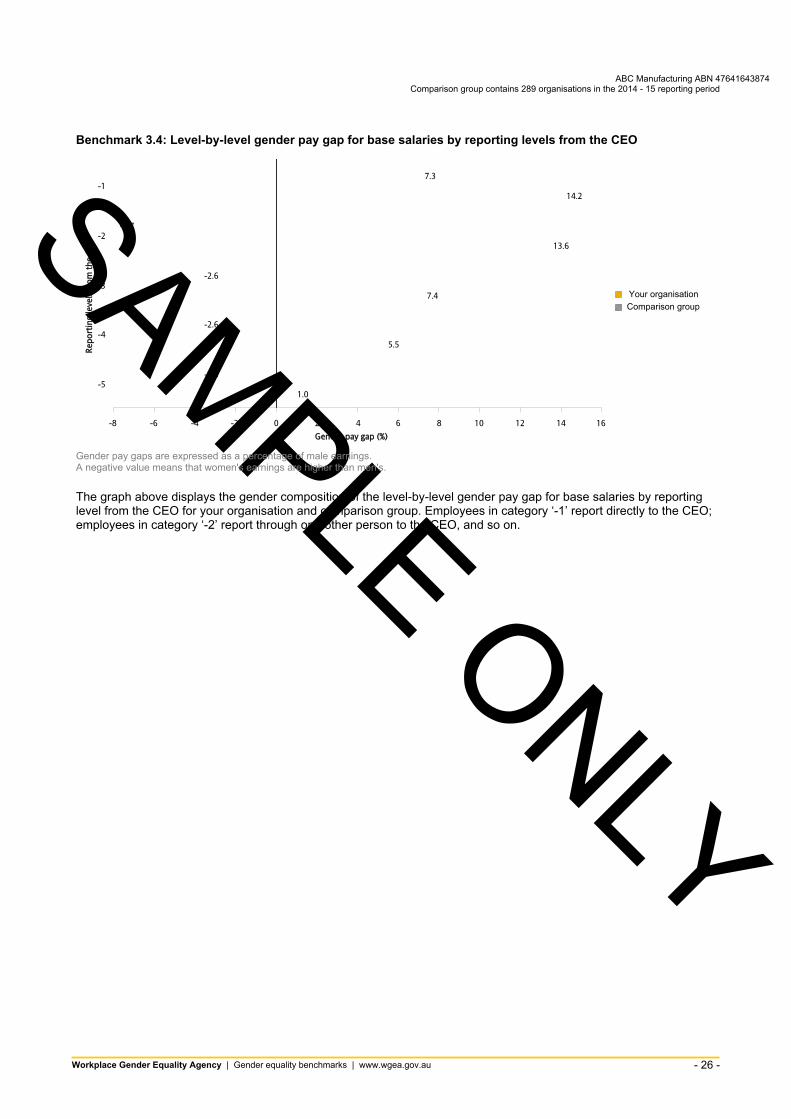
1.0
5.5
7.4
13.6
14.2
-2.6
-2.6
-2.6
-6.7
7.3
-8 -6 -4 -2 0 2 4 6 8 10 12 14 16Gender pay gap (%)
-5
-4
-3
-2
-1
Repo
rtin
g le
vels
from
the
CEO
Your organisationComparison group
SAMPLE ONLY
ABC Manufacturing ABN 47641643874 Comparison group contains 289 organisations in the 2014 - 15 reporting period
Benchmark 3.4: Level-by-level gender pay gap for base salaries by reporting levels from the CEO
Gender pay gaps are expressed as a percentage of male earnings. A negative value means that women's earnings are higher than men's.
The graph above displays the gender composition of the level-by-level gender pay gap for base salaries by reporting level from the CEO for your organisation and comparison group. Employees in category ‘-1’ report directly to the CEO; employees in category ‘-2’ report through one other person to the CEO, and so on.
Workplace Gender Equality Agency | Gender equality benchmarks | www.wgea.gov.au - 26
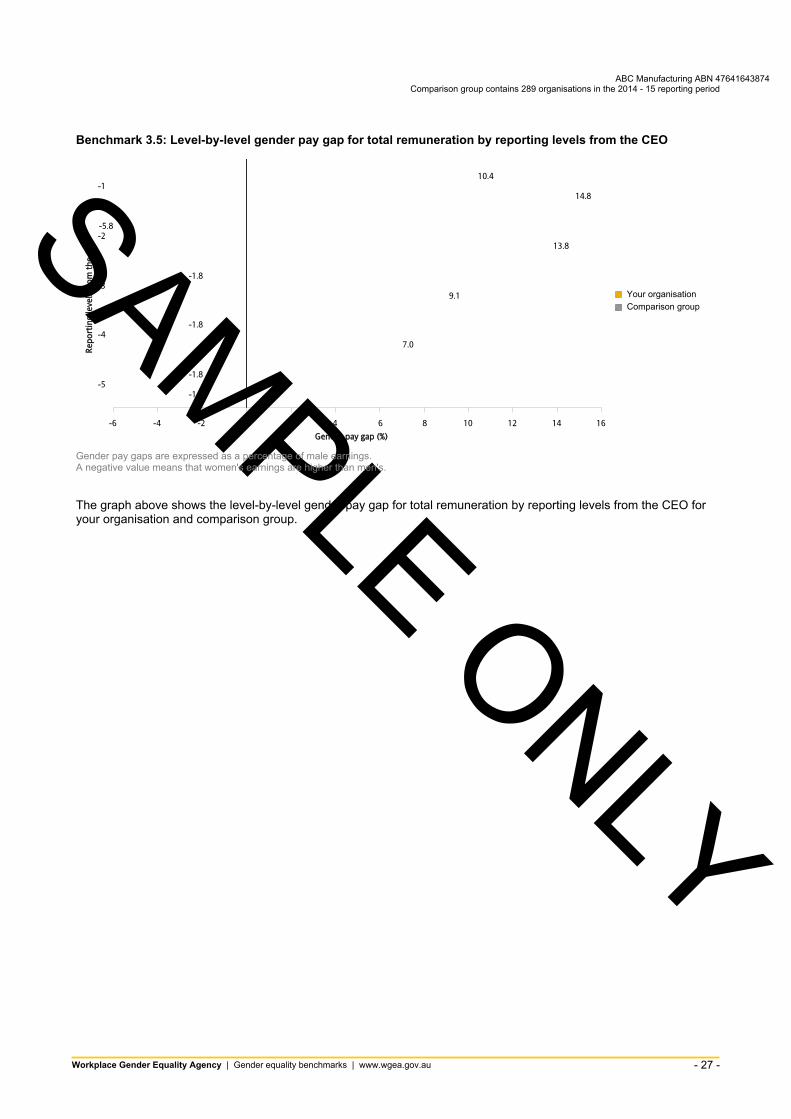
-1.8
7.0
9.1
13.8
14.8
-1.8
-1.8
-1.8
-5.8
10.4
-6 -4 -2 0 2 4 6 8 10 12 14 16Gender pay gap (%)
-5
-4
-3
-2
-1
Repo
rtin
g le
vels
from
the
CEO
Your organisationComparison group
SAMPLE ONLY
ABC Manufacturing ABN 47641643874 Comparison group contains 289 organisations in the 2014 - 15 reporting period
Benchmark 3.5: Level-by-level gender pay gap for total remuneration by reporting levels from the CEO
Gender pay gaps are expressed as a percentage of male earnings. A negative value means that women's earnings are higher than men's.
The graph above shows the level-by-level gender pay gap for total remuneration by reporting levels from the CEO for your organisation and comparison group.
Workplace Gender Equality Agency | Gender equality benchmarks | www.wgea.gov.au - 27
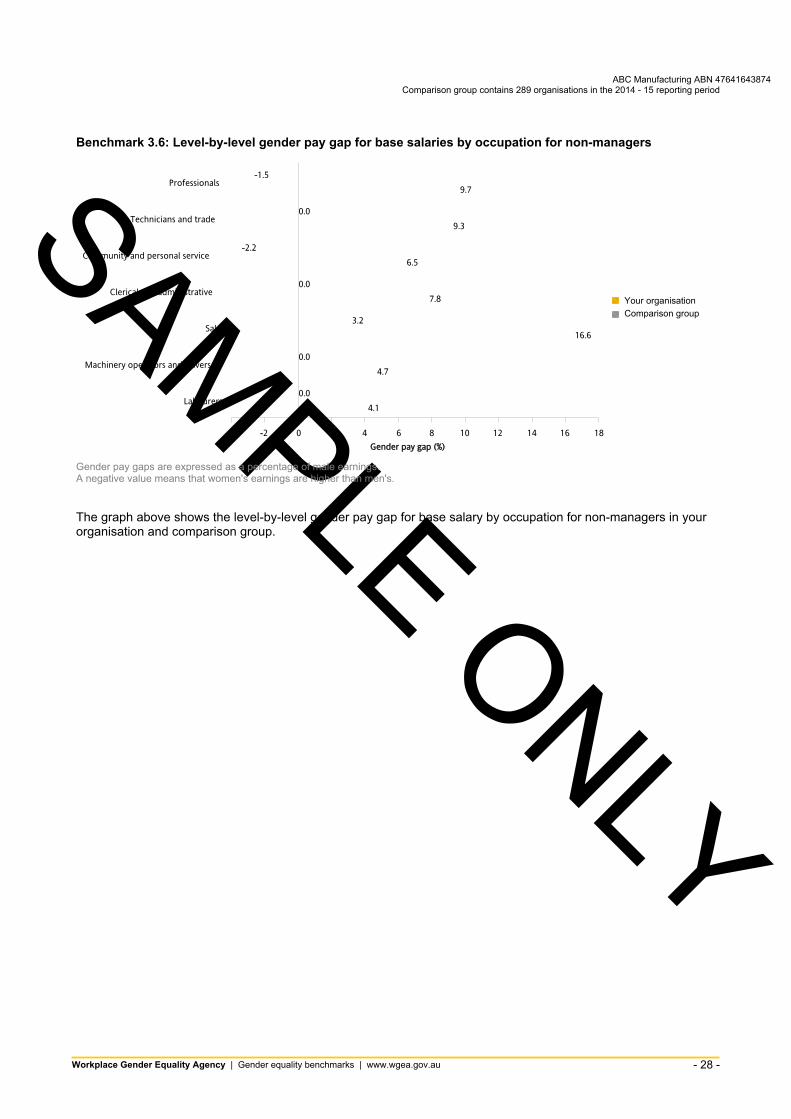
4.1
4.7
16.6
7.8
6.5
9.3
9.7
0.0
0.0
3.2
0.0
-2.2
0.0
-1.5
-4 -2 0 2 4 6 8 10 12 14 16 18Gender pay gap (%)
Labourers
Machinery operators and drivers
Sales
Clerical and administrative
Community and personal service
Technicians and trade
Professionals
Your organisationComparison group
SAMPLE ONLY
ABC Manufacturing ABN 47641643874 Comparison group contains 289 organisations in the 2014 - 15 reporting period
Benchmark 3.6: Level-by-level gender pay gap for base salaries by occupation for non-managers
Gender pay gaps are expressed as a percentage of male earnings. A negative value means that women's earnings are higher than men's.
The graph above shows the level-by-level gender pay gap for base salary by occupation for non-managers in your organisation and comparison group.
Workplace Gender Equality Agency | Gender equality benchmarks | www.wgea.gov.au - 28

Benchmark 3.6.1: Level-by-level gender pay gap for base salaries by occupation for non-managers over time SAMPLE ONLY
ABC Manufacturing ABN 47641643874 Comparison group contains 289 organisations in the 2014 - 15 reporting period
Your organisation (%) Comparison group (median %)
2013 - 14 2014 - 15 2013 - 14 2014 - 15
Professionals -1.5 -1.5 11.3 9.7
Technicians and trade 0.0 0.0 9.8 9.3
Community and personal service -2.2 -2.2 -2.2 6.5
Clerical and administrative 0.0 0.0 10.6 7.8
Sales 3.2 3.2 15.6 16.6
Machinery operators and drivers 0.0 0.0 4.6 4.7
Labourers 0.0 0.0 3.6 4.1
The graph above shows the level-by-level gender pay gap for base salaries by occupation for non-managers in your organisation and comparison group. The table above shows change over time.
Workplace Gender Equality Agency | Gender equality benchmarks | www.wgea.gov.au - 29

5.6
5.7
17.6
7.8
11.4
10.9
12.3
0.0
0.0
3.2
0.0
-1.3
0.0
-0.6
-2 0 2 4 6 8 10 12 14 16 18Gender pay gap (%)
Labourers
Machinery operators and drivers
Sales
Clerical and administrative
Community and personal service
Technicians and trade
Professionals
Your organisationComparison group
SAMPLE ONLY
ABC Manufacturing ABN 47641643874 Comparison group contains 289 organisations in the 2014 - 15 reporting period
Benchmark 3.7: Level-by-level gender pay gap for total remuneration by occupation for non-managers
Gender pay gaps are expressed as a percentage of male earnings. A negative value means that women's earnings are higher than men's.
The graph above shows the level-by-level gender pay gap for total remuneration by occupation for non-managers in your organisation and comparison group.
Workplace Gender Equality Agency | Gender equality benchmarks | www.wgea.gov.au - 30
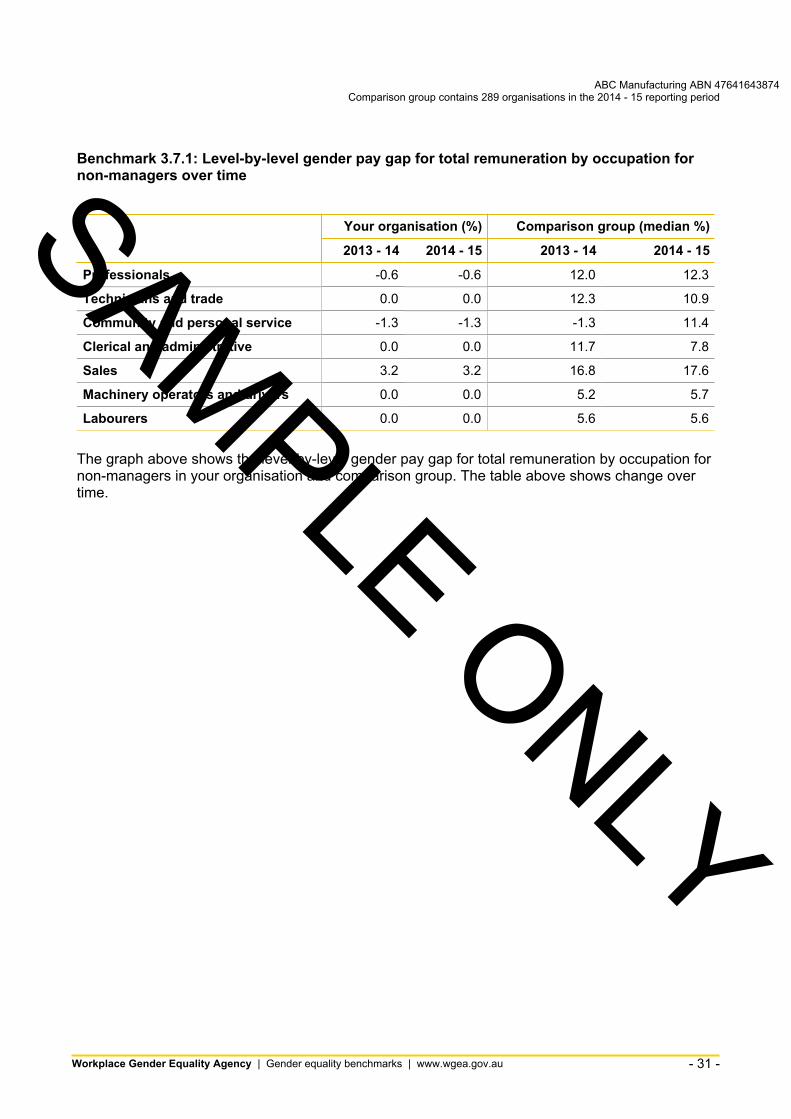
Benchmark 3.7.1: Level-by-level gender pay gap for total remuneration by occupation for non-managers over time SAMPLE ONLY
ABC Manufacturing ABN 47641643874 Comparison group contains 289 organisations in the 2014 - 15 reporting period
Your organisation (%) Comparison group (median %)
2013 - 14 2014 - 15 2013 - 14 2014 - 15
Professionals -0.6 -0.6 12.0 12.3
Technicians and trade 0.0 0.0 12.3 10.9
Community and personal service -1.3 -1.3 -1.3 11.4
Clerical and administrative 0.0 0.0 11.7 7.8
Sales 3.2 3.2 16.8 17.6
Machinery operators and drivers 0.0 0.0 5.2 5.7
Labourers 0.0 0.0 5.6 5.6
The graph above shows the level-by-level gender pay gap for total remuneration by occupation for non-managers in your organisation and comparison group. The table above shows change over time.
Workplace Gender Equality Agency | Gender equality benchmarks | www.wgea.gov.au - 31

4.3
11.8
10.8
8.9
2.5
0.0
0.0
-0.6
3.2
-1.3
-2 0 2 4 6 8 10 12Gender pay gap (%)
Part-time permanent
Part-time contract
Full-time permanent
Full-time contract
Casual
Your organisationComparison group
SAMPLE ONLY
ABC Manufacturing ABN 47641643874 Comparison group contains 289 organisations in the 2014 - 15 reporting period
Benchmark 3.8: Gender pay gap for total remuneration by employment status of non-managers
Gender pay gaps are expressed as a percentage of male earnings. A negative value means that women's earnings are higher than men's.
The graph above shows the gender pay gap for total remuneration by employment status for non-managers for your organisation and comparison group.
Workplace Gender Equality Agency | Gender equality benchmarks | www.wgea.gov.au - 32
non-managers
Managers SAMPLE ONLY
ABC Manufacturing ABN 47641643874 Comparison group contains 289 organisations in the 2014 - 15 reporting period
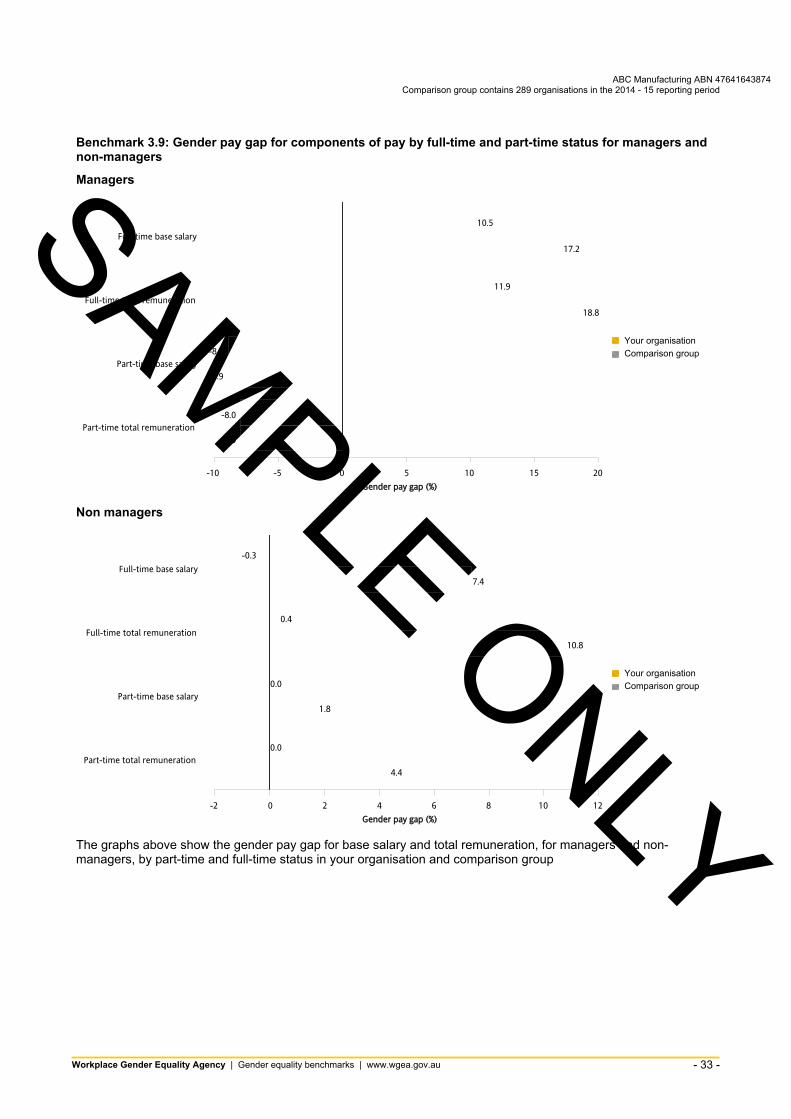
Benchmark 3.9: Gender pay gap for components of pay by full-time and part-time status for managers and
-8.0
-8.9
18.8
17.2
-8.0
-8.9
11.9
10.5
-10 -5 0 5 10 15 20Gender pay gap (%)
Part-time total remuneration
Part-time base salary
Full-time total remuneration
Full-time base salary
Your organisationComparison group
Non managers
4.4
1.8
10.8
7.4
0.0
0.0
0.4
-0.3
-2 0 2 4 6 8 10 12Gender pay gap (%)
Part-time total remuneration
Part-time base salary
Full-time total remuneration
Full-time base salary
Your organisationComparison group
The graphs above show the gender pay gap for base salary and total remuneration, for managers and non-managers, by part-time and full-time status in your organisation and comparison group
Workplace Gender Equality Agency | Gender equality benchmarks | www.wgea.gov.au - 33
SAMPLE ONLY
ABC Manufacturing ABN 47641643874 Comparison group contains 289 organisations in the 2014 - 15 reporting period
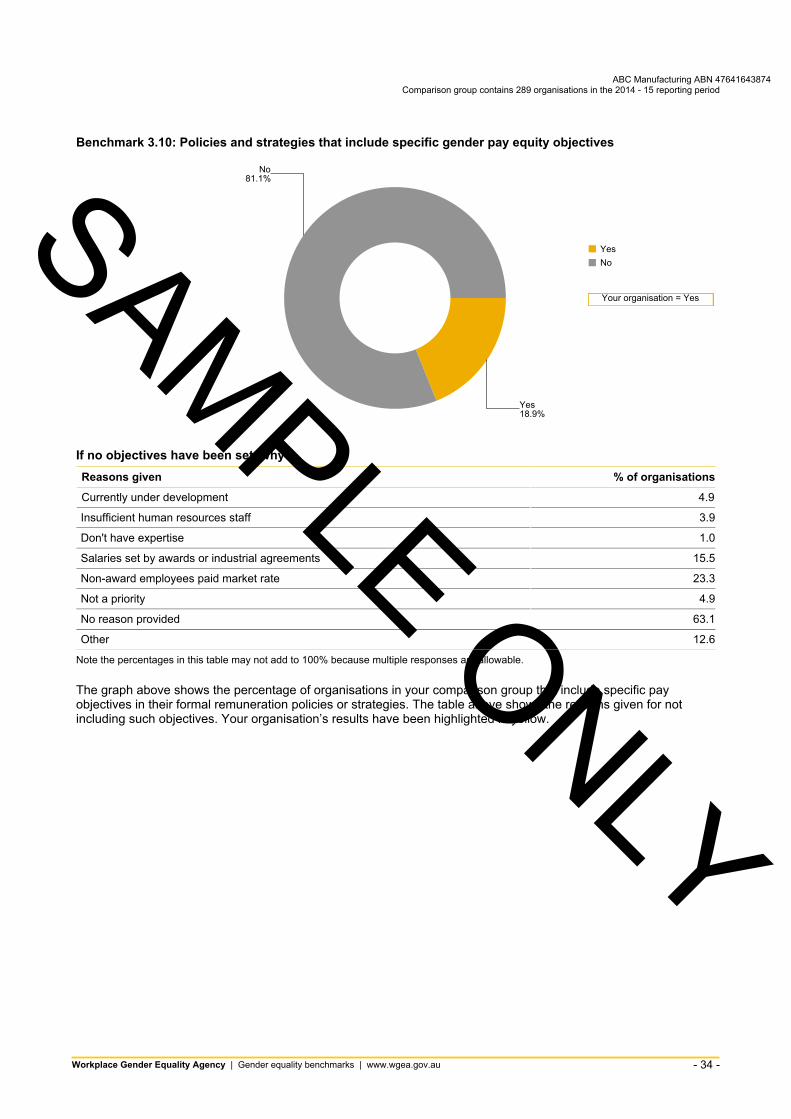
Benchmark 3.10: Policies and strategies that include specific gender pay equity objectives
18.9%Yes
81.1%No
YesNo
Your organisation = Yes
If no objectives have been set, why? Reasons given % of organisations
Currently under development 4.9
Insufficient human resources staff 3.9
Don't have expertise 1.0
Salaries set by awards or industrial agreements 15.5
Non-award employees paid market rate 23.3
Not a priority 4.9
No reason provided 63.1
Other 12.6
Note the percentages in this table may not add to 100% because multiple responses are allowable.
The graph above shows the percentage of organisations in your comparison group that include specific pay objectives in their formal remuneration policies or strategies. The table above shows the reasons given for not including such objectives. Your organisation’s results have been highlighted in yellow.
Workplace Gender Equality Agency | Gender equality benchmarks | www.wgea.gov.au - 34
SAMPLE ONLY
ABC Manufacturing ABN 47641643874 Comparison group contains 289 organisations in the 2014 - 15 reporting period
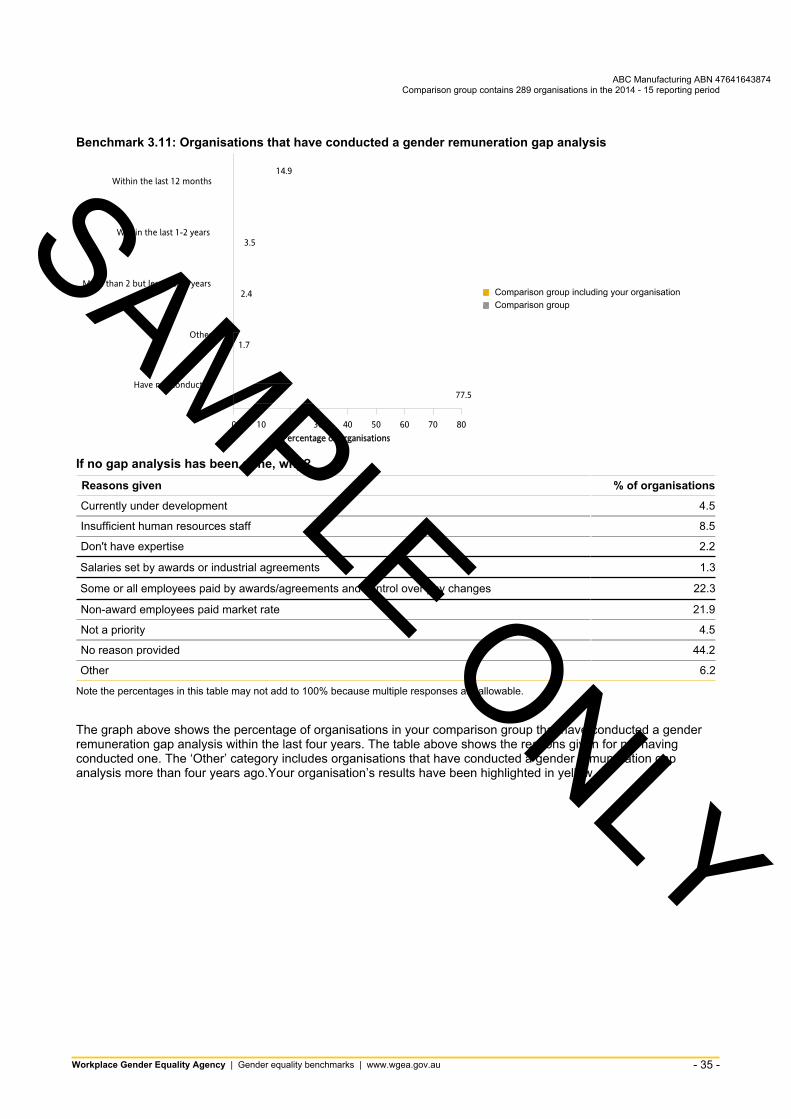
Benchmark 3.11: Organisations that have conducted a gender remuneration gap analysis
77.5
1.7
2.4
3.5
14.9
0 10 20 30 40 50 60 70 80Percentage of organisations
Have not conducted
Other
More than 2 but less than 4 years
Within the last 1-2 years
Within the last 12 months
Comparison group including your organisationComparison group
If no gap analysis has been done, why? Reasons given % of organisations
Currently under development 4.5
Insufficient human resources staff 8.5
Don't have expertise 2.2
Salaries set by awards or industrial agreements 1.3
Some or all employees paid by awards/agreements and control over pay changes 22.3
Non-award employees paid market rate 21.9
Not a priority 4.5
No reason provided 44.2
Other 6.2
Note the percentages in this table may not add to 100% because multiple responses are allowable.
The graph above shows the percentage of organisations in your comparison group that have conducted a gender remuneration gap analysis within the last four years. The table above shows the reasons given for not having conducted one. The ‘Other’ category includes organisations that have conducted a gender remuneration gap analysis more than four years ago.Your organisation’s results have been highlighted in yellow.
Workplace Gender Equality Agency | Gender equality benchmarks | www.wgea.gov.au - 35
ABC Manufacturing ABN 47641643874 Comparison group contains 289 organisations in the 2014 - 15 reporting period
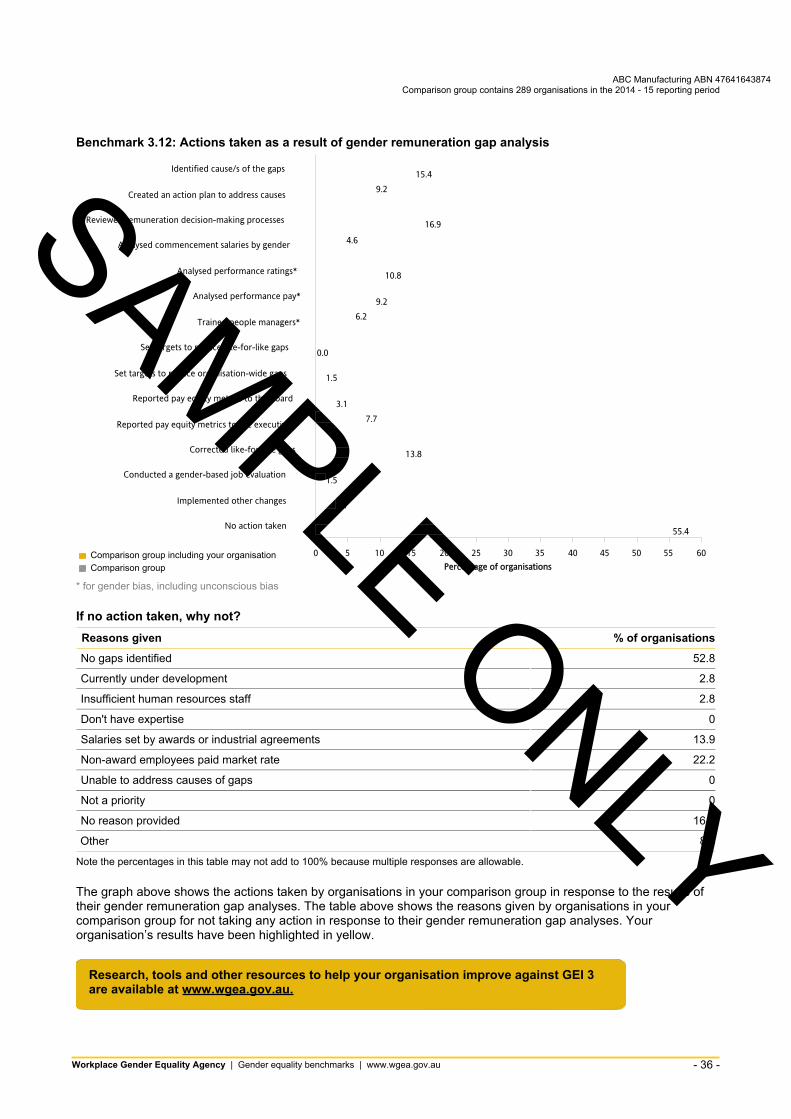
Benchmark 3.12: Actions taken as a result of gender remuneration gap analysis
SAMPLE ONLY
55.4
3.1
1.5
13.8
3.1
1.5
0.0
9.2
10.8
16.9
15.4
7.7
6.2
4.6
9.2
0 5 10 15 20 25 30 35 40 45 50 55 60Percentage of organisations
No action taken
Implemented other changes
Conducted a gender-based job evaluation
Corrected like-for-like gaps
Reported pay equity metrics to the executive
Reported pay equity metrics to the board
Set targets to reduce organisation-wide gaps
Set targets to reduce like-for-like gaps
Trained people managers*
Analysed performance pay*
Analysed performance ratings*
Analysed commencement salaries by gender
Reviewed remuneration decision-making processes
Created an action plan to address causes
Identified cause/s of the gaps
Comparison group including your organisationComparison group
* for gender bias, including unconscious bias
If no action taken, why not? Reasons given % of organisations
No gaps identified 52.8
Currently under development 2.8
Insufficient human resources staff 2.8
Don't have expertise 0
Salaries set by awards or industrial agreements 13.9
Non-award employees paid market rate 22.2
Unable to address causes of gaps 0
Not a priority 0
No reason provided 16.7
Other 8.3
Note the percentages in this table may not add to 100% because multiple responses are allowable.
The graph above shows the actions taken by organisations in your comparison group in response to the results of their gender remuneration gap analyses. The table above shows the reasons given by organisations in your comparison group for not taking any action in response to their gender remuneration gap analyses. Your organisation’s results have been highlighted in yellow.
Research, tools and other resources to help your organisation improve against GEI 3are available at www.wgea.gov.au.
Workplace Gender Equality Agency | Gender equality benchmarks | www.wgea.gov.au - 36
SAMPLE ONLY
ABC Manufacturing ABN 47641643874 Comparison group contains 289 organisations in the 2014 - 15 reporting period
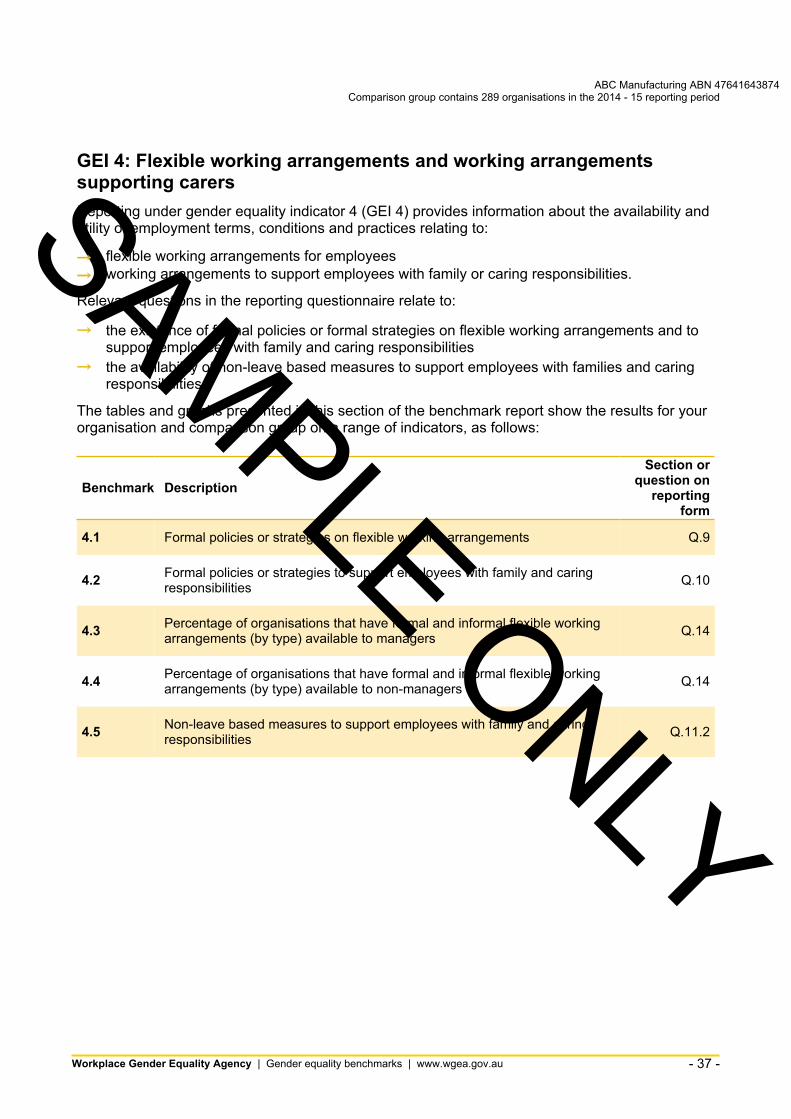
GEI 4: Flexible working arrangements and working arrangementssupporting carers Reporting under gender equality indicator 4 (GEI 4) provides information about the availability and utility of employment terms, conditions and practices relating to:
→ flexible working arrangements for employees → working arrangements to support employees with family or caring responsibilities.
Relevant questions in the reporting questionnaire relate to:
→ the existence of formal policies or formal strategies on flexible working arrangements and to support employees with family and caring responsibilities
→ the availability of non-leave based measures to support employees with families and caring responsibilities.
The tables and graphs presented in this section of the benchmark report show the results for your organisation and comparison group on a range of indicators, as follows:
Section or question onBenchmark Description reporting
form
4.1 Formal policies or strategies on flexible working arrangements Q.9
Formal policies or strategies to support employees with family and caring4.2 Q.10responsibilities
Percentage of organisations that have formal and informal flexible working4.3 Q.14arrangements (by type) available to managers
Percentage of organisations that have formal and informal flexible working4.4 Q.14arrangements (by type) available to non-managers
Non-leave based measures to support employees with family and caring4.5 Q.11.2responsibilities
Workplace Gender Equality Agency | Gender equality benchmarks | www.wgea.gov.au - 37
ABC Manufacturing ABN 47641643874 Comparison group contains 289 organisations in the 2014 - 15 reporting period
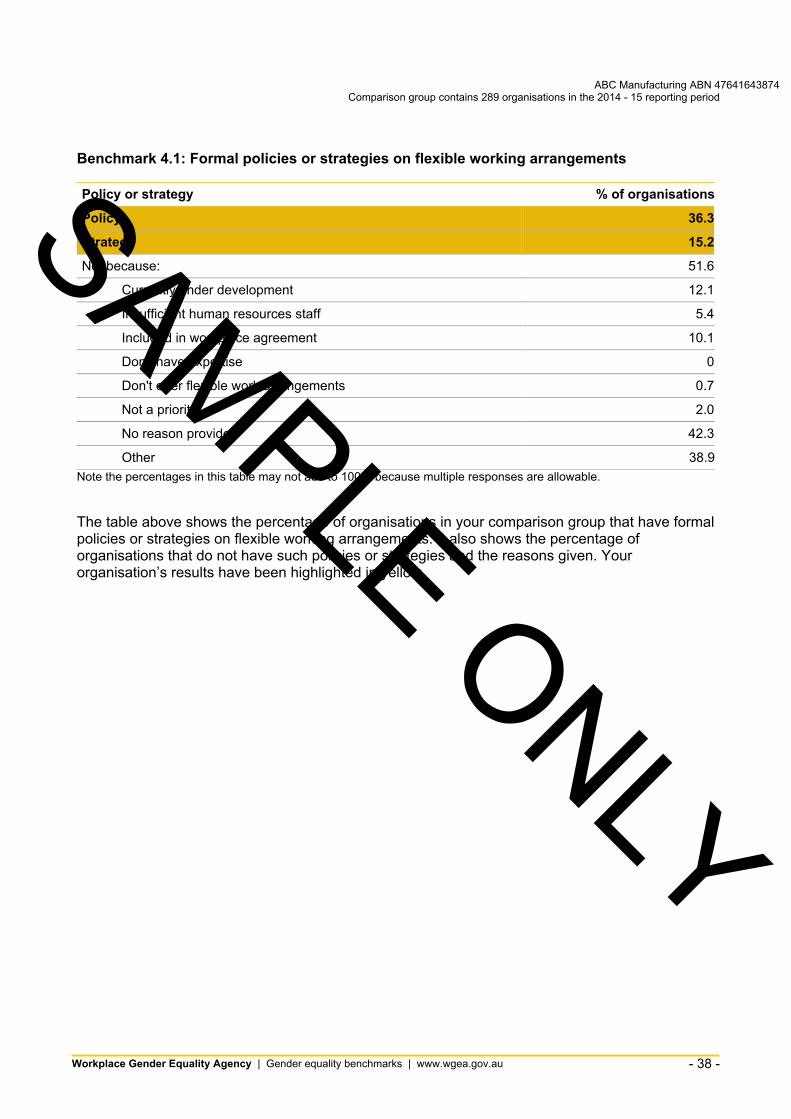
Benchmark 4.1: Formal policies or strategies on flexible working arrangements
Policy or strategy % of organisations
Policy 36.3
Strategy 15.2
No, because: 51.6
Currently under development 12.1
Insufficient human resources staff 5.4
Included in workplace agreement 10.1
Don't have expertise 0
Don't offer flexible work arrangements 0.7
Not a priority 2.0
No reason provided 42.3
Other 38.9
SAMPLE ONLY
Note the percentages in this table may not add to 100% because multiple responses are allowable.
The table above shows the percentage of organisations in your comparison group that have formal policies or strategies on flexible working arrangements. It also shows the percentage of organisations that do not have such policies or strategies and the reasons given. Your organisation’s results have been highlighted in yellow.
Workplace Gender Equality Agency | Gender equality benchmarks | www.wgea.gov.au - 38
SAMPLE ONLY
ABC Manufacturing ABN 47641643874 Comparison group contains 289 organisations in the 2014 - 15 reporting period
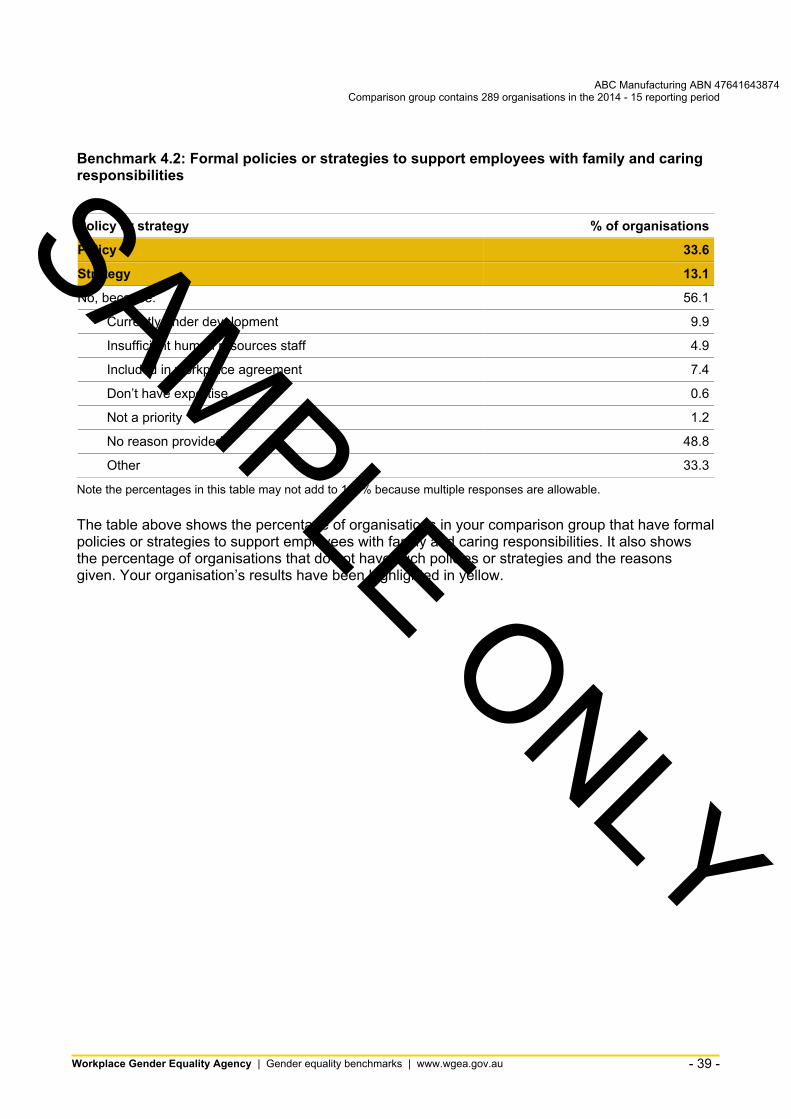
Benchmark 4.2: Formal policies or strategies to support employees with family and caring responsibilities
Policy or strategy % of organisations
Policy 33.6
Strategy 13.1
No, because: 56.1
Currently under development 9.9
Insufficient human resources staff 4.9
Included in workplace agreement 7.4
Don’t have expertise 0.6
Not a priority 1.2
No reason provided 48.8
Other 33.3
Note the percentages in this table may not add to 100% because multiple responses are allowable.
The table above shows the percentage of organisations in your comparison group that have formal policies or strategies to support employees with family and caring responsibilities. It also shows the percentage of organisations that do not have such policies or strategies and the reasons given. Your organisation’s results have been highlighted in yellow.
Workplace Gender Equality Agency | Gender equality benchmarks | www.wgea.gov.au - 39
ABC Manufacturing ABN 47641643874 Comparison group contains 289 organisations in the 2014 - 15 reporting period
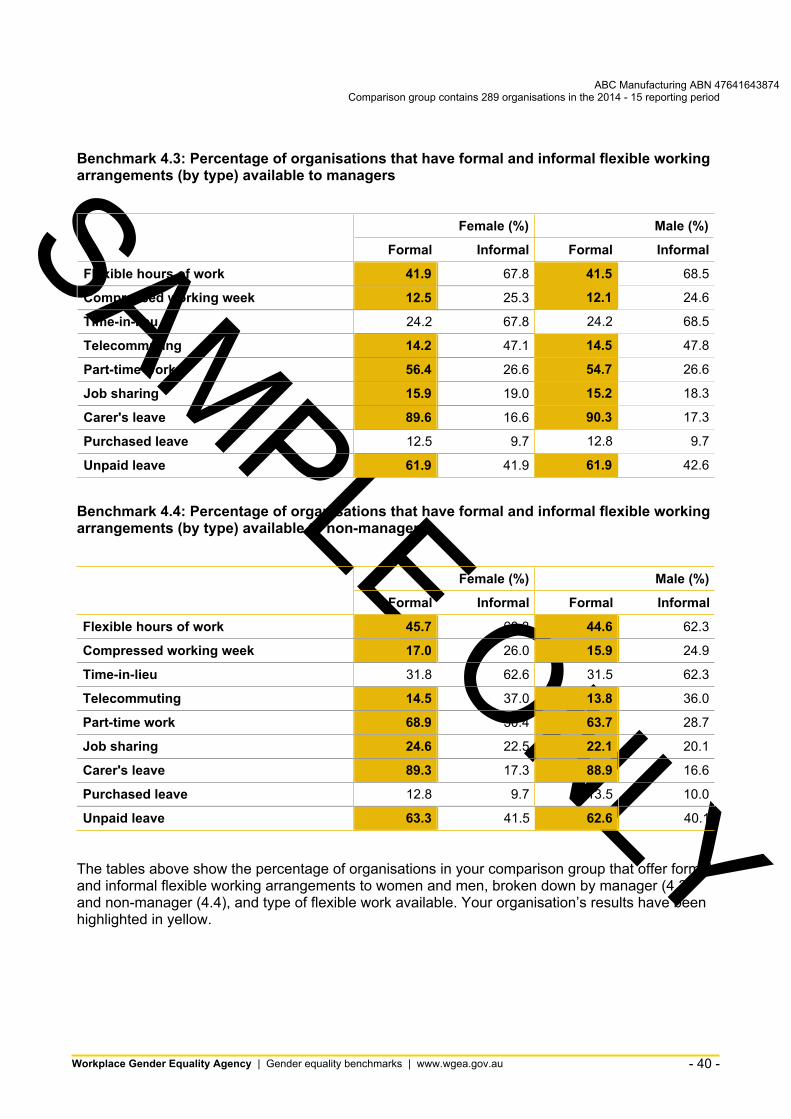
Benchmark 4.3: Percentage of organisations that have formal and informal flexible working arrangements (by type) available to managers SAMPLE ONLY
Female (%) Male (%)
Formal Informal Formal Informal
Flexible hours of work 41.9 67.8 41.5 68.5
Compressed working week 12.5 25.3 12.1 24.6
Time-in-lieu 24.2 67.8 24.2 68.5
Telecommuting 14.2 47.1 14.5 47.8
Part-time work 56.4 26.6 54.7 26.6
Job sharing 15.9 19.0 15.2 18.3
Carer's leave 89.6 16.6 90.3 17.3
Purchased leave 12.5 9.7 12.8 9.7
Unpaid leave 61.9 41.9 61.9 42.6
Benchmark 4.4: Percentage of organisations that have formal and informal flexible working arrangements (by type) available to non-managers
Female (%) Male (%)
Formal Informal Formal Informal
Flexible hours of work 45.7 63.3 44.6 62.3
Compressed working week 17.0 26.0 15.9 24.9
Time-in-lieu 31.8 62.6 31.5 62.3
Telecommuting 14.5 37.0 13.8 36.0
Part-time work 68.9 30.4 63.7 28.7
Job sharing 24.6 22.5 22.1 20.1
Carer's leave 89.3 17.3 88.9 16.6
Purchased leave 12.8 9.7 13.5 10.0
Unpaid leave 63.3 41.5 62.6 40.1
The tables above show the percentage of organisations in your comparison group that offer formal and informal flexible working arrangements to women and men, broken down by manager (4.3) and non-manager (4.4), and type of flexible work available. Your organisation’s results have been highlighted in yellow.
Workplace Gender Equality Agency | Gender equality benchmarks | www.wgea.gov.au - 40
ABC Manufacturing ABN 47641643874 Comparison group contains 289 organisations in the 2014 - 15 reporting period
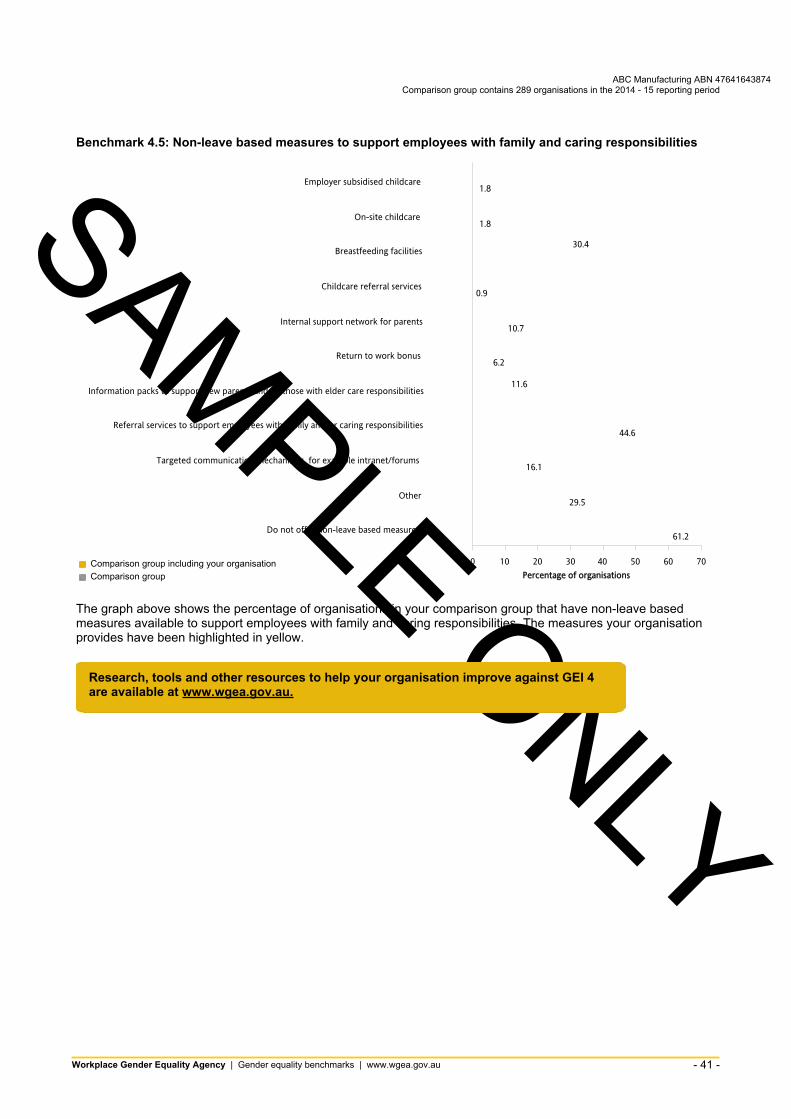
Benchmark 4.5: Non-leave based measures to support employees with family and caring responsibilities
61.2
29.5
16.1
44.6
6.2
10.7
0.9
1.8
1.8
11.6
30.4
0 10 20 30 40 50 60 70Percentage of organisations
Do not offer non-leave based measures
Other
Targeted communication mechanisms, for example intranet/forums
Referral services to support employees with family and/or caring responsibilities
Information packs to support new parents and/or those with elder care responsibilities
Return to work bonus
Internal support network for parents
Childcare referral services
Breastfeeding facilities
On-site childcare
Employer subsidised childcare
Comparison group including your organisationComparison group
SAMPLE ONLY
The graph above shows the percentage of organisations in your comparison group that have non-leave based measures available to support employees with family and caring responsibilities. The measures your organisation provides have been highlighted in yellow.
Research, tools and other resources to help your organisation improve against GEI 4are available at www.wgea.gov.au.
Workplace Gender Equality Agency | Gender equality benchmarks | www.wgea.gov.au - 41
SAMPLE ONLY
ABC Manufacturing ABN 47641643874 Comparison group contains 289 organisations in the 2014 - 15 reporting period
GEI 5: Consultation on gender equality Reporting under gender equality indicator 5 (GEI 5) provides information about consultation that occurs between employers and employees on issues concerning gender equality in the workplace. Examples of consultation include employee surveys and focus groups.
Relevant questions in the reporting questionnaire relate to:
→ whether employee consultation around gender equality issues in the workplace has taken place
→ the type of consultation that has taken place → categories of employees consulted
The tables and graphs presented in this section of the benchmark report show the results for your organisation and comparison group on a range of indicators, as follows:
Section or question onBenchmark Description reporting
form
5.1 Consultation with employees on gender equality in the workplace Q.15
5.2 Mode of employee consultation Q.15.1
5.3 Categories of employees consulted Q.15.2
Workplace Gender Equality Agency | Gender equality benchmarks | www.wgea.gov.au - 42
SAMPLE ONLY
ABC Manufacturing ABN 47641643874 Comparison group contains 289 organisations in the 2014 - 15 reporting period
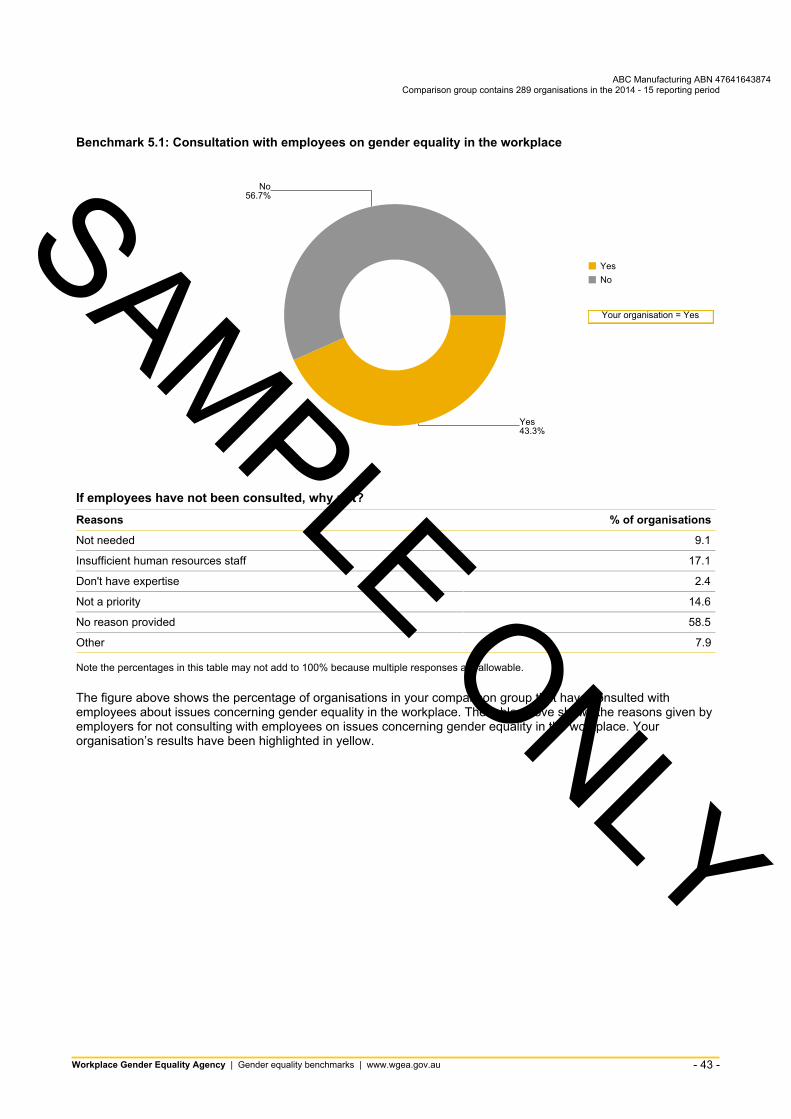
Benchmark 5.1: Consultation with employees on gender equality in the workplace
43.3%Yes
56.7%No
YesNo
Your organisation = Yes
If employees have not been consulted, why not? Reasons % of organisations
Not needed 9.1
Insufficient human resources staff 17.1
Don't have expertise 2.4
Not a priority 14.6
No reason provided 58.5
Other 7.9
Note the percentages in this table may not add to 100% because multiple responses are allowable.
The figure above shows the percentage of organisations in your comparison group that have consulted with employees about issues concerning gender equality in the workplace. The table above shows the reasons given by employers for not consulting with employees on issues concerning gender equality in the workplace. Your organisation’s results have been highlighted in yellow.
Workplace Gender Equality Agency | Gender equality benchmarks | www.wgea.gov.au - 43
ABC Manufacturing ABN 47641643874 Comparison group contains 289 organisations in the 2014 - 15 reporting period
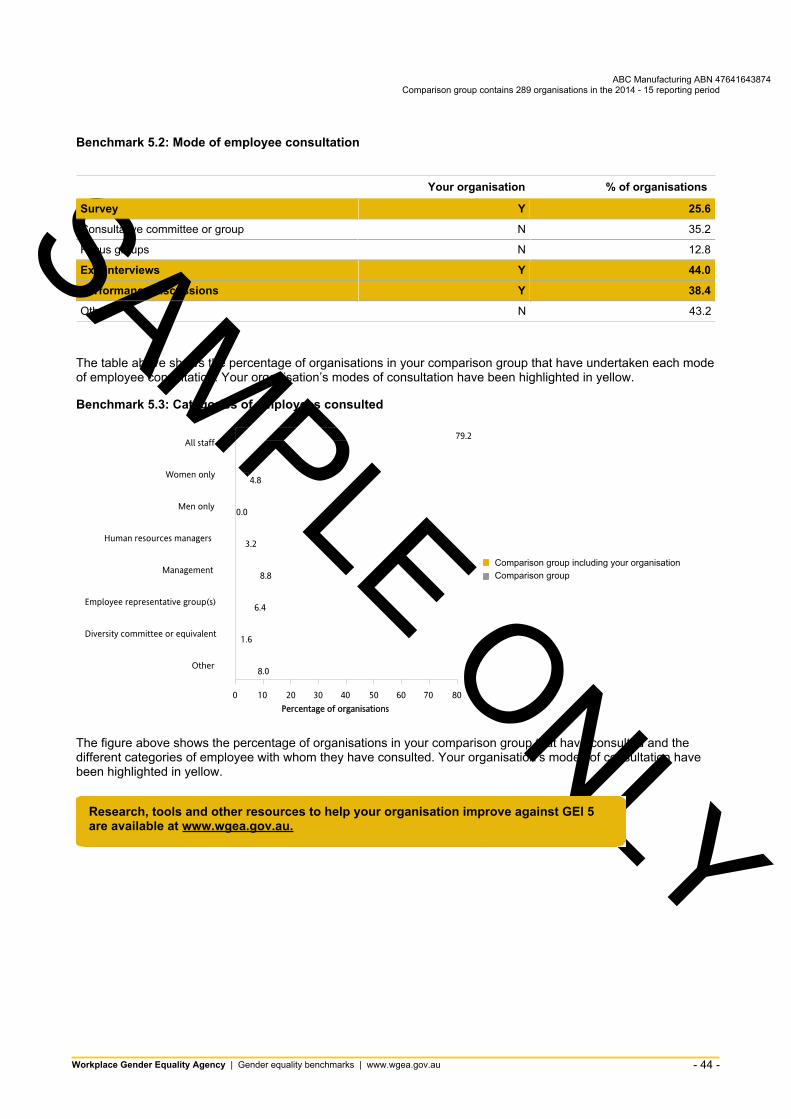
Benchmark 5.2: Mode of employee consultation
SAMPLE ONLY
Your organisation
25.6YSurvey
N
N
Y
Y
N
Consultative committee or group
Focus groups
Exit interviews
Performance discussions
Other
% of organisations
35.2
12.8
44.0
38.4
43.2
The table above shows the percentage of organisations in your comparison group that have undertaken each mode of employee consultation. Your organisation’s modes of consultation have been highlighted in yellow.
Benchmark 5.3: Categories of employees consulted
8.0
1.6
6.4
8.8
3.2
0.0
4.8
79.2
0 10 20 30 40 50 60 70 80Percentage of organisations
Other
Diversity committee or equivalent
Employee representative group(s)
Management
Human resources managers
Men only
Women only
All staff
Comparison group including your organisationComparison group
The figure above shows the percentage of organisations in your comparison group that have consulted and the different categories of employee with whom they have consulted. Your organisation’s modes of consultation have been highlighted in yellow.
are available at www.wgea.gov.au.Research, tools and other resources to help your organisation improve against GEI 5
Workplace Gender Equality Agency | Gender equality benchmarks | www.wgea.gov.au - 44
SAMPLE ONLY
ABC Manufacturing ABN 47641643874 Comparison group contains 289 organisations in the 2014 - 15 reporting period
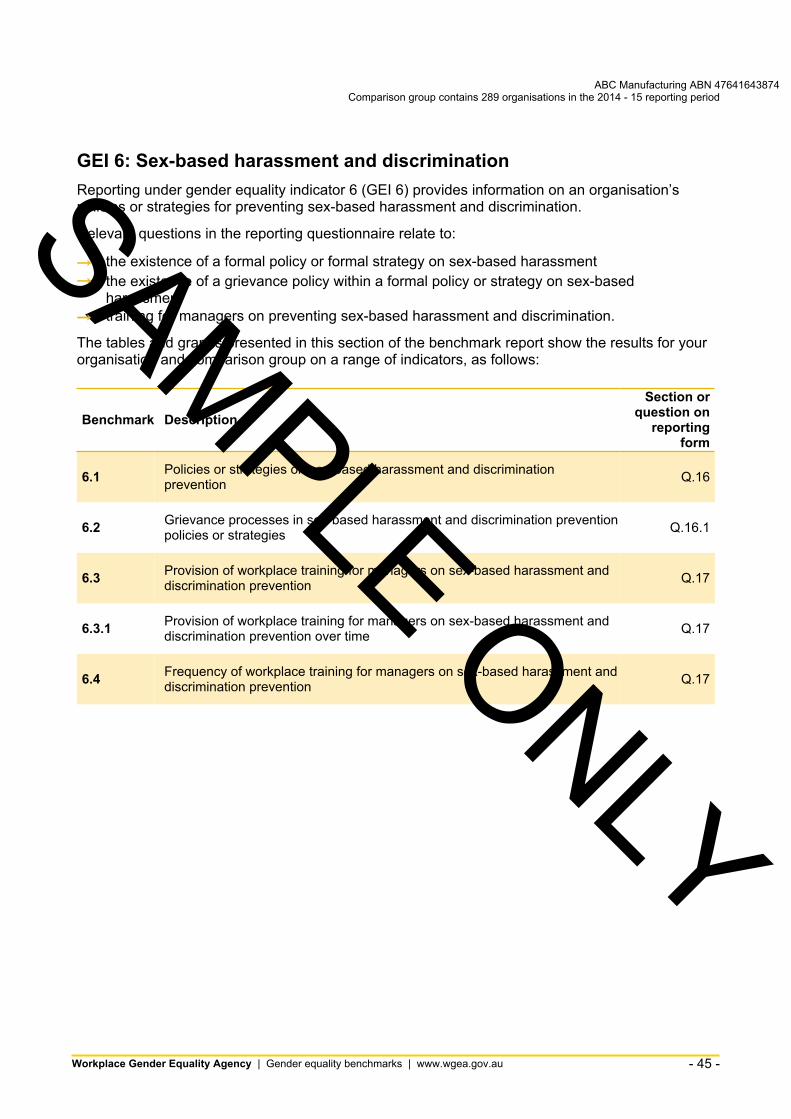
GEI 6: Sex-based harassment and discrimination Reporting under gender equality indicator 6 (GEI 6) provides information on an organisation’s policies or strategies for preventing sex-based harassment and discrimination.
Relevant questions in the reporting questionnaire relate to:
→ the existence of a formal policy or formal strategy on sex-based harassment → the existence of a grievance policy within a formal policy or strategy on sex-based
harassment → training for managers on preventing sex-based harassment and discrimination.
The tables and graphs presented in this section of the benchmark report show the results for your organisation and comparison group on a range of indicators, as follows:
Section or question onBenchmark Description reporting
form
Policies or strategies on sex-based harassment and discrimination6.1 Q.16prevention
Grievance processes in sex-based harassment and discrimination prevention6.2 Q.16.1policies or strategies
Provision of workplace training for managers on sex-based harassment and6.3 Q.17discrimination prevention
Provision of workplace training for managers on sex-based harassment and6.3.1 Q.17discrimination prevention over time
Frequency of workplace training for managers on sex-based harassment and6.4 Q.17discrimination prevention
Workplace Gender Equality Agency | Gender equality benchmarks | www.wgea.gov.au - 45
ABC Manufacturing ABN 47641643874 Comparison group contains 289 organisations in the 2014 - 15 reporting period
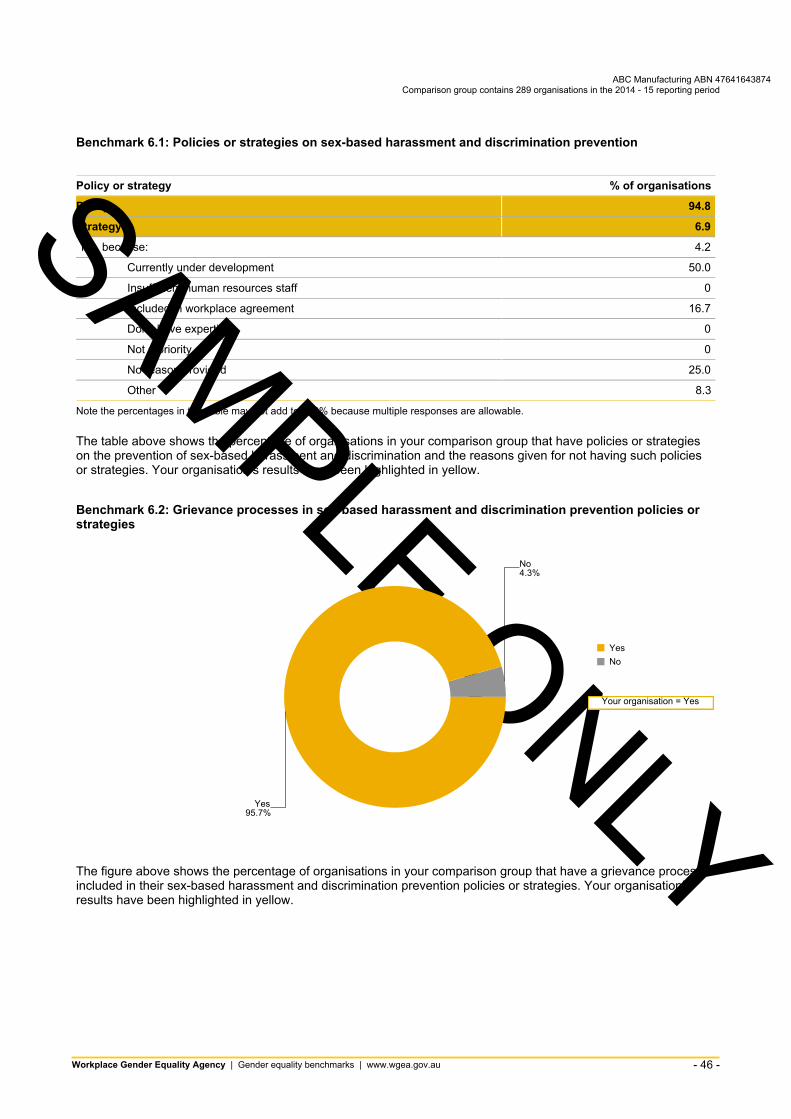
Benchmark 6.1: Policies or strategies on sex-based harassment and discrimination prevention
Policy or strategy % of organisations
Policy 94.8
Strategy 6.9
No, because: 4.2
Currently under development 50.0
Insufficient human resources staff 0
Included in workplace agreement 16.7
Don’t have expertise 0
Not a priority 0
No reason provided 25.0
Other 8.3
SAMPLE ONLY
Note the percentages in this table may not add to 100% because multiple responses are allowable.
The table above shows the percentage of organisations in your comparison group that have policies or strategies on the prevention of sex-based harassment and discrimination and the reasons given for not having such policies or strategies. Your organisation’s results have been highlighted in yellow.
Benchmark 6.2: Grievance processes in sex-based harassment and discrimination prevention policies or strategies
4.3%No
95.7%Yes
YesNo
Your organisation = Yes
The figure above shows the percentage of organisations in your comparison group that have a grievance process included in their sex-based harassment and discrimination prevention policies or strategies. Your organisation’s results have been highlighted in yellow.
Workplace Gender Equality Agency | Gender equality benchmarks | www.wgea.gov.au - 46
prevention SAMPLE ONLY
ABC Manufacturing ABN 47641643874 Comparison group contains 289 organisations in the 2014 - 15 reporting period
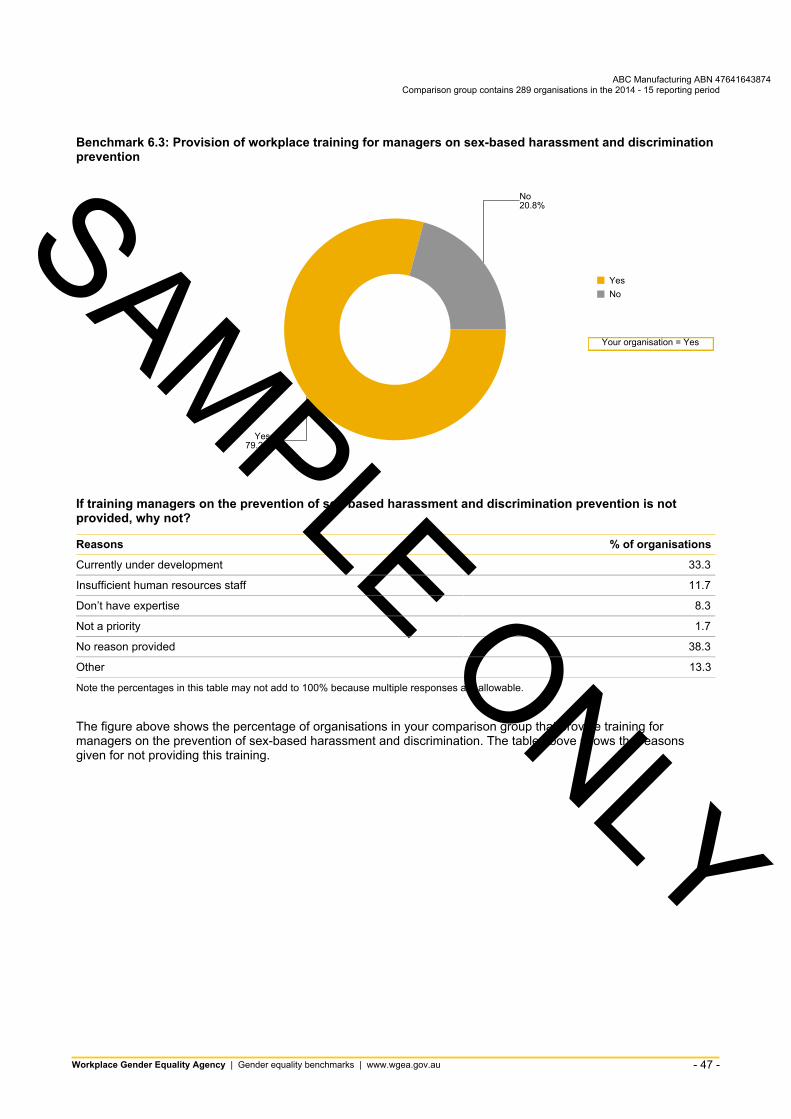
Benchmark 6.3: Provision of workplace training for managers on sex-based harassment and discrimination
20.8%No
79.2%Yes
YesNo
Your organisation = Yes
If training managers on the prevention of sex-based harassment and discrimination prevention is notprovided, why not?
Reasons % of organisations
33.3Currently under development
Insufficient human resources staff 11.7
Don’t have expertise 8.3
Not a priority 1.7
No reason provided 38.3
Other 13.3
Note the percentages in this table may not add to 100% because multiple responses are allowable.
The figure above shows the percentage of organisations in your comparison group that provide training for managers on the prevention of sex-based harassment and discrimination. The table above shows the reasons given for not providing this training.
Workplace Gender Equality Agency | Gender equality benchmarks | www.wgea.gov.au - 47
discrimination prevention over time SAMPLE ONLY
ABC Manufacturing ABN 47641643874 Comparison group contains 289 organisations in the 2014 - 15 reporting period
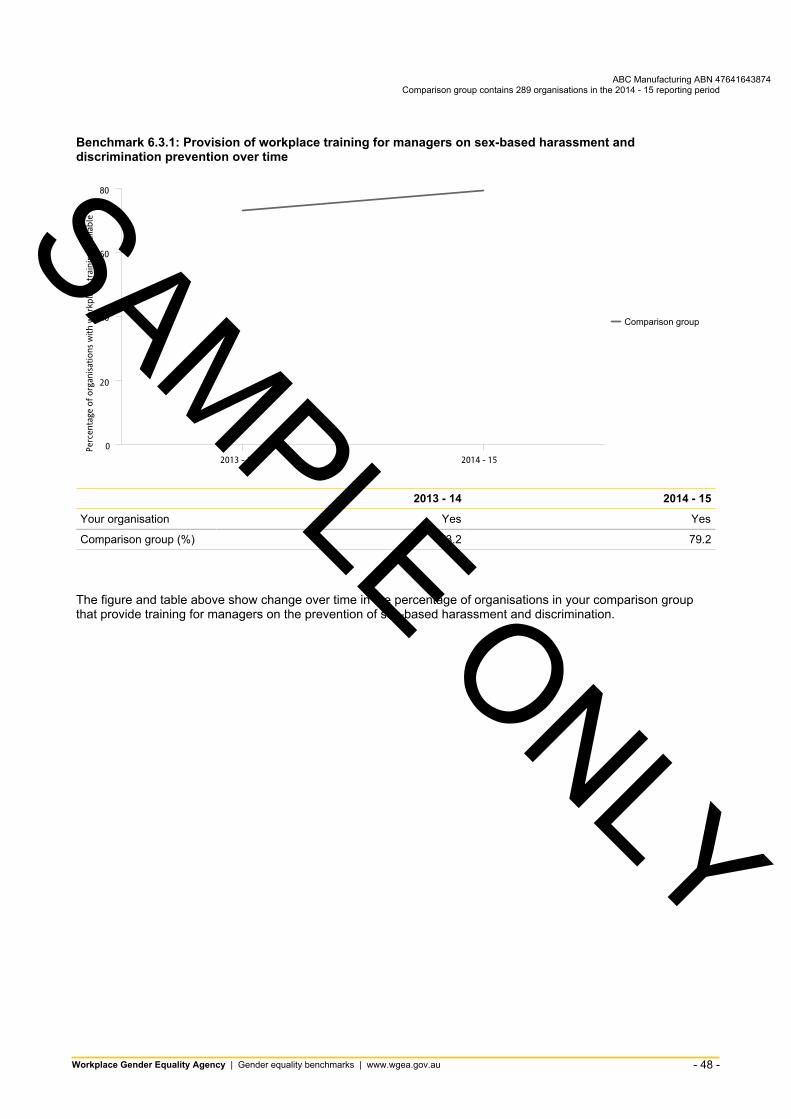
Benchmark 6.3.1: Provision of workplace training for managers on sex-based harassment and
0
20
40
60
80
Perc
enta
ge o
f org
anisa
tions
with
wor
kpla
ce tr
aini
ng a
vaila
ble
2013 - 14 2014 - 15
Comparison group
2013 - 14 2014 - 15
Your organisation Yes Yes
Comparison group (%) 73.2 79.2
The figure and table above show change over time in the percentage of organisations in your comparison group that provide training for managers on the prevention of sex-based harassment and discrimination.
Workplace Gender Equality Agency | Gender equality benchmarks | www.wgea.gov.au - 48
ABC Manufacturing ABN 47641643874 Comparison group contains 289 organisations in the 2014 - 15 reporting period
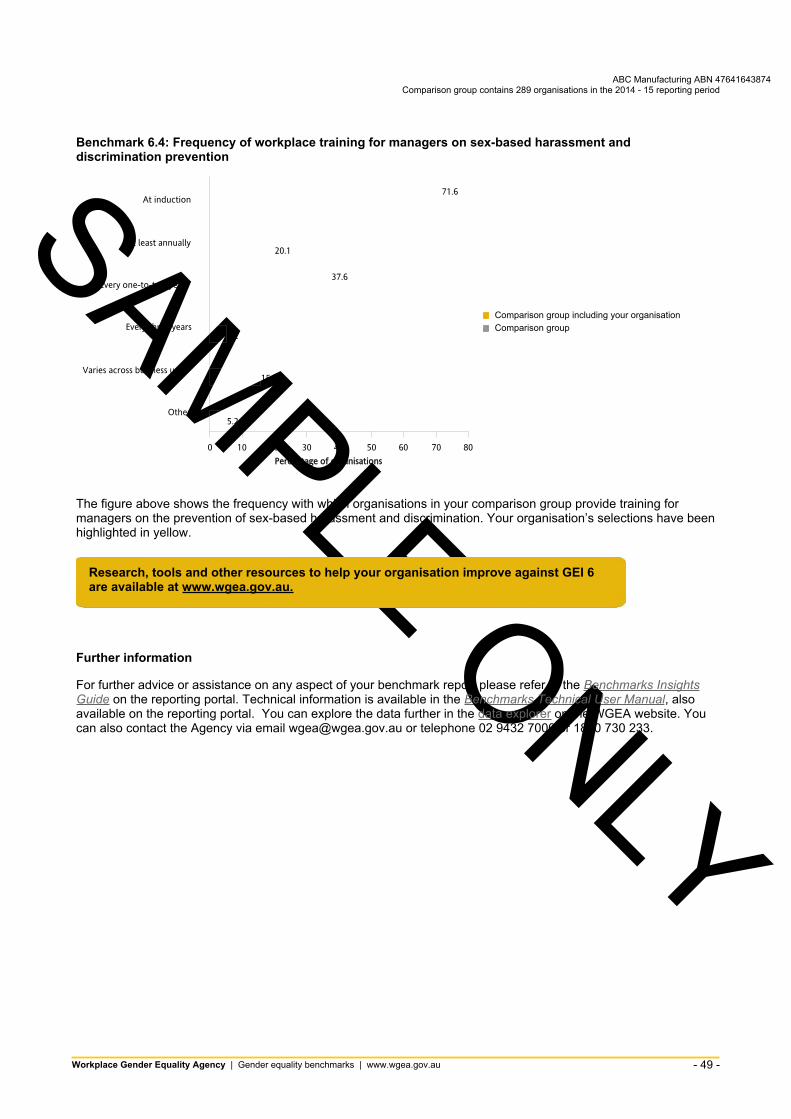
Benchmark 6.4: Frequency of workplace training for managers on sex-based harassment and discrimination prevention SAMPLE ONLY
5.2
15.7
5.2
20.1
37.6
71.6
0 10 20 30 40 50 60 70 80Percentage of organisations
Other
Varies across business units
Every three years
Every one-to-two years
At least annually
At induction
Comparison group including your organisationComparison group
The figure above shows the frequency with which organisations in your comparison group provide training for managers on the prevention of sex-based harassment and discrimination. Your organisation’s selections have been highlighted in yellow.
Research, tools and other resources to help your organisation improve against GEI 6are available at www.wgea.gov.au.
Further information
For further advice or assistance on any aspect of your benchmark report please refer to the Benchmarks Insights Guide on the reporting portal. Technical information is available in the Benchmarks Technical User Manual, also available on the reporting portal. You can explore the data further in the data explorer on the WGEA website. You can also contact the Agency via email [email protected] or telephone 02 9432 7000 or 1800 730 233.
Workplace Gender Equality Agency | Gender equality benchmarks | www.wgea.gov.au - 49