2014. 10. 23. - · PDF file1 2014. 10. 23. Korea Institute for Industrial Economics & Trade...
31
1 2014. 10. 23. Korea Institute for Industrial Economics & Trade Senior Research Fellow, Hang Koo Lee
Transcript of 2014. 10. 23. - · PDF file1 2014. 10. 23. Korea Institute for Industrial Economics & Trade...
1
2014. 10. 23.
Korea Institute for Industrial Economics & Trade
Senior Research Fellow, Hang Koo Lee
3

4
Trade & Investment Liberalization
Globalization of OEM and Parts Companies
The Beginning of the Era of Electric-powered Autonomous Vehicles

5
- OEMs and suppliers are jointly developing new parts, components and
materials.
- Universities have educated interdisciplinary students and retrained
existing workers.
- Extensive inter-industry relationships and creation of collaborative
ecosystem are important for creating new growth engines and employment.
5
Cars
IC
T
Smart(Intelligent)
car
CT
NT BT
ST
Designov
ation
Materials, Tire,
Painting
Interior,
Alternative Fuel
Fuel Cell RT
6 6
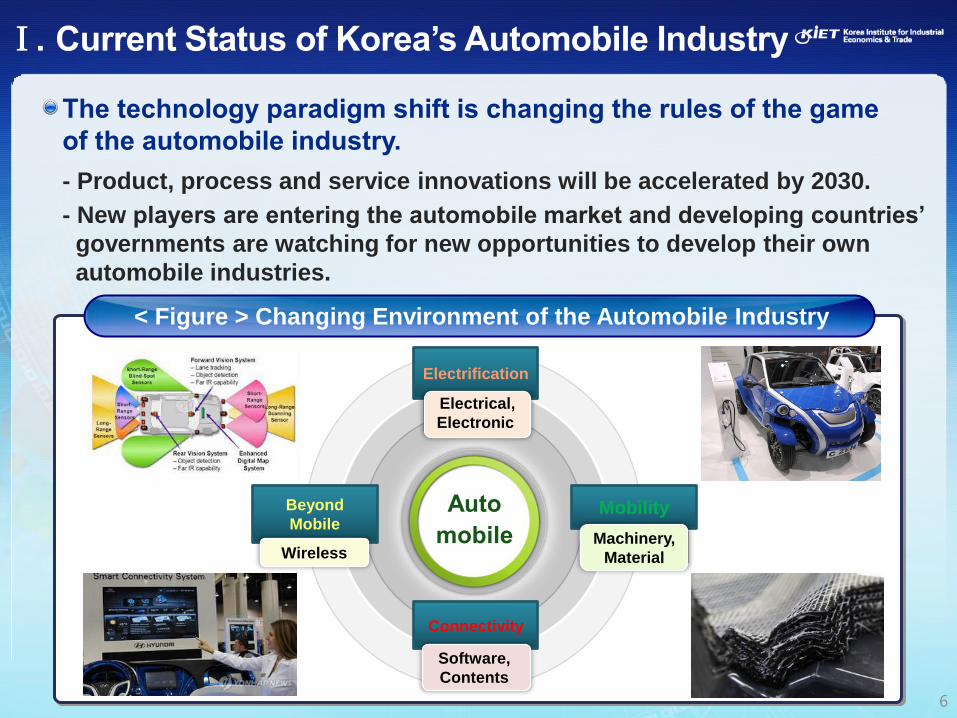
- Product, process and service innovations will be accelerated by 2030.
- New players are entering the automobile market and developing countries’
governments are watching for new opportunities to develop their own
automobile industries.
< Figure > Changing Environment of the Automobile Industry
Mobility
Machinery,
Material
Electrification
Electrical,
Electronic
Beyond
Mobile
Wireless
Connectivity
Software,
Contents

7
2008 2009 2010 2011 2012 2013 2014 1H
Domestic 1,155 1,394 1,465 1,475 1,411 1,383 713
Imported 62 61 91 105 131 157 112
Unit : thousand vehicle
Source : KAMA, KAIDA
Korea’s automobile sales decreased in 2012 and 2013 consecutively.
- Domestic brand market share decreased, but import brand increased.
* Foreign brands’ market share increased to 13.8% in the first half of 2014.
- European brands, especially German brands dominated the imported
vehicle market
* European brand market share : 53.1%(2008) ⇒ 81.3%(2014)
* German brand market share : 42.1%(2008) ⇒ 71.2%(2014)
* Japanese brand market share : 35.5%(2008) ⇒ 11.7%(2014)
< Table > Sales statistics of passenger cars
8
0
1 000
2 000
3 000
4 000
5 000
2000 2001 2002 2003 2004 2005 2006 2007 2008 2009 2010 2011 2012 2013 2014
DD Export DP OP
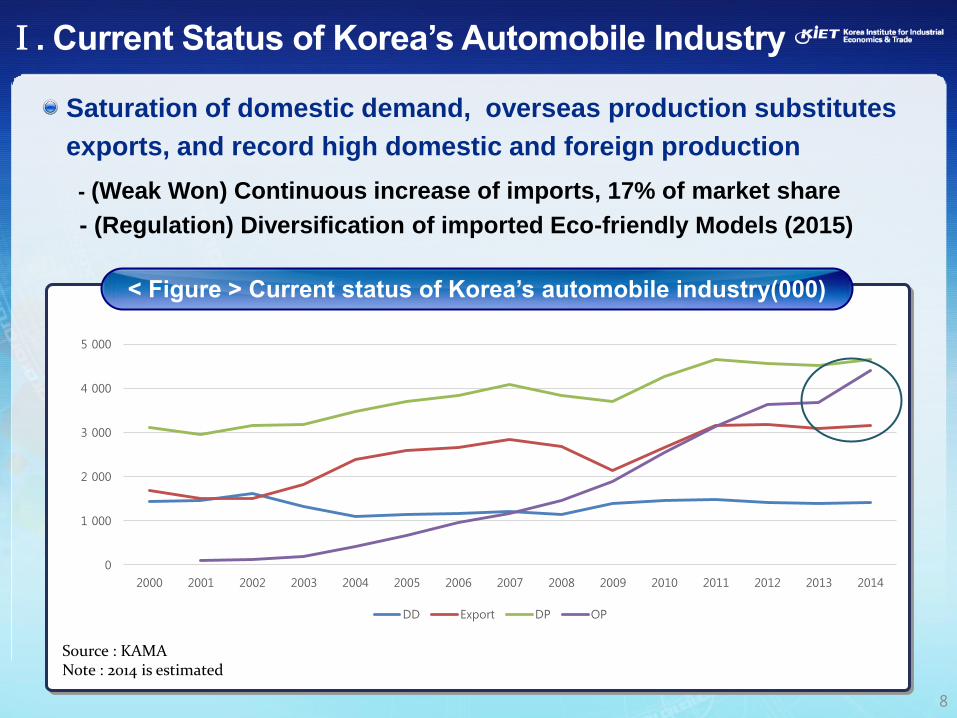
< Figure > Current status of Korea’s automobile industry(000)
Source : KAMA Note : 2014 is estimated
Saturation of domestic demand, overseas production substitutes
exports, and record high domestic and foreign production
- (Weak Won) Continuous increase of imports, 17% of market share
- (Regulation) Diversification of imported Eco-friendly Models (2015)

9
< Figure > Current status of Imported Cars
0
50 000
100 000
150 000
200 000
250 000
2003 2004 2005 2006 2007 2008 2009 2010 2011 2012 2013 2014
Personal Business
< Figure > Performance of Foreign OEM (000)
Source : KAMA
0
500
1 000
1 500
1995 1996 1997 1998 1999 2000 2001 2002 2003 2004 2005 2006 2007 2008 2009 2010 2011 2012 2013
수출
내수 Export
Domestic sales

10
Bipolarization of domestic demand
- Increase of imported vehicles
* Younger generation’s demand for
low-price, and fuel-efficient small models
- Increasing demand of domestically
produced large and mini cars
- Overall increasing demand of SUV
and MPV
< Figure > Trend of commercial truck sales
0
200 000
400 000
600 000
800 000
1 000 000
1 200 000
1991 1992 1993 1994 1995 1996 1997 1998 1999 2000 2001 2002 2003 2004 2005 2006 2007 2008 2009 2010 2011 2012 2013
Mini Small Mid Large
0
50 000
100 000
150 000
200 000
250 000
300 000
1 2 3 4 5 6 7 8 9 10 11 12 13 14 15 16 17 18 19 20 21 22 23
Mini Small Mid Large Other
< Figure > Trend of Sedan sales

11
2008 2013 2014 1H
Diesel(Domestic) 144,941 265,997 145,328
Diesel(Imported) 10,094 97,185 64,427
Alternative Fuel 155,646 179,141 87,434
Source : KAMA Note : Alternative fuel includes LPG, Hybrid and Electric Vehicles
Clean diesel demand is increasing in the Green car market.
- Clean Diesel, especially imported clean diesel, dominates in the green car
(environment-friendly car) market.
- The share of diesel in imported vehicles increased from 16.4% in 2007 to
68.2% in 2014.
- SUVs and MPVs are leading sales of domestically produced diesel.
- Sedans are popular but SUV demand is increasing in the imported diesel
market.
Imported hybrid car sales are sluggish.
< Table > Sales structure of diesel

12
☞ Imported diesel sales promote diversification of diesel models of
Korean auto makers.
- Hyundai will launch the Sonata diesel in 2016.
- Ssangyong is developing a diesel hybrid vehicle.
- Toyota is introducing various hybrid models to compete with
European diesel in the Korean market.
Fuel Type 2014 Share 2013 Share Change(a/b)
Diesel 64,427 68.3 44,601 59.9 44.5
Hybrid 3,335 3.5 3,002 4.0 11.1
Electric 33 0 0 -
Gasoline 26,468 28.1 26,884 36.1 -1.5
Total 94,263 100.0 74,487 100.0 26.5
Unit : number of vehicles, %
< Table > New Registration of Imported Cars by Fuel Type
13
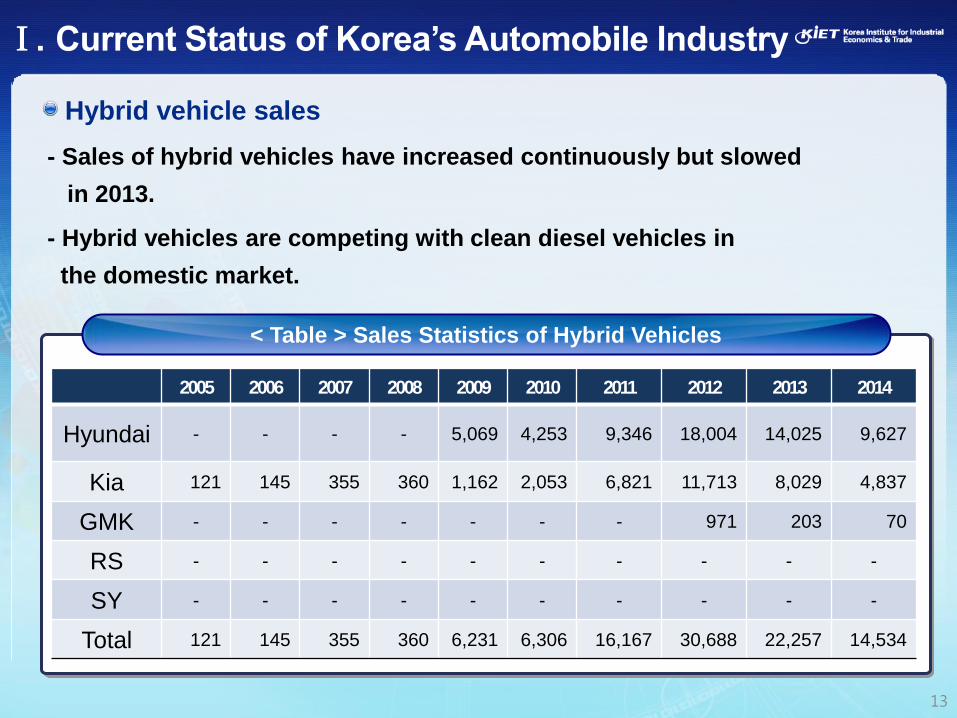
2005 2006 2007 2008 2009 2010 2011 2012 2013 2014
Hyundai - - - - 5,069 4,253 9,346 18,004 14,025 9,627
Kia 121 145 355 360 1,162 2,053 6,821 11,713 8,029 4,837
GMK - - - - - - - 971 203 70
RS - - - - - - - - - -
SY - - - - - - - - - -
Total 121 145 355 360 6,231 6,306 16,167 30,688 22,257 14,534
Hybrid vehicle sales
- Sales of hybrid vehicles have increased continuously but slowed
in 2013.
- Hybrid vehicles are competing with clean diesel vehicles in
the domestic market.
< Table > Sales Statistics of Hybrid Vehicles
14
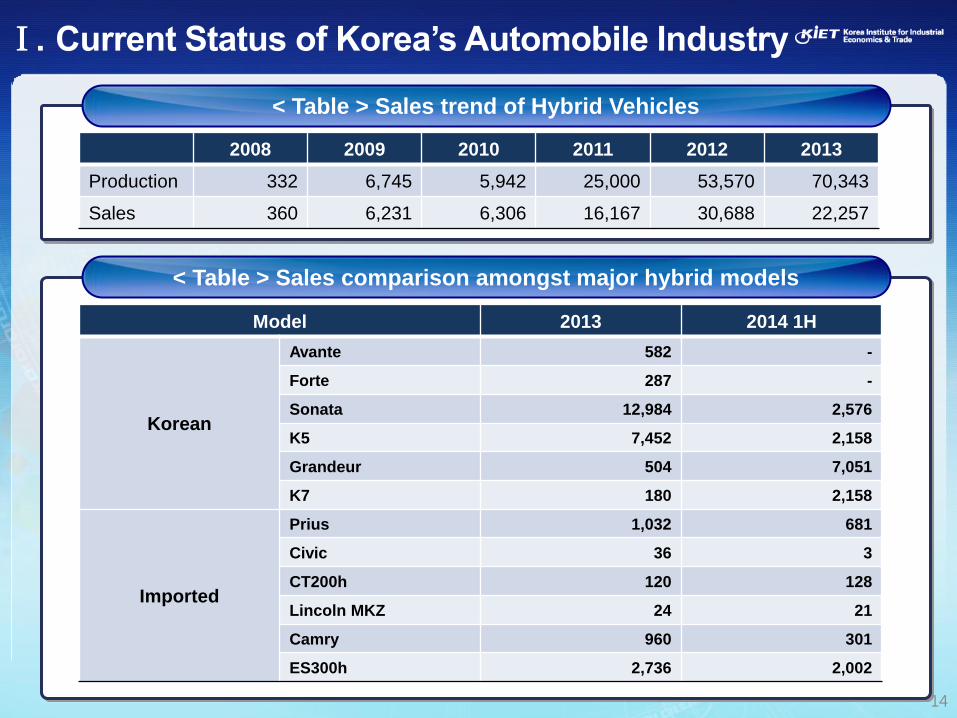
Model 2013 2014 1H
Korean
Avante 582 -
Forte 287 -
Sonata 12,984 2,576
K5 7,452 2,158
Grandeur 504 7,051
K7 180 2,158
Imported
Prius 1,032 681
Civic 36 3
CT200h 120 128
Lincoln MKZ 24 21
Camry 960 301
ES300h 2,736 2,002
2008 2009 2010 2011 2012 2013
Production 332 6,745 5,942 25,000 53,570 70,343
Sales 360 6,231 6,306 16,167 30,688 22,257
< Table > Sales trend of Hybrid Vehicles
< Table > Sales comparison amongst major hybrid models

15
2005 2006 2007 2008 2009 2010 2011 2012 2013 2014
Hyundai - - - - 5,459 3,771 25,870 40,108 43,390 26,115
Kia 156 177 344 332 1,286 2,171 72,678 12,482 26,780 15,020
GMK - - - - - - - 980 173 78
RS - - - - - - - - - -
SY - - - - - - - - - -
Total 156 177 344 332 6,745 5,942 98,548 53,570 70,343 41,213
Hybrid vehicle production is increasing continuously.
- Hyundai dominated the hybrid market in Korea and increased exports.
- Korean consumers prefer large models of hybrid vehicles.
- Production of Hyundai and Kia in 2014:
* Kia produced almost 72,678 hybrid vehicles and exported 71,546 hybrid
vehicles in 2011. Recently, Kia produces hybrid models in the foreign market.
Source : KAMA ; Note : 1st half of 2014
< Table > Production statistics of hybrid vehicles

16
17
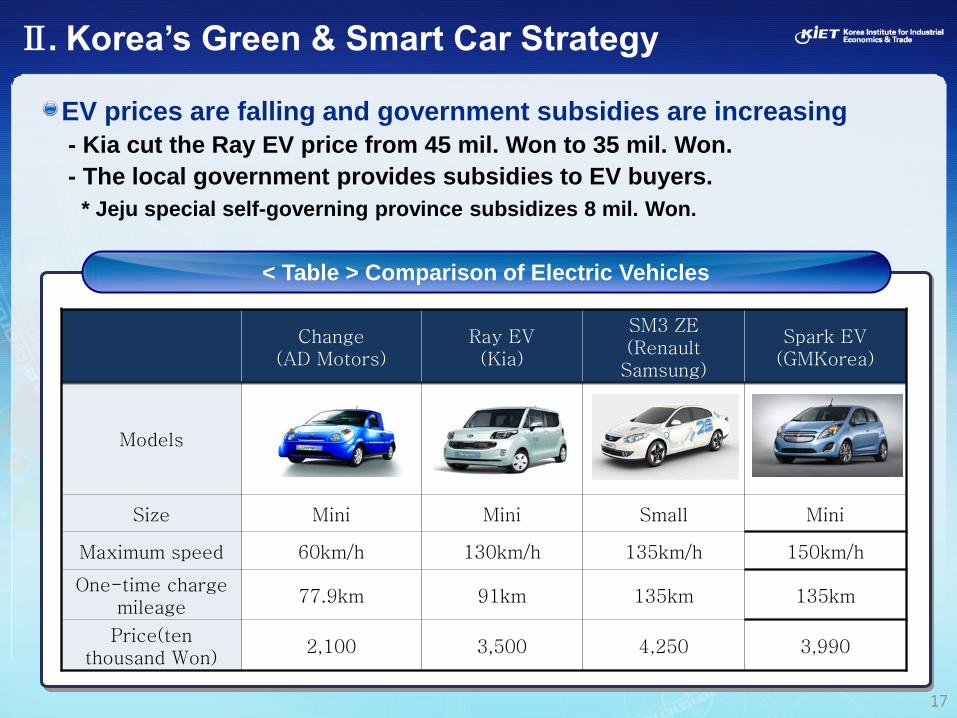
Change (AD Motors)
Ray EV (Kia)
SM3 ZE (Renault
Samsung)
Spark EV (GMKorea)
Models
Size Mini Mini Small Mini
Maximum speed 60km/h 130km/h 135km/h 150km/h
One-time charge mileage
77.9km 91km 135km 135km
Price(ten thousand Won)
2,100 3,500 4,250 3,990
EV prices are falling and government subsidies are increasing
- Kia cut the Ray EV price from 45 mil. Won to 35 mil. Won.
- The local government provides subsidies to EV buyers.
* Jeju special self-governing province subsidizes 8 mil. Won.
< Table > Comparison of Electric Vehicles

18
- The demand for SM3 ZE was three times greater than the supply in
Jeju in 2013.
* The actual purchasing price was 19.5 mil. Won before tax.
cf : average selling price of IC model of SM3 is 17.6 mil. Won.
The lack of government purchasing subsidy has hindered sales.
- OEMs also supply EVs in accordance with government subsidies.
Introducing new mid-size EV models will promote EV sales.
- The sales of imported electric vehicles began in 2014.
2011 2012 2013 2014 2015
Goal 1,000 2,500 13,200 60,000 86,700
Actual
Sales 372 714 715 434 -
< Table > Government goal for BEV sales

19
- Hyundai will launch the Sonata PHEV in 2015 and Avante EV/Hybrid in
2016.
- Kia will introduce the K3 EV in 2016.
Improvement in performance is expected in 2017.
* Electric Cars glide to 200-Mile Range (WSJ. Aug)
- LG Chem. Power Inc. is improving performance of the lithium-ion battery.
Soul SM3
Specification(mm) 4,140 4,750
Generator capacity(kW) 81.4 70.0
Battery capacity(kWh) 27.0 22.0
Mileage(km) 148 135
Charging time(Slow/Fast)(hrs/ms) 4/0.5 4/0.5
Max. Speed (km/h) 145 135
Price 4,250 4,250
< Table > Comparison between Soul and SM3 ZE

20
Construction of Charging Infrastructure
- Limited support for construction
* Fast and Slow charging Infrastructure until 2015
- Registered EV charging station : 177 at the end of June 2014
* 50 more stations in the second half of this year
- Installing Dual charger : DC ChaDemo and AC3
- Constructing public fast charging station : 600 by 2017
2011 2013 2015 2020
Electric
Charger
Public Slow 0.17 3.1 4.5 8
Fast 0.07 0.12 0.6 2.6
Private Slow - 2.5 11.4 137.8
Fast - 1.0 3.0 19.6
Total 0.24 7.1 20 168
unit : thousand
< Table > Charger deployment plan

21
PHEV
Time
FCEV Stack
Battery
Motor
EV Battery Motor
Engine
Battery Motor
HEV
Engine
Battery Motor
Power
Power
PHEV Engine
Battery Motor
Power
Power
Power
HEV Engine
Battery Motor
Power
ICE Engine Power
Degre
e o
f Ele
ctrici
ty
(Policy) Establishment of Long-term Green Car Technology Road-map ⇒
Entice Variety of Participants ⇒ Formation of Cross-industry Ecosystem
< Figure > Gradual shift from ICE vehicle to electric powered vehicles
22
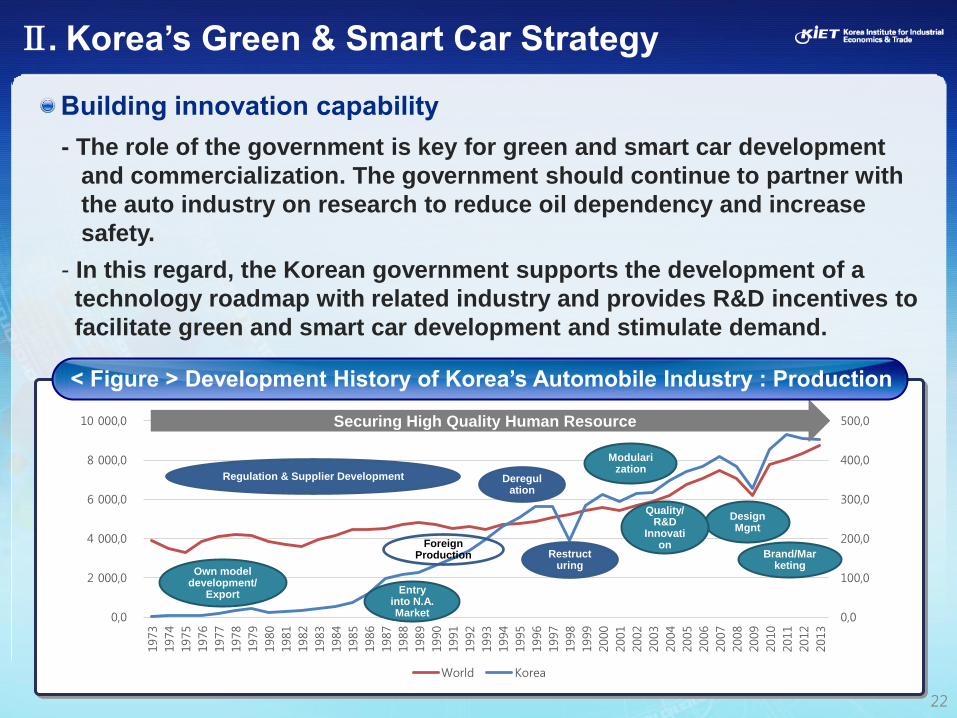
- The role of the government is key for green and smart car development
and commercialization. The government should continue to partner with
the auto industry on research to reduce oil dependency and increase
safety.
- In this regard, the Korean government supports the development of a
technology roadmap with related industry and provides R&D incentives to
facilitate green and smart car development and stimulate demand.
0,0
100,0
200,0
300,0
400,0
500,0
0,0
2 000,0
4 000,0
6 000,0
8 000,0
10 000,0
1973
1974
1975
1976
1977
1978
1979
1980
1981
1982
1983
1984
1985
1986
1987
1988
1989
1990
1991
1992
1993
1994
1995
1996
1997
1998
1999
2000
2001
2002
2003
2004
2005
2006
2007
2008
2009
2010
2011
2012
2013
World Korea
Regulation & Supplier Development Deregulation
Modularization
Design Mgnt
Quality/ R&D
Innovation
Restructuring
Brand/Marketing
Foreign Production
Entry into N.A. Market
Own model development/
Export
Securing High Quality Human Resource
< Figure > Development History of Korea’s Automobile Industry : Production

23
Internalization of Basic Technologies
Developing Tech-Driven Growth Engine
Balanced Growth of Ecosystem
Promote Collaboration
Commercialization of Smart Car Strategy
Action Plan
Vision
Processing

24
Level of
Collaboration
Level of Complexity
Hybrid BEV FCEV ICE
Smart Car
Green Car
Convergence of Science
Trivergence
Technology fusion

25
0
500
1 000
1 500
2 000
2 500
3 000
3 500
4 000
1995 1996 1997 1998 1999 2000 2001 2002 2003 2004 2005 2006 2007 2008 2009 2010 2011 2012 2013
DS Export OP
Growth factors of Hyundai(KIA) Motors Company
Acquire
KIA
Modulari
zation
TQM
R&D
Globalization
Design/
HRM
Brand
Localization
Source : Lee(2012)

26

27
Vehicle
Parts
Tools
Aluminum
Bolt/Nut Abrasive
Material
Glass
Leather
Ink
Casting
Pump Agriculture
Machinery
Valve
Fabricated
Metal Product
Bearing
Engine
Electronics
Other Steel
Product
Steel
Fabricated Metal
Product
Paint
Forging
Textile
Mold
Electric
Equipment
Rubber
Plastic
< Figure > Inter-industry linkage
Source : Input-output table of Bank of Korea
Expansion of Inter-industry Linkage

28
< Figure > R&D Investment of Korean Automobile Industry
0
1
2
3
4
5
0
10 000
20 000
30 000
40 000
50 000
60 000
1996 1997 1998 1999 2000 2001 2002 2003 2004 2005 2006 2007 2008 2009 2010 2011 2012
Amount Intensity

29
Building infrastructure for successful commercialization of
green and smart cars
- Test beds & proving grounds
- SME supporting center
The Korean government
established technology
supporting centers in universities
and auto parts clusters.
- EV and FCEV proving ground
- EV and FCEV town
The automobile industry has
contributed to regional
economic development.
FC Town
FCEV Proving ground
Tech. Supporting Center
< Figure > Infrastructure
30
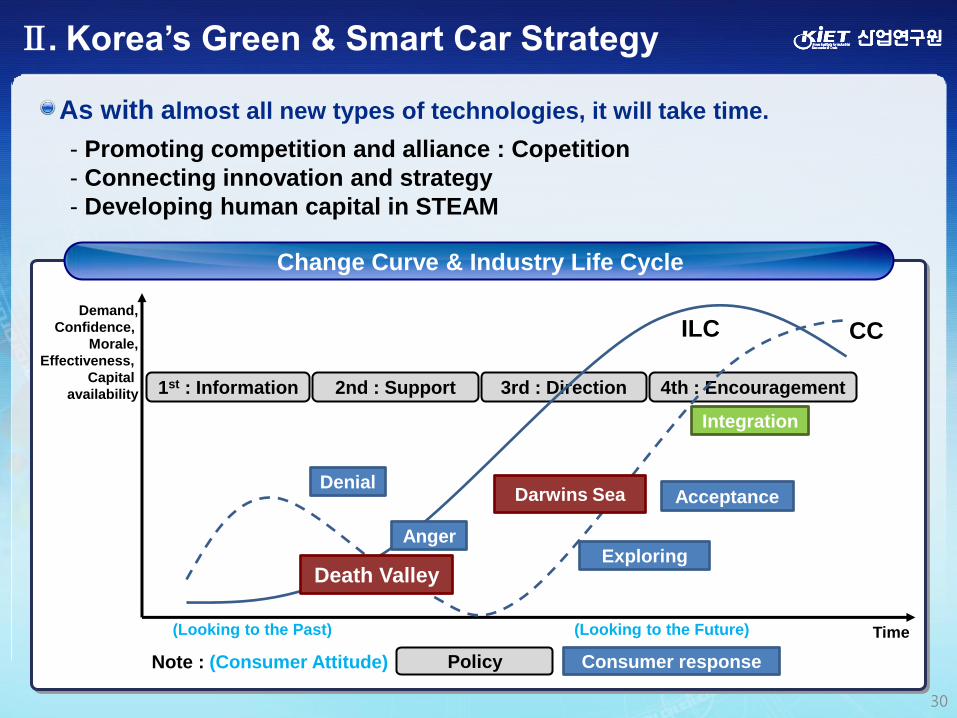
As with almost all new types of technologies, it will take time.
Time
Demand,
Confidence,
Morale,
Effectiveness,
Capital
availability
(Looking to the Past) (Looking to the Future)
CC
1st : Information 2nd : Support 3rd : Direction 4th : Encouragement
Policy
Denial
Exploring
Acceptance
Consumer response Note : (Consumer Attitude)
ILC
Integration
Anger
Darwins Sea
Death Valley
- Promoting competition and alliance : Copetition
- Connecting innovation and strategy
- Developing human capital in STEAM
Change Curve & Industry Life Cycle