
20130627 mtk sustaining its lead in a strong product cycle cs.pdf
21
DISCLOSURE APPENDIX CONTAINS ANALYST CERTIFICATIONS AND THE STATUS OF NON US ANALYSTS. US Disclosure: Credit Suisse does and seeks to do business with companies covered in its research reports. As a result, investors should be aware that the Firm may have a conflict of interest that could affect the objectivity of this report. Investors should consider this report as only a single factor in making their investment decision. CREDIT SUISSE SECURITIES RESEARCH & ANALYTICS BEYOND INFORMATION ® Client-Driven Solutions, Insights, and Access 28 June 2013 Asia Pacific/Taiwan Equity Research Semiconductor Devices MediaTek Inc. (2454.TW / 2454 TT) REINSTATEMENT Sustaining its lead in a strong product cycle ■ Leading a strong product cycle. We reinstate coverage on Mediatek with an OUTPERFORM rating and a NT$400 target price (previously Neutral, TP NT$300) based on (1) leverage to a strong cycle for China-built smartphones and tablets (doubling in 2013 to 495 mn/100 mn units, respectively), (2) market leadership sustaining on rapid innovation, (3) additional drivers from tablets now and LTE longer term, and (4) reset expectations into the high season. ■ Mediatek setting the pace. Mediatek is leading in low-cost smartphones with its turnkey support, high integration, accelerated product refresh cycle and technology migration. Ramp-up from 110 mn to 200 mn smartphone units sustains its share over 40%, with tablet share ramping to 15-20% in 2013 at 20 mn units. TD-SCDMA is a new driver with Mediatek’s share up from 10% to 25% since 2012 and to 30-40% in 2H13 with new chip launches. ■ Unit strength and margin stability drives operating leverage. Strong unit growth and slightly improving gross margins from faster innovation on technology migration, product development and cost reductions are driving strong operating margin expansion from 10% in 1Q12 when feature phones collapsed to 20% by 2H13. New dual/quad cores in 2H13 should improve the cost structure and drive 100 bp GM expansion vs. flattish expectation. ■ Expectations reset into the high season. Over the past two months, Mediatek has managed 2H13 expectations, citing likely below seasonal 3Q13 sales (implying +5-12% QoQ) due to a high 2Q base and lower-cost chips driving ~10% blended ASP reductions in 3Q/4Q. Catalysts now include a rebound from a June sales trough, 2H13 margin improvement, tablet/smartphone design wins and rotation from sectors under pressure. Our NT$400 TP sets Mediatek at 20x average 2013E/2014E EPS (16x ex- cash), in line with its post-crisis average. Share price performance 60 80 100 120 200 250 300 350 400 Feb-11 Jun-11 Oct-11 Feb-12 Jun-12 Oct-12 Price (LHS) Rebased Rel (RHS) The price relative chart measures performance against the TAIWAN SE WEIGHTED INDEX which closed at 7923.16 on 04/02/13 On 04/02/13 the spot exchange rate was NT$29.55/US$1 Performance over 1M 3M 12M Absolute (%) -9.6 -4.1 20.6 Relative (%) -5.1 -3.7 10.8 Financial and valuation metrics Year 12/12A 12/13E 12/14E 12/15E Revenue (NT$ mn) 99,263.2 119,661.7 132,081.1 145,215.3 EBITDA (NT$ mn) 16,129.8 25,273.3 29,404.8 34,090.4 EBIT (NT$ mn) 12,433.3 21,615.2 25,807.6 30,466.0 Net profit (NT$ mn) 15,162.1 24,472.1 28,688.3 33,084.4 EPS (CS adj.) (NT$) 12.76 18.26 21.41 24.69 Change from previous EPS (%) n.a. 0.1 0.1 5.5 Consensus EPS (NT$) n.a. 18.3 22.8 23.8 EPS growth (%) 2.0 43.1 17.2 15.3 P/E (x) 25.7 18.0 15.3 13.3 Dividend yield (%) 2.7 2.7 4.2 4.9 EV/EBITDA (x) 22.4 13.5 11.2 9.4 P/B (x) 2.2 2.2 2.1 2.0 ROE (%) 10.4 13.1 14.1 15.4 Net debt/equity (%) Net cash Net cash Net cash Net cash Source: Company data, Thomson Reuters, Credit Suisse estimates. Rating OUTPERFORM* Price (27 Jun 13, NT$) 328.00 Target price (NT$) 400.00¹ Upside/downside (%) 22.0 Mkt cap (NT$ mn) 442,606 (US$ 14,774) Enterprise value (NT$ mn) 342,045 Number of shares (mn) 1,349.41 Free float (%) 89.1 52-week price range 382.0 - 236.5 ADTO - 6M (US$ mn) 89.3 *Stock ratings are relative to the coverage universe in each analyst's or each team's respective sector. ¹Target price is for 12 months. Research Analysts Randy Abrams, CFA 886 2 2715 6366 [email protected] Yan Taw Boon 852 2101 7039 [email protected] [email protected] FIRST LAST 08/01/13 09:17:05 AM Allianz Global Investors Taiwan
-
Upload
leon-huang -
Category
Engineering
-
view
228 -
download
3
description
Mediatek Analysis report
Transcript of 20130627 mtk sustaining its lead in a strong product cycle cs.pdf

DISCLOSURE APPENDIX CONTAINS ANALYST CERTIFICATIONS AND THE STATUS OF NON US ANALYSTS. US Disclosure: Credit Suisse does and seeks to do business with companies covered in its research reports. As a result, investors should be aware that the Firm may have a conflict of interest that could affect the objectivity of this report. Investors should consider this report as only a single factor in making their investment decision.
CREDIT SUISSE SECURITIES RESEARCH & ANALYTICS BEYOND INFORMATION®
Client-Driven Solutions, Insights, and Access
28 June 2013
Asia Pacific/Taiwan
Equity Research
Semiconductor Devices
MediaTek Inc.
(2454.TW / 2454 TT) REINSTATEMENT
Sustaining its lead in a strong product cycle
■ Leading a strong product cycle. We reinstate coverage on Mediatek with an OUTPERFORM rating and a NT$400 target price (previously Neutral, TP NT$300) based on (1) leverage to a strong cycle for China-built smartphones and tablets (doubling in 2013 to 495 mn/100 mn units, respectively), (2) market leadership sustaining on rapid innovation, (3) additional drivers from tablets now and LTE longer term, and (4) reset
expectations into the high season.
■ Mediatek setting the pace. Mediatek is leading in low-cost smartphones with its turnkey support, high integration, accelerated product refresh cycle and technology migration. Ramp-up from 110 mn to 200 mn smartphone units sustains its share over 40%, with tablet share ramping to 15-20% in 2013 at 20 mn units. TD-SCDMA is a new driver with Mediatek’s share up
from 10% to 25% since 2012 and to 30-40% in 2H13 with new chip launches.
■ Unit strength and margin stability drives operating leverage. Strong unit growth and slightly improving gross margins from faster innovation on technology migration, product development and cost reductions are driving strong operating margin expansion from 10% in 1Q12 when feature phones collapsed to 20% by 2H13. New dual/quad cores in 2H13 should improve
the cost structure and drive 100 bp GM expansion vs. flattish expectation.
■ Expectations reset into the high season. Over the past two months, Mediatek has managed 2H13 expectations, citing likely below seasonal 3Q13 sales (implying +5-12% QoQ) due to a high 2Q base and lower-cost chips driving ~10% blended ASP reductions in 3Q/4Q. Catalysts now include a rebound from a June sales trough, 2H13 margin improvement, tablet/smartphone design wins and rotation from sectors under pressure. Our NT$400 TP sets Mediatek at 20x average 2013E/2014E EPS (16x ex-
cash), in line with its post-crisis average.
Share price performance
60
80
100
120
200
250
300
350
400
Feb-11 Jun-11 Oct-11 Feb-12 Jun-12 Oct-12
Price (LHS) Rebased Rel (RHS)
The price relative chart measures performance against the
TAIWAN SE WEIGHTED INDEX which closed at 7923.16 on
04/02/13
On 04/02/13 the spot exchange rate was NT$29.55/US$1
Performance over 1M 3M 12M Absolute (%) -9.6 -4.1 20.6 Relative (%) -5.1 -3.7 10.8
Financial and valuation metrics
Year 12/12A 12/13E 12/14E 12/15E Revenue (NT$ mn) 99,263.2 119,661.7 132,081.1 145,215.3 EBITDA (NT$ mn) 16,129.8 25,273.3 29,404.8 34,090.4 EBIT (NT$ mn) 12,433.3 21,615.2 25,807.6 30,466.0 Net profit (NT$ mn) 15,162.1 24,472.1 28,688.3 33,084.4 EPS (CS adj.) (NT$) 12.76 18.26 21.41 24.69 Change from previous EPS (%) n.a. 0.1 0.1 5.5 Consensus EPS (NT$) n.a. 18.3 22.8 23.8 EPS growth (%) 2.0 43.1 17.2 15.3 P/E (x) 25.7 18.0 15.3 13.3 Dividend yield (%) 2.7 2.7 4.2 4.9 EV/EBITDA (x) 22.4 13.5 11.2 9.4 P/B (x) 2.2 2.2 2.1 2.0 ROE (%) 10.4 13.1 14.1 15.4 Net debt/equity (%) Net cash Net cash Net cash Net cash
Source: Company data, Thomson Reuters, Credit Suisse estimates.
Rating OUTPERFORM* Price (27 Jun 13, NT$) 328.00 Target price (NT$) 400.00¹ Upside/downside (%) 22.0 Mkt cap (NT$ mn) 442,606 (US$ 14,774) Enterprise value (NT$ mn) 342,045 Number of shares (mn) 1,349.41 Free float (%) 89.1 52-week price range 382.0 - 236.5 ADTO - 6M (US$ mn) 89.3
*Stock ratings are relative to the coverage universe in each
analyst's or each team's respective sector.
¹Target price is for 12 months.
Research Analysts
Randy Abrams, CFA
886 2 2715 6366
Yan Taw Boon
852 2101 7039
[email protected] FIRST LAST 08/01/13 09:17:05 AM Allianz Global Investors Taiwan
28 June 2013
MediaTek Inc.
(2454.TW / 2454 TT) 2
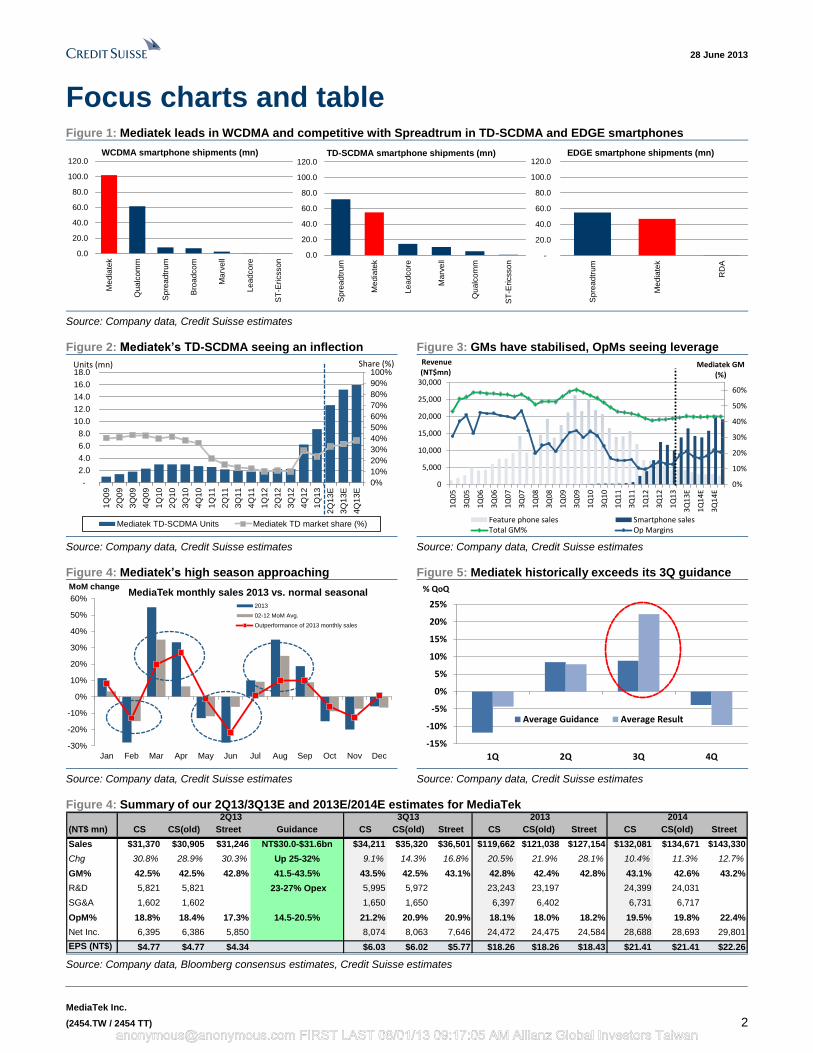
Focus charts and table Figure 1: Mediatek leads in WCDMA and competitive with Spreadtrum in TD-SCDMA and EDGE smartphones
-
20.0
40.0
60.0
80.0
100.0
120.0
Sp
rea
dtr
um
Me
dia
tek
RD
A
EDGE smartphone shipments (mn)
0.0
20.0
40.0
60.0
80.0
100.0
120.0
Me
dia
tek
Qu
alc
om
m
Sp
rea
dtr
um
Bro
adco
m
Ma
rve
ll
Le
adco
re
ST
-Ericsso
n
WCDMA smartphone shipments (mn)
0.0
20.0
40.0
60.0
80.0
100.0
120.0
Sp
rea
dtr
um
Me
dia
tek
Le
adco
re
Ma
rve
ll
Qu
alc
om
m
ST
-Ericsso
n
TD-SCDMA smartphone shipments (mn)
Source: Company data, Credit Suisse estimates
Figure 2: Mediatek’s TD-SCDMA seeing an inflection Figure 3: GMs have stabilised, OpMs seeing leverage
0%
10%
20%
30%
40%
50%
60%
70%
80%
90%
100%
-
2.0
4.0
6.0
8.0
10.0
12.0
14.0
16.0
18.0
1Q
09
2Q
09
3Q
09
4Q
09
1Q
10
2Q
10
3Q
10
4Q
10
1Q
11
2Q
11
3Q
11
4Q
11
1Q
12
2Q
12
3Q
12
4Q
12
1Q
13
2Q
13
E
3Q
13
E
4Q
13
E
Mediatek TD-SCDMA Units Mediatek TD market share (%)
Units (mn) Share (%)
0%
10%
20%
30%
40%
50%
60%
0
5,000
10,000
15,000
20,000
25,000
30,000
1Q
05
3Q
05
1Q
06
3Q
06
1Q
07
3Q
07
1Q
08
3Q
08
1Q
09
3Q
09
1Q
10
3Q
10
1Q
11
3Q
11
1Q
12
3Q
12
1Q
13
3Q
13
E
1Q
14
E
3Q
14
E
Mediatek GM (%)
Revenue (NT$mn)
Feature phone sales Smartphone salesTotal GM% Op Margins
Source: Company data, Credit Suisse estimates Source: Company data, Credit Suisse estimates
Figure 4: Mediatek’s high season approaching Figure 5: Mediatek historically exceeds its 3Q guidance
-30%
-20%
-10%
0%
10%
20%
30%
40%
50%
60%
Jan Feb Mar Apr May Jun Jul Aug Sep Oct Nov Dec
MoM changeMediaTek monthly sales 2013 vs. normal seasonal
2013
02-12 MoM Avg.
Outperformance of 2013 monthly sales
-15%
-10%
-5%
0%
5%
10%
15%
20%
25%
1Q 2Q 3Q 4Q
Average Guidance Average Result
% QoQ
Source: Company data, Credit Suisse estimates Source: Company data, Credit Suisse estimates
Figure 4: Summary of our 2Q13/3Q13E and 2013E/2014E estimates for MediaTek 2Q13 3Q13 2013 2014
(NT$ mn) CS CS(old) Street Guidance CS CS(old) Street CS CS(old) Street CS CS(old) Street
Sales $31,370 $30,905 $31,246 NT$30.0-$31.6bn $34,211 $35,320 $36,501 $119,662 $121,038 $127,154 $132,081 $134,671 $143,330
Chg 30.8% 28.9% 30.3% Up 25-32% 9.1% 14.3% 16.8% 20.5% 21.9% 28.1% 10.4% 11.3% 12.7%
GM% 42.5% 42.5% 42.8% 41.5-43.5% 43.5% 42.5% 43.1% 42.8% 42.4% 42.8% 43.1% 42.6% 43.2%
R&D 5,821 5,821 23-27% Opex 5,995 5,972 23,243 23,197 24,399 24,031
SG&A 1,602 1,602 1,650 1,650 6,397 6,402 6,731 6,717
OpM% 18.8% 18.4% 17.3% 14.5-20.5% 21.2% 20.9% 20.9% 18.1% 18.0% 18.2% 19.5% 19.8% 22.4%
Net Inc. 6,395 6,386 5,850 8,074 8,063 7,646 24,472 24,475 24,584 28,688 28,693 29,801
EPS (NT$) $4.77 $4.77 $4.34 $6.03 $6.02 $5.77 $18.26 $18.26 $18.43 $21.41 $21.41 $22.26 Source: Company data, Bloomberg consensus estimates, Credit Suisse estimates
[email protected] FIRST LAST 08/01/13 09:17:05 AM Allianz Global Investors Taiwan
28 June 2013
MediaTek Inc.
(2454.TW / 2454 TT) 3
Sustaining its lead in a strong product cycle We reinstate our coverage on Mediatek with an OUTPERFORM rating and NT$400 target
price, representing 22% potential upside to Thursday’s close. Our positive view is based
on (1) a strong product cycle in emerging market smartphones and tablets which is only in
the second year of a four- to five-year growth cycle, (2) market leadership continuing to
sustain in the face of tough competition, (3) additional drivers from tablets this year and
LTE over the next few years, and (4) reset sentiment and expectations into the high
season. Our NT$400 target price sets Mediatek at 20x our average 2013E/2014E EPS
(16x ex-cash), similar level to its post financial crisis range.
Emerging market smartphone cycle continues to
ramp faster
Mediatek’s chipsets are leading the ecosystem in low-cost smartphones, which we believe
is now building to 495 mn units in 2013, up from the 450 mn expectation in early January
(see our attached report). We project additional +44% YoY growth to 712 mn units in
2014 as export channels open up further. Mediatek’s growth is also being supplemented
by China-built tablets, which component suppliers are projecting to double to at least 100
mn units this year out of a tablet market approaching 300 mn units.
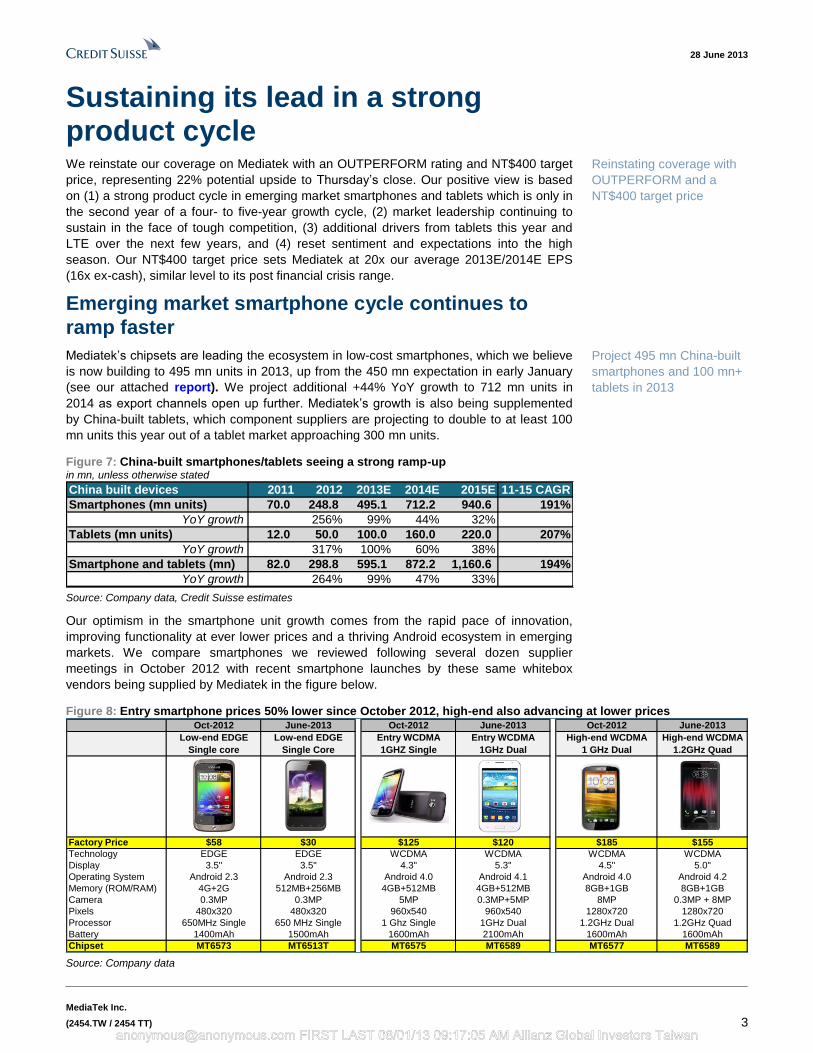
Figure 7: China-built smartphones/tablets seeing a strong ramp-up in mn, unless otherwise stated
China built devices 2011 2012 2013E 2014E 2015E 11-15 CAGR
Smartphones (mn units) 70.0 248.8 495.1 712.2 940.6 191%
YoY growth 256% 99% 44% 32%
Tablets (mn units) 12.0 50.0 100.0 160.0 220.0 207%
YoY growth 317% 100% 60% 38%
Smartphone and tablets (mn) 82.0 298.8 595.1 872.2 1,160.6 194%
YoY growth 264% 99% 47% 33% Source: Company data, Credit Suisse estimates
Our optimism in the smartphone unit growth comes from the rapid pace of innovation,
improving functionality at ever lower prices and a thriving Android ecosystem in emerging
markets. We compare smartphones we reviewed following several dozen supplier
meetings in October 2012 with recent smartphone launches by these same whitebox
vendors being supplied by Mediatek in the figure below.
Figure 8: Entry smartphone prices 50% lower since October 2012, high-end also advancing at lower prices Oct-2012 June-2013 Oct-2012 June-2013 Oct-2012 June-2013
Low-end EDGE Low-end EDGE Entry WCDMA Entry WCDMA High-end WCDMA High-end WCDMA
Single core Single Core 1GHZ Single 1GHz Dual 1 GHz Dual 1.2GHz Quad
Factory Price $58 $30 $125 $120 $185 $155
Technology EDGE EDGE WCDMA WCDMA WCDMA WCDMA
Display 3.5" 3.5" 4.3" 5.3" 4.5" 5.0"
Operating System Android 2.3 Android 2.3 Android 4.0 Android 4.1 Android 4.0 Android 4.2
Memory (ROM/RAM) 4G+2G 512MB+256MB 4GB+512MB 4GB+512MB 8GB+1GB 8GB+1GB
Camera 0.3MP 0.3MP 5MP 0.3MP+5MP 8MP 0.3MP + 8MP
Pixels 480x320 480x320 960x540 960x540 1280x720 1280x720
Processor 650MHz Single 650 MHz Single 1 Ghz Single 1GHz Dual 1.2GHz Dual 1.2GHz Quad
Battery 1400mAh 1500mAh 1600mAh 2100mAh 1600mAh 1600mAh
Chipset MT6573 MT6513T MT6575 MT6589 MT6577 MT6589 Source: Company data
Reinstating coverage with
OUTPERFORM and a
NT$400 target price
Project 495 mn China-built
smartphones and 100 mn+
tablets in 2013
[email protected] FIRST LAST 08/01/13 09:17:05 AM Allianz Global Investors Taiwan

28 June 2013
MediaTek Inc.
(2454.TW / 2454 TT) 4
A few notable trends in the device migration since last fall:
1. Entry pricing getting lower. Factory prices for the entry level 3.5” EDGE Android
smartphones have dropped almost half in about a year from US$58 to US$30. The
prevalence of low-cost EDGE smartphones have opened up the export channel in
developing countries over the past year and allowed price elasticity to accelerate unit
growth.
2. Mid-tier whitebox phones getting much better. For a mid-tier US$120 factory price,
screen sizes have migrated from 4-4.5” up to 5-5.5”, rear cameras now scale up to 5-8
MP and are joined by front cameras, and 1 GHz dual core (versus single core last fall)
power a snappier user interface running Android 4.1 or 4.2.
3. High-tier with better screens resolution and lighter form factor. The upper tier
has allowed a US$150 factory price for 5” Android phone with 8GB memory, 8MP
camera, 1280x720 high resolution screen and quad core processor with vendors also
promoting slim brands and GS4 clone versions.
A combination of higher specs and lower price points is driving elasticity faster than
feature phones. Asian chipset suppliers have now reached 100 mn units just two years
into the ramp, a level that took almost four years during the feature phone ramp from
2005-09.
Price points for the entry level single core chipset are now less than US$5, a level that saw
Asian feature phone chips reach 160 mn units per quarter, suggesting room for continued
fast growth over the next few quarters.
Figure 9: Smartphones outpaced feature phones in ’05-09 Figure 10: $5 chipset drove 160 mn/qtr China feat. phones
0%
5%
10%
15%
20%
25%
30%
35%
40%
45%
50%
0
50
100
150
200
250
3Q
11
/1Q
05
1Q
12
/3Q
05
3Q
12
/1Q
06
1Q
13
/3Q
06
3Q
13
/1Q
07
1Q
14
/3Q
07
3Q
14
/1Q
08
1Q
15
/3Q
08
3Q
15
/1Q
09
1Q
16
/3Q
09
3Q
16
/1Q
10
1Q
17
/3Q
10
3Q
17
/1Q
11
1Q
18
/3Q
11
Asian Feature phone units Asian Smartphone units FF Asian share (%)
Qtrly shipments (mn) Asian share (mn)
$0
$3
$6
$9
$12
$15
$18
$21
0
40
80
120
160
200
240
280
1Q
05
3Q
05
1Q
06
3Q
06
1Q
07
3Q
07
1Q
08
3Q
08
1Q
09
3Q
09
1Q
10
3Q
10
1Q
11
3Q
11
1Q
12
3Q
12
1Q
13
E
3Q
13
E
1Q
14E
3Q
14
E
1Q
15
E
3Q
15
E
Feature phone units Smartphones units
Feature phone ASPs Smartphone ASPs
Chipset units (mn) ASPs (US$)
Source: Company data, Credit Suisse estimates Source: Company data, Credit Suisse estimates
Mediatek still setting the pace
Mediatek has regained the leadership position it held in emerging market feature phones
through a combination of benefits that scale beyond the raw chipset specifications:
■ Turnkey support. Mediatek’s turnkey solutions include manufacturing-ready
reference design kits and software support, with over 1,000 field applications
engineers in China supporting customers in various key locations (Shenzhen,
Shanghai and Beijing). The turnkey support Mediatek provides addresses whitebox
handset makers’ needs, lowers the entry barrier for suppliers, and vastly shortens
time-to-market. Despite the aggressive push by overseas vendors led by Qualcomm,
Mediatek is still leading in its understanding of the market and relationships with the
customers after working closely with them for seven to eight years.
■ High level of integration. Mediatek is enabling its customers to cut down costs faster
through integrating external components on chip. The company’s MT6572 integrates
an internal 32K clock, a SAW-less filter, and single antenna to also reduce external
Mediatek’s customers are
enabled for substantially
lower entry price points and
higher quality at similar
prices relative to last
October
US$5 chipset price on
feature phones enabled 160
mn units/quarter China-built
feature phone volumes
Mediatek’s model for
turnkey support still leads
competitor efforts,
integration, fast refreshes
and now aggressive leading
edge push steps up its
competitiveness
[email protected] FIRST LAST 08/01/13 09:17:05 AM Allianz Global Investors Taiwan

28 June 2013
MediaTek Inc.
(2454.TW / 2454 TT) 5
BOM costs and allows for simplified four-layer PCB. The company has also created a
high degree of flexibility for customers to source local low-cost suppliers, support
multiple mobile DRAM suppliers and scale up pixel count on photos to advertise a
higher megapixel count for the phone.
■ Fast product refreshes. Mediatek is quick in providing new software patches and
churning out optimised chips to help improve customers’ competitiveness. For
example, MT6589A is an optimised version of the 6589 enabling its customers to
improve clock speed performance and the MT6589M and MT6582 represent two
lower-cost chipsets within two quarters of the initial quad core launch which strip out
redundant non-core features, thus lowering prices.
Figure 11: Mediatek has competitive specs but layers on service, support, derivative products and faster time-to-market
Quad Core LTE
Single Core Dual Core
MediaTekMT6589/MT6582,
28nm, 1 GHz, 4 A7,
TD/HSPA+
Qualcomm
MSM8226, 28nm,
1.5GHz, 4 A7,
HSPA+
NVIDIA
Tegra 4, 28nm HPL,
4 A15, LTE Cat 4
MediaTek
MT6572, 28nm, 1-
1.5 GHz, 2 A7,
Power VR, TD+W
Spreadtrum
SC6825/8825, 40nm,
1.2GHz, 2 A5, TD /
EDGE
Qualcomm
MSM8926, 28nm,
1.2-1.4GHz, 4 A7,
LTE Cat 4
Qualcomm
MSM8210, 28nm,
1.2GHz, 2 A7,
TD+W
Marvell
PXA1088, 28nm,
1.0 GHz, 4 A7,
TD/HSPA+
Spreadtrum
SC6820/8820,
40nm, 1GHz, 1 A5,
TD / EDGE
MediaTek
MT6575, 40nm,
1GHz, 1 A9,
HSPA/EDGE
Intel
XMM7160, 28nm,
1.3GHz, 4 A7,
LTE/HSPA+ Cat 3
MediaTek
MT6290, 28nm,
1.4GHz, 4 A7, Mali
400, LTE Cat 3
Leadcore
LC1813, 40nm, 4
A7, TD
Hisilicon
Balong 710, 28nm,
1.5GHz, 4 A9, LTE
Cat 4
Qualcomm
MSM7227A, 45nm,
1GHz, 1 A5,
HSPA/EDGE
MarvellPXA 986(TD)/988(W),
1.2Ghz, 2 A9, Vivante
GC1000
Marvell
PXA1088 LTE,
28nm 1.2GHz, 4 A7,
LTE
Broadcom
BCM23550, 1.2GHz,
4 A7, TD/HSPA+
Broadcom
BCM21892, 40nm,
LTE Cat 4 modem
Broadcom
BCM28145, 1.2
GHz, 2 A9, HSPA+
RDA
RDA8810, 55nm,
1GHz, 1 A5, EDGE
Source: Company data
Based on Mediatek ramping from 110 mn units to around its 200 mn target in 2013, we
believe it maintains 40%+ market share, leading a space supplied by Asian suppliers
Spreadtrum, RDA and Leadcore and overseas vendors Qualcomm, Broadcom and
Marvell.
Figure 12: Mediatek retaining over 40% market share in a fast growing space in mn, unless otherwise stated
Smartphone chipsets 2011 2012 2013 2014 2015
Mediatek 10.0 109.8 203.9 306.9 397.4
Mediatek share (%) 14% 44% 41% 43% 42%
Spreadtrum 0.2 32.0 135.1 186.2 263.9
RDA - - - 24.3 49.8
Leadcore 3.0 5.0 15.0 22.5 30.0
Asian suppliers 13.2 146.8 354.0 539.9 741.1
YoY Growth 1009% 141% 52% 37%
Share 19% 59% 71% 76% 79%
Qualcomm 35.2 81.0 120.6 150.3 174.5
Broadcom 1.5 2.5 7.0 10.0 15.0
Marvell 12.0 15.0 13.0 12.0 10.0
ST-Ericsson 8.0 3.5 0.5 - -
Overseas suppliers 56.7 102.0 141.1 172.3 199.5
YoY Growth 80% 38% 22% 16%
Share 81% 41% 28% 24% 21%
Total 70.1 249.2 495.5 712.6 941.0
YoY Growth 255% 99% 44% 32% Source: Company data, Credit Suisse estimates
Mediatek at its 200 mn
target should retain 40%+
market share in local
channels
[email protected] FIRST LAST 08/01/13 09:17:05 AM Allianz Global Investors Taiwan

28 June 2013
MediaTek Inc.
(2454.TW / 2454 TT) 6
Mediatek’s leadership extends to the mid-high end of the emerging market smartphone
space. Within a quarter from the launch around the Mobile World Congress, the company
has a broad swath of design wins for its quad core chipset spanning the major top tier
vendors in China and most of the whitebox suppliers.
Figure 13: Mediatek lining up a number of Tier 1 design wins with its quad core solution
Company ZTE
Model name ZTE U935 ZTE U956 Lenovo A820T Lenovo S920 Huawei G520 Huawei G700 TCL Y900 TCL P600
Technology TD-SCDMA TD-SCDMA TD-SCDMA WCDMA TD-SCDMA WCDMA WCDMA WCDMA
Operating System Android 4.1 Android 4.1 Android 4.0 Android 4.2 Android 4.1 Android 4.2 Android 4.1 Android 4.1
Pixels 1920*1080 1280*720 960*540 1280*720 854*480 1280*720 1280*720 960*540
RAM 1G 1G 1G 1G 512M 2G 1G 1G
ROM 8G 4G 4G 4G 4G NA 4G 4G
Display 5.0" 5.0" 4.5" 5.3" 5.0" 5.0" 5.0" 4.5"
Camera 1MP + 8MP 1MP + 8MP 8MP 8MP 0.3MP + 5MP NA 5MP + 8 MP 1.3MP + 8MP
Battery 2500m Ah 2500m Ah 2000m Ah 2250m Ah 1700m Ah NA 2500m Ah 1800m Ah
Processor Chip MediaTek 6589 MediaTek 6589 MediaTek 6589 MediaTek 6589 MediaTek 6589 MediaTek 6589 MediaTek 6589 MediaTek 6589
Price (RMB) NA 1,499 1,099 2,199 1,199 1,860 2,499 1,950
Availability Jan-13 Jan-13 Feb-13 Mar-13 Jan-13 Mar-13 NA Jan-13
Lenovo Huawei TCL
Source: Company data
TD-SCDMA chipset introductions open up a
significant new channel with China Mobile
Mediatek’s market share has been dominated by WCDMA to date, where we estimate the
company is shipping half its 200 mn units this year. The company has also rivalled
Spreadtrum in the EDGE smartphone market with about 50 mn units, though its customers
often position Spreadtrum as a value low-cost supplier for this tier of the market. In TD-
SCDMA, however, Spreadtrum is the leader, with Mediatek until recently having limited
position as it entered the market in 2006 with the acquisition of ADI’s handset division and
until last year relied on a separate software solution in cooperation with Datang.
We believe the Spreadtrum merger proposal with Tsinghua Unigroup has mixed
implications for Mediatek (see our report). The group may look to list Spreadtrum on the
local exchange for higher liquidity and valuation but will stay in the public spotlight.
Operations could benefit from closer China ties to development subsidies and
encouragement for use in customer handsets on 4G TD-LTE, though execution could also
slip by change in control and emphasis on the still large WCDMA market may drop
somewhat.
Figure 14: Mediatek leads in WCDMA and competitive with Spreadtrum in TD-SCDMA and EDGE smartphones
-
20.0
40.0
60.0
80.0
100.0
120.0
Sp
rea
dtr
um
Me
dia
tek
RD
A
EDGE smartphone shipments (mn)
0.0
20.0
40.0
60.0
80.0
100.0
120.0
Me
dia
tek
Qu
alc
om
m
Sp
rea
dtr
um
Bro
adco
m
Ma
rve
ll
Le
adco
re
ST
-Ericsso
n
WCDMA smartphone shipments (mn)
0.0
20.0
40.0
60.0
80.0
100.0
120.0
Sp
rea
dtr
um
Me
dia
tek
Le
adco
re
Ma
rve
ll
Qu
alc
om
m
ST
-Ericsso
n
TD-SCDMA smartphone shipments (mn)
Source: Company data, Credit Suisse estimates
Mediatek starting to have
traction on TD-SCDMA with
its new dual core and quad
core chipsets
[email protected] FIRST LAST 08/01/13 09:17:05 AM Allianz Global Investors Taiwan
28 June 2013
MediaTek Inc.
(2454.TW / 2454 TT) 7
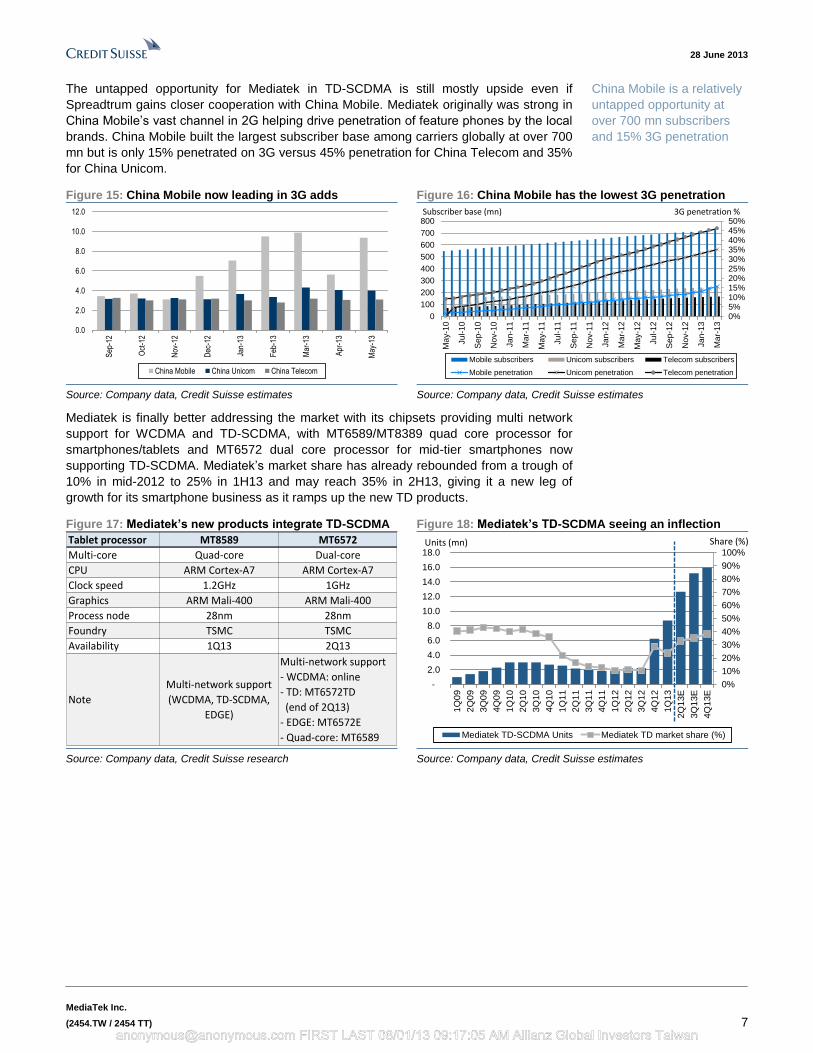
The untapped opportunity for Mediatek in TD-SCDMA is still mostly upside even if
Spreadtrum gains closer cooperation with China Mobile. Mediatek originally was strong in
China Mobile’s vast channel in 2G helping drive penetration of feature phones by the local
brands. China Mobile built the largest subscriber base among carriers globally at over 700
mn but is only 15% penetrated on 3G versus 45% penetration for China Telecom and 35%
for China Unicom.
Figure 15: China Mobile now leading in 3G adds Figure 16: China Mobile has the lowest 3G penetration
0.0
2.0
4.0
6.0
8.0
10.0
12.0
Sep
-12
Oct
-12
Nov
-12
Dec
-12
Jan-
13
Feb
-13
Mar
-13
Apr
-13
May
-13
China Mobile China Unicom China Telecom
0%5%10%15%20%25%30%35%40%45%50%
0
100
200
300
400
500
600
700
800
Ma
y-1
0
Jul-1
0
Sep-1
0
No
v-1
0
Jan-1
1
Ma
r-1
1
Ma
y-1
1
Jul-1
1
Sep-1
1
No
v-1
1
Jan-1
2
Ma
r-1
2
Ma
y-1
2
Jul-1
2
Sep-1
2
No
v-1
2
Jan-1
3
Ma
r-1
3
Mobile subscribers Unicom subscribers Telecom subscribers
Mobile penetration Unicom penetration Telecom penetration
Subscriber base (mn) 3G penetration %
Source: Company data, Credit Suisse estimates Source: Company data, Credit Suisse estimates
Mediatek is finally better addressing the market with its chipsets providing multi network
support for WCDMA and TD-SCDMA, with MT6589/MT8389 quad core processor for
smartphones/tablets and MT6572 dual core processor for mid-tier smartphones now
supporting TD-SCDMA. Mediatek’s market share has already rebounded from a trough of
10% in mid-2012 to 25% in 1H13 and may reach 35% in 2H13, giving it a new leg of
growth for its smartphone business as it ramps up the new TD products.
Figure 17: Mediatek’s new products integrate TD-SCDMA Figure 18: Mediatek’s TD-SCDMA seeing an inflection
Tablet processor MT8589 MT6572
Multi-core Quad-core Dual-core
CPU ARM Cortex-A7 ARM Cortex-A7
Clock speed 1.2GHz 1GHz
Graphics ARM Mali-400 ARM Mali-400
Process node 28nm 28nm
Foundry TSMC TSMC
Availability 1Q13 2Q13
Note
Multi-network support
(WCDMA, TD-SCDMA,
EDGE)
Multi-network support
- WCDMA: online
- TD: MT6572TD
(end of 2Q13)
- EDGE: MT6572E
- Quad-core: MT6589
0%
10%
20%
30%
40%
50%
60%
70%
80%
90%
100%
-
2.0
4.0
6.0
8.0
10.0
12.0
14.0
16.0
18.0
1Q
09
2Q
09
3Q
09
4Q
09
1Q
10
2Q
10
3Q
10
4Q
10
1Q
11
2Q
11
3Q
11
4Q
11
1Q
12
2Q
12
3Q
12
4Q
12
1Q
13
2Q
13E
3Q
13
E
4Q
13
E
Mediatek TD-SCDMA Units Mediatek TD market share (%)
Units (mn) Share (%)
Source: Company data, Credit Suisse research Source: Company data, Credit Suisse estimates
China Mobile is a relatively
untapped opportunity at
over 700 mn subscribers
and 15% 3G penetration
[email protected] FIRST LAST 08/01/13 09:17:05 AM Allianz Global Investors Taiwan

28 June 2013
MediaTek Inc.
(2454.TW / 2454 TT) 8
Margins have finally turned the corner, providing operating leverage Mediatek’s profitability troughed in 1Q12 at 10%, just as feature phones were collapsing
and smartphones were too small to have an impact but incurring a high level of operating
expense ahead of the ramp-up. The company is now generating over half of its revenue
from smartphones and tablets, and finally seeing operating leverage.
Gross margins bottomed at 40.8% in 2Q12 and have recovered slightly each of the past
three quarters; we expect further 40 bp+ improvement to 42.5% in 2Q13 and 100 bp
improvement to 43.5% in 3Q13. Sales leverage and modest margin improvement could
also lift operating margins back over 20% by 3Q13 for the first time since 2010. Rapid
product upgrades in the roadmap are helping drive better functionality and lower cost, with
push through of: (1) 650 MHz single core in 3Q11 (MT6573), (2) 1GHz single core in 1Q12
(MT6575), (3) 1.2 GHz dual core in 3Q12 (MT6577), (4) 1.2 GHz quad core in 1Q13
(MT6589), and now (5) cost-down dual core in 2Q13 (MT6572), (6) cost-down quad core
(MT6589M and MT6582), (7) big little tablet processor (MT8135) in 3Q13, and (8) LTE
modem in 4Q13 along with quad core application processor. The company has also
pushed from a lagging edge low-cost strategy on feature phones, running chips on 110nm
to now aggressive push to 28nm to optimise die size and improve power/performance on
its smartphone chipsets.
Qualcomm until recently was splitting its family and running only 28nm at the high-end and
40nm at the low-end but is now pushing its low cost family to 28nm. The high volume
runners in 1H13 (8225Q quad core and 8225 dual core) were still on 40nm but both will
move to 28nm with the quad core 8226 and 8210/8212 in 4Q13. Mediatek fortunately has
its own 28nm migration with its new cost-down dual/quad core to match up well.
Figure 19: Mediatek GMs seeing modest improvement, driving operating leverage in mn, unless otherwise stated
0%
10%
20%
30%
40%
50%
60%
0
5,000
10,000
15,000
20,000
25,000
30,000
1Q05
3Q05
1Q06
3Q06
1Q07
3Q07
1Q08
3Q08
1Q09
3Q09
1Q10
3Q10
1Q11
3Q11
1Q12
3Q12
1Q13
3Q13
E
1Q14
E
3Q14
E
Mediatek GM (%)
Revenue (NT$mn)
Feature phone sales Smartphone salesTotal GM% Op Margins
Source: Company data, Credit Suisse estimates
LTE and tablets to drive further legs to the growth
opportunity
Mediatek is sampling its first LTE chipset in 4Q13, the MT6290 supporting both FD and TD
modes of LTE along with WCDMA, TD-SCDMA and EDGE and joined with its Quad core
Cortex A7 application processor. The company is doing early engagement with customers
Huawei, ZTE and Lenovo but will be sampling towards the end of this year. We see LTE
offering a growth catalyst for higher ASPs and less commoditisation risk in the next few
years, although at this stage model for only 5 mn units in 2014 and 25 mn units in 2015.
Operating margins troughed
in 1Q12 at 10% as feature
phones collapsed but are
now set to approach 20%
Qualcomm was still on
40nm for its QRD chips in
1H13 but moving to 28nm in
2H13; Mediatek’s cost-down
chips match up to the
challenge
Mediatek’s first LTE chip
samples in 4Q13
[email protected] FIRST LAST 08/01/13 09:17:05 AM Allianz Global Investors Taiwan
28 June 2013
MediaTek Inc.
(2454.TW / 2454 TT) 9
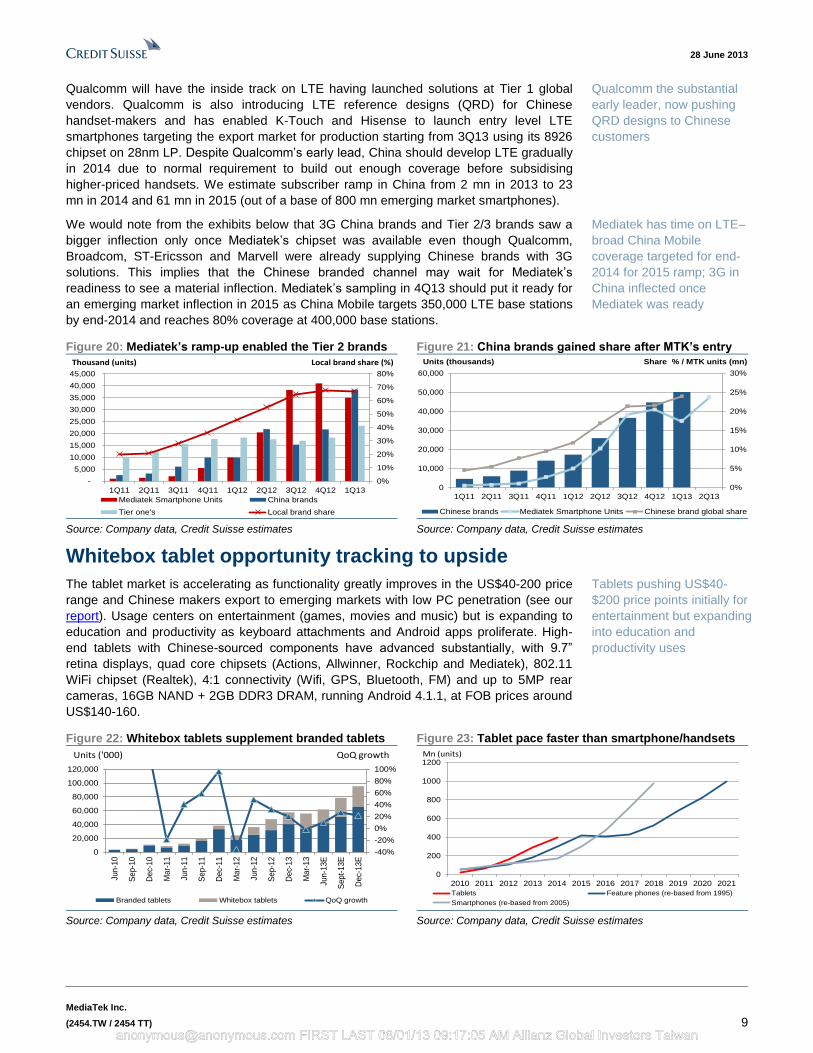
Qualcomm will have the inside track on LTE having launched solutions at Tier 1 global
vendors. Qualcomm is also introducing LTE reference designs (QRD) for Chinese
handset-makers and has enabled K-Touch and Hisense to launch entry level LTE
smartphones targeting the export market for production starting from 3Q13 using its 8926
chipset on 28nm LP. Despite Qualcomm’s early lead, China should develop LTE gradually
in 2014 due to normal requirement to build out enough coverage before subsidising
higher-priced handsets. We estimate subscriber ramp in China from 2 mn in 2013 to 23
mn in 2014 and 61 mn in 2015 (out of a base of 800 mn emerging market smartphones).
We would note from the exhibits below that 3G China brands and Tier 2/3 brands saw a
bigger inflection only once Mediatek’s chipset was available even though Qualcomm,
Broadcom, ST-Ericsson and Marvell were already supplying Chinese brands with 3G
solutions. This implies that the Chinese branded channel may wait for Mediatek’s
readiness to see a material inflection. Mediatek’s sampling in 4Q13 should put it ready for
an emerging market inflection in 2015 as China Mobile targets 350,000 LTE base stations
by end-2014 and reaches 80% coverage at 400,000 base stations.
Figure 20: Mediatek’s ramp-up enabled the Tier 2 brands Figure 21: China brands gained share after MTK’s entry
0%
10%
20%
30%
40%
50%
60%
70%
80%
-
5,000
10,000
15,000
20,000
25,000
30,000
35,000
40,000
45,000
1Q11 2Q11 3Q11 4Q11 1Q12 2Q12 3Q12 4Q12 1Q13
Mediatek Smartphone Units China brands
Tier one's Local brand share
Thousand (units) Local brand share (%)
0%
5%
10%
15%
20%
25%
30%
0
10,000
20,000
30,000
40,000
50,000
60,000
1Q11 2Q11 3Q11 4Q11 1Q12 2Q12 3Q12 4Q12 1Q13 2Q13
Chinese brands Mediatek Smartphone Units Chinese brand global share
Share % / MTK units (mn)Units (thousands)
Source: Company data, Credit Suisse estimates Source: Company data, Credit Suisse estimates
Whitebox tablet opportunity tracking to upside
The tablet market is accelerating as functionality greatly improves in the US$40-200 price
range and Chinese makers export to emerging markets with low PC penetration (see our
report). Usage centers on entertainment (games, movies and music) but is expanding to
education and productivity as keyboard attachments and Android apps proliferate. High-
end tablets with Chinese-sourced components have advanced substantially, with 9.7”
retina displays, quad core chipsets (Actions, Allwinner, Rockchip and Mediatek), 802.11
WiFi chipset (Realtek), 4:1 connectivity (Wifi, GPS, Bluetooth, FM) and up to 5MP rear
cameras, 16GB NAND + 2GB DDR3 DRAM, running Android 4.1.1, at FOB prices around
US$140-160.
Figure 22: Whitebox tablets supplement branded tablets Figure 23: Tablet pace faster than smartphone/handsets
-40%
-20%
0%
20%
40%
60%
80%
100%
0
20,000
40,000
60,000
80,000
100,000
120,000
Jun
-10
Se
p-1
0
De
c-1
0
Ma
r-1
1
Jun
-11
Se
p-1
1
De
c-1
1
Ma
r-1
2
Jun
-12
Sep-1
2
De
c-1
3
Ma
r-1
3
Jun
-13E
Se
pt-
13
E
De
c-1
3E
Branded tablets Whitebox tablets QoQ growth
Units ('000) QoQ growth
0
200
400
600
800
1000
1200
2010 2011 2012 2013 2014 2015 2016 2017 2018 2019 2020 2021
Tablets Feature phones (re-based from 1995)
Smartphones (re-based from 2005)
Mn (units)
Source: Company data, Credit Suisse estimates Source: Company data, Credit Suisse estimates
Qualcomm the substantial
early leader, now pushing
QRD designs to Chinese
customers
Mediatek has time on LTE–
broad China Mobile
coverage targeted for end-
2014 for 2015 ramp; 3G in
China inflected once
Mediatek was ready
Tablets pushing US$40-
$200 price points initially for
entertainment but expanding
into education and
productivity uses
[email protected] FIRST LAST 08/01/13 09:17:05 AM Allianz Global Investors Taiwan
28 June 2013
MediaTek Inc.
(2454.TW / 2454 TT) 10
Tablet chipset, component suppliers, and design houses believe the market is growing
from 50 mn units last year to 100-120 mn units this year. The overall tablet market would
include 110 mn Apple/Samsung + 100 mn China Tier 2/whitebox + 80 mn other foreign
brands, about 290 mn units versus PC industry volumes in the 300-350 mn range.
More notably, tablets are tracking above the handset adoption pace in the 1990s and the
smartphone pace at similar points from 2005 to 2010. The tablet offers a basic computing
capability starting from US$40 with no extra service plan required, providing upside to an
addressable market as large as smartphones, though still early to conclude if it caps out at
300-400 mn units like other consumer products or scales as a basic computing device to
everyone carrying a smartphone.
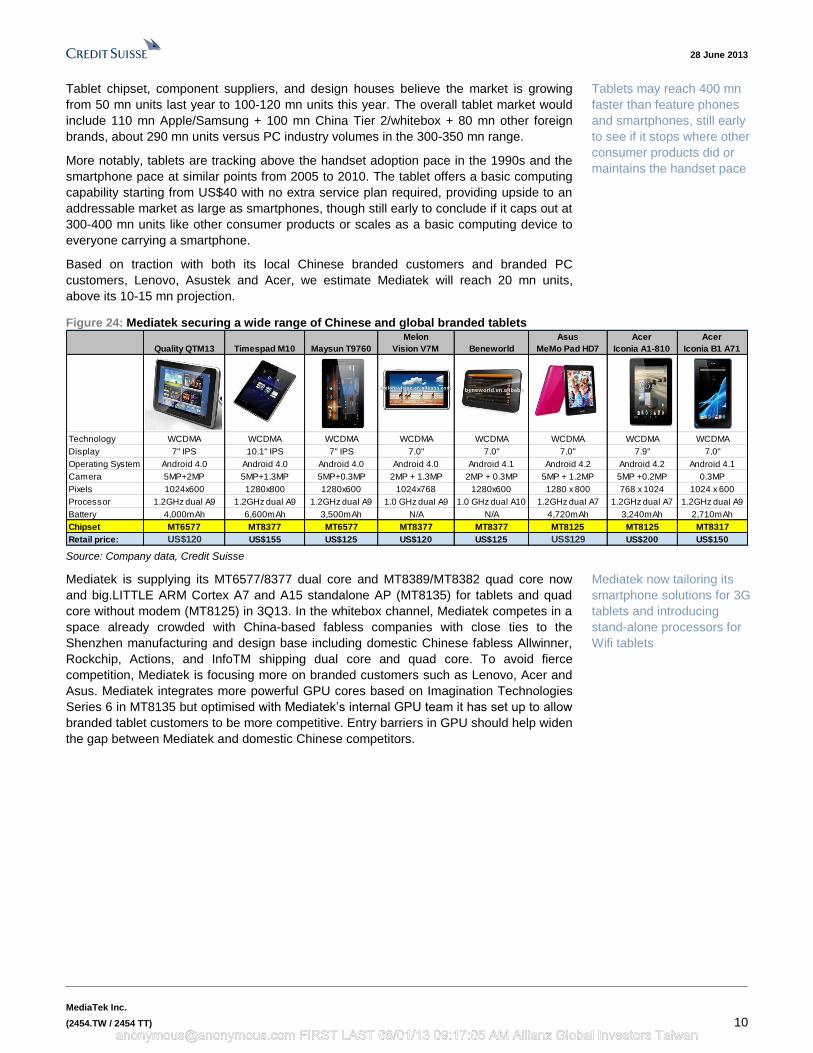
Based on traction with both its local Chinese branded customers and branded PC
customers, Lenovo, Asustek and Acer, we estimate Mediatek will reach 20 mn units,
above its 10-15 mn projection.
Figure 24: Mediatek securing a wide range of Chinese and global branded tablets
Quality QTM13 Timespad M10 Maysun T9760
Melon
Vision V7M Beneworld
Asus
MeMo Pad HD7
Acer
Iconia A1-810
Acer
Iconia B1 A71
Technology WCDMA WCDMA WCDMA WCDMA WCDMA WCDMA WCDMA WCDMA
Display 7" IPS 10.1" IPS 7" IPS 7.0" 7.0" 7.0" 7.9" 7.0"
Operating System Android 4.0 Android 4.0 Android 4.0 Android 4.0 Android 4.1 Android 4.2 Android 4.2 Android 4.1
Camera 5MP+2MP 5MP+1.3MP 5MP+0.3MP 2MP + 1.3MP 2MP + 0.3MP 5MP + 1.2MP 5MP +0.2MP 0.3MP
Pixels 1024x600 1280x800 1280x600 1024x768 1280x600 1280 x 800 768 x 1024 1024 x 600
Processor 1.2GHz dual A9 1.2GHz dual A9 1.2GHz dual A9 1.0 GHz dual A9 1.0 GHz dual A10 1.2GHz dual A7 1.2GHz dual A7 1.2GHz dual A9
Battery 4,000mAh 6,600mAh 3,500mAh N/A N/A 4,720mAh 3,240mAh 2,710mAh
Chipset MT6577 MT8377 MT6577 MT8377 MT8377 MT8125 MT8125 MT8317
Retail price: US$120 US$155 US$125 US$120 US$125 US$129 US$200 US$150 Source: Company data, Credit Suisse
Mediatek is supplying its MT6577/8377 dual core and MT8389/MT8382 quad core now
and big.LITTLE ARM Cortex A7 and A15 standalone AP (MT8135) for tablets and quad
core without modem (MT8125) in 3Q13. In the whitebox channel, Mediatek competes in a
space already crowded with China-based fabless companies with close ties to the
Shenzhen manufacturing and design base including domestic Chinese fabless Allwinner,
Rockchip, Actions, and InfoTM shipping dual core and quad core. To avoid fierce
competition, Mediatek is focusing more on branded customers such as Lenovo, Acer and
Asus. Mediatek integrates more powerful GPU cores based on Imagination Technologies
Series 6 in MT8135 but optimised with Mediatek’s internal GPU team it has set up to allow
branded tablet customers to be more competitive. Entry barriers in GPU should help widen
the gap between Mediatek and domestic Chinese competitors.
Tablets may reach 400 mn
faster than feature phones
and smartphones, still early
to see if it stops where other
consumer products did or
maintains the handset pace
Mediatek now tailoring its
smartphone solutions for 3G
tablets and introducing
stand-alone processors for
Wifi tablets
[email protected] FIRST LAST 08/01/13 09:17:05 AM Allianz Global Investors Taiwan
28 June 2013
MediaTek Inc.
(2454.TW / 2454 TT) 11
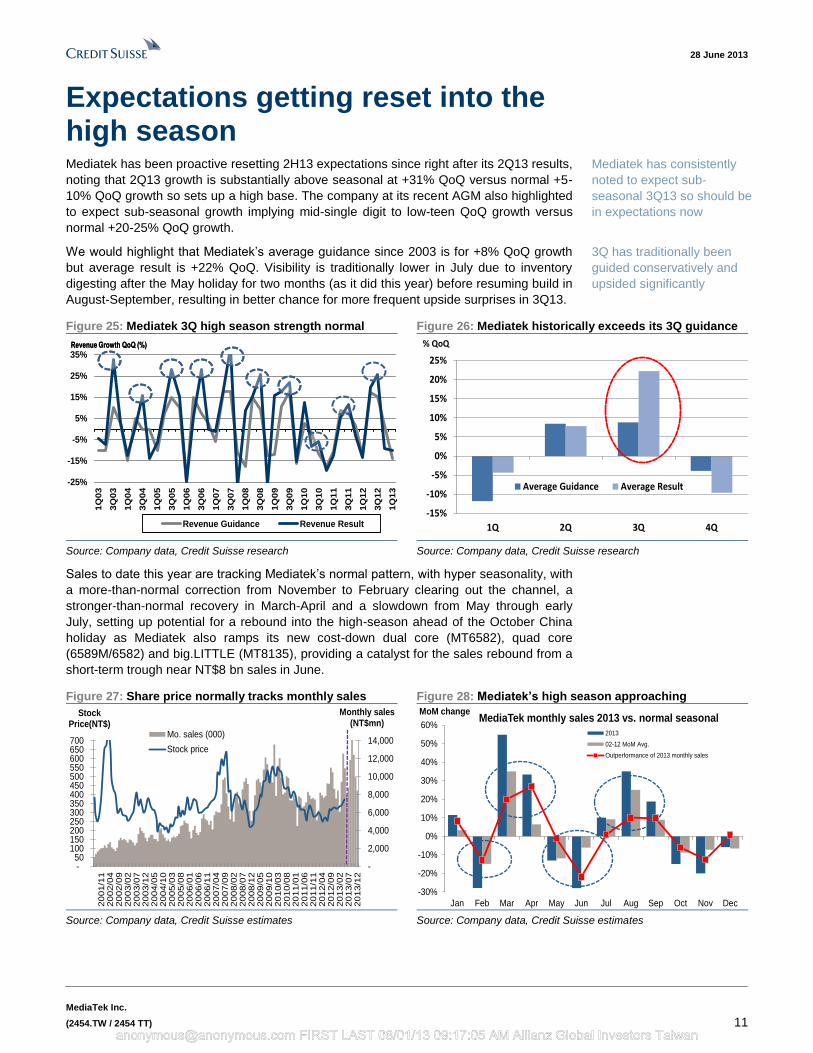
Expectations getting reset into the high season Mediatek has been proactive resetting 2H13 expectations since right after its 2Q13 results,
noting that 2Q13 growth is substantially above seasonal at +31% QoQ versus normal +5-
10% QoQ growth so sets up a high base. The company at its recent AGM also highlighted
to expect sub-seasonal growth implying mid-single digit to low-teen QoQ growth versus
normal +20-25% QoQ growth.
We would highlight that Mediatek’s average guidance since 2003 is for +8% QoQ growth
but average result is +22% QoQ. Visibility is traditionally lower in July due to inventory
digesting after the May holiday for two months (as it did this year) before resuming build in
August-September, resulting in better chance for more frequent upside surprises in 3Q13.
Figure 25: Mediatek 3Q high season strength normal Figure 26: Mediatek historically exceeds its 3Q guidance
-25%
-15%
-5%
5%
15%
25%
35%
1Q
03
3Q
03
1Q
04
3Q
04
1Q
05
3Q
05
1Q
06
3Q
06
1Q
07
3Q
07
1Q
08
3Q
08
1Q
09
3Q
09
1Q
10
3Q
10
1Q
11
3Q
11
1Q
12
3Q
12
1Q
13
Revenue Guidance Revenue Result
Revenue Growth QoQ (%)Revenue Growth QoQ (%)
-15%
-10%
-5%
0%
5%
10%
15%
20%
25%
1Q 2Q 3Q 4Q
Average Guidance Average Result
% QoQ
Source: Company data, Credit Suisse research Source: Company data, Credit Suisse research
Sales to date this year are tracking Mediatek’s normal pattern, with hyper seasonality, with
a more-than-normal correction from November to February clearing out the channel, a
stronger-than-normal recovery in March-April and a slowdown from May through early
July, setting up potential for a rebound into the high-season ahead of the October China
holiday as Mediatek also ramps its new cost-down dual core (MT6582), quad core
(6589M/6582) and big.LITTLE (MT8135), providing a catalyst for the sales rebound from a
short-term trough near NT$8 bn sales in June.
Figure 27: Share price normally tracks monthly sales Figure 28: Mediatek’s high season approaching
- 50
100 150 200 250 300 350 400 450 500 550 600 650 700
-
2,000
4,000
6,000
8,000
10,000
12,000
14,000
20
13/1
22
01
3/0
72
01
3/0
22
01
2/0
92
01
2/0
42
01
1/1
12
01
1/0
62
01
1/0
12
01
0/0
82
01
0/0
32
00
9/1
02
00
9/0
52
00
8/1
22
00
8/0
72
00
8/0
22
00
7/0
92
00
7/0
42
00
6/1
12
00
6/0
62
00
6/0
12
00
5/0
82
00
5/0
32
00
4/1
02
00
4/0
52
00
3/1
22
00
3/0
72
00
3/0
22
00
2/0
92
00
2/0
42
00
1/1
1
Stock Price(NT$)
Monthly sales (NT$mn)
Mo. sales (000)
Stock price
-30%
-20%
-10%
0%
10%
20%
30%
40%
50%
60%
Jan Feb Mar Apr May Jun Jul Aug Sep Oct Nov Dec
MoM changeMediaTek monthly sales 2013 vs. normal seasonal
2013
02-12 MoM Avg.
Outperformance of 2013 monthly sales
Source: Company data, Credit Suisse estimates Source: Company data, Credit Suisse estimates
Mediatek has consistently
noted to expect sub-
seasonal 3Q13 so should be
in expectations now
3Q has traditionally been
guided conservatively and
upsided significantly
[email protected] FIRST LAST 08/01/13 09:17:05 AM Allianz Global Investors Taiwan

28 June 2013
MediaTek Inc.
(2454.TW / 2454 TT) 12
Raise tablets and gross margins, trim smartphones,
leaving EPS unchanged
Our key assumptions for Mediatek include:
■ Smartphones slightly lower: We project smartphones grow from 47.5 mn in 2Q13 to
62 mn in 3Q13 and 59 mn in 4Q13, driving 204 mn units for 2013 and 307 mn in 2014.
We assume blended ASPs will drop 10% QoQ in 3Q13 to ~US$9 and another 10% in
4Q13 to US$8 as lower-cost dual/quad cores ramp.
■ Tablets revised up. We raise tablets from 15 mn to 20 mn on whitebox and branded
OEM traction and the launch of new stand-alone processors for this channel in 2H13.
■ Non-handsets roughly unchanged. We make small upward revisions to WLAN
(connectivity ramp and more to tablets) but still see a downtrend in optical/DVD.
Figure 29: Mediatek operating assumptions
Quarters Years
NT$mn unless noted 1Q13 2Q13E 3Q13E 4Q13E 2011 2012 2013F Prior 2014F 2015F
Feature phones (mn) 72.2 81.5 79.1 67.2 530.2 391.9 300.0 300.5 243.5 195.4
ASPs (US$) $1.95 $1.91 $1.85 $1.80 $3.58 $2.26 $1.88 $1.85 $1.63 $1.38
Smartphones (mn) 35.0 47.5 62.3 59.1 10.0 109.8 203.9 208.8 306.9 397.4
ASPs (US$) $9.71 $9.81 $8.92 $8.12 $13.33 $10.82 $9.04 $9.49 $7.57 $7.06
Tablets (mn) 2.0 6.0 6.5 5.6 0.0 0.0 20.1 13.5 37.5 60.0
ASPs (US$) $14.00 $12.60 $11.34 $10.77 $0.00 $0.00 $11.83 $13.55 $9.36 $7.65
Handset/Tablet Sales 15,003 20,709 23,046 19,645 59,512 61,419 78,403 80,640 91,215 104,982
DTV 3,435 4,087 4,429 4,144 10,722 13,490 16,095 15,877 16,581 17,234
PC Optical 2,403 2,701 2,730 2,530 10,596 11,489 10,365 10,360 8,369 6,717
Consumer DVD 782 888 981 868 4,160 3,515 3,520 3,506 3,142 2,912
WLAN (Ralink) 2,363 2,985 3,025 2,919 1,867 9,365 11,292 10,668 12,774 13,370
Total Sales 23,986 31,370 34,211 30,107 86,858 99,278 119,674 121,050 132,081 145,215
GM % 42.1% 42.5% 43.5% 43.0% 45.3% 41.4% 42.8% 42.4% 43.1% 43.2%
Op M% 12.9% 18.8% 21.2% 17.9% 14.2% 12.5% 18.1% 18.0% 19.5% 21.0%
EPS $2.79 $4.77 $6.03 $4.67 $12.52 $12.85 $18.26 $18.26 $21.41 $24.69 Source: Company data, Credit Suisse estimates
2Q13 reaching the high-end of guidance, 3Q13 sub-
seasonal due to the high base
We are revising up 2Q13 sales to the high-end of the +25-32% QoQ guidance even with a
weak June near NT$8 bn and leaving gross margins at the midpoint at 42.5%, keeping
EPS unchanged at NT$4.77 versus street at NT$4.34. For 3Q13, we factor in +9% QoQ
growth and believe street is now up 17% QoQ (excluding outlier estimates still factoring in
revenue from the MStar closure in August 2013). While street sales estimates are a bit
aggressive at +17% QoQ, we believe GMs with the cost-down chips could improve 100 bp
QoQ, keeping our EPS unchanged and slightly above street. For full-year 2013/2014, we
estimate EPS at NT$18.26/NT$21.41, in the range of street at NT$18.43/NT$22.26.
Figure 30: Summary of our 2Q13E/3Q13E and 2013E/2014E estimates for MediaTek 2Q13 3Q13 2013 2014
(NT$ mn) CS CS(old) Street Guidance CS CS(old) Street CS CS(old) Street CS CS(old) Street
Sales $31,370 $30,905 $31,246 NT$30.0-$31.6bn $34,211 $35,320 $36,501 $119,662 $121,038 $127,154 $132,081 $134,671 $143,330
Chg 30.8% 28.9% 30.3% Up 25-32% 9.1% 14.3% 16.8% 20.5% 21.9% 28.1% 10.4% 11.3% 12.7%
GM% 42.5% 42.5% 42.8% 41.5-43.5% 43.5% 42.5% 43.1% 42.8% 42.4% 42.8% 43.1% 42.6% 43.2%
R&D 5,821 5,821 23-27% Opex 5,995 5,972 23,243 23,197 24,399 24,031
SG&A 1,602 1,602 1,650 1,650 6,397 6,402 6,731 6,717
OpM% 18.8% 18.4% 17.3% 14.5-20.5% 21.2% 20.9% 20.9% 18.1% 18.0% 18.2% 19.5% 19.8% 22.4%
Net Inc. 6,395 6,386 5,850 8,074 8,063 7,646 24,472 24,475 24,584 28,688 28,693 29,801
EPS (NT$) $4.77 $4.77 $4.34 $6.03 $6.02 $5.77 $18.26 $18.26 $18.43 $21.41 $21.41 $22.26 Source: Company data, Bloomberg, Credit Suisse estimates
Key assumption changes:
smartphone volumes slightly
lower after the May-June
dip, tablets revised higher
2Q13 likely at the high-end
of guidance; 3Q13 keeping
estimates for moderate
growth as new products
carry lower blended prices
[email protected] FIRST LAST 08/01/13 09:17:05 AM Allianz Global Investors Taiwan

28 June 2013
MediaTek Inc.
(2454.TW / 2454 TT) 13
Free cash flows remain solid
MediaTek historically has generated solid free cash flows due to its high operating margins
and small requirements for capex only on buildings and engineering tools and now has
built a NT$100 bn cash balance (NT$73/share). The company generated NT$14 bn free
cash flows in 2011 and NT$8.8 bn in 2012, down from the peak NT$54 bn level in 2009
due to the sharp drop those two years in feature phone volumes but we project will
rebound to NT$23 bn in 2013 on improving profitability and smartphone/tablet growth.
Figure 31: Cash flow summary for MediaTek—2003-12, FY13E
Annual (NT$mn) CY03 CY04 CY05 CY06 CY07 CY08 CY09 CY10 CY11 CY12 CY13E CY03-12 Avg
Revenue 38,064 40,054 46,491 52,942 74,779 90,402 115,512 113,522 86,857 99,263 119,662 75,789
Capital spending -292 -1,003 -1,823 -1,987 -1,127 -1,705 -1,574 -2,122 -2,585 -2,268 -918 -1,648
Capex/Revenue (%) 0.8 2.5 3.9 3.8 1.5 1.9 1.4 1.9 3.0 2.3 0.8 2.3
Dep and amort 310 502 946 1,473 1,830 3,295 3,245 2,978 2,729 3,696 3,658 2,101
Depr/Revenue (%) 0.82 1.25 2.04 2.78 2.45 3.64 2.81 2.62 3.14 3.72 3.06 2.53
Operating cash flow 15,943 11,851 23,061 23,343 27,498 35,614 55,250 29,433 16,715 11,026 24,025 24,973
Free cash flow 15,651 10,848 21,239 21,356 26,371 33,910 53,677 27,310 14,130 8,758 23,106 23,325 Source: Company data, Credit Suisse estimates
The company’s free cash flows to enterprise value (based on the current share price) was
3% in 2012 and 7% in 2013. The company declared another NT$9 dividend in 2013,
representing a 2.9% yield, unchanged from last year. Higher earnings at similar 75%
payout range would support a rising dividend yield to 4% in 2014.
Figure 32: Free cash flows and dividend yields for MediaTek, 2003-12, FY13E FCF and Dividend Yields CY03 CY04 CY05 CY06 CY07 CY08 CY09 CY10 CY11 CY12 CY13E CY03-12 Avg
FCF / Share (NT$) 16.49 11.12 21.42 21.10 25.52 32.06 49.86 25.11 12.99 7.37 17.24 22.30
FCF Yield (%) 5.3 3.5 6.8 6.7 8.1 10.2 15.9 8.0 4.1 2.3 5.5 7.1
FCF / EV (%) 5.9 4.1 7.9 8.0 9.9 12.7 20.1 10.2 5.3 3.3 8.6 8.7
Dividend per share (NT$) 8.00 8.50 10.00 11.00 15.00 18.86 13.90 26.00 20.22 9.06 9.00 14.05
Dividend Yield (%) 3.2 5.1 3.4 4.1 2.5 6.6 3.1 8.3 6.4 2.9 2.9 4.6 Source: Company data, Credit Suisse estimates
Mediatek valuation consistent with its range
Mediatek is trading at 17x our revised 2013E EPS (12x ex-cash and interest adjusted
2013 EPS). We reinstate coverage on Mediatek with a target price of NT$400,
representing 20x average 2013E/2014E EPS, in line with its five-year range. Catalysts
include a high season rebound from June sales trough, margin improvement from lower-
cost chipset refreshes in 2H13, design win traction at branded customers and a continued
growth momentum in the space.
Figure 33: Mediatek trading at 17x 2013E EPS (12x ex-cash and interest on the cash)
10x
15x
20x
50
150
250
350
450
550
650
Jul/01 Jul/02 Jul/03 Jul/04 Jul/05 Jul/06 Jul/07 Jul/08 Jul/09 Jul/10 Jul/11 Jul/12 Jul/13
NT$ Mediatek US GAAP PE Band
ccccccccccccccccccccccc
25x
Source: Company data, Credit Suisse Research
Free cash to enterprise
value at 7% in 2013
Mediatek trading at 17x
2013E EPS and 12x ex-
cash EPS
[email protected] FIRST LAST 08/01/13 09:17:05 AM Allianz Global Investors Taiwan

28 June 2013
MediaTek Inc.
(2454.TW / 2454 TT) 14
Investor sentiment is not over-optimistic on Mediatek, with QFII holdings at 50%, sixth
highest among Taiwan tech and below the 61% peak in 2011, and with TSMC and Delta
well over 70%. Our Taiwan strategist Chung Hsu notes that fund flows are in the mid-
range for relative ownership in the IC design sector and points out that IC design is the
second most preferred sector for retail long margin balances in Taiwan after hardware
components at a 12% weighting of long margin vs. a 4% MSCI weighting (see our report).
Retail optimism following the favourable capital gains tax revision could flow into the sector
and Mediatek if retail investment preferences fall in line with history.
Figure 34: Mediatek – QFII ownership still not stretched Figure 35: MTK’s QFII is in the mid-range of its tech peers
0
100
200
300
400
500
600
700
0
10
20
30
40
50
60
70
Jul-0
1
Jan
-02
Jul-0
2
Jan
-03
Jul-0
3
Jan
-04
Jul-0
4
Jan
-05
Jul-0
5
Jan
-06
Jul-0
6
Jan
-07
Jul-0
7
Jan
-08
Jul-0
8
Jan
-09
Jul-0
9
Jan
-10
Jul-1
0
Jan
-11
Jul-1
1
Jan
-12
Jul-1
2
Jan
-13
Share Price (NT$)QFII Holding (%)
MTK Stock Price (NT$) MTK QFII Holding (%)
0%
10%
20%
30%
40%
50%
60%
70%
80%
90%
TS
MC
De
lta
AS
E
Asu
ste
k
Co
mpa
l
Me
dia
tek
Ho
n H
ai
UM
C
Qu
an
ta
HT
C
Ca
tch
er
QFII (%)
Source: TEJ, Company data, Credit Suisse research Source: TEJ, Company data, Credit Suisse research
[email protected] FIRST LAST 08/01/13 09:17:05 AM Allianz Global Investors Taiwan
28 June 2013
MediaTek Inc.
(2454.TW / 2454 TT) 15
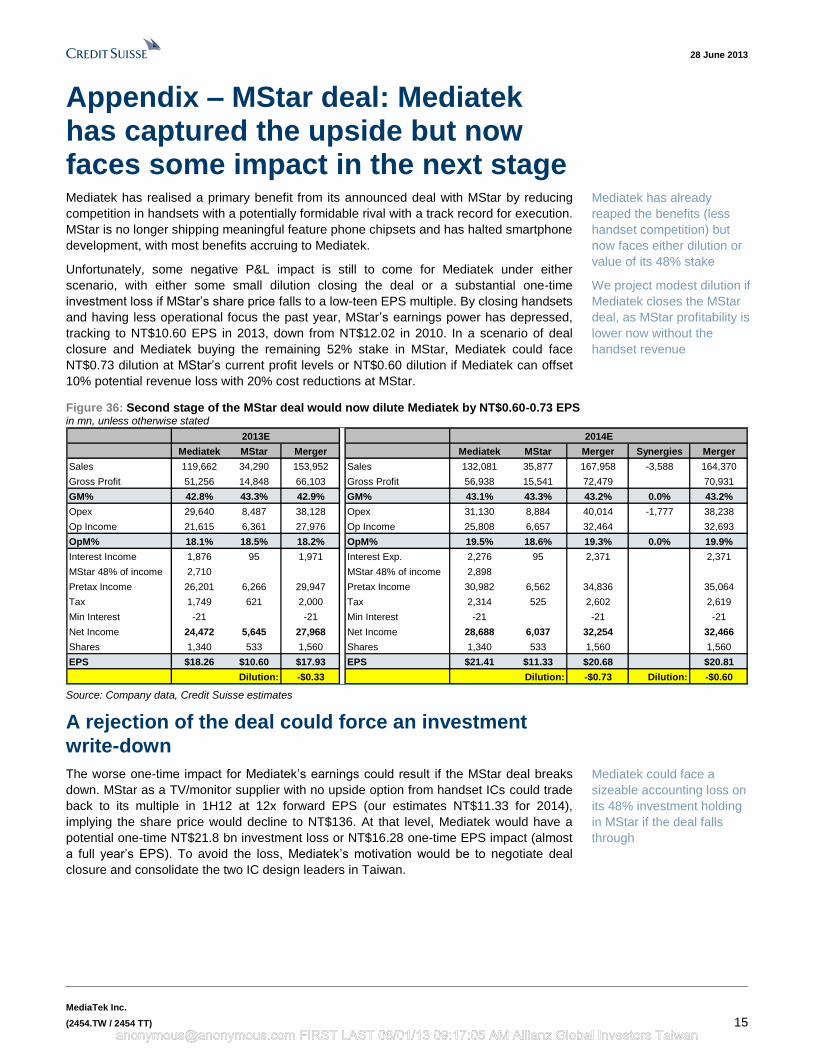
Appendix – MStar deal: Mediatek has captured the upside but now faces some impact in the next stage Mediatek has realised a primary benefit from its announced deal with MStar by reducing
competition in handsets with a potentially formidable rival with a track record for execution.
MStar is no longer shipping meaningful feature phone chipsets and has halted smartphone
development, with most benefits accruing to Mediatek.
Unfortunately, some negative P&L impact is still to come for Mediatek under either
scenario, with either some small dilution closing the deal or a substantial one-time
investment loss if MStar’s share price falls to a low-teen EPS multiple. By closing handsets
and having less operational focus the past year, MStar’s earnings power has depressed,
tracking to NT$10.60 EPS in 2013, down from NT$12.02 in 2010. In a scenario of deal
closure and Mediatek buying the remaining 52% stake in MStar, Mediatek could face
NT$0.73 dilution at MStar’s current profit levels or NT$0.60 dilution if Mediatek can offset
10% potential revenue loss with 20% cost reductions at MStar.
Figure 36: Second stage of the MStar deal would now dilute Mediatek by NT$0.60-0.73 EPS in mn, unless otherwise stated
2013E 2014E Potential investment loss if the deal breaks
Mediatek MStar Merger Mediatek MStar Merger Synergies Merger
Sales 119,662 34,290 153,952 Sales 132,081 35,877 167,958 -3,588 164,370
Gross Profit 51,256 14,848 66,103 Gross Profit 56,938 15,541 72,479 70,931
GM% 42.8% 43.3% 42.9% GM% 43.1% 43.3% 43.2% 0.0% 43.2%
Opex 29,640 8,487 38,128 Opex 31,130 8,884 40,014 -1,777 38,238
Op Income 21,615 6,361 27,976 Op Income 25,808 6,657 32,464 32,693
OpM% 18.1% 18.5% 18.2% OpM% 19.5% 18.6% 19.3% 0.0% 19.9%
Interest Income 1,876 95 1,971 Interest Exp. 2,276 95 2,371 2,371
MStar 48% of income 2,710 MStar 48% of income 2,898
Pretax Income 26,201 6,266 29,947 Pretax Income 30,982 6,562 34,836 35,064
Tax 1,749 621 2,000 Tax 2,314 525 2,602 2,619
Min Interest -21 -21 Min Interest -21 -21 -21
Net Income 24,472 5,645 27,968 Net Income 28,688 6,037 32,254 32,466
Shares 1,340 533 1,560 Shares 1,340 533 1,560 1,560
EPS $18.26 $10.60 $17.93 EPS $21.41 $11.33 $20.68 $20.81
Dilution: -$0.33 Dilution: -$0.73 Dilution: -$0.60 Source: Company data, Credit Suisse estimates
A rejection of the deal could force an investment
write-down
The worse one-time impact for Mediatek’s earnings could result if the MStar deal breaks
down. MStar as a TV/monitor supplier with no upside option from handset ICs could trade
back to its multiple in 1H12 at 12x forward EPS (our estimates NT$11.33 for 2014),
implying the share price would decline to NT$136. At that level, Mediatek would have a
potential one-time NT$21.8 bn investment loss or NT$16.28 one-time EPS impact (almost
a full year’s EPS). To avoid the loss, Mediatek’s motivation would be to negotiate deal
closure and consolidate the two IC design leaders in Taiwan.
Mediatek has already
reaped the benefits (less
handset competition) but
now faces either dilution or
value of its 48% stake
We project modest dilution if
Mediatek closes the MStar
deal, as MStar profitability is
lower now without the
handset revenue
Mediatek could face a
sizeable accounting loss on
its 48% investment holding
in MStar if the deal falls
through
[email protected] FIRST LAST 08/01/13 09:17:05 AM Allianz Global Investors Taiwan
28 June 2013
MediaTek Inc.
(2454.TW / 2454 TT) 16
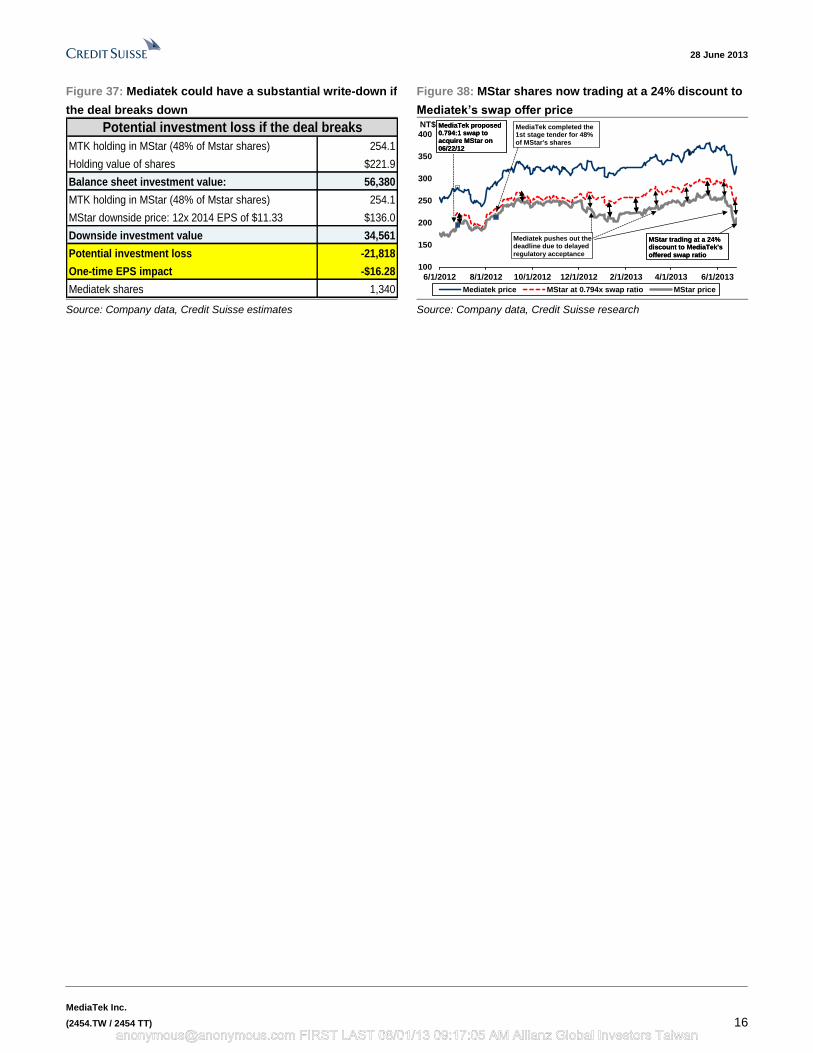
Figure 37: Mediatek could have a substantial write-down if
the deal breaks down
Figure 38: MStar shares now trading at a 24% discount to
Mediatek’s swap offer price
Potential investment loss if the deal breaks
MTK holding in MStar (48% of Mstar shares) 254.1
Holding value of shares $221.9
Balance sheet investment value: 56,380
MTK holding in MStar (48% of Mstar shares) 254.1
MStar downside price: 12x 2014 EPS of $11.33 $136.0
Downside investment value 34,561
Potential investment loss -21,818
One-time EPS impact -$16.28
Mediatek shares 1,340
100
150
200
250
300
350
400
6/1/2012 8/1/2012 10/1/2012 12/1/2012 2/1/2013 4/1/2013 6/1/2013
NT$
Mediatek price MStar at 0.794x swap ratio MStar price
MStar trading at a 24% discount to MediaTek's offered swap ratio
MediaTek proposed 0.794:1 swap to acquire MStar on 06/22/12
MediaTek completed the 1st stage tender for 48% of MStar's shares
MStar trading at a 24% discount to MediaTek's offered swap ratio
MediaTek proposed 0.794:1 swap to acquire MStar on 06/22/12
Mediatek pushes out the deadline due to delayed regulatory acceptance
Source: Company data, Credit Suisse estimates Source: Company data, Credit Suisse research
[email protected] FIRST LAST 08/01/13 09:17:05 AM Allianz Global Investors Taiwan
28 June 2013
MediaTek Inc.
(2454.TW / 2454 TT) 17
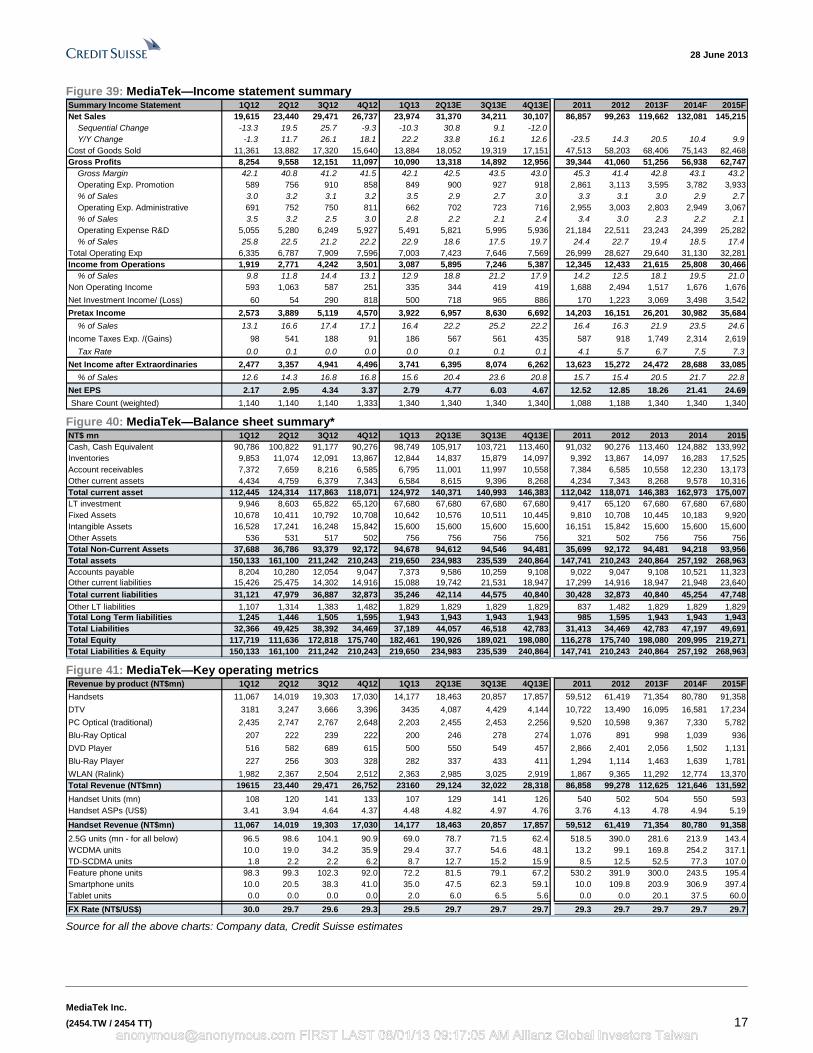
Figure 39: MediaTek—Income statement summary Summary Income Statement 1Q12 2Q12 3Q12 4Q12 1Q13 2Q13E 3Q13E 4Q13E 2011 2012 2013F 2014F 2015F
Net Sales 19,615 23,440 29,471 26,737 23,974 31,370 34,211 30,107 86,857 99,263 119,662 132,081 145,215
Sequential Change -13.3 19.5 25.7 -9.3 -10.3 30.8 9.1 -12.0
Y/Y Change -1.3 11.7 26.1 18.1 22.2 33.8 16.1 12.6 -23.5 14.3 20.5 10.4 9.9
Cost of Goods Sold 11,361 13,882 17,320 15,640 13,884 18,052 19,319 17,151 47,513 58,203 68,406 75,143 82,468
Gross Profits 8,254 9,558 12,151 11,097 10,090 13,318 14,892 12,956 39,344 41,060 51,256 56,938 62,747
Gross Margin 42.1 40.8 41.2 41.5 42.1 42.5 43.5 43.0 45.3 41.4 42.8 43.1 43.2
Operating Exp. Promotion 589 756 910 858 849 900 927 918 2,861 3,113 3,595 3,782 3,933
% of Sales 3.0 3.2 3.1 3.2 3.5 2.9 2.7 3.0 3.3 3.1 3.0 2.9 2.7
Operating Exp. Administrative 691 752 750 811 662 702 723 716 2,955 3,003 2,803 2,949 3,067
% of Sales 3.5 3.2 2.5 3.0 2.8 2.2 2.1 2.4 3.4 3.0 2.3 2.2 2.1
Operating Expense R&D 5,055 5,280 6,249 5,927 5,491 5,821 5,995 5,936 21,184 22,511 23,243 24,399 25,282
% of Sales 25.8 22.5 21.2 22.2 22.9 18.6 17.5 19.7 24.4 22.7 19.4 18.5 17.4
Total Operating Exp 6,335 6,787 7,909 7,596 7,003 7,423 7,646 7,569 26,999 28,627 29,640 31,130 32,281
Income from Operations 1,919 2,771 4,242 3,501 3,087 5,895 7,246 5,387 12,345 12,433 21,615 25,808 30,466
% of Sales 9.8 11.8 14.4 13.1 12.9 18.8 21.2 17.9 14.2 12.5 18.1 19.5 21.0
Non Operating Income 593 1,063 587 251 335 344 419 419 1,688 2,494 1,517 1,676 1,676
Net Investment Income/ (Loss) 60 54 290 818 500 718 965 886 170 1,223 3,069 3,498 3,542
Pretax Income 2,573 3,889 5,119 4,570 3,922 6,957 8,630 6,692 14,203 16,151 26,201 30,982 35,684
% of Sales 13.1 16.6 17.4 17.1 16.4 22.2 25.2 22.2 16.4 16.3 21.9 23.5 24.6
Income Taxes Exp. /(Gains) 98 541 188 91 186 567 561 435 587 918 1,749 2,314 2,619
Tax Rate 0.0 0.1 0.0 0.0 0.0 0.1 0.1 0.1 4.1 5.7 6.7 7.5 7.3
Net Income after Extraordinaries 2,477 3,357 4,941 4,496 3,741 6,395 8,074 6,262 13,623 15,272 24,472 28,688 33,085
% of Sales 12.6 14.3 16.8 16.8 15.6 20.4 23.6 20.8 15.7 15.4 20.5 21.7 22.8
Net EPS 2.17 2.95 4.34 3.37 2.79 4.77 6.03 4.67 12.52 12.85 18.26 21.41 24.69
Share Count (weighted) 1,140 1,140 1,140 1,333 1,340 1,340 1,340 1,340 1,088 1,188 1,340 1,340 1,340
Figure 40: MediaTek—Balance sheet summary* NT$ mn 1Q12 2Q12 3Q12 4Q12 1Q13 2Q13E 3Q13E 4Q13E 2011 2012 2013 2014 2015
Cash, Cash Equivalent 90,786 100,822 91,177 90,276 98,749 105,917 103,721 113,460 91,032 90,276 113,460 124,882 133,992
Inventories 9,853 11,074 12,091 13,867 12,844 14,837 15,879 14,097 9,392 13,867 14,097 16,283 17,525
Account receivables 7,372 7,659 8,216 6,585 6,795 11,001 11,997 10,558 7,384 6,585 10,558 12,230 13,173
Other current assets 4,434 4,759 6,379 7,343 6,584 8,615 9,396 8,268 4,234 7,343 8,268 9,578 10,316
Total current asset 112,445 124,314 117,863 118,071 124,972 140,371 140,993 146,383 112,042 118,071 146,383 162,973 175,007
LT investment 9,946 8,603 65,822 65,120 67,680 67,680 67,680 67,680 9,417 65,120 67,680 67,680 67,680
Fixed Assets 10,678 10,411 10,792 10,708 10,642 10,576 10,511 10,445 9,810 10,708 10,445 10,183 9,920
Intangible Assets 16,528 17,241 16,248 15,842 15,600 15,600 15,600 15,600 16,151 15,842 15,600 15,600 15,600
Other Assets 536 531 517 502 756 756 756 756 321 502 756 756 756
Total Non-Current Assets 37,688 36,786 93,379 92,172 94,678 94,612 94,546 94,481 35,699 92,172 94,481 94,218 93,956
Total assets 150,133 161,100 211,242 210,243 219,650 234,983 235,539 240,864 147,741 210,243 240,864 257,192 268,963
Accounts payable 8,204 10,280 12,054 9,047 7,373 9,586 10,259 9,108 9,022 9,047 9,108 10,521 11,323
Other current liabilities 15,426 25,475 14,302 14,916 15,088 19,742 21,531 18,947 17,299 14,916 18,947 21,948 23,640
Total current liabilities 31,121 47,979 36,887 32,873 35,246 42,114 44,575 40,840 30,428 32,873 40,840 45,254 47,748
Other LT liabilities 1,107 1,314 1,383 1,482 1,829 1,829 1,829 1,829 837 1,482 1,829 1,829 1,829
Total Long Term liabilities 1,245 1,446 1,505 1,595 1,943 1,943 1,943 1,943 985 1,595 1,943 1,943 1,943
Total Liabilities 32,366 49,425 38,392 34,469 37,189 44,057 46,518 42,783 31,413 34,469 42,783 47,197 49,691
Total Equity 117,719 111,636 172,818 175,740 182,461 190,926 189,021 198,080 116,278 175,740 198,080 209,995 219,271
Total Liabilities & Equity 150,133 161,100 211,242 210,243 219,650 234,983 235,539 240,864 147,741 210,243 240,864 257,192 268,963
Figure 41: MediaTek—Key operating metrics Revenue by product (NT$mn) 1Q12 2Q12 3Q12 4Q12 1Q13 2Q13E 3Q13E 4Q13E 2011 2012 2013F 2014F 2015F
Handsets 11,067 14,019 19,303 17,030 14,177 18,463 20,857 17,857 59,512 61,419 71,354 80,780 91,358
DTV 3181 3,247 3,666 3,396 3435 4,087 4,429 4,144 10,722 13,490 16,095 16,581 17,234
PC Optical (traditional) 2,435 2,747 2,767 2,648 2,203 2,455 2,453 2,256 9,520 10,598 9,367 7,330 5,782
Blu-Ray Optical 207 222 239 222 200 246 278 274 1,076 891 998 1,039 936
DVD Player 516 582 689 615 500 550 549 457 2,866 2,401 2,056 1,502 1,131
Blu-Ray Player 227 256 303 328 282 337 433 411 1,294 1,114 1,463 1,639 1,781
WLAN (Ralink) 1,982 2,367 2,504 2,512 2,363 2,985 3,025 2,919 1,867 9,365 11,292 12,774 13,370
Total Revenue (NT$mn) 19615 23,440 29,471 26,752 23160 29,124 32,022 28,318 86,858 99,278 112,625 121,646 131,592
Handset Units (mn) 108 120 141 133 107 129 141 126 540 502 504 550 593
Handset ASPs (US$) 3.41 3.94 4.64 4.37 4.48 4.82 4.97 4.76 3.76 4.13 4.78 4.94 5.19
Handset Revenue (NT$mn) 11,067 14,019 19,303 17,030 14,177 18,463 20,857 17,857 59,512 61,419 71,354 80,780 91,358
2.5G units (mn - for all below) 96.5 98.6 104.1 90.9 69.0 78.7 71.5 62.4 518.5 390.0 281.6 213.9 143.4
WCDMA units 10.0 19.0 34.2 35.9 29.4 37.7 54.6 48.1 13.2 99.1 169.8 254.2 317.1
TD-SCDMA units 1.8 2.2 2.2 6.2 8.7 12.7 15.2 15.9 8.5 12.5 52.5 77.3 107.0
Feature phone units 98.3 99.3 102.3 92.0 72.2 81.5 79.1 67.2 530.2 391.9 300.0 243.5 195.4
Smartphone units 10.0 20.5 38.3 41.0 35.0 47.5 62.3 59.1 10.0 109.8 203.9 306.9 397.4
Tablet units 0.0 0.0 0.0 0.0 2.0 6.0 6.5 5.6 0.0 0.0 20.1 37.5 60.0
FX Rate (NT$/US$) 30.0 29.7 29.6 29.3 29.5 29.7 29.7 29.7 29.3 29.7 29.7 29.7 29.7 Source for all the above charts: Company data, Credit Suisse estimates
[email protected] FIRST LAST 08/01/13 09:17:05 AM Allianz Global Investors Taiwan

28 June 2013
MediaTek Inc.
(2454.TW / 2454 TT) 18
Companies Mentioned (Price as of 27-Jun-2013)
ARM Holdings (ARM.L, 795.0p) Acer Group (2353.TW, NT$21.4) Actions (ACTS.OQ, $2.9) Apple Inc (AAPL.OQ, $398.07) Asustek (2357.TW, NT$272.5) Broadcom Corp. (BRCM.OQ, $33.87) China Mobile Limited (0941.HK, HK$77.85) China Telecom (0728.HK, HK$3.7) China Unicom Hong Kong Ltd (0762.HK, HK$10.06) Datang International Power Generation Co. Ltd. (0991.HK, HK$3.01) Google, Inc. (GOOG.OQ, $873.65) HiSilicon (Unlisted) Hisense Kelon (0921.HK, HK$4.1) Huawei Tech (002502.SZ, Rmb8.36) Imagination Technologies (IMG.L, 295.5p) Intel Corp. (INTC.OQ, $24.01) Lenovo Group Ltd (0992.HK, HK$7.02) Marvell Technology Group Ltd. (MRVL.OQ, $11.73) MediaTek Inc. (2454.TW, NT$328.0, OUTPERFORM, TP NT$400.0) NVIDIA (NVDA.OQ, $14.14) QUALCOMM Inc. (QCOM.OQ, $61.27) RDA Microelectronics (RDA.OQ, $11.65) Realtek Semiconductor (2379.TW, NT$68.5) ST-Ericsson (Unlisted) Samsung Electronics (005930.KS, W1,339,000) Spreadtrum Communication (SPRD.OQ, $26.25) TCL Comm (2618.HK, HK$3.53) ZTE Corporation (0763.HK, HK$12.56)
Disclosure Appendix
Important Global Disclosures
I, Randy Abrams, CFA, certify that (1) the views expressed in this report accurately reflect my personal views about all of the subject companies and securities and (2) no part of my compensation was, is or will be directly or indirectly related to the specific recommendations or views expressed in this report.
3-Year Price and Rating History for MediaTek Inc. (2454.TW)
2454.TW Closing Price Target Price
Date (NT$) (NT$) Rating
02-Jul-10 424.65 475.00 N
28-Jul-10 442.00 440.00
07-Sep-10 472.00 475.00
06-Oct-10 412.50 370.00 U
02-Nov-10 387.50 350.00
08-Mar-11 341.00 315.00
19-Apr-11 309.00 295.00
02-May-11 316.50 315.00 N
23-May-11 310.00 300.00
07-Jun-11 313.50 280.00 U
28-Jul-11 266.00 255.00
07-Sep-11 282.50 260.00
31-Oct-11 318.00 306.00
06-Jan-12 278.50 270.00
04-Apr-12 277.00 300.00 N
30-Apr-12 253.00 260.00
25-Jun-12 280.50 300.00
29-Jun-12 273.00 R
* Asterisk signifies initiation or assumption of coverage.
N EU T RA L
U N D ERPERFO RM
REST RICT ED
The analyst(s) responsible for preparing this research report received Compensation that is based upon various factors including Credit Suisse's total revenues, a portion of which are generated by Credit Suisse's investment banking activities
As of December 10, 2012 Analysts’ stock rating are defined as follows:
Outperform (O) : The stock’s total return is expected to outperform the relevant benchmark*over the next 12 months.
[email protected] FIRST LAST 08/01/13 09:17:05 AM Allianz Global Investors Taiwan

28 June 2013
MediaTek Inc.
(2454.TW / 2454 TT) 19
Neutral (N) : The stock’s total return is expected to be in line with the relevant benchmark* over the next 12 months.
Underperform (U) : The stock’s total return is expected to underperform the relevant benchmark* over the next 12 months.
*Relevant benchmark by region: As of 10th December 2012, Japanese ratings are based on a stock’s tota l return relative to the analyst's coverage universe which consists of all companies covered by the analyst within the relevant sector, with Outperforms representing the most attractiv e, Neutrals the less attractive, and Underperforms the least attractive investment opportunities. As of 2nd October 2012, U.S. and Canadian as well as European ratings are based on a stock’s total return relative to the analyst's coverage universe which consists of all companies covered by the analyst within the relevant sector, with Outperforms representing the most attractive, Neutrals the less attractive, and Underperforms the least attractive investment opportunities. For Latin Ame rican and non-Japan Asia stocks, ratings are based on a stock’s total return relative to the average total return of the relevant country or regional benchmark; Australia, New Zealand are, and prior to 2nd October 2012 U.S. and Canadian ratings were based on (1) a stock’s absolute total return potential to its current share price and (2) the relative attractiveness of a stock’s total return potential within an analyst’s coverage universe. For Australian and New Zealand stocks, 12 -month rolling yield is incorporated in the absolute total return calculation and a 15% and a 7.5% threshold replace the 10-15% level in the Outperform and Underperform stock rating definitions, respectively. The 15% and 7.5% thresholds replace the +10-15% and -10-15% levels in the Neutral stock rating definition, respectively. Prior to 10th December 2012, Japanese ratings we re based on a stock’s total return relative to the average total return of the relevant country or regional benchmark.
Restricted (R) : In certain circumstances, Credit Suisse policy and/or applicable law and regulations preclude certain types of communications, including an investment recommendation, during the course of Credit Suisse's engagement in an investment banking transaction and in certain other circumstances.
Volatility Indicator [V] : A stock is defined as volatile if the stock price has moved up or down by 20% or more in a month in at least 8 of the past 24 months or the analyst expects significant volatility going forward.
Analysts’ sector weightings are distinct from analysts’ stock ratings and are based on the analyst’s expectations for the fundamentals and/or valuation of the sector* relative to the group’s historic fundamentals and/or valuation:
Overweight : The analyst’s expectation for the sector’s fundamentals and/or valuation is favorable over the next 12 months.
Market Weight : The analyst’s expectation for the sector’s fundamentals and/or valuation is neutral over the next 12 months.
Underweight : The analyst’s expectation for the sector’s fundamentals and/or valuation is cautious over the next 12 months.
*An analyst’s coverage sector consists of all companies covered by the analyst within the relevant sector. An analyst may cover multiple sectors.
Credit Suisse's distribution of stock ratings (and banking clients) is:
Global Ratings Distribution
Rating Versus universe (%) Of which banking clients (%)
Outperform/Buy* 43% (53% banking clients)
Neutral/Hold* 39% (49% banking clients)
Underperform/Sell* 15% (38% banking clients)
Restricted 3%
*For purposes of the NYSE and NASD ratings distribution disclosure requirements, our stock ratings of Outperform, Neutral, and Underperform most closely correspond to Buy, Hold, and Sell, respectively; however, the meanings are not the same, as our stock ratings are determined on a relative basis. (Please refer to definitions above.) An investor's decision to buy or sell a security should be based on investment objectives, current holdings, and other individual factors .
Credit Suisse’s policy is to update research reports as it deems appropriate, based on developments with the subject company, the sector or the market that may have a material impact on the research views or opinions stated herein.
Credit Suisse's policy is only to publish investment research that is impartial, independent, clear, fair and not misleading. For more detail please refer to Credit Suisse's Policies for Managing Conflicts of Interest in connection with Investment Research: http://www.csfb.com/research and analytics/disclaimer/managing_conflicts_disclaimer.html
Credit Suisse does not provide any tax advice. Any statement herein regarding any US federal tax is not intended or written to be used, and cannot be used, by any taxpayer for the purposes of avoiding any penalties.
Price Target: (12 months) for MediaTek Inc. (2454.TW)
Method: Our target price of NT$400 for MediaTek is based on a P/E (price-to-earnings) of 20x average 2013/2014E EPS (earnings per share), in line with its five-year historical range.
Risk: Risks that could impede achievement of our NT$400 target price for Mediatek include: (1) share price volatility and potential downside from inventory and demand swings at its emerging market customer base; (2) competition pressuring pricing and margins more than expected; (3) overhang from continued delays in the MStar merger or investment write-down from the deal falling through; and (4) local news and market commentary swinging sentiment, typical for a stock with high retail interest in the Taiwan market.
Please refer to the firm's disclosure website at www.credit-suisse.com/researchdisclosures for the definitions of abbreviations typically used in the target price method and risk sections.
See the Companies Mentioned section for full company names
[email protected] FIRST LAST 08/01/13 09:17:05 AM Allianz Global Investors Taiwan

28 June 2013
MediaTek Inc.
(2454.TW / 2454 TT) 20
The subject company (2454.TW) currently is, or was during the 12-month period preceding the date of distribution of this report, a client of Credit Suisse.
Credit Suisse provided investment banking services to the subject company (2454.TW) within the past 12 months.
Credit Suisse has received investment banking related compensation from the subject company (2454.TW) within the past 12 months
Credit Suisse expects to receive or intends to seek investment banking related compensation from the subject company (2454.TW) within the next 3 months.
As of the end of the preceding month, Credit Suisse beneficially own 1% or more of a class of common equity securities of (2454.TW).
Credit Suisse has a material conflict of interest with the subject company (2454.TW). Credit Suisse is acting as the Joint non-exclusive financial advisor and facilitator to Mediatek on their announced tender offer for Mstar Semiconductor Inc.
Important Regional Disclosures
Singapore recipients should contact Credit Suisse AG, Singapore Branch for any matters arising from this research report.
The analyst(s) involved in the preparation of this report have not visited the material operations of the subject company (2454.TW) within the past 12 months
Restrictions on certain Canadian securities are indicated by the following abbreviations: NVS--Non-Voting shares; RVS--Restricted Voting Shares; SVS--Subordinate Voting Shares.
Individuals receiving this report from a Canadian investment dealer that is not affiliated with Credit Suisse should be advised that this report may not contain regulatory disclosures the non-affiliated Canadian investment dealer would be required to make if this were its own report.
For Credit Suisse Securities (Canada), Inc.'s policies and procedures regarding the dissemination of equity research, please visit http://www.csfb.com/legal_terms/canada_research_policy.shtml.
As of the date of this report, Credit Suisse acts as a market maker or liquidity provider in the equities securities that are the subject of this report.
Principal is not guaranteed in the case of equities because equity prices are variable.
Commission is the commission rate or the amount agreed with a customer when setting up an account or at any time after that.
Taiwanese Disclosures: This research report is for reference only. Investors should carefully consider their own investment risk. Investment results are the responsibility of the individual investor. Reports may not be reprinted without permission of CS. Reports written by Taiwan based analysts on non-Taiwan listed companies are not considered recommendations to buy or sell securities under Taiwan Stock Exchange Operational Regulations Governing Securities Firms Recommending Trades in Securities to Customers.
To the extent this is a report authored in whole or in part by a non-U.S. analyst and is made available in the U.S., the following are important disclosures regarding any non-U.S. analyst contributors: The non-U.S. research analysts listed below (if any) are not registered/qualified as research analysts with FINRA. The non-U.S. research analysts listed below may not be associated persons of CSSU and therefore may not be subject to the NASD Rule 2711 and NYSE Rule 472 restrictions on communications with a subject company, public appearances and trading securities held by a research analyst account.
Credit Suisse (Hong Kong) Limited ................................................................................................................................................... Yan Taw Boon
Credit Suisse AG, Taipei Securities Branch ............................................................................................................................ Randy Abrams, CFA
For Credit Suisse disclosure information on other companies mentioned in this report, please visit the website at www.credit-suisse.com/researchdisclosures or call +1 (877) 291-2683.
[email protected] FIRST LAST 08/01/13 09:17:05 AM Allianz Global Investors Taiwan
28 June 2013
MediaTek Inc.
(2454.TW / 2454 TT) 21
References in this report to Credit Suisse include all of the subsidiaries and affiliates of Credit Suisse operating under its investment banking division. For more information on our structure, please use the following link: https://www.credit-suisse.com/who_we_are/en/.This report may contain material that is not directed to, or intended for distribution to or use by, any person or entity who is a citizen or resident of or located in any locality, state, country or other jurisdiction where such distribution, publication, availability or use would be contrary to law or regulation or which would subject Credit Suisse AG or its affiliates ("CS") to any registration or licensing requirement within such jurisdiction. All material presented in this report, unless specifically indicated otherwise, is under copyright to CS. None of the material, nor its content, nor any copy of it, may be altered in any way, transmitted to, copied or distributed to any other party, without the prior express written permission of CS. All trademarks, service marks and logos used in this report are trademarks or service marks or registered trademarks or service marks of CS or its affiliates. The information, tools and material presented in this report are provided to you for information purposes only and are not to be used or considered as an offer or the solicitation of an offer to sell or to buy or subscribe for securities or other financial instruments. CS may not have taken any steps to ensure that the securities referred to in this report are suitable for any particular investor. CS will not treat recipients of this report as its customers by virtue of their receiving this report. The investments and services contained or referred to in this report may not be suitable for you and it is recommended that you consult an independent investment advisor if you are in doubt about such investments or investment services. Nothing in this report constitutes investment, legal, accounting or tax advice, or a representation that any investment or strategy is suitable or appropriate to your individual circumstances, or otherwise constitutes a personal recommendation to you. CS does not advise on the tax consequences of investments and you are advised to contact an independent tax adviser. Please note in particular that the bases and levels of taxation may change. Information and opinions presented in this report have been obtained or derived from sources believed by CS to be reliable, but CS makes no representation as to their accuracy or completeness. CS accepts no liability for loss arising from the use of the material presented in this report, except that this exclusion of liability does not apply to the extent that such liability arises under specific statutes or regulations applicable to CS. This report is not to be relied upon in substitution for the exercise of independent judgment. CS may have issued, and may in the future issue, other communications that are inconsistent with, and reach different conclusions from, the information presented in this report. Those communications reflect the different assumptions, views and analytical methods of the analysts who prepared them and CS is under no obligation to ensure that such other communications are brought to the attention of any recipient of this report. CS may, to the extent permitted by law, participate or invest in financing transactions with the issuer(s) of the securities referred to in this report, perform services for or solicit business from such issuers, and/or have a position or holding, or other material interest, or effect transactions, in such securities or options thereon, or other investments related thereto. In addition, it may make markets in the securities mentioned in the material presented in this report. CS may have, within the last three years, served as manager or co-manager of a public offering of securities for, or currently may make a primary market in issues of, any or all of the entities mentioned in this report or may be providing, or have provided within the previous 12 months, significant advice or investment services in relation to the investment concerned or a related investment. Additional information is, subject to duties of confidentiality, available on request. Some investments referred to in this report will be offered solely by a single entity and in the case of some investments solely by CS, or an associate of CS or CS may be the only market maker in such investments. Past performance should not be taken as an indication or guarantee of future performance, and no representation or warranty, express or implied, is made regarding future performance. Information, opinions and estimates contained in this report reflect a judgment at its original date of publication by CS and are subject to change without notice. The price, value of and income from any of the securities or financial instruments mentioned in this report can fall as well as rise. The value of securities and financial instruments is subject to exchange rate fluctuation that may have a positive or adverse effect on the price or income of such securities or financial instruments. Investors in securities such as ADR's, the values of which are influenced by currency volatility, effectively assume this risk. Structured securities are complex instruments, typically involve a high degree of risk and are intended for sale only to sophisticated investors who are capable of understanding and assuming the risks involved. The market value of any structured security may be affected by changes in economic, financial and political factors (including, but not limited to, spot and forward interest and exchange rates), time to maturity, market conditions and volatility, and the credit quality of any issuer or reference issuer. Any investor interested in purchasing a structured product should conduct their own investigation and analysis of the product and consult with their own professional advisers as to the risks involved in making such a purchase. Some investments discussed in this report may have a high level of volatility. High volatility investments may experience sudden and large falls in their value causing losses when that investment is realised. Those losses may equal your original investment. Indeed, in the case of some investments the potential losses may exceed the amount of initial investment and, in such circumstances, you may be required to pay more money to support those losses. Income yields from investments may fluctuate and, in consequence, initial capital paid to make the investment may be used as part of that income yield. Some investments may not be readily realisable and it may be difficult to sell or realise those investments, similarly it may prove difficult for you to obtain reliable information about the value, or risks, to which such an investment is exposed. This report may provide the addresses of, or contain hyperlinks to, websites. Except to the extent to which the report refers to website material of CS, CS has not reviewed any such site and takes no responsibility for the content contained therein. Such address or hyperlink (including addresses or hyperlinks to CS's own website material) is provided solely for your convenience and information and the content of any such website does not in any way form part of this document. Accessing such website or following such link through this report or CS's website shall be at your own risk. This report is issued and distributed in Europe (except Switzerland) by Credit Suisse Securities (Europe) Limited, One Cabot Square, London E14 4QJ, England, which is authorised by the Prudential Regulation Authority ("PRA") and regulated by the Financial Conduct Authority ("FCA") and the PRA. This report is being distributed in the United States and Canada by Credit Suisse Securities (USA) LLC; in Switzerland by Credit Suisse AG; in Brazil by Banco de Investimentos Credit Suisse (Brasil) S.A or its affiliates; in Mexico by Banco Credit Suisse (México), S.A. (transactions related to the securities mentioned in this report will only be effected in compliance with applicable regulation); in Japan by Credit Suisse Securities (Japan) Limited, Financial Instruments Firm, Director-General of Kanto Local Finance Bureau (Kinsho) No. 66, a member of Japan Securities Dealers Association, The Financial Futures Association of Japan, Japan Investment Advisers Association, Type II Financial Instruments Firms Association; elsewhere in Asia/ Pacific by whichever of the following is the appropriately authorised entity in the relevant jurisdiction: Credit Suisse (Hong Kong) Limited, Credit Suisse Equities (Australia) Limited, Credit Suisse Securities (Thailand) Limited, having registered address at 990 Abdulrahim Place, 27 Floor, Unit 2701, Rama IV Road, Silom, Bangrak, Bangkok 10500, Thailand, Tel. +66 2614 6000, Credit Suisse Securities (Malaysia) Sdn Bhd, Credit Suisse AG, Singapore Branch, Credit Suisse Securities (India) Private Limited regulated by the Securities and Exchange Board of India (registration Nos. INB230970637; INF230970637; INB010970631; INF010970631), having registered address at 9th Floor, Ceejay House, Dr.A.B. Road, Worli, Mumbai - 18, India, T- +91-22 6777 3777, Credit Suisse Securities (Europe) Limited, Seoul Branch, Credit Suisse AG, Taipei Securities Branch, PT Credit Suisse Securities Indonesia, Credit Suisse Securities (Philippines ) Inc., and elsewhere in the world by the relevant authorised affiliate of the above. Research on Taiwanese securities produced by Credit Suisse AG, Taipei Securities Branch has been prepared by a registered Senior Business Person. Research provided to residents of Malaysia is authorised by the Head of Research for Credit Suisse Securities (Malaysia) Sdn Bhd, to whom they should direct any queries on +603 2723 2020. This report has been prepared and issued for distribution in Singapore to institutional investors, accredited investors and expert investors (each as defined under the Financial Advisers Regulations) only, and is also distributed by Credit Suisse AG, Singapore branch to overseas investors (as defined under the Financial Advisers Regulations). By virtue of your status as an institutional investor, accredited investor, expert investor or overseas investor, Credit Suisse AG, Singapore branch is exempted from complying with certain compliance requirements under the Financial Advisers Act, Chapter 110 of Singapore (the "FAA"), the Financial Advisers Regulations and the relevant Notices and Guidelines issued thereunder, in respect of any financial advisory service which Credit Suisse AG, Singapore branch may provide to you. This research may not conform to Canadian disclosure requirements. In jurisdictions where CS is not already registered or licensed to trade in securities, transactions will only be effected in accordance with applicable securities legislation, which will vary from jurisdiction to jurisdiction and may require that the trade be made in accordance with applicable exemptions from registration or licensing requirements. Non-U.S. customers wishing to effect a transaction should contact a CS entity in their local jurisdiction unless governing law permits otherwise. U.S. customers wishing to effect a transaction should do so only by contacting a representative at Credit Suisse Securities (USA) LLC in the U.S. Please note that this research was originally prepared and issued by CS for distribution to their market professional and institutional investor customers. Recipients who are not market professional or institutional investor customers of CS should seek the advice of their independent financial advisor prior to taking any investment decision based on this report or for any necessary explanation of its contents. This research may relate to investments or services of a person outside of the UK or to other matters which are not authorised by the PRA and regulated by the FCA and the PRA or in respect of which the protections of the PRA and FCA for private customers and/or the UK compensation scheme may not be available, and further details as to where this may be the case are available upon request in respect of this report. CS may provide various services to US municipal entities or obligated persons ("municipalities"), including suggesting individual transactions or trades and entering into such transactions. Any services CS provides to municipalities are not viewed as "advice" within the meaning of Section 975 of the Dodd-Frank Wall Street Reform and Consumer Protection Act. CS is providing any such services and related information solely on an arm's length basis and not as an advisor or fiduciary to the municipality. In connection with the provision of the any such services, there is no agreement, direct or indirect, between any municipality (including the officials, management, employees or agents thereof) and CS for CS to provide advice to the municipality. Municipalities should consult with their financial, accounting and legal advisors regarding any such services provided by CS. In addition, CS is not acting for direct or indirect compensation to solicit the municipality on behalf of an unaffiliated broker, dealer, municipal securities dealer, municipal advisor, or investment adviser for the purpose of obtaining or retaining an engagement by the municipality for or in connection with Municipal Financial Products, the issuance of municipal securities, or of an investment adviser to provide investment advisory services to or on behalf of the municipality. If this report is being distributed by a financial institution other than Credit Suisse AG, or its affiliates, that financial institution is solely responsible for distribution. Clients of that institution should contact that institution to effect a transaction in the securities mentioned in this report or require further information. This report does not constitute investment advice by Credit Suisse to the clients of the distributing financial institution, and neither Credit Suisse AG, its affiliates, and their respective officers, directors and employees accept any liability whatsoever for any direct or consequential loss arising from their use of this report or its content. Principal is not guaranteed. Commission is the commission rate or the amount agreed with a customer when setting up an account or at any time after that.
Copyright © 2013 CREDIT SUISSE AG and/or its affiliates. All rights reserved.
Investment principal on bonds can be eroded depending on sale price or market price. In addition, there are bonds on which investment principal can be eroded due to changes in redemption amounts. Care is required when investing in such instruments.
When you purchase non-listed Japanese fixed income securities (Japanese government bonds, Japanese municipal bonds, Japanese government guaranteed bonds, Japanese corporate bonds) from CS as a seller, you will be requested to pay the purchase price only.
TC1866.doc
[email protected] FIRST LAST 08/01/13 09:17:05 AM Allianz Global Investors Taiwan


![Serie MTK · × ln[A] Arranque en caliente Tiempo de disparo Minutos Segundos Múltiplos de la corriente ajustada Serie MTK MTK-400/3K Clase 10 MTK-800/3K Clase 10 MTK-800/3K ...](https://static.fdocuments.net/doc/165x107/5b50112d7f8b9a2a6e8d9207/serie-mtk-lna-arranque-en-caliente-tiempo-de-disparo-minutos-segundos-multiplos.jpg)


