2013 SCORE Report - Minnesota Pollution Control Agency · A snap shot of 2013 SCORE data, ......
76
Report on 2013 SCORE Programs A summary of recycling and waste management in Minnesota February 2015
Transcript of 2013 SCORE Report - Minnesota Pollution Control Agency · A snap shot of 2013 SCORE data, ......
Report on 2013 SCORE Programs
A summary of recycling and waste management in Minnesota
February 2015
Legislative charge In 1989, the Legislature adopted comprehensive waste reduction and recycling legislation based on recommendations of the Governor’s Select Committee on Recycling and the Environment (SCORE). This set of laws, Minn. Stat. § 115A.551-115A.557, commonly referred to as SCORE, initiated a stable source of state funding for recycling programs, as well as waste reduction and the improved management of household hazardous wastes, yard waste, and problem materials. SCORE legislation provides grant dollars, along with funding to counties and local government for long-term flexible programs.
Authors Arlene Vee, MPCA
Contributors/acknowledgements Anna Kerr, MPCA Garth Hickle, MPCA Tim Farnan, MPCA Mark Rust, MPCA Peder Sandhei, MPCA
Editing and graphic design PIO staff Graphic design staff Administrative Staff
The MPCA is reducing printing and mailing costs by using the Internet to distribute reports and information to wider audience. Visit our website for more information.
MPCA reports are printed on 100% post-consumer recycled content paper manufactured without chlorine or chlorine derivatives.
Minnesota Pollution Control Agency 520 Lafayette Road North | Saint Paul, MN 55155-4194 | www.pca.state.mn.us | 651-296-6300
Toll free 800-657-3864 | TTY 651-282-5332
This report is available in alternative formats upon request, and online at www.pca.state.mn.us .
Document number: w-sw1-30
“Problem materials not recycled” (PMNR) includes five materials that have been banned from disposal in Minnesota (vehicle batteries, tires, major appliances, motor oil, and oil filters). The PMNR number is that portion of the materials that is not recycled, but is assumed to be disposed of somewhere else, legally or not, as they are banned from MSW disposal facilities. It is assumed that they are not being counted in landfill or incinerator tonnages.
SCORE background In 1989, the Governor’s Select Committee on Recycling and the Environment (SCORE) recommended to the Legislature to adopt a comprehensive set of laws, commonly referred to as SCORE. This act initiated a state funding source for recycling programs, as well as waste reduction, management of household hazardous wastes, and problem materials. SCORE legislation and grant dollars, along with funding from counties and local government, provide the basis for long-term, flexible programs.
This Report on 2013 SCORE Programs summarizes information submitted by all 87 counties and the Western Lake Superior Sanitary District (WLSSD) on waste management efforts, including funding and costs, waste reduction activities, recycling, composting, household hazardous waste programs, problem materials collection, and waste processing and disposal. This information is used to calculate the state’s recycling rates and the cost of managing waste and recycling. The report and information on SCORE programs are available at http://www.pca.state.mn.us/score.
1989 was the first year the Minnesota Pollution Control Agency (MPCA) collected data, and in 1991 counties began collecting data on a calendar year basis, instead of a fiscal year. By year 1991 the collection and format had greatly improved, making the quality of the data better. Since then, SCORE reporting was placed on-line for easier reporting by the counties and management by the State.
In 2007 Legislation Law (Chapter 37, Article 1, Section 62 (1,2) requiring the MPCA in consultation with the Association of Minnesota Counties (AMC), the Solid Waste Administrators Association (SWAA), the Solid Waste Management Coordinating Board (SWMCB), and other interested parties to make recommendations that improve and abbreviate SCORE reporting.
The MPCA’s first step was in abbreviating the online 2009 SCORE reporting by preloading previous year data and eliminating some survey questions, along with consolidating expense reporting. The second step will begin in 2015 (Reporting year 2014) SCORE will be entered online and tracked through ReTRAC software. This moves the MPCA to facility reporting through its permit process. As an effort to relieve the burden from counties and to ensure that there is less estimation, the entities directly in charge of the waste will also be reporting. The MPCA continues to work with the hauling community to develop a data reporting mechanism that will provide information regarding transport of Municipal Solid Waste (MSW), recyclables, and organics from generation to facility. A standard reporting form has been developed at the request of the haulers in order to simplify the reporting that haulers currently provide to counties. Counties will continue to be responsible for any data that they handle directly, such as drop-off events and materials handled outside of the traditional hauling system. The MPCA will be scheduling a training opportunity and the information for that training will be sent out through the SWAA, Counties Involved in Source Reduction and Recycling (CISRR), and Association of Minnesota Recyclers Managers. (MPCA Contact: Peder Sandhei)
The MPCA uses SCORE information to detail trends in waste generation and disposal. The MPCA Strategic Plan, 2013 to 2017, set a vision that Minnesota’s land supports healthy ecosystems and sustainable land uses. To reach this vision, solid waste is to be managed to conserve materials, resources and energy; by ensuring waste is reduced, recycling and organic recovery is increased, resource recovery capacity is maintained, and landfilling is reduced.
Contents Legislative charge .......................................................................................................................................... 2
Authors .......................................................................................................................................................... 2
Contributors/acknowledgements ................................................................................................................. 2
Editing and graphic design ............................................................................................................................ 2
SCORE background ........................................................................................................................................ 1
Contents ........................................................................................................................................................ 2
Summary report .................................................................................................................................................... 1
Minnesota counties diverted 68% of its waste from landfills .............................................................................. 1
MSW generation in Minnesota ............................................................................................................................. 2
Per capita MSW generation .................................................................................................................................. 5
Recycling and composting .................................................................................................................................... 6
Materials collected for composting and recycling: tons and trends .................................................................... 7
MSW processing and disposal .............................................................................................................................. 9
Resource recovery and landfilling ......................................................................................................................... 9
Illegal on-site disposal and problem materials not recycled .............................................................................. 10
Problem materials not recycled .......................................................................................................................... 12
SCORE funding .................................................................................................................................................... 12
2014 activities ..................................................................................................................................................... 13
SCORE reporting .......................................................................................................................................... 13
SCORE audit ................................................................................................................................................ 14
Source separated organic composting rule change .................................................................................... 14
Paint stewardship ....................................................................................................................................... 14
2014 Legislation .......................................................................................................................................... 15
MPCA Solid Waste Policy Report ................................................................................................................ 15
Appendix A: County Score Survey Responses ............................................................................................ 16
Summary report A snap shot of 2013 SCORE data, is showing less waste is being burnt or buried illegally onsite, more MSW waste is being sent to surrounding states, reversing the trend we have seen since 2005. This shift is showing an increase to North Dakota landfills and Wisconsin landfills and waste to energy facility. However, contrary to this less waste is going to Iowa landfills from Minnesota.
In 2013, MSW generation saw an increase of 1.5% from 2012. This increase was seen in the amount recycled and processed at Waste to Energy (WTE) facilities, not disposed of at landfills.
· Recycling decreased by 0.3% · Organics increased by 44% · WTE increased by 1% · Landfilling decreased by 1%
The tonnage of recyclables collected increased slightly in 2013 compared to 2012 however, there were declines in the amount of material captured for a number of materials types including glass, paper, plastic and textiles. That dynamic, in combination with the increase in overall generation resulted in a decline in the percentage of traditional recyclables captured. Organics collection increased by 44% therefore, the combined recycling rate-including organics and traditional recyclables and it did increase.
A portion of the increase in organics can be attributed to expanded collections of SSOC; however, a substantial portion is due to reporting practices. 2013 is the first year that counties were asked to track and report yard waste. In previous year’s yard waste was not documented through SCORE reporting, credits up to 5% were added to recycling rates dependent on county programs.
The amount of dollars spent to implement the county programs increased by 3.5% from 2012. In 2013, 78% of the costs were funded with county funds. SCORE Disbursement dollars covered only 22% of county program costs. 2014 Legislation increased these funds for Fiscal Year 2015 with a one-time $4 million dollars. Beginning in Fiscal Year 2016, an additional $3 million will be added to the annual base funding for SCORE grants. These additional funds are to assist counties with waste reuse, reduction, and recycling efforts. The Metropolitan Area counties must use half of these new funds for composting activities.
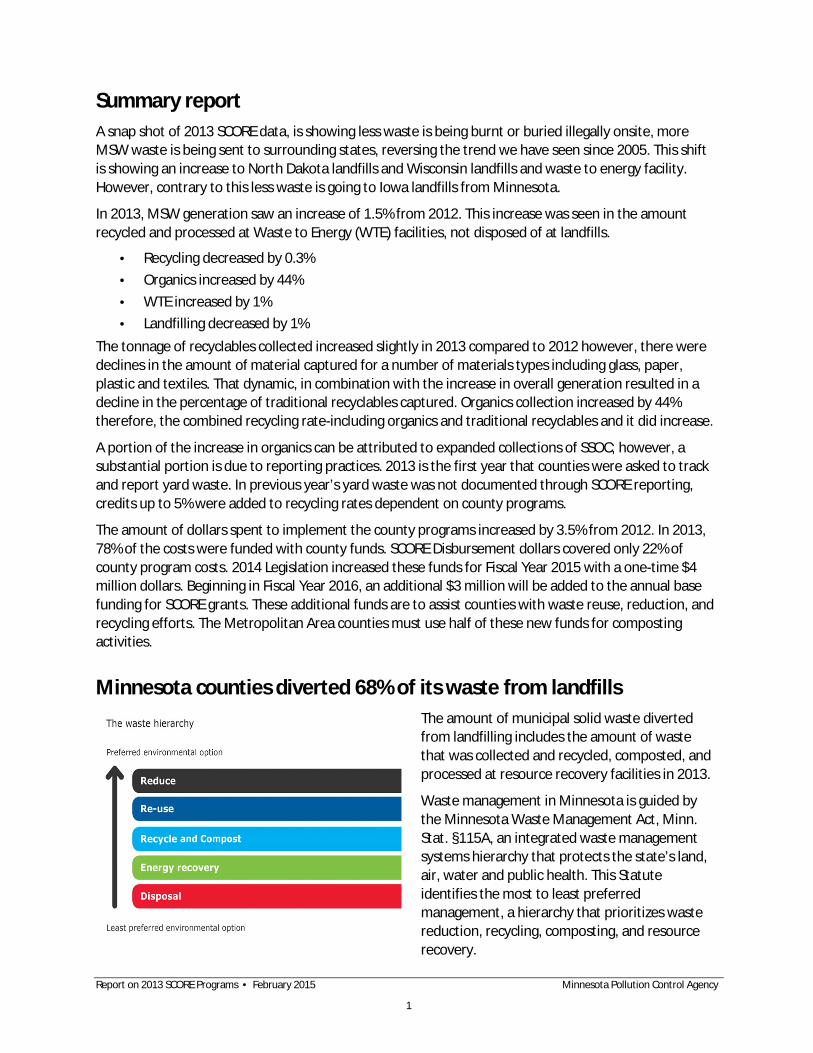
Minnesota counties diverted 68% of its waste from landfills The amount of municipal solid waste diverted from landfilling includes the amount of waste that was collected and recycled, composted, and processed at resource recovery facilities in 2013.
Waste management in Minnesota is guided by the Minnesota Waste Management Act, Minn. Stat. §115A, an integrated waste management systems hierarchy that protects the state’s land, air, water and public health. This Statute identifies the most to least preferred management, a hierarchy that prioritizes waste reduction, recycling, composting, and resource recovery.
Report on 2013 SCORE Programs • February 2015 Minnesota Pollution Control Agency
1
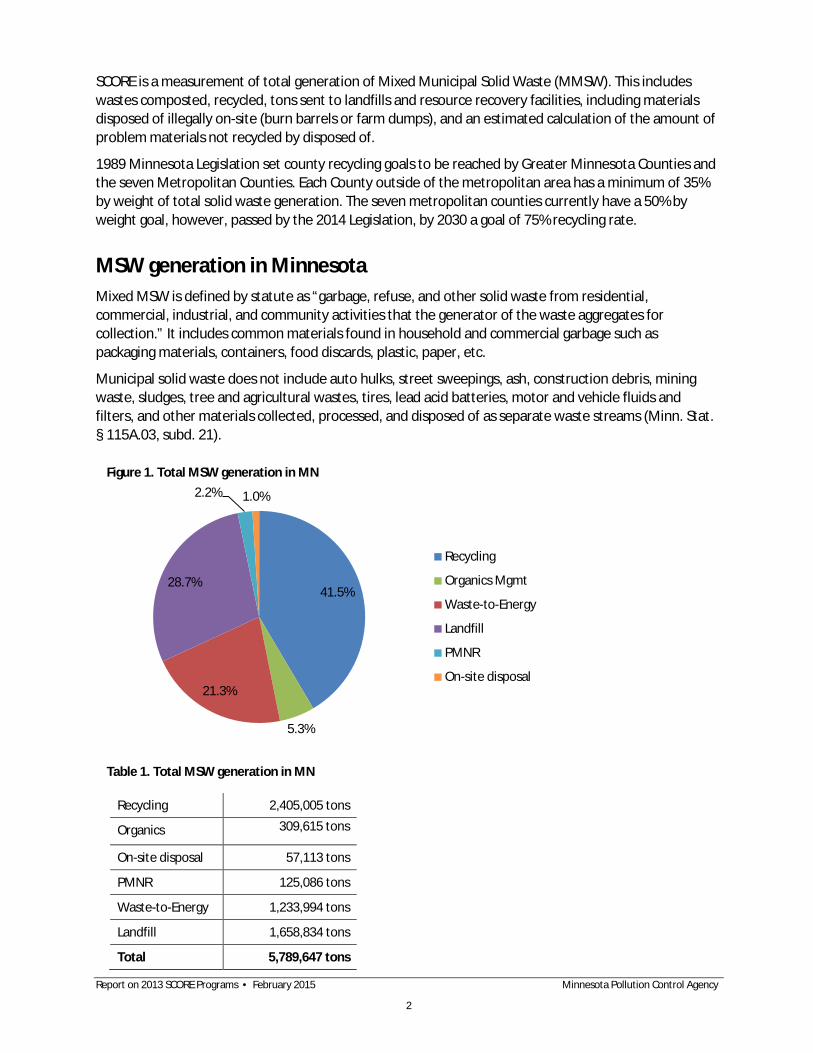
SCORE is a measurement of total generation of Mixed Municipal Solid Waste (MMSW). This includes wastes composted, recycled, tons sent to landfills and resource recovery facilities, including materials disposed of illegally on-site (burn barrels or farm dumps), and an estimated calculation of the amount of problem materials not recycled by disposed of.
1989 Minnesota Legislation set county recycling goals to be reached by Greater Minnesota Counties and the seven Metropolitan Counties. Each County outside of the metropolitan area has a minimum of 35% by weight of total solid waste generation. The seven metropolitan counties currently have a 50% by weight goal, however, passed by the 2014 Legislation, by 2030 a goal of 75% recycling rate.
MSW generation in Minnesota Mixed MSW is defined by statute as “garbage, refuse, and other solid waste from residential, commercial, industrial, and community activities that the generator of the waste aggregates for collection.” It includes common materials found in household and commercial garbage such as packaging materials, containers, food discards, plastic, paper, etc.
Municipal solid waste does not include auto hulks, street sweepings, ash, construction debris, mining waste, sludges, tree and agricultural wastes, tires, lead acid batteries, motor and vehicle fluids and filters, and other materials collected, processed, and disposed of as separate waste streams (Minn. Stat. § 115A.03, subd. 21).
Recycling 2,405,005 tons
Organics 309,615 tons
On-site disposal 57,113 tons
PMNR 125,086 tons
Waste-to-Energy 1,233,994 tons
Landfill 1,658,834 tons
Total 5,789,647 tons
Figure 1. Total MSW generation in MN
Table 1. Total MSW generation in MN
41.5%
5.3%
21.3%
28.7%
2.2% 1.0%
Recycling
Organics Mgmt
Waste-to-Energy
Landfill
PMNR
On-site disposal
Report on 2013 SCORE Programs • February 2015 Minnesota Pollution Control Agency
2
Landfills are sited in Greater Minnesota, scattered throughout the State. Locations of these landfills are in rural and remote areas, closer to and used by Greater Minnesota Counties for disposal. Resource Recovery Facilities are also located in Greater Minnesota Counties; however, in larger populace areas and municipalities, are designed mainly to process the waste that is generated by that area, with limited capacity.
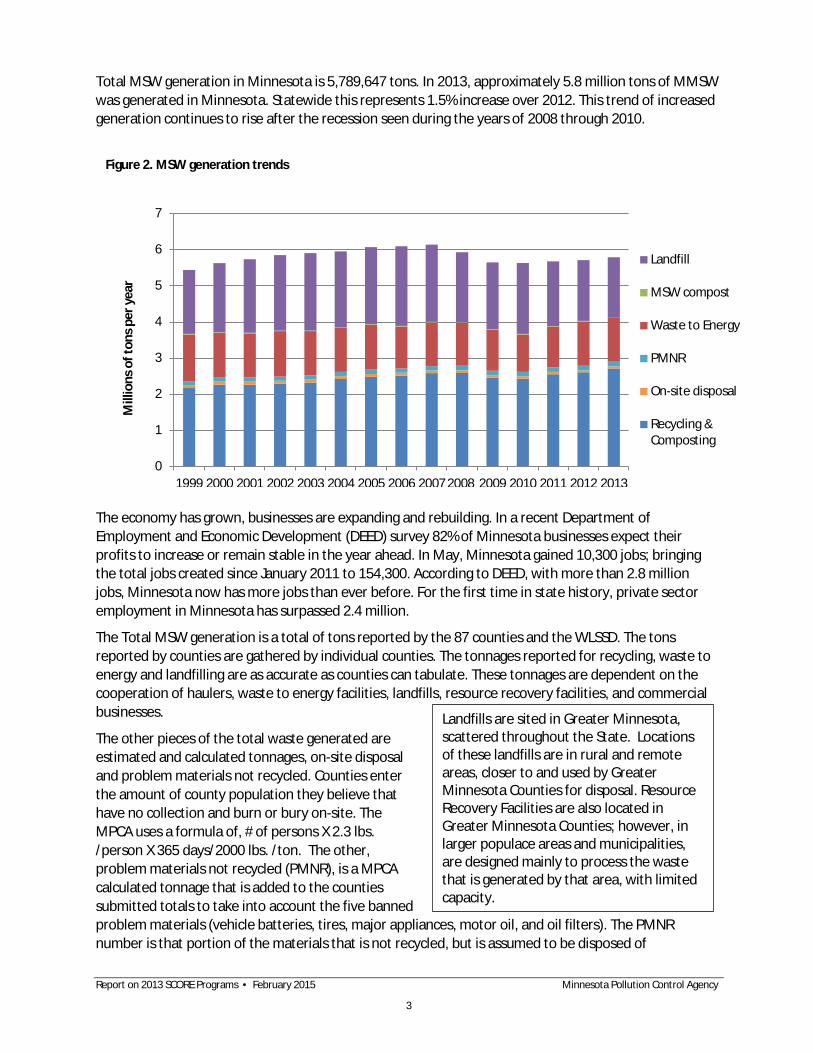
Total MSW generation in Minnesota is 5,789,647 tons. In 2013, approximately 5.8 million tons of MMSW was generated in Minnesota. Statewide this represents 1.5% increase over 2012. This trend of increased generation continues to rise after the recession seen during the years of 2008 through 2010.
The economy has grown, businesses are expanding and rebuilding. In a recent Department of Employment and Economic Development (DEED) survey 82% of Minnesota businesses expect their profits to increase or remain stable in the year ahead. In May, Minnesota gained 10,300 jobs; bringing the total jobs created since January 2011 to 154,300. According to DEED, with more than 2.8 million jobs, Minnesota now has more jobs than ever before. For the first time in state history, private sector employment in Minnesota has surpassed 2.4 million.
The Total MSW generation is a total of tons reported by the 87 counties and the WLSSD. The tons reported by counties are gathered by individual counties. The tonnages reported for recycling, waste to energy and landfilling are as accurate as counties can tabulate. These tonnages are dependent on the cooperation of haulers, waste to energy facilities, landfills, resource recovery facilities, and commercial businesses.
The other pieces of the total waste generated are estimated and calculated tonnages, on-site disposal and problem materials not recycled. Counties enter the amount of county population they believe that have no collection and burn or bury on-site. The MPCA uses a formula of, # of persons X 2.3 lbs. /person X 365 days/2000 lbs. /ton. The other, problem materials not recycled (PMNR), is a MPCA calculated tonnage that is added to the counties submitted totals to take into account the five banned problem materials (vehicle batteries, tires, major appliances, motor oil, and oil filters). The PMNR number is that portion of the materials that is not recycled, but is assumed to be disposed of
Figure 2. MSW generation trends
0
1
2
3
4
5
6
7
1999 2000 2001 2002 2003 2004 2005 2006 2007 2008 2009 2010 2011 2012 2013
Mill
ions
of t
ons p
er y
ear
Landfill
MSW compost
Waste to Energy
PMNR
On-site disposal
Recycling &Composting
Report on 2013 SCORE Programs • February 2015 Minnesota Pollution Control Agency
3

somewhere else, legally or not, as they are banned from MSW disposal facilities. It is assumed that they are not being counted in landfill or incinerator tonnages.
Greater Minnesota has a total population of 2.5 million compared to 5.4 million statewide; with an estimated 96,064 people that live outside of municipalities and are thought to have no collection services available. It is estimated 56,832 tons of MSW is being burnt or buried on-site. In comparison, the Metropolitan Area has a population of 2.9 million, with an estimated 670 people that are thought to burn and bury approximately 281 tons of MSW onsite. Recycling per capita in Greater Minnesota populace is 2.1 tons, and in the Metropolitan Area it is 1.9 tons.
Figure 3. Greater MN MSW generation
Recycling 1,011,470.42
Organics 158,638.00
On-site disposal 56,831.63
PMNR 51,614.66
Waste-to-Energy 325,359.22
Landfill 945,092.81
Total Greater MN MSW generation
2,549,007.00
Table 2. Greater MN MSW generation
39.7%
6.2% 12.8%
37.1%
2.0% 2.2%
Recycling
Organics Mgmt
Waste-to-Energy
Landfill
PMNR
On-site disposal
Report on 2013 SCORE Programs • February 2015 Minnesota Pollution Control Agency
4

Per capita MSW generation In order to determine if the amount of waste created each year is from an increase in population or an increase in consumption, the MPCA calculates the amount of waste generated by the current population.
In 2013, the Minnesota per capita rate increased to 1.07 tons per person (2,137 Pounds/person/year or an increase of 0.4% from 2012). This is consistent with Minnesota growing economy and low unemployment.
Minnesota population increased to 5.4 million, or by 0.9% from 2012. The Twin Cities Metropolitan area increased to 2.9 million people (1.4% increase) compared to Greater Minnesota increase to 2.5 million people (0.3% increase).
To further determine where the increase of the amount of waste is we examine Greater Minnesota versus Metropolitan area per capita rate. Greater Minnesota per capita rate is 1.03 Tons (2,067 Pounds/person/year), an increase of approximately 28 pounds/person/year from 2012. Metropolitan Area’s per capita rate is 1.098 Tons (2,196 pounds/person/year), a decrease of approximately 9 pounds/person/year from 2012.
Figure 4. Metropolitan MSW generation
Recycling 1,393,531.67
Organics 150,980.00
On-site disposal 281.23
PMNR 73,471.15
WTE 908,635.64
Landfilled 713,741.26
Total Metropolitan MSW Generation
3,240,640.95
Table 3. Metropolitan MSW generation
43.0%
4.7%
28.0%
22.0%
2.3% 0.0%
Recycling
Organics Mgmt
Waste-to-Energy
Landfill
PMNR
On-site disposal
Report on 2013 SCORE Programs • February 2015 Minnesota Pollution Control Agency
5
Recycling and composting In 2013, Minnesota’s combined recycling and composting rate increased to 46.9%, from 2012s recycling rate of 45.6%. Minnesota’s recycling programs are among the Nation’s most successful. In 2013, over 2.7 tons were recycled, and composted and recycled, an increase of over 108,193 tons.
The role organics recycling programs play in influencing the overall recycling rate is increasingly important. To meet legislative goals for recycling both traditional recyclables and organics will need to be captured more effectively in the future. As such, there is value in tracking both categories independently so performance of both types of recycling can be monitored. Recycling of items like glass, paper, plastic and textiles appears to have declined in 2013. In pulling out the 309,615 tons of organic waste that was recovered through Food to Livestock, Food to People, SSO composting and yard waste from the total amount of traditional recycling materials (paper, metal, glass, plastics, and other) we can show a more informative rate. The recycling rate of traditional materials is 41.5%, an additional 5.3% organic recycling was captured, for a total Minnesota combined recycling rate of 46.8%.
Minnesota’s combined recycling rate is calculated by dividing the total tons recycled or composted by the total tons of MSW generated. This calculation uses actual weights of collected recyclables and solid waste, as well as tonnage estimates of wastes that are not recorded—on-site disposal of waste and problem materials that are disposed of improperly.
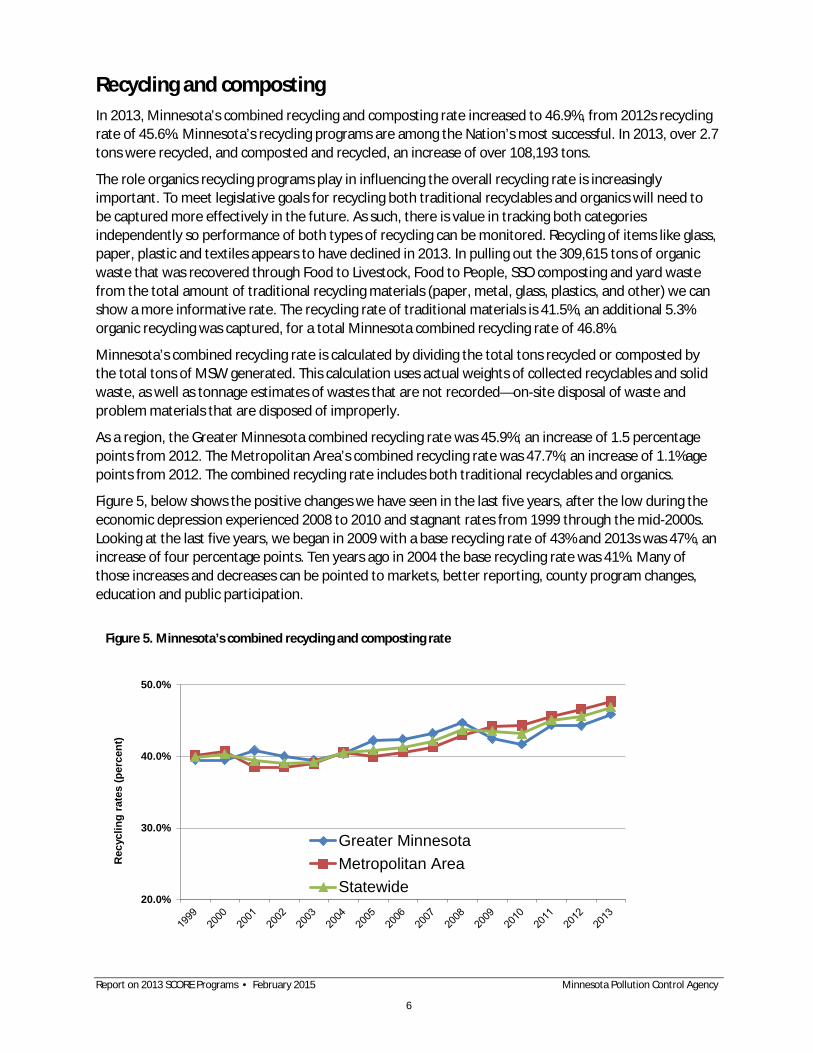
As a region, the Greater Minnesota combined recycling rate was 45.9%; an increase of 1.5 percentage points from 2012. The Metropolitan Area’s combined recycling rate was 47.7%; an increase of 1.1%age points from 2012. The combined recycling rate includes both traditional recyclables and organics.
Figure 5, below shows the positive changes we have seen in the last five years, after the low during the economic depression experienced 2008 to 2010 and stagnant rates from 1999 through the mid-2000s. Looking at the last five years, we began in 2009 with a base recycling rate of 43% and 2013s was 47%, an increase of four percentage points. Ten years ago in 2004 the base recycling rate was 41%. Many of those increases and decreases can be pointed to markets, better reporting, county program changes, education and public participation.
20.0%
30.0%
40.0%
50.0%
Rec
yclin
g ra
tes
(per
cent
)
Greater MinnesotaMetropolitan AreaStatewide
Figure 5. Minnesota’s combined recycling and composting rate
Report on 2013 SCORE Programs • February 2015 Minnesota Pollution Control Agency
6
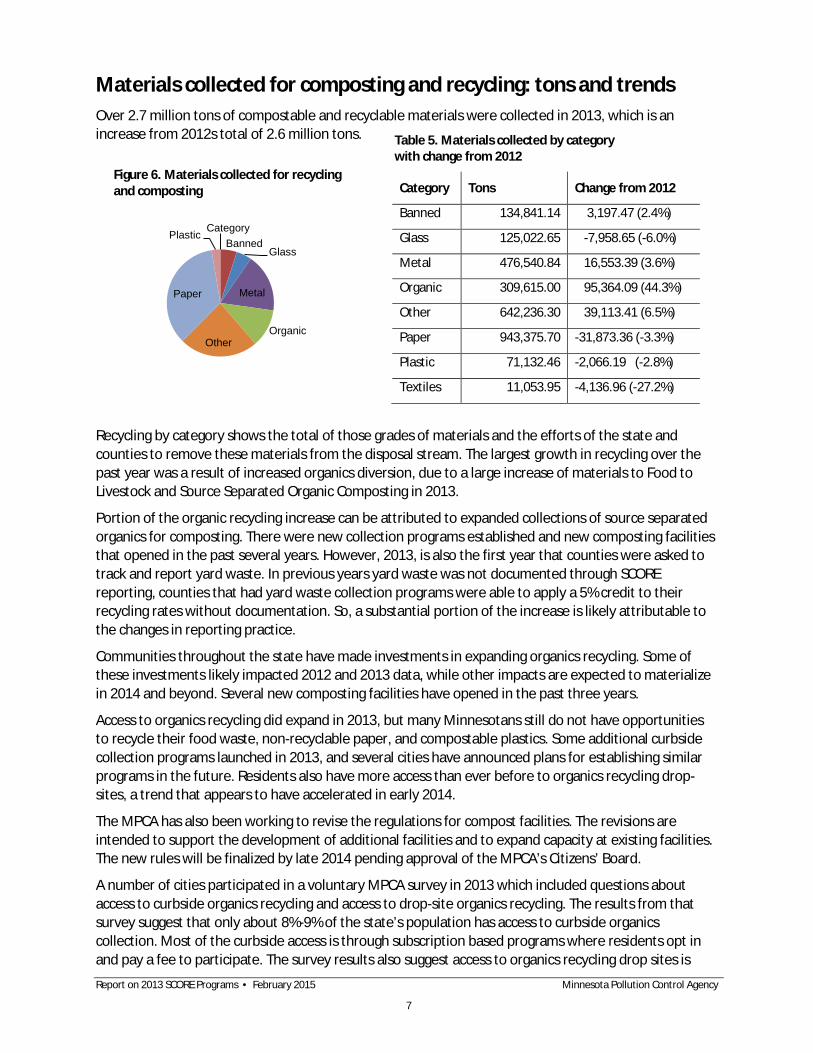
Materials collected for composting and recycling: tons and trends Over 2.7 million tons of compostable and recyclable materials were collected in 2013, which is an increase from 2012s total of 2.6 million tons.
Recycling by category shows the total of those grades of materials and the efforts of the state and counties to remove these materials from the disposal stream. The largest growth in recycling over the past year was a result of increased organics diversion, due to a large increase of materials to Food to Livestock and Source Separated Organic Composting in 2013.
Portion of the organic recycling increase can be attributed to expanded collections of source separated organics for composting. There were new collection programs established and new composting facilities that opened in the past several years. However, 2013, is also the first year that counties were asked to track and report yard waste. In previous years yard waste was not documented through SCORE reporting, counties that had yard waste collection programs were able to apply a 5% credit to their recycling rates without documentation. So, a substantial portion of the increase is likely attributable to the changes in reporting practice.
Communities throughout the state have made investments in expanding organics recycling. Some of these investments likely impacted 2012 and 2013 data, while other impacts are expected to materialize in 2014 and beyond. Several new composting facilities have opened in the past three years.
Access to organics recycling did expand in 2013, but many Minnesotans still do not have opportunities to recycle their food waste, non-recyclable paper, and compostable plastics. Some additional curbside collection programs launched in 2013, and several cities have announced plans for establishing similar programs in the future. Residents also have more access than ever before to organics recycling drop-sites, a trend that appears to have accelerated in early 2014.
The MPCA has also been working to revise the regulations for compost facilities. The revisions are intended to support the development of additional facilities and to expand capacity at existing facilities. The new rules will be finalized by late 2014 pending approval of the MPCA’s Citizens’ Board.
A number of cities participated in a voluntary MPCA survey in 2013 which included questions about access to curbside organics recycling and access to drop-site organics recycling. The results from that survey suggest that only about 8%-9% of the state’s population has access to curbside organics collection. Most of the curbside access is through subscription based programs where residents opt in and pay a fee to participate. The survey results also suggest access to organics recycling drop sites is
Table 5. Materials collected by category with change from 2012
Category Tons Change from 2012
Banned 134,841.14 3,197.47 (2.4%)
Glass 125,022.65 -7,958.65 (-6.0%)
Metal 476,540.84 16,553.39 (3.6%)
Organic 309,615.00 95,364.09 (44.3%)
Other 642,236.30 39,113.41 (6.5%)
Paper 943,375.70 -31,873.36 (-3.3%)
Plastic 71,132.46 -2,066.19 (-2.8%)
Textiles 11,053.95 -4,136.96 (-27.2%)
Report on 2013 SCORE Programs • February 2015 Minnesota Pollution Control Agency
7
Category Banned
Glass
Metal
Organic Other
Paper
Plastic
Figure 6. Materials collected for recycling and composting
more prominent, but still only about 23% of the state’s population have an organics recycling drop-site in their city. Several counties and WLSSD host drop-sites open to any residents within the county or district, so additional residents could also participate if they are willing to transport their organics to other nearby cities.
Minimal data is currently available to evaluate statewide access to organics recycling for commercial businesses. Recycling of organics is certainly happening in the commercial sector, but there are likely still many areas of the state where collection services are not available. Commercial organics recycling options including food donation efforts and food-to-livestock programs remain an important part of the overall organics diversion effort.
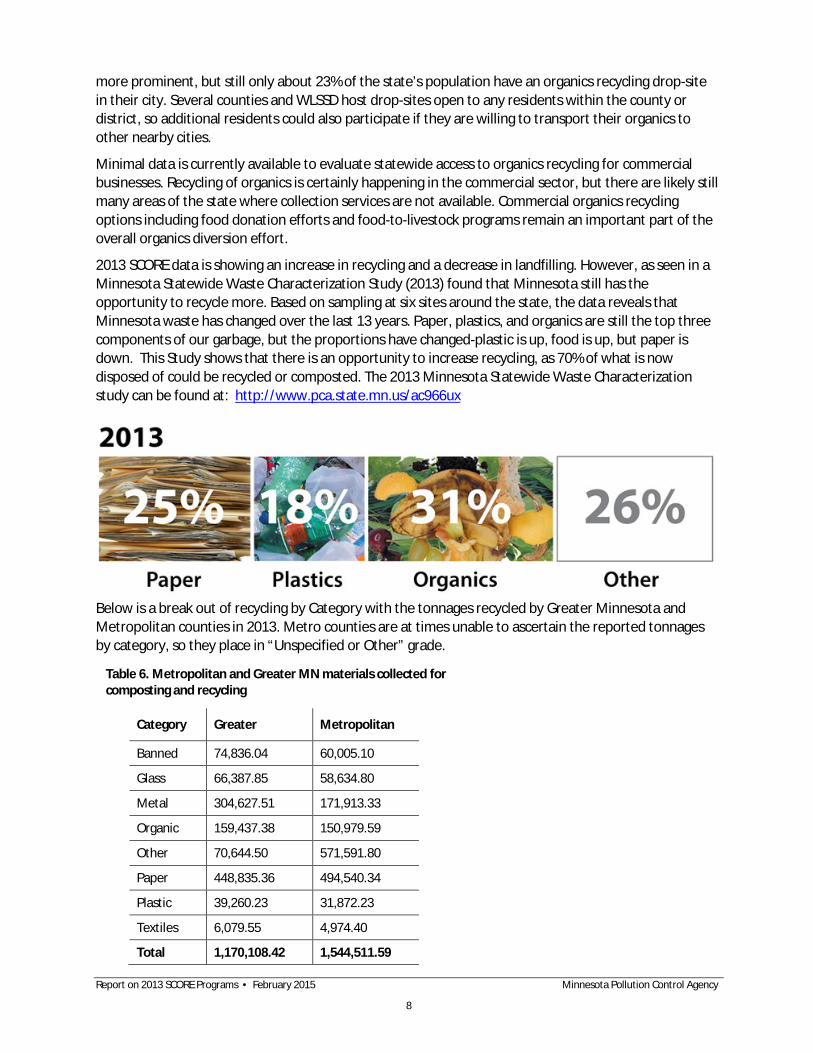
2013 SCORE data is showing an increase in recycling and a decrease in landfilling. However, as seen in a Minnesota Statewide Waste Characterization Study (2013) found that Minnesota still has the opportunity to recycle more. Based on sampling at six sites around the state, the data reveals that Minnesota waste has changed over the last 13 years. Paper, plastics, and organics are still the top three components of our garbage, but the proportions have changed-plastic is up, food is up, but paper is down. This Study shows that there is an opportunity to increase recycling, as 70% of what is now disposed of could be recycled or composted. The 2013 Minnesota Statewide Waste Characterization study can be found at: http://www.pca.state.mn.us/ac966ux
Below is a break out of recycling by Category with the tonnages recycled by Greater Minnesota and Metropolitan counties in 2013. Metro counties are at times unable to ascertain the reported tonnages by category, so they place in “Unspecified or Other” grade.
Table 6. Metropolitan and Greater MN materials collected for composting and recycling
Category Greater Metropolitan
Banned 74,836.04 60,005.10
Glass 66,387.85 58,634.80
Metal 304,627.51 171,913.33
Organic 159,437.38 150,979.59
Other 70,644.50 571,591.80
Paper 448,835.36 494,540.34
Plastic 39,260.23 31,872.23
Textiles 6,079.55 4,974.40
Total 1,170,108.42 1,544,511.59
Report on 2013 SCORE Programs • February 2015 Minnesota Pollution Control Agency
8
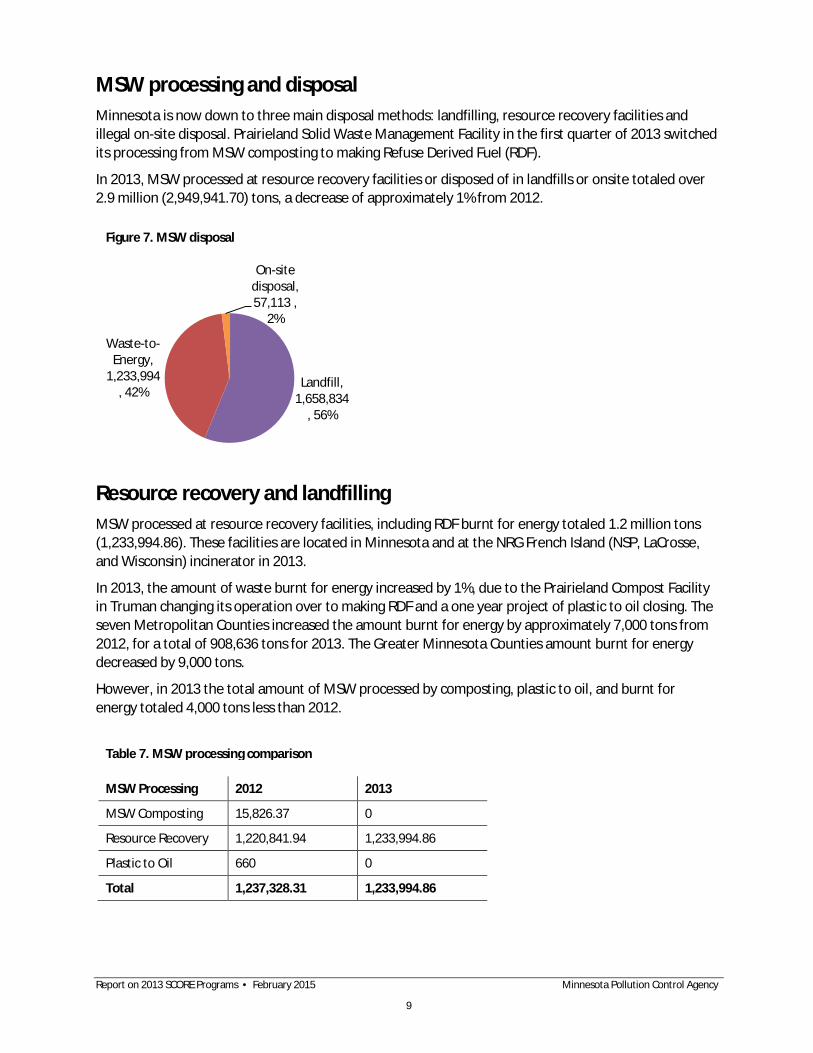
MSW processing and disposal Minnesota is now down to three main disposal methods: landfilling, resource recovery facilities and illegal on-site disposal. Prairieland Solid Waste Management Facility in the first quarter of 2013 switched its processing from MSW composting to making Refuse Derived Fuel (RDF).
In 2013, MSW processed at resource recovery facilities or disposed of in landfills or onsite totaled over 2.9 million (2,949,941.70) tons, a decrease of approximately 1% from 2012.
Resource recovery and landfilling MSW processed at resource recovery facilities, including RDF burnt for energy totaled 1.2 million tons (1,233,994.86). These facilities are located in Minnesota and at the NRG French Island (NSP, LaCrosse, and Wisconsin) incinerator in 2013.
In 2013, the amount of waste burnt for energy increased by 1%, due to the Prairieland Compost Facility in Truman changing its operation over to making RDF and a one year project of plastic to oil closing. The seven Metropolitan Counties increased the amount burnt for energy by approximately 7,000 tons from 2012, for a total of 908,636 tons for 2013. The Greater Minnesota Counties amount burnt for energy decreased by 9,000 tons.
However, in 2013 the total amount of MSW processed by composting, plastic to oil, and burnt for energy totaled 4,000 tons less than 2012.
Table 7. MSW processing comparison
Figure 7. MSW disposal
MSW Processing 2012 2013
MSW Composting 15,826.37 0
Resource Recovery 1,220,841.94 1,233,994.86
Plastic to Oil 660 0
Total 1,237,328.31 1,233,994.86
Landfill, 1,658,834
, 56%
Waste-to-Energy,
1,233,994 , 42%
On-site disposal, 57,113 ,
2%
Report on 2013 SCORE Programs • February 2015 Minnesota Pollution Control Agency
9

MSW landfilled in Minnesota and the surrounding states totaled 1.6 million tons (1,658,834.07). Minnesota landfills received 1.3 million tons (1,343,689.52), with the landfills in Wisconsin receiving 164,272.86 tons, North Dakota receiving 78,784.48, Iowa receiving 69,137.63, and South Dakota receiving 2,949.58 tons.
The amount of waste leaving Minnesota in 2013 rose, reversing the trend we have seen since 2005. This shift shows an increase to North Dakota landfills (increase of 7,192 tons) and Wisconsin landfills and waste to energy facility (increase of 4,942 tons). However, contrary to this less waste is going to Iowa landfills from Minnesota (decrease of 2,240).
To break the processing and landfilling trends by region, below is a table that shows the disposal methods of MSW by Greater Minnesota and of the Metropolitan Counties in 2013.
Illegal on-site disposal and problem materials not recycled On-site disposal of MSW, either burning or burying, has been an on-going practice for many years. Although it is against the law for most people, some farmers are still allowed to burn or bury household garbage under existing Min. Stat.§§88.171 and 17.135. However, it should be noted that nearly all materials found in modern garbage are considered prohibited materials (Minn.Stat.88.171) and as a result, are illegal to burn for all Minnesotans regardless of the farmer exemption found in Minn.Stat.17.135.
In the 2013 SCORE survey, counties estimated that 57,113 tons of waste was disposed of on-site representing 1% of the total MSW generated in Minnesota. This estimate may be very conservative. According to a 2005 baseline study on backyard garbage burning in Minnesota, 45% of all rural residents (625,129 persons or 251,056 households) burned their garbage on-site totaling 228,172 tons each year.
Table 8. Greater and Metropolitan MSW disposal
Dest. Facility Type Greater Metropolitan
Landfill 945,092.81 713,741.26
Resource Recovery 325,359.22 908,635.64
MSW Total 1,270,452.03 1,622,376.90
Report on 2013 SCORE Programs • February 2015 Minnesota Pollution Control Agency
10
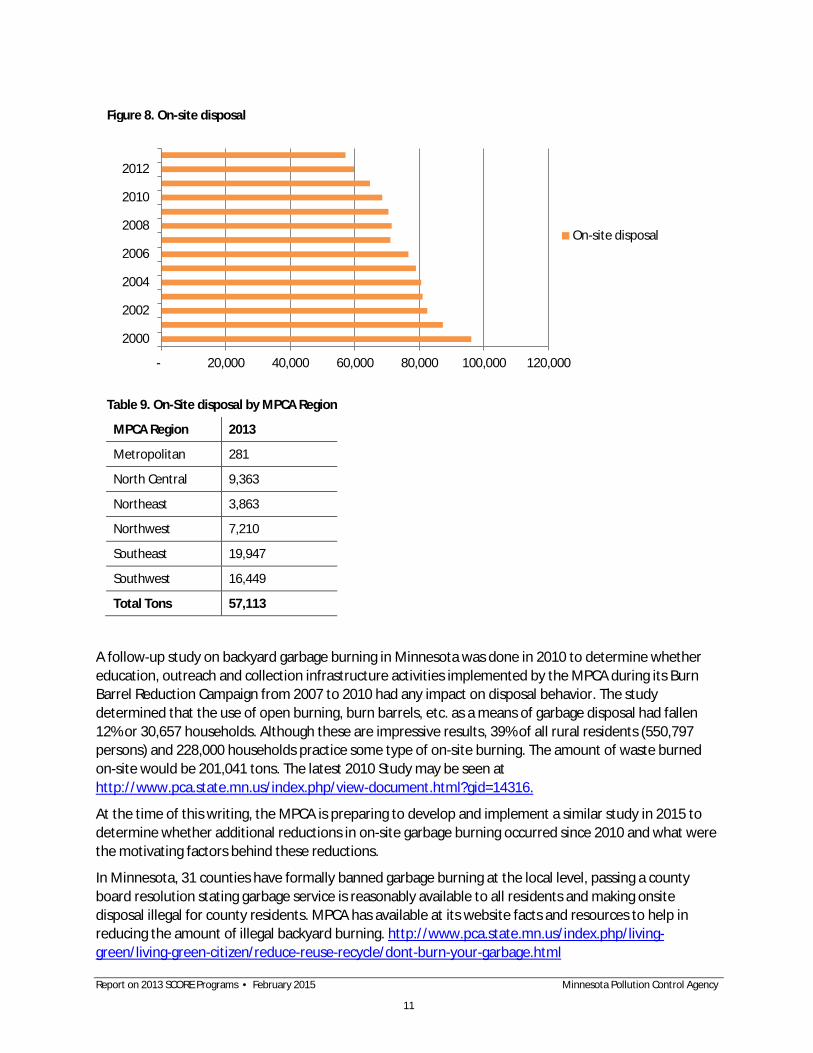
A follow-up study on backyard garbage burning in Minnesota was done in 2010 to determine whether education, outreach and collection infrastructure activities implemented by the MPCA during its Burn Barrel Reduction Campaign from 2007 to 2010 had any impact on disposal behavior. The study determined that the use of open burning, burn barrels, etc. as a means of garbage disposal had fallen 12% or 30,657 households. Although these are impressive results, 39% of all rural residents (550,797 persons) and 228,000 households practice some type of on-site burning. The amount of waste burned on-site would be 201,041 tons. The latest 2010 Study may be seen at http://www.pca.state.mn.us/index.php/view-document.html?gid=14316.
At the time of this writing, the MPCA is preparing to develop and implement a similar study in 2015 to determine whether additional reductions in on-site garbage burning occurred since 2010 and what were the motivating factors behind these reductions.
In Minnesota, 31 counties have formally banned garbage burning at the local level, passing a county board resolution stating garbage service is reasonably available to all residents and making onsite disposal illegal for county residents. MPCA has available at its website facts and resources to help in reducing the amount of illegal backyard burning. http://www.pca.state.mn.us/index.php/living-green/living-green-citizen/reduce-reuse-recycle/dont-burn-your-garbage.html
- 20,000 40,000 60,000 80,000 100,000 120,000
2000
2002
2004
2006
2008
2010
2012
On-site disposal
Figure 8. On-site disposal
Table 9. On-Site disposal by MPCA Region
MPCA Region 2013
Metropolitan 281
North Central 9,363
Northeast 3,863
Northwest 7,210
Southeast 19,947
Southwest 16,449
Total Tons 57,113
Report on 2013 SCORE Programs • February 2015 Minnesota Pollution Control Agency
11
Problem materials not recycled Problem materials not recycled (PMNR) makes up 2% or 125,086 tons of all MSW generated in 2013. PMNR includes five materials that have been banned from disposal in Minnesota (vehicle batteries, tires, major appliances, motor oil, oil filters). The PMNR number is that portion of the materials that is not recycled, but is assumed to be disposed of somewhere else, legally or not, as they are banned from MSW disposal facilities. It is assumed that they are not being counted in landfill or incinerator tonnages.
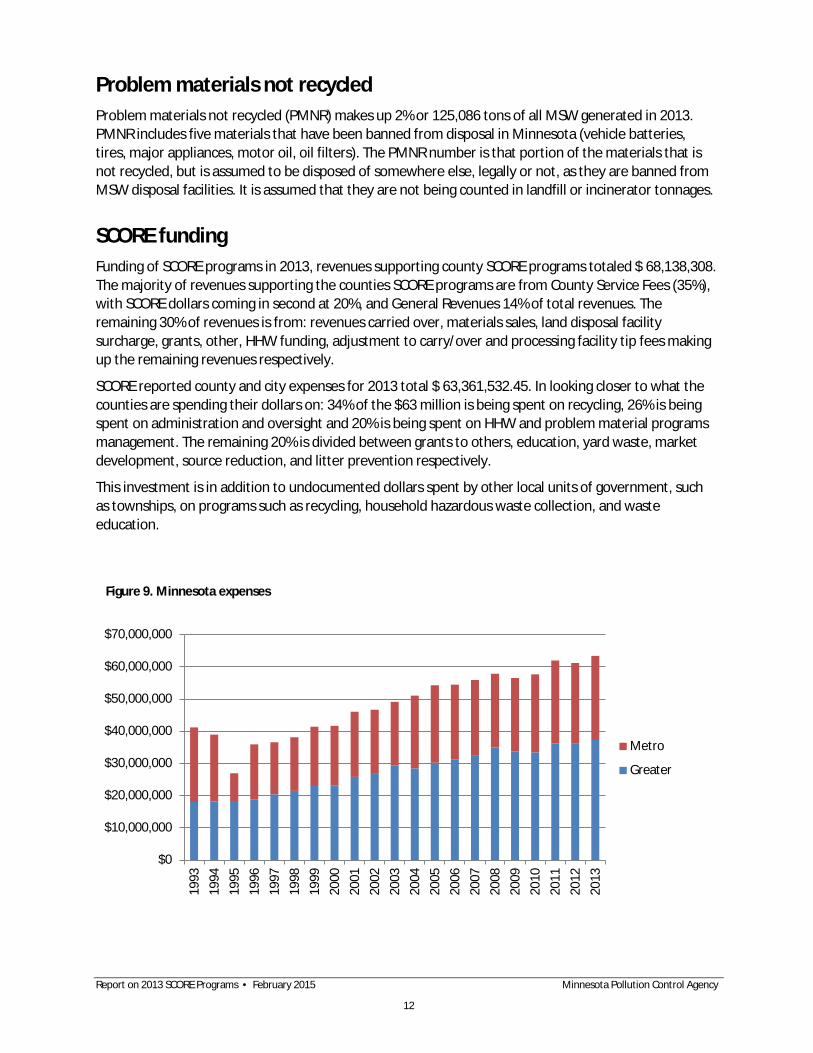
SCORE funding Funding of SCORE programs in 2013, revenues supporting county SCORE programs totaled $ 68,138,308. The majority of revenues supporting the counties SCORE programs are from County Service Fees (35%), with SCORE dollars coming in second at 20%, and General Revenues 14% of total revenues. The remaining 30% of revenues is from: revenues carried over, materials sales, land disposal facility surcharge, grants, other, HHW funding, adjustment to carry/over and processing facility tip fees making up the remaining revenues respectively.
SCORE reported county and city expenses for 2013 total $ 63,361,532.45. In looking closer to what the counties are spending their dollars on: 34% of the $63 million is being spent on recycling, 26% is being spent on administration and oversight and 20% is being spent on HHW and problem material programs management. The remaining 20% is divided between grants to others, education, yard waste, market development, source reduction, and litter prevention respectively.
This investment is in addition to undocumented dollars spent by other local units of government, such as townships, on programs such as recycling, household hazardous waste collection, and waste education.
Figure 9. Minnesota expenses
Report on 2013 SCORE Programs • February 2015 Minnesota Pollution Control Agency
12
$0
$10,000,000
$20,000,000
$30,000,000
$40,000,000
$50,000,000
$60,000,000
$70,000,000
1993
1994
1995
1996
1997
1998
1999
2000
2001
2002
2003
2004
2005
2006
2007
2008
2009
2010
2011
2012
2013
Metro
Greater
Money from the State is passed onto the county level in the form of annual block grants. Each county is required to match the funding from the Legislature with a local contribution of at least 25%.
2014 Legislation took up the issue of SCORE disbursement dollars not keeping up with inflation and the underfunding of SCORE. Legislators reinvested in SCORE by passing HF3172/SF2785, Omnibus Supplemental Finance Bill, with an additional $4 million for Fiscal Year 2015, then in Fiscal Year 2016 and thereafter it will be $3 million to be added to the annual base funding of SCORE grants to assist counties with waste reuse, reduction and recycling efforts.
As a result with this renewed investment counties will be able to address the challenges, growing costs and increased demands they have been experiencing in managing and collecting compost and recycling materials.
2014 activities Solid waste, recycling, organic composting and funding received a great deal of attention, study, and ultimate change during 2014. This work will affect future SCORE reporting and data going forward.
SCORE reporting In 2015 (Reporting year 2014), SCORE will be entered online and tracked through ReTRAC software. This moves the MPCA to facility reporting through its permit process. As an effort to relieve the burden from counties and to ensure that there is less estimation, the entities directly in charge of the waste will also be reporting. The MPCA continues to work with the hauling community to develop a data reporting mechanism that will provide information regarding transport of MSW, recyclables, and organics from generation to facility. A standard reporting form has been developed at the request of the haulers in order to simplify the reporting that haulers currently provide to counties. Counties will continue to be responsible for any data that they handle directly, such as drop-off events and materials handled outside of the traditional hauling system.
The MPCA will be scheduling training opportunities. Information for this training will be sent out through the Solid Waste Administrators Association, Counties Involved in Source Reduction and Recycling (CISRR), and Association of Minnesota Recyclers Managers.
The 2013 SCORE report for the first time includes organics as a separate and distinct category. Effectively capturing both organics and traditional recyclables will be essential to meeting the state’s recycling goals. However, looking at each category individually will provide more insight into performance for both processes.
Terminology used to describe these activities will also be part of this evaluation. Organics recycling is comprised of Food-to-People, Food-to-Livestock, and Composting. Food-toPeople is essentially a reuse strategy. Composting has some similarities to recycling in that it involves capturing source separated material that is collected to manufacture a produce, but also has some different characteristics. Ensuring that we use terminology and data management practices that allow us to distinguishing these activities from each other and traditional recycling will help ensure that progress in one area does not mask declining performance in another. As such reporting practices and terminology for the 2014 SCORE report will be evaluated to help ensure SCORE will provide policy makers and the public with an accurate assessment of the state’s recycling performance.
Report on 2013 SCORE Programs • February 2015 Minnesota Pollution Control Agency
13

SCORE audit Office of the Legislative Auditor is auditing SCORE, focusing of the 2014 audit is the effectiveness of Minnesota’s waste abatement efforts, specifically source reduction, reuse, recycling and composting programs and policies. Some of the questions being asked are:
· How effective are Minnesota’s waste abatement efforts? · Does the current funding structure incentivize effective waste abatement? · How effective are Minnesota’s solid waste policies and how do they compare to other states?
OLA staff are currently reviewing solid waste data and having discussions with state and local entities to answer these questions which will be summarized in their final audit report, anticipated in January of 2015. A similar audit was conducted in 2002 in which the focus was primarily the SCORE program (grant pass-through dollars, solid waste data, etc.).
Source separated organic composting rule change The MPCA has been working on revising the regulations for organic compost facilities. The revisions impact Chapters 7001 and 7035 and support efforts to increase composting while being adequately protective of the environment. The proposed changes:
1. Create the Source Separated Organic Material (SSOM) Compost facilities category. The proposed rule establishes requirements appropriate to the composting of SSOM, which will differ from requirements applicable to Solid Waste Composting facilities. Regulations for Solid Waste Composting facilities are designed for organics that have been co-mingled with MMSW. SSOM compost facilities will be able to accept items like food waste, non-recyclable paper and compostable plastics that are not acceptable at yard waste facilities. The MPCA expects that the proposed requirements will reduce costs to build and operate SSOM facilities. A permit will still be required.
2. Establish a new category of facilities called small compost sites. Small compost sites must have no more than 120 cubic yards of material on site at any given time and meet other general requirements. Under the proposed rule, small compost sites may accept materials that backyard compost sites cannot. Small compost sites, like backyard compost sites, will not require a state permit to operate.
3. Modify the existing backyard compost site definition. Apartment buildings and commercial office complexes that compost on-site are now incorporated into the small compost site definition. A permit is still not required, but the larger entities do have some increased responsibility to operate as good neighbors.
No changes will be made to the existing rules for yard waste composting and solid waste composting. Under the existing and proposed rules, local governments continue to have the option of enacting ordinances to establish more stringent requirements. The proposed rules will be finalized by late 2014 pending approval of the MPCA’s Citizens’ Board.
Paint stewardship Paint Stewardship Program/PaintCare – The Minnesota paint stewardship program operated by industry funded and managed organization, PaintCare, will launch on November 1, 2014. The program is expected to result in an expanded number of collection locations for unwanted paint across the state as well as reduce the costs currently shouldered by the county HHW programs. For more information on the program, please see http://www.pca.state.mn.us/ycx948u.
Report on 2013 SCORE Programs • February 2015 Minnesota Pollution Control Agency
14
2014 Legislation 2014 legislation passed a number of Bills that will have positive effects on recycling and organic composting, along with the management of solid waste in the future. Legislation was passed for a one-time $4 million (Environmental Fund) beginning in Fiscal Year (FY) 2015, in the future $3 million of which will be for annual base funding for SCORE grants to assist counties with waste reuse, reduction, and recycling efforts. The Metropolitan Counties must use half of the new funds for composting activities.
Legislation was also passed to increase the Metropolitan Area goal for recycling to be increased from a 50% goal to a 75 % goal by the end of 2030. This Bill adds sport facilities by January 1, 2015, all college and professional sports venues, to the commercial and public entity recycling requirements throughout the State of Minnesota.
Legislation specific to Commercial and State Agencies was passed regarding reuse, recycling, waste reduction efforts. Two specific additional recycling amendments were made, including: State Agencies recycling rate goals, reporting, and recycling improvements; and Commercial buildings within the seven county metropolitan areas, generating more than 4 cubic yards of solid waste per week, to offer recycling opportunities to their employees, tenants, and customers starting in 2016. This Bill received a second amendment which added prohibition of sharps from being placed with recyclable materials.
MPCA Solid Waste Policy Report MPCA Solid Waste Policy Report (SWPR) is a legislative report providing policy analysis and recommendations related to solid waste. The SWPR is prepared for the legislature by the MPCA every four years and brings forward recommendations for solid waste-related initiatives with the goal of advancing Minnesota’s materials management objectives. Previous reports have included themes such as addressing on-site disposal and burn barrels, beverage container recycling, developing commercial recycling requirements, and creating product stewardship laws. Progress has been made on many fronts as a result of the SWPR recommendations. The next report is due December 31, 2015. The MPCA staff is currently working on the scope and topics to be addressed in the 2015 report and will be working with a variety of stakeholders throughout the process.
Report on 2013 SCORE Programs • February 2015 Minnesota Pollution Control Agency
15
Appendix A: County Score Survey Responses
Report on 2013 SCORE Programs • February 2015 Minnesota Pollution Control Agency
16

County Survey Responses Finances: Revenues (part 1)
CountyCY2012 revenue carried over
Adjustment to carry over
General revenue
Service feeProcessing facility tip fee
Land disposal facility surcharge
Aitkin $267,006 0 $165,624 $0 $0 $0Anoka $0 0 $0 $1,809,459 $0 $0Becker ($121,019) 121,019 $0 $219,287 $0 $0Beltrami $0 0 $739,500 $0 $0 $0Benton $33,779 0 $0 $171,205 $0 $0Big Stone $1,992 0 $122,832 $2,336 $0 $0Blue Earth $0 0 $150,034 $236 $0 $0Brown $330 0 $341,989 $15,652 $0 $0Carlton ($58,301) 58,301 $0 $0 $37,358 $0Carver $0 0 $0 $425,771 $0 $0Cass $0 0 $0 $831,354 $0 $0Chippewa $0 0 $126,992 $0 $0 $0Chisago $0 0 $0 $269,665 $10,172 $0Clay $46,401 0 $0 $504,416 $0 $0Clearwater $0 0 $0 $107,594 $0 $0Cook $0 0 $343,093 $0 $0 $0Cottonwood $27,315 0 $0 $183,042 $0 $0Crow Wing $0 0 $508,907 $0 $86,016 $0Dakota ($1) 1 $0 $0 $0 $1,290,269Dodge $0 0 $238,675 $0 $44,500 $0Faribault $79,750 0 $175,066 $0 $0 $0Fillmore ($4,094) 4,094 $13,988 $0 $0 $0Freeborn $70,335 0 $394,220 $0 $0 $0Goodhue $0 0 $357,324 $0 $0 $0Grant $103,245 9 $36,433 $121,350 $0 $0Hennepin $0 0 $0 $5,621,247 $267,427 $0Houston $0 0 $188,448 $0 $0 $0Hubbard $0 0 $312,417 $0 $0 $0Isanti $103,287 0 $23,356 $0 $0 $0Itasca $0 0 $381,577 $0 $0 $0Jackson $190,222 0 $13,988 $0 $0 $0Kanabec $111,421 0 $13,868 $0 $0 $0Kandiyohi $0 0 $10,345 $292,400 $0 $0Kittson $7,785 0 $13,988 $0 $0 $0Koochiching $108 0 $85,233 $85,233 $16,032 $0Lac qui Parle $248,836 0 $105,000 $0 $0 $0Lake $0 0 $170,618 $4,771 $0 $0Lake of The Woods $0 0 $162,715 $0 $0 $0Le Sueur $104,958 0 $144,306 $0 $0 $0Lincoln $27,723 0 $165,740 $0 $0 $0Lyon $0 0 $0 $234,321 $0 $114,000Mahnomen $32,635 0 $13,988 $0 $0 $0Marshall $0 0 $0 $1,504 $0 $0Martin $67,038 0 $624,492 $0 $0 $0McLeod $0 0 $0 $75,360 $520,388 $990,224Meeker $17,394 0 $15,000 $0 $0 $0Mille Lacs $97,970 0 $30,400 $0 $0 $0Morrison $0 0 $244,576 $0 $0 $0
A - 1

County Survey Responses Finances: Revenues (part 1)
CountyCY2012 revenue carried over
Adjustment to carry over
General revenue
Service feeProcessing facility tip fee
Land disposal facility surcharge
Mower $0 0 $0 $309,721 $0 $0Murray ($17,545) 17,545 $13,750 $0 $0 $0Nicollet $24,035 0 $292,649 $0 $0 $0Nobles $82,244 0 $0 $184,031 $0 $191,330Norman $0 0 $59,213 $0 $0 $0Olmsted ($373,144) 373,144 $0 $0 $0 $0Otter Tail $15,300 0 $0 $772,412 $0 $0Pennington $175,913 0 $13,988 $0 $0 $0Pine $100,527 0 $70,000 $0 $0 $0Pipestone ($174,924) 174,924 $190,467 $3,640 $0 $0Polk $317,998 0 $0 $260,471 $0 $0Pope/Douglas $37,708 0 $290,000 $0 $0 $0Ramsey $625,759 0 $0 $5,339,340 $0 $0Red Lake $0 0 $12,379 $0 $0 $0Redwood $548,199 0 $347,637 $1,750 $0 $0Renville $185,492 58,988 $315,000 $12,408 $3,001 $0Rice $386,522 0 $0 $654,718 $0 $0Rock ($32,736) 32,736 $63,212 $0 $15,886 $0Roseau ($293) 293 $0 $0 $0 $0Scott $680,597 0 $80,330 $0 $0 $0Sherburne $257,542 0 $0 $0 $0 $54,418Sibley $15,853 0 $130,495 $0 $0 $0St. Louis - partial $0 0 $0 $1,003,817 $0 $0Stearns $105,661 0 $0 $0 $0 $0Steele $0 0 $515,728 $0 $0 $0Stevens ($8,516) 8,516 $106,809 $0 $0 $0Swift ($109,839) 109,839 $179,834 $0 $0 $0Todd $0 0 $0 $300,542 $0 $0Traverse ($47,050) 47,050 $13,988 $0 $0 $0Wabasha $0 0 $21,995 $0 $0 $0Wadena $0 0 $0 $187,042 $23,062 $0Waseca ($143,797) 143,797 $0 $0 $0 $0Washington $0 0 $0 $933,354 $0 $0Watonwan $357,723 0 $14,508 $173,233 $0 $0Wilkin $0 0 $0 $82,593 $0 $0Winona ($83,853) 83,853 $286,929 $618,375 $0 $0WLSSD $0 0 $0 $1,659,715 $380,871 $0Wright $889,107 0 $77,219 $16,288 $0 $0Yellow Medicine $30,053 0 $0 $54,223 $0 $20,940
Metro Area $883,300 $1 $0 $14,129,170 $267,427 $1,344,687Greater Minn. $4,417,351 $1,234,108 $9,530,861 $9,414,704 $1,137,286 $1,316,494Minnesota $5,300,651 $1,234,109 $9,530,861 $23,543,874 $1,404,713 $2,661,181
A - 2
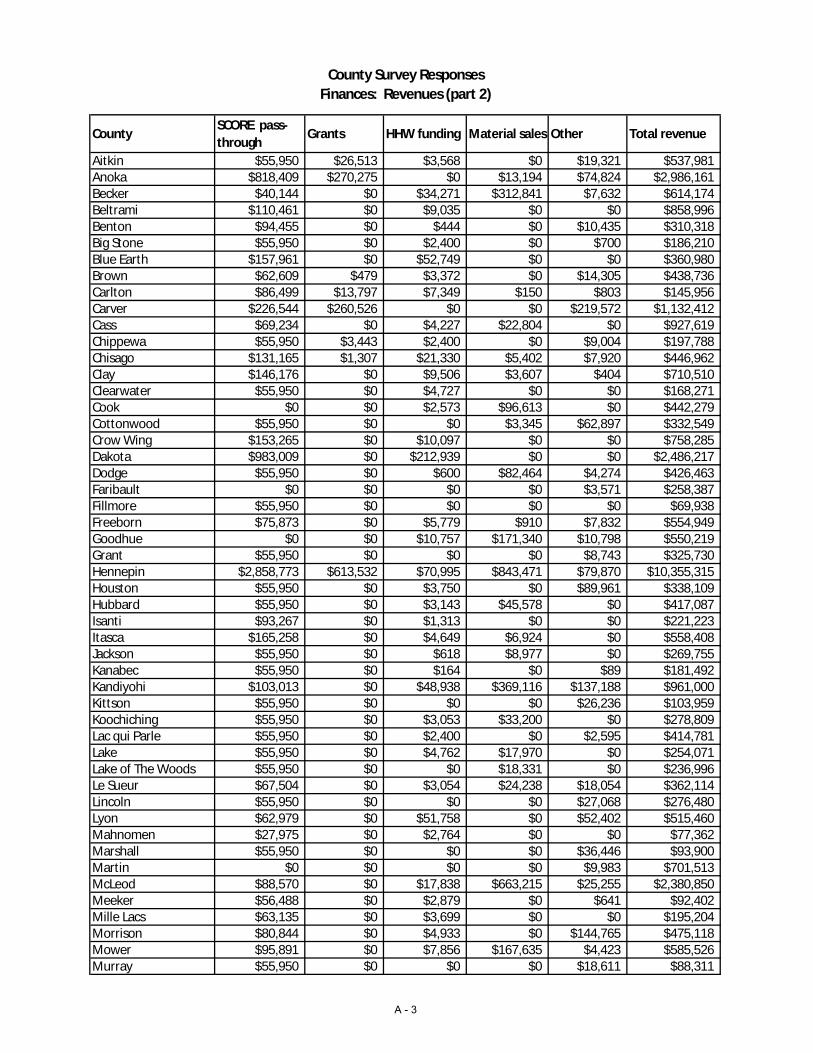
County Survey ResponsesFinances: Revenues (part 2)
CountySCORE pass-through
Grants HHW funding Material sales Other Total revenue
Aitkin $55,950 $26,513 $3,568 $0 $19,321 $537,981Anoka $818,409 $270,275 $0 $13,194 $74,824 $2,986,161Becker $40,144 $0 $34,271 $312,841 $7,632 $614,174Beltrami $110,461 $0 $9,035 $0 $0 $858,996Benton $94,455 $0 $444 $0 $10,435 $310,318Big Stone $55,950 $0 $2,400 $0 $700 $186,210Blue Earth $157,961 $0 $52,749 $0 $0 $360,980Brown $62,609 $479 $3,372 $0 $14,305 $438,736Carlton $86,499 $13,797 $7,349 $150 $803 $145,956Carver $226,544 $260,526 $0 $0 $219,572 $1,132,412Cass $69,234 $0 $4,227 $22,804 $0 $927,619Chippewa $55,950 $3,443 $2,400 $0 $9,004 $197,788Chisago $131,165 $1,307 $21,330 $5,402 $7,920 $446,962Clay $146,176 $0 $9,506 $3,607 $404 $710,510Clearwater $55,950 $0 $4,727 $0 $0 $168,271Cook $0 $0 $2,573 $96,613 $0 $442,279Cottonwood $55,950 $0 $0 $3,345 $62,897 $332,549Crow Wing $153,265 $0 $10,097 $0 $0 $758,285Dakota $983,009 $0 $212,939 $0 $0 $2,486,217Dodge $55,950 $0 $600 $82,464 $4,274 $426,463Faribault $0 $0 $0 $0 $3,571 $258,387Fillmore $55,950 $0 $0 $0 $0 $69,938Freeborn $75,873 $0 $5,779 $910 $7,832 $554,949Goodhue $0 $0 $10,757 $171,340 $10,798 $550,219Grant $55,950 $0 $0 $0 $8,743 $325,730Hennepin $2,858,773 $613,532 $70,995 $843,471 $79,870 $10,355,315Houston $55,950 $0 $3,750 $0 $89,961 $338,109Hubbard $55,950 $0 $3,143 $45,578 $0 $417,087Isanti $93,267 $0 $1,313 $0 $0 $221,223Itasca $165,258 $0 $4,649 $6,924 $0 $558,408Jackson $55,950 $0 $618 $8,977 $0 $269,755Kanabec $55,950 $0 $164 $0 $89 $181,492Kandiyohi $103,013 $0 $48,938 $369,116 $137,188 $961,000Kittson $55,950 $0 $0 $0 $26,236 $103,959Koochiching $55,950 $0 $3,053 $33,200 $0 $278,809Lac qui Parle $55,950 $0 $2,400 $0 $2,595 $414,781Lake $55,950 $0 $4,762 $17,970 $0 $254,071Lake of The Woods $55,950 $0 $0 $18,331 $0 $236,996Le Sueur $67,504 $0 $3,054 $24,238 $18,054 $362,114Lincoln $55,950 $0 $0 $0 $27,068 $276,480Lyon $62,979 $0 $51,758 $0 $52,402 $515,460Mahnomen $27,975 $0 $2,764 $0 $0 $77,362Marshall $55,950 $0 $0 $0 $36,446 $93,900Martin $0 $0 $0 $0 $9,983 $701,513McLeod $88,570 $0 $17,838 $663,215 $25,255 $2,380,850Meeker $56,488 $0 $2,879 $0 $641 $92,402Mille Lacs $63,135 $0 $3,699 $0 $0 $195,204Morrison $80,844 $0 $4,933 $0 $144,765 $475,118Mower $95,891 $0 $7,856 $167,635 $4,423 $585,526Murray $55,950 $0 $0 $0 $18,611 $88,311
A - 3

County Survey ResponsesFinances: Revenues (part 2)
CountySCORE pass-through
Grants HHW funding Material sales Other Total revenue
Nicollet $80,483 $0 $6,634 $0 $0 $403,801Nobles $55,950 $0 $0 $0 $6,650 $520,205Norman $55,950 $0 $2,959 $0 $0 $118,122Olmsted $356,863 $0 $133,212 $0 $184,601 $674,676Otter Tail $139,746 $0 $36,841 $647,906 $0 $1,612,205Pennington $55,950 $0 $0 $1,176 $15,933 $262,960Pine $71,857 $0 $1,134 $0 $0 $243,518Pipestone $55,950 $0 $0 $0 $32,320 $282,377Polk $0 $22,366 $4,744 $94,326 $27,516 $727,420Pope/Douglas $144,589 $0 $13,817 $0 $600 $486,714Ramsey $1,254,451 $348,205 $0 $0 $82,024 $7,649,779Red Lake $55,950 $0 $3,916 $887 $1,133 $74,264Redwood $55,950 $0 $0 $193,460 $48,797 $1,195,793Renville $55,950 $0 $0 $0 $1,801 $632,640Rice $157,954 $0 $38,697 $354,062 $100,401 $1,692,354Rock $55,950 $0 $0 $0 $19,530 $154,578Roseau $55,950 $0 $4,464 $0 $57,584 $117,998Scott $323,165 $0 $0 $0 $0 $1,084,092Sherburne $217,670 $1,018 $4,196 $0 $61 $534,905Sibley $55,950 $0 $2,188 $18,909 $12,361 $235,756St. Louis - partial $55,950 $25,000 $13,989 $390,258 $94,637 $1,583,651Stearns $369,173 $445,859 $0 $0 $0 $920,693Steele $88,857 $0 $0 $0 $1,223 $605,808Stevens $55,950 $0 $0 $0 $214 $162,973Swift $27,975 $0 $2,400 $128,421 $0 $338,630Todd $60,211 $0 $4,731 $90,783 $0 $456,267Traverse $55,950 $0 $0 $0 $0 $69,938Wabasha $55,950 $0 $3,709 $0 $0 $81,654Wadena $55,950 $0 $0 $0 $0 $266,054Waseca $0 $0 $3,048 $207,326 $1,093 $211,467Washington $590,442 $239,511 $0 $0 $129,852 $1,893,159Watonwan $0 $0 $2,655 $0 $10,103 $558,222Wilkin $55,950 $0 $0 $107,159 $1,100 $246,802Winona $125,603 $0 $24,120 $0 $15,192 $1,070,219WLSSD $253,510 $88,723 $250,278 $100,253 $92,105 $2,825,456Wright $308,874 $8,019 $11,700 $5,924 $512 $1,317,643Yellow Medicine $55,950 $0 $0 $0 $1,014 $162,179
Metro Area $6,949,298 $1,733,066 $288,130 $856,665 $586,204 $27,037,948Greater Minn. $6,611,776 $635,506 $917,990 $4,395,510 $1,488,775 $41,100,360Minnesota $13,561,074 $2,368,572 $1,206,120 $5,252,175 $2,074,979 $68,138,308
A - 4

County Survey ResponsesFinances: Revenue summary
CountyAdjusted CY2012 revenue (carried over)
CY2012 revenue Total revenue
Aitkin $267,006 $270,975 $537,981Anoka $0 $2,986,161 $2,986,161Becker $0 $614,174 $614,174Beltrami $0 $858,996 $858,996Benton $33,779 $276,539 $310,318Big Stone $1,992 $184,218 $186,210Blue Earth $0 $360,980 $360,980Brown $330 $438,406 $438,736Carlton $0 $145,956 $145,956Carver $0 $1,132,412 $1,132,412Cass $0 $927,619 $927,619Chippewa $0 $197,788 $197,788Chisago $0 $446,962 $446,962Clay $46,401 $664,109 $710,510Clearwater $0 $168,271 $168,271Cook $0 $442,279 $442,279Cottonwood $27,315 $305,234 $332,549Crow Wing $0 $758,285 $758,285Dakota $0 $2,486,217 $2,486,217Dodge $0 $426,463 $426,463Faribault $79,750 $178,637 $258,387Fillmore $0 $69,938 $69,938Freeborn $70,335 $484,614 $554,949Goodhue $0 $550,219 $550,219Grant $103,254 $222,476 $325,730Hennepin $0 $10,355,315 $10,355,315Houston $0 $338,109 $338,109Hubbard $0 $417,087 $417,087Isanti $103,287 $117,936 $221,223Itasca $0 $558,408 $558,408Jackson $190,222 $79,533 $269,755Kanabec $111,421 $70,071 $181,492Kandiyohi $0 $961,000 $961,000Kittson $7,785 $96,174 $103,959Koochiching $108 $278,701 $278,809Lac qui Parle $248,836 $165,945 $414,781Lake $0 $254,071 $254,071Lake of The Woods $0 $236,996 $236,996Le Sueur $104,958 $257,156 $362,114Lincoln $27,723 $248,758 $276,480Lyon $0 $515,460 $515,460Mahnomen $32,635 $44,727 $77,362Marshall $0 $93,900 $93,900Martin $67,038 $634,475 $701,513McLeod $0 $2,380,850 $2,380,850Meeker $17,394 $75,008 $92,402Mille Lacs $97,970 $97,234 $195,204Morrison $0 $475,118 $475,118
A - 5

County Survey ResponsesFinances: Revenue summary
CountyAdjusted CY2012 revenue (carried over)
CY2012 revenue Total revenue
Mower $0 $585,526 $585,526Murray $0 $88,311 $88,311Nicollet $24,035 $379,766 $403,801Nobles $82,244 $437,961 $520,205Norman $0 $118,122 $118,122Olmsted $0 $674,676 $674,676Otter Tail $15,300 $1,596,905 $1,612,205Pennington $175,913 $87,047 $262,960Pine $100,527 $142,991 $243,518Pipestone $0 $282,377 $282,377Polk $317,998 $409,422 $727,420Pope/Douglas $37,708 $449,006 $486,714Ramsey $625,759 $7,024,020 $7,649,779Red Lake $0 $74,264 $74,264Redwood $548,199 $647,594 $1,195,793Renville $244,480 $388,160 $632,640Rice $386,522 $1,305,832 $1,692,354Rock $0 $154,578 $154,578Roseau $0 $117,998 $117,998Scott $680,597 $403,495 $1,084,092Sherburne $257,542 $277,363 $534,905Sibley $15,853 $219,903 $235,756St. Louis - partial $0 $1,583,651 $1,583,651Stearns $105,661 $815,032 $920,693Steele $0 $605,808 $605,808Stevens $0 $162,973 $162,973Swift $0 $338,630 $338,630Todd $0 $456,267 $456,267Traverse $0 $69,938 $69,938Wabasha $0 $81,654 $81,654Wadena $0 $266,054 $266,054Waseca $0 $211,467 $211,467Washington $0 $1,893,159 $1,893,159Watonwan $357,723 $200,499 $558,222Wilkin $0 $246,802 $246,802Winona $0 $1,070,219 $1,070,219WLSSD $0 $2,825,456 $2,825,456Wright $889,107 $428,535 $1,317,643Yellow Medicine $30,053 $132,126 $162,179
Metro Area $883,301 $26,154,647 $27,037,948Greater Minn. $5,651,458 $35,448,902 $41,100,360Minnesota $6,534,759 $61,603,549 $68,138,308
A - 6

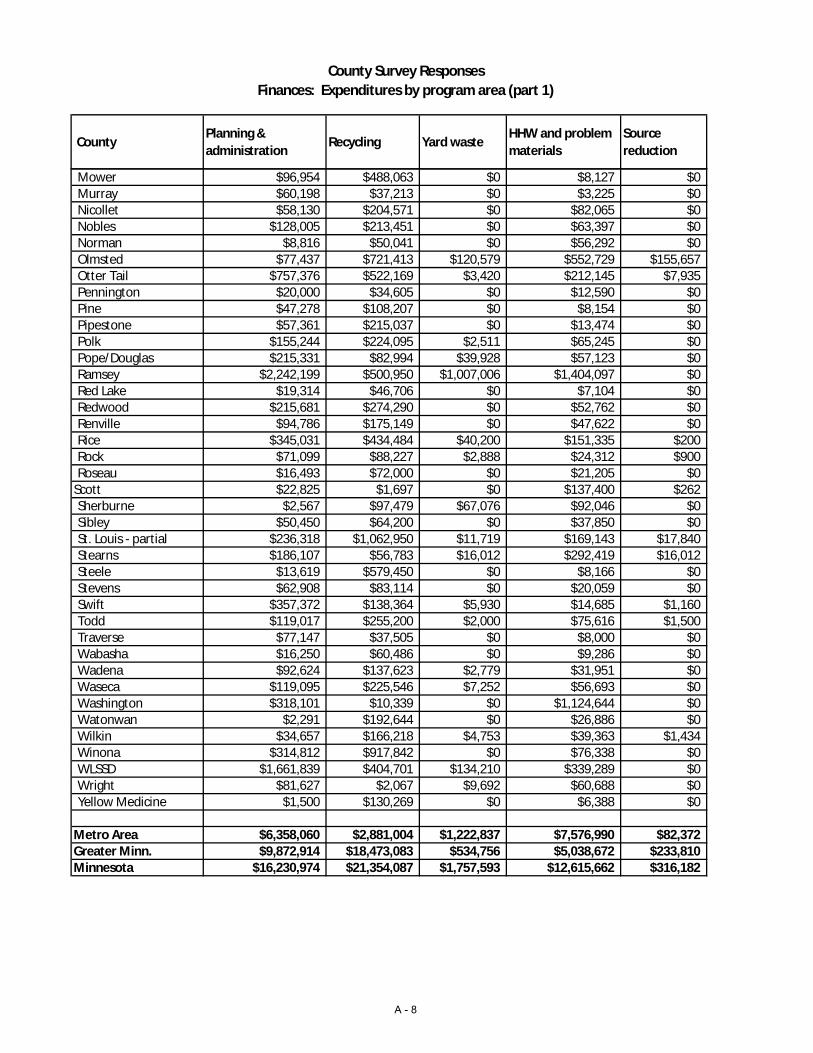
County Survey ResponsesFinances: Expenditures by program area (part 1)
County Planning & administration
Recycling Yard waste HHW and problem materials
Source reduction
Aitkin $153,330 $107,252 $300 $10,070 $1,317Anoka $763,771 $52,909 $78,528 $476,645 $82,371Becker $214,498 $584,649 $0 $63,286 $0Beltrami $0 $832,433 $0 $22,855 $0Benton $124,690 $270 $0 $91,126 $0Big Stone $70,559 $109,729 $0 $5,985 $0Blue Earth $82,028 $169,970 $4,457 $88,456 $0Brown $49,630 $346,280 $0 $47,612 $0Carlton $56,259 $71,039 $4,882 $29,717 $0Carver $486,463 $110,700 $43,866 $380,722 $0Cass $125,000 $678,000 $0 $102,581 $0Chippewa $16,733 $159,136 $0 $18,822 $0Chisago $200,311 $50,000 $0 $170,038 $0Clay $138,842 $335,505 $38,489 $101,424 $0Clearwater $21,322 $109,774 $1,356 $34,116 $0Cook $247,147 $184,164 $0 $10,533 $0Cottonwood $17,832 $558,534 $0 $1,949 $0Crow Wing $214,517 $14,192 $26,543 $121,924 $0Dakota $435,262 $17,447 $0 $1,468,282 $0Dodge $50,209 $302,800 $24,622 $12,538 $24,622Faribault $26,890 $48,754 $200 $16,933 $300Fillmore $0 $70,420 $0 $0 $0Freeborn $64,416 $306,209 $0 $17,636 $0Goodhue $333,850 $178,548 $0 $43,277 $0Grant $0 $229,024 $0 $19,621 $0Hennepin $2,109,697 $2,091,179 $26,361 $2,630,554 $1Houston $53,087 $281,251 $0 $3,771 $0Hubbard $27,779 $249,019 $12,027 $121,318 $0Isanti $63,130 $49,900 $0 $7,345 $0Itasca $110,041 $367,449 $0 $42,177 $0Jackson $20,889 $25,556 $0 $3,700 $0Kanabec $3,387 $50,936 $0 $2,984 $0Kandiyohi $264,392 $598,891 $0 $97,717 $0Kittson $32,157 $0 $0 $4,466 $0Koochiching $116,605 $128,331 $2,763 $24,598 $0Lac qui Parle $29,065 $74,184 $0 $19,654 $0Lake $37,499 $149,489 $475 $66,108 $0Lake of The Woods $4,264 $182,064 $1,275 $48,864 $0Le Sueur $57,045 $46,037 $0 $74,680 $0Lincoln $35,815 $205,769 $0 $12,128 $0Lyon $52,212 $263,881 $0 $152,578 $4,000Mahnomen $44,850 $14,834 $0 $8,142 $0Marshall $28,968 $0 $0 $14,045 $0Martin $40,103 $320,302 $1,150 $13,468 $670McLeod $711,148 $1,311,243 $253 $149,074 $0Meeker $11,196 $13,250 $0 $16,746 $0Mille Lacs $3,564 $57,094 $0 $10,533 $0Morrison $22,664 $127,546 $12,092 $264,949 $0
A - 7
County Survey ResponsesFinances: Expenditures by program area (part 1)
County Planning & administration
Recycling Yard waste HHW and problem materials
Source reduction
Mower $96,954 $488,063 $0 $8,127 $0Murray $60,198 $37,213 $0 $3,225 $0Nicollet $58,130 $204,571 $0 $82,065 $0Nobles $128,005 $213,451 $0 $63,397 $0Norman $8,816 $50,041 $0 $56,292 $0Olmsted $77,437 $721,413 $120,579 $552,729 $155,657Otter Tail $757,376 $522,169 $3,420 $212,145 $7,935Pennington $20,000 $34,605 $0 $12,590 $0Pine $47,278 $108,207 $0 $8,154 $0Pipestone $57,361 $215,037 $0 $13,474 $0Polk $155,244 $224,095 $2,511 $65,245 $0Pope/Douglas $215,331 $82,994 $39,928 $57,123 $0Ramsey $2,242,199 $500,950 $1,007,006 $1,404,097 $0Red Lake $19,314 $46,706 $0 $7,104 $0Redwood $215,681 $274,290 $0 $52,762 $0Renville $94,786 $175,149 $0 $47,622 $0Rice $345,031 $434,484 $40,200 $151,335 $200Rock $71,099 $88,227 $2,888 $24,312 $900Roseau $16,493 $72,000 $0 $21,205 $0
Scott $22,825 $1,697 $0 $137,400 $262Sherburne $2,567 $97,479 $67,076 $92,046 $0Sibley $50,450 $64,200 $0 $37,850 $0St. Louis - partial $236,318 $1,062,950 $11,719 $169,143 $17,840Stearns $186,107 $56,783 $16,012 $292,419 $16,012Steele $13,619 $579,450 $0 $8,166 $0Stevens $62,908 $83,114 $0 $20,059 $0Swift $357,372 $138,364 $5,930 $14,685 $1,160Todd $119,017 $255,200 $2,000 $75,616 $1,500Traverse $77,147 $37,505 $0 $8,000 $0Wabasha $16,250 $60,486 $0 $9,286 $0Wadena $92,624 $137,623 $2,779 $31,951 $0Waseca $119,095 $225,546 $7,252 $56,693 $0Washington $318,101 $10,339 $0 $1,124,644 $0Watonwan $2,291 $192,644 $0 $26,886 $0Wilkin $34,657 $166,218 $4,753 $39,363 $1,434Winona $314,812 $917,842 $0 $76,338 $0WLSSD $1,661,839 $404,701 $134,210 $339,289 $0Wright $81,627 $2,067 $9,692 $60,688 $0Yellow Medicine $1,500 $130,269 $0 $6,388 $0
Metro Area $6,358,060 $2,881,004 $1,222,837 $7,576,990 $82,372Greater Minn. $9,872,914 $18,473,083 $534,756 $5,038,672 $233,810Minnesota $16,230,974 $21,354,087 $1,757,593 $12,615,662 $316,182
A - 8

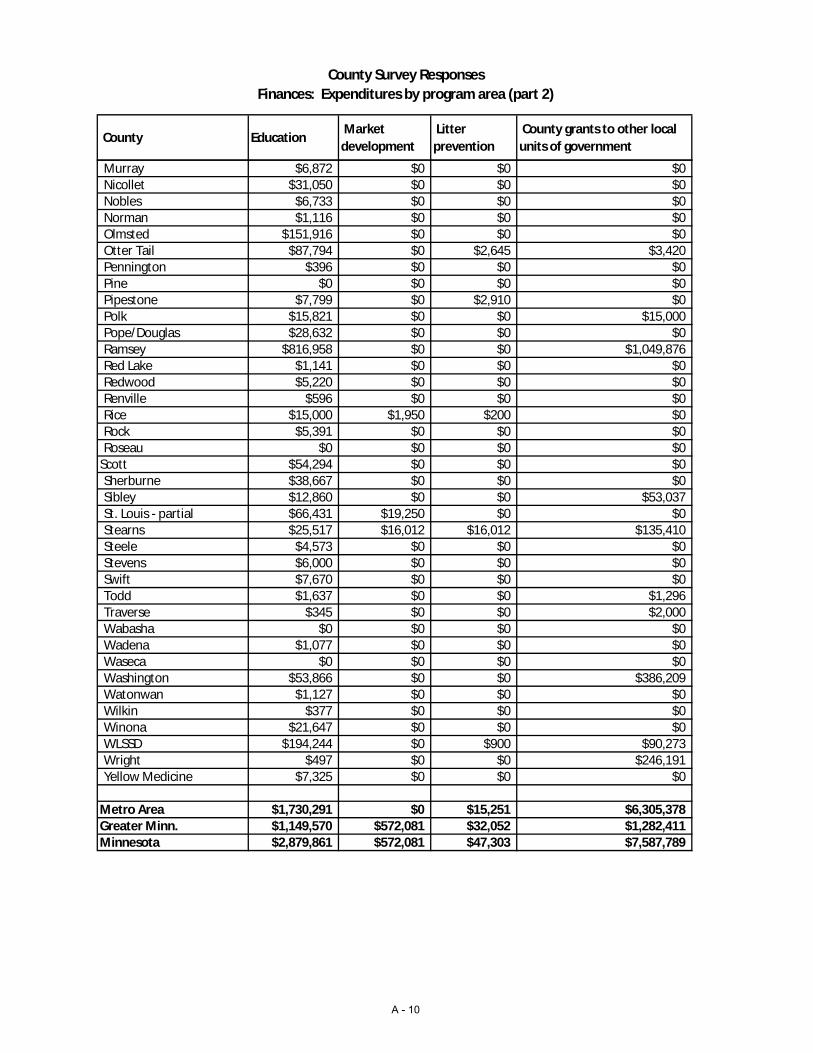
County Survey ResponsesFinances: Expenditures by program area (part 2)
County Education Market development
Litter prevention
County grants to other local units of government
Aitkin $6,002 $0 $0 $0Anoka $48,722 $0 $0 $1,483,214Becker $6,311 $0 $0 $57,823Beltrami $3,708 $0 $0 $0Benton $20,276 $0 $0 $96,925Big Stone $1,500 $0 $0 $0Blue Earth $14,002 $0 $2,068 $0Brown $2,337 $0 $0 $0Carlton $3,414 $0 $0 $15,000Carver $5,135 $0 $15,251 $90,276Cass $0 $0 $0 $0Chippewa $3,097 $0 $0 $0Chisago $26,612 $0 $0 $0Clay $15,135 $0 $0 $0Clearwater $1,703 $0 $0 $0Cook $436 $0 $0 $0Cottonwood $0 $0 $0 $0Crow Wing $24,758 $0 $4,023 $352,328Dakota $128,193 $0 $0 $437,031Dodge $40,768 $900 $0 $0Faribault $5,933 $159,077 $300 $0Fillmore $0 $0 $0 $0Freeborn $13,501 $0 $0 $0Goodhue $5,153 $0 $0 $0Grant $0 $0 $0 $0Hennepin $638,750 $0 $0 $2,858,773Houston $0 $0 $0 $0Hubbard $5,445 $0 $1,500 $0Isanti $0 $0 $0 $2,450Itasca $1,241 $0 $0 $37,500Jackson $10,135 $0 $0 $0Kanabec $434 $0 $0 $0Kandiyohi $0 $0 $0 $0Kittson $0 $0 $0 $25,000Koochiching $6,405 $0 $128 $0Lac qui Parle $4,900 $0 $0 $0Lake $0 $0 $0 $500Lake of The Woods $529 $0 $0 $0Le Sueur $32,014 $0 $0 $23,400Lincoln $2,738 $0 $0 $0Lyon $42,789 $0 $0 $0Mahnomen $796 $0 $0 $0Marshall $0 $0 $0 $25,000Martin $10,693 $229,193 $550 $0McLeod $30,878 $145,699 $816 $31,739Meeker $19,465 $0 $0 $21,294Mille Lacs $5,920 $0 $0 $0Morrison $1,042 $0 $0 $46,825Mower $8,402 $0 $0 $0
A - 9
County Survey ResponsesFinances: Expenditures by program area (part 2)
County Education Market development
Litter prevention
County grants to other local units of government
Murray $6,872 $0 $0 $0Nicollet $31,050 $0 $0 $0Nobles $6,733 $0 $0 $0Norman $1,116 $0 $0 $0Olmsted $151,916 $0 $0 $0Otter Tail $87,794 $0 $2,645 $3,420Pennington $396 $0 $0 $0Pine $0 $0 $0 $0Pipestone $7,799 $0 $2,910 $0Polk $15,821 $0 $0 $15,000Pope/Douglas $28,632 $0 $0 $0Ramsey $816,958 $0 $0 $1,049,876Red Lake $1,141 $0 $0 $0Redwood $5,220 $0 $0 $0Renville $596 $0 $0 $0Rice $15,000 $1,950 $200 $0Rock $5,391 $0 $0 $0Roseau $0 $0 $0 $0
Scott $54,294 $0 $0 $0Sherburne $38,667 $0 $0 $0Sibley $12,860 $0 $0 $53,037St. Louis - partial $66,431 $19,250 $0 $0Stearns $25,517 $16,012 $16,012 $135,410Steele $4,573 $0 $0 $0Stevens $6,000 $0 $0 $0Swift $7,670 $0 $0 $0Todd $1,637 $0 $0 $1,296Traverse $345 $0 $0 $2,000Wabasha $0 $0 $0 $0Wadena $1,077 $0 $0 $0Waseca $0 $0 $0 $0Washington $53,866 $0 $0 $386,209Watonwan $1,127 $0 $0 $0Wilkin $377 $0 $0 $0Winona $21,647 $0 $0 $0WLSSD $194,244 $0 $900 $90,273Wright $497 $0 $0 $246,191Yellow Medicine $7,325 $0 $0 $0
Metro Area $1,730,291 $0 $15,251 $6,305,378Greater Minn. $1,149,570 $572,081 $32,052 $1,282,411Minnesota $2,879,861 $572,081 $47,303 $7,587,789
A - 10

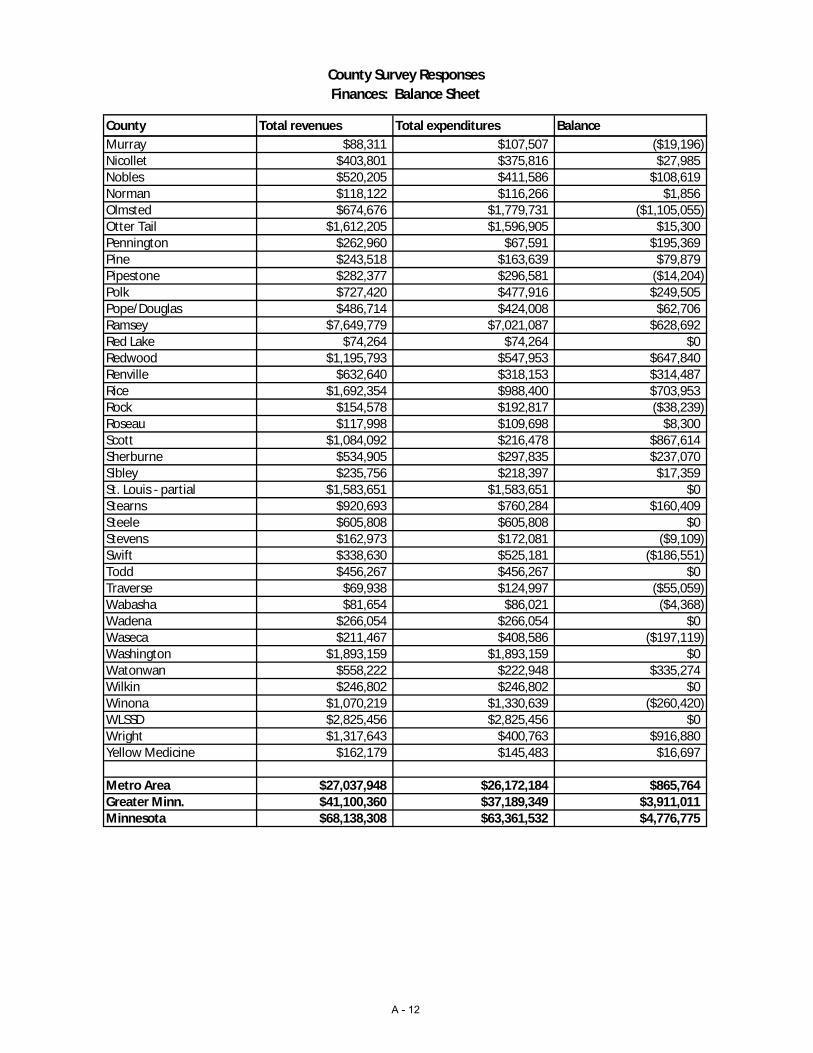
County Survey ResponsesFinances: Balance Sheet
County Total revenues Total expenditures BalanceAitkin $537,981 $278,272 $259,710Anoka $2,986,161 $2,986,161 $0Becker $614,174 $926,567 ($312,393)Beltrami $858,996 $858,996 $0Benton $310,318 $333,287 ($22,969)Big Stone $186,210 $187,773 ($1,563)Blue Earth $360,980 $360,980 $0Brown $438,736 $445,859 ($7,123)Carlton $145,956 $180,310 ($34,354)Carver $1,132,412 $1,132,412 $0Cass $927,619 $905,581 $22,038Chippewa $197,788 $197,788 $0Chisago $446,962 $446,962 $0Clay $710,510 $629,395 $81,115Clearwater $168,271 $168,271 ($0)Cook $442,279 $442,279 $0Cottonwood $332,549 $578,315 ($245,766)Crow Wing $758,285 $758,285 $0Dakota $2,486,217 $2,486,215 $2Dodge $426,463 $456,459 ($29,996)Faribault $258,387 $258,387 $0Fillmore $69,938 $70,420 ($482)Freeborn $554,949 $401,762 $153,187Goodhue $550,219 $560,828 ($10,609)Grant $325,730 $248,645 $77,085Hennepin $10,355,315 $10,355,315 $0Houston $338,109 $338,109 $0Hubbard $417,087 $417,087 $0Isanti $221,223 $122,825 $98,398Itasca $558,408 $558,408 $0Jackson $269,755 $60,281 $209,475Kanabec $181,492 $57,740 $123,752Kandiyohi $961,000 $961,000 $0Kittson $103,959 $61,623 $42,336Koochiching $278,809 $278,830 ($21)Lac qui Parle $414,781 $127,802 $286,979Lake $254,071 $254,071 $0Lake of The Woods $236,996 $236,996 $0Le Sueur $362,114 $233,176 $128,938Lincoln $276,480 $256,450 $20,030Lyon $515,460 $515,460 $0Mahnomen $77,362 $68,622 $8,740Marshall $93,900 $68,013 $25,887Martin $701,513 $616,129 $85,384McLeod $2,380,850 $2,380,850 $0Meeker $92,402 $81,951 $10,452Mille Lacs $195,204 $77,111 $118,093Morrison $475,118 $475,118 $0Mower $585,526 $601,547 ($16,021)
A - 11
County Survey ResponsesFinances: Balance Sheet
County Total revenues Total expenditures BalanceMurray $88,311 $107,507 ($19,196)Nicollet $403,801 $375,816 $27,985Nobles $520,205 $411,586 $108,619Norman $118,122 $116,266 $1,856Olmsted $674,676 $1,779,731 ($1,105,055)Otter Tail $1,612,205 $1,596,905 $15,300Pennington $262,960 $67,591 $195,369Pine $243,518 $163,639 $79,879Pipestone $282,377 $296,581 ($14,204)Polk $727,420 $477,916 $249,505Pope/Douglas $486,714 $424,008 $62,706Ramsey $7,649,779 $7,021,087 $628,692Red Lake $74,264 $74,264 $0Redwood $1,195,793 $547,953 $647,840Renville $632,640 $318,153 $314,487Rice $1,692,354 $988,400 $703,953Rock $154,578 $192,817 ($38,239)Roseau $117,998 $109,698 $8,300Scott $1,084,092 $216,478 $867,614Sherburne $534,905 $297,835 $237,070Sibley $235,756 $218,397 $17,359St. Louis - partial $1,583,651 $1,583,651 $0Stearns $920,693 $760,284 $160,409Steele $605,808 $605,808 $0Stevens $162,973 $172,081 ($9,109)Swift $338,630 $525,181 ($186,551)Todd $456,267 $456,267 $0Traverse $69,938 $124,997 ($55,059)Wabasha $81,654 $86,021 ($4,368)Wadena $266,054 $266,054 $0Waseca $211,467 $408,586 ($197,119)Washington $1,893,159 $1,893,159 $0Watonwan $558,222 $222,948 $335,274Wilkin $246,802 $246,802 $0Winona $1,070,219 $1,330,639 ($260,420)WLSSD $2,825,456 $2,825,456 $0Wright $1,317,643 $400,763 $916,880Yellow Medicine $162,179 $145,483 $16,697
Metro Area $27,037,948 $26,172,184 $865,764Greater Minn. $41,100,360 $37,189,349 $3,911,011Minnesota $68,138,308 $63,361,532 $4,776,775
A - 12
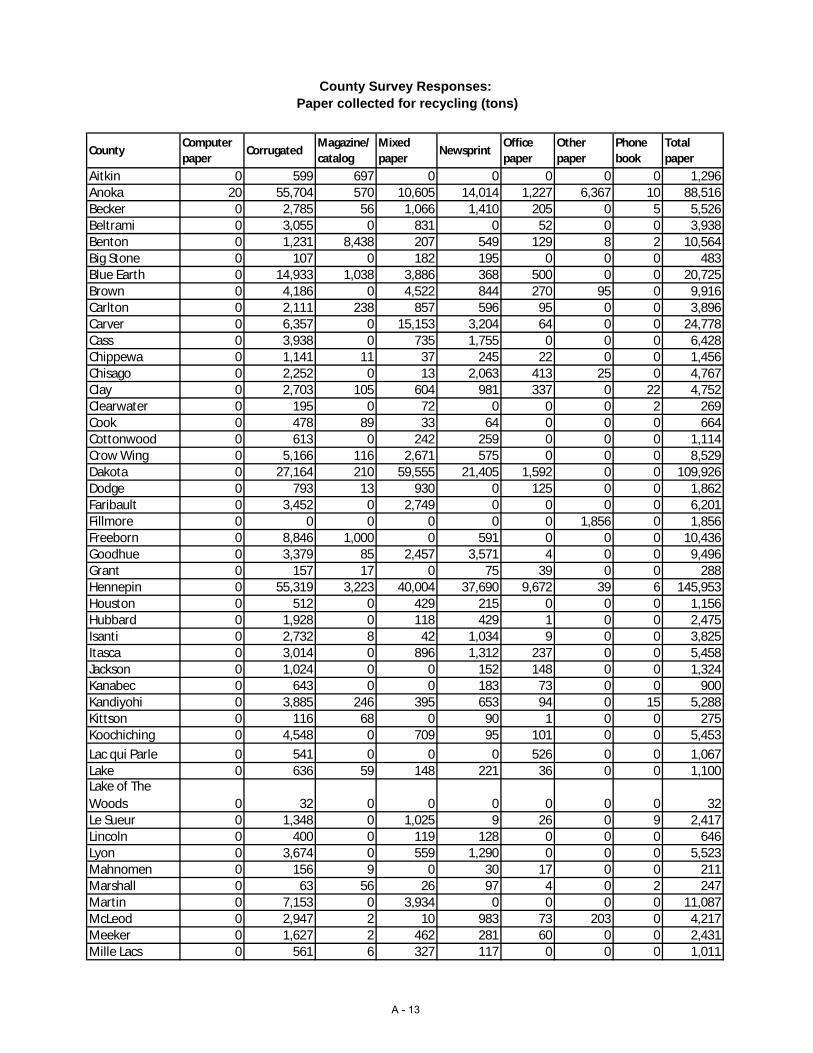
County Survey Responses: Paper collected for recycling (tons)
CountyComputer paper
CorrugatedMagazine/catalog
Mixed paper
NewsprintOffice paper
Other paper
Phone book
Total paper
Aitkin 0 599 697 0 0 0 0 0 1,296Anoka 20 55,704 570 10,605 14,014 1,227 6,367 10 88,516Becker 0 2,785 56 1,066 1,410 205 0 5 5,526Beltrami 0 3,055 0 831 0 52 0 0 3,938Benton 0 1,231 8,438 207 549 129 8 2 10,564Big Stone 0 107 0 182 195 0 0 0 483Blue Earth 0 14,933 1,038 3,886 368 500 0 0 20,725Brown 0 4,186 0 4,522 844 270 95 0 9,916Carlton 0 2,111 238 857 596 95 0 0 3,896Carver 0 6,357 0 15,153 3,204 64 0 0 24,778Cass 0 3,938 0 735 1,755 0 0 0 6,428Chippewa 0 1,141 11 37 245 22 0 0 1,456Chisago 0 2,252 0 13 2,063 413 25 0 4,767Clay 0 2,703 105 604 981 337 0 22 4,752Clearwater 0 195 0 72 0 0 0 2 269Cook 0 478 89 33 64 0 0 0 664Cottonwood 0 613 0 242 259 0 0 0 1,114Crow Wing 0 5,166 116 2,671 575 0 0 0 8,529Dakota 0 27,164 210 59,555 21,405 1,592 0 0 109,926Dodge 0 793 13 930 0 125 0 0 1,862Faribault 0 3,452 0 2,749 0 0 0 0 6,201Fillmore 0 0 0 0 0 0 1,856 0 1,856Freeborn 0 8,846 1,000 0 591 0 0 0 10,436Goodhue 0 3,379 85 2,457 3,571 4 0 0 9,496Grant 0 157 17 0 75 39 0 0 288Hennepin 0 55,319 3,223 40,004 37,690 9,672 39 6 145,953Houston 0 512 0 429 215 0 0 0 1,156Hubbard 0 1,928 0 118 429 1 0 0 2,475Isanti 0 2,732 8 42 1,034 9 0 0 3,825Itasca 0 3,014 0 896 1,312 237 0 0 5,458Jackson 0 1,024 0 0 152 148 0 0 1,324Kanabec 0 643 0 0 183 73 0 0 900Kandiyohi 0 3,885 246 395 653 94 0 15 5,288Kittson 0 116 68 0 90 1 0 0 275Koochiching 0 4,548 0 709 95 101 0 0 5,453Lac qui Parle 0 541 0 0 0 526 0 0 1,067Lake 0 636 59 148 221 36 0 0 1,100Lake of The Woods 0 32 0 0 0 0 0 0 32Le Sueur 0 1,348 0 1,025 9 26 0 9 2,417Lincoln 0 400 0 119 128 0 0 0 646Lyon 0 3,674 0 559 1,290 0 0 0 5,523Mahnomen 0 156 9 0 30 17 0 0 211Marshall 0 63 56 26 97 4 0 2 247Martin 0 7,153 0 3,934 0 0 0 0 11,087McLeod 0 2,947 2 10 983 73 203 0 4,217Meeker 0 1,627 2 462 281 60 0 0 2,431Mille Lacs 0 561 6 327 117 0 0 0 1,011
A - 13
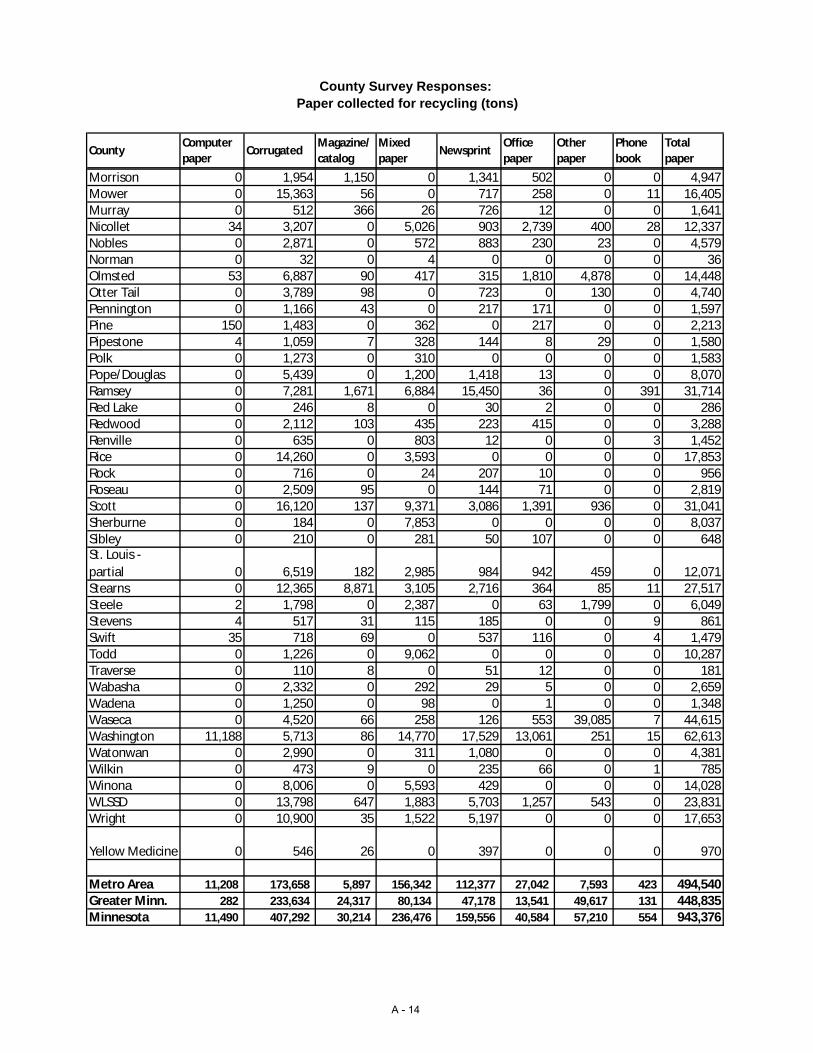
County Survey Responses: Paper collected for recycling (tons)
CountyComputer paper
CorrugatedMagazine/catalog
Mixed paper
NewsprintOffice paper
Other paper
Phone book
Total paper
Morrison 0 1,954 1,150 0 1,341 502 0 0 4,947Mower 0 15,363 56 0 717 258 0 11 16,405Murray 0 512 366 26 726 12 0 0 1,641Nicollet 34 3,207 0 5,026 903 2,739 400 28 12,337Nobles 0 2,871 0 572 883 230 23 0 4,579Norman 0 32 0 4 0 0 0 0 36Olmsted 53 6,887 90 417 315 1,810 4,878 0 14,448Otter Tail 0 3,789 98 0 723 0 130 0 4,740Pennington 0 1,166 43 0 217 171 0 0 1,597Pine 150 1,483 0 362 0 217 0 0 2,213Pipestone 4 1,059 7 328 144 8 29 0 1,580Polk 0 1,273 0 310 0 0 0 0 1,583Pope/Douglas 0 5,439 0 1,200 1,418 13 0 0 8,070Ramsey 0 7,281 1,671 6,884 15,450 36 0 391 31,714Red Lake 0 246 8 0 30 2 0 0 286Redwood 0 2,112 103 435 223 415 0 0 3,288Renville 0 635 0 803 12 0 0 3 1,452Rice 0 14,260 0 3,593 0 0 0 0 17,853Rock 0 716 0 24 207 10 0 0 956Roseau 0 2,509 95 0 144 71 0 0 2,819Scott 0 16,120 137 9,371 3,086 1,391 936 0 31,041Sherburne 0 184 0 7,853 0 0 0 0 8,037Sibley 0 210 0 281 50 107 0 0 648St. Louis - partial 0 6,519 182 2,985 984 942 459 0 12,071Stearns 0 12,365 8,871 3,105 2,716 364 85 11 27,517Steele 2 1,798 0 2,387 0 63 1,799 0 6,049Stevens 4 517 31 115 185 0 0 9 861Swift 35 718 69 0 537 116 0 4 1,479Todd 0 1,226 0 9,062 0 0 0 0 10,287Traverse 0 110 8 0 51 12 0 0 181Wabasha 0 2,332 0 292 29 5 0 0 2,659Wadena 0 1,250 0 98 0 1 0 0 1,348Waseca 0 4,520 66 258 126 553 39,085 7 44,615Washington 11,188 5,713 86 14,770 17,529 13,061 251 15 62,613Watonwan 0 2,990 0 311 1,080 0 0 0 4,381Wilkin 0 473 9 0 235 66 0 1 785Winona 0 8,006 0 5,593 429 0 0 0 14,028WLSSD 0 13,798 647 1,883 5,703 1,257 543 0 23,831Wright 0 10,900 35 1,522 5,197 0 0 0 17,653
Yellow Medicine 0 546 26 0 397 0 0 0 970
Metro Area 11,208 173,658 5,897 156,342 112,377 27,042 7,593 423 494,540Greater Minn. 282 233,634 24,317 80,134 47,178 13,541 49,617 131 448,835Minnesota 11,490 407,292 30,214 236,476 159,556 40,584 57,210 554 943,376
A - 14
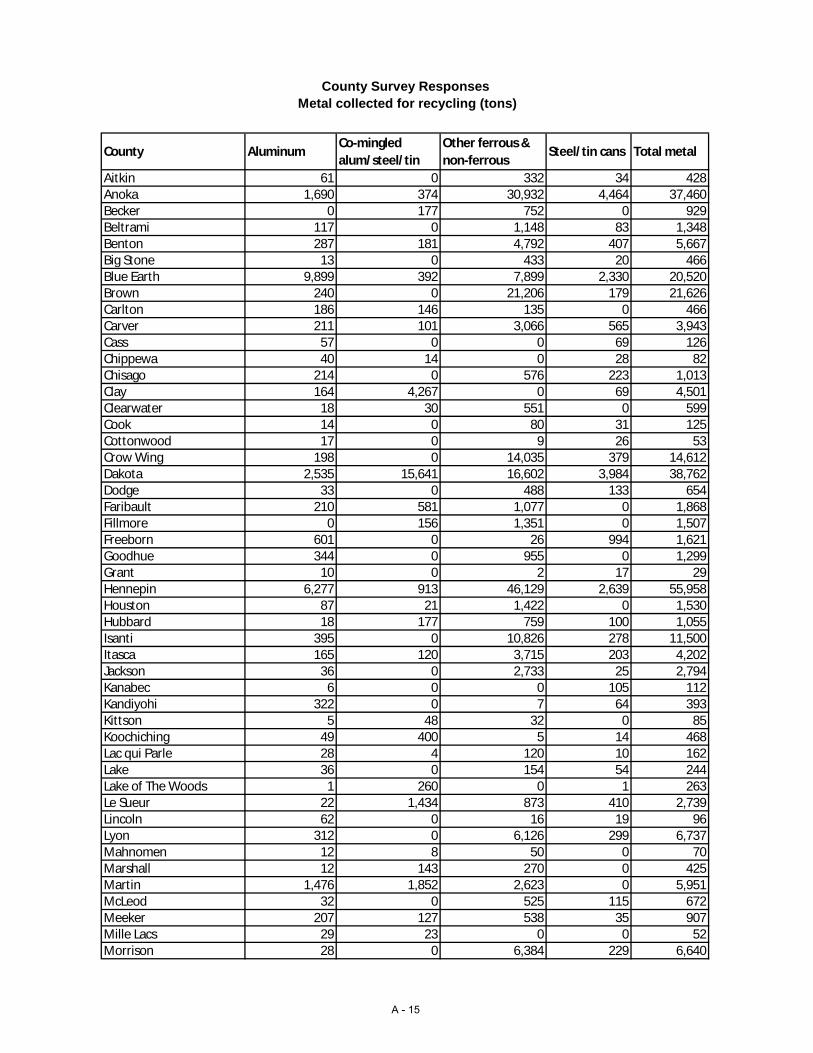
County Survey Responses Metal collected for recycling (tons)
County AluminumCo-mingled alum/steel/tin
Other ferrous & non-ferrous
Steel/tin cans Total metal
Aitkin 61 0 332 34 428Anoka 1,690 374 30,932 4,464 37,460Becker 0 177 752 0 929Beltrami 117 0 1,148 83 1,348Benton 287 181 4,792 407 5,667Big Stone 13 0 433 20 466Blue Earth 9,899 392 7,899 2,330 20,520Brown 240 0 21,206 179 21,626Carlton 186 146 135 0 466Carver 211 101 3,066 565 3,943Cass 57 0 0 69 126Chippewa 40 14 0 28 82Chisago 214 0 576 223 1,013Clay 164 4,267 0 69 4,501Clearwater 18 30 551 0 599Cook 14 0 80 31 125Cottonwood 17 0 9 26 53Crow Wing 198 0 14,035 379 14,612Dakota 2,535 15,641 16,602 3,984 38,762Dodge 33 0 488 133 654Faribault 210 581 1,077 0 1,868Fillmore 0 156 1,351 0 1,507Freeborn 601 0 26 994 1,621Goodhue 344 0 955 0 1,299Grant 10 0 2 17 29Hennepin 6,277 913 46,129 2,639 55,958Houston 87 21 1,422 0 1,530Hubbard 18 177 759 100 1,055Isanti 395 0 10,826 278 11,500Itasca 165 120 3,715 203 4,202Jackson 36 0 2,733 25 2,794Kanabec 6 0 0 105 112Kandiyohi 322 0 7 64 393Kittson 5 48 32 0 85Koochiching 49 400 5 14 468Lac qui Parle 28 4 120 10 162Lake 36 0 154 54 244Lake of The Woods 1 260 0 1 263Le Sueur 22 1,434 873 410 2,739Lincoln 62 0 16 19 96Lyon 312 0 6,126 299 6,737Mahnomen 12 8 50 0 70Marshall 12 143 270 0 425Martin 1,476 1,852 2,623 0 5,951McLeod 32 0 525 115 672Meeker 207 127 538 35 907Mille Lacs 29 23 0 0 52Morrison 28 0 6,384 229 6,640
A - 15
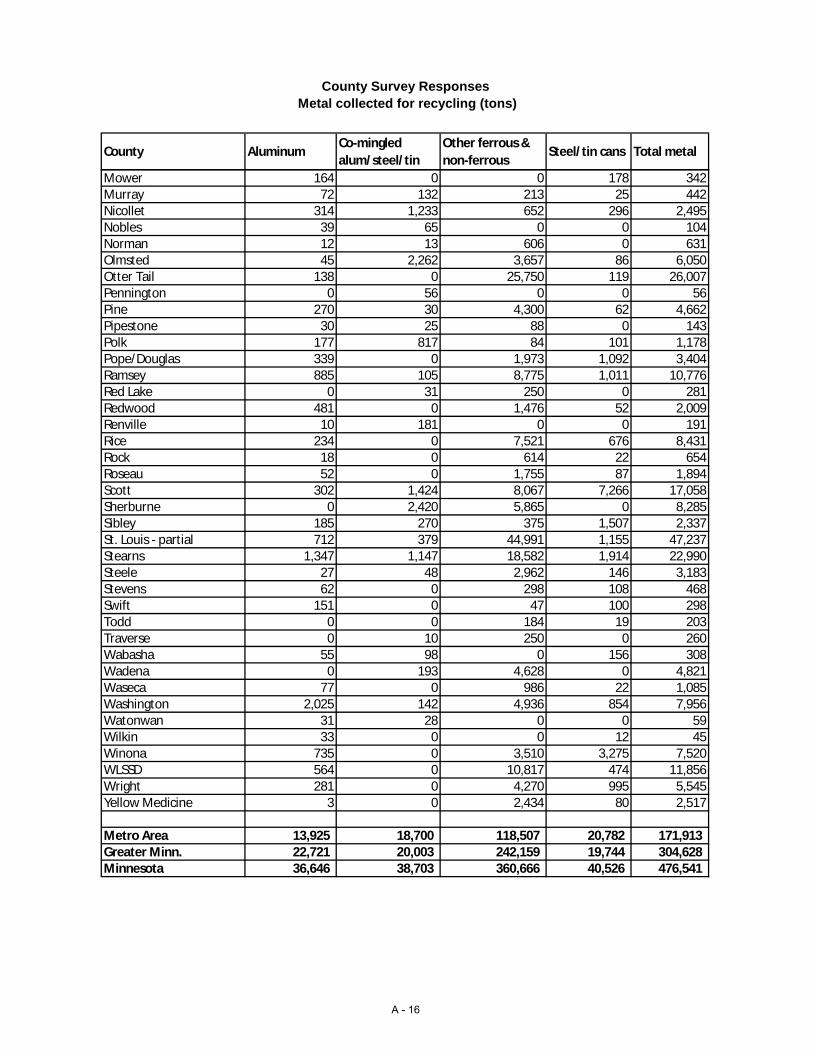
County Survey Responses Metal collected for recycling (tons)
County AluminumCo-mingled alum/steel/tin
Other ferrous & non-ferrous
Steel/tin cans Total metal
Mower 164 0 0 178 342Murray 72 132 213 25 442Nicollet 314 1,233 652 296 2,495Nobles 39 65 0 0 104Norman 12 13 606 0 631Olmsted 45 2,262 3,657 86 6,050Otter Tail 138 0 25,750 119 26,007Pennington 0 56 0 0 56Pine 270 30 4,300 62 4,662Pipestone 30 25 88 0 143Polk 177 817 84 101 1,178Pope/Douglas 339 0 1,973 1,092 3,404Ramsey 885 105 8,775 1,011 10,776Red Lake 0 31 250 0 281Redwood 481 0 1,476 52 2,009Renville 10 181 0 0 191Rice 234 0 7,521 676 8,431Rock 18 0 614 22 654Roseau 52 0 1,755 87 1,894Scott 302 1,424 8,067 7,266 17,058Sherburne 0 2,420 5,865 0 8,285Sibley 185 270 375 1,507 2,337St. Louis - partial 712 379 44,991 1,155 47,237Stearns 1,347 1,147 18,582 1,914 22,990Steele 27 48 2,962 146 3,183Stevens 62 0 298 108 468Swift 151 0 47 100 298Todd 0 0 184 19 203Traverse 0 10 250 0 260Wabasha 55 98 0 156 308Wadena 0 193 4,628 0 4,821Waseca 77 0 986 22 1,085Washington 2,025 142 4,936 854 7,956Watonwan 31 28 0 0 59Wilkin 33 0 0 12 45Winona 735 0 3,510 3,275 7,520WLSSD 564 0 10,817 474 11,856Wright 281 0 4,270 995 5,545Yellow Medicine 3 0 2,434 80 2,517
Metro Area 13,925 18,700 118,507 20,782 171,913 Greater Minn. 22,721 20,003 242,159 19,744 304,628 Minnesota 36,646 38,703 360,666 40,526 476,541
A - 16

County Survey Responses Glass collected for recycling (tons)
County Food & beverage Other glass Total glass
Aitkin 244 0 244Anoka 5,864 26 5,890Becker 535 0 535Beltrami 878 19 897Benton 920 265 1,185Big Stone 123 0 123Blue Earth 982 0 982Brown 367 0 367Carlton 677 0 677Carver 2,270 0 2,270Cass 877 0 877Chippewa 54 0 54Chisago 903 0 903Clay 502 0 502Clearwater 2 0 2Cook 221 0 221Cottonwood 164 0 164Crow Wing 1,162 0 1,162Dakota 10,870 1,802 12,673Dodge 533 383 916Faribault 228 0 228Fillmore 510 0 510Freeborn 488 0 488Goodhue 469 0 469Grant 95 0 95Hennepin 23,586 0 23,586Houston 181 0 181Hubbard 427 0 427Isanti 368 0 368Itasca 1,247 0 1,247Jackson 80 0 80Kanabec 42 0 42Kandiyohi 339 0 339Kittson 0 0 0Koochiching 95 0 95Lac qui Parle 59 0 59Lake 394 0 394Lake of The Woods 0 16 16Le Sueur 256 0 256Lincoln 86 0 86Lyon 373 0 373Mahnomen 30 0 30Marshall 0 0 0Martin 882 0 882McLeod 386 0 386Meeker 201 0 201Mille Lacs 197 0 197Morrison 432 0 432Mower 353 0 353
A - 17

County Survey Responses Glass collected for recycling (tons)
County Food & beverage Other glass Total glass
Murray 157 0 157Nicollet 275 0 275Nobles 370 0 370Norman 53 0 53Olmsted 161 1,168 1,329Otter Tail 681 0 681Pennington 92 0 92Pine 341 0 341Pipestone 171 0 171Polk 245 0 245Pope/Douglas 1,908 0 1,908Ramsey 10,191 0 10,191Red Lake 34 0 34Redwood 239 0 239Renville 190 0 190Rice 1,035 1,645 2,680Rock 117 0 117Roseau 0 1,806 1,806Scott 708 0 708Sherburne 2,178 0 2,178Sibley 69 0 69St. Louis - partial 849 1 850Stearns 4,732 1,232 5,965Steele 450 19,136 19,586Stevens 129 0 129Swift 318 0 318Todd 133 0 133Traverse 34 0 34Wabasha 344 0 344Wadena 161 0 161Waseca 107 0 107Washington 3,317 0 3,317Watonwan 177 0 177Wilkin 71 0 71Winona 734 0 734WLSSD 3,479 0 3,479Wright 3,087 0 3,087Yellow Medicine 233 0 233
Metro Area 56,806 1,829 58,635 Greater Minn. (56,806) 25,671 66,388 Minnesota 27,499 125,023
A - 18
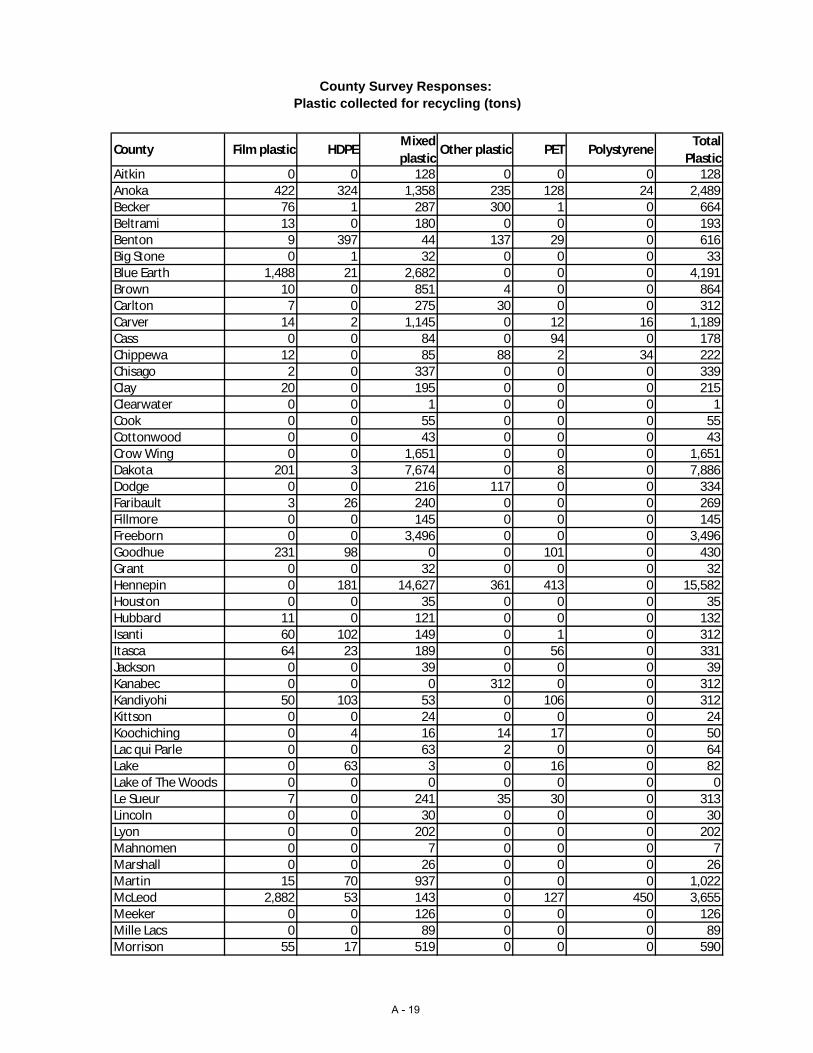
County Survey Responses: Plastic collected for recycling (tons)
County Film plastic HDPEMixed plastic
Other plastic PET PolystyreneTotal
PlasticAitkin 0 0 128 0 0 0 128Anoka 422 324 1,358 235 128 24 2,489Becker 76 1 287 300 1 0 664Beltrami 13 0 180 0 0 0 193Benton 9 397 44 137 29 0 616Big Stone 0 1 32 0 0 0 33Blue Earth 1,488 21 2,682 0 0 0 4,191Brown 10 0 851 4 0 0 864Carlton 7 0 275 30 0 0 312Carver 14 2 1,145 0 12 16 1,189Cass 0 0 84 0 94 0 178Chippewa 12 0 85 88 2 34 222Chisago 2 0 337 0 0 0 339Clay 20 0 195 0 0 0 215Clearwater 0 0 1 0 0 0 1Cook 0 0 55 0 0 0 55Cottonwood 0 0 43 0 0 0 43Crow Wing 0 0 1,651 0 0 0 1,651Dakota 201 3 7,674 0 8 0 7,886Dodge 0 0 216 117 0 0 334Faribault 3 26 240 0 0 0 269Fillmore 0 0 145 0 0 0 145Freeborn 0 0 3,496 0 0 0 3,496Goodhue 231 98 0 0 101 0 430Grant 0 0 32 0 0 0 32Hennepin 0 181 14,627 361 413 0 15,582Houston 0 0 35 0 0 0 35Hubbard 11 0 121 0 0 0 132Isanti 60 102 149 0 1 0 312Itasca 64 23 189 0 56 0 331Jackson 0 0 39 0 0 0 39Kanabec 0 0 0 312 0 0 312Kandiyohi 50 103 53 0 106 0 312Kittson 0 0 24 0 0 0 24Koochiching 0 4 16 14 17 0 50Lac qui Parle 0 0 63 2 0 0 64Lake 0 63 3 0 16 0 82Lake of The Woods 0 0 0 0 0 0 0Le Sueur 7 0 241 35 30 0 313Lincoln 0 0 30 0 0 0 30Lyon 0 0 202 0 0 0 202Mahnomen 0 0 7 0 0 0 7Marshall 0 0 26 0 0 0 26Martin 15 70 937 0 0 0 1,022McLeod 2,882 53 143 0 127 450 3,655Meeker 0 0 126 0 0 0 126Mille Lacs 0 0 89 0 0 0 89Morrison 55 17 519 0 0 0 590
A - 19

County Survey Responses: Plastic collected for recycling (tons)
County Film plastic HDPEMixed plastic
Other plastic PET PolystyreneTotal
PlasticMower 34 131 0 65 12 0 242Murray 2 3 58 0 0 0 63Nicollet 0 45 540 200 88 0 873Nobles 101 6 98 221 0 0 427Norman 0 0 23 0 0 0 23Olmsted 102 2 147 189 2 57 500Otter Tail 0 116 0 117 206 0 439Pennington 0 18 54 10 0 0 81Pine 9 52 65 28 88 0 242Pipestone 261 1 72 0 7 12 353Polk 0 0 123 0 0 0 123Pope/Douglas 140 1 271 101 1 0 513Ramsey 265 423 1,059 68 498 0 2,314Red Lake 0 0 9 0 0 0 9Redwood 150 77 201 0 50 0 478Renville 0 0 81 0 0 0 81Rice 130 276 132 138 276 0 952Rock 0 3 0 20 38 0 62Roseau 321 0 69 57 0 0 447Scott 8 112 489 0 256 0 865Sherburne 0 0 1,105 0 0 0 1,105Sibley 0 0 42 24 10 0 76St. Louis - partial 109 276 41 0 323 0 749Stearns 183 1,847 184 701 139 1 3,055Steele 95 1 188 134 1 17 436Stevens 0 0 44 0 0 0 44Swift 0 67 0 0 83 0 150Todd 0 0 61 0 0 0 61Traverse 0 0 14 0 0 0 14Wabasha 0 23 21 0 38 0 82Wadena 12 0 225 0 0 0 238Waseca 0 18 0 47 34 0 99Washington 218 30 1,102 0 198 0 1,548Watonwan 0 0 442 0 0 0 442Wilkin 0 0 20 0 0 0 20Winona 0 0 349 0 0 0 349WLSSD 223 316 437 11 348 0 1,335Wright 42 1 2,813 0 1 0 2,858Yellow Medicine 0 0 74 0 0 0 74
Metro Area 1,128 1,074 27,453 664 1,513 40 31,872 Greater Minn. 6,930 4,259 22,073 3,100 2,327 571 39,260 Minnesota 8,059 5,333 49,526 3,763 3,840 611 71,132
A - 20
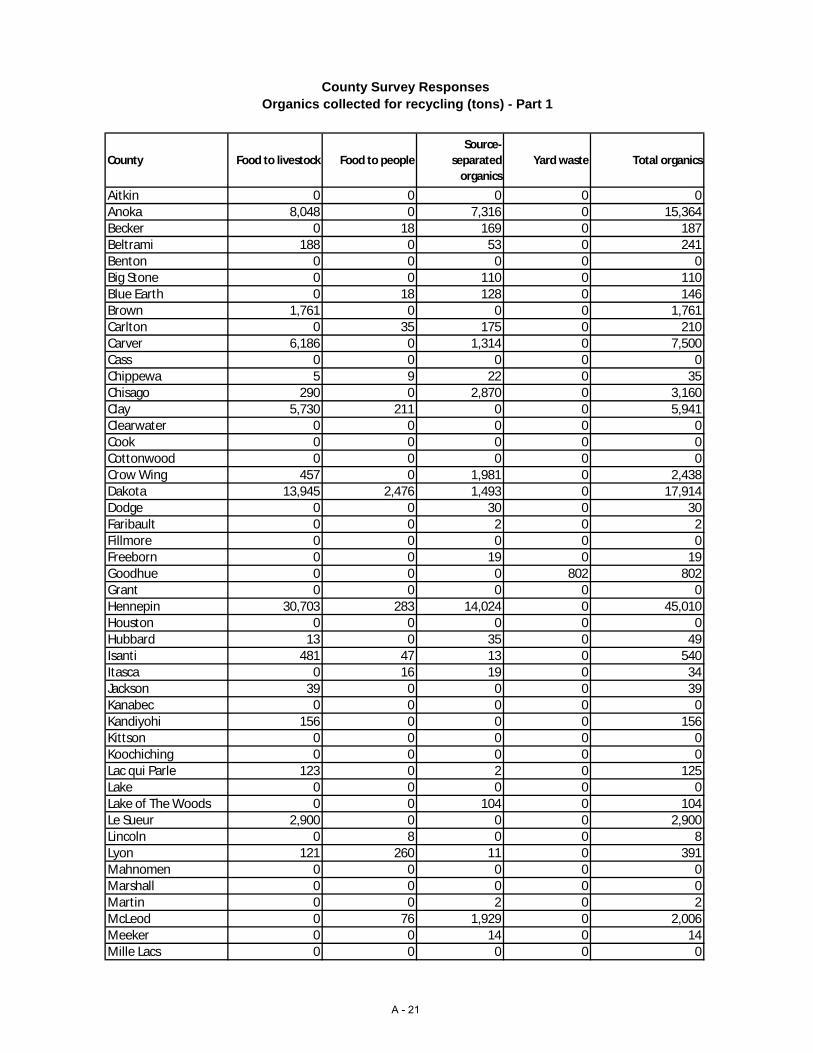
County Survey Responses Organics collected for recycling (tons) - Part 1
County Food to livestock Food to peopleSource-
separated organics
Yard waste Total organics
Aitkin 0 0 0 0 0Anoka 8,048 0 7,316 0 15,364Becker 0 18 169 0 187Beltrami 188 0 53 0 241Benton 0 0 0 0 0Big Stone 0 0 110 0 110Blue Earth 0 18 128 0 146Brown 1,761 0 0 0 1,761Carlton 0 35 175 0 210Carver 6,186 0 1,314 0 7,500Cass 0 0 0 0 0Chippewa 5 9 22 0 35Chisago 290 0 2,870 0 3,160Clay 5,730 211 0 0 5,941Clearwater 0 0 0 0 0Cook 0 0 0 0 0Cottonwood 0 0 0 0 0Crow Wing 457 0 1,981 0 2,438Dakota 13,945 2,476 1,493 0 17,914Dodge 0 0 30 0 30Faribault 0 0 2 0 2Fillmore 0 0 0 0 0Freeborn 0 0 19 0 19Goodhue 0 0 0 802 802Grant 0 0 0 0 0Hennepin 30,703 283 14,024 0 45,010Houston 0 0 0 0 0Hubbard 13 0 35 0 49Isanti 481 47 13 0 540Itasca 0 16 19 0 34Jackson 39 0 0 0 39Kanabec 0 0 0 0 0Kandiyohi 156 0 0 0 156Kittson 0 0 0 0 0Koochiching 0 0 0 0 0Lac qui Parle 123 0 2 0 125Lake 0 0 0 0 0Lake of The Woods 0 0 104 0 104Le Sueur 2,900 0 0 0 2,900Lincoln 0 8 0 0 8Lyon 121 260 11 0 391Mahnomen 0 0 0 0 0Marshall 0 0 0 0 0Martin 0 0 2 0 2McLeod 0 76 1,929 0 2,006Meeker 0 0 14 0 14Mille Lacs 0 0 0 0 0
A - 21

County Survey Responses Organics collected for recycling (tons) - Part 1
County Food to livestock Food to peopleSource-
separated organics
Yard waste Total organics
Morrison 10 9 33 0 52Mower 0 0 1,831 0 1,831Murray 0 0 27 0 27Nicollet 0 0 125 0 125Nobles 82 11 25 0 118Norman 0 0 0 0 0Olmsted 60,892 143 83 0 61,119Otter Tail 19,431 0 0 0 19,431Pennington 0 0 0 0 0Pine 673 40 23 0 736Pipestone 89 1 238 0 327Polk 2,294 0 1,103 0 3,396Pope/Douglas 8 24 1,470 0 1,503Ramsey 46,789 1,671 1,832 0 50,292Red Lake 0 0 0 0 0Redwood 1,251 437 0 0 1,688Renville 650 220 0 0 870Rice 27,674 0 711 0 28,385Rock 0 0 0 0 0Roseau 0 0 0 0 0Scott 0 0 1,478 0 1,478Sherburne 550 0 149 0 699Sibley 0 2,600 0 0 2,600St. Louis - partial 9 9 221 0 239Stearns 0 38 107 0 145Steele 18 0 0 0 18Stevens 0 0 34 0 34Swift 0 0 1,620 0 1,620Todd 0 0 0 0 0Traverse 0 0 0 0 0Wabasha 0 0 0 0 0Wadena 0 0 18 0 18Waseca 0 0 0 0 0Washington 11,477 1,387 558 0 13,422Watonwan 0 0 0 0 0Wilkin 0 0 0 0 0Winona 9,055 0 0 0 9,055WLSSD 104 617 3,141 0 3,862Wright 0 0 44 0 44Yellow Medicine 0 0 47 0 47
Metro Area 117,148 5,817 28,014 - 150,980 Greater Minn. 135,053 4,846 18,736 802 158,635 Minnesota 252,202 10,663 46,751 802 309,615
A - 22

County Survey Responses Textiles, other collected for recycling (tons) - Part 2
County Carpet TextilesMattresses & box springs
PalletsUnspecified or Other
Total
Aitkin 0 79 0 190 0 269Anoka 50 2,406 49 3,886 8,142 14,534Becker 0 235 0 22 0 257Beltrami 0 0 0 8 0 8Benton 0 0 0 0 0 0Big Stone 0 3 0 0 0 3Blue Earth 0 223 0 13,451 0 13,674Brown 0 4 0 902 151 1,057Carlton 0 67 30 0 5 102Carver 33 98 0 1,053 0 1,184Cass 0 17 0 0 973 990Chippewa 0 13 0 0 723 737Chisago 1 4 28 25 0 58Clay 0 0 0 0 0 0Clearwater 0 0 0 0 0 0Cook 0 0 0 0 0 0Cottonwood 0 23 0 0 0 23Crow Wing 0 253 97 3,027 2 3,379Dakota 0 1,195 13 14,123 45,855 61,186Dodge 6 6 0 427 50 488Faribault 0 12 0 0 0 12Fillmore 1 18 1 0 0 20Freeborn 0 1 0 20 0 21Goodhue 0 0 10 14 0 24Grant 0 0 0 0 51 51Hennepin 0 0 0 325 292,437 292,762Houston 0 0 0 0 0 0Hubbard 0 90 0 0 0 90Isanti 4 0 26 0 0 30Itasca 0 0 0 69 2 71Jackson 0 22 0 188 0 209Kanabec 1 0 1 0 0 2Kandiyohi 0 0 0 0 0 0Kittson 0 0 0 0 0 0Koochiching 0 0 0 2 0 2Lac qui Parle 0 32 0 8 1 41Lake 0 0 3 0 20 23Lake of The Woods 0 0 0 0 0 0Le Sueur 0 4 1 1,894 1 1,899Lincoln 0 75 0 2 0 77Lyon 0 11 0 0 3,614 3,625Mahnomen 0 0 0 0 320 320Marshall 0 0 0 0 0 0Martin 0 120 0 12 0 132McLeod 0 0 8 553 4,594 5,155Meeker 0 0 0 0 68 68Mille Lacs 0 0 0 0 0 0Morrison 0 77 0 653 0 730
A - 23

County Survey Responses Textiles, other collected for recycling (tons) - Part 2
County Carpet TextilesMattresses & box springs
PalletsUnspecified or Other
Total
Mower 0 84 0 3,075 0 3,159Murray 0 152 0 115 0 267Nicollet 0 10 0 1,561 0 1,572Nobles 0 156 0 721 0 877Norman 0 0 0 0 0 0Olmsted 0 511 0 568 0 1,080Otter Tail 0 0 39 455 236 730Pennington 0 0 0 0 0 0Pine 1 10 0 1 0 12Pipestone 0 132 0 1,987 0 2,119Polk 0 0 0 70 1,000 1,070Pope/Douglas 120 367 0 53 125 665Ramsey 0 1,187 9 961 197,404 199,561Red Lake 0 0 0 0 0 0Redwood 26 1,266 7 2,221 2,758 6,278Renville 20 45 0 4 0 69Rice 0 94 0 10,656 60 10,810Rock 0 37 0 0 0 37Roseau 0 0 0 2,094 0 2,094Scott 0 0 0 2,454 0 2,454Sherburne 0 36 0 139 3,883 4,059Sibley 6 0 1 20 1 27St. Louis - partial 0 27 97 4 114 242Stearns 0 0 0 1,317 1 1,318Steele 0 0 0 1,274 478 1,752Stevens 0 15 3 0 0 18Swift 0 0 0 0 0 0Todd 0 0 0 0 0 0Traverse 0 0 0 0 0 0Wabasha 0 0 0 0 0 0Wadena 0 0 18 6 0 25Waseca 0 60 0 57 0 117Washington 0 5 0 151 4,728 4,884Watonwan 0 2 0 0 0 2Wilkin 0 0 0 0 0 0Winona 0 0 0 1,331 564 1,895WLSSD 28 1,452 0 537 691 2,708Wright 0 6 0 56 0 62Yellow Medicine 0 16 0 0 0 16
Metro Area 83 4,891 71 22,954 548,566 576,566 Greater Minn. 213 5,867 370 49,789 20,486 76,724Minnesota 295 10,758 441 72,743 569,052 653,290
A - 24

County Survey ResponsesProblem materials (banned) collected for recycling (tons)
County Antifreeze ElectronicsFluorescent & HID lamps
HHWLatex paint
Major appliances
Used oilUsed oil filters
Vehicle batteries
Waste tires
Total problem matls
Aitkin 2 38 2 5 2 107 100 8 102 162 527Anoka 77 680 52 6 143 2,049 273 160 2,096 683 6,218Becker 2 96 45 12 19 199 206 16 204 382 1,181Beltrami 3 178 5 18 18 274 37 21 280 234 1,069Benton 0 17 0 1 9 353 31 18 241 78 749Big Stone 0 12 1 1 1 31 33 4 31 27 141Blue Earth 39 835 23 38 47 391 632 30 1,126 1,745 4,907Brown 2 84 2 7 3 153 91 12 156 124 635Carlton 6 63 3 5 9 213 157 24 218 108 806Carver 5 459 12 75 92 573 76 45 586 191 2,114Cass 1 95 9 13 7 172 23 13 176 127 635Chippewa 0 32 2 0 0 73 17 6 75 242 446Chisago 4 127 3 124 57 322 51 25 330 107 1,151Clay 25 129 17 7 16 378 270 38 371 303 1,554Clearwater 0 16 1 2 1 0 7 4 54 59 145Cook 0 10 0 0 1 31 11 2 32 10 98Cottonwood 0 42 0 0 0 70 9 5 71 67 266Crow Wing 22 221 32 2 21 507 51 48 411 126 1,442Dakota 55 5,526 88 130 348 2,452 327 191 2,509 817 12,442Dodge 4 32 0 0 0 122 16 10 125 48 357Faribault 2 36 1 2 1 102 15 9 92 44 304Fillmore 4 266 6 8 2 125 23 10 128 69 641Freeborn 3 40 1 7 5 187 36 14 191 62 547Goodhue 0 32 0 20 14 279 37 22 285 93 782Grant 0 12 2 3 4 36 5 3 37 12 113Hennepin 42 2,690 36 84 791 7,170 956 558 7,335 2,390 22,053Houston 0 172 3 1 0 113 15 9 116 179 607Hubbard 0 179 3 2 2 127 38 10 126 343 830Isanti 0 121 1 11 0 229 31 18 235 77 722Itasca 3 106 2 17 15 2,585 36 21 280 223 3,287Jackson 0 10 2 1 5 62 9 5 63 21 178Kanabec 1 0 0 0 0 96 40 8 98 32 275Kandiyohi 0 0 0 0 0 254 34 20 260 85 653Kittson 0 3 2 2 3 27 4 2 30 15 88Koochiching 0 31 1 4 2 79 11 6 81 39 256Lac qui Parle 2 28 2 7 13 72 20 3 44 44 236Lake 6 9 5 0 4 67 68 13 66 79 318Lake of The Woods 0 0 2 0 1 24 0 2 24 170 222Le Sueur 8 83 11 6 8 167 59 13 171 147 673Lincoln 0 14 1 6 0 35 43 3 39 63 202Lyon 0 71 5 0 32 156 21 12 159 52 509Mahnomen 0 6 0 0 1 33 4 3 34 11 92Marshall 0 6 1 2 3 57 8 5 60 40 181Martin 8 65 60 7 6 160 32 16 134 98 586McLeod 2 106 6 2,203 9 217 29 17 222 72 2,881Meeker 0 48 5 0 5 317 80 11 143 126 734Mille Lacs 0 5 0 2 10 155 21 0 0 0 192Morrison 5 82 5 0 0 198 164 15 203 249 922Mower 8 45 0 0 6 236 32 18 242 79 666
A - 25

County Survey ResponsesProblem materials (banned) collected for recycling (tons)
County Antifreeze ElectronicsFluorescent & HID lamps
HHWLatex paint
Major appliances
Used oilUsed oil filters
Vehicle batteries
Waste tires
Total problem matls
Murray 0 6 1 3 0 51 7 4 53 17 142Nicollet 4 138 23 7 7 198 55 15 203 103 753Nobles 0 50 4 6 8 130 25 10 136 62 431Norman 0 20 2 1 2 45 7 4 51 13 145Olmsted 12 392 79 60 121 895 119 70 6,508 298 8,555Otter Tail 9 126 2 290 372 346 917 27 353 573 3,016Pennington 0 33 4 4 5 85 11 7 87 28 263Pine 2 30 9 3 3 175 23 14 251 118 628Pipestone 0 83 3 3 4 60 27 4 60 31 276Polk 0 49 2 14 8 189 25 63 194 114 658Pope/Douglas 31 394 24 11 32 372 276 26 631 132 1,929Ramsey 12 181 26 329 304 3,151 420 245 3,223 1,050 8,942Red Lake 0 8 1 2 1 25 11 3 25 40 116Redwood 44 434 30 21 8 95 161 10 316 934 2,052Renville 20 87 4 0 3 92 12 7 95 127 448Rice 10 186 7 8 52 388 52 30 412 175 1,320Rock 0 51 2 1 2 57 8 5 59 344 528Roseau 2 25 14 6 3 93 23 11 108 81 366Scott 13 137 22 111 74 822 939 64 840 394 3,416Sherburne 0 289 4 10 80 541 72 42 554 180 1,773Sibley 5 18 5 6 7 99 12 7 93 125 376St. Louis - partial 55 314 15 164 29 609 1,903 116 496 1,764 5,464Stearns 9 56 0 0 0 912 122 71 933 304 2,407Steele 0 30 0 6 6 219 29 17 224 73 604Stevens 0 30 1 9 0 59 8 5 60 20 192Swift 0 27 3 0 0 58 8 5 59 19 179Todd 0 29 1 0 3 147 20 12 151 49 412Traverse 0 0 0 0 0 21 3 2 21 7 53Wabasha 0 0 0 0 0 129 17 10 132 43 331Wadena 1 44 2 3 7 83 11 6 92 28 276Waseca 0 0 4 3 0 114 15 13 117 335 602Washington 12 805 0 0 181 1,489 198 116 1,523 496 4,820Watonwan 0 0 0 0 0 67 9 5 69 22 172Wilkin 0 1 2 1 0 40 5 3 40 13 104Winona 0 0 0 0 0 309 41 24 317 103 794WLSSD 61 705 26 92 21 909 96 101 734 239 2,985Wright 1 99 2 19 26 771 335 60 788 257 2,358Yellow Medicine 0 19 2 2 0 206 8 5 63 21 326
Metro Area 215 10,478 236 734 1,933 17,705 3,190 1,379 18,113 6,022 60,005 Greater Minn. 430 7,378 551 3,297 1,170 18,178 7,131 1,385 22,049 13,268 74,836 Minnesota 645 17,856 787 4,031 3,104 35,884 10,321 2,763 40,161 19,290 134,841
A - 26
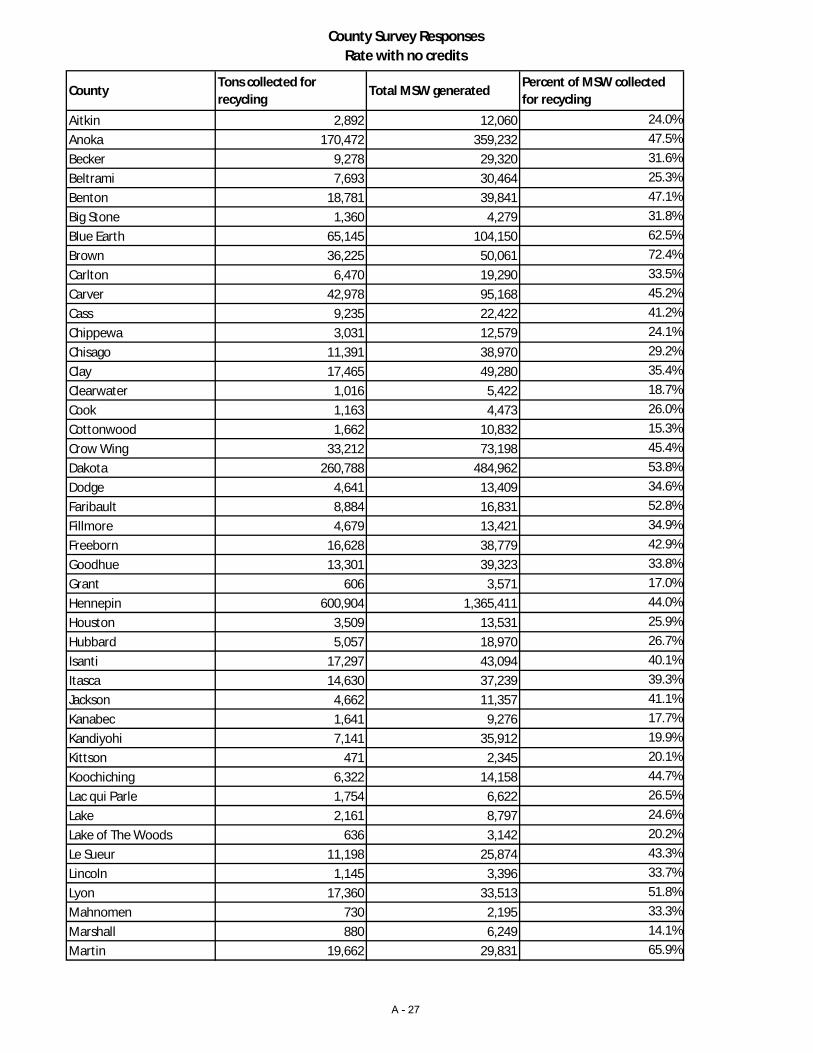
County Survey Responses Rate with no credits
CountyTons collected for recycling
Total MSW generatedPercent of MSW collected for recycling
Aitkin 2,892 12,060 24.0%Anoka 170,472 359,232 47.5%Becker 9,278 29,320 31.6%Beltrami 7,693 30,464 25.3%Benton 18,781 39,841 47.1%Big Stone 1,360 4,279 31.8%Blue Earth 65,145 104,150 62.5%Brown 36,225 50,061 72.4%Carlton 6,470 19,290 33.5%Carver 42,978 95,168 45.2%Cass 9,235 22,422 41.2%Chippewa 3,031 12,579 24.1%Chisago 11,391 38,970 29.2%Clay 17,465 49,280 35.4%Clearwater 1,016 5,422 18.7%Cook 1,163 4,473 26.0%Cottonwood 1,662 10,832 15.3%Crow Wing 33,212 73,198 45.4%Dakota 260,788 484,962 53.8%Dodge 4,641 13,409 34.6%Faribault 8,884 16,831 52.8%Fillmore 4,679 13,421 34.9%Freeborn 16,628 38,779 42.9%Goodhue 13,301 39,323 33.8%Grant 606 3,571 17.0%Hennepin 600,904 1,365,411 44.0%Houston 3,509 13,531 25.9%Hubbard 5,057 18,970 26.7%Isanti 17,297 43,094 40.1%Itasca 14,630 37,239 39.3%Jackson 4,662 11,357 41.1%Kanabec 1,641 9,276 17.7%Kandiyohi 7,141 35,912 19.9%Kittson 471 2,345 20.1%Koochiching 6,322 14,158 44.7%Lac qui Parle 1,754 6,622 26.5%Lake 2,161 8,797 24.6%Lake of The Woods 636 3,142 20.2%Le Sueur 11,198 25,874 43.3%Lincoln 1,145 3,396 33.7%Lyon 17,360 33,513 51.8%Mahnomen 730 2,195 33.3%Marshall 880 6,249 14.1%Martin 19,662 29,831 65.9%
A - 27
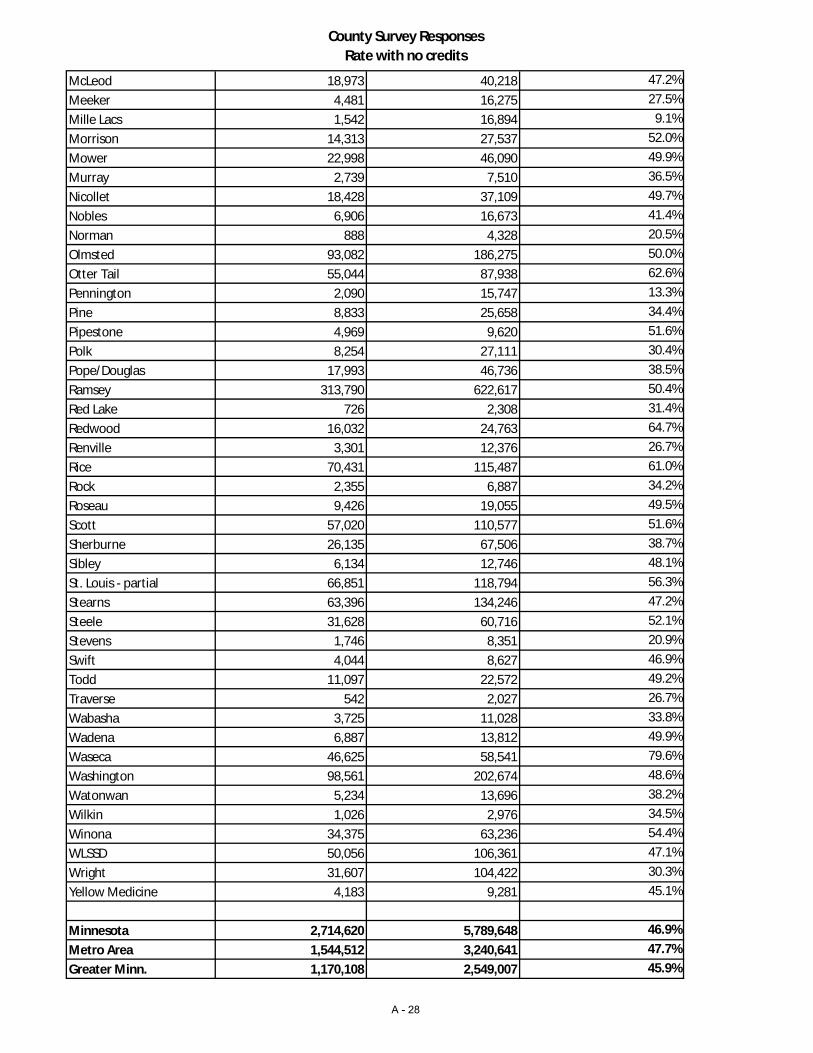
County Survey Responses Rate with no credits
McLeod 18,973 40,218 47.2%Meeker 4,481 16,275 27.5%Mille Lacs 1,542 16,894 9.1%Morrison 14,313 27,537 52.0%Mower 22,998 46,090 49.9%Murray 2,739 7,510 36.5%Nicollet 18,428 37,109 49.7%Nobles 6,906 16,673 41.4%Norman 888 4,328 20.5%Olmsted 93,082 186,275 50.0%Otter Tail 55,044 87,938 62.6%Pennington 2,090 15,747 13.3%Pine 8,833 25,658 34.4%Pipestone 4,969 9,620 51.6%Polk 8,254 27,111 30.4%Pope/Douglas 17,993 46,736 38.5%Ramsey 313,790 622,617 50.4%Red Lake 726 2,308 31.4%Redwood 16,032 24,763 64.7%Renville 3,301 12,376 26.7%Rice 70,431 115,487 61.0%Rock 2,355 6,887 34.2%Roseau 9,426 19,055 49.5%Scott 57,020 110,577 51.6%Sherburne 26,135 67,506 38.7%Sibley 6,134 12,746 48.1%St. Louis - partial 66,851 118,794 56.3%Stearns 63,396 134,246 47.2%Steele 31,628 60,716 52.1%Stevens 1,746 8,351 20.9%Swift 4,044 8,627 46.9%Todd 11,097 22,572 49.2%Traverse 542 2,027 26.7%Wabasha 3,725 11,028 33.8%Wadena 6,887 13,812 49.9%Waseca 46,625 58,541 79.6%Washington 98,561 202,674 48.6%Watonwan 5,234 13,696 38.2%Wilkin 1,026 2,976 34.5%Winona 34,375 63,236 54.4%WLSSD 50,056 106,361 47.1%Wright 31,607 104,422 30.3%Yellow Medicine 4,183 9,281 45.1%
Minnesota 2,714,620 5,789,648 46.9%Metro Area 1,544,512 3,240,641 47.7%Greater Minn. 1,170,108 2,549,007 45.9%
A - 28
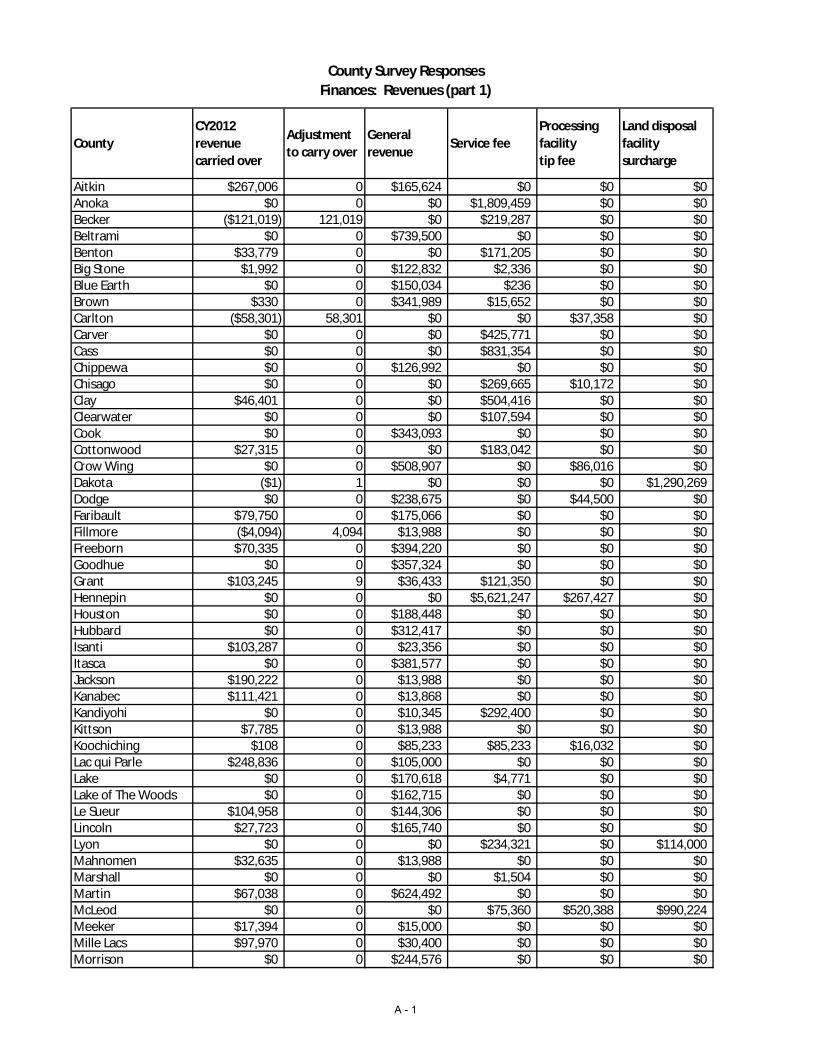
County Survey Responses Finances: Revenues (part 1)
CountyCY2012 revenue carried over
Adjustment to carry over
General revenue
Service feeProcessing facility tip fee
Land disposal facility surcharge
Aitkin $267,006 0 $165,624 $0 $0 $0Anoka $0 0 $0 $1,809,459 $0 $0Becker ($121,019) 121,019 $0 $219,287 $0 $0Beltrami $0 0 $739,500 $0 $0 $0Benton $33,779 0 $0 $171,205 $0 $0Big Stone $1,992 0 $122,832 $2,336 $0 $0Blue Earth $0 0 $150,034 $236 $0 $0Brown $330 0 $341,989 $15,652 $0 $0Carlton ($58,301) 58,301 $0 $0 $37,358 $0Carver $0 0 $0 $425,771 $0 $0Cass $0 0 $0 $831,354 $0 $0Chippewa $0 0 $126,992 $0 $0 $0Chisago $0 0 $0 $269,665 $10,172 $0Clay $46,401 0 $0 $504,416 $0 $0Clearwater $0 0 $0 $107,594 $0 $0Cook $0 0 $343,093 $0 $0 $0Cottonwood $27,315 0 $0 $183,042 $0 $0Crow Wing $0 0 $508,907 $0 $86,016 $0Dakota ($1) 1 $0 $0 $0 $1,290,269Dodge $0 0 $238,675 $0 $44,500 $0Faribault $79,750 0 $175,066 $0 $0 $0Fillmore ($4,094) 4,094 $13,988 $0 $0 $0Freeborn $70,335 0 $394,220 $0 $0 $0Goodhue $0 0 $357,324 $0 $0 $0Grant $103,245 9 $36,433 $121,350 $0 $0Hennepin $0 0 $0 $5,621,247 $267,427 $0Houston $0 0 $188,448 $0 $0 $0Hubbard $0 0 $312,417 $0 $0 $0Isanti $103,287 0 $23,356 $0 $0 $0Itasca $0 0 $381,577 $0 $0 $0Jackson $190,222 0 $13,988 $0 $0 $0Kanabec $111,421 0 $13,868 $0 $0 $0Kandiyohi $0 0 $10,345 $292,400 $0 $0Kittson $7,785 0 $13,988 $0 $0 $0Koochiching $108 0 $85,233 $85,233 $16,032 $0Lac qui Parle $248,836 0 $105,000 $0 $0 $0Lake $0 0 $170,618 $4,771 $0 $0Lake of The Woods $0 0 $162,715 $0 $0 $0Le Sueur $104,958 0 $144,306 $0 $0 $0Lincoln $27,723 0 $165,740 $0 $0 $0Lyon $0 0 $0 $234,321 $0 $114,000Mahnomen $32,635 0 $13,988 $0 $0 $0Marshall $0 0 $0 $1,504 $0 $0Martin $67,038 0 $624,492 $0 $0 $0McLeod $0 0 $0 $75,360 $520,388 $990,224Meeker $17,394 0 $15,000 $0 $0 $0Mille Lacs $97,970 0 $30,400 $0 $0 $0Morrison $0 0 $244,576 $0 $0 $0
A - 1
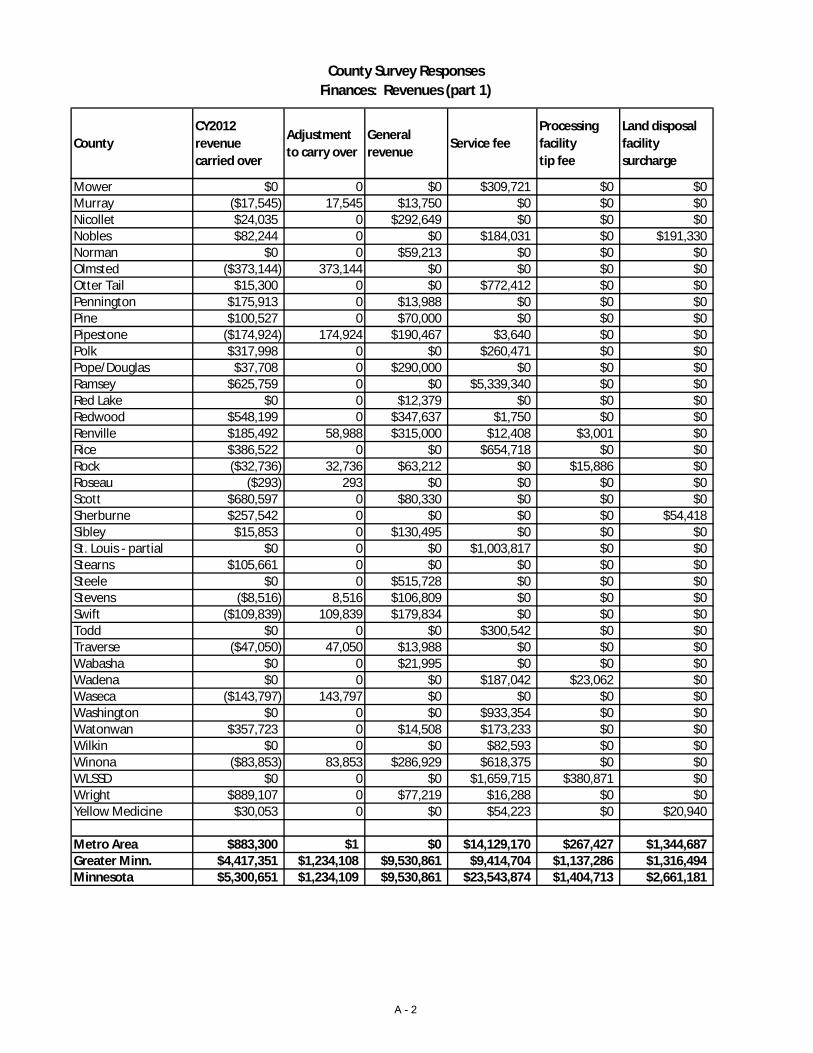
County Survey Responses Finances: Revenues (part 1)
CountyCY2012 revenue carried over
Adjustment to carry over
General revenue
Service feeProcessing facility tip fee
Land disposal facility surcharge
Mower $0 0 $0 $309,721 $0 $0Murray ($17,545) 17,545 $13,750 $0 $0 $0Nicollet $24,035 0 $292,649 $0 $0 $0Nobles $82,244 0 $0 $184,031 $0 $191,330Norman $0 0 $59,213 $0 $0 $0Olmsted ($373,144) 373,144 $0 $0 $0 $0Otter Tail $15,300 0 $0 $772,412 $0 $0Pennington $175,913 0 $13,988 $0 $0 $0Pine $100,527 0 $70,000 $0 $0 $0Pipestone ($174,924) 174,924 $190,467 $3,640 $0 $0Polk $317,998 0 $0 $260,471 $0 $0Pope/Douglas $37,708 0 $290,000 $0 $0 $0Ramsey $625,759 0 $0 $5,339,340 $0 $0Red Lake $0 0 $12,379 $0 $0 $0Redwood $548,199 0 $347,637 $1,750 $0 $0Renville $185,492 58,988 $315,000 $12,408 $3,001 $0Rice $386,522 0 $0 $654,718 $0 $0Rock ($32,736) 32,736 $63,212 $0 $15,886 $0Roseau ($293) 293 $0 $0 $0 $0Scott $680,597 0 $80,330 $0 $0 $0Sherburne $257,542 0 $0 $0 $0 $54,418Sibley $15,853 0 $130,495 $0 $0 $0St. Louis - partial $0 0 $0 $1,003,817 $0 $0Stearns $105,661 0 $0 $0 $0 $0Steele $0 0 $515,728 $0 $0 $0Stevens ($8,516) 8,516 $106,809 $0 $0 $0Swift ($109,839) 109,839 $179,834 $0 $0 $0Todd $0 0 $0 $300,542 $0 $0Traverse ($47,050) 47,050 $13,988 $0 $0 $0Wabasha $0 0 $21,995 $0 $0 $0Wadena $0 0 $0 $187,042 $23,062 $0Waseca ($143,797) 143,797 $0 $0 $0 $0Washington $0 0 $0 $933,354 $0 $0Watonwan $357,723 0 $14,508 $173,233 $0 $0Wilkin $0 0 $0 $82,593 $0 $0Winona ($83,853) 83,853 $286,929 $618,375 $0 $0WLSSD $0 0 $0 $1,659,715 $380,871 $0Wright $889,107 0 $77,219 $16,288 $0 $0Yellow Medicine $30,053 0 $0 $54,223 $0 $20,940
Metro Area $883,300 $1 $0 $14,129,170 $267,427 $1,344,687Greater Minn. $4,417,351 $1,234,108 $9,530,861 $9,414,704 $1,137,286 $1,316,494Minnesota $5,300,651 $1,234,109 $9,530,861 $23,543,874 $1,404,713 $2,661,181
A - 2

County Survey ResponsesFinances: Revenues (part 2)
CountySCORE pass-through
Grants HHW funding Material sales Other Total revenue
Aitkin $55,950 $26,513 $3,568 $0 $19,321 $537,981Anoka $818,409 $270,275 $0 $13,194 $74,824 $2,986,161Becker $40,144 $0 $34,271 $312,841 $7,632 $614,174Beltrami $110,461 $0 $9,035 $0 $0 $858,996Benton $94,455 $0 $444 $0 $10,435 $310,318Big Stone $55,950 $0 $2,400 $0 $700 $186,210Blue Earth $157,961 $0 $52,749 $0 $0 $360,980Brown $62,609 $479 $3,372 $0 $14,305 $438,736Carlton $86,499 $13,797 $7,349 $150 $803 $145,956Carver $226,544 $260,526 $0 $0 $219,572 $1,132,412Cass $69,234 $0 $4,227 $22,804 $0 $927,619Chippewa $55,950 $3,443 $2,400 $0 $9,004 $197,788Chisago $131,165 $1,307 $21,330 $5,402 $7,920 $446,962Clay $146,176 $0 $9,506 $3,607 $404 $710,510Clearwater $55,950 $0 $4,727 $0 $0 $168,271Cook $0 $0 $2,573 $96,613 $0 $442,279Cottonwood $55,950 $0 $0 $3,345 $62,897 $332,549Crow Wing $153,265 $0 $10,097 $0 $0 $758,285Dakota $983,009 $0 $212,939 $0 $0 $2,486,217Dodge $55,950 $0 $600 $82,464 $4,274 $426,463Faribault $0 $0 $0 $0 $3,571 $258,387Fillmore $55,950 $0 $0 $0 $0 $69,938Freeborn $75,873 $0 $5,779 $910 $7,832 $554,949Goodhue $0 $0 $10,757 $171,340 $10,798 $550,219Grant $55,950 $0 $0 $0 $8,743 $325,730Hennepin $2,858,773 $613,532 $70,995 $843,471 $79,870 $10,355,315Houston $55,950 $0 $3,750 $0 $89,961 $338,109Hubbard $55,950 $0 $3,143 $45,578 $0 $417,087Isanti $93,267 $0 $1,313 $0 $0 $221,223Itasca $165,258 $0 $4,649 $6,924 $0 $558,408Jackson $55,950 $0 $618 $8,977 $0 $269,755Kanabec $55,950 $0 $164 $0 $89 $181,492Kandiyohi $103,013 $0 $48,938 $369,116 $137,188 $961,000Kittson $55,950 $0 $0 $0 $26,236 $103,959Koochiching $55,950 $0 $3,053 $33,200 $0 $278,809Lac qui Parle $55,950 $0 $2,400 $0 $2,595 $414,781Lake $55,950 $0 $4,762 $17,970 $0 $254,071Lake of The Woods $55,950 $0 $0 $18,331 $0 $236,996Le Sueur $67,504 $0 $3,054 $24,238 $18,054 $362,114Lincoln $55,950 $0 $0 $0 $27,068 $276,480Lyon $62,979 $0 $51,758 $0 $52,402 $515,460Mahnomen $27,975 $0 $2,764 $0 $0 $77,362Marshall $55,950 $0 $0 $0 $36,446 $93,900Martin $0 $0 $0 $0 $9,983 $701,513McLeod $88,570 $0 $17,838 $663,215 $25,255 $2,380,850Meeker $56,488 $0 $2,879 $0 $641 $92,402Mille Lacs $63,135 $0 $3,699 $0 $0 $195,204Morrison $80,844 $0 $4,933 $0 $144,765 $475,118Mower $95,891 $0 $7,856 $167,635 $4,423 $585,526Murray $55,950 $0 $0 $0 $18,611 $88,311
A - 3
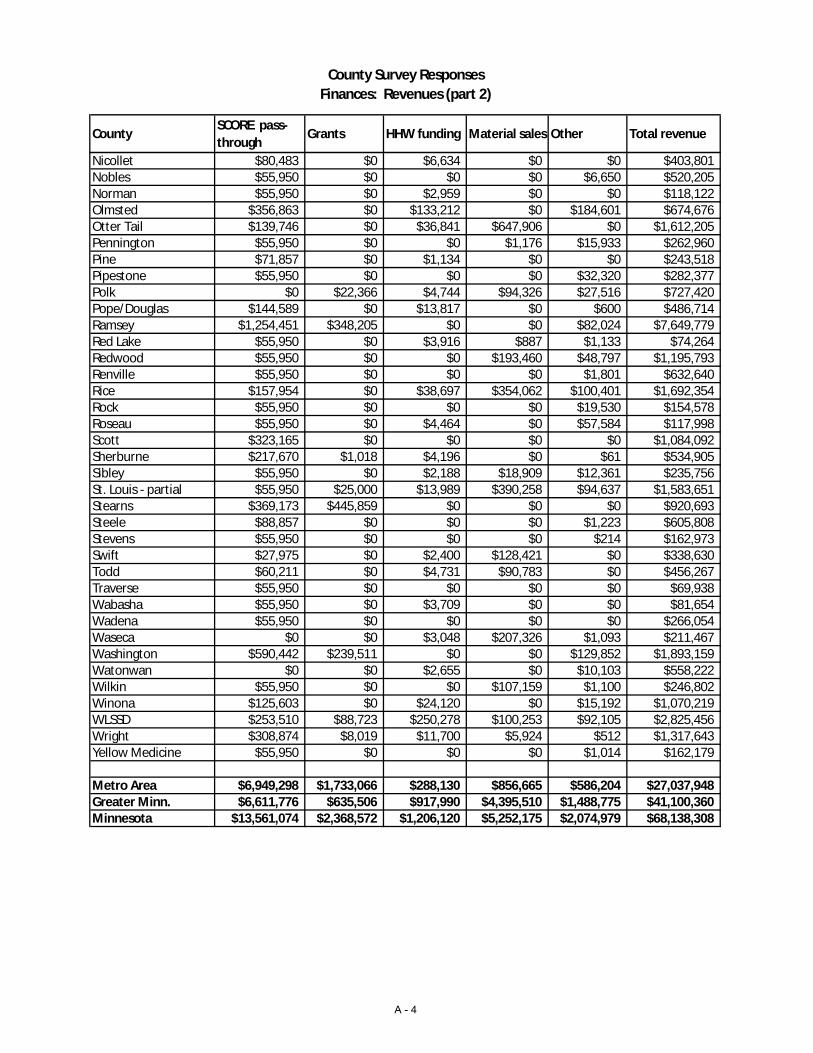
County Survey ResponsesFinances: Revenues (part 2)
CountySCORE pass-through
Grants HHW funding Material sales Other Total revenue
Nicollet $80,483 $0 $6,634 $0 $0 $403,801Nobles $55,950 $0 $0 $0 $6,650 $520,205Norman $55,950 $0 $2,959 $0 $0 $118,122Olmsted $356,863 $0 $133,212 $0 $184,601 $674,676Otter Tail $139,746 $0 $36,841 $647,906 $0 $1,612,205Pennington $55,950 $0 $0 $1,176 $15,933 $262,960Pine $71,857 $0 $1,134 $0 $0 $243,518Pipestone $55,950 $0 $0 $0 $32,320 $282,377Polk $0 $22,366 $4,744 $94,326 $27,516 $727,420Pope/Douglas $144,589 $0 $13,817 $0 $600 $486,714Ramsey $1,254,451 $348,205 $0 $0 $82,024 $7,649,779Red Lake $55,950 $0 $3,916 $887 $1,133 $74,264Redwood $55,950 $0 $0 $193,460 $48,797 $1,195,793Renville $55,950 $0 $0 $0 $1,801 $632,640Rice $157,954 $0 $38,697 $354,062 $100,401 $1,692,354Rock $55,950 $0 $0 $0 $19,530 $154,578Roseau $55,950 $0 $4,464 $0 $57,584 $117,998Scott $323,165 $0 $0 $0 $0 $1,084,092Sherburne $217,670 $1,018 $4,196 $0 $61 $534,905Sibley $55,950 $0 $2,188 $18,909 $12,361 $235,756St. Louis - partial $55,950 $25,000 $13,989 $390,258 $94,637 $1,583,651Stearns $369,173 $445,859 $0 $0 $0 $920,693Steele $88,857 $0 $0 $0 $1,223 $605,808Stevens $55,950 $0 $0 $0 $214 $162,973Swift $27,975 $0 $2,400 $128,421 $0 $338,630Todd $60,211 $0 $4,731 $90,783 $0 $456,267Traverse $55,950 $0 $0 $0 $0 $69,938Wabasha $55,950 $0 $3,709 $0 $0 $81,654Wadena $55,950 $0 $0 $0 $0 $266,054Waseca $0 $0 $3,048 $207,326 $1,093 $211,467Washington $590,442 $239,511 $0 $0 $129,852 $1,893,159Watonwan $0 $0 $2,655 $0 $10,103 $558,222Wilkin $55,950 $0 $0 $107,159 $1,100 $246,802Winona $125,603 $0 $24,120 $0 $15,192 $1,070,219WLSSD $253,510 $88,723 $250,278 $100,253 $92,105 $2,825,456Wright $308,874 $8,019 $11,700 $5,924 $512 $1,317,643Yellow Medicine $55,950 $0 $0 $0 $1,014 $162,179
Metro Area $6,949,298 $1,733,066 $288,130 $856,665 $586,204 $27,037,948Greater Minn. $6,611,776 $635,506 $917,990 $4,395,510 $1,488,775 $41,100,360Minnesota $13,561,074 $2,368,572 $1,206,120 $5,252,175 $2,074,979 $68,138,308
A - 4
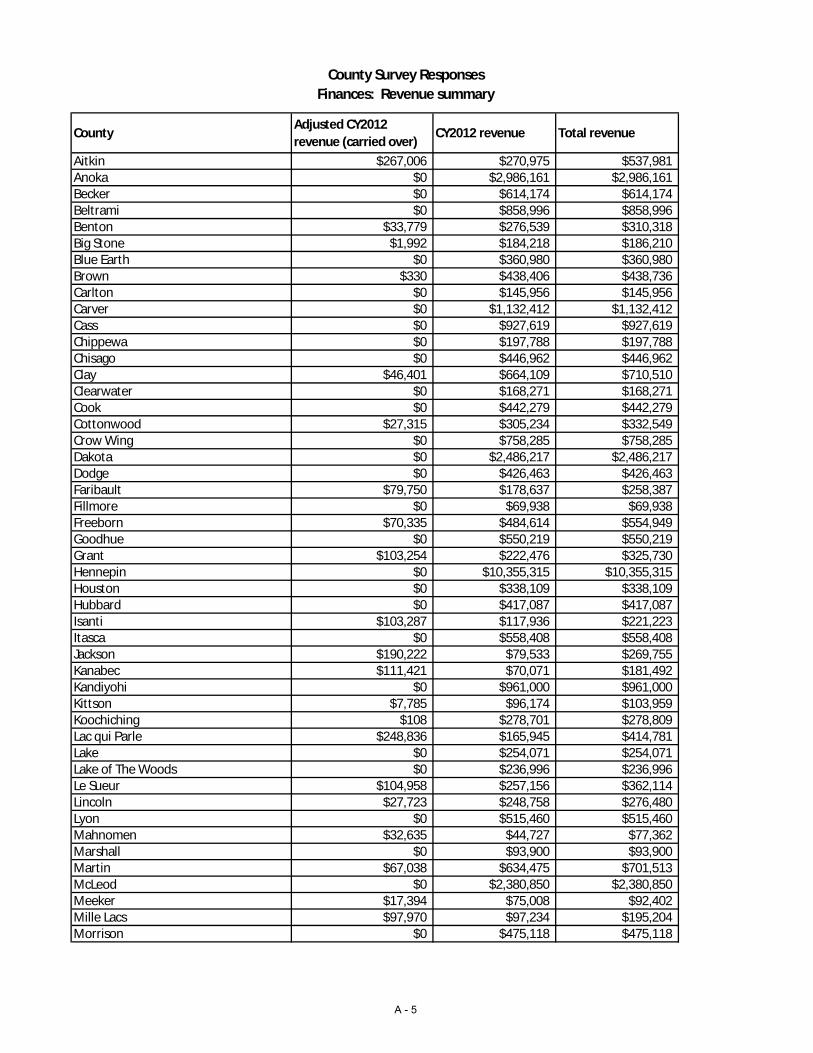
County Survey ResponsesFinances: Revenue summary
CountyAdjusted CY2012 revenue (carried over)
CY2012 revenue Total revenue
Aitkin $267,006 $270,975 $537,981Anoka $0 $2,986,161 $2,986,161Becker $0 $614,174 $614,174Beltrami $0 $858,996 $858,996Benton $33,779 $276,539 $310,318Big Stone $1,992 $184,218 $186,210Blue Earth $0 $360,980 $360,980Brown $330 $438,406 $438,736Carlton $0 $145,956 $145,956Carver $0 $1,132,412 $1,132,412Cass $0 $927,619 $927,619Chippewa $0 $197,788 $197,788Chisago $0 $446,962 $446,962Clay $46,401 $664,109 $710,510Clearwater $0 $168,271 $168,271Cook $0 $442,279 $442,279Cottonwood $27,315 $305,234 $332,549Crow Wing $0 $758,285 $758,285Dakota $0 $2,486,217 $2,486,217Dodge $0 $426,463 $426,463Faribault $79,750 $178,637 $258,387Fillmore $0 $69,938 $69,938Freeborn $70,335 $484,614 $554,949Goodhue $0 $550,219 $550,219Grant $103,254 $222,476 $325,730Hennepin $0 $10,355,315 $10,355,315Houston $0 $338,109 $338,109Hubbard $0 $417,087 $417,087Isanti $103,287 $117,936 $221,223Itasca $0 $558,408 $558,408Jackson $190,222 $79,533 $269,755Kanabec $111,421 $70,071 $181,492Kandiyohi $0 $961,000 $961,000Kittson $7,785 $96,174 $103,959Koochiching $108 $278,701 $278,809Lac qui Parle $248,836 $165,945 $414,781Lake $0 $254,071 $254,071Lake of The Woods $0 $236,996 $236,996Le Sueur $104,958 $257,156 $362,114Lincoln $27,723 $248,758 $276,480Lyon $0 $515,460 $515,460Mahnomen $32,635 $44,727 $77,362Marshall $0 $93,900 $93,900Martin $67,038 $634,475 $701,513McLeod $0 $2,380,850 $2,380,850Meeker $17,394 $75,008 $92,402Mille Lacs $97,970 $97,234 $195,204Morrison $0 $475,118 $475,118
A - 5
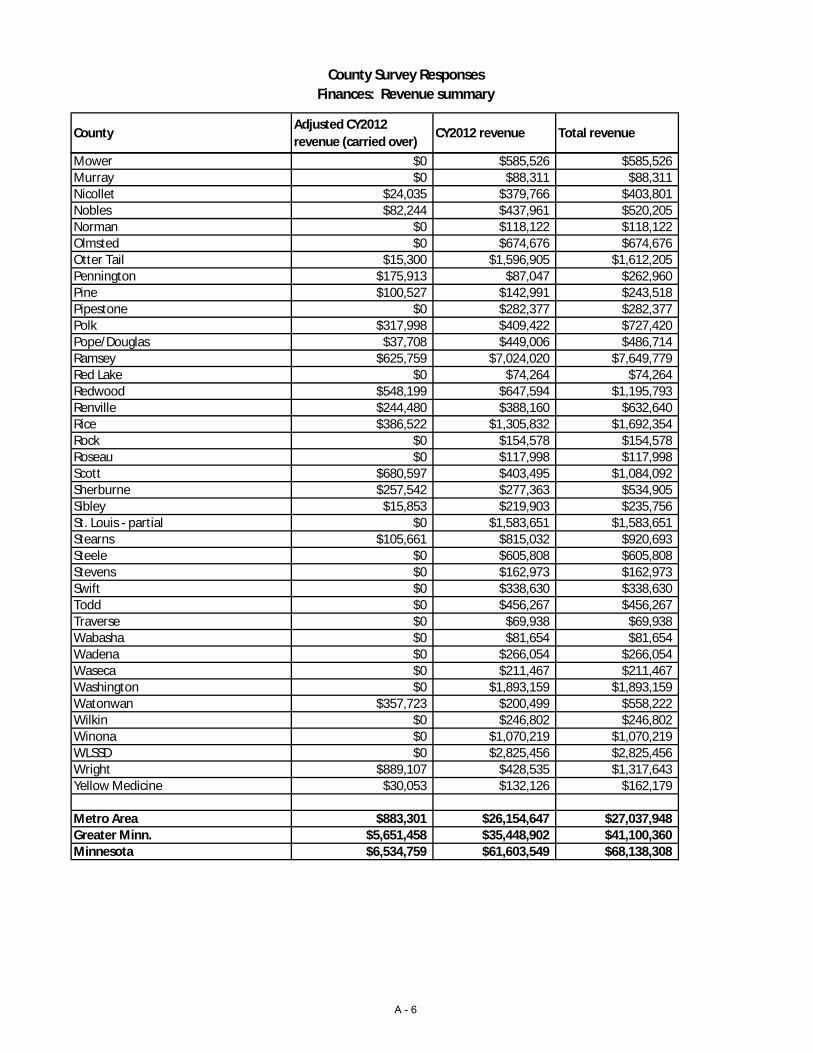
County Survey ResponsesFinances: Revenue summary
CountyAdjusted CY2012 revenue (carried over)
CY2012 revenue Total revenue
Mower $0 $585,526 $585,526Murray $0 $88,311 $88,311Nicollet $24,035 $379,766 $403,801Nobles $82,244 $437,961 $520,205Norman $0 $118,122 $118,122Olmsted $0 $674,676 $674,676Otter Tail $15,300 $1,596,905 $1,612,205Pennington $175,913 $87,047 $262,960Pine $100,527 $142,991 $243,518Pipestone $0 $282,377 $282,377Polk $317,998 $409,422 $727,420Pope/Douglas $37,708 $449,006 $486,714Ramsey $625,759 $7,024,020 $7,649,779Red Lake $0 $74,264 $74,264Redwood $548,199 $647,594 $1,195,793Renville $244,480 $388,160 $632,640Rice $386,522 $1,305,832 $1,692,354Rock $0 $154,578 $154,578Roseau $0 $117,998 $117,998Scott $680,597 $403,495 $1,084,092Sherburne $257,542 $277,363 $534,905Sibley $15,853 $219,903 $235,756St. Louis - partial $0 $1,583,651 $1,583,651Stearns $105,661 $815,032 $920,693Steele $0 $605,808 $605,808Stevens $0 $162,973 $162,973Swift $0 $338,630 $338,630Todd $0 $456,267 $456,267Traverse $0 $69,938 $69,938Wabasha $0 $81,654 $81,654Wadena $0 $266,054 $266,054Waseca $0 $211,467 $211,467Washington $0 $1,893,159 $1,893,159Watonwan $357,723 $200,499 $558,222Wilkin $0 $246,802 $246,802Winona $0 $1,070,219 $1,070,219WLSSD $0 $2,825,456 $2,825,456Wright $889,107 $428,535 $1,317,643Yellow Medicine $30,053 $132,126 $162,179
Metro Area $883,301 $26,154,647 $27,037,948Greater Minn. $5,651,458 $35,448,902 $41,100,360Minnesota $6,534,759 $61,603,549 $68,138,308
A - 6
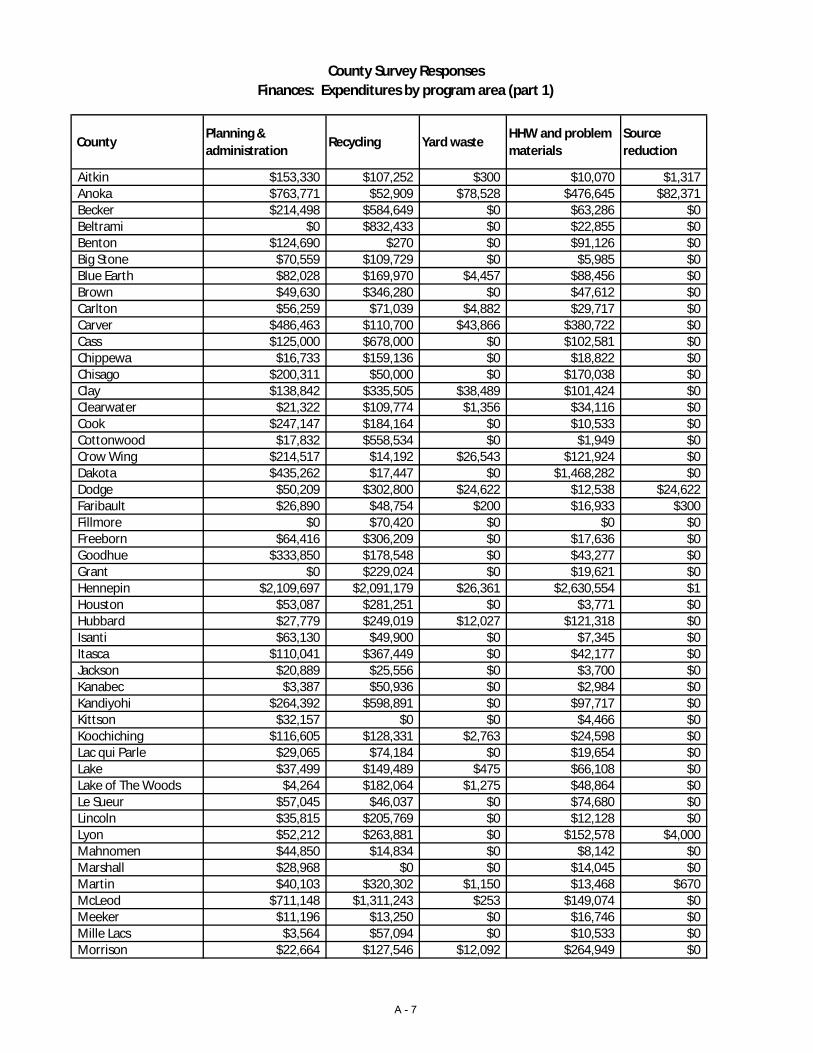
County Survey ResponsesFinances: Expenditures by program area (part 1)
County Planning & administration
Recycling Yard waste HHW and problem materials
Source reduction
Aitkin $153,330 $107,252 $300 $10,070 $1,317Anoka $763,771 $52,909 $78,528 $476,645 $82,371Becker $214,498 $584,649 $0 $63,286 $0Beltrami $0 $832,433 $0 $22,855 $0Benton $124,690 $270 $0 $91,126 $0Big Stone $70,559 $109,729 $0 $5,985 $0Blue Earth $82,028 $169,970 $4,457 $88,456 $0Brown $49,630 $346,280 $0 $47,612 $0Carlton $56,259 $71,039 $4,882 $29,717 $0Carver $486,463 $110,700 $43,866 $380,722 $0Cass $125,000 $678,000 $0 $102,581 $0Chippewa $16,733 $159,136 $0 $18,822 $0Chisago $200,311 $50,000 $0 $170,038 $0Clay $138,842 $335,505 $38,489 $101,424 $0Clearwater $21,322 $109,774 $1,356 $34,116 $0Cook $247,147 $184,164 $0 $10,533 $0Cottonwood $17,832 $558,534 $0 $1,949 $0Crow Wing $214,517 $14,192 $26,543 $121,924 $0Dakota $435,262 $17,447 $0 $1,468,282 $0Dodge $50,209 $302,800 $24,622 $12,538 $24,622Faribault $26,890 $48,754 $200 $16,933 $300Fillmore $0 $70,420 $0 $0 $0Freeborn $64,416 $306,209 $0 $17,636 $0Goodhue $333,850 $178,548 $0 $43,277 $0Grant $0 $229,024 $0 $19,621 $0Hennepin $2,109,697 $2,091,179 $26,361 $2,630,554 $1Houston $53,087 $281,251 $0 $3,771 $0Hubbard $27,779 $249,019 $12,027 $121,318 $0Isanti $63,130 $49,900 $0 $7,345 $0Itasca $110,041 $367,449 $0 $42,177 $0Jackson $20,889 $25,556 $0 $3,700 $0Kanabec $3,387 $50,936 $0 $2,984 $0Kandiyohi $264,392 $598,891 $0 $97,717 $0Kittson $32,157 $0 $0 $4,466 $0Koochiching $116,605 $128,331 $2,763 $24,598 $0Lac qui Parle $29,065 $74,184 $0 $19,654 $0Lake $37,499 $149,489 $475 $66,108 $0Lake of The Woods $4,264 $182,064 $1,275 $48,864 $0Le Sueur $57,045 $46,037 $0 $74,680 $0Lincoln $35,815 $205,769 $0 $12,128 $0Lyon $52,212 $263,881 $0 $152,578 $4,000Mahnomen $44,850 $14,834 $0 $8,142 $0Marshall $28,968 $0 $0 $14,045 $0Martin $40,103 $320,302 $1,150 $13,468 $670McLeod $711,148 $1,311,243 $253 $149,074 $0Meeker $11,196 $13,250 $0 $16,746 $0Mille Lacs $3,564 $57,094 $0 $10,533 $0Morrison $22,664 $127,546 $12,092 $264,949 $0
A - 7

County Survey ResponsesFinances: Expenditures by program area (part 1)
County Planning & administration
Recycling Yard waste HHW and problem materials
Source reduction
Mower $96,954 $488,063 $0 $8,127 $0Murray $60,198 $37,213 $0 $3,225 $0Nicollet $58,130 $204,571 $0 $82,065 $0Nobles $128,005 $213,451 $0 $63,397 $0Norman $8,816 $50,041 $0 $56,292 $0Olmsted $77,437 $721,413 $120,579 $552,729 $155,657Otter Tail $757,376 $522,169 $3,420 $212,145 $7,935Pennington $20,000 $34,605 $0 $12,590 $0Pine $47,278 $108,207 $0 $8,154 $0Pipestone $57,361 $215,037 $0 $13,474 $0Polk $155,244 $224,095 $2,511 $65,245 $0Pope/Douglas $215,331 $82,994 $39,928 $57,123 $0Ramsey $2,242,199 $500,950 $1,007,006 $1,404,097 $0Red Lake $19,314 $46,706 $0 $7,104 $0Redwood $215,681 $274,290 $0 $52,762 $0Renville $94,786 $175,149 $0 $47,622 $0Rice $345,031 $434,484 $40,200 $151,335 $200Rock $71,099 $88,227 $2,888 $24,312 $900Roseau $16,493 $72,000 $0 $21,205 $0
Scott $22,825 $1,697 $0 $137,400 $262Sherburne $2,567 $97,479 $67,076 $92,046 $0Sibley $50,450 $64,200 $0 $37,850 $0St. Louis - partial $236,318 $1,062,950 $11,719 $169,143 $17,840Stearns $186,107 $56,783 $16,012 $292,419 $16,012Steele $13,619 $579,450 $0 $8,166 $0Stevens $62,908 $83,114 $0 $20,059 $0Swift $357,372 $138,364 $5,930 $14,685 $1,160Todd $119,017 $255,200 $2,000 $75,616 $1,500Traverse $77,147 $37,505 $0 $8,000 $0Wabasha $16,250 $60,486 $0 $9,286 $0Wadena $92,624 $137,623 $2,779 $31,951 $0Waseca $119,095 $225,546 $7,252 $56,693 $0Washington $318,101 $10,339 $0 $1,124,644 $0Watonwan $2,291 $192,644 $0 $26,886 $0Wilkin $34,657 $166,218 $4,753 $39,363 $1,434Winona $314,812 $917,842 $0 $76,338 $0WLSSD $1,661,839 $404,701 $134,210 $339,289 $0Wright $81,627 $2,067 $9,692 $60,688 $0Yellow Medicine $1,500 $130,269 $0 $6,388 $0
Metro Area $6,358,060 $2,881,004 $1,222,837 $7,576,990 $82,372Greater Minn. $9,872,914 $18,473,083 $534,756 $5,038,672 $233,810Minnesota $16,230,974 $21,354,087 $1,757,593 $12,615,662 $316,182
A - 8
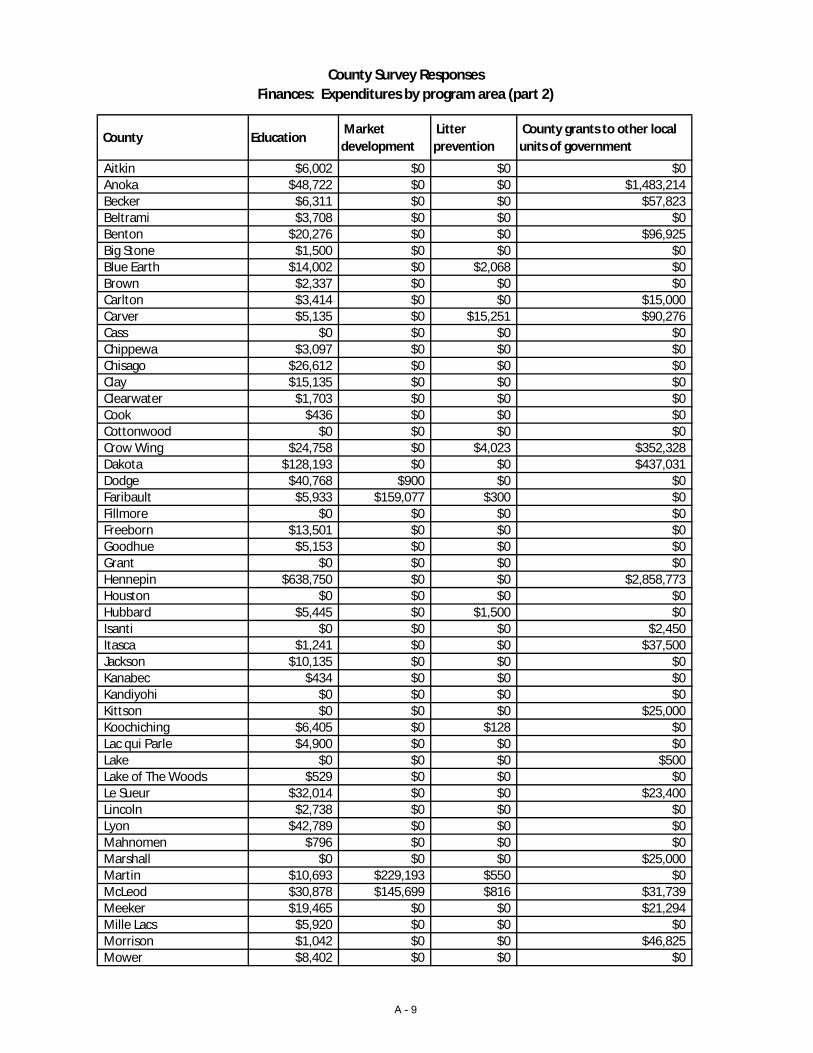
County Survey ResponsesFinances: Expenditures by program area (part 2)
County Education Market development
Litter prevention
County grants to other local units of government
Aitkin $6,002 $0 $0 $0Anoka $48,722 $0 $0 $1,483,214Becker $6,311 $0 $0 $57,823Beltrami $3,708 $0 $0 $0Benton $20,276 $0 $0 $96,925Big Stone $1,500 $0 $0 $0Blue Earth $14,002 $0 $2,068 $0Brown $2,337 $0 $0 $0Carlton $3,414 $0 $0 $15,000Carver $5,135 $0 $15,251 $90,276Cass $0 $0 $0 $0Chippewa $3,097 $0 $0 $0Chisago $26,612 $0 $0 $0Clay $15,135 $0 $0 $0Clearwater $1,703 $0 $0 $0Cook $436 $0 $0 $0Cottonwood $0 $0 $0 $0Crow Wing $24,758 $0 $4,023 $352,328Dakota $128,193 $0 $0 $437,031Dodge $40,768 $900 $0 $0Faribault $5,933 $159,077 $300 $0Fillmore $0 $0 $0 $0Freeborn $13,501 $0 $0 $0Goodhue $5,153 $0 $0 $0Grant $0 $0 $0 $0Hennepin $638,750 $0 $0 $2,858,773Houston $0 $0 $0 $0Hubbard $5,445 $0 $1,500 $0Isanti $0 $0 $0 $2,450Itasca $1,241 $0 $0 $37,500Jackson $10,135 $0 $0 $0Kanabec $434 $0 $0 $0Kandiyohi $0 $0 $0 $0Kittson $0 $0 $0 $25,000Koochiching $6,405 $0 $128 $0Lac qui Parle $4,900 $0 $0 $0Lake $0 $0 $0 $500Lake of The Woods $529 $0 $0 $0Le Sueur $32,014 $0 $0 $23,400Lincoln $2,738 $0 $0 $0Lyon $42,789 $0 $0 $0Mahnomen $796 $0 $0 $0Marshall $0 $0 $0 $25,000Martin $10,693 $229,193 $550 $0McLeod $30,878 $145,699 $816 $31,739Meeker $19,465 $0 $0 $21,294Mille Lacs $5,920 $0 $0 $0Morrison $1,042 $0 $0 $46,825Mower $8,402 $0 $0 $0
A - 9

County Survey ResponsesFinances: Expenditures by program area (part 2)
County Education Market development
Litter prevention
County grants to other local units of government
Murray $6,872 $0 $0 $0Nicollet $31,050 $0 $0 $0Nobles $6,733 $0 $0 $0Norman $1,116 $0 $0 $0Olmsted $151,916 $0 $0 $0Otter Tail $87,794 $0 $2,645 $3,420Pennington $396 $0 $0 $0Pine $0 $0 $0 $0Pipestone $7,799 $0 $2,910 $0Polk $15,821 $0 $0 $15,000Pope/Douglas $28,632 $0 $0 $0Ramsey $816,958 $0 $0 $1,049,876Red Lake $1,141 $0 $0 $0Redwood $5,220 $0 $0 $0Renville $596 $0 $0 $0Rice $15,000 $1,950 $200 $0Rock $5,391 $0 $0 $0Roseau $0 $0 $0 $0
Scott $54,294 $0 $0 $0Sherburne $38,667 $0 $0 $0Sibley $12,860 $0 $0 $53,037St. Louis - partial $66,431 $19,250 $0 $0Stearns $25,517 $16,012 $16,012 $135,410Steele $4,573 $0 $0 $0Stevens $6,000 $0 $0 $0Swift $7,670 $0 $0 $0Todd $1,637 $0 $0 $1,296Traverse $345 $0 $0 $2,000Wabasha $0 $0 $0 $0Wadena $1,077 $0 $0 $0Waseca $0 $0 $0 $0Washington $53,866 $0 $0 $386,209Watonwan $1,127 $0 $0 $0Wilkin $377 $0 $0 $0Winona $21,647 $0 $0 $0WLSSD $194,244 $0 $900 $90,273Wright $497 $0 $0 $246,191Yellow Medicine $7,325 $0 $0 $0
Metro Area $1,730,291 $0 $15,251 $6,305,378Greater Minn. $1,149,570 $572,081 $32,052 $1,282,411Minnesota $2,879,861 $572,081 $47,303 $7,587,789
A - 10
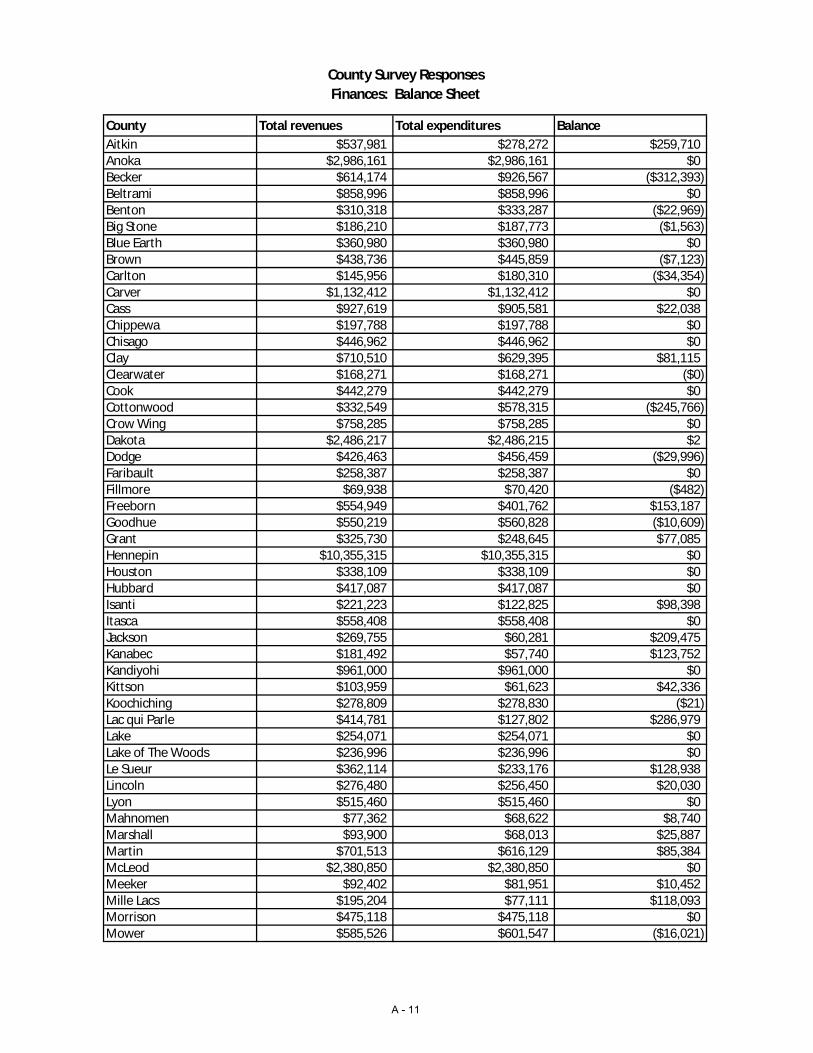
County Survey ResponsesFinances: Balance Sheet
County Total revenues Total expenditures BalanceAitkin $537,981 $278,272 $259,710Anoka $2,986,161 $2,986,161 $0Becker $614,174 $926,567 ($312,393)Beltrami $858,996 $858,996 $0Benton $310,318 $333,287 ($22,969)Big Stone $186,210 $187,773 ($1,563)Blue Earth $360,980 $360,980 $0Brown $438,736 $445,859 ($7,123)Carlton $145,956 $180,310 ($34,354)Carver $1,132,412 $1,132,412 $0Cass $927,619 $905,581 $22,038Chippewa $197,788 $197,788 $0Chisago $446,962 $446,962 $0Clay $710,510 $629,395 $81,115Clearwater $168,271 $168,271 ($0)Cook $442,279 $442,279 $0Cottonwood $332,549 $578,315 ($245,766)Crow Wing $758,285 $758,285 $0Dakota $2,486,217 $2,486,215 $2Dodge $426,463 $456,459 ($29,996)Faribault $258,387 $258,387 $0Fillmore $69,938 $70,420 ($482)Freeborn $554,949 $401,762 $153,187Goodhue $550,219 $560,828 ($10,609)Grant $325,730 $248,645 $77,085Hennepin $10,355,315 $10,355,315 $0Houston $338,109 $338,109 $0Hubbard $417,087 $417,087 $0Isanti $221,223 $122,825 $98,398Itasca $558,408 $558,408 $0Jackson $269,755 $60,281 $209,475Kanabec $181,492 $57,740 $123,752Kandiyohi $961,000 $961,000 $0Kittson $103,959 $61,623 $42,336Koochiching $278,809 $278,830 ($21)Lac qui Parle $414,781 $127,802 $286,979Lake $254,071 $254,071 $0Lake of The Woods $236,996 $236,996 $0Le Sueur $362,114 $233,176 $128,938Lincoln $276,480 $256,450 $20,030Lyon $515,460 $515,460 $0Mahnomen $77,362 $68,622 $8,740Marshall $93,900 $68,013 $25,887Martin $701,513 $616,129 $85,384McLeod $2,380,850 $2,380,850 $0Meeker $92,402 $81,951 $10,452Mille Lacs $195,204 $77,111 $118,093Morrison $475,118 $475,118 $0Mower $585,526 $601,547 ($16,021)
A - 11

County Survey ResponsesFinances: Balance Sheet
County Total revenues Total expenditures BalanceMurray $88,311 $107,507 ($19,196)Nicollet $403,801 $375,816 $27,985Nobles $520,205 $411,586 $108,619Norman $118,122 $116,266 $1,856Olmsted $674,676 $1,779,731 ($1,105,055)Otter Tail $1,612,205 $1,596,905 $15,300Pennington $262,960 $67,591 $195,369Pine $243,518 $163,639 $79,879Pipestone $282,377 $296,581 ($14,204)Polk $727,420 $477,916 $249,505Pope/Douglas $486,714 $424,008 $62,706Ramsey $7,649,779 $7,021,087 $628,692Red Lake $74,264 $74,264 $0Redwood $1,195,793 $547,953 $647,840Renville $632,640 $318,153 $314,487Rice $1,692,354 $988,400 $703,953Rock $154,578 $192,817 ($38,239)Roseau $117,998 $109,698 $8,300Scott $1,084,092 $216,478 $867,614Sherburne $534,905 $297,835 $237,070Sibley $235,756 $218,397 $17,359St. Louis - partial $1,583,651 $1,583,651 $0Stearns $920,693 $760,284 $160,409Steele $605,808 $605,808 $0Stevens $162,973 $172,081 ($9,109)Swift $338,630 $525,181 ($186,551)Todd $456,267 $456,267 $0Traverse $69,938 $124,997 ($55,059)Wabasha $81,654 $86,021 ($4,368)Wadena $266,054 $266,054 $0Waseca $211,467 $408,586 ($197,119)Washington $1,893,159 $1,893,159 $0Watonwan $558,222 $222,948 $335,274Wilkin $246,802 $246,802 $0Winona $1,070,219 $1,330,639 ($260,420)WLSSD $2,825,456 $2,825,456 $0Wright $1,317,643 $400,763 $916,880Yellow Medicine $162,179 $145,483 $16,697
Metro Area $27,037,948 $26,172,184 $865,764Greater Minn. $41,100,360 $37,189,349 $3,911,011Minnesota $68,138,308 $63,361,532 $4,776,775
A - 12

County Survey Responses: Paper collected for recycling (tons)
CountyComputer paper
CorrugatedMagazine/catalog
Mixed paper
NewsprintOffice paper
Other paper
Phone book
Total paper
Aitkin 0 599 697 0 0 0 0 0 1,296Anoka 20 55,704 570 10,605 14,014 1,227 6,367 10 88,516Becker 0 2,785 56 1,066 1,410 205 0 5 5,526Beltrami 0 3,055 0 831 0 52 0 0 3,938Benton 0 1,231 8,438 207 549 129 8 2 10,564Big Stone 0 107 0 182 195 0 0 0 483Blue Earth 0 14,933 1,038 3,886 368 500 0 0 20,725Brown 0 4,186 0 4,522 844 270 95 0 9,916Carlton 0 2,111 238 857 596 95 0 0 3,896Carver 0 6,357 0 15,153 3,204 64 0 0 24,778Cass 0 3,938 0 735 1,755 0 0 0 6,428Chippewa 0 1,141 11 37 245 22 0 0 1,456Chisago 0 2,252 0 13 2,063 413 25 0 4,767Clay 0 2,703 105 604 981 337 0 22 4,752Clearwater 0 195 0 72 0 0 0 2 269Cook 0 478 89 33 64 0 0 0 664Cottonwood 0 613 0 242 259 0 0 0 1,114Crow Wing 0 5,166 116 2,671 575 0 0 0 8,529Dakota 0 27,164 210 59,555 21,405 1,592 0 0 109,926Dodge 0 793 13 930 0 125 0 0 1,862Faribault 0 3,452 0 2,749 0 0 0 0 6,201Fillmore 0 0 0 0 0 0 1,856 0 1,856Freeborn 0 8,846 1,000 0 591 0 0 0 10,436Goodhue 0 3,379 85 2,457 3,571 4 0 0 9,496Grant 0 157 17 0 75 39 0 0 288Hennepin 0 55,319 3,223 40,004 37,690 9,672 39 6 145,953Houston 0 512 0 429 215 0 0 0 1,156Hubbard 0 1,928 0 118 429 1 0 0 2,475Isanti 0 2,732 8 42 1,034 9 0 0 3,825Itasca 0 3,014 0 896 1,312 237 0 0 5,458Jackson 0 1,024 0 0 152 148 0 0 1,324Kanabec 0 643 0 0 183 73 0 0 900Kandiyohi 0 3,885 246 395 653 94 0 15 5,288Kittson 0 116 68 0 90 1 0 0 275Koochiching 0 4,548 0 709 95 101 0 0 5,453Lac qui Parle 0 541 0 0 0 526 0 0 1,067Lake 0 636 59 148 221 36 0 0 1,100Lake of The Woods 0 32 0 0 0 0 0 0 32Le Sueur 0 1,348 0 1,025 9 26 0 9 2,417Lincoln 0 400 0 119 128 0 0 0 646Lyon 0 3,674 0 559 1,290 0 0 0 5,523Mahnomen 0 156 9 0 30 17 0 0 211Marshall 0 63 56 26 97 4 0 2 247Martin 0 7,153 0 3,934 0 0 0 0 11,087McLeod 0 2,947 2 10 983 73 203 0 4,217Meeker 0 1,627 2 462 281 60 0 0 2,431Mille Lacs 0 561 6 327 117 0 0 0 1,011
A - 13

County Survey Responses: Paper collected for recycling (tons)
CountyComputer paper
CorrugatedMagazine/catalog
Mixed paper
NewsprintOffice paper
Other paper
Phone book
Total paper
Morrison 0 1,954 1,150 0 1,341 502 0 0 4,947Mower 0 15,363 56 0 717 258 0 11 16,405Murray 0 512 366 26 726 12 0 0 1,641Nicollet 34 3,207 0 5,026 903 2,739 400 28 12,337Nobles 0 2,871 0 572 883 230 23 0 4,579Norman 0 32 0 4 0 0 0 0 36Olmsted 53 6,887 90 417 315 1,810 4,878 0 14,448Otter Tail 0 3,789 98 0 723 0 130 0 4,740Pennington 0 1,166 43 0 217 171 0 0 1,597Pine 150 1,483 0 362 0 217 0 0 2,213Pipestone 4 1,059 7 328 144 8 29 0 1,580Polk 0 1,273 0 310 0 0 0 0 1,583Pope/Douglas 0 5,439 0 1,200 1,418 13 0 0 8,070Ramsey 0 7,281 1,671 6,884 15,450 36 0 391 31,714Red Lake 0 246 8 0 30 2 0 0 286Redwood 0 2,112 103 435 223 415 0 0 3,288Renville 0 635 0 803 12 0 0 3 1,452Rice 0 14,260 0 3,593 0 0 0 0 17,853Rock 0 716 0 24 207 10 0 0 956Roseau 0 2,509 95 0 144 71 0 0 2,819Scott 0 16,120 137 9,371 3,086 1,391 936 0 31,041Sherburne 0 184 0 7,853 0 0 0 0 8,037Sibley 0 210 0 281 50 107 0 0 648St. Louis - partial 0 6,519 182 2,985 984 942 459 0 12,071Stearns 0 12,365 8,871 3,105 2,716 364 85 11 27,517Steele 2 1,798 0 2,387 0 63 1,799 0 6,049Stevens 4 517 31 115 185 0 0 9 861Swift 35 718 69 0 537 116 0 4 1,479Todd 0 1,226 0 9,062 0 0 0 0 10,287Traverse 0 110 8 0 51 12 0 0 181Wabasha 0 2,332 0 292 29 5 0 0 2,659Wadena 0 1,250 0 98 0 1 0 0 1,348Waseca 0 4,520 66 258 126 553 39,085 7 44,615Washington 11,188 5,713 86 14,770 17,529 13,061 251 15 62,613Watonwan 0 2,990 0 311 1,080 0 0 0 4,381Wilkin 0 473 9 0 235 66 0 1 785Winona 0 8,006 0 5,593 429 0 0 0 14,028WLSSD 0 13,798 647 1,883 5,703 1,257 543 0 23,831Wright 0 10,900 35 1,522 5,197 0 0 0 17,653
Yellow Medicine 0 546 26 0 397 0 0 0 970
Metro Area 11,208 173,658 5,897 156,342 112,377 27,042 7,593 423 494,540Greater Minn. 282 233,634 24,317 80,134 47,178 13,541 49,617 131 448,835Minnesota 11,490 407,292 30,214 236,476 159,556 40,584 57,210 554 943,376
A - 14

County Survey Responses Metal collected for recycling (tons)
County AluminumCo-mingled alum/steel/tin
Other ferrous & non-ferrous
Steel/tin cans Total metal
Aitkin 61 0 332 34 428Anoka 1,690 374 30,932 4,464 37,460Becker 0 177 752 0 929Beltrami 117 0 1,148 83 1,348Benton 287 181 4,792 407 5,667Big Stone 13 0 433 20 466Blue Earth 9,899 392 7,899 2,330 20,520Brown 240 0 21,206 179 21,626Carlton 186 146 135 0 466Carver 211 101 3,066 565 3,943Cass 57 0 0 69 126Chippewa 40 14 0 28 82Chisago 214 0 576 223 1,013Clay 164 4,267 0 69 4,501Clearwater 18 30 551 0 599Cook 14 0 80 31 125Cottonwood 17 0 9 26 53Crow Wing 198 0 14,035 379 14,612Dakota 2,535 15,641 16,602 3,984 38,762Dodge 33 0 488 133 654Faribault 210 581 1,077 0 1,868Fillmore 0 156 1,351 0 1,507Freeborn 601 0 26 994 1,621Goodhue 344 0 955 0 1,299Grant 10 0 2 17 29Hennepin 6,277 913 46,129 2,639 55,958Houston 87 21 1,422 0 1,530Hubbard 18 177 759 100 1,055Isanti 395 0 10,826 278 11,500Itasca 165 120 3,715 203 4,202Jackson 36 0 2,733 25 2,794Kanabec 6 0 0 105 112Kandiyohi 322 0 7 64 393Kittson 5 48 32 0 85Koochiching 49 400 5 14 468Lac qui Parle 28 4 120 10 162Lake 36 0 154 54 244Lake of The Woods 1 260 0 1 263Le Sueur 22 1,434 873 410 2,739Lincoln 62 0 16 19 96Lyon 312 0 6,126 299 6,737Mahnomen 12 8 50 0 70Marshall 12 143 270 0 425Martin 1,476 1,852 2,623 0 5,951McLeod 32 0 525 115 672Meeker 207 127 538 35 907Mille Lacs 29 23 0 0 52Morrison 28 0 6,384 229 6,640
A - 15

County Survey Responses Metal collected for recycling (tons)
County AluminumCo-mingled alum/steel/tin
Other ferrous & non-ferrous
Steel/tin cans Total metal
Mower 164 0 0 178 342Murray 72 132 213 25 442Nicollet 314 1,233 652 296 2,495Nobles 39 65 0 0 104Norman 12 13 606 0 631Olmsted 45 2,262 3,657 86 6,050Otter Tail 138 0 25,750 119 26,007Pennington 0 56 0 0 56Pine 270 30 4,300 62 4,662Pipestone 30 25 88 0 143Polk 177 817 84 101 1,178Pope/Douglas 339 0 1,973 1,092 3,404Ramsey 885 105 8,775 1,011 10,776Red Lake 0 31 250 0 281Redwood 481 0 1,476 52 2,009Renville 10 181 0 0 191Rice 234 0 7,521 676 8,431Rock 18 0 614 22 654Roseau 52 0 1,755 87 1,894Scott 302 1,424 8,067 7,266 17,058Sherburne 0 2,420 5,865 0 8,285Sibley 185 270 375 1,507 2,337St. Louis - partial 712 379 44,991 1,155 47,237Stearns 1,347 1,147 18,582 1,914 22,990Steele 27 48 2,962 146 3,183Stevens 62 0 298 108 468Swift 151 0 47 100 298Todd 0 0 184 19 203Traverse 0 10 250 0 260Wabasha 55 98 0 156 308Wadena 0 193 4,628 0 4,821Waseca 77 0 986 22 1,085Washington 2,025 142 4,936 854 7,956Watonwan 31 28 0 0 59Wilkin 33 0 0 12 45Winona 735 0 3,510 3,275 7,520WLSSD 564 0 10,817 474 11,856Wright 281 0 4,270 995 5,545Yellow Medicine 3 0 2,434 80 2,517
Metro Area 13,925 18,700 118,507 20,782 171,913 Greater Minn. 22,721 20,003 242,159 19,744 304,628 Minnesota 36,646 38,703 360,666 40,526 476,541
A - 16
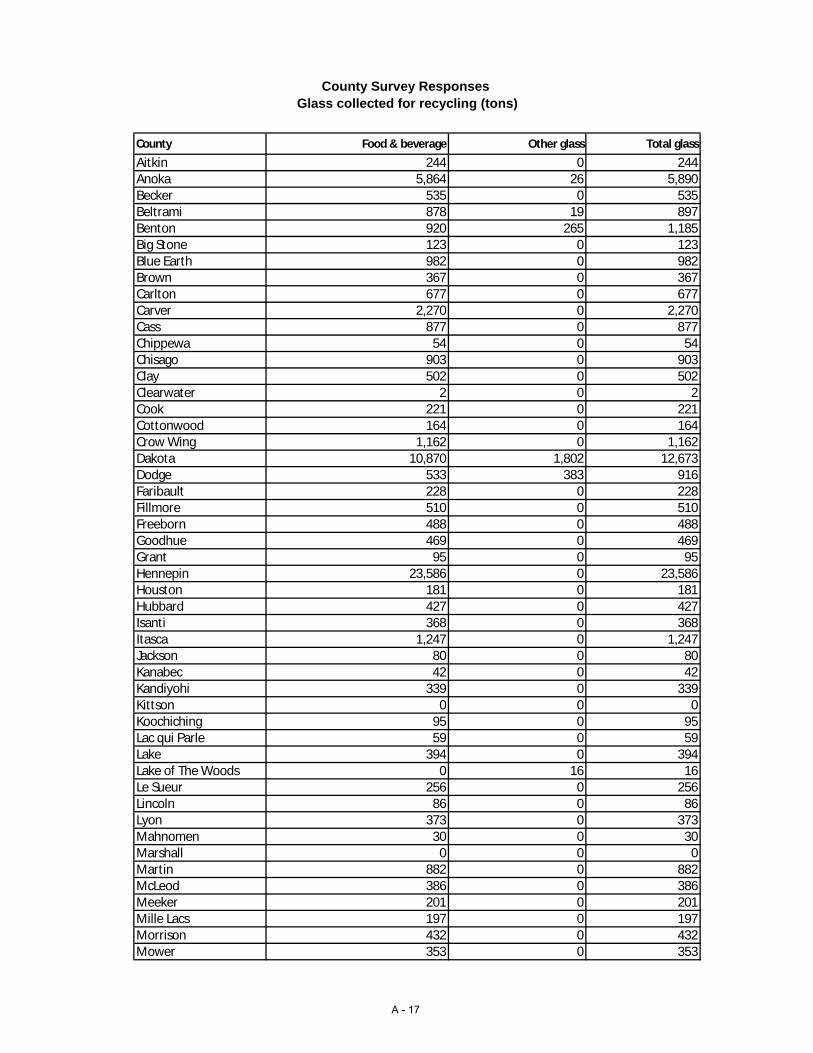
County Survey Responses Glass collected for recycling (tons)
County Food & beverage Other glass Total glass
Aitkin 244 0 244Anoka 5,864 26 5,890Becker 535 0 535Beltrami 878 19 897Benton 920 265 1,185Big Stone 123 0 123Blue Earth 982 0 982Brown 367 0 367Carlton 677 0 677Carver 2,270 0 2,270Cass 877 0 877Chippewa 54 0 54Chisago 903 0 903Clay 502 0 502Clearwater 2 0 2Cook 221 0 221Cottonwood 164 0 164Crow Wing 1,162 0 1,162Dakota 10,870 1,802 12,673Dodge 533 383 916Faribault 228 0 228Fillmore 510 0 510Freeborn 488 0 488Goodhue 469 0 469Grant 95 0 95Hennepin 23,586 0 23,586Houston 181 0 181Hubbard 427 0 427Isanti 368 0 368Itasca 1,247 0 1,247Jackson 80 0 80Kanabec 42 0 42Kandiyohi 339 0 339Kittson 0 0 0Koochiching 95 0 95Lac qui Parle 59 0 59Lake 394 0 394Lake of The Woods 0 16 16Le Sueur 256 0 256Lincoln 86 0 86Lyon 373 0 373Mahnomen 30 0 30Marshall 0 0 0Martin 882 0 882McLeod 386 0 386Meeker 201 0 201Mille Lacs 197 0 197Morrison 432 0 432Mower 353 0 353
A - 17

County Survey Responses Glass collected for recycling (tons)
County Food & beverage Other glass Total glass
Murray 157 0 157Nicollet 275 0 275Nobles 370 0 370Norman 53 0 53Olmsted 161 1,168 1,329Otter Tail 681 0 681Pennington 92 0 92Pine 341 0 341Pipestone 171 0 171Polk 245 0 245Pope/Douglas 1,908 0 1,908Ramsey 10,191 0 10,191Red Lake 34 0 34Redwood 239 0 239Renville 190 0 190Rice 1,035 1,645 2,680Rock 117 0 117Roseau 0 1,806 1,806Scott 708 0 708Sherburne 2,178 0 2,178Sibley 69 0 69St. Louis - partial 849 1 850Stearns 4,732 1,232 5,965Steele 450 19,136 19,586Stevens 129 0 129Swift 318 0 318Todd 133 0 133Traverse 34 0 34Wabasha 344 0 344Wadena 161 0 161Waseca 107 0 107Washington 3,317 0 3,317Watonwan 177 0 177Wilkin 71 0 71Winona 734 0 734WLSSD 3,479 0 3,479Wright 3,087 0 3,087Yellow Medicine 233 0 233
Metro Area 56,806 1,829 58,635 Greater Minn. (56,806) 25,671 66,388 Minnesota 27,499 125,023
A - 18

County Survey Responses: Plastic collected for recycling (tons)
County Film plastic HDPEMixed plastic
Other plastic PET PolystyreneTotal
PlasticAitkin 0 0 128 0 0 0 128Anoka 422 324 1,358 235 128 24 2,489Becker 76 1 287 300 1 0 664Beltrami 13 0 180 0 0 0 193Benton 9 397 44 137 29 0 616Big Stone 0 1 32 0 0 0 33Blue Earth 1,488 21 2,682 0 0 0 4,191Brown 10 0 851 4 0 0 864Carlton 7 0 275 30 0 0 312Carver 14 2 1,145 0 12 16 1,189Cass 0 0 84 0 94 0 178Chippewa 12 0 85 88 2 34 222Chisago 2 0 337 0 0 0 339Clay 20 0 195 0 0 0 215Clearwater 0 0 1 0 0 0 1Cook 0 0 55 0 0 0 55Cottonwood 0 0 43 0 0 0 43Crow Wing 0 0 1,651 0 0 0 1,651Dakota 201 3 7,674 0 8 0 7,886Dodge 0 0 216 117 0 0 334Faribault 3 26 240 0 0 0 269Fillmore 0 0 145 0 0 0 145Freeborn 0 0 3,496 0 0 0 3,496Goodhue 231 98 0 0 101 0 430Grant 0 0 32 0 0 0 32Hennepin 0 181 14,627 361 413 0 15,582Houston 0 0 35 0 0 0 35Hubbard 11 0 121 0 0 0 132Isanti 60 102 149 0 1 0 312Itasca 64 23 189 0 56 0 331Jackson 0 0 39 0 0 0 39Kanabec 0 0 0 312 0 0 312Kandiyohi 50 103 53 0 106 0 312Kittson 0 0 24 0 0 0 24Koochiching 0 4 16 14 17 0 50Lac qui Parle 0 0 63 2 0 0 64Lake 0 63 3 0 16 0 82Lake of The Woods 0 0 0 0 0 0 0Le Sueur 7 0 241 35 30 0 313Lincoln 0 0 30 0 0 0 30Lyon 0 0 202 0 0 0 202Mahnomen 0 0 7 0 0 0 7Marshall 0 0 26 0 0 0 26Martin 15 70 937 0 0 0 1,022McLeod 2,882 53 143 0 127 450 3,655Meeker 0 0 126 0 0 0 126Mille Lacs 0 0 89 0 0 0 89Morrison 55 17 519 0 0 0 590
A - 19
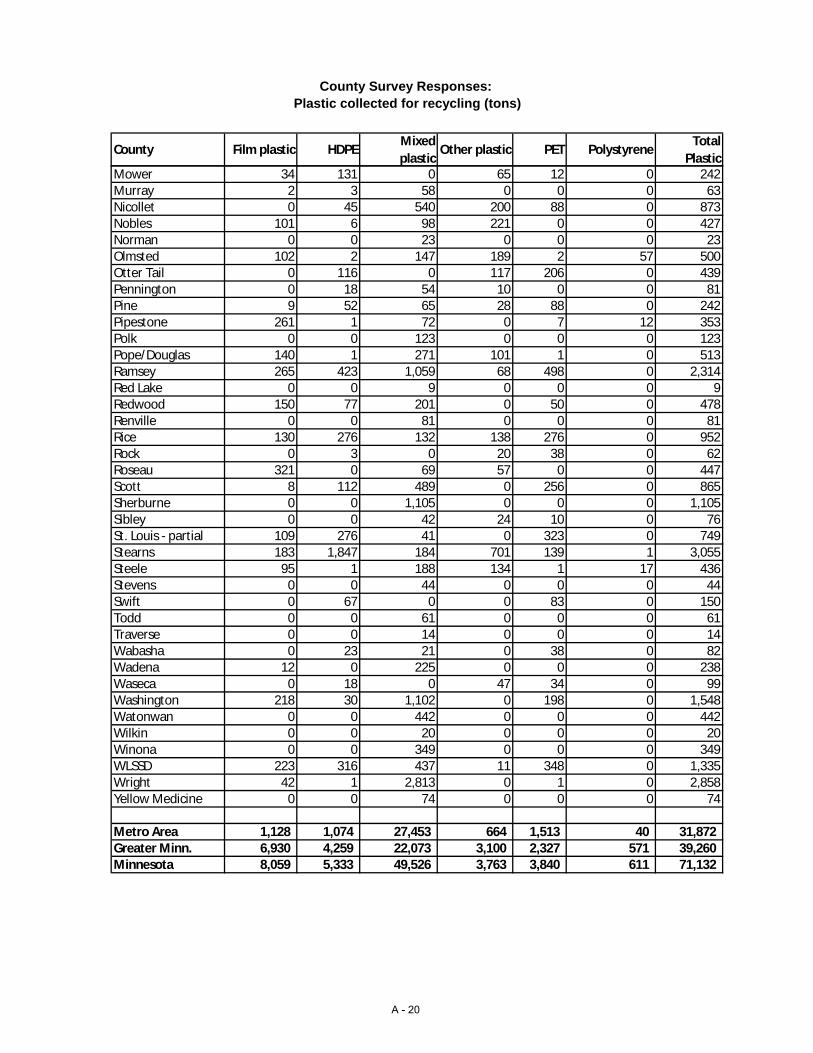
County Survey Responses: Plastic collected for recycling (tons)
County Film plastic HDPEMixed plastic
Other plastic PET PolystyreneTotal
PlasticMower 34 131 0 65 12 0 242Murray 2 3 58 0 0 0 63Nicollet 0 45 540 200 88 0 873Nobles 101 6 98 221 0 0 427Norman 0 0 23 0 0 0 23Olmsted 102 2 147 189 2 57 500Otter Tail 0 116 0 117 206 0 439Pennington 0 18 54 10 0 0 81Pine 9 52 65 28 88 0 242Pipestone 261 1 72 0 7 12 353Polk 0 0 123 0 0 0 123Pope/Douglas 140 1 271 101 1 0 513Ramsey 265 423 1,059 68 498 0 2,314Red Lake 0 0 9 0 0 0 9Redwood 150 77 201 0 50 0 478Renville 0 0 81 0 0 0 81Rice 130 276 132 138 276 0 952Rock 0 3 0 20 38 0 62Roseau 321 0 69 57 0 0 447Scott 8 112 489 0 256 0 865Sherburne 0 0 1,105 0 0 0 1,105Sibley 0 0 42 24 10 0 76St. Louis - partial 109 276 41 0 323 0 749Stearns 183 1,847 184 701 139 1 3,055Steele 95 1 188 134 1 17 436Stevens 0 0 44 0 0 0 44Swift 0 67 0 0 83 0 150Todd 0 0 61 0 0 0 61Traverse 0 0 14 0 0 0 14Wabasha 0 23 21 0 38 0 82Wadena 12 0 225 0 0 0 238Waseca 0 18 0 47 34 0 99Washington 218 30 1,102 0 198 0 1,548Watonwan 0 0 442 0 0 0 442Wilkin 0 0 20 0 0 0 20Winona 0 0 349 0 0 0 349WLSSD 223 316 437 11 348 0 1,335Wright 42 1 2,813 0 1 0 2,858Yellow Medicine 0 0 74 0 0 0 74
Metro Area 1,128 1,074 27,453 664 1,513 40 31,872 Greater Minn. 6,930 4,259 22,073 3,100 2,327 571 39,260 Minnesota 8,059 5,333 49,526 3,763 3,840 611 71,132
A - 20

County Survey Responses Organics collected for recycling (tons) - Part 1
County Food to livestock Food to peopleSource-
separated organics
Yard waste Total organics
Aitkin 0 0 0 0 0Anoka 8,048 0 7,316 0 15,364Becker 0 18 169 0 187Beltrami 188 0 53 0 241Benton 0 0 0 0 0Big Stone 0 0 110 0 110Blue Earth 0 18 128 0 146Brown 1,761 0 0 0 1,761Carlton 0 35 175 0 210Carver 6,186 0 1,314 0 7,500Cass 0 0 0 0 0Chippewa 5 9 22 0 35Chisago 290 0 2,870 0 3,160Clay 5,730 211 0 0 5,941Clearwater 0 0 0 0 0Cook 0 0 0 0 0Cottonwood 0 0 0 0 0Crow Wing 457 0 1,981 0 2,438Dakota 13,945 2,476 1,493 0 17,914Dodge 0 0 30 0 30Faribault 0 0 2 0 2Fillmore 0 0 0 0 0Freeborn 0 0 19 0 19Goodhue 0 0 0 802 802Grant 0 0 0 0 0Hennepin 30,703 283 14,024 0 45,010Houston 0 0 0 0 0Hubbard 13 0 35 0 49Isanti 481 47 13 0 540Itasca 0 16 19 0 34Jackson 39 0 0 0 39Kanabec 0 0 0 0 0Kandiyohi 156 0 0 0 156Kittson 0 0 0 0 0Koochiching 0 0 0 0 0Lac qui Parle 123 0 2 0 125Lake 0 0 0 0 0Lake of The Woods 0 0 104 0 104Le Sueur 2,900 0 0 0 2,900Lincoln 0 8 0 0 8Lyon 121 260 11 0 391Mahnomen 0 0 0 0 0Marshall 0 0 0 0 0Martin 0 0 2 0 2McLeod 0 76 1,929 0 2,006Meeker 0 0 14 0 14Mille Lacs 0 0 0 0 0
A - 21

County Survey Responses Organics collected for recycling (tons) - Part 1
County Food to livestock Food to peopleSource-
separated organics
Yard waste Total organics
Morrison 10 9 33 0 52Mower 0 0 1,831 0 1,831Murray 0 0 27 0 27Nicollet 0 0 125 0 125Nobles 82 11 25 0 118Norman 0 0 0 0 0Olmsted 60,892 143 83 0 61,119Otter Tail 19,431 0 0 0 19,431Pennington 0 0 0 0 0Pine 673 40 23 0 736Pipestone 89 1 238 0 327Polk 2,294 0 1,103 0 3,396Pope/Douglas 8 24 1,470 0 1,503Ramsey 46,789 1,671 1,832 0 50,292Red Lake 0 0 0 0 0Redwood 1,251 437 0 0 1,688Renville 650 220 0 0 870Rice 27,674 0 711 0 28,385Rock 0 0 0 0 0Roseau 0 0 0 0 0Scott 0 0 1,478 0 1,478Sherburne 550 0 149 0 699Sibley 0 2,600 0 0 2,600St. Louis - partial 9 9 221 0 239Stearns 0 38 107 0 145Steele 18 0 0 0 18Stevens 0 0 34 0 34Swift 0 0 1,620 0 1,620Todd 0 0 0 0 0Traverse 0 0 0 0 0Wabasha 0 0 0 0 0Wadena 0 0 18 0 18Waseca 0 0 0 0 0Washington 11,477 1,387 558 0 13,422Watonwan 0 0 0 0 0Wilkin 0 0 0 0 0Winona 9,055 0 0 0 9,055WLSSD 104 617 3,141 0 3,862Wright 0 0 44 0 44Yellow Medicine 0 0 47 0 47
Metro Area 117,148 5,817 28,014 - 150,980 Greater Minn. 135,053 4,846 18,736 802 158,635 Minnesota 252,202 10,663 46,751 802 309,615
A - 22
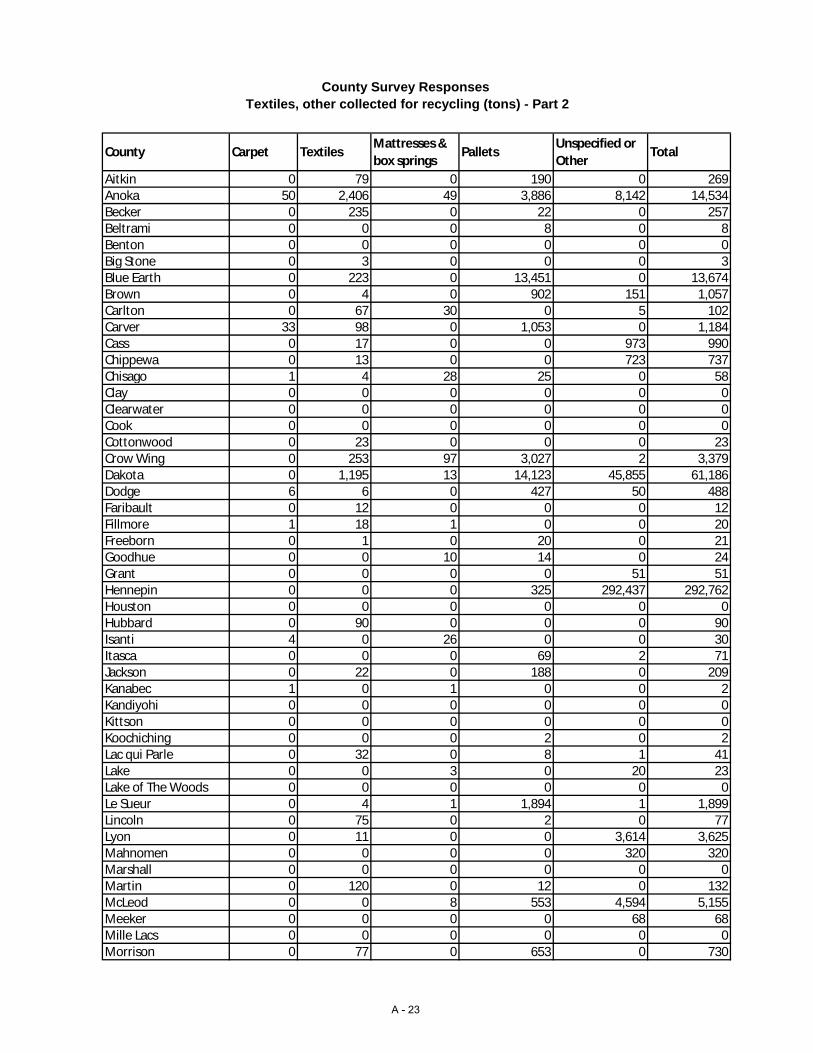
County Survey Responses Textiles, other collected for recycling (tons) - Part 2
County Carpet TextilesMattresses & box springs
PalletsUnspecified or Other
Total
Aitkin 0 79 0 190 0 269Anoka 50 2,406 49 3,886 8,142 14,534Becker 0 235 0 22 0 257Beltrami 0 0 0 8 0 8Benton 0 0 0 0 0 0Big Stone 0 3 0 0 0 3Blue Earth 0 223 0 13,451 0 13,674Brown 0 4 0 902 151 1,057Carlton 0 67 30 0 5 102Carver 33 98 0 1,053 0 1,184Cass 0 17 0 0 973 990Chippewa 0 13 0 0 723 737Chisago 1 4 28 25 0 58Clay 0 0 0 0 0 0Clearwater 0 0 0 0 0 0Cook 0 0 0 0 0 0Cottonwood 0 23 0 0 0 23Crow Wing 0 253 97 3,027 2 3,379Dakota 0 1,195 13 14,123 45,855 61,186Dodge 6 6 0 427 50 488Faribault 0 12 0 0 0 12Fillmore 1 18 1 0 0 20Freeborn 0 1 0 20 0 21Goodhue 0 0 10 14 0 24Grant 0 0 0 0 51 51Hennepin 0 0 0 325 292,437 292,762Houston 0 0 0 0 0 0Hubbard 0 90 0 0 0 90Isanti 4 0 26 0 0 30Itasca 0 0 0 69 2 71Jackson 0 22 0 188 0 209Kanabec 1 0 1 0 0 2Kandiyohi 0 0 0 0 0 0Kittson 0 0 0 0 0 0Koochiching 0 0 0 2 0 2Lac qui Parle 0 32 0 8 1 41Lake 0 0 3 0 20 23Lake of The Woods 0 0 0 0 0 0Le Sueur 0 4 1 1,894 1 1,899Lincoln 0 75 0 2 0 77Lyon 0 11 0 0 3,614 3,625Mahnomen 0 0 0 0 320 320Marshall 0 0 0 0 0 0Martin 0 120 0 12 0 132McLeod 0 0 8 553 4,594 5,155Meeker 0 0 0 0 68 68Mille Lacs 0 0 0 0 0 0Morrison 0 77 0 653 0 730
A - 23
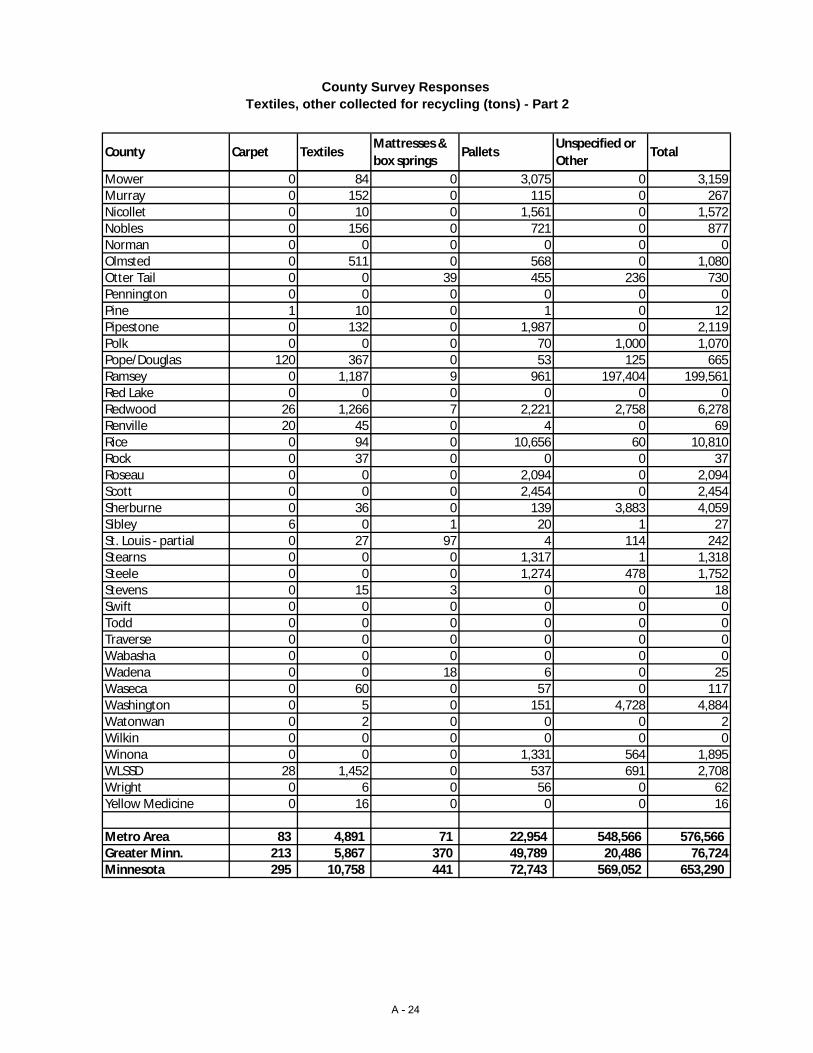
County Survey Responses Textiles, other collected for recycling (tons) - Part 2
County Carpet TextilesMattresses & box springs
PalletsUnspecified or Other
Total
Mower 0 84 0 3,075 0 3,159Murray 0 152 0 115 0 267Nicollet 0 10 0 1,561 0 1,572Nobles 0 156 0 721 0 877Norman 0 0 0 0 0 0Olmsted 0 511 0 568 0 1,080Otter Tail 0 0 39 455 236 730Pennington 0 0 0 0 0 0Pine 1 10 0 1 0 12Pipestone 0 132 0 1,987 0 2,119Polk 0 0 0 70 1,000 1,070Pope/Douglas 120 367 0 53 125 665Ramsey 0 1,187 9 961 197,404 199,561Red Lake 0 0 0 0 0 0Redwood 26 1,266 7 2,221 2,758 6,278Renville 20 45 0 4 0 69Rice 0 94 0 10,656 60 10,810Rock 0 37 0 0 0 37Roseau 0 0 0 2,094 0 2,094Scott 0 0 0 2,454 0 2,454Sherburne 0 36 0 139 3,883 4,059Sibley 6 0 1 20 1 27St. Louis - partial 0 27 97 4 114 242Stearns 0 0 0 1,317 1 1,318Steele 0 0 0 1,274 478 1,752Stevens 0 15 3 0 0 18Swift 0 0 0 0 0 0Todd 0 0 0 0 0 0Traverse 0 0 0 0 0 0Wabasha 0 0 0 0 0 0Wadena 0 0 18 6 0 25Waseca 0 60 0 57 0 117Washington 0 5 0 151 4,728 4,884Watonwan 0 2 0 0 0 2Wilkin 0 0 0 0 0 0Winona 0 0 0 1,331 564 1,895WLSSD 28 1,452 0 537 691 2,708Wright 0 6 0 56 0 62Yellow Medicine 0 16 0 0 0 16
Metro Area 83 4,891 71 22,954 548,566 576,566 Greater Minn. 213 5,867 370 49,789 20,486 76,724Minnesota 295 10,758 441 72,743 569,052 653,290
A - 24
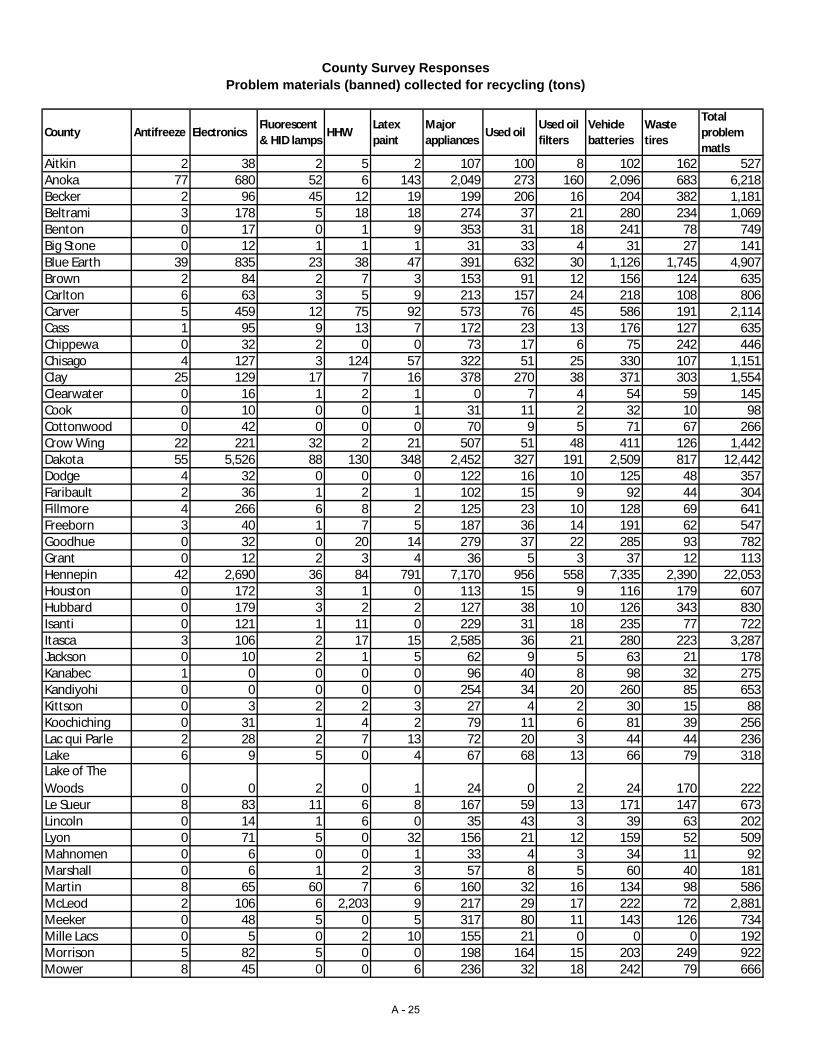
County Survey ResponsesProblem materials (banned) collected for recycling (tons)
County Antifreeze ElectronicsFluorescent & HID lamps
HHWLatex paint
Major appliances
Used oilUsed oil filters
Vehicle batteries
Waste tires
Total problem matls
Aitkin 2 38 2 5 2 107 100 8 102 162 527Anoka 77 680 52 6 143 2,049 273 160 2,096 683 6,218Becker 2 96 45 12 19 199 206 16 204 382 1,181Beltrami 3 178 5 18 18 274 37 21 280 234 1,069Benton 0 17 0 1 9 353 31 18 241 78 749Big Stone 0 12 1 1 1 31 33 4 31 27 141Blue Earth 39 835 23 38 47 391 632 30 1,126 1,745 4,907Brown 2 84 2 7 3 153 91 12 156 124 635Carlton 6 63 3 5 9 213 157 24 218 108 806Carver 5 459 12 75 92 573 76 45 586 191 2,114Cass 1 95 9 13 7 172 23 13 176 127 635Chippewa 0 32 2 0 0 73 17 6 75 242 446Chisago 4 127 3 124 57 322 51 25 330 107 1,151Clay 25 129 17 7 16 378 270 38 371 303 1,554Clearwater 0 16 1 2 1 0 7 4 54 59 145Cook 0 10 0 0 1 31 11 2 32 10 98Cottonwood 0 42 0 0 0 70 9 5 71 67 266Crow Wing 22 221 32 2 21 507 51 48 411 126 1,442Dakota 55 5,526 88 130 348 2,452 327 191 2,509 817 12,442Dodge 4 32 0 0 0 122 16 10 125 48 357Faribault 2 36 1 2 1 102 15 9 92 44 304Fillmore 4 266 6 8 2 125 23 10 128 69 641Freeborn 3 40 1 7 5 187 36 14 191 62 547Goodhue 0 32 0 20 14 279 37 22 285 93 782Grant 0 12 2 3 4 36 5 3 37 12 113Hennepin 42 2,690 36 84 791 7,170 956 558 7,335 2,390 22,053Houston 0 172 3 1 0 113 15 9 116 179 607Hubbard 0 179 3 2 2 127 38 10 126 343 830Isanti 0 121 1 11 0 229 31 18 235 77 722Itasca 3 106 2 17 15 2,585 36 21 280 223 3,287Jackson 0 10 2 1 5 62 9 5 63 21 178Kanabec 1 0 0 0 0 96 40 8 98 32 275Kandiyohi 0 0 0 0 0 254 34 20 260 85 653Kittson 0 3 2 2 3 27 4 2 30 15 88Koochiching 0 31 1 4 2 79 11 6 81 39 256Lac qui Parle 2 28 2 7 13 72 20 3 44 44 236Lake 6 9 5 0 4 67 68 13 66 79 318Lake of The Woods 0 0 2 0 1 24 0 2 24 170 222Le Sueur 8 83 11 6 8 167 59 13 171 147 673Lincoln 0 14 1 6 0 35 43 3 39 63 202Lyon 0 71 5 0 32 156 21 12 159 52 509Mahnomen 0 6 0 0 1 33 4 3 34 11 92Marshall 0 6 1 2 3 57 8 5 60 40 181Martin 8 65 60 7 6 160 32 16 134 98 586McLeod 2 106 6 2,203 9 217 29 17 222 72 2,881Meeker 0 48 5 0 5 317 80 11 143 126 734Mille Lacs 0 5 0 2 10 155 21 0 0 0 192Morrison 5 82 5 0 0 198 164 15 203 249 922Mower 8 45 0 0 6 236 32 18 242 79 666
A - 25

County Survey ResponsesProblem materials (banned) collected for recycling (tons)
County Antifreeze ElectronicsFluorescent & HID lamps
HHWLatex paint
Major appliances
Used oilUsed oil filters
Vehicle batteries
Waste tires
Total problem matls
Murray 0 6 1 3 0 51 7 4 53 17 142Nicollet 4 138 23 7 7 198 55 15 203 103 753Nobles 0 50 4 6 8 130 25 10 136 62 431Norman 0 20 2 1 2 45 7 4 51 13 145Olmsted 12 392 79 60 121 895 119 70 6,508 298 8,555Otter Tail 9 126 2 290 372 346 917 27 353 573 3,016Pennington 0 33 4 4 5 85 11 7 87 28 263Pine 2 30 9 3 3 175 23 14 251 118 628Pipestone 0 83 3 3 4 60 27 4 60 31 276Polk 0 49 2 14 8 189 25 63 194 114 658Pope/Douglas 31 394 24 11 32 372 276 26 631 132 1,929Ramsey 12 181 26 329 304 3,151 420 245 3,223 1,050 8,942Red Lake 0 8 1 2 1 25 11 3 25 40 116Redwood 44 434 30 21 8 95 161 10 316 934 2,052Renville 20 87 4 0 3 92 12 7 95 127 448Rice 10 186 7 8 52 388 52 30 412 175 1,320Rock 0 51 2 1 2 57 8 5 59 344 528Roseau 2 25 14 6 3 93 23 11 108 81 366Scott 13 137 22 111 74 822 939 64 840 394 3,416Sherburne 0 289 4 10 80 541 72 42 554 180 1,773Sibley 5 18 5 6 7 99 12 7 93 125 376St. Louis - partial 55 314 15 164 29 609 1,903 116 496 1,764 5,464Stearns 9 56 0 0 0 912 122 71 933 304 2,407Steele 0 30 0 6 6 219 29 17 224 73 604Stevens 0 30 1 9 0 59 8 5 60 20 192Swift 0 27 3 0 0 58 8 5 59 19 179Todd 0 29 1 0 3 147 20 12 151 49 412Traverse 0 0 0 0 0 21 3 2 21 7 53Wabasha 0 0 0 0 0 129 17 10 132 43 331Wadena 1 44 2 3 7 83 11 6 92 28 276Waseca 0 0 4 3 0 114 15 13 117 335 602Washington 12 805 0 0 181 1,489 198 116 1,523 496 4,820Watonwan 0 0 0 0 0 67 9 5 69 22 172Wilkin 0 1 2 1 0 40 5 3 40 13 104Winona 0 0 0 0 0 309 41 24 317 103 794WLSSD 61 705 26 92 21 909 96 101 734 239 2,985Wright 1 99 2 19 26 771 335 60 788 257 2,358Yellow Medicine 0 19 2 2 0 206 8 5 63 21 326
Metro Area 215 10,478 236 734 1,933 17,705 3,190 1,379 18,113 6,022 60,005 Greater Minn. 430 7,378 551 3,297 1,170 18,178 7,131 1,385 22,049 13,268 74,836 Minnesota 645 17,856 787 4,031 3,104 35,884 10,321 2,763 40,161 19,290 134,841
A - 26

County Survey Responses Rate with no credits
CountyTons collected for recycling
Total MSW generatedPercent of MSW collected for recycling
Aitkin 2,892 12,060 24.0%Anoka 170,472 359,232 47.5%Becker 9,278 29,320 31.6%Beltrami 7,693 30,464 25.3%Benton 18,781 39,841 47.1%Big Stone 1,360 4,279 31.8%Blue Earth 65,145 104,150 62.5%Brown 36,225 50,061 72.4%Carlton 6,470 19,290 33.5%Carver 42,978 95,168 45.2%Cass 9,235 22,422 41.2%Chippewa 3,031 12,579 24.1%Chisago 11,391 38,970 29.2%Clay 17,465 49,280 35.4%Clearwater 1,016 5,422 18.7%Cook 1,163 4,473 26.0%Cottonwood 1,662 10,832 15.3%Crow Wing 33,212 73,198 45.4%Dakota 260,788 484,962 53.8%Dodge 4,641 13,409 34.6%Faribault 8,884 16,831 52.8%Fillmore 4,679 13,421 34.9%Freeborn 16,628 38,779 42.9%Goodhue 13,301 39,323 33.8%Grant 606 3,571 17.0%Hennepin 600,904 1,365,411 44.0%Houston 3,509 13,531 25.9%Hubbard 5,057 18,970 26.7%Isanti 17,297 43,094 40.1%Itasca 14,630 37,239 39.3%Jackson 4,662 11,357 41.1%Kanabec 1,641 9,276 17.7%Kandiyohi 7,141 35,912 19.9%Kittson 471 2,345 20.1%Koochiching 6,322 14,158 44.7%Lac qui Parle 1,754 6,622 26.5%Lake 2,161 8,797 24.6%Lake of The Woods 636 3,142 20.2%Le Sueur 11,198 25,874 43.3%Lincoln 1,145 3,396 33.7%Lyon 17,360 33,513 51.8%Mahnomen 730 2,195 33.3%Marshall 880 6,249 14.1%Martin 19,662 29,831 65.9%
A - 27

County Survey Responses Rate with no credits
McLeod 18,973 40,218 47.2%Meeker 4,481 16,275 27.5%Mille Lacs 1,542 16,894 9.1%Morrison 14,313 27,537 52.0%Mower 22,998 46,090 49.9%Murray 2,739 7,510 36.5%Nicollet 18,428 37,109 49.7%Nobles 6,906 16,673 41.4%Norman 888 4,328 20.5%Olmsted 93,082 186,275 50.0%Otter Tail 55,044 87,938 62.6%Pennington 2,090 15,747 13.3%Pine 8,833 25,658 34.4%Pipestone 4,969 9,620 51.6%Polk 8,254 27,111 30.4%Pope/Douglas 17,993 46,736 38.5%Ramsey 313,790 622,617 50.4%Red Lake 726 2,308 31.4%Redwood 16,032 24,763 64.7%Renville 3,301 12,376 26.7%Rice 70,431 115,487 61.0%Rock 2,355 6,887 34.2%Roseau 9,426 19,055 49.5%Scott 57,020 110,577 51.6%Sherburne 26,135 67,506 38.7%Sibley 6,134 12,746 48.1%St. Louis - partial 66,851 118,794 56.3%Stearns 63,396 134,246 47.2%Steele 31,628 60,716 52.1%Stevens 1,746 8,351 20.9%Swift 4,044 8,627 46.9%Todd 11,097 22,572 49.2%Traverse 542 2,027 26.7%Wabasha 3,725 11,028 33.8%Wadena 6,887 13,812 49.9%Waseca 46,625 58,541 79.6%Washington 98,561 202,674 48.6%Watonwan 5,234 13,696 38.2%Wilkin 1,026 2,976 34.5%Winona 34,375 63,236 54.4%WLSSD 50,056 106,361 47.1%Wright 31,607 104,422 30.3%Yellow Medicine 4,183 9,281 45.1%
Minnesota 2,714,620 5,789,648 46.9%Metro Area 1,544,512 3,240,641 47.7%Greater Minn. 1,170,108 2,549,007 45.9%
A - 28