2013 Report of Fastest Growing Expenditures - …€¦ · · 2013-03-072013 Report of Fastest...
14
2013 Report of Fastest Growing Expenditures Based on November 2012 Forecast March 5, 2013 This document is made available electronically by the Minnesota Legislative Reference Library as part of an ongoing digital archiving project. http://www.leg.state.mn.us/lrl/lrl.asp
Transcript of 2013 Report of Fastest Growing Expenditures - …€¦ · · 2013-03-072013 Report of Fastest...

2013 Report of Fastest Growing Expenditures
Based on November 2012 Forecast
March 5, 2013
This document is made available electronically by the Minnesota Legislative Reference Library as part of an ongoing digital archiving project. http://www.leg.state.mn.us/lrl/lrl.asp

400 Centennial Building • 658 Cedar Street • St. Paul, Minnesota 55155 Voice: (651) 201-8000 • Fax: (651) 296-8685 • TTY: 1-800-627-3529
An Equal Opportunity Employer
March 5, 2013
The Honorable Paul Thissen Speaker of the House 463 State Office Building St. Paul, MN 55155
The Honorable Thomas M. Bakk Majority Leader 226 State Capitol St. Paul, MN 55155
The Honorable Lyndon Carlson Sr., Chair House Ways & Means Committee 479 State Office Building St. Paul, MN 55155
The Honorable Richard Cohen, Chair Senate Finance Committee 121 State Capitol St. Paul, MN 55155
The Honorable Kurt Daudt Minority Leader 267 State Office Building St. Paul, MN 55155
The Honorable David W. Hann Minority Leader 147 State Office Building St. Paul, MN 55155
Subject: 2013 Report of Fastest Growing Expenditures
Dear Senators and Representatives:
In accordance with M.S. 16A.103, subdivision 4, which directs the commissioner of Minnesota Management & Budget to report by January 10 of an odd-numbered year on programs for which expenditures projected for the next biennium (FY 2014-15) under current law exceed by 15% those of the current biennium (FY 2012-13), I have attached the 2013 Report of Fastest Growing Expenditures.
Please direct questions regarding this report to John Pollard at (651) 201-8039 or [email protected].
Sincerely,
Jim Schowalter Commissioner
Attachment
cc: Senator Michelle L. Fischbach, Eric Nauman, Senate Fiscal Analyst Representative Mary Liz Holberg, Bill Marx, House Fiscal Analyst
Fastest Growing Expenditures
Reporting Requirement This report identifies the fastest growing elements in Minnesota’s state budget and reviews factors that have led to the growth. Information is based on the November 2012 economic and budget forecast.
“Fastest Growing Expenditures” is required under Minnesota statutes 16A.103, subdivision 4, first enacted in the 2005 legislative session.
Subd. 4. Report on expenditure increases. By January 10 of an odd-numbered year, the commissioner of management and budget must report on those programs or components of programs for which expenditures for the next biennium according to the forecast issued the previous November are projected to increase more than 15 percent over the expenditures for that program in the current biennium. The report must include an analysis of the factors that are causing the increases in expenditures.
State of Minnesota 1 Fastest Growing Expenditures Based on November 2012 Forecast

All Funds Expenditure Trends The current forecast for the budget for the current biennium (FY 2012-13) reflects an 5 percent increase over the previous biennium, while projected all funds spending for the upcoming biennium (FY 2014-15) will increase 5.4 percent over the current biennium. Over the last decade, the growth in state spending has averaged 7.5 percent per biennium, and 10.5 percent over the last twenty years.
Many factors can contribute to growth in spending. In the last decade human services program costs have been among the most prominent - driven largely by health care enrollment growth and increasing medical costs. Legislative budget decisions to spend more on particular programs are another primary factor. Legislative action to consolidate Information Technology services represents a significant portion of the increases in this edition of the report. Increases in other areas may be less apparent, often representing a much smaller share of the overall budget.
10.0%
13.5% 13.0%
15.4%
7.3% 8.4%
11.0%
5.9% 5.0% 5.4%
0%2%4%6%8%
10%12%14%16%18%
% C
hang
e
Biennium
All Funds Expenditures: Biennial Increase
State of Minnesota 2 Fastest Growing Expenditures Based on November 2012 Forecast
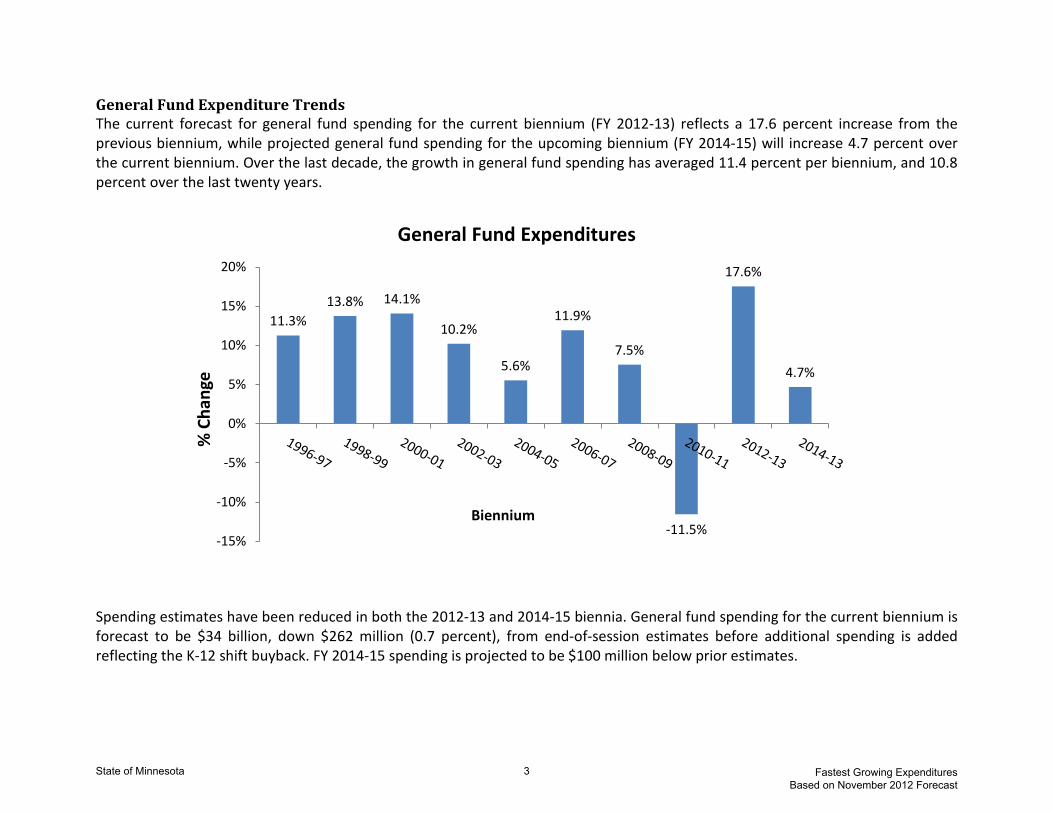
General Fund Expenditure Trends The current forecast for general fund spending for the current biennium (FY 2012-13) reflects a 17.6 percent increase from the previous biennium, while projected general fund spending for the upcoming biennium (FY 2014-15) will increase 4.7 percent over the current biennium. Over the last decade, the growth in general fund spending has averaged 11.4 percent per biennium, and 10.8 percent over the last twenty years.
Spending estimates have been reduced in both the 2012-13 and 2014-15 biennia. General fund spending for the current biennium is forecast to be $34 billion, down $262 million (0.7 percent), from end-of-session estimates before additional spending is added reflecting the K-12 shift buyback. FY 2014-15 spending is projected to be $100 million below prior estimates.
11.3% 13.8% 14.1%
10.2%
5.6%
11.9%
7.5%
-11.5%
17.6%
4.7%
-15%
-10%
-5%
0%
5%
10%
15%
20%
% C
hang
e
Biennium
General Fund Expenditures
State of Minnesota 3 Fastest Growing Expenditures Based on November 2012 Forecast

While a fairly significant amount of FY 2012-13 revenues do not continue into FY 2014-15 one-time spending reductions used in FY 2012-13 also distort spending growth projections. General fund spending for FY 2014-15 is estimated to total $37 billion, $1.6 billion more than FY 2012-13.
Forecast spending in health and human services is estimated to be $743 million (6.9 percent) more than FY 2012-13 while K-12 spending estimated to be $795 million higher (5.5 percent). Furthermore, the one-time use of tobacco bond proceeds to pay general obligation debt service artificially reduced spending by $646 million in FY 2012-13. In FY 2014-15 general obligation debt service is once again paid for from the general fund.
After the increases in K-12 education and property tax aids and credits spending related to the school shift buyback are accounted for state general fund spending for FY 2014-15 is $37 billion, a 4.7 percent increase over the current biennium.
Timing and Reporting Period For this report, the biennial comparison includes FY 2012-13 and FY 2014-15 current law projections as shown in the November 2012 expenditure forecast.
“Fastest growing” items were identified if the change in expenditures was 15 percent or more, biennium to biennium. This should not be confused with 15% annual increases. For a program to grow 15% biennium to biennium, its average annual growth rates would be closer to seven or eight percent.
Report Format The body of the report lists budget activities that met the initial threshold of 15 percent growth. Comments are displayed that explain the nature of the unique factors contributing to the expenditure growth.
In a significant number of instances, the explanation points to a one-time budget action or new programs funded by the legislature.
How the items in the body of the report were identified Total state spending, involves approximately 6000 separate appropriation identification codes, of which 1000 are in the general fund. Generally, this report represents budget activity level spending authorizations, which may include multiple appropriations.
This level of reporting is substantially comparable to prior year reporting. Prior year reporting referred to program-level spending, however, the components presented were budget activities for many agencies.
State of Minnesota 4 Fastest Growing Expenditures Based on November 2012 Forecast

To identify initial data on expenditure increases, information from the state budget system on actual spending for FY 2012 and budgeted spending for FY 2013 was used and compared to budgeted spending for FY 2014-15.
The following criteria were applied: • All state operating funds – excluding federally funded appropriations - were included. • Spending at the program and budget activity levels was reviewed. Budget activities to be reported were determined by
comparing:
- 2012 actual data plus 2013 modified budget (to represent the 2012-2013 biennium), - 2014 and 2015 forecast budget amounts (to represent the 2014-2015 biennium).
The data was drawn from the state budget system. This report covers forecast and non-forecast spending changes.
• Small items, those with biennial changes under $250,000, were excluded. • Items that resulted solely from budget structure changes within an agency are excluded from the report. • Items resulting from accounting treatment differences between the accounting and budget systems were excluded.
Does the report identify specific categories of state expenditures? Please note that this report organizes data by specific budget activities. The report does not analyze expenditures by categories (e.g. payroll expense, operating costs). Some specific expenditure categories may grow rapidly but are not highlighted. The requirements for this report specify the perspective for analysis: components of agencies’ budget structure.
For example, the cost of prescription drugs is included in the spending for health care programs, state operated services, and correctional facilities. While these costs may contribute to overall program growth, they are not identified separately in this report.
Additional Information Information in this report has been prepared by the Budget Services Division, Minnesota Management and Budget (MMB). In some instances explanatory information and data presented is based on analysis by financial staff in the relevant agency.
State of Minnesota 5 Fastest Growing Expenditures Based on November 2012 Forecast

Type of Increase, for item s covered in this report ($1.4 billion)
Many factors can contribute to growth in spending. Not all increases are reflected in this report or the graph above – only those programs and their components increasing above 15% from 2012-2013 to 2014-2015 current law base. An attempt to categorize the items in this report highlights eight major factors in play for the subset of increases in this report:
Information Technology Consolidation: In 2011, the Legislature adopted measures to consolidate information technology within the State’s IT agency (now called MN.IT). The measures included consolidating agency IT spending and personnel. This impact is seen in MN.IT budget activities.
New Conditions: Current law allows for changes in base funding for many activities statewide based on changes in underlying program usage and related economic conditions. In the last decade human services program costs have been among the most prominent - driven largely by health care enrollment growth and increasing medical costs.
Increased Revenue
1%
Lower than usual activity in 2012
and/or 2013 0.3%
New Conditions 36%
New Programs 5% One-time
Reductions 7%
Tax Base Changes 2%
IT Consolidation 49%
State of Minnesota 6 Fastest Growing Expenditures Based on November 2012 Forecast
One-time Reductions: Budget reductions in 2012-13 included components that were one-time in nature. As these reductions are reinstated in the current law base, increases above the percentage set in statute for display in this report result.
Lower than usual activity in 2012 and/or 2013: Data in this report for 2012 represent actual spending. Agencies may not spend the full amount of their appropriations. Data in this report for 2013 represent the current modified budget as entered by agencies in the budget system. In the modified budget, agencies may reallocate funding within their agency, as allowed in law. Both of these conditions may result in comparative amounts for 2012 or 2013 being lower than the ongoing anticipated activity in the program.
Increased Revenue Estimates: Some programs’ expenditures are set by the amount of revenue collected. These increases are allowed within current law.
New Programs funded by the Legislature: The Legislature may decide each biennium to create new programs.
Property Tax Base Changes: Within in current law, increases related to changes in property tax bases changes statewide may result in changes to programs in the tax policy aids and credits area.
Increased Program Funding by the Legislature: The Legislature may decide each biennium to increase funding over for particular programs that already exist, over and above current law.
State of Minnesota 7 Fastest Growing Expenditures Based on November 2012 Forecast

($'s in Thousands)
Bill Area Agency Program Fund Budget Activity FY12 FY13 FY12 & FY13 FY14 FY15 FY14 &
FY15 DIFF %DIFF Description of Increase Type of Increase E-12 Education
EducationOther General Education General
Abatement Revenue 1,406 2,417 3,823 3,015 3,252 6,267 2,444 63.93%
Due to the recession and declining commercial and residential property values, abatements have increase 26%, 59% and 52% each year in the last 3 years. There is an expectation that abatement growth will continue but at a slower rate of growth. Also contributing to the forecasted growth is a pending claim in the tax court for the St. Paul Ford Plant (estimated taxes abated of $3M). Tax Base Changes
EducationOther General Education General
Consolidation Transition 145 248 393 469 484 953 560 142.49%
Consolidation Aid is based on estimated number of districts that will consolidate. Aid is allowed for two years after consolidating. FY 2012-13 is artificially low due to no consolidations occurring in FY 2012, reducing slightly FY 2013 funding. FY 2014-15 funding levels are consistent with historical experience.
Lower than usual activity in 2012
and/or 2013
Education
Special Student & Teacher General
Literacy Incentive Aid - 40,083 40,083 52,359 53,836 106,195 66,112 164.94%
Funding for the new Literacy Incentive aid started in the second year of the current biennium, therefore only 82.5% of one year is included in FY 2012-13 biennium total. New Program
EducationFacilities & Technology General
Health & Safety Revenue 92 189 281 450 437 887 606 215.66%
Red Lake and Houston school districts have low property value per pupil and receive the vast majority of their health and safety revenue in the form of aid. Both of these districts have added new health and safety projects in recent years and thus the state aid increases significantly. New Conditions
EducationFacilities & Technology General
Debt Service Equalization 11,449 19,452 30,901 19,539 24,653 44,192 13,291 43.01%
Aid for Debt Service Equalization relates to declining Adjusted Net Tax Capacity (ANTC) in some districts. The decline is driven by the elimination of the homestead credit and by lower residential property valuations in the wake of the recession. Districts with lower ANTC will receive larger aid payments. Tax Base Changes
State of Minnesota 8 Fastest Growing Expenditures Based on November 2012 Forecast
($'s in Thousands)
Bill Area Agency Program Fund Budget Activity FY12 FY13 FY12 & FY13 FY14 FY15 FY14 &
FY15 DIFF %DIFF Description of Increase Type of Increase
EducationFacilities & Technology General
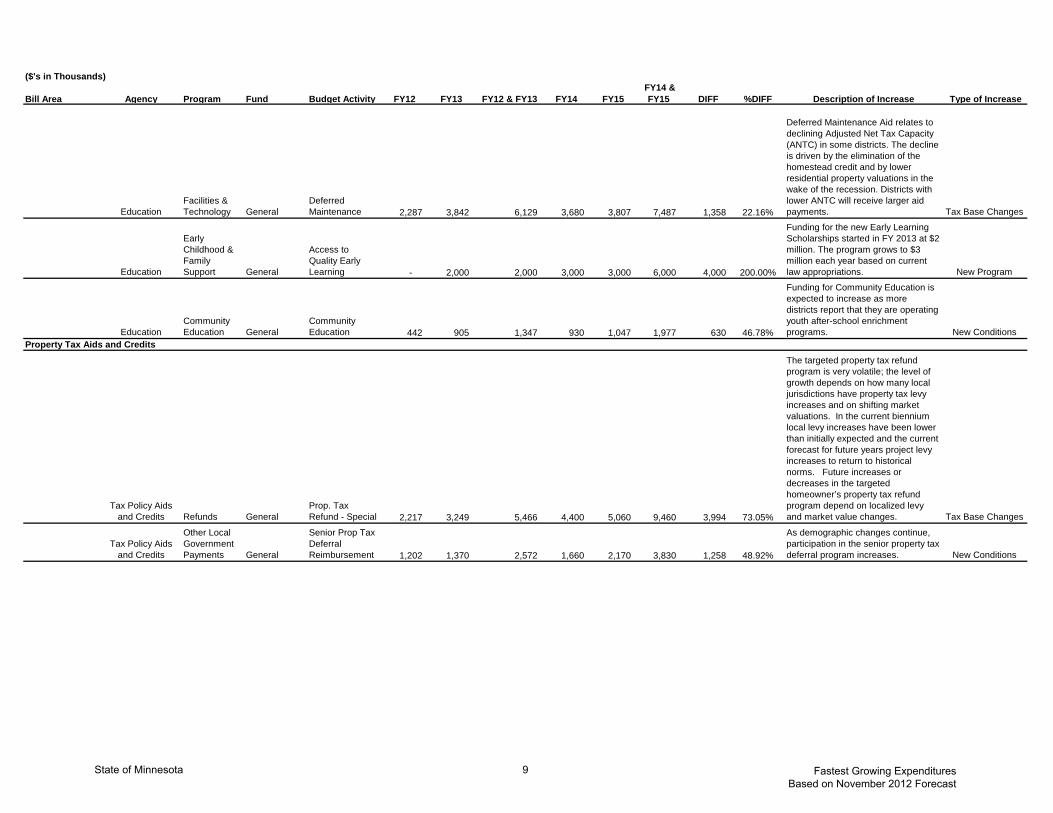
Deferred Maintenance 2,287 3,842 6,129 3,680 3,807 7,487 1,358 22.16%
Deferred Maintenance Aid relates to declining Adjusted Net Tax Capacity (ANTC) in some districts. The decline is driven by the elimination of the homestead credit and by lower residential property valuations in the wake of the recession. Districts with lower ANTC will receive larger aid payments. Tax Base Changes
Education
Early Childhood & Family Support General
Access to Quality Early Learning - 2,000 2,000 3,000 3,000 6,000 4,000 200.00%
Funding for the new Early Learning Scholarships started in FY 2013 at $2 million. The program grows to $3 million each year based on current law appropriations. New Program
EducationCommunity Education General
Community Education 442 905 1,347 930 1,047 1,977 630 46.78%
Funding for Community Education is expected to increase as more districts report that they are operating youth after-school enrichment programs. New Conditions
Property Tax Aids and Credits
Tax Policy Aids and Credits Refunds General
Prop. Tax Refund - Special 2,217 3,249 5,466 4,400 5,060 9,460 3,994 73.05%
The targeted property tax refund program is very volatile; the level of growth depends on how many local jurisdictions have property tax levy increases and on shifting market valuations. In the current biennium local levy increases have been lower than initially expected and the current forecast for future years project levy increases to return to historical norms. Future increases or decreases in the targeted homeowner’s property tax refund program depend on localized levy and market value changes. Tax Base Changes
Tax Policy Aids and Credits
Other Local Government Payments General
Senior Prop Tax Deferral Reimbursement 1,202 1,370 2,572 1,660 2,170 3,830 1,258 48.92%
As demographic changes continue, participation in the senior property tax deferral program increases. New Conditions
State of Minnesota 9 Fastest Growing Expenditures Based on November 2012 Forecast

($'s in Thousands)
Bill Area Agency Program Fund Budget Activity FY12 FY13 FY12 & FY13 FY14 FY15 FY14 &
FY15 DIFF %DIFF Description of Increase Type of Increase Health and Human Services
Human ServicesForecasted Programs
Health Care Access MinnesotaCare 263,973 281,167 545,140 453,770 534,754 988,524 443,384 81.33%
Two factors drive expenditure growth. First, federal health care reform mandates that individuals obtain insurance coverage, so the forecast for MinnesotaCare assumes higher enrollment. In addition, DHS's 1115 PMAP waiver, which allows the state to share the cost of the MinnesotaCare program with the federal government, expires on January 1, 2014, which means the state will receive less federal funding, while continuing to incur the same level of cost. New Conditions
Human ServicesGrant Programs General
Aging & Adult Services Grants 12,154 12,455 24,609 22,043 22,909 44,952 20,343 82.66%
This growth reflects the restoration of base funding levels for FY2014/15 for Essential Community Support grants after there were large one-time reductions of this funding for FY2012/13. The implementation of this new program could not occur in FY2012/13 because needed federal approval hadn't been received. The large percentage increase also reflects one-time reductions in another grant program within this BACT, the Community Service/Service Development. Again, the increase in FY2014/15 is due to restoring base funding. One-time Reduction
Human ServicesGrant Programs
Restricted Misc Special Rev
CD Treatment Support Grants 607 900 1,507 900 900 1,800 293 19.48%
This reflects a return to base funding levels for FY2014/15. There was a one-time cancellation of funding that was not able to be used in 2012, because there was a reduction in the number of available providers in 2012.
Lower than usual activity in 2012
and/or 2013Public Safety
CorrectionsCorrectional Institutions General
Institution Support Services 11,147 13,112 24,260 16,909 18,333 35,243 10,983 45.27%
This budget activity includes funding for a forecast increase in prison population. The anticipated growth is approximately 400 offenders from the currently funded level in FY 2013 to 9620 offenders in FY 2015. In FY 2014-15, $12.4 million is added to this activity to partially fund that anticipated increase. This is partly offset by other one-time transfers into the activity in the FY 12-13 biennium. New Conditions
State of Minnesota 10 Fastest Growing Expenditures Based on November 2012 Forecast

($'s in Thousands)
Bill Area Agency Program Fund Budget Activity FY12 FY13 FY12 & FY13 FY14 FY15 FY14 &
FY15 DIFF %DIFF Description of Increase Type of Increase
Public Safety - Public Safety
Homeland Security & Emergency Management
Restricted Misc Special Rev
Nuclear Plant Preparedness 2,723 4,291 7,014 4,613 4,500 9,113 2,099 29.93%
The increase results from a negotiated agreement with Excel Energy for preparedness planning for nuclear disasters. Increased Revenue
Public Safety - Public Safety
Gambling & Alcohol Enforcement
Restricted Misc Special Rev
Gambling Enforcement 331 1,138 1,469 1,009 1,009 2,018 549 37.33%
The increase was due to lower than anticipated spending in FY 2012 and an increase in electronic pull-tab receipts.
Lower than usual activity in 2012 and/or 2013;
Increased Revenue
Public Safety - Public Safety
Office Of Justice Programs
Restricted Misc Special Rev
Crime Victims Services 359 644 1,003 678 680 1,358 355 35.40%
The increase is from an increase in funds from the Department of Corrections for inmate restitution. Increased Revenue
Public Safety - Public Safety
Minnesota Firefighters Training & Education
Restricted Misc Special Rev
Minnesota Firefighters Training & Education 2,393 1,661 4,054 2,764 2,764 5,528 1,474 36.37%
The increase results from additional legislative appropriations from the Fire Safety Account for firefighter training.
Increased Program Funding by Legislature
Transportation Bill Area
TransportationMultimodal Systems
Hangar Loan Revolving Aeronautics 260 531 791 536 536 1,072 281 35.59%
The increase results from the forecast increase of loan activity (receipts and expenditures) within the hangar revolving loan fund. All receipts are appropriated for additional construction of hangar buildings. Increased Revenue
TransportationMultimodal Systems
Transit Assistance Transit 22,043 39,171 61,214 36,118 39,195 75,313 14,099 23.03%
The increase results from the forecast increase in car sales and the resulting increase in Motor Vehicle Sales Tax and Motor Vehicle Lease Sales Tax. Increased Revenue
Metropolitan Council-
Transportation Transit GeneralMet Council Transit 39,038 39,038 78,076 64,889 64,970 129,859 51,783 66.32%
The increase reflects a return to the base after one-time reductions in '12-13. One-time Reduction
Public Safety - Transportation
Driver & Vehicle Services
Restricted Misc Special Rev DVS Support 7,425 17,370 24,795 28,226 16,659 44,885 20,090 81.03%
The increase results from higher spending projections for the MNLARS Project as it progresses through implementation phases. New Conditions
Public Safety - Transportation
Pipeline Safety
Restricted Misc Special Rev Pipeline Safety 608 1,454 2,062 1,454 1,454 2,908 846 41.05%
The increase results from lower than anticipated spending in FY 2012. Pipeline Safety bills operators only for actual cost incurred for inspection and enforcement.
Lower than usual activity in 2012
and/or 2013Agriculture Bill Area
AgricultureValue-added Products General Value-Added 2,308 3,223 5,530 10,235 10,235 20,470 14,940 270.13%
This program received a one-time base reduction in FY12 & FY13. FY14 & FY15 returns to base funding levels. One-time Reduction
State of Minnesota 11 Fastest Growing Expenditures Based on November 2012 Forecast

($'s in Thousands)
Bill Area Agency Program Fund Budget Activity FY12 FY13 FY12 & FY13 FY14 FY15 FY14 &
FY15 DIFF %DIFF Description of Increase Type of Increase Economic Development
Iron Range Resources and Rehabilitation
Board OperationsIron Range Resources
Operations - IRRRB 2,058 2,860 4,919 2,860 2,860 5,720 802 16.30%
Difference from FY 2012 to FY 2013 is due to expenditures coming in below budget in FY 2012. Operations budget is constant through FY2015.
Lower than usual activity in 2012
and/or 2013
Iron Range Resources and Rehabilitation
BoardPass-through Funding
Iron Range Resources
Pass-through Funding 7,746 17,195 24,941 14,719 14,786 29,505 4,564 18.30%
Due to increases in taconite production for 2012-2013 (FY 2014-2015), IRRRB will receive additional resources for the Taconite Economic Development Fund. New Conditions
Iron Range Resources and Rehabilitation
Board ProjectsIron Range Resources Projects 9,249 7,500 16,749 13,000 14,500 27,500 10,751 64.19%
Due to increases in taconite production for 2012-2013 (FY 2014-2015), IRRRB will receive additional resources for programs. New Conditions
State Government
MN.IT Services
IT For Minnesota Government
Enterprise Technologies
IT Standard Services 37,046 36,565 73,611 128,039 125,321 253,359 179,749 244.19%
This increase is due to IT consolidation. IT Consolidation
MN.IT Services
IT For Minnesota Government
Enterprise Technologies
Application Development/Support 31,034 36,045 67,078 177,674 189,563 367,238 300,159 447.48%
This increase is due to IT consolidation. IT Consolidation
MN.IT Services
IT For Minnesota Government
Enterprise Technologies
Projects/Initiatives 5,872 8,214 14,086 54,335 58,765 113,100 99,015 702.95%
This increase is due to IT consolidation. IT Consolidation
MN.IT Services
IT For Minnesota Government Master Lease Leadership 3,782 5,900 9,682 14,310 14,310 28,620 18,938 195.61%
This increase is due to IT consolidation. IT Consolidation
MN.IT Services
IT For Minnesota Government
Enterprise Technologies Leadership 16,880 19,411 36,291 57,339 55,639 112,978 76,686 211.31%
This increase is due to IT consolidation. IT Consolidation
Management and Budget
Statewide Services General Treasury 1,744 1,615 3,358 1,981 1,981 3,961 603 17.96%
The increase in expenditures is based on the assumption existing vacancies will be filled in fiscal year 2014.
Lower than usual activity in 2012
and/or 2013
Management and Budget
Statewide Services
Management Analysis
Human Resource Management 743 1,918 2,662 2,118 2,118 4,237 1,575 59.17%
The increase in expenditures is based on an increased activity in Enterprise Learning and Development--a fee-for-service unit within MMB. New Conditions
Veterans AffairsVeterans Health Care
Other Misc Special Rev
Veterans Health Care 3,273 4,205 7,478 5,308 5,313 10,621 3,143 42.02%
This increase in spending is due to efforts to modernize and update IT services and support at the veterans homes in order to bring them in to industry-level standards of care. New Program
MMB Non-operating Tort Claim
Trunk Highway Tort Claim 28 600 628 600 600 1,200 572 91.04%
Tort claims payments in 2012 were relatively low. The forecast assumes a level of anticipated activity more comparable to historical trends.
Lower than usual activity in 2012
and/or 2013
State of Minnesota 12 Fastest Growing Expenditures Based on November 2012 Forecast