2013 Patent Litigation Studypatentdocs.typepad.com/files/2013-patent-litigation-study.pdf · 2013...
38
1995–2012 2013 Patent Litigation Study Big cases make headlines, while patent cases proliferate
Transcript of 2013 Patent Litigation Studypatentdocs.typepad.com/files/2013-patent-litigation-study.pdf · 2013...

1995–2012
2013 Patent Litigation Study Big cases make headlines, while patent cases proliferate


PwC 1
Table of contents
Introduction 3
Summary of key observations 5Patent actions rise dramatically, set record high 6Median damages award declines 7NPE awards outpace practicing entities 7The largest historical awards have rarely been upheld 8Jury trials are favored overall 9Patentees still winning with juries, and increasingly with bench 9NPEs look to juries more often 10However, discrepancy in use of juries has shrunk 10Median jury awards substantially outpace the bench 10Reasonable royalties are the most prevalent damages 11Assessing success rate factors 12Success rates: up for practicing entities, down for NPEs 12Trial success rates: diverging results 12Summary judgment impact on NPEs 13Consumer products technology leads in decisions 13Biotechnology and information technology cases on the rise 14Median damages largest in telecommunications industry 15NPE versus practicing entity damages vary widely by industry 16Success rates by industry 17Practicing entity versus NPE success rates by industry 18Telecommunications and computer hardware/electronics industries lead in jury use 19Majority of patent cases reach trial within three years 20Median time-to-trial: approximately 2.5 years 21Median damages rise with time-to-trial 22Virginia Eastern, Wisconsin Western speediest in time-to-trial 22Certain districts are more favorable to patent holders 23Federal district courts with most NPE cases 24Practicing entities and NPEs by the numbers 25NPEs see variety in median damages and success rates 26Individual NPEs experience lower success rates 26Vast majority of NPE litigation involves company and individual NPEs 27ANDA litigation trends upward 27New Jersey and Delaware are favored ANDA districts 28 Historical ANDA success rates have varied significantly 28Top ANDA litigants 29Statistics by judge 30Summary judgment statistics by judge 32
Our methodology 34
Our authors 35
2013 Patent Litigation Study

2 PwC 2013 Patent Litigation Study
Introduction

PwC 3 2013 Patent Litigation Study
We view 2012 as a banner year in patent litigation. Massive damages awards made headlines. The 2011 America Invests Act (AIA) began making its impact. The influence of nonpracticing entities (NPEs) continued to grow. And the number of patents granted and litigations filed maintained their upward trajectory.
Prior to 2012, only three patent infringement damages awards eclipsed the $1 billion mark. But last year alone, three cases, tried before juries in separate districts, resulted in awards of $1 billion or greater: Monsanto v. DuPont, Apple v. Samsung, and Carnegie Mellon University v. Marvell. The outcomes of these matters have varied so far. Monsanto v. DuPont settled for a ten-year $1.75 billion license; the $1.05 billion award in Apple v. Samsung was reduced by $450 million and likely will be modified further; and Carnegie Mellon v. Marvell remains in the post-trial phase. Similarly, two ‘stent wars’ verdicts of more than $500 million were overturned or settled for short dollars in 2013.
NPEs continued to play a critical and growing role in patent litigation in 2012. One recent analysis reported that as of 2012 NPEs accounted for the majority of patent infringement litigation filed in the United States, compared to less than a quarter of patent infringement lawsuits filed in 2007.1 Our statistics indicate that only 16% of identified decisions in 2012 involved NPE patent holders. The difference reveals a much higher tendency for NPE actions to be resolved without a formal court decision. Our analysis continues to show a significant disparity in median damages awarded to NPEs versus practicing entities. Over the last 12 years, NPEs have been awarded median damages that have averaged twice the median award for practicing entities.
The AIA also made an impact in 2012. While many elements of the AIA did not go into effect until late 2012 or early 2013, the ‘anti-joinder’ provision, which constrained the number of defendants that could be named in the same lawsuit, became effective on September 16, 2011. This
provision of the AIA resulted in an increase in the absolute number of lawsuits, particularly those filed by NPEs. One study noted a large decline (over 40%) in the average number of defendants per case between 2011 and 2012, with the average dropping from 3.9 defendants in 2011 to 2.3 defendants in 2012.2 In addition, the AIA largely ended the phenomenon of false marking ‘qui tam’ actions that had become so prevalent in 2010 and early 2011.
The number of patent lawsuits filed spiked by almost 30% in 2012 to over 5,000, with some of that increase attributed to the AIA’s ‘anti-joinder’ provision. The number of patents granted by the United States Patent and Trademark Office (USPTO) also has continued the significant upward growth that has been seen since 2009. Patent infringement litigation shows no signs of cooling off, either as a means of generating revenue or of protecting competitive advantages.
1 See Sara Jeruss, Robin Feldman, and Tom Ewing, “The AIA 500 Expanded: The Effects of Patent Monetization Entities,” (April 2013). Available at SSRN: http://ssrn.com/abstract=2247195
2 See James Pistorino, “2012 Trends in Patent Case Filings and Venue: Eastern District of Texas Most Popular for Plaintiffs (Again) But 11 Percent Fewer Defendants Named Nationwide,” (February 2013).

2013 Patent Litigation Study 4 PwC
Summary of key observations

2013 Patent Litigation Study PwC 5
Recognizing the significance of these developments and business leaders’ continuing deep interest in intellectual property matters, PwC maintains a database of patent damages awards and other identified decisions. We collect information about patent holder success rates, time-to-trial statistics, and practicing versus nonpracticing entity (NPE) statistics from 1995 through 2012. This year’s study also includes statistics by judge.
Our analysis yields a number of observations that can help executives, legislators, and litigators assess their patent enforcement or defense strategies, as well as the impact of NPEs.
• Annual median damages awards (in 2012 dollars) ranged from $1.9 million to $16.5 million between 1995 and 2012. The median damages award was approximately $4.9 million over 2007 to 2012.
• Damages awards for NPEs averaged more than double those for practicing entities over the last decade.
• The disparity between jury and bench awards is stark; the median jury award amounted to nearly 45 times the median bench award between 2007 and 2012.
• Reasonable royalties remain the predominant measure of patent damages awards, representing more than 80% of awards over the last six years.
• NPEs have been successful 24% of the time overall versus 34% for practicing entities, due to the relative lack of success for NPEs at summary judgment. However, both have about a two-thirds success rate at trial.
• The median damages award in the telecommunications industry was significantly higher than that of other industries. Biotechnology/pharma, medical devices, and computer hardware/electronics also had higher relative median damages awards than did other industries.
• While the median time-to-trial has remained fairly constant, averaging 2.3 years since 1995, we see significant variations among jurisdictions.
• Certain federal district courts (particularly Virginia Eastern, Delaware, and Texas Eastern) continue to be more favorable to patent holders, with shorter time-to-trial durations, higher success rates, and larger median damages awards.
• The top five federal district courts (out of a total of 94) accounted for 39% of all identified decisions involving an NPE as the patent holder. The Eastern District of Texas accounted for 12% of NPE decisions.
• Not all NPEs are created equal. University/non-profit NPEs have the highest success rate among NPE litigants. Individuals’ median damages award is considerably lower than the median award of company or university NPEs.
• While Abbreviated New Drug Application (ANDA) litigation continues to grow rapidly, success rates since 2006 have varied significantly, given the small number of cases that reach a dispositive court conclusion before settling.
• Of currently-active judges, the ten most active on patent infringement cases generally have higher median damages and lower time to trial than the overall study medians.

6 PwC 2013 Patent Litigation Study
Patent actions rise dramatically, set record high
Chart 1
1,000
1,500
2,000
2,500
3,000
3,500
4,000
4,500
5,000
5,500
100,000
120,000
140,000
160,000
180,000
200,000
220,000
240,000
260,000
280,000
Pat
ent
case
s fil
ed
Patents granted
’91 ’92 ’93 ’94 ’95 ’96 ’97 ’98 ’99 ’00 ’01 ’02 ’03 ’04 ’05 ’06 ’07 ’08 ’09 ’10 ’12’11
CAGR=6.4%
CAGR=4.5%
Patent cases Patents granted
Year
Years are based on September year-end.Sources: US Patent and Trademark Office: Performance & Accountability Report and US Courts: Judicial Facts & Figures
Chart 1. Patent case filings and grants
2012 saw continued growth in patent actions filed and patents granted
As Chart 1 illustrates, the annual number of patent actions filed has increased at an overall compound annual growth rate (CAGR) of 7% since 1991. Much of this growth can be attributed to the 29% increase in the number of filings in 2012 over 2011. The number of
patent actions filed reached 5,189 in 2012, representing the highest number ever recorded. As noted earlier, the anti-joinder provision of the America Invents Acts (AIA) played a large role in the 2012 increase.3 In addition, the temporary rash of false marking cases in 2010 and 2011 (reportedly over 1,000) contributed to the dramatic increase seen since 2009.
Meanwhile, the number of patents granted by the United States Patent and Trademark Office (USPTO) has also grown steadily, increasing at a CAGR of 5% since 1991. In 2012, the number of all types of patents granted by the USPTO increased by 11% to 270,258. As the chart further shows, 2012 continued the trend of high correlation (approximately 96% since 1991) between patent cases filed and patents granted by the USPTO.
3 Some estimates have placed the increase caused by the AIA at perhaps 2,000 cases

PwC 7 2013 Patent Litigation Study
Median damages award declines
Chart 2a
NPE awards outpace practicing entities
Chart 2b
Chart 2a. Patent holder median damages awarded
$0
$1
$2
$3
$4
$5
$6
$7
Med
ian
dam
ages
aw
ard
ed (i
n M
M)
Median damages are adjusted for inflation and represented in 2012 US dollars.
The number of identified decisions is indicated within the respective column.
1995-2000 2001-2006 2007-2012
67 141 187
$4.9
$5.4
$6.5
Chart 2b. Patent holder median damages awarded: nonpracticing entities vs. practicing entities
$0
$2
$4
$6
$8
$10
$12
Med
ian
dam
ages
aw
ard
ed (i
n M
M)
Median damages are adjusted for inflation and represented in 2012 US dollars.
1995-2000 2001-2006 2007-2012
Nonpracticing entities
Practicing entities
$7.2
$3.8
$4.6
$5.7
$11.2
$5.5
Adjusting for inflation using the consumer price index (CPI), the annual median damages award ranged from $1.9 million to $16.5 million between 1995 and 2012, with an overall median award of $5.5 million over the last 18 years. As Chart 2a illustrates, when we segment the time period from 1995 through 2012 into thirds, we see that the median damages award over the most recent period represents the lowest relative point. Notably, the median damages award from 2007 to 2012 was down more than 24% from the median award between 2001 and 2006. However, the median damages award in 2012 jumped to $9.5 million, with three of the largest damages awards of all time occurring in this year.
Over the last 12 years, median damage awards for NPEs have significantly outpaced those of practicing entities.
Chart 2b shows the continuation of a trend that started in 2001: a wide premium (almost double in the last 12 years) in the damages awarded to NPEs compared to those awarded to practicing entities.
Given recent case decisions at the Federal Circuit, what does that portend for patent litigation liability? For damages? Willfulness?
No matter what the Federal Circuit does
to try to add predictability and limits
on patent infringement remedies—
whether it be new standards on willful
infringement, lost profits, reasonably
royalty, or whatever—the market place
(and those who continue to invest in
patent litigation) will respond with
new strategies to take advantage of the
system. And, so long as trial judges stand
aside and let the parties present their
cases to a jury, patent litigation is here to
stay in a big way.
—Steven Bauer (Proskauer Rose LLP)

8 PwC 2013 Patent Litigation Study
The largest historical awards have rarely been upheld
Chart 2c
Year
Plaintiff
Defendant
Technology
Award (in MM)
2009 Centocor Ortho Biotech Inc. Abbott Laboratories Arthritis drugs $1,848
2007 Lucent Technologies Inc. Microsoft Corp. MP3 technology $1,538
2012 Carnegie Mellon University Marvell Technology Group Noise reduction technology on integrated circuits for disk drives
$1,169
2012 Apple Inc. Samsung Electronics Co. Smartphone software $1,049
2012 Monsanto Company E.I. Dupont De Nemours and Company Genetically modified soybean seeds
$1,000
2010 Mirror Worlds LLC Apple Inc. Operating system $626
2011 Bruce N. Saffran M.D. Jonhson & Johnson Drug-eluting stents $593
2003 Eolas Technologies Inc. Microsoft Corp. Internet browser $521
2008 Bruce N. Saffran M.D. Boston Scientific Corp. Drug-eluting stents $432
2009 Uniloc USA Inc. Microsoft Corp. Software activation technology $388
Chart 2c. Top ten largest initial adjudicated damages awards: 1995–2012
Substantial damages awards have continued to garner headlines, particularly in 2012. Chart 2c displays the top ten damages awards in federal district courts since 1995. Whereas in 2011 only one decision cracked the top ten list—a $593 million damages award to Dr. Bruce Saffran against
Johnson & Johnson (which has since been overturned)—three cases broke into the top ten list in 2012: Monsanto v. DuPont for $1 billion, Apple v. Samsung for $1.05 billion, and Carnegie Mellon v. Marvell for $1.2 billion. It is important to note that the awards reflected in Chart 2c are those
identified during initial adjudication; most of these awards have since been vacated, remanded, or reduced, while some remain in the appellate process. In fact, by mid-2013, two of the three blockbusters from 2012 were significantly reduced or settled, with the other still pending appeals.
PwC 9 2013 Patent Litigation Study
Patentees still winning with juries, and increasingly with bench
Chart 3b
Jury trials are favored overall
Chart 3a
Chart 3a. Use of jury trials by decade
0%
10%
20%
30%
40%
50%
60%
70%
1980s 1990s 2000s 2010s
59%62%
14%
26%
Chart 3b. Bench vs. jury trials: success rates
0%
10%
20%
30%
40%
50%
60%
70%
80%
90%
100%
1995-2000 2001-2006 2007-2012
Bench
Jury
63%
77%
43%
80%
55%
76%
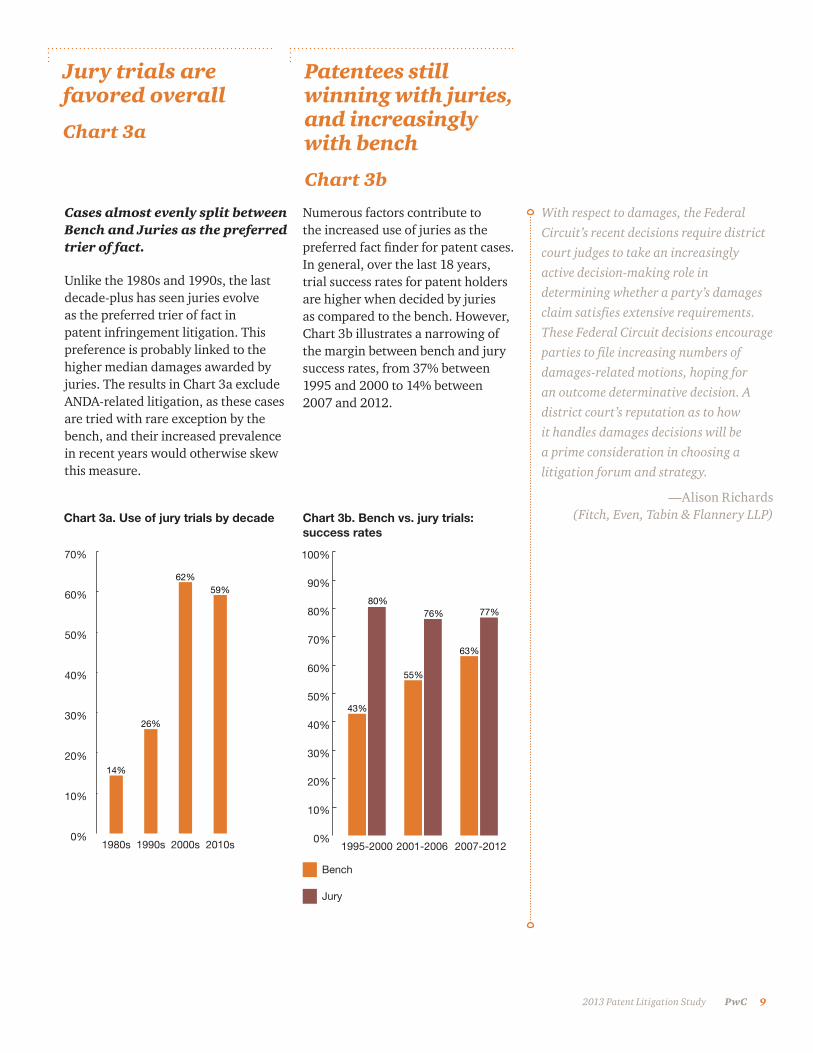
Cases almost evenly split between Bench and Juries as the preferred trier of fact.
Unlike the 1980s and 1990s, the last decade-plus has seen juries evolve as the preferred trier of fact in patent infringement litigation. This preference is probably linked to the higher median damages awarded by juries. The results in Chart 3a exclude ANDA-related litigation, as these cases are tried with rare exception by the bench, and their increased prevalence in recent years would otherwise skew this measure.
Numerous factors contribute to the increased use of juries as the preferred fact finder for patent cases. In general, over the last 18 years, trial success rates for patent holders are higher when decided by juries as compared to the bench. However, Chart 3b illustrates a narrowing of the margin between bench and jury success rates, from 37% between 1995 and 2000 to 14% between 2007 and 2012.
With respect to damages, the Federal
Circuit’s recent decisions require district
court judges to take an increasingly
active decision-making role in
determining whether a party’s damages
claim satisfies extensive requirements.
These Federal Circuit decisions encourage
parties to file increasing numbers of
damages-related motions, hoping for
an outcome determinative decision. A
district court’s reputation as to how
it handles damages decisions will be
a prime consideration in choosing a
litigation forum and strategy.
—Alison Richards (Fitch, Even, Tabin & Flannery LLP)
10 PwC 2013 Patent Litigation Study
Median jury awards substantially outpace the bench
Chart 3e
NPEs look to juries more often
Chart 3c
However, discrepancy in use of juries has shrunk
Chart 3d
Chart 3c. Use of jury trials by type of entity: 1995–2012
Chart 3d. Use of jury trials by type of entity
Chart 3e. Bench vs. jury trials: median damages awarded by period
0%
10%
20%
30%
40%
50%
60%
The number of cases is indicated within the respective column.
74/1
31
313/
662
56%
47%
Nonpracticing entities
Practicing entities
0%
10%
20%
30%
40%
50%
60%
70%
80%
1995-2000 2001-2006 2007-2012
Nonpracticing entities
Practicing entities
61%
55%
20%
25%
50%
71%
Bench
Jury
Median damages are adjusted for inflation and represented in 2012 US dollars.
$0
$2
$4
$6
$8
$10
$12
$14
Med
ian
dam
ages
aw
ard
ed (i
n M
M)
1995-2000 2001-2006 2007-2012
$0.3
$12.2
$5.4
$6.9
$1.0
$11.2
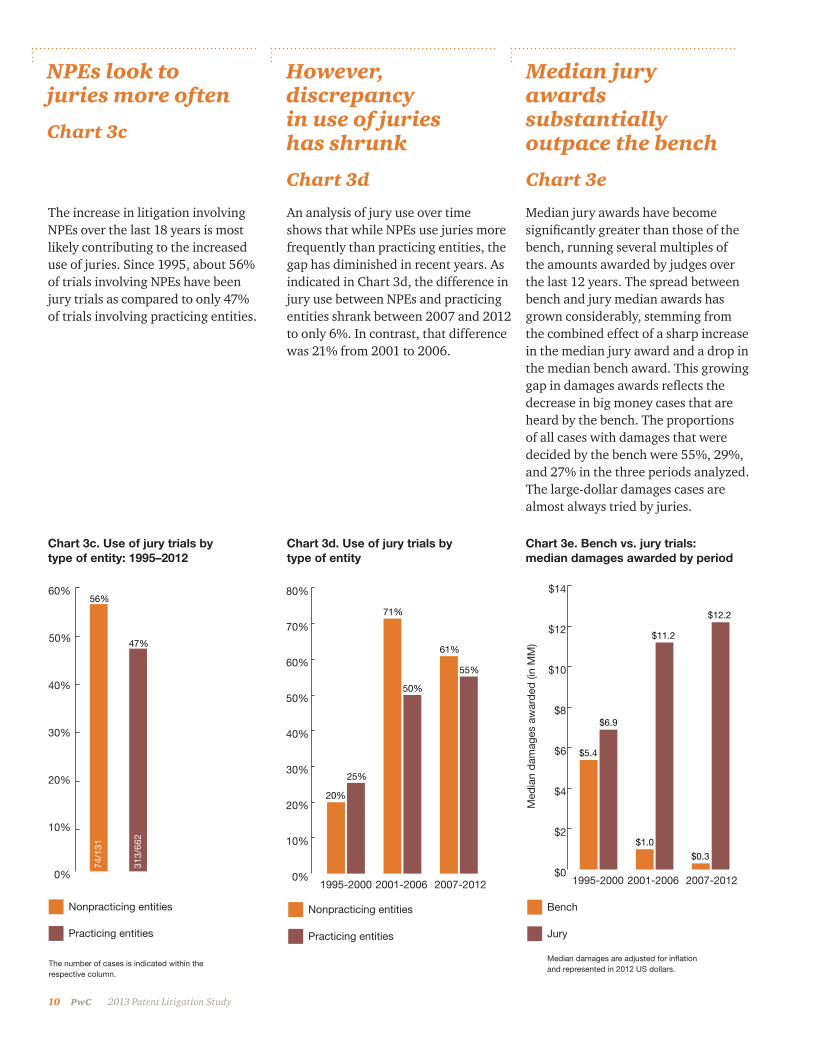
The increase in litigation involving NPEs over the last 18 years is most likely contributing to the increased use of juries. Since 1995, about 56% of trials involving NPEs have been jury trials as compared to only 47% of trials involving practicing entities.
An analysis of jury use over time shows that while NPEs use juries more frequently than practicing entities, the gap has diminished in recent years. As indicated in Chart 3d, the difference in jury use between NPEs and practicing entities shrank between 2007 and 2012 to only 6%. In contrast, that difference was 21% from 2001 to 2006.
Median jury awards have become significantly greater than those of the bench, running several multiples of the amounts awarded by judges over the last 12 years. The spread between bench and jury median awards has grown considerably, stemming from the combined effect of a sharp increase in the median jury award and a drop in the median bench award. This growing gap in damages awards reflects the decrease in big money cases that are heard by the bench. The proportions of all cases with damages that were decided by the bench were 55%, 29%, and 27% in the three periods analyzed. The large-dollar damages cases are almost always tried by juries.

PwC 11 2013 Patent Litigation Study
Reasonable royalties are the most prevalent damages
Chart 4
Chart 4. Composition of damages awards to all entities
0%
10%
20%
30%
40%
50%
60%
70%
80%
90%
1995-2000 2001-2006 2007-2012
Price erosion
Lost profits
Reasonable royalty
26%
79%
8%
44%
7%
68%
81%
2%
33%
Reasonable royalties are the predominant measure of damages; price erosion is rare
Reasonable royalties are the kind of damages most frequently awarded in patent cases, constituting a greater share with each passing year. However, in the last six-year period, lost profits have somewhat resurged, being awarded in about one-third of decided cases.4 Section 284 of the Federal Code governing equitable compensation sets a reasonable royalty as the minimum level of compensation due to the patent holder from an infringer.
Lost profits damages are not as common as reasonable royalties for several reasons:
• NPEs, which bring an increased proportion of patent actions, are ineligible for lost profits damages because they do not sell products or services embodying their patents. If we omit NPE results from Chart 4, the proportion of damages awarded through reasonable royalties decreases by about 6%.
• Even in circumstances where the patentee may be eligible for lost profits awards, the patentee might seek recovery through the reasonable royalty approach. The complexity and cost of the analysis for determining lost profits is usually greater than it is for reasonable royalties.
• Patent holders can find the process of supporting lost profits analyses distracting to their core operations or they might not want to risk disclosing proprietary cost and profit information that is central to the calculation of lost profits.
• Lost profits entitlement can be more difficult to establish. The proliferation of competition provides greater access to substitute products. The presence of these alternatives means that even without an alleged infringer’s products on the market, consumers may not have automatically bought the patent holder’s products. Furthermore, the growing use of specialized distribution channels for reaching a specific consumer demographic may support an alleged infringer’s contention that its customers are separate and distinct from those of the patent holder.
In addition, damages awards for price erosion claims have become almost non-existent over the last six years. Globalized competition, turbulent economic conditions, and the cost and complexity of price erosion analyses have reduced the recovery (and most likely pursuit) of price erosions claims.
4 Because some litigants receive damages awards of both lost profits and reasonable royalties, the totals exceed 100%.

12 PwC 2013 Patent Litigation Study
Assessing success rate factors
Chart 5a
Success rates: up for practicing entities, down for NPEs
Chart 5b
Chart 5a. Patent holder success rates: 1995–2012
Chart 5b. Patent holder overall success rates
Chart 5c. Patent holder success rates at trial: 1995–2012
0%
10%
20%
30%
40%
50%
60%
70%65% 66%
24%
2%
34%
10%
Overall Summaryjudgment
Trial
Nonpracticing entities
Practicing entities
0%
5%
10%
15%
20%
25%
30%
35%
40%
45%
1995-2000 2001-2006 2007-2012
Nonpracticing entities
Practicing entities
26%
38%
14%
29%
33%
28%
The number of cases is indicated within the respective column.
56/7
0
Bench Jury
Nonpracticing entities
Practicing entities
0%
10%
20%
30%
40%
50%
60%
70%
80%
90%
25/5
7
196/
349
60/7
4
238/
313
44%
56%
81%
76%
Trial success rates: divergent results
Chart 5c
Success rates vary considerably by year, type of entity (NPE versus practicing entity), and trier of fact
Chart 5a demonstrates that the overall success rate for practicing entities is 10% higher than that of NPEs over the last 18 years. As compared to practicing entities, NPEs are much less successful at the summary judgment stage: in only 2% of identified decisions, as opposed to almost 10% for practicing entities. Meanwhile, the trial success rate for practicing entities is nearly identical to that of NPEs, at roughly two-thirds.
By segmenting overall success rate data for NPEs and practicing entities within the last 18 years, we see an interesting pattern. While the difference in overall success rates for NPEs versus practicing entities between 2001 and 2006 shrank to about 5%, the gap widened over the last six years. Between 2007 and 2012, the practicing entity overall success rate outpaced that for NPEs by approximately 12%. This difference is similar to the margin in overall success rates between 1995 and 2000.
Notably, an increase in practicing entity success, along with a decline in NPE success, has contributed to the growing gap in success rates between 2007 and 2012.
Consistent with last year’s study, Chart 5c illustrates that since 1995, practicing entities and NPEs have been significantly more successful with jury trials than they have been with bench trials. The chart also captures a divergence in success rates: while practicing entities enjoy a success rate 12% higher than NPEs with the bench, their success rates with juries are actually about 5% less than NPEs.
PwC 13 2013 Patent Litigation Study
Chart 5d. Percent of decisions at summary judgment
Chart 6a. Distribution of cases: top ten industries, 1995–2012
0%
10%
20%
30%
40%
50%
60%
70%
1995-2000 2001-2006 2007-2012
Nonpracticing entities
Practicing entities
61%
52%
60%
50%
58%
54%
Summary judgment impact on NPEs
Chart 5d
Consumer products technology leads in decisions
Chart 6a
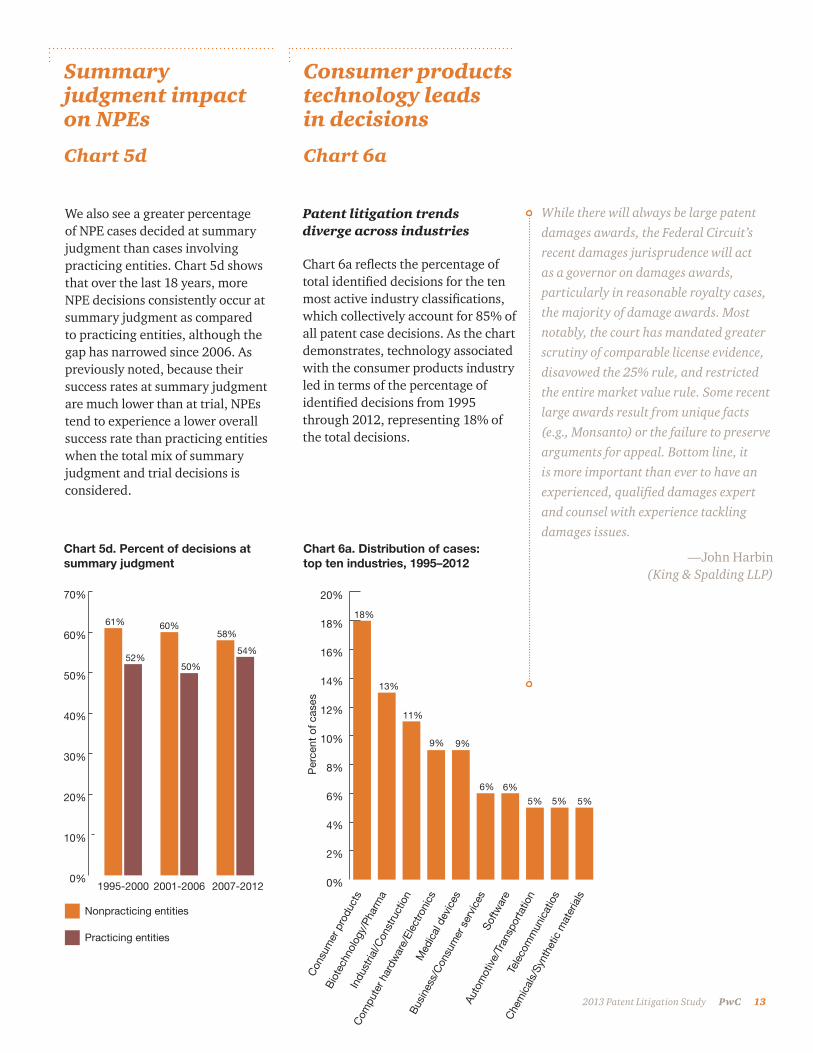
We also see a greater percentage of NPE cases decided at summary judgment than cases involving practicing entities. Chart 5d shows that over the last 18 years, more NPE decisions consistently occur at summary judgment as compared to practicing entities, although the gap has narrowed since 2006. As previously noted, because their success rates at summary judgment are much lower than at trial, NPEs tend to experience a lower overall success rate than practicing entities when the total mix of summary judgment and trial decisions is considered.
Patent litigation trends diverge across industries
Chart 6a reflects the percentage of total identified decisions for the ten most active industry classifications, which collectively account for 85% of all patent case decisions. As the chart demonstrates, technology associated with the consumer products industry led in terms of the percentage of identified decisions from 1995 through 2012, representing 18% of the total decisions.
0%
2%
4%
6%
8%
10%
12%
14%
16%
18%
20%
Con
sum
er p
rodu
cts
Bio
tech
nolo
gy/P
harm
a
Indu
stria
l/Con
stru
ctio
n
Com
pute
r har
dwar
e/El
ectro
nics
Med
ical
dev
ices
Bus
ines
s/C
onsu
mer
ser
vice
sSo
ftwar
eTe
leco
mm
unic
atio
s
Auto
mot
ive/
Tran
spor
tatio
n
Che
mic
als/
Synt
hetic
mat
eria
ls
Per
cent
of c
ases
18%
13%
11%
9% 9%
6% 6%
5% 5% 5%
While there will always be large patent
damages awards, the Federal Circuit’s
recent damages jurisprudence will act
as a governor on damages awards,
particularly in reasonable royalty cases,
the majority of damage awards. Most
notably, the court has mandated greater
scrutiny of comparable license evidence,
disavowed the 25% rule, and restricted
the entire market value rule. Some recent
large awards result from unique facts
(e.g., Monsanto) or the failure to preserve
arguments for appeal. Bottom line, it
is more important than ever to have an
experienced, qualified damages expert
and counsel with experience tackling
damages issues.
—John Harbin (King & Spalding LLP)

14 PwC 2013 Patent Litigation Study
Biotechnology and information technology (computer hardware, software, Internet) cases on the rise
Chart 6b
Overall rank
Industry
1995 – 2000
Cases Rank
2001 – 2006
Cases Rank
2007 – 2012
Cases Rank
Total cases
1 Consumer products 81 1 98 1 148 1 327
2 Biotechnology/Pharma 39 4 80 2 127 2 246
3 Industrial/Construction 64 2 70 3 76 4 210
4 Computer hardware/Electronics 24 6 48 5 101 3 173
5 Medical devices 41 3 54 4 72 5 167
6 Business/Consumer services 17 8 47 6 48 8 112
7 Software 14 9 28 8 70 6 112
8 Automotive/Transportation 24 7 30 7 37 9 91
9 Telecommunications 13 11 27 9 50 7 90
10 Chemicals/Synthetic materials 31 5 22 10 32 10 85
11 Food/Beverages/Tobacco 14 10 10 13 13 13 37
12 Metals/Mining 12 12 14 11 8 17 34
13 Clothing/Textiles 9 13 10 14 10 16 29
14 Energy 6 14 11 12 12 14 29
15 Agriculture 5 15 10 15 12 15 27
16 Financial institutions/Investment management/Insurance
1 18 3 17 22 12 26
17 Internet/Online services 0 20 0 20 25 11 25
18 Aerospace/Defense 3 17 3 18 8 18 14
19 Media 4 16 4 16 4 20 12
20 Environment/Waste management 1 19 3 19 6 19 10
Total 403 572 881 1,856
Chart 6b. Number of cases by industry: 1995−2012
Chart 6b provides additional insight into the number of identified decisions by industry from 1995 through 2012. The consumer products industry ranks first in the percentage of decisions in each of the three time segments.
The number of decisions and relative ranking of the biotechnology/pharma industry have increased. In addition, the computer hardware/electronics, software, and Internet/online services industries experienced significant increases in identified decisions
from 2007 through 2012. In fact, no identified decisions in Internet/online services occurred prior to 2007. This data reflects the increasing importance and size of biotechnology and information technology.

PwC 15 2013 Patent Litigation Study
Median damages largest in tele- communications industry
Chart 6c
Chart 6c. Patent holder median damages awarded: top ten industries, 1995–2012
$0
$5
$10
$15
$20
$25
$30
$35
Con
sum
er p
rodu
cts
Bio
tech
nolo
gy/P
harm
a
Indu
stria
l/Con
stru
ctio
n
Com
pute
r har
dwar
e/El
ectro
nics
Med
ical
dev
ices
Bus
ines
s/C
onsu
mer
ser
vice
sSo
ftwar
eTe
leco
mm
unic
atio
ns
Auto
mot
ive/
Tran
spor
tatio
n
Che
mic
als/
Synt
hetic
mat
eria
ls
Median damages are adjusted for inflation and represented in 2012 US dollars.
The number of identified decisions is indicated within the respective column.
74 21 46 50 53 22 2317
1521
Med
ian
dam
ages
aw
ard
ed (i
n M
M)
Overall median damage award for all industries
While technology associated with the consumer products industry represented the largest percentage of identified decisions, the median damages awarded were relatively low compared to the other top ten most active industries. Consistent with last year’s 2012 Patent Litigation
With 3 of the largest damages cases of all time occurring in 2012 (Apple, Monsanto and CMU), do you foresee a surge in patent litigation damages? Or in number of cases pursued, more so than already observed?
While the year 2012 witnessed several of
the largest verdicts in patent litigation
history, these results were less about
trends in the damages law and more
about the enormous revenues in issue
in, for example, the Apple-Samsung
battles. In fact, the recent developments
at the Federal Circuit on issues such
as the entire market value rule,
apportionment and comparability of
licenses are bringing much needed clarity
and discipline to damages proof. These
developments have made the manner in
which damages are proved and defended
more critical than ever.
—William Lee (Wilmer Cutler Pickering
Hale and Dorr LLP)
Study, technology associated with the telecommunications, biotechnology/ pharma, medical devices, and computer hardware/electronics industries experienced significantly higher median damages awards than other industries.

16 PwC 2013 Patent Litigation Study
NPE versus practicing entity damages vary widely by industry
Chart 6d
Chart 6d. Patent holder median damages awarded by type of entity: top ten industries, 1995–2012
$0
$10
$20
$30
$40
$50
$60
Con
sum
er p
rodu
cts
Bio
tech
nolo
gy/P
harm
aIn
dust
rial/C
onst
ruct
ion
Med
ical
dev
ices
Com
pute
r har
dwar
e/El
ectro
nics
Bus
ines
s/C
onsu
mer
ser
vice
s
Softw
are
Che
mic
als/
Synt
hetic
mat
eria
ls
Auto
mot
ive/
Tran
spor
tatio
n
Tele
com
mun
icat
ions
Nonpracticing entities
Practicing entities
Median damages are adjusted for inflation and represented in 2012 US dollars.
Overall NPE median damage award for all industries
Overall PE median damage award for all industries
Med
ian
dam
ages
(in
MM
)
Chart 6d separates the median damages awards for each of the top ten industries into practicing entity and NPE median damages. This chart demonstrates that the relationship between NPE and practicing entity damages is volatile across industry classification. The telecommunications and biotechnology/pharma industries have experienced significantly greater awards for practicing entities, while the computer hardware/electronics and business/consumer services industries reflect substantially higher awards for NPEs. Consistent with the overall data, more of the top ten industries analyzed in the nearby chart show higher median damages awards for NPEs. (See, for example, Chart 2b, which illustrates that NPE median damages overall have been higher over the last 12 years.)
PwC 17 2013 Patent Litigation Study
Success rates by industry
Chart 6e
Chart 6e. Patent holder success rates: top ten industries, 1995–2012
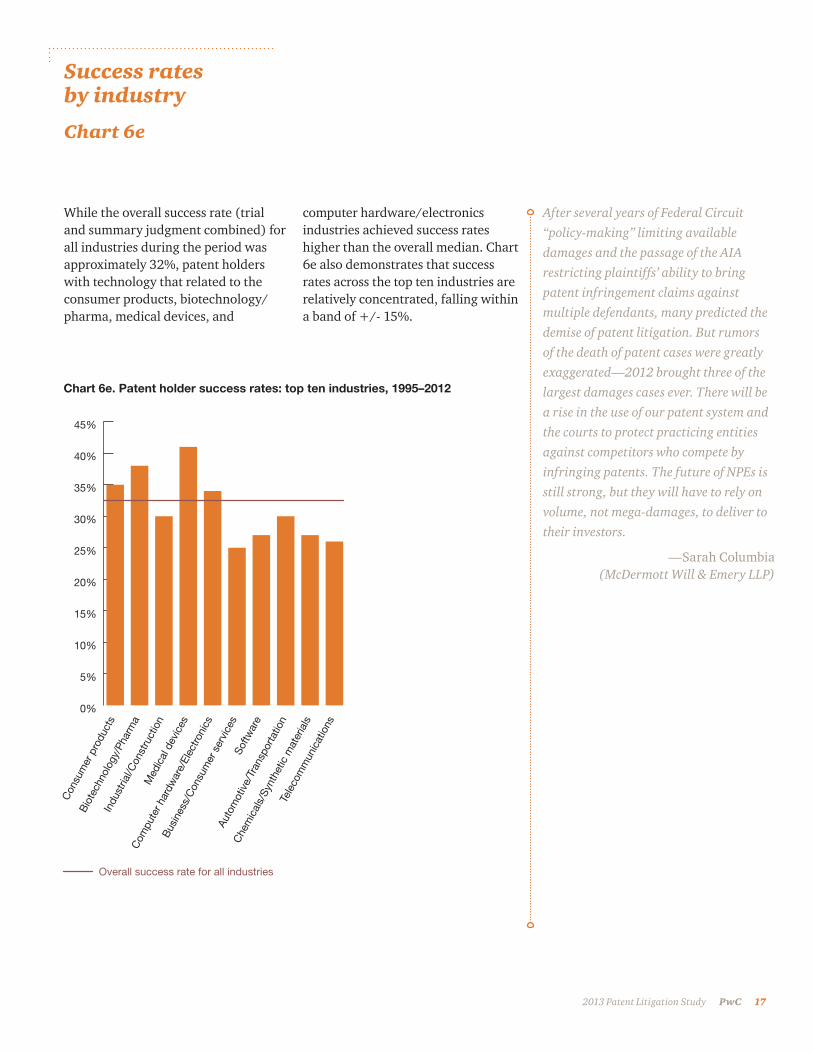
While the overall success rate (trial and summary judgment combined) for all industries during the period was approximately 32%, patent holders with technology that related to the consumer products, biotechnology/ pharma, medical devices, and
0%
5%
10%
15%
20%
25%
30%
35%
40%
45%
Con
sum
er p
rodu
cts
Bio
tech
nolo
gy/P
harm
a
Indu
stria
l/Con
stru
ctio
nM
edic
al d
evic
es
Com
pute
r har
dwar
e/El
ectro
nics
Bus
ines
s/C
onsu
mer
ser
vice
sSo
ftwar
e
Che
mic
als/
Synt
hetic
mat
eria
ls
Auto
mot
ive/
Tran
spor
tatio
nTe
leco
mm
unic
atio
ns
Overall success rate for all industries
computer hardware/electronics industries achieved success rates higher than the overall median. Chart 6e also demonstrates that success rates across the top ten industries are relatively concentrated, falling within a band of +/- 15%.
After several years of Federal Circuit
“policy-making” limiting available
damages and the passage of the AIA
restricting plaintiffs’ ability to bring
patent infringement claims against
multiple defendants, many predicted the
demise of patent litigation. But rumors
of the death of patent cases were greatly
exaggerated—2012 brought three of the
largest damages cases ever. There will be
a rise in the use of our patent system and
the courts to protect practicing entities
against competitors who compete by
infringing patents. The future of NPEs is
still strong, but they will have to rely on
volume, not mega-damages, to deliver to
their investors.
—Sarah Columbia (McDermott Will & Emery LLP)

18 PwC 2013 Patent Litigation Study
Practicing entity versus NPE success rates by industry
Chart 6f
Chart 6f. Patent holder success rates: top ten industries, 1995–2012
Chart 6f demonstrates that while the overall success rate is higher for practicing entities than for NPEs, the volatility of success rates for NPEs is very high across industries. The contrast between the high NPE success
rates of the biotechnology/pharma and medical device industries and the low NPE success rates of the software and business/consumer services industries is particularly striking.
While notable, these cases do not portend
a surge in the level of damages awards.
Each has its own unique circumstances,
and none has been affirmed. Without
addressing the circumstances of any of
these three cases, recent Federal Circuit
precedent, e.g., WhitServe, Lasertrack,
if anything, suggests an increased effort
to introduce rigor into the proof required
for patent damages and enforce the
standards for reliable, admissible expert
testimony that courts routinely apply in
other areas of law.
—Richard Cederoth (Sidley Austin LLP)
0%
5%
10%
15%
20%
25%
30%
35%
40%
45%
Con
sum
er p
rodu
cts
Bio
tech
nolo
gy/P
harm
aIn
dust
rial/C
onst
ruct
ion
Com
pute
r har
dwar
e/El
ectro
nics
Med
ical
dev
ices
Bus
ines
s/C
onsu
mer
ser
vice
s
Softw
are
Tele
com
mun
icat
ions
Auto
mot
ive/
Tran
spor
tatio
nC
hem
ical
s/Sy
nthe
tic m
ater
ials
Nonpracticing entities
Practicing entities
Overall NPE success rate for all industries
Overall PE success rate for all industries

PwC 19 2013 Patent Litigation Study
Telecommunications and computer hardware/electronics industries lead in jury use
Chart 6g
0%
10%
20%
30%
40%
50%
60%
70%
80%
Con
sum
er p
rodu
cts
Bio
tech
nolo
gy/P
harm
a
Indu
stria
l/Con
stru
ctio
n
Com
pute
r har
dwar
e/El
ectro
nics
Med
ical
dev
ices
Bus
ines
s/C
onsu
mer
ser
vice
sSo
ftwar
eTe
leco
mm
unic
atio
ns
Auto
mot
ive/
Tran
spor
tatio
n
Che
mic
als/
Synt
hetic
mat
eria
ls
Overall use of jury for all industries
Chart 6g. Use of jury trials: top ten industries, 1995–2012
Use of jury trials varies widely by industry, as illustrated in Chart 6g. Highlighting the wide disparity of jury trials by industry are the computer hardware/electronics and telecommunications industries compared to the biotechnology/pharma industry, both with a margin in jury use of more than 45%. As previously noted, the
telecommunications industry also had the highest median damages award by a significant margin. The biotechnology/pharma industry had a considerably lower use of jury trials than the other top ten industries; this is partly due to the frequent incidence of ANDA-related litigations, which are tried primarily by the bench.
Although last year saw three of
the largest damages awards ever, the
trend in patent in litigation will be to rein
in excessive awards. The Federal Circuit’s
requirement for rigorous economic proof
instead of speculation and rules of thumb
will keep damage awards in check. The
fight will be at the pre-trial stage with the
issues often decided on Daubert motions.
A potentially larger impact could come
from efforts to counter NPEs, such as the
SHIELD Act, which will not only deter
frivolous suits but also make it harder to
monetize patent assets.
—Mike Jakes (Finnegan, Henderson, Farabow,
Garrett & Dunner LLP)
20 PwC 2013 Patent Litigation Study
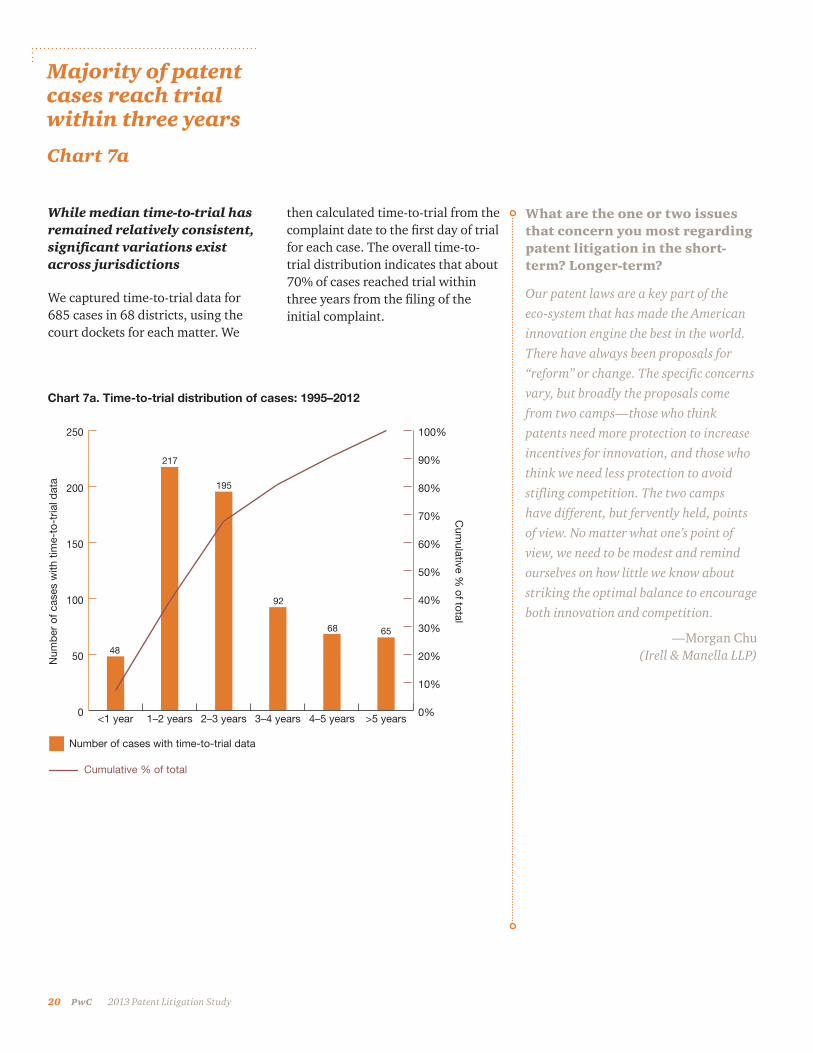
Majority of patent cases reach trial within three years
Chart 7a
0
50
100
150
200
250
<1 year 1–2 years 2–3 years 3–4 years 4–5 years >5 years0%
10%
20%
30%
40%
50%
60%
70%
80%
90%
100%
Num
ber
of c
ases
with
tim
e-to
-tria
l dat
a
Cum
ulative % of total
Number of cases with time-to-trial data
Cumulative % of total
217
195
48
92
68 65
Chart 7a. Time-to-trial distribution of cases: 1995–2012
While median time-to-trial has remained relatively consistent, significant variations exist across jurisdictions
We captured time-to-trial data for 685 cases in 68 districts, using the court dockets for each matter. We
then calculated time-to-trial from the complaint date to the first day of trial for each case. The overall time-to-trial distribution indicates that about 70% of cases reached trial within three years from the filing of the initial complaint.
What are the one or two issues that concern you most regarding patent litigation in the short-term? Longer-term?
Our patent laws are a key part of the
eco-system that has made the American
innovation engine the best in the world.
There have always been proposals for
“reform” or change. The specific concerns
vary, but broadly the proposals come
from two camps—those who think
patents need more protection to increase
incentives for innovation, and those who
think we need less protection to avoid
stifling competition. The two camps
have different, but fervently held, points
of view. No matter what one’s point of
view, we need to be modest and remind
ourselves on how little we know about
striking the optimal balance to encourage
both innovation and competition.
—Morgan Chu (Irell & Manella LLP)

PwC 21 2013 Patent Litigation Study
Median time-to-trial: approximately 2.5 years
Chart 7b
Number of cases
Median time-to-trial
0
10
20
30
40
50
60
70
80
90
1995 1996 1997 1998 1999 2000 2001 2002 2003 2004 2005 2006 2007 2008 2009 2010 2011 20120.0
0.5
1.0
1.5
2.0
2.5
3.0
3.5
4.0
Num
ber
of c
ases
tha
t w
ent
to t
rial
Med
ian time-to-trial (in years)
Chart 7b. Median time-to-trial
Overall, time-to-trial appears to have remained relatively steady at about 2.5 years since 2005, and no significant variations are noted since 1997.
However, since 2004, there is a slight upward trend in time-to-trial as the annual volume of cases going to trial has increased.

22 PwC 2013 Patent Litigation Study
Median damages rise with time-to-trial
Chart 7c
Virginia Eastern, Wisconsin Western speediest in time-to-trial
Chart 7d
Rank District
Total # of identified decisions with time-to-trial data In years
1 Virginia Eastern 22 0.97
2 Wisconsin Western 10 1.07
3 Florida Middle 15 1.74
4 Delaware 113 1.94
5 Texas Southern 11 2.00
6 Texas Eastern 85 2.19
7 California Central 29 2.34
8 Texas Northern 18 2.42
9 Florida Southern 15 2.50
10 Minnesota 12 2.66
11 New Jersey 27 2.70
12 California Northern 39 2.72
13 New York Southern 36 2.95
14 Massachusetts 25 3.63
15 Illinois Northern 35 3.67
Overall (all decisions identified) 685 2.35
Includes only the 15 most active districts for which time-to-trial data was available.
Chart 7c. Median damages based on time-to-trial: 1995–2012
Chart 7d. Median time-to-trial by district from 1995–2012
$0
$2
$4
$6
$8
$10
$12
$14
$16
$18
$20
138 76127
Median damages are adjusted for inflation and represented in 2012 US dollars.
The number of identified decisions is indicated within the respective column.
Med
ian
dam
ages
(in
MM
)
Time-to-trial in years
0–2 2–4 4+
$3.6
$8.2
$17.3
Chart 7c reflects the direct relationship between the median damages award and the number of years to trial. Several factors might influence this relationship. Cases involving higher potential damages awards are more complex and, thus, take longer to reach trial. Also, increased time-to-trial provides a longer period over which sales can occur, thereby increasing the potential damages base.
Since 1995, significant variations have occurred in the median time-to-trial across jurisdictions. To assess the lead time, we focused on the most active districts. Chart 7d summarizes the median time-to-trial among these courts from 1995 to 2012. As indicated, the Virginia Eastern and Wisconsin Western districts boast
the shortest time-to-trial, which has been significantly lower than the next district or the median. The fastest five districts and overall median time-to-trial have remained consistent from our last study.

PwC 23 2013 Patent Litigation Study
Certain districts are more favorable to patent holders
Chart 8
Chart 8. District Court rankings: 1995–2012
Overall rank District
Median time-to-trial (in years) Rank Overall success rate Rank
Median damages awarded Rank
1 Virginia Eastern 0.97 1 34.8% 6 $36,782,534 1
2 Delaware 1.94 4 42.2% 3 $20,754,192 2
3 Texas Eastern 2.19 6 57.5% 1 $10,000,000 5
4 Wisconsin Western 1.07 2 32.4% 8 $4,829,358 9
5 New Jersey 2.70 11 34.9% 5 $16,836,493 3
6 Florida Middle 1.74 3 51.4% 2 $154,571 15
7 California Central 2.34 7 30.4% 9 $6,869,675 7
8 Texas Southern 2.00 5 19.6% 15 $11,274,784 4
9 Texas Northern 2.42 8 40.6% 4 $2,167,307 12
10 Massachusetts 3.63 14 32.4% 7 $4,174,815 10
11 California Northern 2.72 12 23.9% 14 $8,300,746 6
12 Minnesota 2.66 10 29.8% 11 $1,623,834 13
13 New York Southern 2.95 13 30.0% 10 $3,337,908 11
14 Florida Southern 2.50 9 26.3% 12 $374,435 14
15 Illinois Northern 3.67 15 24.8% 13 $5,890,039 8
Overall (all decisions identified) 2.35 32.4% $5,463,992
Median damages are adjusted for inflation and represented in 2012 US dollars. The rankings for these courts are based on their relative ranking for each of the three statistical measures.
Certain federal district courts are more favorable to patent holders
Certain jurisdictions (particularly Virginia Eastern, Delaware, and Texas Eastern) continue to be more favorable venues for patent holders, with shorter time-to-trial, higher success rates, and greater median damages awards. Chart
8 presents the top 15 districts based on an average of their categorical rankings for each of the three statistical measures. The overall ranking for district courts varies slightly from last year’s 2012 Patent Litigation Study, with New Jersey and Massachusetts moving up several positions.

24 PwC 2013 Patent Litigation Study
Federal district courts with most NPE cases
Chart 9a
District
Decisions involving NPEs
Total identified decisions
NPE % of total decisions
NPE success rate
Texas Eastern 45 120 37.5% 46.7%
Illinois Northern 32 133 24.1% 12.5%
New York Southern 28 120 23.3% 14.3%
California Northern 21 134 15.7% 19.0%
Delaware 17 179 9.5% 41.2%
California Central 15 79 19.0% 33.3%
Florida Southern 13 38 34.2% 15.4%
Massachusetts 13 71 18.3% 38.5%
Minnesota 10 47 21.3% 40.0%
Pennsylvania Eastern 10 35 28.6% 20.0%
Texas Southern 10 46 21.7% 10.0%
DC 9 22 40.9% 0.0%
US Court of Federal Claims 8 20 40.0% 12.5%
Virginia Eastern 8 46 17.4% 25.0%
Florida Middle 7 35 20.0% 57.1%
Pennsylvania Western 7 18 38.9% 57.1%
Texas Northern 7 32 21.9% 42.9%
Colorado 6 22 27.3% 33.3%
Maryland 6 17 35.3% 0.0%
Michigan Eastern 6 37 16.2% 0.0%
New Jersey 6 83 7.2% 16.7%
All Identified Decisions 370 1,856 19.9% 24.3%
New Jersey District Court 6 83 7.2% 16.7%
Includes districts with more than 5 identified decisions involving an NPE as the patent holder.
Chart 9a. District courts with most identifed decisions with NPE as patent holder: 1995–2012
Of NPE decisions, 39% were concentrated in five federal district courts
Cases with NPEs as patent holders were concentrated in a relatively smaller number of key districts: the top five districts (out of the total 94) with the most identified decisions
accounted for 39% of all identified NPE cases and the top ten districts accounted for 55%. Of particular interest is that the two districts with the most identified NPE decisions, Illinois Northern and Texas Eastern, continue to present a dichotomy in relative NPE success rates. Texas Eastern ranks third highest (46.7%),
whereas Illinois Northern ranks sixteenth (12.5%) in terms of overall NPE success rates. Meanwhile, Delaware, which has the lowest percentage of identified decisions where the patent holder is an NPE, has an overall NPE success rate of 38.9%, which is among the highest and well above the overall average.

PwC 25 2013 Patent Litigation Study
Practicing entities and NPEs by the numbers
Chart 9b
Chart 9b. Key statistics for practicing and nonpracticing entities: 1995–2012
Median time- to-trial (in years)
Overall success rate
Median damages awarded
Nonpracticing Entity 2.55 24.3% $8,885,947
Practicing Entity 2.30 34.5% $5,354,968
Practicing Entity 2.30 34.5% $5,354,968
Median damages are adjusted for inflation and represented in 2012 US dollars.
Chart 9b reflects a summary of critical patent litigation statistics for practicing entities and NPEs. In the current and prior year, the median damage award for NPEs was significantly higher than
that for practicing entities, while practicing entities enjoyed higher success rates and slightly shorter median time-to-trial.
With the escalating costs of U.S. patent
litigation, the need to employ alternative
dispute resolution is ever more pressing,
especially in the case of foreign litigants
who are likely to be less accustomed
to the fees and costs of full blown U.S.
litigation. The ADR opportunities
provided under local rules, such as those
of the Northern District of California,
should be taken seriously. Courts lacking
such rules may even be persuaded to
“borrow” them in the sound exercise of
their docket management discretion.
Effective use of such ADR procedures
requires thorough early case preparation,
potentially including the use of experts.
—Richard Gray (Jenner & Block LLP)

26 PwC 2013 Patent Litigation Study
$0
$2
$4
$6
$8
$10
$12
Med
ian
dam
ages
aw
ard
ed (i
n M
M)
Com
pany
Uni
vers
ity &
non
-pro
fit
Indi
vidu
al
Median damages are adjusted for inflation and represented in 2012 US dollars.
The number of cases is indicated within the respective column.
29945
$11.2
$10.0
$3.2
NPEs see variety in median damages and success rates
Chart 10a
Individual NPEs experience lower success rates
Chart 10b
0%
5%
10%
15%
20%
25%
30%
35%
40%
45%
50%
33/1
86
9/20
48/1
63
Com
pany
Uni
vers
ity &
non
-pro
fit
Indi
vidu
al
The number of cases is indicated within the respective column.
29%
45%
18%
Chart 10a. Patent holder median damages awarded by NPE type: 1995–2012
Chart 10b. Patent holder success rates by NPE type: 1995–2012
Median damages awards and success rates vary significantly among NPEs
Charts 10a through 10c represent an analysis of NPE litigation by NPE type: (1) companies/for-profit organizations, (2) universities/ non-profit organizations, and (3) individuals/inventors.
Chart 10a illustrates that the median damages award for NPEs that are companies/for-profit organizations is only slightly higher than that for university/non-profit, but significantly higher than that for individual NPEs. Notably, while damages for companies/for-profit organizations and individual/inventors remained relatively consistent with last year’s findings, the median damages award for NPEs that are universities/non-profit organizations increased significantly to $10.0 million from $1.5 million in last year’s study. This is a result of two major damages awards won by universities in 2012, relative to a smaller overall sample size of university/non-profit NPE cases.
While company NPEs are awarded higher damages, university/non-profit NPEs have by far the highest success rate among NPEs. Individual NPEs lag far behind, as shown in Chart 10b. Each reading was consistent with the calculations in last year’s study, with company and individual NPEs remaining relatively constant and university/ non-profit NPEs increasing to a 45% success rate.
PwC 27 2013 Patent Litigation Study
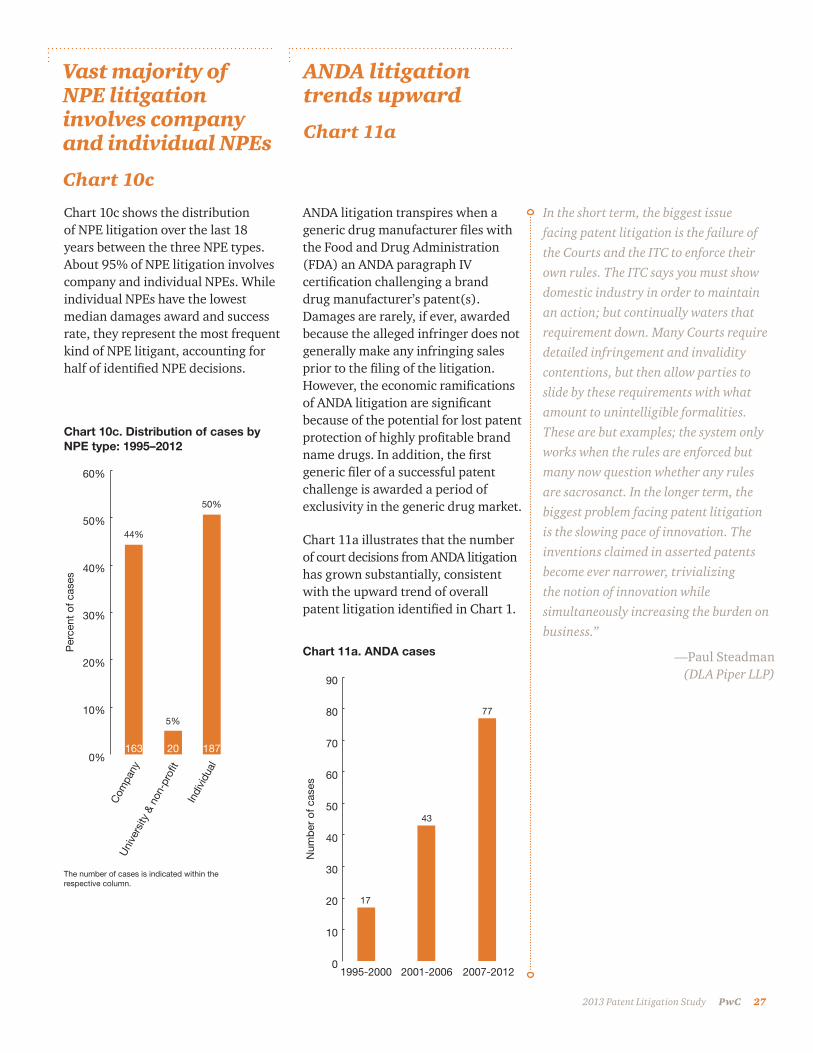
Vast majority of NPE litigation involves company and individual NPEs
Chart 10c
ANDA litigation trends upward
Chart 11a
0
10
20
30
40
50
60
70
80
90
1995-2000 2001-2006 2007-2012
Num
ber
of c
ases
17
43
77
0%
10%
20%
30%
40%
50%
60%
The number of cases is indicated within the respective column.
18720163
Per
cent
of c
ases
Com
pany
Uni
vers
ity &
non
-pro
fit
Indi
vidu
al
44%
5%
50%
Chart 11a. ANDA cases
Chart 10c. Distribution of cases by NPE type: 1995–2012
Chart 10c shows the distribution of NPE litigation over the last 18 years between the three NPE types. About 95% of NPE litigation involves company and individual NPEs. While individual NPEs have the lowest median damages award and success rate, they represent the most frequent kind of NPE litigant, accounting for half of identified NPE decisions.
ANDA litigation transpires when a generic drug manufacturer files with the Food and Drug Administration (FDA) an ANDA paragraph IV certification challenging a brand drug manufacturer’s patent(s). Damages are rarely, if ever, awarded because the alleged infringer does not generally make any infringing sales prior to the filing of the litigation. However, the economic ramifications of ANDA litigation are significant because of the potential for lost patent protection of highly profitable brand name drugs. In addition, the first generic filer of a successful patent challenge is awarded a period of exclusivity in the generic drug market.
Chart 11a illustrates that the number of court decisions from ANDA litigation has grown substantially, consistent with the upward trend of overall patent litigation identified in Chart 1.
In the short term, the biggest issue
facing patent litigation is the failure of
the Courts and the ITC to enforce their
own rules. The ITC says you must show
domestic industry in order to maintain
an action; but continually waters that
requirement down. Many Courts require
detailed infringement and invalidity
contentions, but then allow parties to
slide by these requirements with what
amount to unintelligible formalities.
These are but examples; the system only
works when the rules are enforced but
many now question whether any rules
are sacrosanct. In the longer term, the
biggest problem facing patent litigation
is the slowing pace of innovation. The
inventions claimed in asserted patents
become ever narrower, trivializing
the notion of innovation while
simultaneously increasing the burden on
business.”
—Paul Steadman (DLA Piper LLP)

28 PwC 2013 Patent Litigation Study
New Jersey and Delaware are favored ANDA districts
Chart 11b
Historical ANDA success rates have varied significantly
Chart 11c
Rank Top five districtsNumber of cases
1 Delaware 31
2 New Jersey 31
3 New York Southern 15
4 Illinois Northern 12
5 Florida Southern 6
Chart 11b. Top five districts with ANDA cases: 1995–2012
Chart 11c. ANDA success rates
0%
10%
20%
30%
40%
50%
60%
70%
80%
90%
2006 2007 2008 2009 2010 2011 2012
The total number of cases are indicated within the respective column.
83%
22%
50%
40%
56%
72%
50%
8 6 9 10 16 18 18
Chart 11b reflects the top five most active judicial districts for ANDA litigation. Given the concentration of pharmaceutical companies in the New York/New Jersey area, it is not surprising that a large number of ANDA cases are brought in those districts and in Delaware, where many companies are incorporated. These five districts comprise almost 70% of the ANDA cases during our study period.
Chart 11c reflects ANDA success rates, which we have defined here as the patent holder’s (the brand name drug manufacturer’s) success. Since 2006, ANDA litigation success rates have ranged from a low of 22% to a high of 83%. However, the sample size (the number of ANDA cases reaching a dispositive conclusion) in the earlier years was low, possibly explaining the wide swings in success rates. Because the majority of ANDA litigations continue to end in settlement, the adjudicated case sample size remains modest.
We are encouraged to see quality
improvements happening within the
U.S. patent community. A big reason for
this is that the courts are more regularly
sanctioning plaintiffs for filing suits
based on dubious patents that come about
due to limited pre-filing due diligence
or a motivation to land nuisance value
settlements. Further, NetApp became an
inaugural member of Unified Patents
because of its out-of-the-box thinking on
collaborative deterrence of these very same
dubious patents. We remain optimistic
that these trends will continue to help our
resource-constrained judicial system and
further improve the quality of our country’s
patent system.
—Douglas Luftman (Chief Intellectual Property
Counsel, NetApp, Inc.)
PwC 29 2013 Patent Litigation Study
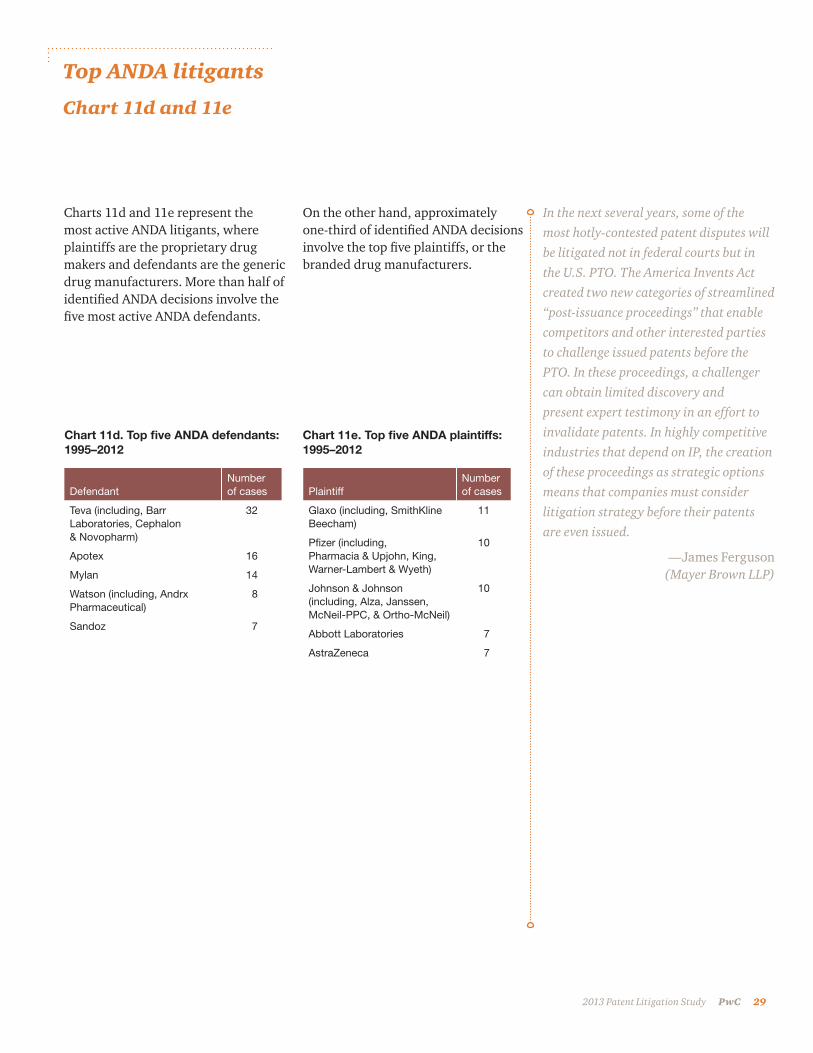
Top ANDA litigants
Chart 11d and 11e
Chart 11d. Top five ANDA defendants: 1995–2012
Chart 11e. Top five ANDA plaintiffs: 1995–2012
DefendantNumber of cases
Teva (including, Barr Laboratories, Cephalon & Novopharm)
32
Apotex 16
Mylan 14
Watson (including, Andrx Pharmaceutical)
8
Sandoz 7
PlaintiffNumber of cases
Glaxo (including, SmithKline Beecham)
11
Pfizer (including, Pharmacia & Upjohn, King, Warner-Lambert & Wyeth)
10
Johnson & Johnson (including, Alza, Janssen, McNeil-PPC, & Ortho-McNeil)
10
Abbott Laboratories 7
AstraZeneca 7
Charts 11d and 11e represent the most active ANDA litigants, where plaintiffs are the proprietary drug makers and defendants are the generic drug manufacturers. More than half of identified ANDA decisions involve the five most active ANDA defendants.
On the other hand, approximately one-third of identified ANDA decisions involve the top five plaintiffs, or the branded drug manufacturers.
In the next several years, some of the
most hotly-contested patent disputes will
be litigated not in federal courts but in
the U.S. PTO. The America Invents Act
created two new categories of streamlined
“post-issuance proceedings” that enable
competitors and other interested parties
to challenge issued patents before the
PTO. In these proceedings, a challenger
can obtain limited discovery and
present expert testimony in an effort to
invalidate patents. In highly competitive
industries that depend on IP, the creation
of these proceedings as strategic options
means that companies must consider
litigation strategy before their patents
are even issued.
—James Ferguson (Mayer Brown LLP)

30 PwC 2013 Patent Litigation Study
Statistics by judge
Chart 12a
We also captured information on the presiding judge in identified patent litigation disputes. This table represents statistics for the top 50 currently-active judges from 1995–2012. Overwhelmingly, the median damages awarded in cases presided
over by the top ten judges exceeds the overall median damages awarded from 1995−2012, possibly indicating that larger disputes tend to be handled by more experienced judges. However, the three $1 billion cases from 2012 were handled by judges with four or
fewer identified patent trial cases. Similarly, the time-to-trial for the top ten judges is also generally shorter than the overall median, which is also likely a result of increased experience in patent litigation matters.
RankJudge last name
Judge first name District court
Identified decision
Median damages
Success rate
Time-to-trial
% of decisions that are SJs
1 Robinson Sue Delaware 58 $21,237,057 37.9% 1.84 32.8%
2 Sleet Gregory Delaware 27 $31,651,000 55.6% 1.88 11.1%
3 Crabb Barbara Wisconsin Western 27 $2,521,951 33.3% 1.07 70.4%
4 Davis Leonard Texas Eastern 24 $17,811,922 58.3% 2.35 33.3%
5 Wilken Claudia California Northern 16 $9,532,839 37.5% 2.19 56.3%
6 Clark Ron Texas Eastern 13 $6,740,099 84.6% 1.74 7.7%
7 Illston Susan California Northern 13 $ – 0.0% 2.59 69.2%
8 Stark Leonard Delaware 11 $12,890,034 45.5% 2.12 63.6%
9 Huff Marilyn California Southern 10 $25,108,181 40.0% 2.39 60.0%
10 Alsup William California Northern 10 $18,807,241 10.0% 1.61 60.0%
11 Darrah John Illinois Northern 10 $9,989,639 10.0% 3.50 70.0%
12 Young William Massachusetts 10 $229,714 20.0% 1.72 60.0%
13 Cooper Mary New Jersey 10 $ – 30.0% 2.61 60.0%
14 Rakoff Jed New York Southern 9 $974,699 11.1% 1.05 77.8%
15 Cohn Avern Michigan Eastern 9 $821,426 44.4% 4.38 44.4%
16 Lungstrum John Kansas 9 $229,171 22.2% 2.51 44.4%
17 Thynge Mary Delaware 9 $34,327 11.1% 2.49 77.8%
18 Kendall Virginia Illinois Northern 9 $ – 11.1% – 88.9%
19 Whyte Ronald California Northern 9 $ – 0.0% 2.45 77.8%
20 Pfaelzer Mariana California Central 8 $163,329,629 12.5% 3.90 75.0%
21 Bucklo Elaine Illinois Northern 8 $114,002,318 50.0% 2.84 62.5%
22 Ellis, III Thomas Virginia Eastern 8 $52,938,680 37.5% 0.65 25.0%
23 Doty David Minnesota 8 $2,343,412 25.0% 2.35 75.0%
24 Montgomery Ann Minnesota 8 $163,607 37.5% – 75.0%
25 Chesler Stanley New Jersey 8 $ – 50.0% 3.62 62.5%

PwC 31 2013 Patent Litigation Study
RankJudge last name
Judge first name District court
Identified decision
Median damages
Success rate
Time-to-trial
% of decisions that are SJs
Continued
26 Smith Rebecca Virginia Eastern 8 $ – 25.0% 1.23 75.0%
27 McKinney Larry Indiana Southern 8 $10,520,507 0.0% – 87.5%
28 Carter David California Central 7 $9,602,263 14.3% 1.77 57.1%
29 Gorton Nathaniel Massachusetts 7 $7,562,745 71.4% 3.60 42.9%
30 Saris Patti Massachusetts 7 $58,437 14.3% 3.08 57.1%
31 Woodlock Douglas Massachusetts 7 $27,806 14.3% 3.52 85.7%
32 Ellison Keith Texas Southern 7 $ – 14.3% 2.86 85.7%
33 Cote Denise New York Southern 7 $ – 42.9% 1.50 71.4%
34 Guzman Ronald Illinois Northern 7 $354,375,187 14.3% 3.67 71.4%
35 Zagel James Illinois Northern 6 $34,980,345 66.7% 7.54 66.7%
36 Stein Sidney New York Southern 6 $27,934,776 50.0% 1.92 33.3%
37 Laporte Elizabeth California Northern 6 $24,789,872 16.7% 4.65 83.3%
38 Frank Donovan Minnesota 6 $15,643,206 33.3% 2.58 50.0%
39 Pisano Joel New Jersey 6 $3,878,407 83.3% 2.35 50.0%
40 Armstrong Saundra California Northern 6 $3,137,301 16.7% 2.53 66.7%
41 St. Eve Amy Illinois Northern 6 $2,905,098 16.7% 1.76 83.3%
42 Babcock Lewis Colorado 6 $2,546,190 50.0% 3.12 50.0%
43 Breyer Charles California Northern 6 $2,181,101 16.7% 1.47 50.0%
44 Stewart Ted Utah 6 $1,278,640 33.3% 5.35 83.3%
45 Gadola Paul Michigan Eastern 6 $963,258 33.3% 2.60 50.0%
46 Damich Edward US Court of Federal Claims 6 $942,550 16.7% – 66.7%
47 Atlas Nancy Texas Southern 6 $352,673 16.7% 1.91 66.7%
48 Barker Sarah Indiana Southern 6 $154,571 66.7% 3.34 16.7%
49 Antoon, II John Florida Middle 6 $ – 50.0% 4.12 50.0%
50 McMahon Colleen New York Southern 6 $ – 16.7% 5.02 83.3%
32 PwC 2013 Patent Litigation Study
Rank Judge last name Judge first name District court Identified SJ decisions Success rate at SJ
1 Crabb Barbara Wisconsin Western 19 10.5%
2 Robinson Sue Delaware 19 5.3%
3 Wilken Claudia California Northern 9 11.1%
4 Illston Susan California Northern 9 0.0%
5 Davis Leonard Texas Eastern 8 12.5%
6 Kendall Virginia Illinois Northern 8 12.5%
7 Stark Leonard Delaware 7 14.3%
8 Darrah John Illinois Northern 7 0.0%
9 McKinney Larry Indiana Southern 7 0.0%
10 Rakoff Jed New York Southern 7 0.0%
11 Thynge Mary Delaware 7 0.0%
12 Whyte Ronald California Northern 7 0.0%
13 Cooper Mary New Jersey 6 33.3%
14 Huff Marilyn California Southern 6 33.3%
15 Montgomery Ann Minnesota 6 16.7%
16 Young William Massachusetts 6 16.7%
17 Alsup William California Northern 6 0.0%
18 Doty David Minnesota 6 0.0%
19 Ellison Keith Texas Southern 6 0.0%
20 Pfaelzer Mariana California Central 6 0.0%
21 Smith Rebecca Virginia Eastern 6 0.0%
22 Woodlock Douglas Massachusetts 6 0.0%
23 Chesler Stanley New Jersey 5 40.0%
24 Bucklo Elaine Illinois Northern 5 20.0%
25 Cote Denise New York Southern 5 20.0%
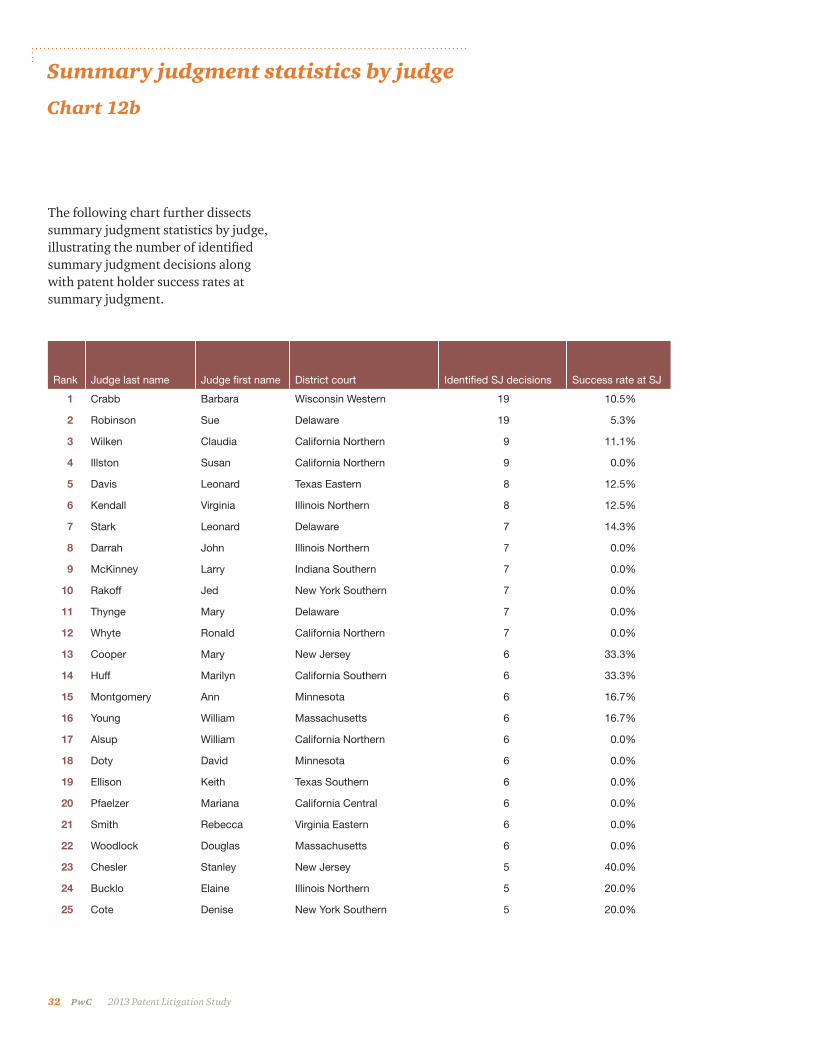
Summary judgment statistics by judge
Chart 12b
The following chart further dissects summary judgment statistics by judge, illustrating the number of identified summary judgment decisions along with patent holder success rates at summary judgment.

PwC 33 2013 Patent Litigation Study
Rank Judge last name Judge first name District court Identified SJ decisions Success rate at SJ
26 Guzman Ronald Illinois Northern 5 20.0%
27 Perry Catherine Missouri Eastern 5 20.0%
28 Stewart Ted Utah 5 20.0%
29 Collyer Rosemary DC 5 0.0%
30 Ericksen Joan Minnesota 5 0.0%
31 Kennelly Matthew Illinois Northern 5 0.0%
32 Laporte Elizabeth California Northern 5 0.0%
33 Lasker Morris Massachusetts 5 0.0%
34 McMahon Colleen New York Southern 5 0.0%
35 St. Eve Amy Illinois Northern 5 0.0%
36 Zagel James Illinois Northern 4 50.0%
37 Greenaway, Jr. Joseph New Jersey 4 25.0%
38 Lungstrum John Kansas 4 25.0%
39 Armstrong Saundra California Northern 4 0.0%
40 Arterton Janet Connecticut 4 0.0%
41 Atlas Nancy Texas Southern 4 0.0%
42 Carter David California Central 4 0.0%
43 Chatigny Robert Connecticut 4 0.0%
44 Cohn Avern Michigan Eastern 4 0.0%
45 Crocker Stephen Wisconsin Western 4 0.0%
46 Currie Cameron South Carolina 4 0.0%
47 Damich Edward US Court of Federal Claims 4 0.0%
48 Gonzalez Irma California Southern 4 0.0%
49 Hart William Illinois Northern 4 0.0%
50 McAuliffe Steven New Hampshire 4 0.0%
34 PwC 2013 Patent Litigation Study
Our methodology
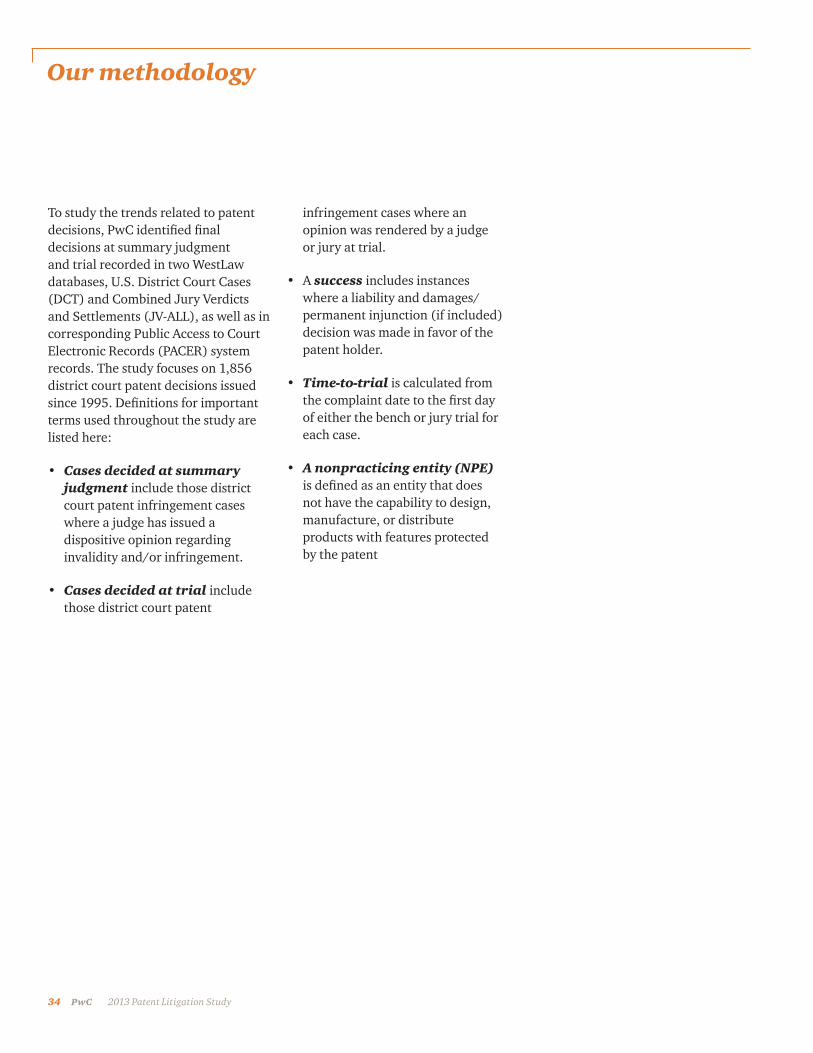
To study the trends related to patent decisions, PwC identified final decisions at summary judgment and trial recorded in two WestLaw databases, U.S. District Court Cases (DCT) and Combined Jury Verdicts and Settlements (JV-ALL), as well as in corresponding Public Access to Court Electronic Records (PACER) system records. The study focuses on 1,856 district court patent decisions issued since 1995. Definitions for important terms used throughout the study are listed here:
• Cases decided at summary judgment include those district court patent infringement cases where a judge has issued a dispositive opinion regarding invalidity and/or infringement.
• Cases decided at trial include those district court patent
infringement cases where an opinion was rendered by a judge or jury at trial.
• A success includes instances where a liability and damages/permanent injunction (if included) decision was made in favor of the patent holder.
• Time-to-trial is calculated from the complaint date to the first day of either the bench or jury trial for each case.
• A nonpracticing entity (NPE) is defined as an entity that does not have the capability to design, manufacture, or distribute products with features protected by the patent
PwC 35 2013 Patent Litigation Study
Our authors
Chris Barry has 29 years of experience in PwC’s Forensic Services practice. Mr. Barry has worked extensively in the intellectual property field, including damage quantification and testimony in infringement actions, determining reasonable royalty rates, valuing IP for transaction and financial reporting purposes, and performing royalty inspections for licensors with running rate agreements. Mr. Barry has testified at trial roughly 60 times as an expert witness. Mr. Barry is a CPA holding the AICPA credential of Certified in Financial Forensics. He earned a BA in accounting from Franklin & Marshall College and an MBA from the University of California at Berkeley.
Ronen Arad is a Director in PwC’s Forensic Services practice. Mr. Arad has been involved in many aspects of complex financial analyses and forensic assessments, both in the normal course of business and in the context of litigation. He has worked extensively in the intellectual property field, including quantifying damages in infringement and misappropriation actions, performing licensing inspections for licensors in a range of industries, and valuing intellectual property. Mr. Arad is a Chartered Financial Analyst (CFA) charter-holder and holds a BS degree in Commerce with concentrations in Finance and Accounting from the University of Virginia.
Landan Ansell is a Manager in PwC’s Forensic Services practice in Atlanta. He specializes in financial analysis and modeling for the valuation of economic damages for commercial disputes, as well as forensic accounting matters. Mr. Ansell has over six years of experience assisting clients in solving complex, crisis-related issues by providing litigation and investigation services, as well as financial and economic analysis, including the analysis of significant volumes of data and the development of comprehensive and user-friendly financial models. Mr. Ansell earned a BBA with a concentration in Accounting from Emory University and is a CPA.
Evan Clark is a Senior Associate in the Forensic Services practice in Atlanta. He specializes in financial modeling and analysis and focuses on the quantification of damages for business interruption claims. Mr. Clark earned a BBA with a concentration in Finance from Emory University.
Additionally, the following individuals contributed significantly to this study: Addis Workalemahu, Alexander E. Wagner, Amber Yang, Amy Lea, Chad Halbur, Heather Fugate, Holly Mills, HyeYun Lee, Jennifer Beaudoin, Katherine Hou, Matthew Hynes, Meena Chockalingam, Meredith Cartier, Nicholas Baccash, Paul Conboy, Paulina Boonman, Pichon Duplan, Sarah Stanley, Severin Ritchie, Sonia Mehta and Zhihua Wu.

www.pwc.com
© 2013 PricewaterhouseCoopers LLP, a Delaware limited liability partnership. All rights reserved. PwC refers to the US member firm, and may sometimes refer to the PwC network. Each member firm is a separate legal entity. Please see www.pwc.com/structure for further details.
This content is for general information purposes only, and should not be used as a substitute for consultation with professional advisors. PwC US helps organizations and individuals create the value they’re looking for. We’re a member of the PwC network of firms with 169,000 people in more than 158 countries. We’re committed to delivering quality in assurance, tax and advisory services. Tell us what matters to you and find out more by visiting us at www.pwc.com/us.
NY-13-0768
To have a deeper conversation about how this subject may affect your business, please contact:
Chris Barry(617) 530-6304christopher.c.barry@ us.pwc.com
Ronen Arad(678) [email protected]
Kristofer Swanson(312) [email protected]