2013 Oklahoma State University Combined Research and ...
298
2013 Oklahoma State University Combined Research and Extension Annual Report of Accomplishments and Results Status: New Not Yet Submitted I. Report Overview 1. Executive Summary The Division of Agriculture Sciences and Natural Resources (DASNR) at Oklahoma State University has an integrated approach to research and extension programs. Over the past years the Oklahoma Agricultural Experiment Station (OAES) and the Oklahoma Cooperative Extension Service (OCES) have developed multidisciplinary TEAMS of research and extension faculty members working on priority research and extension needs. The TEAMS are based on priorities identified by stakeholders, faculty and specialists. Our Planned Program areas as identified in our Plan of Work serve as overarching guides for the priority areas of research and extension. Each of the TEAM activities is thus covered within one of the Planned Program areas. Each of the faculty members and specialists remains administratively connected to a disciplinary department or geographic region unit. However, each also plans and conducts research and/or extension program efforts in close collaboration with other individuals within at least one multidisciplinary TEAM. Some significant research and/or extension efforts and developments during 2013 are presented following. Identifying molecular markers to predict heat stress in crops - Increase in global temperature, air pollutants such as ozone and the erratic rainfall regimes leading to extended drought pose significant threats to agricultural production not only in Oklahoma, but the entire world. The decrease in arable land compounded by the climate change issues has led to significant reductions in crop yields that will ultimately impact the cost of food, fuels and fodder. Understanding the molecular processes in plants that lead to this decrease in production will provide us with tools for tweaking those pathways and ensure sustainable production in the wake of climate change. OSU researchers have identified a suite of 16 genes that are induced in response to heat stress. These genes can serve as molecular markers to predict heat stress in crops and can help in estimating yield losses when high temperatures are in the forecast during a cropping season. Improving Water Quality through Poultry Waste Management Education- Since the mid-1990s water quality concerns related to elevated phosphorus (P) concentrations in northeastern Oklahoma watersheds (Eucha Spavinaw and Illinois River) have been the focus of regional and national attention, resulting in increased regulation and litigation. The 1998 Oklahoma Registered Poultry Feeding Operations and Poultry Waste Applicators Certification Acts required all poultry production operators and poultry waste applicators to complete an initial nine-hour series of Poultry Waste Management Education (PWME) sessions followed by annual continuing education. Responsibility for developing educational materials and providing the training required by the Acts was conferred to Oklahoma Cooperative Extension Service. In 2013, the PWME Program continued to provide the required training, addressing water quality concerns associated with improper or excessive land application of poultry litter. More than 500 people participated in the program during 2013. A recent study from researchers at the University of Arkansas highlights water quality improvements within the Illinois River watershed. Researchers examined in-stream P concentration data spanning from 1997 to 2009 within the Illinois River watershed. Results showed that flow-adjusted P concentrations have been decreasing since 2003 in the Illinois River at Arkansas Highway 59, at Watts, Oklahoma and further downstream at Tahlequah, Oklahoma. These decreases are tied at least in part to the reductions in waste water treatment effluent P. However, changes in agricultural management practices are also likely responsible for P reductions and include: exporting the majority of poultry litter outside nutrient sensitive watersheds, implementation of best management practices, strict regulations related to
Transcript of 2013 Oklahoma State University Combined Research and ...

2013 Oklahoma State University Combined Research and Extension Annual Report of Accomplishments and Results
Status: New
Not Yet Submitted
I. Report Overview
1. Executive Summary
The Division of Agriculture Sciences and Natural Resources (DASNR) at Oklahoma State University has an integrated approach to research and extension programs. Over the past years the Oklahoma Agricultural Experiment Station (OAES) and the Oklahoma Cooperative Extension Service (OCES) have developed multidisciplinary TEAMS of research and extension faculty members working on priority research and extension needs. The TEAMS are based on priorities identified by stakeholders, faculty and specialists. Our Planned Program areas as identified in our Plan of Work serve as overarching guides for the priority areas of research and extension. Each of the TEAM activities is thus covered within one of the Planned Program areas. Each of the faculty members and specialists remains administratively connected to a disciplinary department or geographic region unit. However, each also plans and conducts research and/or extension program efforts in close collaboration with other individuals within at least one multidisciplinary TEAM. Some significant research and/or extension efforts and developments during 2013 are presented following. Identifying molecular markers to predict heat stress in crops - Increase in global temperature, air pollutants such as ozone and the erratic rainfall regimes leading to extended drought pose significant threats to agricultural production not only in Oklahoma, but the entire world. The decrease in arable land compounded by the climate change issues has led to significant reductions in crop yields that will ultimately impact the cost of food, fuels and fodder. Understanding the molecular processes in plants that lead to this decrease in production will provide us with tools for tweaking those pathways and ensure sustainable production in the wake of climate change. OSU researchers have identified a suite of 16 genes that are induced in response to heat stress. These genes can serve as molecular markers to predict heat stress in crops and can help in estimating yield losses when high temperatures are in the forecast during a cropping season. Improving Water Quality through Poultry Waste Management Education- Since the mid-1990s water quality concerns related to elevated phosphorus (P) concentrations in northeastern Oklahoma watersheds (Eucha Spavinaw and Illinois River) have been the focus of regional and national attention, resulting in increased regulation and litigation. The 1998 Oklahoma Registered Poultry Feeding Operations and Poultry Waste Applicators Certification Acts required all poultry production operators and poultry waste applicators to complete an initial nine-hour series of Poultry Waste Management Education (PWME) sessions followed by annual continuing education. Responsibility for developing educational materials and providing the training required by the Acts was conferred to Oklahoma Cooperative Extension Service. In 2013, the PWME Program continued to provide the required training, addressing water quality concerns associated with improper or excessive land application of poultry litter. More than 500 people participated in the program during 2013. A recent study from researchers at the University of Arkansas highlights water quality improvements within the Illinois River watershed. Researchers examined in-stream P concentration data spanning from 1997 to 2009 within the Illinois River watershed. Results showed that flow-adjusted P concentrations have been decreasing since 2003 in the Illinois River at Arkansas Highway 59, at Watts, Oklahoma and further downstream at Tahlequah, Oklahoma. These decreases are tied at least in part to the reductions in waste water treatment effluent P. However, changes in agricultural management practices are also likely responsible for P reductions and include: exporting the majority of poultry litter outside nutrient sensitive watersheds, implementation of best management practices, strict regulations related to

land application of manure and mandatory manure management education for poultry producers and manure applicators. The PWME program continues to assist producers by providing outreach efforts addressing each of these practices. Restoring Land through Prescribed Fire Education and Associations- Eastern redcedar (Juniperus virginiana) is one of the most widely distributed trees in Oklahoma and surrounding states, and it has been encroaching in areas previously characterized by fire-dependent grassland and savanna. Eastern redcedar encroachment converts grasslands to shrublands, greatly reducing the value of the land for grazing and native wildlife habitat. Dense groves of eastern redcedar also threaten life and property as they represent a significant wildfire hazard. The current area covered by Eastern redcedar in Oklahoma is estimated beyond 4.5 million hectares and it is projected to be 6.3 million hectares by 2013. During 2012-2013 Oklahoma State University Extension personnel led a multi-state effort of 11 resource professionals to create a Prescribed Fire Community of Practice (CoP) within eXtension. This CoP was officially launched to the public in 2013. Currently there are 72 members who have contributed 58 FAQs and 59 articles related to prescribed fire. This CoP will serve as a clearing house of knowledge for prescribed fire and highlights the leadership that OSU-NREM provides in the fire ecology discipline. Much of the content on the CoP is from research generated at OSU. The site also provides a mechanism to advertise workshops and field days that OSU and our collaborators carry out. From our work with prescribed burn associations (PBA) we currently have 18 PBAs in Oklahoma representing 34 counties, with over 350 members managing over 1.1 million acres of land. Studying Wildlife Exposure to Aflatoxins through Supplemental Feeding- Upland game bird hunting is a multi-million dollar industry that is steeped in tradition. Arguably the most popular quarry is Northern Bobwhite (quail), but a long-term, idiopathic decline in populations across the species' range has eroded hunting opportunities for quail and raised concern for its long-term persistence. Habitat loss and fragmentation appears to play the most prominent role in the decline, but research suggests that other factors contribute as well, and land managers are interested in anything they can do to improve conditions for quail. One potential source of mortality for quail comes from poisoning via aflatoxins, a family of secondary metabolites produced by fungi in the genus Aspergillus. These fungi can grow on a wide variety of cereal grains and produce the deadly aflatoxins. The FDA regulates aflatoxin concentrations in foods destined for consumption by humans and livestock. There is, however, no standard for wildlife feed so grain sold as "bird seed" or "wildlife feed" can often far exceed the safety standards in place for humans and livestock, thereby exposing wildlife that consume those grains to aflatoxin poisoning. Oklahoma Agricultural Experiment Station researchers investigated a potential route of exposure to aflatoxin through a series of field trials in which camera traps were deployed at bait stations designed to attract deer. Baited solely with piled, whole corn, we found that quail used bait stations for deer in autumn and winter, with greater reliance on the supplemental food in winter. The primary aim of this work has been a laboratory investigation of the conditions that promote aflatoxin development on grain that has been supplied to wildlife. We considered grain type (whole corn or milo), temperature, moisture, duration of environmental exposure, and disposition (i.e., whether the grains are scattered or piled). Beginning with grains from which no aflatoxin could be detected, we found that aflatoxins developed on nearly all samples by the end of the 4-week trails. In some cases, aflatoxin concentrations far exceeded limits allowable for humans and livestock, as well as levels known to be detrimental to quail. Milo was much less likely to develop lethal concentrations of aflatoxin than was corn, and only when piled and wet did aflatoxin concentrations rise to dangerous levels on milo. From this research, we have identified themes that will be developed into best practices for wildlife feeding. Advanced Cow-Calf Boot Camp- Cow-Calf Boot Camps have been very well received by all producers who have participated over the last several years. Many of those producers asked for an "advanced" camp. A week-long Advanced Cow-Calf Boot Camp was made available to graduates of previous Cow-Calf Boot Camps. Forty-Five producers from four states attended the camp. The effectiveness and impact of the program was evaluated using pre- and post-tests along with an overall evaluation. Sixty-eight percent of the participants considered themselves part-time cattle producers, and

32% as full-time cattle producers. Participants rated the individual classes on a scale of 1 to 5. Six of the presentations were rated above 4.50: Soil Fertility, Forage College, Livestock Law, Introduction to Estate Laws, Advanced Reproductive Efficiency, and the Tour of the Haskell Research Station. When asked what the value of the workshop was to their operation the answers ranged from $5/head to $500/head, with an average of $64.94/head. One hundred percent of the participants plan to adopt one or more of the production practices discussed at the workshop. One hundred percent of the participants said they would recommend this class to other producers. Pre-test scores averaged 58% with a standard deviation of 17.2%. Post test scores averaged 70% with a standard deviation of 15.5%. The overall value of this program is best determined by using the producer's own estimation of the average value ($/head) gained from the workshop, the average number of cattle per participant and the total number of participants. By this estimation the value of the OSU Cow/Calf Camp was $223,182. Eastern redcedar as a cellulosic biomass feedstock- Production of fuels and chemicals by conversion of renewable cellulosic biomass is a viable strategy for reducing US petroleum imports, increasing energy security, and mitigating climate change by decreasing greenhouse gas emissions. Oklahoma is well-positioned to take a leading role in the biobased economy to meet part of the demand for cellulosic biofuels. OSU researchers developed biomass pretreatments for improving biomass properties for enzymatic hydrolysis. Redcedar is considered a noxious weed by many landowners due to its ability to spread quickly, replace grasslands, and present a major fire hazard. A sulfite pretreatment process using sodium bisulfite and sulfuric acid was found to be effective in pretreating redcedar for enzymatic hydrolysis. Processes to use Eastern redcedar to produce biofuels, such as the sulfite pretreatment and butanol conversion, will provide a venue to reduce redcedar infestation in Oklahoma and across grasslands in the Central Plains by converting redcedar into butanol. The projected economic impact of biorefineries using redcedar to local communities in Oklahoma would be over $1 billion per year. Over 400 direct jobs would be created by implementing the novel butanol production process using redcedar, which would provide 25% of the 1.26 billion gallons of jet fuel used by the Navy each year. The development of new conversion technologies and new products are expected to create spin-off companies and bring significant investment to Oklahoma and the U.S. Improving Producer Income through Value Enhancement Programs- Cattle sickness costs the industry millions of dollars each year. These losses negatively impact producer profitability and they impact each and every level of the beef production chain. In order to facilitate the adoption of best management practices that should result in reduced sickness and associated adverse effects, the Oklahoma Quality Beef Network (OQBN) was initially developed in 2001. The goal is to add value to Oklahoma's calf crop and empower cattle producers to capture at least part of the added value. One way in which that goal is achieved is through the development and verification of value added programs within OQBN. The OQBN Vac-45 program is the largest of its kind in the state of Oklahoma with over 100 producers verifying cattle with OQBN. New for 2013 was the development of OQBN Precon. Similar to the Vac-45 program but not replacing it, OQBN Precon allows producers to verify cattle that have been purchased from different ranches. It can be valuable to Oklahoma since over 3 million head of cattle are purchased as stocker cattle, about 1,000 hd have been enrolled in its first year. OQBN held 9 sales for its verified cattle in Oklahoma throughout 2013. Over 5,401 calves were enrolled representing over 98 producers an increase of over 46% from 2012, making 2013 the second largest year for enrollment of cattle since 2008. Final premiums for the 2013 OQBN VAC-45 program cattle over non weaned non verified cattle were 7.42$/cwt. The average price premium (on average for a 600 lbs calf) is 44.52$/hd. The added weight gain over the 45 day preconditioning period on average is 90 lbs. that added gain is worth 130.50$/hd with a value of gain at 1.45$/lbs for a gross increase in revenue of 175.02$/hd. If the cost of preconditioning is estimated at 79.45$/hd, net profit to producers is 95.57$/hd or $516,173 in net revenue total for all OQBN producers. Detecting biological contamination of foods and on surfaces used for food processing - While the need for a method that can detect biological contamination of foods and on surfaces used for food processing and its importance for food safety is well-understood, currently there is no rapid method available for such detection. OSU researchers demonstrated that laser-induced breakdown spectroscopy (LIBS) can be used to differentiate bacterial pathogens and antimicrobial-resistant bacterial pathogens from isogenic antimicrobial-susceptible strains, and to detect food pathogens on foods and food-
processing surfaces. The type (E. coli or S. enterica) of bacteria could also be differentiated in all cases studied along with the metabolic state (viable or heat killed). The main advantages of LIBS-based technology are the speed of analysis, minimal sample preparation, use of few consumables, and the ability to detect pathogens on all types of surfaces. This research provides data showing the potential of LIBS for the rapid identification of biological contaminants using spectra collected directly from foods and surfaces, and its future application in the food processing industry with a predicted outcome of a significant reduction in the instances of outbreaks of food-borne diseases. Continuing to Help Producers with Meat Goat Boot Camps - Meat goat production is an underserved agricultural enterprise regarding the availability of extension educational materials, decision tools, educational conferences and workshops. In contrast, the popularity of the meat goat enterprise as part of a multi-species grazing program, stand-alone livestock enterprise, or youth livestock project has grown tremendously over the past 20 years. To address these educational needs, a multi-disciplinary group of OCES professionals held the 2013 OSU Meat Goat Boot Camp. The boot camp is an intense 3-day workshop with 21 different sessions including hands-on demonstrations, case studies, lectures, and problem solving exercises. This program is unique in that it is the only one of its kind in the country. Fifty one producers from eight different states attended the Camp. The Boot Camp was the first exposure to an extension program for 75% of the participants. These producers represented 2,590 goats and an average herd size of 51. On a scale of 1-5, the average score across all 21 sessions was 4.39 which is exceptionally high compared to other extension programs offered by our group. Eighteen best management production practices were evaluated and participants indicated that based on knowledge gained in the Boot Camp, they intended to implement or refine many of the practices covered. In fact, participants valued the economic impact of the program at an average of $164 per goat, or a total impact of $425,000. These producers represent leaders or "change agents" in the goat industry in their regions of the country and therefore should have a much greater impact beyond their own inventory. Increasing Youth Knowledge and Understanding of STEM Technologies and Careers- The U.S. is falling dangerously behind other nations in developing its future workforce of scientists, engineers, and technology experts. Only 18% of US high school seniors are proficient in science (NAEP, 2005). Oklahoma 4-H is combating this issue by teaching youth about Science Technology, Engineering, and Math (STEM). Oklahoma 4-H STEM program is addressing this issue through STEM curriculum promotion, 4-H trainings in the area of STEM, and professional development of 4-H Educators. Oklahoma's main vehicle for educating youth about science, technology, engineering, and math has been the 4-H STEM Institute. For 2013, this program included, STEM Robotics and Geographic Information Systems. The STEM Institute was designed to train teams of youth and adult in the use and application of technology. These teams were then charged with the tasks of applying their technology specialty to a community service project or the development of a special project club. Once their project is established or complete the team was then expected to go teach other youth about their program and their technology. In 2013, Oklahoma 4-H hosted four statewide STEM conferences/ trainings for youth and adult volunteers; Stem Institute 1 and 2, 4-H Science Biotechnology Lab and the 4-H Forensics conference. Three professional development opportunities were taught to training county educators to teach STEM: 4-H STEM Community Action Teams a Revolution of Responsibility, Digital Media Training. SE District In-Service, Inquiry Based Teaching Methods and Student Centered approaches, and TechXcite for club and school enrichment. TechXcite is a recently developed Engineering curriculum that is designed for middle school aged students. OK4-H was fortunate to receive a sub-grant from Duke University to pilot these materials. One hundred and twenty eight educational kits have been distributed across the state. These kits are being used by educators to introduce youth to career fields in engineering and the engineering method in 52 locations across the state. Duke University specialists are currently collecting our evaluation data to determine the effectiveness if the TechXcite curriculum. Oklahoma 4-H has submitted over 1000 evaluations that will be analyzed this fall. STEM Geospatial projects are about teaching youth how to think spatially. This is done by training them in GPS/GIS. Once trained, the teams of youth and adults are expected to apply the GIS technology. Once trained our teams work locally to identify a community issue which can be addressed by this powerful technology. The Washita county 4-H team is working on a project to map the Illegal dumpsite around Cordell, Oklahoma. The Washington County 4-H Beef club is working on a GIS to identify areas

within their community in need of beautification through environmental conservation. The Oklahoma County Dove Science Academy 4-H is creating a GIS that is focusing on the emergency management of their community and how to locate them using GIS/GPS technology. The Creek County 4-H team is developing a community atlas that can be used to explore their county and the natural resources it has to offer. The STEM Robotics training is designed to help groups of youth and adults begin their own robotics clubs to teach engineering to participating youth. From the 2013 training four new clubs were started and the educational programs of four previously existing clubs were enhanced. These clubs are competing in Lego First Robotics competitions and educating other youth around their community about engineering through robotics. Increasing Knowledge and Awareness of Entomology- Entomology education has a vital impact on agriculture, human and animal health, and preservation of the environment. Over 300 extension presentations to nearly 300,000 people allowed the opportunity to observe, study, and directly interact with these animals can have a life-long impact on patrons including: 1) increasing awareness of the vital roles all animals play in the environment and ecological cycles on Earth, 2) breaking down irrational myths and fears commonly held regarding these animals, and 3) fostering feelings of environmental stewardship and personal responsibility that will make them better citizens and more caring people. Each year, many thousands of Oklahomans are educated on the truth and myths surrounding arthropods through the Insect Adventure program. Participants in the Insect Adventure experience a great reduction in fear regarding the important group of animals called arthropods. Adults and youth understand the value of insects and the broad impact of entomology on humans. Conversion of cellulosic biomass to biofuels and biobased chemicals -The US imported 40% of its liquid fuel consumption in 2012 and the import is projected to remain at 32% in 2040. Production of fuels and chemicals by conversion of renewable cellulosic biomass is a viable strategy for reducing US petroleum imports, increasing energy security, and mitigating climate change by decreasing greenhouse gas emissions. Cellulosic biofuel and biobased chemical production would enhance rural farm economies since conversion processes are likely to be located close to feedstock sources, and attract investment capital. However, challenges such as high capital costs and technological obstacles hinder the development of cellulosic biofuel and biobased chemical production. Syngas cleanup is considered one of the most cost prohibitive operations in using gasification based fuels and chemicals. Researchers showed that biochar, which is a byproduct of biomass gasification, effectively and simultaneously removes common syngas contaminants. The control methods developed for syngas fermentation represent a break-through characterization of the production mechanisms that underline the commercially deployed fermentation process, and can be implemented in industrial control systems for process operation. These methods can be used on an industrial scale to maintain high conversion of syngas components to alcohols, which also requires moderately skilled operators and potentially reduce capital and operating costs. Several companies have been attracted by these methods; potential research agreements are in negotiation. Helping Youth Increase their Knowledge of Natural Resources and the Environment- In his 2006 book Last Child in the Woods, Richard Louv tells of schools eliminating hands-on nature study from the curriculum in an effort to increase standardized test scores. Beyond the changes in school curriculum, the busy life of today's over-stretched and over-stressed parents allow little time for outdoor activities. A research study was begun to determine the economic impact of 4-H shooting sports events on the Oklahoma economy. Looking as a series of state-level events, participant families are asked to list the cost of travel, supplies, meals, etc. associated with participating in an event. While the majority of the youth involved in Shooting Sports are not likely to be involved in risky behaviors, some may be inclined to become involved in at risk behaviors if not involved in programs that encourage discipline and positive role models. The estimated cost to keep one juvenile delinquent housed in a correctional facility is close to $55,000 per year. In a survey of youth and families in Texas, the estimated cost for a youth to participate in 4-H shooting sports was about $4,320 a year. Ten training workshops were provided in Shooting Sports, Forestry, Wildlife, Range, Water, Homesite and Land

judging. Economic Impact Analysis was conducted for the four counties where 4-H State Shooting Sports Contests were held during 2013. Three economic activity measures indicate that 1 and 1.5 jobs were expanded or created, personal income to the residents within these four counties increased between $18,799 and $33,585, and resulting sales within these counties increased between $30,480 and $55,247. Using Economic Contribution Analysis for the 4-H Shooting Sports Program in the state of Oklahoma, it was determined that between 108 and 112 jobs were expanded or created, personal income to the residents of the state increased between $3.4 and $3.5 million, and resulting sales in the state increased between $5.7 and $5.8 million. Over 6,000 youth are enrolled in the Shooting Sports and nearly 1100 youth competed in one or more state-level shooting sports contest hosted during 2013. To participate in 4-H Shooting Sports youth are required to receive a minimum of 8 hours of instruction under the guidance of a certified shooting sports instructor before being allowed to compete in a shooting sports contest or event. Certified instructors teach the safe use of sporting arms, environmental ethics, and sportsmanship. In 2013, 82 new volunteers received certification in a shooting sports discipline. To receive certification an adult must successfully complete a minimum of 12 hours of training in a specific shooting sports discipline before being allowed to work with youth in clubs. Over 40 4-H youth earned the right to represent Oklahoma at national contests in Shooting Sport, WHEP and Forestry. The compound archery team placed 1st Overall while the shotgun team placed 5th Overall. Forty three percent of the youth who attended the WHEP contest were involved in service learning projects in their locale. Improving Turf Varieties for Sustainability and Recreation- Severe winter-kill plagued warm-season turfgrasses across the US transition zone in the late 1970s, early 1980s and again in 1990 and 2010. Proper management of the earlier selections of bermudagrasses could only provide limited protection against losses of bermudagrass to winter-kill and is financial impact when sports fields and golf courses required resodding or reseeding. Following particularly bad winters, sod production facilities would be hit by winter-kill and operators could not full take advantage of the opportunity to meet market demand for bermudagrass sod since their production fields were damaged and limited sod was available for harvest. Consequently, improved high quality seeded and vegetatively propagated turf-type bermudagrasses were needed to better resist the effects of harsh winters and less damage from severe winter-kill events. The Oklahoma State University Bermudagrass Development Team from 1986 to date has breed tens of thousands of lines of experimental bermudagrasses. These bermudagrasses have been screening in-depth in Oklahoma for improved winter-hardiness, seed set, establishment rate, pest resistance and overall quality. To date, we have commercialized and obtained proprietary protection on Yukon and Riviera seeded bermudagrasses as well as Patriot, Latitude 36 and NorthBridge vegetatively propagated bermudagrasses. Seed production licenses for large scale production were granted to one national firm each for Yukon and Riviera seeded bermudagrasses. These two seeded bermudagrass lines were adopted as standards in the 2013-2018 NTEP bermudagrass trial due to excellent performance and their first-class winter hardiness in seeded turf-type bermudagrass options. Sod producers are able to make at least a three to five cent per square foot premium on production of high quality winter-hardy bermudagrasses and to somewhat escape the "commodity-like" market place of variety-not-stated common bermudagrass sod production which keeps sale prices and grower profits reduced in the industry as a whole. In 2013, 6 and 7 new sublicensees of NorthBridge and Latitude 36 Turf bermudagrasses, respectively, were licensed by our representative, Sod Solutions LLC outside of Oklahoma. In 2013, the OSU generated bermudagrass Latitude 36 was installed on Washington Redskins FedEx Field, the Philadelphia Eagles Lincoln Financial Field and the Tennessee Titans LP Stadium while NorthBridge was installed on the playing surface at one Major Lead Baseball stadium and one NFL stadium. These installs show the high level of acceptance of the OSU bermudagrasses that demonstrated improved winter hardiness, visual quality and high levels of traffic tolerance. Replacement of winter-susceptible type bermudagrass will be a multi-year, on-going process. Decreasing winter-kill results in less weedy turf, since a dense cover of turfgrass results in less invasion by winter and summer annual weeds. Reductions in weed cover and percentage results in less use of herbicide for weed control as well as a resultant higher quality turfgrass surface earlier in the growing season. Based on NTEP trial research in 2010, approximately 20% less winter-kill of turfgrass area can be expected using winter-hardy turf bermudagrass varieties developed by Oklahoma State University. This can result in 15 to 20 % less fertilizer being used and a reduction in need for purchase of replacement seed or sod to repair damaged areas of turfgrass.

Community Nutrition Education Programs- In FY13, CNEP had a positive impact on the health and wellness of 3,351 low-income Oklahoma families. More than 98% of adult graduates demonstrate a positive change towards a healthy diet. In addition, 43% of graduates less often ran out of food by the end of the month and 25% report that their children ate breakfast more often. CNEP staff provided a total of 5,305 hours of nutrition information on healthy eating practices, food preparation and food safety to 22,714 qualifying Oklahoma youth during the 2013 fiscal year. The majority of enrolled youth (18,407) were taught through school enrichment programs; while 4,307 children received their nutrition education through short- term community-based programs. Based on a 2009 study, estimated potential health care savings associated with nutrition education programs similar to the CNEP were approximately $20 million due to increased prevention of nutrition-related chronic diseases and conditions. Improving Roadside Vegetation Management- An erosion resistant, aesthetically pleasing, low growing, low maintenance vegetation is required for the 240,000 acres of state department of transportation maintained right of way adjacent to concrete and asphalt roads in Oklahoma. For 27 years the Oklahoma State University Roadside Vegetation Management Team has been performing annual research and extension education aimed at development of Best Management Practices (BMP) as well as Integrated Pest Management Practices (IPM) for Oklahoma Department of Transportation vegetation management employees. The OSU RVM team annually trains over 700 ODOT employees in BMPs and IPM. Each employee has adopted at least one (and often several more) of the BMP and IPM techniques transferred through the 3 annual initial pesticide applicator certification schools, 3 annual herbicide sprayer calibration workshops and 15 annual continuing education workshops. There is no single practice or always a ridge set of practices to solve any given problem. ODOT uses an integrated vegetation selection, mowing and herbicide application program to manage the 240,000 acres of right of way. Each ODOT employee engaged in roadside management is using at the minimum at least one integrated practice. Adoption of BMPs and IPM techniques coupled with integration of the latest research results into product bid specifications followed by competitive bid process results annually in a savings of over $120,000 in ODOT roadside vegetation maintenance costs. Retail Trade and Economic Impact Analysis for Oklahoma Communities- Municipal governments rely heavily on sales tax collections for revenue, and retail sales contribute to local quality of life. Yet, many communities in OK lack the human capital necessary to track and identify new retail opportunities. Retail Trade Analysis continues to be a popular Extension program, providing nine communities with data useful to evaluating their retail development programs and creating new retail opportunities. One example of high impact results is that Tommy Kramer, Executive Director of the Durant Industrial Authority, requests the reports annually to identify and target new retail establishments for Durant, OK. Particular successes he has had involving this data was securing new, national retail chains like Hibbett Sports and Rue 21 clothing store to the city of Durant. Applications Engineers Assisting Small Manufacturers- Of the over 5,000 manufacturers in Oklahoma, approximately half are located in rural areas and are extremely important to their local economies. The loss or downsizing of even one of these wealth-generating small or mid-sized companies can have devastating consequences for the host and surrounding communities. These rural firms face particular difficulty in getting relevant and usable information and technical assistance that will keep them abreast of the rapid changes in manufacturing technology. To address the difficulties faced by our small rural manufacturers, the College of Engineering, Architecture and Technology and the Division of Agricultural Sciences and Natural Resources at Oklahoma State University work in partnership to provide technical assistance through the Applications Engineering program. Since 1997, Applications Engineers have been deployed in the state in as part of the Oklahoma Cooperative Extension Service to provide on-site engineering assistance. In order to receive engineering assistance the client must agree to a post-project impact assessment. This impact assessment is done using procedures developed by the National Institute for Standards and Technology for the Manufacturing Extension Partnership. The client is contacted some months after the completion of an activity and is asked a series of questions designed to assess the impact of the effort. The impact of this program is measured in several ways. One is the economic value of the service to

the company as reported by the client. Another measure is the number of jobs created or retained. Both impacts are measured by an independent survey of the client. In 2013, the Applications Engineers client projects resulted in increased sales of more than $47.9M, while retaining an additional $14.5M in sales that would have otherwise been lost. Further, the expertise provided by our engineers created cost savings of $6.8M, and avoided additional costs estimated at $4.5M. With 150 new jobs created and 140 jobs retained, our projects provided an additional $16.8M to the state's economy. Finally, assisted manufacturers invested over $20.7M in new plant facilities and equipment, for a total economic impact of $116.3M. Assisting Oklahoma Small Businesses Use E-commerce- Small businesses in rural areas tend to struggle to establish a market presence and compete in today's economy. During 2013, the Oklahoma State University e-commerce program provided training to 105 small businesses on how to plan, effectively set up, and promote their websites, which can help address these issues. Of the 2013 participants, ratings for all relevant e-commerce workshops were quite high. We offered 4 workshops geared to those business owners without websites, and our "Websites 101" class was attended by 40 different people. We held 2 workshops targeted towards individuals or small businesses that might want to consider selling online via an online storefront (Amazon, eBay, or Etsy) instead of building a site themselves. We also held 2 workshops focused on small business owners who already had a website, but were interested in making it more visible. These workshops on Search Engine Optimization proved to be quite popular. Response to each of these different workshops has been extremely positive. After the training, 92% of respondents planned on increasing their web efforts, and 93% indicated that they would be changing the way they marketed their website. These half-day, hands-on sessions are positively impacting rural businesses as evidenced by success stories of former attendees. These include those who used simple template-based software programs used in the workshops to set up their own websites (an example still in the works is Silk Coins based out of Tulsa), began selling online via an online storefront (such as Butterfly Boutique, who now sells on Etsy and is based in Seminole), or made successful changes to their own site (for example, www.davis-air.com in Lawton utilized many of the SEO examples we suggested to increase their visitors by 15%). Further, anecdotal evidence suggests that the improved advertising offered by a website can increase small business sales anywhere from 20% to over 200%. With average sales of $150,000 (which was the average displayed in a small business report by Mississippi State in 2007) this implies that the e-commerce program increased the revenue of small businesses in Oklahoma by between $2.1M and $21.0M during 2013. Improving Rural Health in Oklahoma Communities - Community Health Needs Assessment (CHNA), is required for all nonprofit hospitals by the Affordable Care Act of 2010. Penalties for non-compliance are assessed through the IRS. The process developed by Oklahoma Cooperative Extension Service (OCES) meets this requirement and also provides a forum for a discussion on health between the hospital and community. OCES, in conjunction with the Oklahoma Office of Rural Health, led 18 communities through a facilitation process focused on community-level health in 2013. The CHNA is a four-meeting process between the local hospital and a wide sampling of community members, and is typically completed in 2-4 months. Three different methods of gathering relevant information are used: (1) demographic, economic, and health indicator data from secondary sources; (2) a survey completed by local residents (available both in print and online); and (3) focus-group meetings of community members. The CHNA process was significantly streamlined in 2013 to meet the pressing time restrictions faced by many rural hospitals. A comprehensive report was also generated that summarized each CHNA product and meeting that took place, including a listing of priorities derived and implementation steps for each priority. The creation of this report (typically published to their website) further assists hospitals in documenting and sharing information derived from the process. A total of 18 communities completed their CHNA in 2013 yielding 83 staff papers completed. A total of 55 community meetings were held during the year, with 800 individual participants, specifically for the CHNA process. One notable relationship created in 2013 was with Mercy-affiliated hospitals. Six of Mercy's rural facilities completed their CHNA during the year. The CHNA process is offered at no cost to all facilities. Private-market vendors exist offering to meet the same needs, but their costs and products vary significantly some between $10,000 and $20,000. Other states (Kansas and Kentucky) with similar collaborations among state agencies and resources charge between $5,000 and $7,000 per

community. Therefore, if the average of $6,000 per community were applied, a total value of $108,000 could be assumed in 2013 alone. Success stories emerged after the process was completed in several communities that participated. This included a pilot weight loss institute in Cleveland and the creation of community-level committees in Idabel to dig deeper into the health priorities identified. Farm and Business Tax Institutes - Frequent changes in Federal and Oklahoma State Tax Laws create a need to keep tax preparers informed of the impact of the changes and how to best help their clients utilize the tax planning and management opportunities available in the current tax laws. These tax schools are designed to update tax preparers about new laws and regulations covering farm, non-farm business and individual taxpayer issues. This program has been conducted for the past 48 years. It has grown from a one-day seminar to its present form of two days per location for the fall Farm and Business Tax Institutes and the summer Tax Clinic. The combination of all the schools allows a preparer to get the full 40 hours of CPE/CLE as required by state. Topics covered range from presentation of new tax laws and their implications, agricultural issues, business issues, tax planning opportunities, professional ethics, retirement, and social security to name a few. Twelve two day sessions are conducted each year with two of these in the summer and ten in the fall and two one day special topics courses. Total 2012 attendance for the schools was approximately 1,950 tax preparers. Certified public accountants make up 46 percent of the attendance, 27 percent are tax preparers and bookkeepers, 10 percent are enrolled agents, 2 percent are attorneys, and the remaining 15 percent come from a variety of backgrounds. These tax preparers file roughly 80 percent of the farm returns for taxpayers in the state of Oklahoma. High quality, professional instruction is provided to make continuing education credit available for Certified Public Accountants, Enrolled Agents, and Tax Attorneys. Participants filed more than 37,000 Federal farm tax returns and 250,000 Federal non-farm tax returns as reported by the participants in the most recent program evaluations. A recently added question asked the participants to place a subjective value on the education received which they then use to assist their clients with tax planning advice to reduce Federal and Oklahoma income taxes, to increase return filing accuracy, to provide retirement planning assistance, and/or to educate their clients of important estate planning tools. The participants were asked specify a value per return they filed which averaged just slightly greater than $80.00 per return. Therefore using the number of participants willing to provide this information (roughly 25% of the participants) and the average number of returns completed by this group annually (250 returns) the value of the tax schools is over $10,000,000 for 2013. Continued Effort to Inform Dual-Purpose Wheat Producers of First Hollow Stem Research - Wheat fields utilized for livestock grazing during the fall/winter and then harvested for grain by early summer are termed "dual-purpose" wheat fields. Proper timing of livestock grazing termination at the ¼ inch First Hollow Stem (FHS) stage of growth is critical in avoiding large grain yield losses caused by overgrazing wheat pastures. Because grazing termination dates can vary greatly on a field-by-field basis due to planting date and the particular variety planted, FHS is the single best way for stocker cattle producers to determine exact times for grazing termination. Oklahoma has about 5.7 million acres of wheat planted annually, of which, about 2.5 million acres are utilized by farmers as "dual-purpose" wheat acres. Research indicates overgrazing wheat pasture by just one week can result in a decreased grain yield of up to 25% at harvest and mistiming grazing termination by two weeks will reduce the bushels of wheat at harvest by up to 60%! Given average yield, this equates into a 19 bu/ac loss. At current prices, this amounts to a $150 + per acre potential loss of income for "dual-purpose" wheat producers or a $380,000,000 potential annual loss for the state of Oklahoma. To help prevent these losses, we monitor first hollow stem, conduct in-service trainings, and hold grower workshops on methodology and benefits of scouting for first hollow stem. It is estimated that at least 80% of dual-purpose wheat producers in Oklahoma use first hollow stem as a criterion for removal of cattle from wheat pasture. First hollow stem was monitored at two locations (Stillwater and El Reno, OK) and data were distributed to extension educators and stakeholders via electronic newsletter. It is estimated that at least 80% of dual-purpose wheat producers follow these numbers and use them as a rule of thumb estimator for removal of cattle from wheat pasture. Even with a very conservative estimate of only 10% loss at harvest if not adhering to this research-based criterion, the annual savings to producers is easily over $100M.
Improving Fertilizer Decisions through Sensor-Based Technology - Current global nitrogen use efficiency for cereals production is estimated to be 33%. Environmental concerns and increasing fertilizer prices have necessitated improved precision in determining crop nitrogen requirements. Oklahoma State University has developed hand-held sensors and corresponding web-based decision aids that can be used to generate in-season nitrogen recommendations based on yield potential. This method is much more accurate than yield-goal-based systems in predicting high or low-yielding years where nitrogen fertilizer application rates should be adjusted accordingly. Sensor based nitrogen management presentations and demonstrations were given at 40 grower meetings with approximately 2,600 individuals in attendance in 2012. Two websites devoted nutrient management (nue.okstate.edu and npk.okstate.edu) were viewed approximately 19,500 times in 2012. In the fall of 2012 it is estimated that the N-Rich Strip and SBNRC was established on nearly 500,000 acres of Winter Wheat and Winter Canola. Recent research concluded that this technologies increases profit in winter crops by $10/ac resulting in a state wide impact of approximately $5 million. Additional to the success of the N-Rich strips is the commercialization of the smaller Hand Held GreenSeeker sensor. This sensor is sold at 10% of the cost ($495) of the larger unit historically used. The new Hand Held has been selling well in Oklahoma and across the United States. The Hand Held has also meet great support internationally. The adoption of this low cost sensor will greatly impact the state of Oklahoma as the implementation of the N-Rich Strip and Sensor Based Nitrogen Calculator which will ultimately the increase economic and environmental sustainability of winter wheat production in Oklahoma.
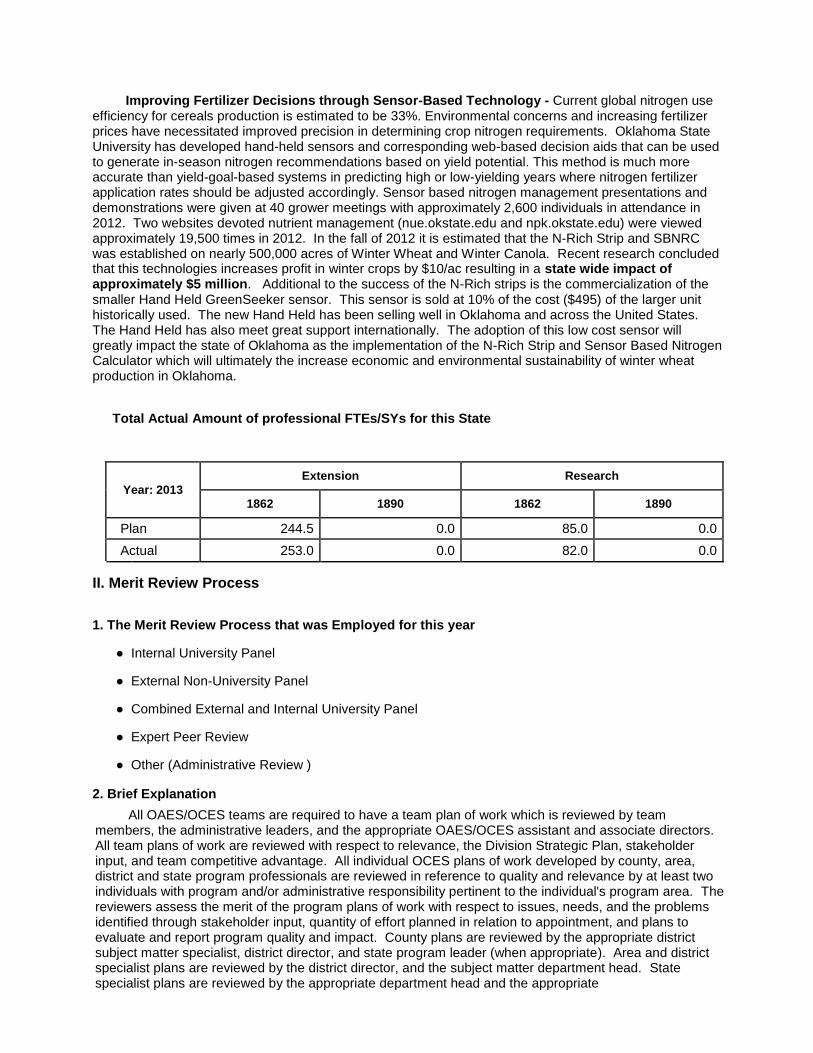
Total Actual Amount of professional FTEs/SYs for this State
Year: 2013 Extension Research
1862 1890 1862 1890
Plan 244.5 0.0 85.0 0.0
Actual 253.0 0.0 82.0 0.0
II. Merit Review Process
1. The Merit Review Process that was Employed for this year
● Internal University Panel
● External Non-University Panel
● Combined External and Internal University Panel
● Expert Peer Review
● Other (Administrative Review )
2. Brief Explanation
All OAES/OCES teams are required to have a team plan of work which is reviewed by team members, the administrative leaders, and the appropriate OAES/OCES assistant and associate directors. All team plans of work are reviewed with respect to relevance, the Division Strategic Plan, stakeholder input, and team competitive advantage. All individual OCES plans of work developed by county, area, district and state program professionals are reviewed in reference to quality and relevance by at least two individuals with program and/or administrative responsibility pertinent to the individual's program area. The reviewers assess the merit of the program plans of work with respect to issues, needs, and the problems identified through stakeholder input, quantity of effort planned in relation to appointment, and plans to evaluate and report program quality and impact. County plans are reviewed by the appropriate district subject matter specialist, district director, and state program leader (when appropriate). Area and district specialist plans are reviewed by the district director, and the subject matter department head. State specialist plans are reviewed by the appropriate department head and the appropriate
assistant director/state program leader.
III. Stakeholder Input
1. Actions taken to seek stakeholder input that encouraged their participation
● Use of media to announce public meetings and listening sessions
● Targeted invitation to traditional stakeholder groups
● Targeted invitation to non-traditional stakeholder groups
● Targeted invitation to traditional stakeholder individuals
● Targeted invitation to non-traditional stakeholder individuals
● Targeted invitation to selected individuals from general public
● Survey of traditional stakeholder groups
● Survey of traditional stakeholder individuals
● Other (Professional journals, meetings, etc.)
Brief explanation.
A broad array of actions was used to encourage stakeholder input. Personal invitation and public notice are regularly used in Extension Program Advisory Committees as well as when we seek input to experiment station projects. Most all statewide and unit advisory groups are notified through direct contact. Several programs have targeted nontraditional stakeholder participation including sustainable agriculture, agribiosecurity, water, wildlife, youth, human health, Spanish speaking audiences, Native American tribes, etc. Numerous Native American tribal leaders have been invited to state and district discussions. Farm commodity groups regularly are invited to campus and we attend most of their meetings in order to hear input. A few of our advisory groups are statuary in nature such as out Food and Agriculture Products Center advisory group.
2(A). A brief statement of the process that was used by the recipient institution to identify individuals and groups stakeholders and to collect input from them
1. Method to identify individuals and groups
● Use Advisory Committees
● Use Internal Focus Groups
● Use External Focus Groups
● Open Listening Sessions
● Needs Assessments
● Use Surveys
Brief explanation.
Every County CES office holds 2-4 program advisory meetings annually. OCES and OAES also meet with numerous boards, commissions, associations, public agencies, departmental advisory committees, special needs groups, consumers, school leaders, government officials, individuals, and, each year. See section 2(b) of this state report to get a partial list of groups providing input. During 2013, Oklahoma Cooperative Extension Service (OCES) develop three multicultural and community engagement strategies, 1) determine the needs for intercultural training by Extension personnel across the state of Oklahoma, 2) assess intercultural competence using the Intercultural Development Inventory (IDI), and 3) design tailor-made training programs according to the group level of intercultural competence. The first two strategies were concluded in 2013 (needs assessment and assessment of intercultural competence using the IDI). These two strategies were diagnostic strategies to design and deliver trainings for extension personnel according to their level

of intercultural competence. The third strategy, design and deliver intercultural competent training, will be developed by the office of Multicultural and Community Engagement during 2014. The needs assessment showed that OCES personnel are interested in attending intercultural training and developing their own intercultural competence to reach multicultural groups. The main objective of these trainings should be to develop OCES personnel's intercultural competence, defined as the ability to effectively work with people from other cultures, building an intercultural competent community (ICC) of educators who understand and accept cultural differences. The plan includes design face to face and online educational materials in a variety of delivering methods, workshops, and lectures, online via Adobe Connect or Desire to Learn. According to IDI assessment, the intercultural trainings should start reviewing and discussing cultural superiority or inferiority (right from wrong), and continue focusing on cultural differences and commonalities and the ways that those differences could be accepted and respected. Training shall respect county educators' cultural identity, and contribute to developing their required skills, attitudes, knowledge and values to respect a diverse society, contributing to the understanding and solidarity among people from different ethnicities, social, cultural, religious values, etc.
2(B). A brief statement of the process that was used by the recipient institution to identify individuals and groups who are stakeholders and to collect input from them
1. Methods for collecting Stakeholder Input
● Meeting with traditional Stakeholder groups
● Survey of traditional Stakeholder groups
● Meeting with traditional Stakeholder individuals
● Survey of traditional Stakeholder individuals
● Meeting with the general public (open meeting advertised to all)
● Survey of the general public
● Meeting specifically with non-traditional groups
● Survey specifically with non-traditional groups
● Meeting specifically with non-traditional individuals
● Meeting with invited selected individuals from the general public
● Other (Peer reviews, grant proposal reviews)
Brief explanation.
Following are some examples of stakeholder input - this list is in no way exhaustive. Representatives from OAES and/or OCES met with the following stakeholder groups. Division of Agricultural Sciences and Natural Resources Advisory Council (twice per year) Oklahoma Wheat Commission (ten times per year) Oklahoma Peanut Commission (twice per year) Oklahoma Sorghum Commission (twice per year) Oklahoma Wheat Growers Association Board (twice per year) Oklahoma Oilseed Commission Soil Fertility Research and Education Advisory Board (three times per year) Canola Advisory Board (twice per year) Oklahoma Grain and Feed Association

Oklahoma Seed Trade Association Oklahoma Genetics Inc. Board Oklahoma Cattleman's Association Oklahoma Home and Community Education Oklahoma Ag in the Classroom Advisory Committee (Quarterly) 4-H Shooting Sports Committee Land Judging Committee Oklahoma Farm Bureau 4-H Centennial Gardens Committee (twice per year) OK Youth Forestry and Wildlife Camp Committee (six times) Northeast Oklahoma Beekeepers Association USGA Advisory Committee Oklahoma Pecan Growers Association American Farmers and Ranchers Rural Health Works Committee Rural Health Works National Advisory Committee Stormwater Advisory Committee Tribal On-Site Waste Project Advisory Committee Integrated Environmental Research and Education Site Advisory Committee Oklahoma Sustainable Agriculture Research and Extension Advisory Committee Oklahoma Food and Agricultural Advisory Center Advisory Committee (twice per year) In all these settings we listen to the expressed problems, concerns, opportunities and situations faced by the various groups. This is in addition to the county PACs which were described earlier and result in over 1,000 people providing input at the local level. Likewise we periodically conduct surveys with respect to particular issues or groups of people.
3. A statement of how the input will be considered
● In the Budget Process
● To Identify Emerging Issues
● Redirect Extension Programs
● Redirect Research Programs
● In the Staff Hiring Process

● In the Action Plans
● To Set Priorities
● Other (In team planning and budget requests)
Brief explanation.
Input was used in decisions as to filling vacant positions in a difficult budget time. These decisions resulted in approval for filling the following positions an Area Animal Science Specialist, an Area Economics Specialist, a equine State Specialist, a Cropping State Specialist, Irrigation State Specialist, research faculty in Wildlife and Ecology Management, Medical Entomology, Animal Behavior, and Agricultural Finance. We continued to receive much input related to drought. 2013 showed some relief from two years of deep drought. However, we continued to target programming and educational materials to include drought related programs, herd replacement, forage options, feeding alternatives, cattle selection and culling, alternative crops, crop insurance, tax implication education, etc. Drought issues brought forward by PAC attendees included: · Rebuilding cowherds will be expensive · Pasture Renovation/weed control options following drought · Alternative crops · No-till cropping systems · Discovery/utilization of more drought tolerant forage base · Crop insurance programs and decisions · Proper stocking rates for post-drought recovery of pastures · Stocker programs for traditional cow-calf operations · Increased feed/hay cost · Use of CRP land · Risk management Other implications relating to water use and availability continued to be of high interest. These included irrigation, water quality, quantity, pond management, and water rights. Many also had concerns about passage of the next Farm Bill, the commodity programs and risk management programs that would be contained in the Farm Bill.
Brief Explanation of what you learned from your Stakeholders
Desire to see Farm Bill passage. Continued need for better risk management tools. Funding stability for Extension and Experimentation Stations particularly formula funds.
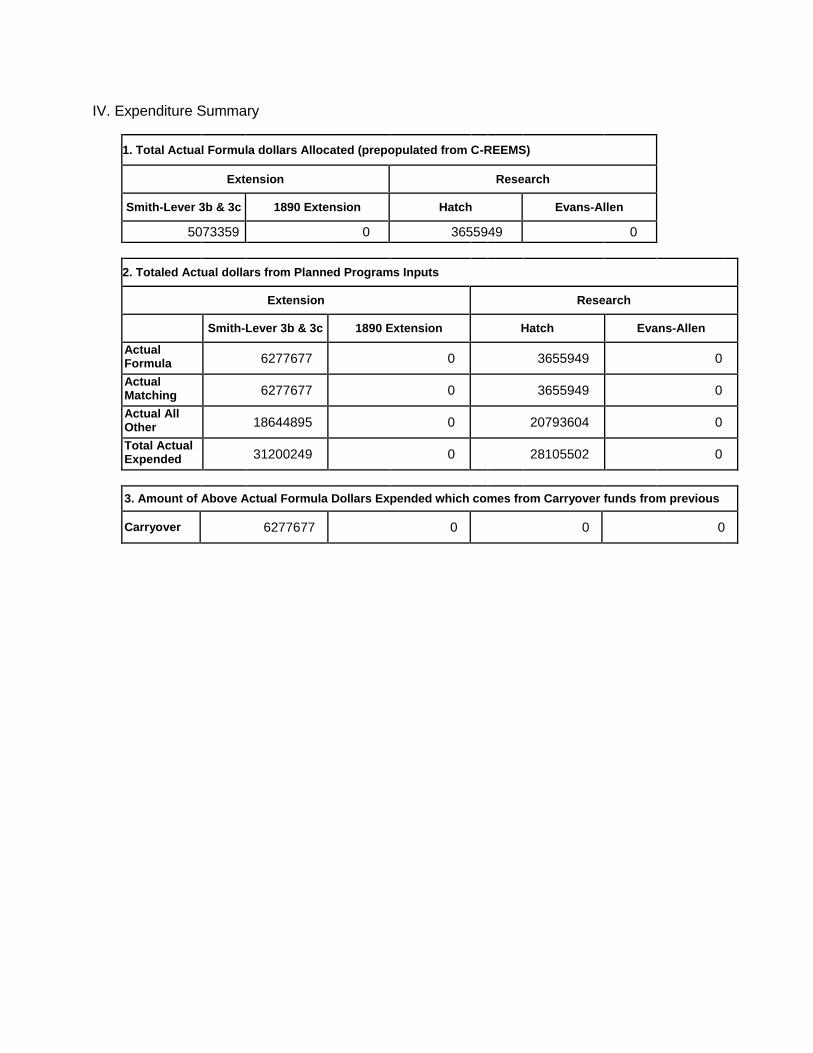
IV. Expenditure Summary
1. Total Actual Formula dollars Allocated (prepopulated from C-REEMS)
Extension Research
Smith-Lever 3b & 3c 1890 Extension Hatch Evans-Allen
5073359 0 3655949 0
2. Totaled Actual dollars from Planned Programs Inputs
Extension Research
Smith-Lever 3b & 3c 1890 Extension Hatch Evans-Allen
Actual Formula 6277677 0 3655949 0
Actual Matching 6277677 0 3655949 0
Actual All Other 18644895 0 20793604 0
Total Actual Expended 31200249 0 28105502 0
3. Amount of Above Actual Formula Dollars Expended which comes from Carryover funds from previous
Carryover 6277677 0 0 0

V. Planned Program Table of Content
S. No. PROGRAM NAME
1 Global Food Security and Hunger - Animal Enterprises
2 Global Food Security and Hunger - Crop Enterprises
3 Plant Biological Technologies
4 Commercial and Consumer Horticulture
5 Ecosystem and Environmental Quality and Management including Weather and Climate
6 Food Safety - Food Processing, Product Storage, and Food and Product Safety
7 4-H Youth Development
8 Turfgrass Development and Management
9 Community Resource and Economic Development
10 Integrated Pest Management
11 Food Safety - Agricultural Biosecurity
12 Global Food Security and Hunger - Farm and Agribusiness Systems Economics
13 Sustainable Energy - Bio-Based Products Development
14 Childhood Obesity - Hunger / Health / Risky Behaviors / Resilience Issue Teams
15 Structure and Function of Macromolecules
16 Sustainable Energy - Environmental Family and Youth Issues
17 Climate Change - Family and Youth Environmental and Safety Issues
18 Food Safety - Hunger, Health and Safety
19 Global Food Security and Hunger - Families and Youth

V(A). Planned Program (Summary)
Program # 1
1. Name of the Planned Program
Global Food Security and Hunger - Animal Enterprises
Reporting on this Program
V(B). Program Knowledge Area(s)
1. Program Knowledge Areas and Percentage
KA Code
Knowledge Area %1862 Extension
%1890 Extension
%1862 Research
%1890 Research
121 Management of Range Resources 5% 15%
205 Plant Management Systems 8% 0%
302 Nutrient Utilization in Animals 10% 20%
303 Genetic Improvement of Animals 8% 10%
304 Animal Genome 0% 10%
305 Animal Physiological Processes 5% 10%
306 Environmental Stress in Animals 12% 10%
307 Animal Management Systems 22% 10%
308 Improved Animal Products (Before Harvest)
10% 5%
311 Animal Diseases 10% 5%
315 Animal Welfare/Well-Being and Protection 10% 5%
Total 100% 100%
V(C). Planned Program (Inputs)
1. Actual amount of FTE/SYs expended this Program
Year: 2013 Extension Research
1862 1890 1862 1890
Plan 19.0 0.0 8.0 0.0
Actual Paid Professional 23.0 0.0 12.5 0.0
Actual Volunteer 2.6 0.0 0.0 0.0
2. Actual dollars expended in this Program (includes Carryover Funds from previous years)

Extension Research
Smith-Lever 3b & 3c 1890 Extension Hatch Evans-Allen
510000 0 554374 0
1862 Matching 1890 Matching 1862 Matching 1890 Matching
510000 0 554374 0
1862 All Other 1890 All Other 1862 All Other 1890 All Other
1720000 0 3150945 0
V(D). Planned Program (Activity)
1. Brief description of the Activity
Conducted fundamental and applied research Constructed research facilities Wrote extramural grant proposals Conducted workshops and other educational meetings and conferences Provided in-service training Provided one-on-one consultation Developed and maintained numerous newsletters, web sites, press releases, Sun Up programs, and other mass media resources
2. Brief description of the target audience
Managers, owners and employees of farms, ranches and agribusinesses, research scientists, extension personnel, beef cattle producers, meat goat producers, consumers, and policy makers.
3. How was eXtension used?
Active participation in the Horse CoP. In addition, we are working with the National Beef Cattle Evaluation Consortium extension team to cooperatively develop additional beef genetics extension materials so that a more uniform source of genetics materials is available across the US. As a part of these efforts, we are working to re-vamp and revitalize the genetics portion of the beef cattle CoP. We are currently developing new content with the goal of launching the new site in late 2014.
V(E). Planned Program (Outputs)
1. Standard output measures
2013 Direct Contacts
Adults Indirect Contacts
Adults Direct Contacts
Youth Indirect Contacts
Youth
Actual 152670 521830 11000 25000
2. Number of Patent Applications Submitted (Standard Research Output)

Patent Applications Submitted
Year: 2013
Actual: 0
Patents listed
3. Publications (Standard General Output Measure)
Number of Peer Reviewed Publications
2013 Extension Research Total
Actual 6 43 49
V(F). State Defined Outputs
Output Target
Output #1
Output Measure
● Number of educational meetings, conferences, in-service trainings held
Year Actual
2013 120
Output #2
Output Measure
● Number of fact sheets, proceedings publications, newsletters and other non-peer reviewed extension publications produced
Year Actual
2013 31
Output #3
Output Measure
● Number of Animal Enterprise television ?spots? or segments produced
Year Actual
2013 72
Output #4
Output Measure
● Number of web sites maintained
Year Actual
2013 4
V(G). State Defined Outcomes
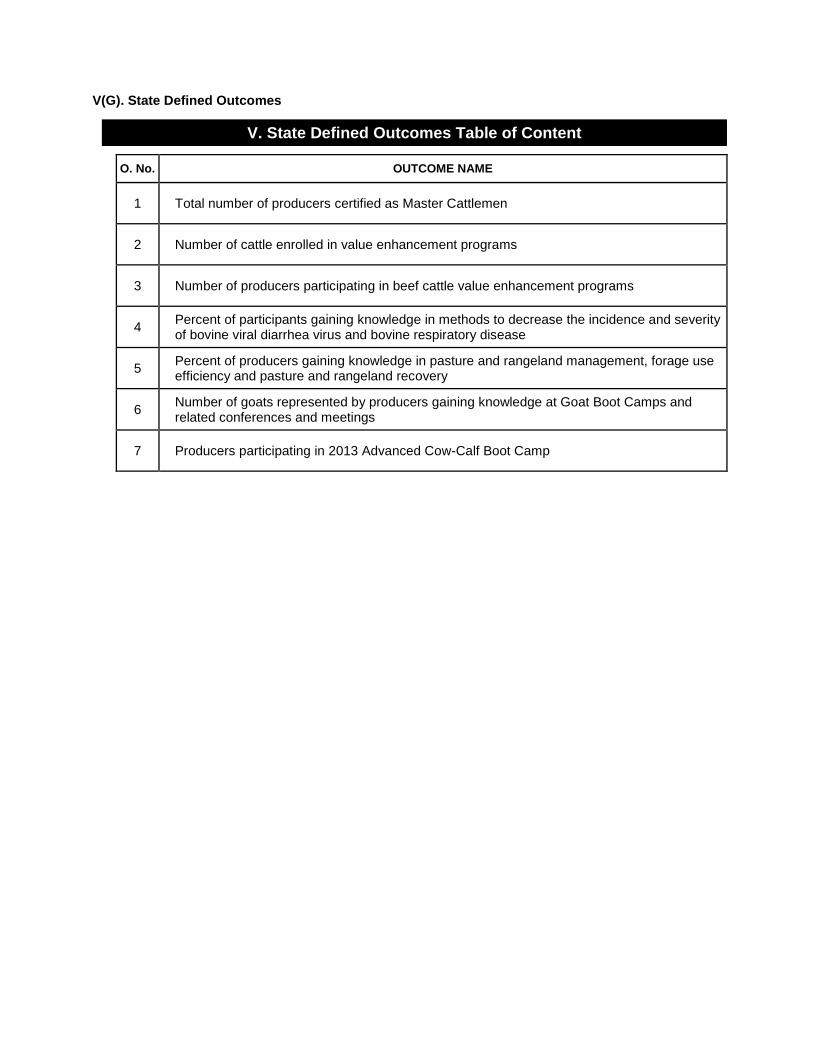
V. State Defined Outcomes Table of Content
O. No. OUTCOME NAME
1 Total number of producers certified as Master Cattlemen
2 Number of cattle enrolled in value enhancement programs
3 Number of producers participating in beef cattle value enhancement programs
4
Percent of participants gaining knowledge in methods to decrease the incidence and severity of bovine viral diarrhea virus and bovine respiratory disease
5
Percent of producers gaining knowledge in pasture and rangeland management, forage use efficiency and pasture and rangeland recovery
6
Number of goats represented by producers gaining knowledge at Goat Boot Camps and related conferences and meetings
7 Producers participating in 2013 Advanced Cow-Calf Boot Camp

Outcome #1
1. Outcome Measures
Total number of producers certified as Master Cattlemen
2. Associated Institution Types
● 1862 Extension
3a. Outcome Type:
Change in Action Outcome Measure
3b. Quantitative Outcome
Year
Actual
2013
55
3c. Qualitative Outcome or Impact Statement
Issue (Who cares and Why)
Beef production accounts for approximately one-third of Oklahoma?s agricultural production in most years. Moreover, seventy percent of the state?s 86,000 farms have some cattle and over fifty percent of the land area in Oklahoma is pasture or rangeland. Most of the cattle operations are small in size, with seventy-eight percent of the beef cow inventory in herds of fifty head or less. Smaller cattle operations have higher cost of production and are less likely to incorporate best management practices.
What has been done
The Master Cattleman Program is conducted by an interdisciplinary team resulting in a variety of educational products and programs, including the Beef Cattle Manual, benchmarking of cow/calf and stocker producer practices, Master Cattleman programs delivered at the local level and in-service training for Extension educators. An interdisciplinary Beef Cattle Manual was updated and published. The manual contains 41 chapters addressing various business, production, and natural resource topics. Approximately 117 manuals were distributed in 2013 and a total of about 9,500 have been distributed since program inception through local Extension offices, area and state meetings and from the Master Cattleman website. Requests have been filled to 25 states and 5 foreign countries. The manual is being used as a textbook in 8 universities and community colleges. To become a Master Cattleman, a producer completes twenty eight hours of instruction from the Beef Cattle Manual and associated quizzes.
Results
The program has enjoyed wide adoption in the state and it continues to be a popular staple in educational programming. Approximately 785 students have graduated with 55 having graduated during 2013. Currently, 62 students are enrolled from 17 Oklahoma Counties. Graduates average response to their estimate of annual improvement in their cattle operation?s profitability is $3,500 for a total annual impact of $2.5 million. On average, graduates indicate that they use the Beef Cattle Manual at least once monthly and that they have referred 5 additional people to the Beef Cattle Manual and three people to the Master Cattleman program.
4. Associated Knowledge Areas

KA Code
Knowledge Area
121
Management of Range Resources
302
Nutrient Utilization in Animals
303
Genetic Improvement of Animals
306
Environmental Stress in Animals
307
Animal Management Systems
315
Animal Welfare/Well-Being and Protection
Outcome #2
1. Outcome Measures
Number of cattle enrolled in value enhancement programs
2. Associated Institution Types
● 1862 Extension
3a. Outcome Type:
Change in Knowledge Outcome Measure
3b. Quantitative Outcome
Year
Actual
2013
5401
3c. Qualitative Outcome or Impact Statement
Issue (Who cares and Why)
Cattle sickness costs the industry millions of dollars each year. These losses negatively impact producer profitability and they impact each and every level of the beef production chain. In order to facilitate the adoption of best management practices that should result in reduced sickness and associated adverse effects, the Oklahoma Quality Beef Network (OQBN) was initially developed in 2001. The goal is to add value to Oklahoma's calf crop and empower cattle producers to capture at least part of the added value.
What has been done
One way in which that goal is achieved is through the development and verification of value added programs within OQBN. The OQBN Vac-45 program is the largest of its kind in the state of Oklahoma with over 100 producers verifying cattle with OQBN. New for 2013 was the development of OQBN Precon. Similar to the Vac-45 program but not replacing it, OQBN Precon allows producers to verify cattle that have been purchased from different ranches. It can be valuable to Oklahoma since over 3 million head of cattle are purchased as stocker cattle, about 1,000 hd have been enrolled in its first year.
Results
OQBN held 9 sales for its verified cattle in Oklahoma throughout 2013. Over 5,401 calves were enrolled representing over 98 producers an increase of over 46% from 2012, making 2013 the second largest year for enrollment of cattle since 2008. Final premiums for the 2013 OQBN VAC-45 program cattle over non weaned non verified cattle were 7.42$/cwt. The average price

premium (on average for a 600 lbs calf) is 44.52$/hd. The added weight gain over the 45 day preconditioning period on average is 90 lbs. that added gain is worth 130.50$/hd with a value of gain at 1.45$/lbs for a gross increase in revenue of 175.02$/hd. If the price of preconditioning is estimated at 79.45$/hd, net profit to producers is 95.57$/hd or $516,173 in net revenue total for all OQBN producers.
4. Associated Knowledge Areas
KA Code
Knowledge Area
307
Animal Management Systems
308
Improved Animal Products (Before Harvest)
311
Animal Diseases
315
Animal Welfare/Well-Being and Protection
Outcome #3
1. Outcome Measures
Number of producers participating in beef cattle value enhancement programs
2. Associated Institution Types
● 1862 Extension
3a. Outcome Type:
Change in Action Outcome Measure
3b. Quantitative Outcome
Year
Actual
2013
98
3c. Qualitative Outcome or Impact Statement
Issue (Who cares and Why)
What has been done
Results
4. Associated Knowledge Areas
KA Code
Knowledge Area
307
Animal Management Systems
308
Improved Animal Products (Before Harvest)
311
Animal Diseases
315
Animal Welfare/Well-Being and Protection

Outcome #4
1. Outcome Measures
Percent of participants gaining knowledge in methods to decrease the incidence and severity of bovine viral diarrhea virus and bovine respiratory disease
2. Associated Institution Types
● 1862 Extension
● 1862 Research
3a. Outcome Type:
Change in Knowledge Outcome Measure
3b. Quantitative Outcome
Year
Actual
2013
98
3c. Qualitative Outcome or Impact Statement
Issue (Who cares and Why)
Bovine respiratory disease is the most common disease among feedlot cattle in the United States, accounting for approximately 75 percent of feedlot morbidity and 50 percent to 70 percent of all feedlot deaths. BRD causes between $800 million to $900 million annually in economic losses from death, decreased performance, and antimicrobial treatment costs. Despite improved vaccines and antimicrobials, BRD rates have been increasing during recent years. Feedlot cattle that received 1, 2, or 3 treatments for BRD returned $40.64, $58.35, and $291.93 less, respectively, than untreated animals. A substantial portion (79%) of lost return is due to decreased carcass weight and lower quality grade rather than treatment costs. Immune response and morbidity issues relative to cattle growth and carcass quality affect every level of the beef industry, from the producer to the packer, all the way to the consumer as end-user. Few studies have documented the economic effect of BRD from incidence of the disease through harvest, and especially the impact of BRD on acceptability of the final product as determined by consumers.
What has been done
We observed the effects of segregation of commingled, newly received calves with a high risk of developing BRD into BRD-outcome groups (never treated vs. number of times treated) on feedlot performance and carcass characteristics when steers in outcome groups were fed to a similar body compositional endpoint. We also determined the effect of ancillary therapies for BRD on feedlot performance and carcass traits.
Results
As the number of antimicrobial treatments for BRD increases, average daily gain in the backgrounding phase decreases, cost-per-unit increases, and net returns decline. Days on feed needed to reach a common 12th rib fat thickness increased by 7 days for every increase in number of antimicrobial treatment required. Increased days on feed, lower final body weight and lower carcass value resulted in an $11.36 loss in income for every time an animal was treated. Decreasing the average number of times an animal is treated for BRD by one treatment would result in a nearly $9 million savings to Oklahoma feedlot cattle producers. In addition, marbling scores, color stability and overall acceptance of the final beef product by consumers decreases

as the number of antimicrobial treatments increases. No ancillary group differences existed for any of variables analyzed.
4. Associated Knowledge Areas
KA Code
Knowledge Area
305
Animal Physiological Processes
306
Environmental Stress in Animals
307
Animal Management Systems
311
Animal Diseases
315
Animal Welfare/Well-Being and Protection
Outcome #5
1. Outcome Measures
Percent of producers gaining knowledge in pasture and rangeland management, forage use efficiency and pasture and rangeland recovery
Not Reporting on this Outcome Measure
Outcome #6
1. Outcome Measures
Number of goats represented by producers gaining knowledge at Goat Boot Camps and related conferences and meetings
2. Associated Institution Types
● 1862 Extension
3a. Outcome Type:
Change in Knowledge Outcome Measure
3b. Quantitative Outcome
Year
Actual
2013
0
3c. Qualitative Outcome or Impact Statement
Issue (Who cares and Why)
Meat goat production is an underserved agricultural enterprise regarding the availability of extension educational materials, decision tools, educational conferences and workshops. In contrast, the popularity of the meat goat enterprise as part of a multi-species grazing program, stand-alone livestock enterprise, or youth livestock project has grown tremendously over the past 20 years.
What has been done
To address these educational needs, a multi-disciplinary group of OCES professionals held the 2013 OSU Meat Goat Boot Camp. The boot camp is an intense 3-day workshop with 21 different

sessions including hands-on demonstrations, case studies, lectures, and problem solving exercises. This program is unique in that it is the only one of its kind in the country. Fifty one producers from eight different states attended the Camp. The Boot Camp was the first exposure to an extension program for 75% of the participants. These producers represented 2,590 goats and an average herd size of 51.
Results
On a scale of 1-5, the average score across all 21 sessions was 4.39 which is exceptionally high compared to other extension programs offered by our group. Eighteen best management production practices were evaluated and participants indicated that based on knowledge gained in the Boot Camp, they intended to implement or refine many of the practices covered. In fact, participants valued the economic impact of the program at an average of $164 per goat, or a total impact of $425,000. These producers represent leaders or "change agents" in the goat industry in their regions of the country and therefore should have a much greater impact beyond their own inventory.
4. Associated Knowledge Areas
KA Code
Knowledge Area
121
Management of Range Resources
302
Nutrient Utilization in Animals
306
Environmental Stress in Animals
307
Animal Management Systems
308
Improved Animal Products (Before Harvest)
311
Animal Diseases
315
Animal Welfare/Well-Being and Protection
Outcome #7
1. Outcome Measures
Producers participating in 2013 Advanced Cow-Calf Boot Camp
2. Associated Institution Types
● 1862 Extension
3a. Outcome Type:
Change in Knowledge Outcome Measure
3b. Quantitative Outcome
Year
Actual
2013
0
3c. Qualitative Outcome or Impact Statement
Issue (Who cares and Why)
Cow-Calf Boot Camps have been very well received by all producers who have participated over the last several years. Many of those producers asked for an "advanced" camp.

What has been done
A week-long Advanced Cow-Calf Boot Camp was made available to graduates of previous Cow-Calf Boot Camps. Forty-Five producers from four states attended the camp.
Results
The effectiveness and impact of the program was evaluated using pre- and post-tests along with an overall evaluation. Sixty-eight percent of the participants considered themselves part-time cattle producers, which leaves 32% as full-time cattle producers. Eighty-four percent of the producers own less than 100 head of cows, with 45% owning between 10 to 50 cows. When asked to rate the individual classes on a scale of 1 to 5, the average score was 4.23. Six of the presentations were rated above 4.50: Soil Fertility, Forage College, Livestock Law, Introduction to Estate Laws, Advanced Reproductive Efficiency, and the Tour of the Haskell Research Station. When asked what the value of the workshop was to their operation the answers ranged from $5/head to $500/head, with an average of $64.94/head. One hundred percent of the participants plan to adopt 1 or more of the production practices discussed at the workshop. One hundred percent of the participants said they would recommend this class to other producers. One participant remarked that "All speakers were very informative and very good class." Pre-test scores averaged 58% with a standard deviation of 17.2%. Post test scores averaged 70% with a standard deviation of 15.5%. The overall value of this program is best determined by using the producer's own estimation of the average value ($/head) gained from the workshop, the average number of cattle per participant and the total number of participants. By this estimation the value of the OSU Cow/Calf Camp was $223,182.
4. Associated Knowledge Areas
KA Code
Knowledge Area
205
Plant Management Systems
302
Nutrient Utilization in Animals
303
Genetic Improvement of Animals
306
Environmental Stress in Animals
307
Animal Management Systems
308
Improved Animal Products (Before Harvest)
315
Animal Welfare/Well-Being and Protection
V(H). Planned Program (External Factors)
● Natural Disasters (drought, weather extremes, etc.)
● Economy
● Appropriations changes
● Public Policy changes
● Government Regulations
● Competing Public priorities
● Competing Programmatic Challenges
● Populations changes (immigration, new cultural groupings, etc.)
Brief Explanation
Latent effects of the 2010-2012 drought still plague the industry, demonstrations, and some research.
Additional drought conditions in the winter 2013-2014 will likely continue to cause problems.

V(I). Planned Program (Evaluation Studies)
Evaluation Results
See Qualitative Outcome or Impact Statements for Outcomes 1 and 2. These results are based on follow
up surveys with each of the respective group involved in the planned program.
The effectiveness and impact of the "Advanced Cow-Calf Boot Camp" (outcome 7) was evaluated using
pre- and post-tests along with an overall evaluation. Sixty-eight percent of the participants considered
themselves part-time cattle producers, which leaves 32% as full-time cattle producers. Eighty-four percent of the
producers own less than 100 head of cows, with 45% owning between 10 to 50 cows. When asked to rate the
individual classes on a scale of 1 to 5, the average score was 4.23. Six of the presentations were rated above
4.50: Soil Fertility, Forage College, Livestock Law, Introduction to Estate Laws, Advanced Reproductive
Efficiency, and the Tour of the Haskell Research Station. When asked what the value of the workshop was to
their operation the answers ranged from $5/head to $500/head, with an average of $64.94/head. One hundred
percent of the participants plan to adopt 1 or more of the production practices discussed at the workshop. One
hundred percent of the participants said they would recommend this class to other producers. One participant
remarked that "All speakers were very informative and very good class." Pre-test scores averaged 58% with a
standard deviation of 17.2%. Post test scores averaged 70% with a standard deviation of 15.5%. The overall
value of this program is best determined by using the producer's own estimation of the average value ($/head)
gained from the workshop, the average number of cattle per participant and the total number of participants. By
this estimation the value of the OSU Cow/Calf Camp was $223,182.
Key Items of Evaluation
OQBN Precon program helped producers get a net profit of $95.57 per head resulting in over $500,000 in
net profit for producers directly participating in the program. Other producers not directly studiied in the
program would also likely show a net profit for implementing similar suggested management.
In follow up evaluations with Master Cattleman Program, the 785 Master Cattleman graduates indicate that
the knowledge acquired and put into practice on their operations imporve their profitability by $3,500 on average
or a total annual impact of $2.5 million.

V(A). Planned Program (Summary)
Program # 2
1. Name of the Planned Program
Global Food Security and Hunger - Crop Enterprises
Reporting on this Program
V(B). Program Knowledge Area(s)
1. Program Knowledge Areas and Percentage
KA Code
Knowledge Area %1862 Extension
%1890 Extension
%1862 Research
%1890 Research
102 Soil, Plant, Water, Nutrient Relationships 20% 5%
133 Pollution Prevention and Mitigation 4% 5%
201 Plant Genome, Genetics, and Genetic Mechanisms
3% 20%
204 Plant Product Quality and Utility (Preharvest)
10% 10%
205 Plant Management Systems 30% 20%
211 Insects, Mites, and Other Arthropods Affecting Plants
8% 10%
212 Pathogens and Nematodes Affecting Plants
5% 10%
213 Weeds Affecting Plants 8% 5%
215 Biological Control of Pests Affecting Plants 4% 5%
216 Integrated Pest Management Systems 8% 10%
Total 100% 100%
V(C). Planned Program (Inputs)
1. Actual amount of FTE/SYs expended this Program
Year: 2013 Extension Research
1862 1890 1862 1890
Plan 18.0 0.0 11.0 0.0
Actual Paid Professional 19.0 0.0 12.1 0.0
Actual Volunteer 2.8 0.0 0.0 0.0
2. Actual dollars expended in this Program (includes Carryover Funds from previous years)

Extension Research
Smith-Lever 3b & 3c 1890 Extension Hatch Evans-Allen
510000 0 534876 0
1862 Matching 1890 Matching 1862 Matching 1890 Matching
510000 0 534876 0
1862 All Other 1890 All Other 1862 All Other 1890 All Other
1690000 0 3042553 0
V(D). Planned Program (Activity)
1. Brief description of the Activity
Wheat cultivar performance testing and demonstration throughout Oklahoma Wheat breeding, variety development, and introgression of new traits into elite germplasm Publication of web sites, web-based updates, video presentations, and printed extension materials that disseminate research findings and address current and emerging issues in Oklahoma agriculture Provide effective, non-classroom educational opportunities for industry professionals, Extension educators, farmers, and ranchers. Conduct on-farm research and demonstration of nitrogen rich strips and use of hand-held sensors Explore opportunities for market-based solutions to global climate change and evaluate potential for Oklahoma stakeholders to participate in these opportunities
2. Brief description of the target audience
Wheat growers, dual-purpose wheat producers, millers, bakers, wheat importers, seed growers and dealers, wheat breeders, crop producers, canola, peanut, sunflower and other crop producers and nutraceutical producers.
3. How was eXtension used?
Dr. Randy Boman is active in the Cotton CoP.
V(E). Planned Program (Outputs)
1. Standard output measures
2013 Direct Contacts
Adults Indirect Contacts
Adults Direct Contacts
Youth Indirect Contacts
Youth
Actual 42050 694800 802 1000
2. Number of Patent Applications Submitted (Standard Research Output)

Patent Applications Submitted
Year: 2013
Actual: 1
Patents listed
One PVP certificate for a wheat variety was submitted.
3. Publications (Standard General Output Measure)
Number of Peer Reviewed Publications
2013 Extension Research Total
Actual 27 19 46
V(F). State Defined Outputs
Output Target
Output #1
Output Measure
● Field Demonstrations, field days, and conferences
Year Actual
2013 70
Output #2
Output Measure
● Regionally adapted wheat cultivars
Year Actual
2013 1
Output #3
Output Measure
● Educational materials developed
Year Actual
2013 37
Output #4
Output Measure
● Web-based educational materials such as web sites, videos, and social media applications
Year Actual
2013 2

V(G). State Defined Outcomes
V. State Defined Outcomes Table of Content
O. No. OUTCOME NAME
1
Percentage of dual-purpose wheat acreage where first hollow stem criterion used for decision making
2
Number of wheat varieties released to address agronomic and end-use quality needs of hard red winter wheat industry
3 Locally-controlled evaluations and agronomic data for oilseed crops
4
Percentage of wheat acres sown to varieties with improved pest resistance, yield potential, and end-use quality.
5
Increase in knowledge and adoption rate of reduced tillage practices and crop rotation - acres effected
6
Number of crop acres where fertilization decisions include sensor-based fertilization information
7 Locally-controlled evaluations and agronomic data for small grains crops
8 Soil carbon sequestration assessment
9
Expansion of pedigreed seed production and capacity to increase wheat grain yield and end-use quality
10 Improving phosphorus use efficiency of cereal crops
11 Winter canola as a rotational crop for winter wheat
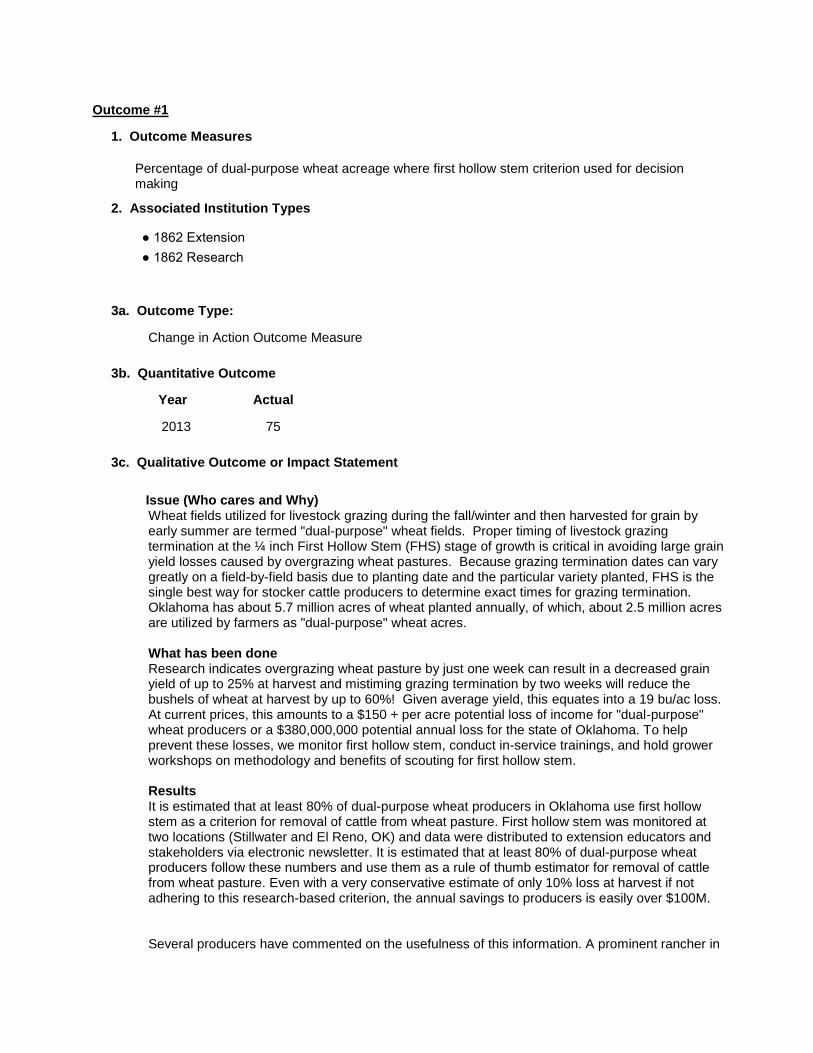
Outcome #1
1. Outcome Measures
Percentage of dual-purpose wheat acreage where first hollow stem criterion used for decision making
2. Associated Institution Types
● 1862 Extension
● 1862 Research
3a. Outcome Type:
Change in Action Outcome Measure
3b. Quantitative Outcome
Year
Actual
2013
75
3c. Qualitative Outcome or Impact Statement
Issue (Who cares and Why)
Wheat fields utilized for livestock grazing during the fall/winter and then harvested for grain by early summer are termed "dual-purpose" wheat fields. Proper timing of livestock grazing termination at the ¼ inch First Hollow Stem (FHS) stage of growth is critical in avoiding large grain yield losses caused by overgrazing wheat pastures. Because grazing termination dates can vary greatly on a field-by-field basis due to planting date and the particular variety planted, FHS is the single best way for stocker cattle producers to determine exact times for grazing termination. Oklahoma has about 5.7 million acres of wheat planted annually, of which, about 2.5 million acres are utilized by farmers as "dual-purpose" wheat acres.
What has been done
Research indicates overgrazing wheat pasture by just one week can result in a decreased grain yield of up to 25% at harvest and mistiming grazing termination by two weeks will reduce the bushels of wheat at harvest by up to 60%! Given average yield, this equates into a 19 bu/ac loss. At current prices, this amounts to a $150 + per acre potential loss of income for "dual-purpose" wheat producers or a $380,000,000 potential annual loss for the state of Oklahoma. To help prevent these losses, we monitor first hollow stem, conduct in-service trainings, and hold grower workshops on methodology and benefits of scouting for first hollow stem.
Results
It is estimated that at least 80% of dual-purpose wheat producers in Oklahoma use first hollow stem as a criterion for removal of cattle from wheat pasture. First hollow stem was monitored at two locations (Stillwater and El Reno, OK) and data were distributed to extension educators and stakeholders via electronic newsletter. It is estimated that at least 80% of dual-purpose wheat producers follow these numbers and use them as a rule of thumb estimator for removal of cattle from wheat pasture. Even with a very conservative estimate of only 10% loss at harvest if not adhering to this research-based criterion, the annual savings to producers is easily over $100M. Several producers have commented on the usefulness of this information. A prominent rancher in

southern Oklahoma, for example, commented "I appreciate you guys distributing the first hollow stem data from the El Reno site. It matches what I have been finding in my field and lets me know that I am making the right decision."
4. Associated Knowledge Areas
KA Code
Knowledge Area
205
Plant Management Systems
Outcome #2
1. Outcome Measures
Number of wheat varieties released to address agronomic and end-use quality needs of hard red winter wheat industry
2. Associated Institution Types
● 1862 Research
3a. Outcome Type:
Change in Condition Outcome Measure
3b. Quantitative Outcome
Year
Actual
2013
1
3c. Qualitative Outcome or Impact Statement
Issue (Who cares and Why)
Wheat and the associated grazing component are worth in excess of $1.5 billion annually to the Oklahoma economy. In the winter-wheat market, farmer profitability is yield-driven while end-user value is quality driven. While yield potential and end-use quality are not mutually exclusive traits, developing and marketing cultivars that satisfy both requirements is extremely difficult. The fact that there are relatively few scientists and even fewer private companies working in the area of wheat improvement exacerbates the problem.
What has been done
The Oklahoma State University Wheat Improvement Team was developed as a cross-cutting collection of scientists who work collaboratively to develop, test, and distribute improved wheat cultivars for the Southern Great Plains. As part of this effort over 900 individual crosses are made on a yearly basis. In addition approximately 45 cultivars are evaluated in replicated small grain performance trials at 24 sites throughout Oklahoma. Farmers are involved in both of the processes through advisory organizations and direct participation in research trials.
Results
The Oklahoma Agricultural Experiment station released the hard red winter wheat cultivar "Doublestop CL Plus" in 2013. This cultivar is tolerant to the imidazolinone family of herbicides and provides opportunity for wheat farmers to control feral rye and jointed goatgrass in-season. These are two of the most competitive weeds in wheat and are major contributors to foreign material and dockage in the southern Great Plains. Reduction of foreign material and dockage will

improve end-use quality of wheat coming from the region and should help reduce wheat price basis. Demand far exceeded supply the first year of release and Doublestop CL Plus was sown by farmers throughout the southern Great Plains.
4. Associated Knowledge Areas
KA Code
Knowledge Area
204
Plant Product Quality and Utility (Preharvest)
205
Plant Management Systems
Outcome #3
1. Outcome Measures
Locally-controlled evaluations and agronomic data for oilseed crops
Not Reporting on this Outcome Measure
Outcome #4
1. Outcome Measures
Percentage of wheat acres sown to varieties with improved pest resistance, yield potential, and end-use quality.
2. Associated Institution Types
● 1862 Extension
● 1862 Research
3a. Outcome Type:
Change in Condition Outcome Measure
3b. Quantitative Outcome
Year
Actual
2013
47
3c. Qualitative Outcome or Impact Statement
Issue (Who cares and Why)
In 2006 over half (54%) of all wheat acres were sown to the cultivar ?Jagger? or the Jagger-by-Abilene cross Jagalene. In addition, many newer wheat cultivars have offered increased yield as compared to Jagger and Jagalene, but have relied on Jagger resistance genes to fight the problematic foliar diseases leaf and stripe rust. Shifts in disease races over the past four years have made these genes largely ineffective, presenting an unnecessary production risk for farmers and grain merchandisers.
What has been done
Since 2006, the Oklahoma State University Wheat Improvement Team has developed and released ten wheat cultivars with disease resistance and agronomic performance superior to that of Jagger and Jagalene in targeted environments. In addition, our newest releases and advanced

experimental lines contain insect and disease resistance genes different from those in Jagger. A comprehensive educational campaign has made farmers and ranchers aware of improved cultivars released by land-grant institutions and private breeding companies in the region.
Results
In 2012 acreage of Jagger and Jagalene had fallen to 5% and 0%, respectively. Acreage of the disease and Hessian fly resistant cultivar 'Duster' increased from 0.3% of acreage in 2007 to 19.7% in 2013 and improved cultivars now occupy 47% of Oklahoma wheat acres (with the percentages of individual cultivars changing some from last year). Unfortunately, the disease resistance of Jagger-derived lines such as 'OK Bullet' and 'Fuller' are no longer highly effective at preventing foliar disease and future efforts will focus on displacing these varieties with superior genetics of newer lines such as 'Gallagher' and 'Iba'. Gallagher, for example, fits a similar production profile as Duster but offers increased yield potential, foliar disease resistance, and kernel size without sacrificing Hessian fly resistance, acid soil tolerance, or fall forage production for dual-purpose systems. In 2012 Gallagher offered a 5.9 bu/ac average yield advantage over Duster, indicating a potential increase in Oklahoma farm revenue of $53 million annually if we meet our target of replacing 1.2 million acres of Duster with Gallagher in the next five to seven years.
4. Associated Knowledge Areas
KA Code
Knowledge Area
204
Plant Product Quality and Utility (Preharvest)
205
Plant Management Systems
Outcome #5
1. Outcome Measures
Increase in knowledge and adoption rate of reduced tillage practices and crop rotation - acres effected
Not Reporting on this Outcome Measure
Outcome #6
1. Outcome Measures
Number of crop acres where fertilization decisions include sensor-based fertilization information
2. Associated Institution Types
● 1862 Extension
● 1862 Research
3a. Outcome Type:
Change in Condition Outcome Measure
3b. Quantitative Outcome
Year
Actual
2013
0

3c. Qualitative Outcome or Impact Statement
Issue (Who cares and Why)
Current global nitrogen use efficiency for cereals production is estimated to be 33%. Environmental concerns and increasing fertilizer prices have necessitated improved precision in determining crop nitrogen requirements.
What has been done
Oklahoma State University has developed hand-held sensors and corresponding web-based decision aids that can be used to generate in-season nitrogen recommendations based on yield potential. This method is much more accurate than yield-goal-based systems in predicting high or low-yielding years where nitrogen fertilizer application rates should be adjusted accordingly. Sensor based nitrogen management presentations and demonstrations were given at 40 grower meetings with approximately 2,600 individuals in attendance in 2012. Two websites devoted nutrient management (nue.okstate.edu and npk.okstate.edu) were viewed approximately 19,500 times in 2012.
Results
In the fall of 2012 it is estimated that the N-Rich Strip and SBNRC was established on nearly 500,000 acres of Winter Wheat and Winter Canola. Recent research concluded that this technologies increases profit in winter crops by $10/ac resulting in a state wide impact of approximately 5 million dollars. Additional to the success of the N-Rich strips is the commercialization of the smaller Hand Held GreenSeeker sensor. This sensor is sold at 10% of the cost (495$) of the larger unit historically used. The new Hand Held has been selling well in Oklahoma and across the United States. The Hand Held has also meet great support internationally. The adoption of this low cost sensor will greatly impact the state of Oklahoma as the implementation of the N-Rich Strip and Sensor Based Nitrogen Calculator which will ultimately the increase economic and environmental sustainability of winter wheat production in Oklahoma.
4. Associated Knowledge Areas
KA Code
Knowledge Area
102
Soil, Plant, Water, Nutrient Relationships
205
Plant Management Systems
Outcome #7
1. Outcome Measures
Locally-controlled evaluations and agronomic data for small grains crops
2. Associated Institution Types
● 1862 Extension
● 1862 Research
3a. Outcome Type:
Change in Condition Outcome Measure
3b. Quantitative Outcome
Year
Actual

2013
65
3c. Qualitative Outcome or Impact Statement
Issue (Who cares and Why)
Choosing the right cultivar is essential to ensuring economic profitability of any production system. Wheat yield data collected in 2010, for example, show that cultivar choice can easily increase gross income by more than $120 per acre and dramatically reduce pesticide use.
What has been done
The Oklahoma State University small grains variety testing program tests 25 to 45 released wheat cultivars and advanced experimental lines in replicated test plots at 25 to 30 sites throughout Oklahoma on an annual basis. The wheat multi-use team sows 40 to 45 additional non-replicated wheat variety demonstration tests at sites throughout Oklahoma. All but five of these sites are located on-farm and are conducted with the assistance of farmer-cooperators.
Results
Field day attendees typically represent over 1.7 million acres of wheat and report an average perceived value of the information received at field day events to be $21.46 per acre for a total impact of over $37 million annually. Wheat phenological data, forage yield, grain yield, test weight, and protein content data were collected and posted near real time on the Oklahoma small grains variety testing site at www.wheat.okstate.edu. This site received over 19,000 page views in 2013 and was reinforced with the @OSU_smallgrains Twitter feed which currently has over 550 followers. Hard copies of results were distributed to over 8,000 stakeholders in the state of Oklahoma via direct mailing and to over 600 producers via electronic copy. In-season recommendations and progress reports were provided by the World of Wheat blog at www.osuwheat.com which received over 19,000 views in 2013. Finally, Extension personnel and stakeholders were provided ?how to? guides on scouting and pest management via the OSU Small Grains YouTube feed which was viewed fro a total of 14,860 minutes in 2013.
4. Associated Knowledge Areas
KA Code
Knowledge Area
201
Plant Genome, Genetics, and Genetic Mechanisms
204
Plant Product Quality and Utility (Preharvest)
205
Plant Management Systems
Outcome #8
1. Outcome Measures
Soil carbon sequestration assessment
2. Associated Institution Types
● 1862 Extension
● 1862 Research

3a. Outcome Type:
Change in Condition Outcome Measure
3b. Quantitative Outcome
Year
Actual
2013
0
3c. Qualitative Outcome or Impact Statement
Issue (Who cares and Why)
What has been done
Efforts to quantify and demonstrate the capacity of Oklahoma soils to sequester carbon after no-till adoption, cropland conversion to permanent grass, or improvement of rangeland management have strengthened the Oklahoma Carbon Program. In 2013, a pilot project funded by a USDA Conservation Innovation Grant and Western Farmers Electric Cooperative was completed.
Results
During this project, carbon offset contracts were established on 86,936 acres resulting in approximately $134,000 being paid to Oklahoma producers for the sequestration of an estimated 37,721 Mtons of CO2. In addition, these conservation practices were estimated to have prevented 203,342 lbs of N, 39,381 lbs of P, and 10,651 tons of sediment from entering surface waters of Oklahoma. It can also be noted that approximately half of these load reductions resulted from the adoption of No-till crop management.
4. Associated Knowledge Areas
KA Code
Knowledge Area
102
Soil, Plant, Water, Nutrient Relationships
205
Plant Management Systems
Outcome #9
1. Outcome Measures
Expansion of pedigreed seed production and capacity to increase wheat grain yield and end-use quality
2. Associated Institution Types
● 1862 Extension
3a. Outcome Type:
Change in Knowledge Outcome Measure
3b. Quantitative Outcome
Year
Actual
2013
0

3c. Qualitative Outcome or Impact Statement
Issue (Who cares and Why)
Quality seed is the foundation for profitable and sustainable crop production. Unfortunately, most wheat acres in Oklahoma are seeded using farmer-saved seed with low purity and/or quality. In addition, farmer-saved seed is frequently contaminated with Italian ryegrass or other weed seed that ultimately reduce the marketability and end-use quality of Oklahoma wheat. Increasing the use of pedigreed seed would alleviate many of these issues and increase farmer access to improved genetics. Demand for certified seed has increased among farmers, but greater production capacity at all levels of the certification process (foundation, registered, and certified) is needed to ensure adequate supply.
What has been done
The Oklahoma Crop Improvement Association (OCIA), Oklahoma Foundation Seed Stocks (OFSS), private seed retailers, and Oklahoma Cooperative Extension have increased awareness regarding the importance of seed quality. Certified seed availability was increased using a three-pronged approach. First, a conscious effort was made to recruit new certified seed producers and to increase capacity of current certified seed producers. Second, release of new wheat varieties by the Oklahoma Agricultural Experiment Station was delayed by one year to increase seed availability the year of release. Finally, OCIA and OFSS increased capacity to ensure an adequate, steady supply of foundation and registered seed.
Results
Wheat acres sown to registered seed for sale as certified seed the following year more than doubled (23,452 vs. 50,319 acres) from 2003 to 2012 and the number of varieties available to choose from increased from 19 to 36. Production of breeder and foundation seed during this time period has increase accordingly to meet demand. For example, there were 344 bushels of foundation 'Duster' available in 2006, the year of its release. In contrast, there were 15,342 bushels of 'Doublestop CL Plus' available for planting (all classes of seed) when it was released in 2013. This means more bushels of improved varieties in more seedsmens' hands more quickly. Planting of certified seed by farmers and ranchers has increased as well. Over the past five years acres planted to certified seed of OSU-developed varieties has increased from 112,000 to 785,000, assuming a one bushel per acre seeding rate.
4. Associated Knowledge Areas
KA Code
Knowledge Area
201
Plant Genome, Genetics, and Genetic Mechanisms
205
Plant Management Systems
Outcome #10
1. Outcome Measures
Improving phosphorus use efficiency of cereal crops
2. Associated Institution Types
● 1862 Research

3a. Outcome Type:
Change in Knowledge Outcome Measure
3b. Quantitative Outcome
Year
Actual
2013
0
3c. Qualitative Outcome or Impact Statement
Issue (Who cares and Why)
Demand for phosphorus (P) is steadily rising and the P reserves relied on are decreasing in both quantity and quality. These reserves are predicted to reach near exhaustion within the next 46-60 years. In addition, global demand for cereal crops is estimated to increase 31% by 2030. To meet this demand it is imperative that resource efficiency, especially P-use efficiency, of all major crops be increased. Failing to do so could lead to the exploitation of marginal land and the resulting negative environmental and social consequences.
What has been done
We previously completed screening experiments for comparing P uptake efficiency and P utilization efficiency between different wheat accessions, in addition to distinguishing between the two types of P use efficiency. Later, studies were conducted for examining accession mechanisms in acid soils that increase P solubility in the rhizosphere, which contributes to P-uptake efficiency. Rhizo-cells were used to examine root excretions by high P uptake efficient plants, which were analyzed for organic acids, phosphatase, and changes in P forms and pH.
Results
Low molecular weight organic acids particularly oxalic and citric acid play important roles in P-uptake ability for the accessions screened. In addition to these organic acids, accessions that were able to maintain an acidic rhizosphere were better able to uptake typically recalcitrant forms of P; this may simply be a secondary effect of the excreted organic acids. This information will help breeders in developing more P-use efficient cultivars.
4. Associated Knowledge Areas
KA Code
Knowledge Area
102
Soil, Plant, Water, Nutrient Relationships
205
Plant Management Systems
Outcome #11
1. Outcome Measures
Winter canola as a rotational crop for winter wheat
2. Associated Institution Types

● 1862 Extension
● 1862 Research
3a. Outcome Type:
Change in Condition Outcome Measure
3b. Quantitative Outcome
Year
Actual
2013
0
3c. Qualitative Outcome or Impact Statement
Issue (Who cares and Why)
For many years the vast majority of Oklahoma cropland acres have been seeded to continuous winter wheat. For example, in Canadian County from 1998 to 2007, 87 percent of total crop acres were seeded to wheat. Continuous cropping of annuals contributes to the buildup of yield-constraining weeds, diseases, and insects. Economic returns are hampered by yield losses and by reductions in grain quality.
What has been done
The DASNR team working with a number of private companies and state and federal agencies, and Kansas State University, identified varieties and initiated variety trails; developed suggested management practices including seeding rates, fertilizer recommendations, weed, disease, and insect management; and herbicide, insecticide, and fungicide alternatives; and harvest, storage, and marketing strategies.
Results
Research has determined that a three year crop rotation that includes canola followed by two years of dual-purpose wheat has a high probability of generating greater net returns than continuous dual-purpose wheat and continuous grain-only wheat. This rotation is an economically viable alternative for managing weeds and diseases in wheat. Private industries have become engaged through buying and processing of harvested canola and developing and selling varieties. In 2009, for the first time, the Oklahoma Agricultural Statistics Service reported canola planted and harvested acres. Planted and harvested acreage has steadily increased since that time. In the fall of 2012, 205,000 Oklahoma acres were planted to canola and fall 2013 estimates were over 300,000 acres.
4. Associated Knowledge Areas
KA Code
Knowledge Area
102
Soil, Plant, Water, Nutrient Relationships
205
Plant Management Systems
212
Pathogens and Nematodes Affecting Plants
213
Weeds Affecting Plants
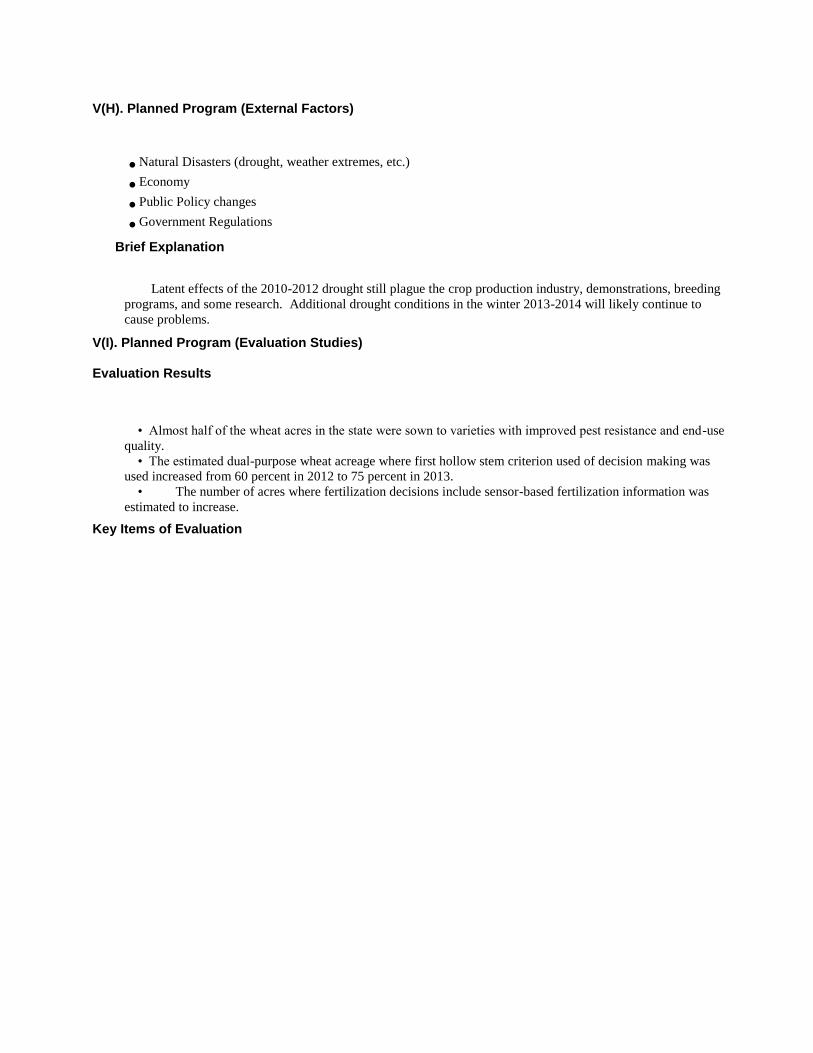
V(H). Planned Program (External Factors)
● Natural Disasters (drought, weather extremes, etc.)
● Economy
● Public Policy changes
● Government Regulations
Brief Explanation
Latent effects of the 2010-2012 drought still plague the crop production industry, demonstrations, breeding
programs, and some research. Additional drought conditions in the winter 2013-2014 will likely continue to
cause problems.
V(I). Planned Program (Evaluation Studies)
Evaluation Results
• Almost half of the wheat acres in the state were sown to varieties with improved pest resistance and end-use
quality.
• The estimated dual-purpose wheat acreage where first hollow stem criterion used of decision making was
used increased from 60 percent in 2012 to 75 percent in 2013.
• The number of acres where fertilization decisions include sensor-based fertilization information was
estimated to increase.
Key Items of Evaluation

V(A). Planned Program (Summary)
Program # 3
1. Name of the Planned Program
Plant Biological Technologies
Reporting on this Program
V(B). Program Knowledge Area(s)
1. Program Knowledge Areas and Percentage
KA Code
Knowledge Area %1862 Extension
%1890 Extension
%1862 Research
%1890 Research
123 Management and Sustainability of Forest Resources
0% 5%
132 Weather and Climate 0% 5%
201 Plant Genome, Genetics, and Genetic Mechanisms
0% 25%
203 Plant Biological Efficiency and Abiotic Stresses Affecting Plants
0% 13%
206 Basic Plant Biology 0% 14%
211 Insects, Mites, and Other Arthropods Affecting Plants
0% 5%
212 Pathogens and Nematodes Affecting Plants
0% 33%
Total 0% 100%
V(C). Planned Program (Inputs)
1. Actual amount of FTE/SYs expended this Program
Year: 2013 Extension Research
1862 1890 1862 1890
Plan 0.0 0.0 12.0 0.0
Actual Paid Professional 0.0 0.0 11.5 0.0
Actual Volunteer 0.0 0.0 0.0 0.0
2. Actual dollars expended in this Program (includes Carryover Funds from previous years)
Extension Research
Smith-Lever 3b & 3c 1890 Extension Hatch Evans-Allen
0 0 511390 0
1862 Matching 1890 Matching 1862 Matching 1890 Matching
0 0 511390 0
1862 All Other 1890 All Other 1862 All Other 1890 All Other
0 0 2908953 0

V(D). Planned Program (Activity)
1. Brief description of the Activity
•Design and conduct research, including the development of methods and procedures •Write and submit grant proposals to private, state and federal agencies •Generate scientific publications - communicating scientific results to a wide range of scientists •Training of professional scientists - graduate and undergraduate students, technicians and post docs in the scientific discipline •File patents
2. Brief description of the target audience
Scientists and scientific societies Governmental science organizations Educational institutions Applied researchers and extension specialists Students Private, federal, state, and industrial funding agencies Other stakeholders (producers, consumers, educators, public)
3. How was eXtension used?
eXtension was not used in this program
V(E). Planned Program (Outputs)
1. Standard output measures
2013 Direct Contacts
Adults Indirect Contacts
Adults Direct Contacts
Youth Indirect Contacts
Youth
Actual 0 0 0 0
2. Number of Patent Applications Submitted (Standard Research Output)
Patent Applications Submitted
Year: 2013
Actual: 4
Patents listed
3. Publications (Standard General Output Measure)
Number of Peer Reviewed Publications
2013 Extension Research Total
Actual 0 36 36
V(F). State Defined Outputs
Output Target

Output #1
Output Measure
● Grant proposals written and submitted
Year Actual
2013 37
Output #2
Output Measure
● Peer-reviewed publications including journal articles
Year Actual
2013 36

V(G). State Defined Outcomes
V. State Defined Outcomes Table of Content
O. No. OUTCOME NAME
1 Graduate students graduated
2 Improving biomass yield and stress tolerance of bioenergy crops
3 Identifying molecular markers to predict heat stress in crops

Outcome #1
1. Outcome Measures
Graduate students graduated
2. Associated Institution Types
● 1862 Research
3a. Outcome Type:
Change in Action Outcome Measure
3b. Quantitative Outcome
Year
Actual
2013
4
3c. Qualitative Outcome or Impact Statement
Issue (Who cares and Why)
What has been done
Results
4. Associated Knowledge Areas
KA Code
Knowledge Area
201
Plant Genome, Genetics, and Genetic Mechanisms
203
Plant Biological Efficiency and Abiotic Stresses Affecting Plants
206
Basic Plant Biology
212
Pathogens and Nematodes Affecting Plants
Outcome #2
1. Outcome Measures
Improving biomass yield and stress tolerance of bioenergy crops
2. Associated Institution Types
● 1862 Research
3a. Outcome Type:
Change in Knowledge Outcome Measure

3b. Quantitative Outcome
Year
Actual
2013
0
3c. Qualitative Outcome or Impact Statement
Issue (Who cares and Why)
Improving biomass yield and abiotic stress tolerance of the bioenergy crop species are the major target traits for sustainable biofuel production. However little progress has been made to date, because relevant genes/factors that control these traits are unknown. MicroRNAs, a class of small non coding RNAs, are well known for their gene regulatory roles by destroying or repressing translation of the mRNA targets.
What has been done
Research was conducted to identify critical miRNAs that might be important for adaptation to abiotic stresses such as drought and heat.
Results
We have identified 32 conserved and 67 novel miRNA families from the small RNA libraries generated from switchgrass leaves exposed to abiotic (drought and heat) stress. Interestingly 11 conserved and 25 novel families were up-regulated in response to both stresses. Similarly 4 conserved and 4 novel miRNA families also down-regulated in response to both stresses.
4. Associated Knowledge Areas
KA Code
Knowledge Area
201
Plant Genome, Genetics, and Genetic Mechanisms
203
Plant Biological Efficiency and Abiotic Stresses Affecting Plants
206
Basic Plant Biology
Outcome #3
1. Outcome Measures
Identifying molecular markers to predict heat stress in crops
2. Associated Institution Types
● 1862 Research
3a. Outcome Type:
Change in Knowledge Outcome Measure
3b. Quantitative Outcome
Year
Actual
2013
0

3c. Qualitative Outcome or Impact Statement
Issue (Who cares and Why)
Increase in global temperature, air pollutants such as ozone and the erratic rainfall regimes leading to extended drought pose significant threats to agricultural production not only in Oklahoma, but the entire world. The decrease in arable land compounded by the climate change issues has led to significant reductions in crop yields that will ultimately impact the cost of food, fuels and fodder. Understanding the molecular processes in plants that leads to this decrease in production will provide us with tools for tweaking those pathways and ensure sustainable production in the wake of climate change.
What has been done
We have identified a suite of 16 genes that are induced in response to heat stress. These genes are upregulated in all the cereals analyzed (wheat, maize, rice) and also in the bioenergy crop, switchgrass. These genes can serve as molecular markers to predict heat stress in crops and can help in estimating yield losses when high temperatures are in the forecast during a cropping season.
Results
Our group has identified several regulatory and signaling genes that are important for high tiller number in switchgrass using gene expression profiling in inbred lines with contrasting tiller number trait. Increasing tiller number provides an avenue for increasing the switchgrass biomass yield, that inturn can translate into increasing profits to farmers and help reduce the dependence on foreign oil. Plants are exposed to multiple stresses simultaneously in nature. Yet, most studies of plant stress responses are conducted using a single stressor at a time. A combination of drought and ozone stress simultaneously in Medicago truncatula evoked unique sets of genes that were not identified when the stressors were applied singly. This indicates plants perceive combined stress as a new stress state and not just an additive effect of the single stresses. These results indicate that studies on stress tolerance should consider co-occuring stresses that are likely to occur in field conditions.
4. Associated Knowledge Areas
KA Code
Knowledge Area
201
Plant Genome, Genetics, and Genetic Mechanisms
203
Plant Biological Efficiency and Abiotic Stresses Affecting Plants
206
Basic Plant Biology
V(H). Planned Program (External Factors)
● Economy
● Appropriations changes
● Public Policy changes
● Government Regulations
● Competing Public priorities
● Competing Programmatic Challenges
Brief Explanation

Research in plant biotechnology and crop improvement has been negatively impacted by the very limited
federal funding for agricultural research in general. Further, irrational levels of government regulation, mostly at
the international level, regarding transgenic plants has a serious chilling effect on research progress in this area
V(I). Planned Program (Evaluation Studies)
Evaluation Results
Member of the iCrest team that was awarded the President Cup for meritorious interdisciplinary research at
OSU.
Key Items of Evaluation
Member of the iCrest team that was awarded the President Cup for meritorious interdisciplinary research at
OSU.

V(A). Planned Program (Summary)
Program # 4
1. Name of the Planned Program
Commercial and Consumer Horticulture
Reporting on this Program
V(B). Program Knowledge Area(s)
1. Program Knowledge Areas and Percentage
KA Code
Knowledge Area %1862 Extension
%1890 Extension
%1862 Research
%1890 Research
124 Urban Forestry 5% 10%
202 Plant Genetic Resources 10% 10%
204 Plant Product Quality and Utility (Preharvest)
15% 15%
205 Plant Management Systems 45% 40%
502 New and Improved Food Products 15% 20%
901 Program and Project Design, and Statistics
5% 5%
903 Communication, Education, and Information Delivery
5% 0%
Total 100% 100%
V(C). Planned Program (Inputs)
1. Actual amount of FTE/SYs expended this Program
Year: 2013 Extension Research
1862 1890 1862 1890
Plan 12.0 0.0 3.0 0.0
Actual Paid Professional 20.0 0.0 2.7 0.0
Actual Volunteer 29.3 0.0 0.0 0.0
2. Actual dollars expended in this Program (includes Carryover Funds from previous years)
Extension Research
Smith-Lever 3b & 3c 1890 Extension Hatch Evans-Allen
450000 0 117434 0
1862 Matching 1890 Matching 1862 Matching 1890 Matching
450000 0 117434 0
1862 All Other 1890 All Other 1862 All Other 1890 All Other
1350000 0 668000 0

V(D). Planned Program (Activity)
1. Brief description of the Activity
•Conduct research to evaluate cultivars of traditional and nontraditional horticultural crops and ornamental plants. •Conduct research into crop cultural systems, particularly the feasibility of horticultural crops in rotation with agronomic crops. Lead CoP for grape production for eXtension. •Conduct research to develop "seed to market" production systems for high-value alternative horticultural crops like cilantro and herbs. •Conduct research to develop sustainable and/or organic production systems for commercial horticultural crops. •Provide demonstrations and education and disseminate information to support Oklahoma's commercial horticulture industry, with emphasis on electronic resources. •Survey Oklahoma Consumers (Gardeners) at the county level to assess the needs and wants of the gardening public •Upgrade the web-based delivery •Review and revise annually or as needed Fact sheets and other publications •Educational programs focused on Consumer Best Management Practices (BMP) for the conservation of energy, water resources, water pollution prevention, Integrated Pest Management (IPM), and urban landscape wildlife conservation •Educational programs are conducted based on public interest and County Educator requests •Participate and support eXtension Consumer Horticulture/Master Gardener Community of Practice •Conduct Master Gardener/Junior Master Gardener Training •Conduct pesticide training and education •Provide Education on Backyard Food Production •Assist in Youth at Risk - Obesity/School Gardens
2. Brief description of the target audience
Horticultural crop producers, commodity groups, food processors, landscape professionals, input suppliers such as seed and chemical companies, peer scientists, extension specialists and county professionals, horticultural dealers and merchants, greenhouses, Master Gardeners, home owners, communities, and youth.
3. How was eXtension used?
In 2013 the Grape Community of Practice eXtension website was managed by an extension fruit specialist from another land grant institution and by an extension employee at Oklahoma State University. During 2013 efforts by Oklahoma State ceased regarding the Grape Community of Practice due to the loss of the extension specialist that managed that webpage. 31 responses were provided by state specialists to users of eXtension through the Ask an Expert feature of the eXtension web site.
V(E). Planned Program (Outputs)
1. Standard output measures
2013 Direct Contacts
Adults Indirect Contacts
Adults Direct Contacts
Youth Indirect Contacts
Youth
Actual 109081 3650559 9500 250000
2. Number of Patent Applications Submitted (Standard Research Output)

Patent Applications Submitted
Year: 2013
Actual: 0
Patents listed
3. Publications (Standard General Output Measure)
Number of Peer Reviewed Publications
2013 Extension Research Total
Actual 47 18 65
V(F). State Defined Outputs
Output Target
Output #1
Output Measure
● New Master Gardeners trained
Year Actual
2013 322
Output #2
Output Measure
● Manuscripts submitted for consideration of publication in peer-reviewed journals
Year Actual
2013 20
Output #3
Output Measure
● Number of Extension publications completed - fact sheets, newsletters, trial reports, web-based materials
Year Actual
2013 85
Output #4
Output Measure
● Number of statewide "Oklahoma Gardening" shows produced
Year Actual
2013 37

V(G). State Defined Outcomes
V. State Defined Outcomes Table of Content
O. No. OUTCOME NAME
1 Number of horticultural crop producers newly certified as organic
2 Number of volunteer hours provided to community horticulture programs statewide
3
Number of home gardeners experiencing increased awareness and knowledge about environmental issues and IPM principles
4 Outreach workshops to underserved horticultural food crop farmers within the state
5
Trialing tomato varieties with heat-set capabilities and using plasticulture to manage soil temperature and moisture levels. Number of trials.

Outcome #1
1. Outcome Measures
Number of horticultural crop producers newly certified as organic
2. Associated Institution Types
● 1862 Extension
● 1862 Research
3a. Outcome Type:
Change in Action Outcome Measure
3b. Quantitative Outcome
Year
Actual
2013
6
3c. Qualitative Outcome or Impact Statement
Issue (Who cares and Why)
Organic produce is an important niche market for fresh market fruit and vegetable producers within the state. A segment of consumers are interested in having more certified organic produce available for purchase. As a result there is demand for more certified organic farmers who can fill this market demand.
What has been done
As a Land Grant institution Oklahoma State University has committed both people and resources to develop a research and outreach programs to provide research based information for organic farmers. In addition, this effort is in collaboration with the Oklahoma Department of Agriculture Food and Forestry?s (ODAFF) Organic Certification program to provide both information and certification to increase the number of organic farmers available to fill this developing market.
Results
During the past 12 months six newly certified organic producers have been added to the ODAFF certified list.
4. Associated Knowledge Areas
KA Code
Knowledge Area
204
Plant Product Quality and Utility (Preharvest)
205
Plant Management Systems
502
New and Improved Food Products

Outcome #2
1. Outcome Measures
Number of volunteer hours provided to community horticulture programs statewide
2. Associated Institution Types
● 1862 Extension
3a. Outcome Type:
Change in Action Outcome Measure
3b. Quantitative Outcome
Year
Actual
2013
79829
3c. Qualitative Outcome or Impact Statement
Issue (Who cares and Why)
Rapid urban growth in many areas of the United States coupled with increased interest in the environment and home gardening have prompted an ever-increasing number of garden and landscape inquiries. Along with this interest, comes a multitude of gardening questions needing individual explanation and too few Extension staff members to answer each question. Many of these questions are seasonal in nature and are relatively easy to answer assuming that one has horticulture training.
What has been done
Oklahoma Master Gardeners are trained, supervised and recruited to: 1) improve overall efficiency in providing one-on-one service to the non-commercial horticulture clientele in the county, 2) provide group learning and teaching activities for non-commercial clientele, 3) allow agents to develop proactive Extension programs, and 4) form a group of Extension volunteers to support additional consumer horticulture efforts. Trainees participate in a 10 - 13 week course receiving between 40 - 56 hours of course work on subjects including: basic plant science, vegetables, fruits, nuts, ornamentals, lawns, diagnosing pest problems, soils, and other related topics. Upon completion of the training period, satisfactorily passing an exam on materials and topics covered, and donating between 40 - 56 hours of volunteer time to the Horticulture program, the trainees are certified and awarded the title of Oklahoma Master Gardener. Examples of Master Gardener Volunteer activities include: staffing plant clinics to answer phone and walk-in questions, manning educational exhibits, maintaining demonstration gardens, community beautification projects, serving as 4-H hort leaders and judges, speaking at club/civic meetings, teaching horticulture activities at nursing homes, etc., assisting in horticulture mailings, newsletters, etc., and appearing on TV and radio.
Results
The service from the Master Gardener volunteer program has proven to be a highly popular means of extending the knowledge of the Oklahoma State University Cooperative Extension

Service to the residents of Oklahoma. The Oklahoma Master Gardener Program now has 26 counties participating in the program as of January 2014. The following data was provided by 23 of the 26 counties. Approximately 322 new Master Gardeners were trained during the 2013 training season. Close to 1,244 active Master Gardeners volunteered their time, contributing approximately 79,829 volunteer hours resulting in over 9,967,280 educational interventions with Oklahomans and as many as 2,729+ educational and community programs and activities being conducted in their communities in 2013. This translates to over $1,459,274.00 in service that was donated by volunteers (wage rate of $18.28/hour was used, which includes a 12% estimate of fringe benefits. This hourly rate is the assigned wage for non-management, non-agricultural workers in 2011 for the state of Oklahoma as published by The Independent Sector, an organization that ?serves as a national forum to encourage giving, volunteering and not-for-profit initiative,? http://www.independentsector.org/programs/research/volunteer_time.html). Reports are gathered yearly at the beginning of the following year. In addition to the many hours donated, approximately 9,344 pounds of produce was donated to local food pantries/kitchens, shelters, and other organizations throughout Oklahoma by the Master Gardeners.
4. Associated Knowledge Areas
KA Code
Knowledge Area
124
Urban Forestry
204
Plant Product Quality and Utility (Preharvest)
205
Plant Management Systems
903
Communication, Education, and Information Delivery
Outcome #3
1. Outcome Measures
Number of home gardeners experiencing increased awareness and knowledge about environmental issues and IPM principles
2. Associated Institution Types
● 1862 Extension
3a. Outcome Type:
Change in Action Outcome Measure
3b. Quantitative Outcome
Year
Actual
2013
1017084
3c. Qualitative Outcome or Impact Statement
Issue (Who cares and Why)
Public concern for the environment continues to increase. Traditional landscape management practices have involved extensive use of pesticides, fertilizers, and other materials that could harm the environment if not used properly. Integrated Pest Management (IPM) uses biological

principles, cultural practices, and some chemicals to control pest populations with minimal environ¬mental impact.
What has been done
Over 2,792 workshops, educational programs/seminars and Oklahoma Gardening segments are used to educate the public of IPM practices and other related gardening topics.
Results
Homeowners are better educated and can make choices in maintaining the landscape that are more environmentally friendly.
4. Associated Knowledge Areas
KA Code
Knowledge Area
124
Urban Forestry
205
Plant Management Systems
903
Communication, Education, and Information Delivery
Outcome #4
1. Outcome Measures
Outreach workshops to underserved horticultural food crop farmers within the state
2. Associated Institution Types
● 1862 Extension
3a. Outcome Type:
Change in Knowledge Outcome Measure
3b. Quantitative Outcome
Year
Actual
2013
5
3c. Qualitative Outcome or Impact Statement
Issue (Who cares and Why)
Underserved new and beginning producers of horticultural food crops have traditionally been difficult to contact due to the diverse locations and types of crops that they are growing. Because of this, the flow of information to these farmers has been limited. Basic information related to field preparation, soil fertility, pest management, crop management, and food safety is needed to increase these farms chances of being successful.
What has been done
The project that was begun in 2012 was continued in 2013. Project funding was from a grant from the USDA Risk Management Agency (RMA). Five different workshop/field days were developed. Workshops were planned and completed with groups of new farmers including the Hmong in eastern Oklahoma and the Otoe-Missouria and Ponca tribes in north central Oklahoma. The workshop/field days were used to increase new and beginning horticulture food crop farmer?s knowledge and skills. Skills taught included production risk management techniques such as

business and insurance considerations, field preparation, soil fertility, plasticulture, cover crops, pest management, and food safety considerations.
Results
At the first workshop in eastern Oklahoma nearly 52% of the participants agreed they would evaluate practices to reduce risk in their specialty crop businesses. Afternoon sessions included hoop house crop production, cover crop management, no-till methods for vegetable production, and setting vegetable transplants The season extension presentation was particularly popular. As a result of the first workshop, producers estimated the economic benefit to their operations somewhere between $250-500 and one estimated a benefit between $2,250-2,500. The second workshop in eastern Oklahoma covered topics on soil fertility, pest management, testing for soil moisture levels, managing drip irrigation, and produce washing techniques. Afternoon sessions covered developing a farm food safety plan including good agricultural practices, good manufacturing practices and using the grower self-assessment publication for food safety risks to develop a risk assessment of their farms. Nearly 70% of participants gained new information about food safety practices. Overall 70% of participants gained new ideas on how to prevent production problems from occurring including crop growth, weather, and food safety hazards. As a result of participation in this second workshop producers estimated that their operations would benefit between $250-1,000 and one producer estimated his benefit as more than $2,500. A third workshop was held in eastern Oklahoma due to producers requesting help on learning about pesticide safety and calibration of sprayers. This workshop was a joint effort with the horticulture and entomology and plant pathology departments. It covered pesticide label considerations including personal protective equipment, pesticide application, pre-harvest intervals, etc. Also included in the workshop were demonstrations on calibrating hand-pump and tractor-PTO driven sprayers. Two workshops were completed in north central Oklahoma with the Otoe-Missouria and Ponca tribes. The first workshop in April covered soil fertility, season extension using plasticulture, crop planning for different seasons, soil preparation and installation of plastic mulch and drip irrigation. All participants strongly agreed that they had gained in knowledge about areas covered by the workshop. Also covered at this workshop was the use of risk management techniques including government support options. Nearly 63% of participants agreed that they would evaluate practices to reduce risk in their specialty crop businesses. Afternoon sessions at this workshop included high-tunnel crop production, leafy greens, cover crops, and reduced tillage options for production of vegetable crops. Producers at the first workshop estimated that the economic benefit to their farms would range from $750 to $1000. One farmer stated that the economic benefit would exceed $2,500. The second workshop with this group was completed in July and focused primarily on food safety issues connected to the production and sale of fresh produce. The workshop included field demonstrations in the morning including pest scouting, pest management, managing drip irrigation, and washing fresh produce. Following lunch, presentations were given on Good Agricultural Practices, Good Handling Practices and marketing of fresh produce. Estimated economic benefits from the two workshops ranged from $250 to $1,000 for a large percentage of the participants while several estimated the benefit to be over $2,500.
4. Associated Knowledge Areas
KA Code
Knowledge Area
204
Plant Product Quality and Utility (Preharvest)
205
Plant Management Systems
903
Communication, Education, and Information Delivery

Outcome #5
1. Outcome Measures
Trialing tomato varieties with heat-set capabilities and using plasticulture to manage soil temperature and moisture levels. Number of trials.
2. Associated Institution Types
● 1862 Research
3a. Outcome Type:
Change in Knowledge Outcome Measure
3b. Quantitative Outcome
Year
Actual
2013
5
3c. Qualitative Outcome or Impact Statement
Issue (Who cares and Why)
Oklahomans want locally grown fresh produce and tomato is one of those produce items that are a ?must have? item for consumers within the state. Tomatoes have been produced in Oklahoma since people began gardening here. Within the vegetable crop group, tomatoes require high levels of management and attention to detail in order to be successful. One of the biggest problems for tomato growers is fruit set which usually stops completely during the hotter periods of June and July. In 2011 and 2012, farmers had difficulty growing tomatoes for market due to the intense hot weather that was experienced. Farmers continue to request help with this ongoing problem.
What has been done
During 2013 five different tomato trials were completed within the state. Trial sites were located in Noble (north-central), Tulsa (eastern), Payne (central), and Blaine (western) areas of the state. These trials were partially supported by a specialty crop grant from the Oklahoma Department of Agriculture, Food, and Forestry (ODAFF). On-farm trial sites received the same 12 tomato varieties for testing in a replicated trial with three replications. The majority of sites used drip irrigation and plastic mulch for crop management.
Results
Results from the first year of this two year study were published in the Oklahoma State University Vegetable Trial Report MP-164 which is available at: http://www.hortla.okstate.edu/research-and-outreach/research/pdfs/13vegreport.pdf. Tomato cultivars that performed well in 2013 included Solar Fire, Bella Rosa, Tribeca, and Tribute. These cultivars were in the top 5 cultivars at a majority of locations during the 2013 season. Results were presented to commercial tomato growers at the 2014 Horticulture Industry Show. Farmers are interested in seeing results from upcoming trials during the 2014 season. As in 2013 multiple trials are planned for 2014 with locations ranging from eastern Oklahoma to western areas of the state.
4. Associated Knowledge Areas
KA Code
Knowledge Area

202
Plant Genetic Resources
204
Plant Product Quality and Utility (Preharvest)
205
Plant Management Systems
V(H). Planned Program (External Factors)
● Natural Disasters (drought, weather extremes, etc.)
● Economy
● Appropriations changes
● Competing Public priorities
● Competing Programmatic Challenges
● Populations changes (immigration, new cultural groupings, etc.)
Brief Explanation
External factors include drought and extreme high temperatures that have resulted in low production of
tomato fruit for fresh market within the
state.
V(I). Planned Program (Evaluation Studies)
Evaluation Results
Tomato cultivars that performed well in 2013 included Solar Fire, Bella Rosa, Tribeca, and
Tribute.
Key Items of Evaluation

V(A). Planned Program (Summary)
Program # 5
1. Name of the Planned Program
Ecosystem and Environmental Quality and Management including Weather and Climate
Reporting on this Program
V(B). Program Knowledge Area(s)
1. Program Knowledge Areas and Percentage
KA Code
Knowledge Area %1862 Extension
%1890 Extension
%1862 Research
%1890 Research
104 Protect Soil from Harmful Effects of Natural Elements
6% 10%
111 Conservation and Efficient Use of Water 9% 10%
112 Watershed Protection and Management 9% 10%
121 Management of Range Resources 13% 15%
123 Management and Sustainability of Forest Resources
7% 10%
132 Weather and Climate 12% 5%
133 Pollution Prevention and Mitigation 5% 5%
134 Outdoor Recreation 7% 0%
135 Aquatic and Terrestrial Wildlife 8% 5%
136 Conservation of Biological Diversity 5% 5%
141 Air Resource Protection and Management 6% 5%
205 Plant Management Systems 5% 5%
403 Waste Disposal, Recycling, and Reuse 6% 5%
605 Natural Resource and Environmental Economics
2% 10%
Total 100% 100%
V(C). Planned Program (Inputs)
1. Actual amount of FTE/SYs expended this Program
Year: 2013 Extension Research
1862 1890 1862 1890
Plan 10.0 0.0 14.0 0.0
Actual Paid Professional 15.0 0.0 14.6 0.0
Actual Volunteer 1.7 0.0 0.0 0.0
2. Actual dollars expended in this Program (includes Carryover Funds from previous years)

Extension Research
Smith-Lever 3b & 3c 1890 Extension Hatch Evans-Allen
470000 0 646549 0
1862 Matching 1890 Matching 1862 Matching 1890 Matching
470000 0 646549 0
1862 All Other 1890 All Other 1862 All Other 1890 All Other
1430572 0 3677783 0
V(D). Planned Program (Activity)
1. Brief description of the Activity
Designed and conducedt research Forged collaborative relationships that build on current strengths in research in management. Partnered with state and federal agencies to address pressing needs in conservation. Produced scientific publications; disseminate information through other print and online media outlets. Conducted workshops, field days, and other personal information exchanges to promote issues and alternatives in natural resource management. Submitted grant proposals Continued to develop Mesonet weather-related decision tools including but not limited to OK-FIRE system for wildland fire management, plant disease prediction modeling knowledge and operational weather-based tools, new Cattle Comfort Index (developed by animal scientists in Nebraska) combines heat and cold stress into a single model for multiple livestock species combined with Oklahoma Mesonet data will be made available on a statewide basis in Oklahoma. Conducted Poultry Waste Management Education Weather and climate education for the general public and agricultural sector was conducted through weather reports on TV through OSU SUNUP, online video/audio tutorials, printable information and fact sheets, email newsletters, educational programs, seminars and workshops. Statewide daily estimates of plant available water in the top 80 centimeters of the soil profile were available through the Oklahoma Mesonet website. Educational materials and programs were developed to inform clientele on how available water in the soil profile impacts cropping and ecosystem decision management to improve risk management. The Oklahoma Mesonet introduced a new "Agriculture" website section that provides statewide and farm local perspectives to risk management and decision support weather-based tools. Evapotranspiration is being investigated as a broad measure of plant environmental stress. The Oklahoma Mesonet provides a statewide system that can be used to ground truth satellite evapotranspiration modeling. Research at OSU will provide the foundation for modeling plant

biomass based on rainfall, soil moisture, and evapotranspiration that can be used in ecosystem and grazing management. Conducted multi-disciplinary research on grassland fuel modeling as part of an awarded Joint Fire Science Program grant. Provided agriculture and natural resource management technical expertise for weather and climate data and models maintained and operated by the Oklahoma Mesonet.
2. Brief description of the target audience
Scientists, students, related agencies (Federal, State, private), land owners, farmers, ranchers, communities, consumers, land developers, state legislators, commodity groups, community leaders
3. How was eXtension used?
Dr. Doug Hamilton has three webpages on the eXtension anaerobic digestion website. "Types of Anaerobic Digesters" is the number one page on the site with 1,641 unique visitors in 2013. Average time on page for "Types of Anaerobic Digesters" is 5:06; however, in the 3rd quarter of 2013, 444 visitors spent an average of 10:57 minutes on the page. Hamilton added another webpage in 2013. Making Sense of Smells was added to the "Waste to Worth Conference" site. Since it became public in fall of 2013, 22 unique visitors have used the site, spending an average of 10:01 minutes viewing the material. Dr. Hailin Zhang became a Became a member of the Drinking Water and Human Health Community. He participated in a webinar titled: Safe drinking water before, during and after a disaster. The webinar had 70 participants on the day it was broadcast and many viewers afterwards. With collaborators from 4 universities, 2 federal agencies, and 2 NGOs, we launched the Prescribed Fire Community of Practice within eXtension. There have been 59 articles and 58 FAQs made available in the CoP, with 72 technical experts participating.
V(E). Planned Program (Outputs)
1. Standard output measures
2013 Direct Contacts
Adults Indirect Contacts
Adults Direct Contacts
Youth Indirect Contacts
Youth
Actual 11600 152300 1069 37000
2. Number of Patent Applications Submitted (Standard Research Output)
Patent Applications Submitted
Year: 2013
Actual: 0
Patents listed
3. Publications (Standard General Output Measure)
Number of Peer Reviewed Publications

2013 Extension Research Total
Actual 17 108 125
V(F). State Defined Outputs
Output Target
Output #1
Output Measure
● Grant proposals written and submitted
Year Actual
2013 75
Output #2
Output Measure
● Manuscripts submitted for consideration of peer-reviewed publication
Year Actual
2013 133
Output #3
Output Measure
● Extension conferences, workshops and training sessions
Year Actual
2013 191
Output #4
Output Measure
● Research and Extension reports and fact sheets
Year Actual
2013 221
Output #5
Output Measure
● Number of web-based weather related decision tools provided through Oklahoma Mesonet to improve crop and livestock production and safety and/or reduce costs
Year Actual
2013 15
Output #6
Output Measure
● Weather-based decision support tools made operational and delivered through Oklahoma

Mesonet websites for use on computer and mobile devices.
Year Actual
2013 2

V(G). State Defined Outcomes
V. State Defined Outcomes Table of Content
O. No. OUTCOME NAME
1
Number of poultry producers and poultry litter applicators acquiring initial waste managment certification and number maintaining certification
2
Number of animal waste analyses conducted for land application of beef, dairy or swine waste.
3 Number of animal waste analyses conducted for poultry litter application
4
Number of users accessing website designed to deliver information about water policy, conservation and efficient use
5 Number of downloads of Extension fact sheets and related education materials
6 Number of enrollments in conservation-related land management programs
7 Land area restored in Oklahoma through invasive/encroaching species removal
8 Land area restored in Oklahoma through prescribed fire or other practices
9
Access by users of Oklahoma Mesonet computer and mobile device weather and climate data and tools
10 Wildlife exposure to aflatoxins through supplemental feeding
11 Bird collision mortality at U.S. wind facilities
12
Assessing Functions and Ecosystem Services Provided by the Wetlands Reserve Program in Oklahoma
13
Assessment of current and future states of Oklahoma forests with respect to biomass and carbon sequestration.
14 Prescribed Burn Associations
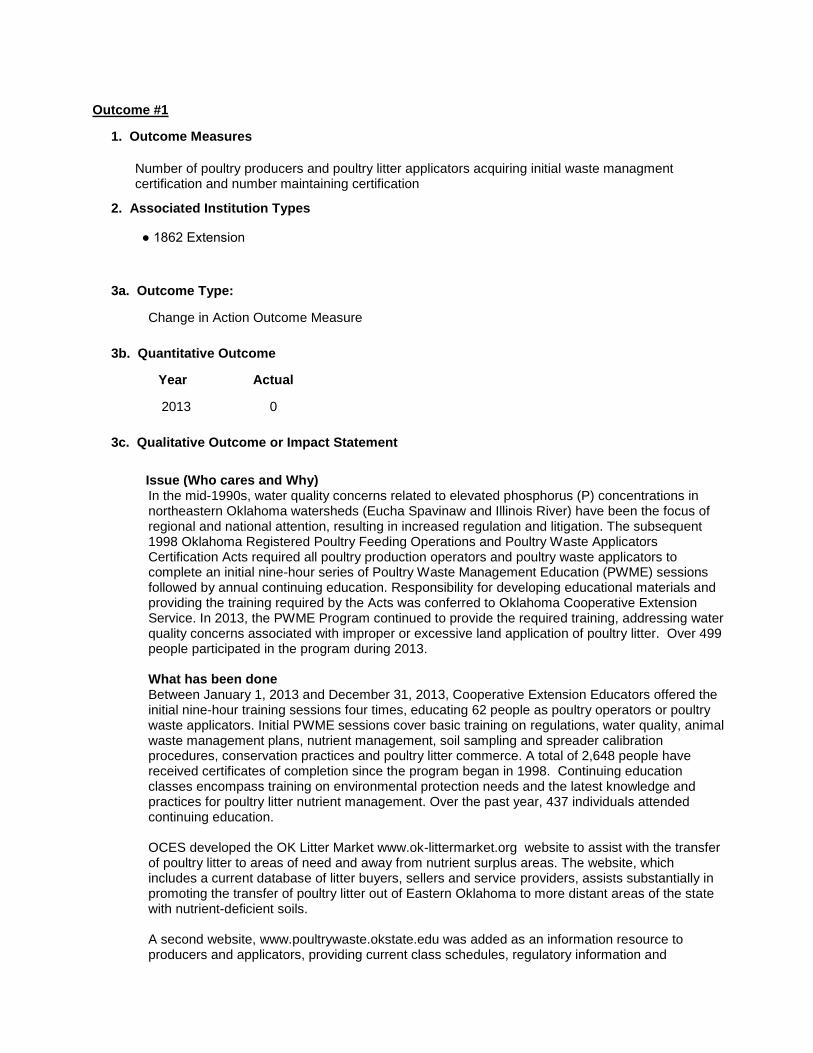
Outcome #1
1. Outcome Measures
Number of poultry producers and poultry litter applicators acquiring initial waste managment certification and number maintaining certification
2. Associated Institution Types
● 1862 Extension
3a. Outcome Type:
Change in Action Outcome Measure
3b. Quantitative Outcome
Year
Actual
2013
0
3c. Qualitative Outcome or Impact Statement
Issue (Who cares and Why)
In the mid-1990s, water quality concerns related to elevated phosphorus (P) concentrations in northeastern Oklahoma watersheds (Eucha Spavinaw and Illinois River) have been the focus of regional and national attention, resulting in increased regulation and litigation. The subsequent 1998 Oklahoma Registered Poultry Feeding Operations and Poultry Waste Applicators Certification Acts required all poultry production operators and poultry waste applicators to complete an initial nine-hour series of Poultry Waste Management Education (PWME) sessions followed by annual continuing education. Responsibility for developing educational materials and providing the training required by the Acts was conferred to Oklahoma Cooperative Extension Service. In 2013, the PWME Program continued to provide the required training, addressing water quality concerns associated with improper or excessive land application of poultry litter. Over 499 people participated in the program during 2013.
What has been done
Between January 1, 2013 and December 31, 2013, Cooperative Extension Educators offered the initial nine-hour training sessions four times, educating 62 people as poultry operators or poultry waste applicators. Initial PWME sessions cover basic training on regulations, water quality, animal waste management plans, nutrient management, soil sampling and spreader calibration procedures, conservation practices and poultry litter commerce. A total of 2,648 people have received certificates of completion since the program began in 1998. Continuing education classes encompass training on environmental protection needs and the latest knowledge and practices for poultry litter nutrient management. Over the past year, 437 individuals attended continuing education. OCES developed the OK Litter Market www.ok-littermarket.org website to assist with the transfer of poultry litter to areas of need and away from nutrient surplus areas. The website, which includes a current database of litter buyers, sellers and service providers, assists substantially in promoting the transfer of poultry litter out of Eastern Oklahoma to more distant areas of the state with nutrient-deficient soils. A second website, www.poultrywaste.okstate.edu was added as an information resource to producers and applicators, providing current class schedules, regulatory information and

educational publications related to animal waste management and water quality. The Poultry Litter Nutrient Management Guide was developed in 2011 and has become a vital resource for individuals seeking information about litter use as a fertilizer. It is available via download from www.poultrywaste.okstate.edu. Poultry Practices, a biannual publication with timely articles directed toward poultry producers and poultry waste applicators, was expanded during 2013 to include more material and currently reaches more than 1,000 recipients at each distribution.
Results
A recent study from researchers at the University of Arkansas highlights water quality improvements within the Illinois River watershed. Researchers examined in-stream P concentration data spanning from 1997 to 2009 within the Illinois River watershed. Results showed that flow-adjusted P concentrations have been decreasing since 2003 in the Illinois River at Arkansas Highway 59, at Watts, Oklahoma and further downstream at Tahlequah, Oklahoma. These decreases are tied to the reductions in waste water treatment effluent P, which occurred in 2002. However, changes in agricultural management practices are also likely responsible for P reductions and include: exporting the majority of poultry litter outside nutrient sensitive watersheds, implementation of best management practices, strict regulations related to land application of manure and mandatory manure management education for poultry producers and manure applicators. The PWME program continues to assist producers by providing outreach efforts addressing each of these practices.
4. Associated Knowledge Areas
KA Code
Knowledge Area
112
Watershed Protection and Management
133
Pollution Prevention and Mitigation
403
Waste Disposal, Recycling, and Reuse
Outcome #2
1. Outcome Measures
Number of animal waste analyses conducted for land application of beef, dairy or swine waste.
2. Associated Institution Types
● 1862 Extension
3a. Outcome Type:
Change in Action Outcome Measure
3b. Quantitative Outcome
Year
Actual
2013
669
3c. Qualitative Outcome or Impact Statement

Issue (Who cares and Why)
What has been done
Results
4. Associated Knowledge Areas
KA Code
Knowledge Area
112
Watershed Protection and Management
133
Pollution Prevention and Mitigation
205
Plant Management Systems
403
Waste Disposal, Recycling, and Reuse
Outcome #3
1. Outcome Measures
Number of animal waste analyses conducted for poultry litter application
2. Associated Institution Types
● 1862 Extension
3a. Outcome Type:
Change in Action Outcome Measure
3b. Quantitative Outcome
Year
Actual
2013
389
3c. Qualitative Outcome or Impact Statement
Issue (Who cares and Why)
What has been done
Results
4. Associated Knowledge Areas
KA Code
Knowledge Area
112
Watershed Protection and Management
133
Pollution Prevention and Mitigation
205
Plant Management Systems
403
Waste Disposal, Recycling, and Reuse

Outcome #4
1. Outcome Measures
Number of users accessing website designed to deliver information about water policy, conservation and efficient use
2. Associated Institution Types
● 1862 Extension
3a. Outcome Type:
Change in Knowledge Outcome Measure
3b. Quantitative Outcome
Year
Actual
2013
7027
3c. Qualitative Outcome or Impact Statement
Issue (Who cares and Why)
Water management is crucial to human health and well being, agricultural and industrial productivity, and management of natural resources.
What has been done
Improvements to the website include creation of audience-specific and industry pages addressing food processing and energy development, a revised waste management page, new QR code, and streamlined navigation.
Results
Number of visitors to the website has nearly doubled in every year since 2009.
4. Associated Knowledge Areas
KA Code
Knowledge Area
111
Conservation and Efficient Use of Water
605
Natural Resource and Environmental Economics
Outcome #5
1. Outcome Measures
Number of downloads of Extension fact sheets and related education materials
Not Reporting on this Outcome Measure

Outcome #6
1. Outcome Measures
Number of enrollments in conservation-related land management programs
2. Associated Institution Types
● 1862 Extension
3a. Outcome Type:
Change in Knowledge Outcome Measure
3b. Quantitative Outcome
Year
Actual
2013
0
3c. Qualitative Outcome or Impact Statement
Issue (Who cares and Why)
{No Data Entered}
What has been done
{No Data Entered}
Results
{No Data Entered}
4. Associated Knowledge Areas
KA Code
Knowledge Area
104
Protect Soil from Harmful Effects of Natural Elements
112
Watershed Protection and Management
121
Management of Range Resources
133
Pollution Prevention and Mitigation
136
Conservation of Biological Diversity
205
Plant Management Systems

Outcome #7
1. Outcome Measures
Land area restored in Oklahoma through invasive/encroaching species removal
2. Associated Institution Types
● 1862 Extension
● 1862 Research
3a. Outcome Type:
Change in Condition Outcome Measure
3b. Quantitative Outcome
Year
Actual
2013
25000
3c. Qualitative Outcome or Impact Statement
Issue (Who cares and Why)
Within the past decade land managers in Oklahoma wanting to convert Old World Bluestem fields to native grassland dominated fields did not have a good understanding of the techniques necessary to complete the task, nor did they have anyone to whom they could be referred.
What has been done
Today, OSU scientists, in collaboration with others, have determined a fire and herbicide regime that, to date, is the most effective, thus reducing the amount of herbicide used and the cost to the producer. We also helped land managers (private, non-profit, and government agencies) realize the difficulty in re-establishing native plant species in sites that had been previously dominated by Old World Bluestems.
Results
This knowledge helped save them thousands of dollars on purchasing native seeds to reseed those sites. Additionally, this program produced and trained students who now are working as invasive species scientists in multiple state and federal agencies, furthering the influence of the research program. Cooperative Extension representatives in natural resources, entomology and plant pathology, weed science, and horticulture have increased their sharing of information about invasive species through the Oklahoma Invasive Plant Council, the Oklahoma Botanic Gardens, SUN-UP, and the Oklahoma Gardening series. These programs have promoted increased knowledge concerning the ecology and management of invasive species in Oklahoma and increased awareness of the importance of avoiding the use of invasive species in various land management practices.
4. Associated Knowledge Areas
KA Code
Knowledge Area
104
Protect Soil from Harmful Effects of Natural Elements
111
Conservation and Efficient Use of Water
112
Watershed Protection and Management

121
Management of Range Resources
123
Management and Sustainability of Forest Resources
134
Outdoor Recreation
135
Aquatic and Terrestrial Wildlife
136
Conservation of Biological Diversity
605
Natural Resource and Environmental Economics
Outcome #8
1. Outcome Measures
Land area restored in Oklahoma through prescribed fire or other practices
2. Associated Institution Types
● 1862 Extension
● 1862 Research
3a. Outcome Type:
Change in Condition Outcome Measure
3b. Quantitative Outcome
Year
Actual
2013
500000
3c. Qualitative Outcome or Impact Statement
Issue (Who cares and Why)
Eastern redcedar (Juniperus virginiana) is one of the most widely distributed trees in Oklahoma and surrounding states, and it has been encroaching in areas previously characterized by fire-dependent grassland and savanna. Eastern redcedar encroachment converts grasslands to shrublands, greatly reducing the value of the land for grazing and native wildlife habitat. Dense groves of eastern redcedar also threaten life and property as they represent a significant wildfire hazard. The current area covered by Eastern redcedar in Oklahoma is estimated beyond 4.5 million hectares and it is projected to be 6.3 million hectares by 2013.
What has been done
During 2012-2013 Oklahoma State University Extension personnel led a multi-state effort of 11 resource professionals to create a Prescribed Fire Community of Practice (CoP) within eXtension. This CoP was officially launched to the public in 2013. Currently there are 72 members who have contributed 58 FAQs and 59 articles related to prescribed fire. This CoP will serve as a clearing house of knowledge for prescribed fire and highlights the leadership that OSU-NREM provides in the fire ecology discipline. Much of the content on the CoP is from research generated at OSU. The site also provides a mechanism to advertise workshops and field days that OSU and our collaborators carry out.
Results
From our work with prescribed burn associations (PBA) we currently have 18 PBAs in Oklahoma representing 34 counties, with over 350 members managing over 1.1 million acres of land.

4. Associated Knowledge Areas
KA Code
Knowledge Area
111
Conservation and Efficient Use of Water
112
Watershed Protection and Management
121
Management of Range Resources
123
Management and Sustainability of Forest Resources
134
Outdoor Recreation
135
Aquatic and Terrestrial Wildlife
136
Conservation of Biological Diversity
205
Plant Management Systems
605
Natural Resource and Environmental Economics
Outcome #9
1. Outcome Measures
Access by users of Oklahoma Mesonet computer and mobile device weather and climate data and tools
2. Associated Institution Types
● 1862 Extension
● 1862 Research
3a. Outcome Type:
Change in Knowledge Outcome Measure
3b. Quantitative Outcome
Year
Actual
2013
724416
3c. Qualitative Outcome or Impact Statement
Issue (Who cares and Why)
The Oklahoma Mesonet has assembled and created weather-based tools that give Oklahoma agricultural producers and natural resource managers the opportunity to move from calendar-based to weather-based farm management. Weather-based farm management can reduce farm inputs, increase crop yield and quality, improve farm sustainability, provide new integrated pest management (IPM) opportunities, improve environmental protection and expand crop marketing information. The Oklahoma Mesonet provides farmers and ranchers weather-based risk management tools and information in a number of formats, including: website for desktop and tablet, iPhone app, Android app, and mobile website for other cellphone platforms. Weather-based management has been made possible because the Oklahoma Mesonet operates one of the most data-rich weather networks in the world. New weather data are transmitted every 5 minutes from a statewide system of 120 automated weather-monitoring towers. This constant flow of verified, research-quality weather data are used to maintain a wide spectrum of weather and agricultural decision support products made available for computer and mobile devices.
The challenge in implementing weather-based agricultural management includes: providing intuitive decision-support tools, enhancing mobile device information delivery, expanding grower weather knowledge, and simplifying weather data display. These challenges are further complicated by agriculture?s need for forecast, current, and climate perspectives in supporting farm and ranch management decisions.
What has been done
Oklahoma State University, the University of Oklahoma, and the Oklahoma Climatological Survey (OCS) through the Oklahoma Mesonet have created multi-faceted agricultural and natural resource extension/outreach online data and models. The Oklahoma Mesonet data has supported various agricultural and ecological research projects. Mesonet.org provides desktop and tablet access to weather data and products at no cost to Oklahoma farmers and ranchers. An Agriculture section within Mesonet.org organizes decision support products by crop and livestock commodity. Android and iPhone apps provide 5-minute weather, forecast, and radar information, wherever the user has mobile network access. Ongoing extension/outreach efforts inform growers about available products and introduction to weather-based farm management tools via farm show exhibits, educational presentations, television, web tutorials, and printed materials. In 2013 efforts focused on Mesonet weather product education. Educational presentations and National Weather Center tours provided information to traditional and non-traditional audiences. An assessment was made of OSU extension publications for weather and climate information. The assessment included what weather or climate information was presented and how extensive topic discussions were in these publications. This lays the groundwork for what needs to be developed to fill weather and climate education gaps. Base programming and web design for the new Wheat First Hollow Stem Advisor were done to bring this online for testing in December 2013. 2013 followed a year of major change for agriculture models within the Mesonet. In August 2012, the Mesonet Agweather website was replaced with an Agriculture section within the Mesonet.org website. A Cattle Comfort Advisor, using solar radiation, wind, and relative humidity to adjust air temperature, replaced traditional cattle heat and cold stress models. Plant Available Water maps were added that estimate soil column water in inches. Mesonet Long-Term Averages Maps and Graphs were created to provide interactive tools that can be used to assess any Mesonet data set by days, months or years against 15-year averages.
Results
The informal feedback from the Oklahoma agricultural community continues to be very complimentary of the Oklahoma Mesonet. Farmers and ranchers turn to the Mesonet to monitor rainfall and soil moisture. To minimize drift hazard, they use the Mesonet Drift Risk Advisor. Monitoring soil temperature has taken on increasing importance with the dramatic climb in seed costs. Growers monitor current and forecast relative humidity to determine good times to bale hay or harvest crops. An estimated 60% of agriculture producers and 80% of industry professionals in Oklahoma are using smartphones. This makes the Mesonet Android and iPhone apps important tools for delivering the latest weather information to those in the agriculture community. Close to 70% of the people we visit with at farm shows ask us to show them how to download the Mesonet apps on to their smartphone or mention they already have the app. One producer noted how he used Mesonet to know if a far away field received rain or not. Knowing rainfall amounts lets him avoid wasted trips. A wasted trip means lost revenue, time and unnecessary emissions. A hay producer stated he uses the Mesonet to monitor humidity changes
for hay baling, without having to drive to the field. This producer not only saves time and money, the Mesonet allows him to monitor the field conditions from home and get more sleep. This better rested farmer is a safer farmer. Near Willow, OK a producer used 10 and 24-inch soil moisture to decide not to plant dry land cotton. He saved the input costs and reduced his financial risk. Mark Hodges, past Executive Director for the Oklahoma Wheat Commission, has used Oklahoma Mesonet soil moisture and rainfall maps to build customer relations with international grain buyers of Oklahoma wheat. While Mr. Hodges has not put a direct value on Oklahoma Mesonet data, he has stated that Mesonet information has been part of Oklahoma grain sellers marketing millions of bushels of wheat over multiple years to buyers in Mexico. Mesonet serves agricultural and horticultural enterprises on several levels. Dennis Brigham of Bentley Turf Farms told how he used weather information on the older Mesonet Agweather to help him schedule sod installation by his company?s installation crews. One day north of Mustang, a Bentley Turf Farms? crew was busy laying sod, while to the southwest a severe storm cell spawned a tornado. Mr. Brigham used the radar on the Mesonet Agweather website to track a tornadic storm cell and direct a crew in the path of the storm to a safer location. An economic survey completed by OU graduate student Kim Klockow using recognized economic analysis techniques, estimated that the 10% of Oklahoma crop land being managed with Oklahoma Mesonet data saved $8 million in production costs in 2008. Miss Klockow was only able to survey crop producers. This estimated value did not include the Mesonet value to livestock producers for that year.
4. Associated Knowledge Areas
KA Code
Knowledge Area
111
Conservation and Efficient Use of Water
121
Management of Range Resources
123
Management and Sustainability of Forest Resources
132
Weather and Climate
134
Outdoor Recreation
205
Plant Management Systems
Outcome #10
1. Outcome Measures
Wildlife exposure to aflatoxins through supplemental feeding
2. Associated Institution Types
● 1862 Research
3a. Outcome Type:
Change in Knowledge Outcome Measure
3b. Quantitative Outcome
Year
Actual

2013
0
3c. Qualitative Outcome or Impact Statement
Issue (Who cares and Why)
Upland game bird hunting is a multi-million dollar industry that is steeped in tradition. Arguably the most popular quarry is Northern Bobwhite (quail), but a long-term, idiopathic decline in populations across the species' range has eroded hunting opportunities for quail and raised concern for its long-term persistence. Many hypotheses have been evaluated to explain the quail decline, which has been determined to be the most persistent and rapid of any North American bird species. Habitat loss and fragmentation appears to play the most prominent role in the decline, but research suggests that other factors contribute as well, and land managers are interested in anything they can do to improve conditions for quail. One potential source of mortality for quail comes from poisoning via aflatoxins, a family of secondary metabolites produced by fungi in the genus Aspergillus. These fungi can grow on a wide variety of cereal grains and produce the deadly aflatoxins. The FDA regulates aflatoxin concentrations in foods destined for consumption by humans and livestock. For example, interstate transport of grains exceeding 20 ppb of aflatoxin is prohibited. There is, however, no standard for wildlife feed so grain sold as "bird seed" or "wildlife feed" can often far exceed the safety standards in place for humans and livestock, thereby exposing wildlife that consume those grains to aflatoxin poisoning. We were concerned with the possibility that quail are exposed to aflatoxins through the consumption of grain intentionally set out to attract quail or through accidental exposure through the far more common practice of setting out grain to attract white-tailed deer. We additionally sought to determine characteristics of feeding operations that are the most likely to result in aflatoxin development on supplemental feed.
What has been done
We investigated a potential route of exposure to aflatoxin through a series of field trials in which camera traps were deployed at bait stations designed to attract deer. Baited solely with piled, whole corn, we found that quail used bait stations for deer in autumn and winter, with greater reliance on the supplemental food in winter. Although absolute rates of visitation to bait piles were low in comparison to other wildlife species, relative to the population size (very low for quail in the study area) the exposure rate is likely to be significant. The primary aim of this work has been a laboratory investigation of the conditions that promote aflatoxin development on grain that has been supplied to wildlife. We considered grain type (whole corn or milo), temperature, moisture, duration of environmental exposure, and disposition (i.e., whether the grains are scattered or piled). Beginning with grains from which no aflatoxin could be detected, we found that aflatoxins developed on nearly all samples by the end of the 4-week trails. In some cases, aflatoxin concentrations far exceeded limits allowable for humans and livestock, as well as levels known to be detrimental to quail. Milo was much less likely to develop lethal concentrations of aflatoxin than was corn, and only when piled and wet did aflatoxin concentrations rise to dangerous levels on milo. From this research, we have identified themes that will be developed into best practices for wildlife feeding. We recommend that milo be offered instead of corn, that it be spread instead of piled, and that it be collected and discarded if unconsumed after four weeks. This project was conducted by Leah Dale and Tim O'Connell in the department of Natural Resource Ecology and Management (NREM) at Oklahoma State University, with significant assistance from Adam Gourley of the Oklahoma Agricultural Experiment Station (OAES) and Ryan Lerch from the Oklahoma Department of Agriculture, Food and Forestry (ODAFF).
Results
Field trials and greenhouse studies in this project took place exclusively on lands and in facilities managed by the OAES, and with administrative support from the Oklahoma Cooperative Fish and Wildlife Research Unit in NREM. We are specifically collaborating on this project with the Oklahoma Department of Wildlife Conservation (ODWC). During 2013, we delivered poster and oral presentations of this work to a dedicated workshop for the ODWC, to the Kansas Natural Resources Conference, and to the Oklahoma Ornithological Society. The information has thus been shared with a wide spectrum of wildlife professionals, researchers, and interested private citizens in Oklahoma, Texas, and Kansas. To date, the relevance of the study information has been regional in the Southern Plains. This region is a stronghold for remaining populations of Northern Bobwhite as well as a region in which supplemental feeding for deer is a common and widespread practice. As information from our study disseminates, we expect it to spur changes in the way people choose to provide supplemental food to wildlife and ultimately reduce a potentially important cause of mortality in quail.
4. Associated Knowledge Areas
KA Code
Knowledge Area
135
Aquatic and Terrestrial Wildlife
Outcome #11
1. Outcome Measures
Bird collision mortality at U.S. wind facilities
2. Associated Institution Types
● 1862 Research
3a. Outcome Type:
Change in Knowledge Outcome Measure
3b. Quantitative Outcome
Year
Actual
2013
0
3c. Qualitative Outcome or Impact Statement
Issue (Who cares and Why)
Wind energy is a promising alternative to fossil fuels, but the impacts of wind facilities on wildlife remain unclear. Previous estimates of bird collision mortality at wind turbines do not distinguish between old generation lattice turbines and new generation monopole turbines (which now comprise the vast majority of U.S. turbines). Additionally, wind facility-scale correlates of collision rates have not been investigated. We derived an estimate of bird mortality for U.S. monopole turbines. In addition, we examined how bird mortality varies among different turbine sizes and across broad regions of the U.S. as a way to assist broad-scale decisions about where to develop wind energy and what types of turbines to install.
What has been done

We published the results of our analysis, which was based on the novel approach of combining bird collision mortality data from 60 previously conducted studies that span the U.S. Our general findings were that annual collision mortality at U.S. wind turbines is estimated to be between 140,000 and 328,000 birds, that per turbine morality rates increase greatly with increasing turbine height, and that mortality varies across broad U.S. regions, with lowest mortality in the Great Plains. We delivered an oral presentation of these findings at a national working group meeting (USGS Wind Energy Impacts Assessment Methodology Working Group), and a paper was published in the international peer-reviewed journal Biological Conservation. Data compiled for this analysis are also being used in collaboration with USGS ecologists to understand species-level risks of bird-turbine collisions. Data are also being linked to a recently released USGS map and database that includes locations and specifications for every U.S. wind turbine; this will allow for identification of turbine-level correlates of mortality. A research grant has been awarded by USGS to conduct follow-up research to assess correlates of bat collision mortality, to contribute data to efforts assessing impacts of turbine collision mortality on bat population dynamics, and to assess biases associated with data used in the above analyses.
Results
Our results will be used by the U.S. Fish and Wildlife Service in their planning and risk prioritization process for migratory and non-migratory birds. In addition findings from the completed analyses and follow-up studies will be used by the U.S. Geological Survey to develop their methodology for addressing the impacts of onshore wind energy development in the U.S.Additionally, we expect that our finding of relatively low rates of bird-turbine collision mortality in the Great Plains region may inform broad-scale siting decisions for future wind energy developments. These decisions will have ecosystem-scale implications related to patterns of land use. Our completed and continuing research will have national impact, as illustrated by the use of our findings by federal agencies, including the U.S. Geological Survey and the U.S. Fish and Wildlife Service. In addition, given rapid wind energy development in Oklahoma and the southern Great Plains, these results may be of particular interest and use in this region. Evidence of the local, regional, and national impact of this work is provided by the coverage of our Biological Conservation paper by numerous media outlets, including at least 8 Oklahoma newspapers, Oklahoma websites and radio stations, regional newspapers (The Journal Record, The High Plains Journal), and national outlets (Smithsonian.com, American Bird Conservancy, National Geographic, NPR affiliate in Los Angeles, California).
4. Associated Knowledge Areas
KA Code
Knowledge Area
135
Aquatic and Terrestrial Wildlife

Outcome #12
1. Outcome Measures
Assessing Functions and Ecosystem Services Provided by the Wetlands Reserve Program in Oklahoma
2. Associated Institution Types
● 1862 Extension
● 1862 Research
3a. Outcome Type:
Change in Knowledge Outcome Measure
3b. Quantitative Outcome
Year
Actual
2013
0
3c. Qualitative Outcome or Impact Statement
Issue (Who cares and Why)
Because of the ecological and economic benefits provided by wetlands, many state and federal agencies along with public and private organizations throughout the U.S. have worked together to reverse the decline in wetland acreage. One program that has played an important role in reversing the loss of wetlands in the U.S. and providing important benefits to private landowners is the Wetlands Reserve Program (WRP), which was established by the 1990 Farm Bill. The WRP is a voluntary program administered through U.S. Department of Agriculture?s Natural Resources Conservation Service (NRCS) that encourages private landowners to protect, restore, and enhance wetland ecosystems through enrolling eligible lands in permanent easements, 30-year easements, and wetland restoration cost-share agreements. Since implementation of the WRP in 1990, >7,800 WRP projects have been developed on >600,000 ha in the U.S. (NRCS 2009). In Oklahoma, 205 projects and approximately 25,000 ha of wetlands have been enrolled in the WRP since 1996. Many of these projects involve restoration of wetlands on agricultural lands deemed marginally productive. Although the WRP has contributed significantly to increasing the overall wetland acreage in the U.S., it is not clear how effective it has been at restoring fully functional wetlands that provide ecosystem goods and services that are comparable to reference wetlands. Given the extensive nature of the WRP as well as the cost of the program (e.g., Oklahoma was allocated $10 million for the WRP in 2010), it is imperative that wetland restorations established under the WRP increase and sustain wetland functions on the landscape. Currently, few efforts have been made to evaluate the efficacy of the WRP at restoring wetland functions and services that are necessary to maintain sustainable wetland ecosystems. The focus of this research has been to monitor and evaluate the functions and services provided by WRP wetlands in Oklahoma to assist the NRCS in meeting their mission as well as assist landowners with recommendations to better enhance their WRP wetlands.
What has been done
We have continued monitoring the progress of WRP wetlands throughout the state and report our

findings to NRCS and private landowners. We scheduled wetland training sessions with NRCS personnel and private landowners throughout the state in 2013, but widespread drought forced the cancellation of these events. We are planning to conduct the training sessions in 2014. We recently received funding from the NRCS to evaluate the use of prescribed fire to reduce occurrence and abundance of invasive plants in WRP wetlands and enhance growth and establishment of preferred wetlands plants. This research will be initiated in 2014.
Results
The NRCS has begun modifying some of their restoration and management practices (e.g., employing moist-soil management, time drawdowns to create optimal conditions for wetland plant establishment, and incorporating prescribed burning into management guidelines) of WRP to better enhance the functions and services provided by these wetlands. Our reports have been used by NRCS and private landowners to better track the development of these restorations. State and federal natural resource agencies and private landowners are the target audiences for this project. Results from these projects will allow government agencies such as Natural Resource Conservation Service, Oklahoma Department of Wildlife Conservation, Oklahoma Conservation Commission, Oklahoma Water Resource Board, and U.S. Environmental Protection Agency to better manage and conserve natural resources and develop sound conservation and management strategies. Specifically, this work will provide guidance to these agencies as the state begins implementing its Wetland Conservation Program. Moreover, this research emphasizes the important instrument the WRP program is at meeting the federal government?s mandate of ?no net loss? of wetlands nationally. Finally, information from this work will provide guidance to private landowners about the important functions of wetlands and the guidance on how to better protect these valuable resources.
4. Associated Knowledge Areas
KA Code
Knowledge Area
112
Watershed Protection and Management
135
Aquatic and Terrestrial Wildlife
136
Conservation of Biological Diversity
Outcome #13
1. Outcome Measures
Assessment of current and future states of Oklahoma forests with respect to biomass and carbon sequestration.
2. Associated Institution Types
● 1862 Research
3a. Outcome Type:
Change in Knowledge Outcome Measure
3b. Quantitative Outcome
Year
Actual
2013
0
3c. Qualitative Outcome or Impact Statement
Issue (Who cares and Why)
Methods for assessing current and future states of Oklahoma forests are needed for many purposes, including assessment of stored carbon. We enhanced data collection in a series of permanent forest growth plots to develop improved methods for inventorying biomass in Oklahoma and U.S. forests.
What has been done
Data collection continued on the 25-year remeasurement of over 200 plots in a natural, even-aged, shortleaf pine growth study. We sampled carbon in soils, understory vegetation and the forest floor, as well as in standing trees. We used dendrochronology to correlate ice storm occurrence and other climate data with tree ring data from shortleaf pine forests. We modeled forest growth to weather and climate variables, and to the understory dynamics of shortleaf pine forests. We developed new forest inventory methods for random samples of tree dimensions and, in plantations, by modifying row sampling. In 2013, 2 peer-reviewed journal articles were accepted for publication and 6 were published in the proceedings of professional conferences. We delivered 5 poster and 3 oral presentations at three separate, regional conferences in 2013.
Results
Improved models for growth of the shortleaf pine overstory and understory can help forest managers forecast carbon storage in the forests and the effects of management practices on carbon storage and other outputs of shortleaf pine forests. New sampling techniques that apply importance sampling can lead to more accurate forest sampling that is not subject to bias from volume tables. This can assist inventories for forest carbon storage. New row sampling methods for forest plantations can help to obtain more efficient inventories for these forests, including the carbon stored in these forests.
4. Associated Knowledge Areas
KA Code
Knowledge Area
123
Management and Sustainability of Forest Resources
Outcome #14
1. Outcome Measures
Prescribed Burn Associations
2. Associated Institution Types
● 1862 Extension
3a. Outcome Type:
Change in Condition Outcome Measure
3b. Quantitative Outcome
Year
Actual
2013
18
3c. Qualitative Outcome or Impact Statement

Issue (Who cares and Why)
The lack of fire has been a major contributor to the increase of woody plant species, especially juniper species, throughout the Great Plains. There are several reasons landowners in this region do not use fire, the main four are liability, lack of knowledge or training, lack of labor and limited amounts of equipment.
What has been done
To address this lack of fire use from local to national levels, we developed prescribed burn associations that enable landowners to safely and effectively conduct prescribed burns and better manage their lands. Since this work began there have been 18 prescribed burn associations (PBA) started in 35 Oklahoma counties, with 350 members statewide. The work initiated in Oklahoma has also spread to Texas, Kansas, Nebraska, Mississippi, and Illinois. A recent (2012) survey revealed 55 PBAs in the Great Plains with three others in Mississippi (1) and Illinois (2). This survey also showed that 27 of the PBAs had safely conducted 1,094 burns on almost 500,000 acres since the late 1990s. OSU NREM has also been instrumental in the development of the Oklahoma Prescribed Burn Association, a statewide organization that has been established to assist existing PBAs and develop new ones in OK. They have partnered with 1 federal agency, 4 state agencies and 4 private groups to establish this organization. This statewide effect in OK has led to establishment of state associations in Texas and Kansas, with Nebraska attempting to start one as well. The increased interest and activity of burn associations has also started a regional group working on PBA issues, the Alliance of Prescribed Burn Associations, with members from OK, TX, KS, and NE. OSU NREM has been invited to speak in other states about the importance and effectiveness of PBAs, these other states include, Missouri, Montana, New Mexico, Florida, and Iowa. We have also sent information about PBAs to 10 other states and two Canadian provinces.
Results
Prescribed burn associations in the Great Plains have safely and effectively conducted 1,094 burns on 500,000 acres of private lands. There are currently 61 PBAs in seven states, with five more states looking to start PBAs. This effort as launched the formation of three state PBAs and a regional alliance.
4. Associated Knowledge Areas
KA Code
Knowledge Area
121
Management of Range Resources
135
Aquatic and Terrestrial Wildlife
136
Conservation of Biological Diversity
205
Plant Management Systems
V(H). Planned Program (External Factors)
● Natural Disasters (drought, weather extremes, etc.)
● Economy
● Appropriations changes
● Public Policy changes
● Government Regulations
● Competing Public priorities
● Competing Programmatic Challenges
Brief Explanation

Drought continues to have prolonged effects and late 2013 saw the beginning of another droughty period.
This has impacted the interest in drought and weather and climate forecasts. Long-term drought conditions
have increased the concern of fire outbreaks.
During this time period there has been political attention on climate issues from both ends of the political
spectrum, i.e. climate concerns as an issue to be dealt with and learn about versus climate concerns not important
due to lack of respect for the science. This has created debate more focused on whether climate changes are an
issue deserving action and resource allocation, rather than how best to handle climate variability through
mitigation and/or adaptation.
Lack of a Farm Bill slowed numerous natural resources programs and this may continue post farm bill
pasasage.
V(I). Planned Program (Evaluation Studies)
Evaluation Results
A recent study from researchers at the University of Arkansas highlights water quality improvements within
the Illinois River watershed. Researchers examined in-stream P concentration data spanning from 1997 to 2009
within the Illinois River watershed. Results showed that flow-adjusted P concentrations have been decreasing
since 2003 in the Illinois River at Arkansas Highway 59, at Watts, Oklahoma and further downstream at
Tahlequah, Oklahoma. These decreases are tied to the reductions in waste water treatment effluent P, which
occurred in 2002. However, changes in agricultural management practices are also likely responsible for P
reductions and include: exporting the majority of poultry litter outside nutrient sensitive watersheds,
implementation of best management practices, strict regulations related to land application of manure and
mandatory manure management education for poultry producers and manure applicators. The PWME program
continues to assist producers by providing outreach efforts addressing each of these practices.
Key Items of Evaluation

V(A). Planned Program (Summary)
Program # 6
1. Name of the Planned Program
Food Safety - Food Processing, Product Storage, and Food and Product Safety
Reporting on this Program
V(B). Program Knowledge Area(s)
1. Program Knowledge Areas and Percentage
KA Code
Knowledge Area %1862 Extension
%1890 Extension
%1862 Research
%1890 Research
216 Integrated Pest Management Systems 4% 5%
401 Structures, Facilities, and General Purpose Farm Supplies
15% 5%
403 Waste Disposal, Recycling, and Reuse 8% 5%
501 New and Improved Food Processing Technologies
20% 10%
502 New and Improved Food Products 8% 10%
503 Quality Maintenance in Storing and Marketing Food Products
8% 10%
701 Nutrient Composition of Food 4% 10%
711
Ensure Food Products Free of Harmful Chemicals, Including Residues from Agricultural and Other Sources
11% 10%
712
Protect Food from Contamination by Pathogenic Microorganisms, Parasites, and Naturally Occurring Toxins
12% 25%
723 Hazards to Human Health and Safety 10% 10%
Total 100% 100%
V(C). Planned Program (Inputs)
1. Actual amount of FTE/SYs expended this Program
Year: 2013 Extension Research
1862 1890 1862 1890
Plan 1.3 0.0 5.0 0.0
Actual Paid Professional 3.0 0.0 3.8 0.0
Actual Volunteer 0.1 0.0 0.0 0.0
2. Actual dollars expended in this Program (includes Carryover Funds from previous years)

Extension Research
Smith-Lever 3b & 3c 1890 Extension Hatch Evans-Allen
50000 0 169725 0
1862 Matching 1890 Matching 1862 Matching 1890 Matching
50000 0 169725 0
1862 All Other 1890 All Other 1862 All Other 1890 All Other
830000 0 965450 0
V(D). Planned Program (Activity)
1. Brief description of the Activity
Food Safety: • Conduct research on preventing contamination of foods with pathogenic microorganism during production, processing, storage, distribution, and/or consumer use. • Conduct research on eliminating or reducing the numbers of potential pathogenic microorganisms in foods during production, processing, storage, distribution, and/or consumer use. • Conduct research on detecting contamination of foods with pathogenic microorganisms. • Conduct research on detecting microbial toxins in foods. • Conduct research on detecting undeclared allergens in foods. • Provide technical information and assistance to food industry and/or consumers to determine safe food production, food processing, and/or food handling procedures. • Conduct food safety workshops designed to provide certification in recognized food safety systems such as Hazard Analysis Critical Control Points (HACCP). • Disseminate food safety recommendations to industry and consumers via popular press, fact sheets, eXtension publications, web-based outreach, workshops, and/or peer-reviewed journal articles. Food Processing: • Conduct research on improving or maintaining the quality of processed foods. • Conduct research on developing profitable new food products and food processing technology. • Conduct research on maximizing the efficiency and sustainability of food processing operations. • Conduct research on improving the healthfulness and nutritional value of processed food products. • Conduct research on evaluating the economic feasibility of food processing activities. • Provide technical information and assistance related to processing, analyzing the chemical and physical properties, and improving or maintaining the quality of processed food products. • Provide technical information and assistance related to food product formulationand new food product development. • Provide technical information and assistance related to selection and evaluation of processing technology • Provide technical information and assistance related to food process evaluation. • Provide technical information and assistance related to processed-food business economic planning and product marketing. • Serve as a resource to help commercial food processors recognize and comply with applicable food product processing and labeling regulations. • Disseminate recommendations for food processing industry best practices via popular press, fact sheets, eXtension publications, web-based outreach, workshops, and/or peer-reviewed journal articles.

Product Storage •Conduct research that evaluates agricultural product storage and handling technologies with the aim of improving quality, safety, and costs. Provide technical applications, demonstrations and education for grain and food storage providers and handlers.
2. Brief description of the target audience
food processors; handlers, manufacturers, and marketers of grain, feed and food; food safety regulators;
3. How was eXtension used?
The Food Safety and Small Meat Processors Resource Areas were monitored for information regarding emerging issues of concern.
V(E). Planned Program (Outputs)
1. Standard output measures
2013 Direct Contacts
Adults Indirect Contacts
Adults Direct Contacts
Youth Indirect Contacts
Youth
Actual 0 0 0 0
2. Number of Patent Applications Submitted (Standard Research Output)
Patent Applications Submitted
Year: 2013
Actual: 0
Patents listed
3. Publications (Standard General Output Measure)
Number of Peer Reviewed Publications
2013 Extension Research Total
Actual 9 32 41
V(F). State Defined Outputs
Output Target
Output #1
Output Measure
● Number of conferences and other extension outreach presentations
Year Actual
2013 95
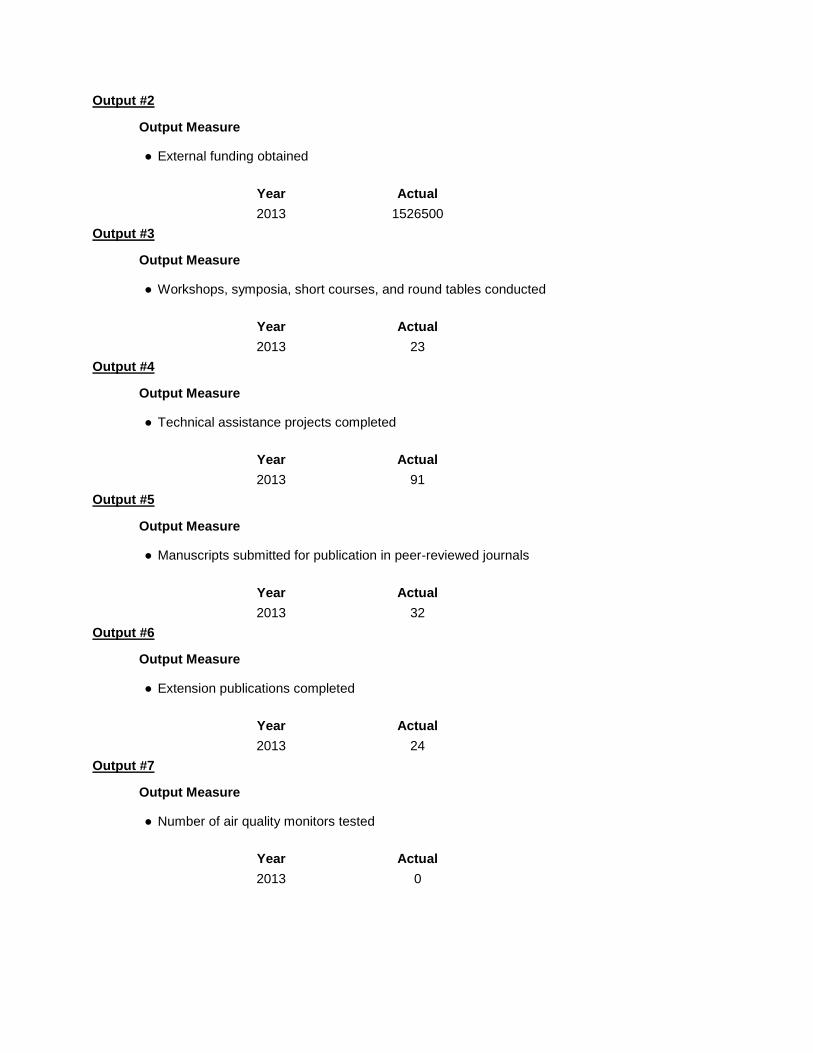
Output #2
Output Measure
● External funding obtained
Year Actual
2013 1526500
Output #3
Output Measure
● Workshops, symposia, short courses, and round tables conducted
Year Actual
2013 23
Output #4
Output Measure
● Technical assistance projects completed
Year Actual
2013 91
Output #5
Output Measure
● Manuscripts submitted for publication in peer-reviewed journals
Year Actual
2013 32
Output #6
Output Measure
● Extension publications completed
Year Actual
2013 24
Output #7
Output Measure
● Number of air quality monitors tested
Year Actual
2013 0
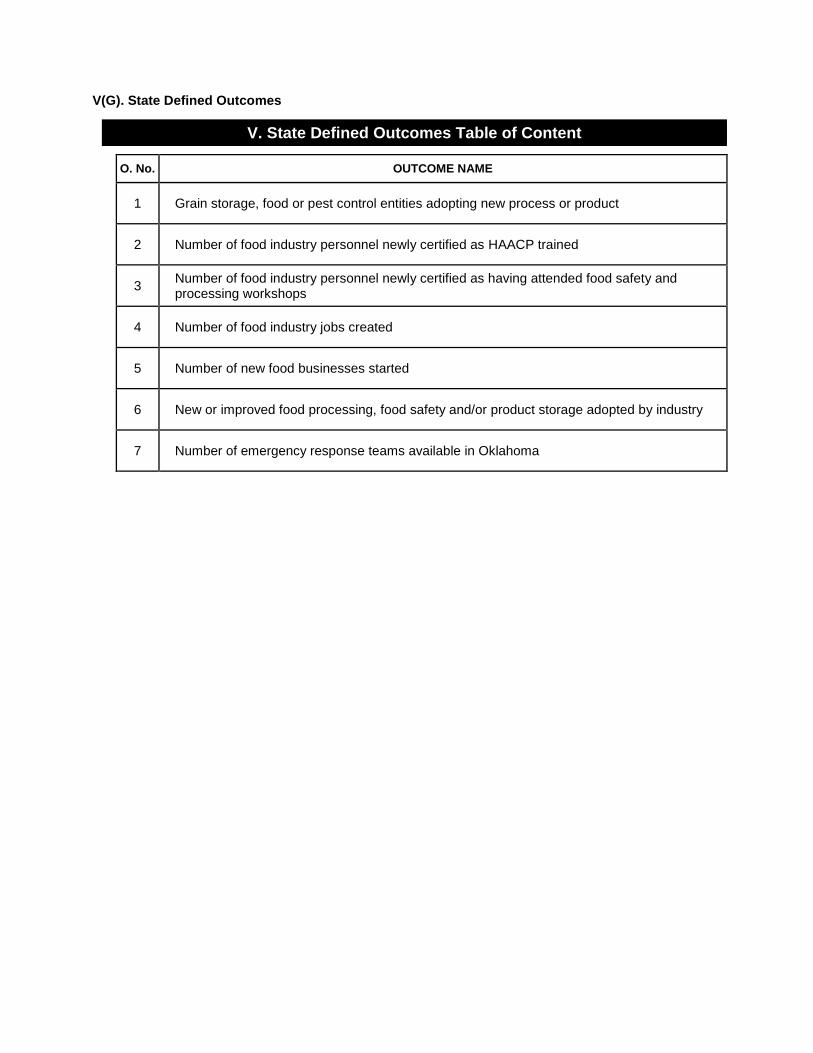
V(G). State Defined Outcomes
V. State Defined Outcomes Table of Content
O. No. OUTCOME NAME
1 Grain storage, food or pest control entities adopting new process or product
2 Number of food industry personnel newly certified as HAACP trained
3
Number of food industry personnel newly certified as having attended food safety and processing workshops
4 Number of food industry jobs created
5 Number of new food businesses started
6 New or improved food processing, food safety and/or product storage adopted by industry
7 Number of emergency response teams available in Oklahoma

Outcome #1
1. Outcome Measures
Grain storage, food or pest control entities adopting new process or product
2. Associated Institution Types
● 1862 Extension
● 1862 Research
3a. Outcome Type:
Change in Action Outcome Measure
3b. Quantitative Outcome
Year
Actual
2013
15
3c. Qualitative Outcome or Impact Statement
Issue (Who cares and Why)
Fumigation applicators are fumigating without adequately monitoring the air in the bin and around the bin during and after application of a very toxic product.
What has been done
We provided workshops on gas monitoring equipment and the calibration and maintenance of this equipment.
Results
Fifteen facilities have purchased new gas monitors and given the employees instructions on how to use these monitors.
4. Associated Knowledge Areas
KA Code
Knowledge Area
216
Integrated Pest Management Systems
401
Structures, Facilities, and General Purpose Farm Supplies
503
Quality Maintenance in Storing and Marketing Food Products
723
Hazards to Human Health and Safety
Outcome #2
1. Outcome Measures
Number of food industry personnel newly certified as HAACP trained
2. Associated Institution Types
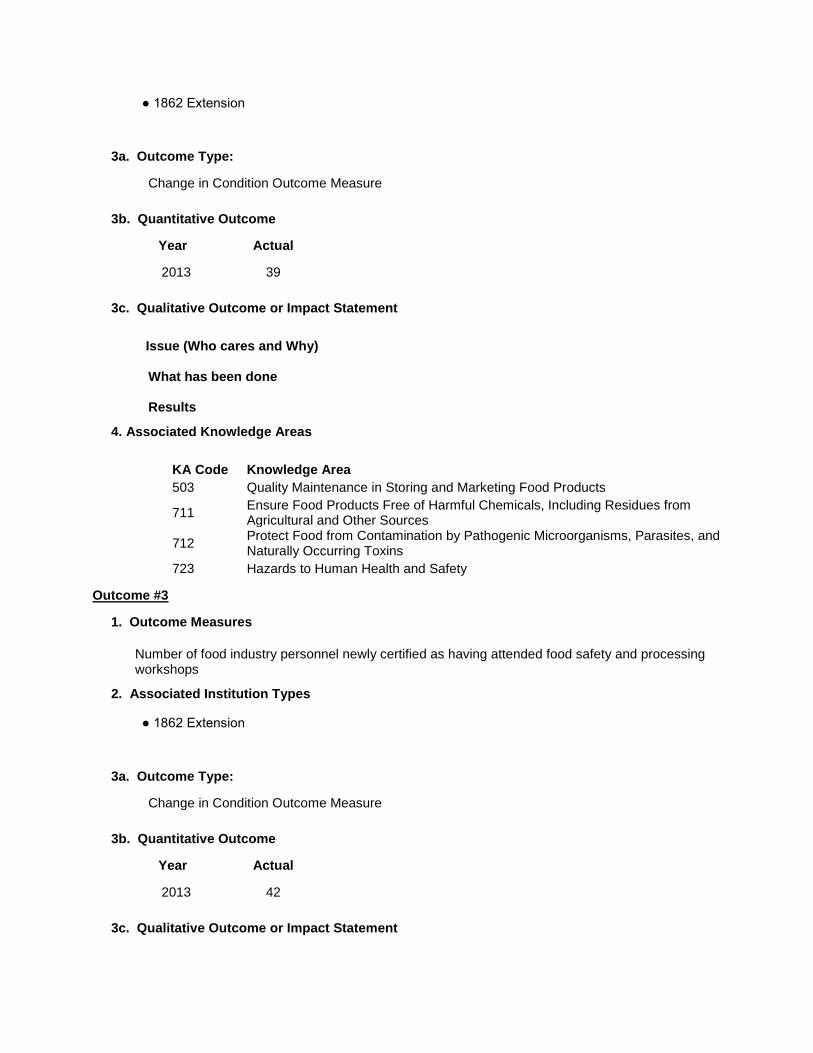
● 1862 Extension
3a. Outcome Type:
Change in Condition Outcome Measure
3b. Quantitative Outcome
Year
Actual
2013
39
3c. Qualitative Outcome or Impact Statement
Issue (Who cares and Why)
What has been done
Results
4. Associated Knowledge Areas
KA Code
Knowledge Area
503
Quality Maintenance in Storing and Marketing Food Products
711
Ensure Food Products Free of Harmful Chemicals, Including Residues from Agricultural and Other Sources
712
Protect Food from Contamination by Pathogenic Microorganisms, Parasites, and Naturally Occurring Toxins
723
Hazards to Human Health and Safety
Outcome #3
1. Outcome Measures
Number of food industry personnel newly certified as having attended food safety and processing workshops
2. Associated Institution Types
● 1862 Extension
3a. Outcome Type:
Change in Condition Outcome Measure
3b. Quantitative Outcome
Year
Actual
2013
42
3c. Qualitative Outcome or Impact Statement
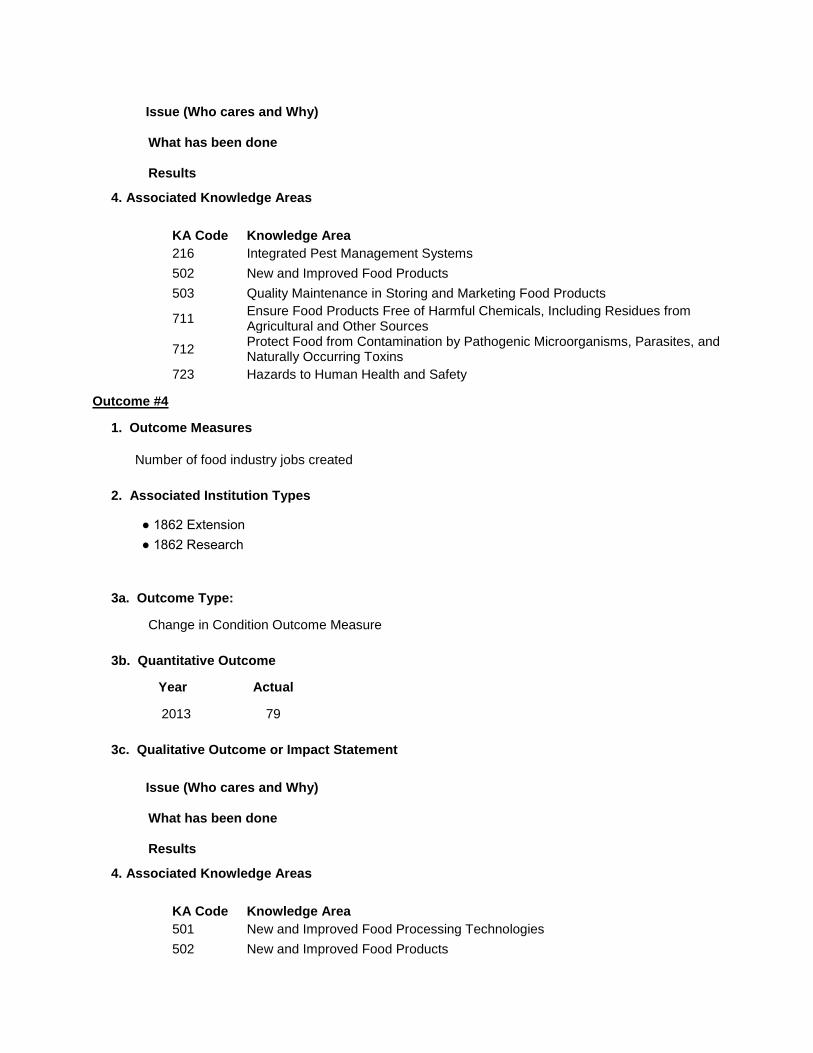
Issue (Who cares and Why)
What has been done
Results
4. Associated Knowledge Areas
KA Code
Knowledge Area
216
Integrated Pest Management Systems
502
New and Improved Food Products
503
Quality Maintenance in Storing and Marketing Food Products
711
Ensure Food Products Free of Harmful Chemicals, Including Residues from Agricultural and Other Sources
712
Protect Food from Contamination by Pathogenic Microorganisms, Parasites, and Naturally Occurring Toxins
723
Hazards to Human Health and Safety
Outcome #4
1. Outcome Measures
Number of food industry jobs created
2. Associated Institution Types
● 1862 Extension
● 1862 Research
3a. Outcome Type:
Change in Condition Outcome Measure
3b. Quantitative Outcome
Year
Actual
2013
79
3c. Qualitative Outcome or Impact Statement
Issue (Who cares and Why)
What has been done
Results
4. Associated Knowledge Areas
KA Code
Knowledge Area
501
New and Improved Food Processing Technologies
502
New and Improved Food Products

Outcome #5
1. Outcome Measures
Number of new food businesses started
2. Associated Institution Types
● 1862 Extension
● 1862 Research
3a. Outcome Type:
Change in Condition Outcome Measure
3b. Quantitative Outcome
Year
Actual
2013
23
3c. Qualitative Outcome or Impact Statement
Issue (Who cares and Why)
NuCare Nutrition (NN, nucare.com) is an established vitamin/supplement company located in Kingfisher. NN has historically provided clients with private-label, custom-blended nutritional supplements like protein powder, glutamine tablets, and weight-loss powders. NN got their start in the business by using contract packers to make product for their clients. As time progressed, they realized that they could increase their profits and improve product quality if they made the products themselves. NN contacted the FAPC for assistance in starting their own processing facility.
What has been done
Tim Bowser, Jason Young, Darren Scott, Erin Johnson, Jake Nelson and Guadalupe El Rassi visited with the client at the FAPC to discuss potential needs. Some of the team also visited the NN facility to review plans and make recommendations. Assistance has been through team and individual response from the FAPC over a period of six months and included: product safety plans, quality plans, equipment and process recommendations, cleaning recommendations, formulation suggestions, label reviews, dust control, and more.
Results
The new facility is up and running in Kingfisher and has resulted in approximately four new jobs, with more business and additional jobs likely in the near future.
4. Associated Knowledge Areas
KA Code
Knowledge Area
501
New and Improved Food Processing Technologies
502
New and Improved Food Products
503
Quality Maintenance in Storing and Marketing Food Products

Outcome #6
1. Outcome Measures
New or improved food processing, food safety and/or product storage adopted by industry
2. Associated Institution Types
● 1862 Extension
● 1862 Research
3a. Outcome Type:
Change in Action Outcome Measure
3b. Quantitative Outcome
Year
Actual
2013
87
3c. Qualitative Outcome or Impact Statement
Issue (Who cares and Why)
Backwoods Foods (BF) is an established food company located near Tahlequah that the FAPC has been working with since 1998. BF is a ?co-packer? that specializes in manufacturing high-acid or acidified foods (e.g. salsa, barbecue sauce, pickles) for about 45 clients around the U.S. Recently BF has outgrown their existing 8,400 sq. ft. facility and a new 24,000 sq. ft. building and equipment is proposed.
What has been done
Tim Bowser has helped to identify and size equipment for the new facility including a steam boiler, steam kettles, piping, and lighting.
Results
The new facility (24,000 sq. ft.) is slated for construction in the Tahlequah Industrial Park and is expected to generate 40 new jobs. Construction will start in 2014.
4. Associated Knowledge Areas
KA Code
Knowledge Area
216
Integrated Pest Management Systems
401
Structures, Facilities, and General Purpose Farm Supplies
403
Waste Disposal, Recycling, and Reuse
501
New and Improved Food Processing Technologies
502
New and Improved Food Products
503
Quality Maintenance in Storing and Marketing Food Products
701
Nutrient Composition of Food
711
Ensure Food Products Free of Harmful Chemicals, Including Residues from Agricultural and Other Sources
712
Protect Food from Contamination by Pathogenic Microorganisms, Parasites, and

Naturally Occurring Toxins
723
Hazards to Human Health and Safety
Outcome #7
1. Outcome Measures
Number of emergency response teams available in Oklahoma
2. Associated Institution Types
● 1862 Extension
3a. Outcome Type:
Change in Action Outcome Measure
3b. Quantitative Outcome
Year
Actual
2013
4
3c. Qualitative Outcome or Impact Statement
Issue (Who cares and Why)
Grain storage is a very dangerous work environment. Yearly as many as 30 deaths are caused in the US involving workers of the grain storage industry.
What has been done
Training, training opportunities and training programs have been developed to reach first responder groups. Regional first responder technicians have been established and trained for grain industry accidents.
Results
Four teams are available in Oklahoma now, one in each quadrant of the state.
4. Associated Knowledge Areas
KA Code
Knowledge Area
723
Hazards to Human Health and Safety

V(H). Planned Program (External Factors)
● Natural Disasters (drought, weather extremes, etc.)
● Economy
● Appropriations changes
● Public Policy changes
● Government Regulations
● Competing Public priorities
● Competing Programmatic Challenges
● Populations changes (immigration, new cultural groupings, etc.)
Brief Explanation
Weather extremes cause more grain to go out of condition and a more dangerous work environment results
due to poor quality grain in storage. Limited formula funding has hindered our ability to conduct applied
research and technical assistance projects. In addition, financial and in-kind support from industry partners has
been flat.
V(I). Planned Program (Evaluation Studies)
Evaluation Results
Extension and outreach programs were evaluated based on before and after assessment of student
knowledge
Key Items of Evaluation
Key definitions of major program concepts, e.g. principles of food safety programs such as HACCP.
V(A). Planned Program (Summary)
Program # 7
1. Name of the Planned Program
4-H Youth Development
Reporting on this Program
V(B). Program Knowledge Area(s)
1. Program Knowledge Areas and Percentage
KA Code
Knowledge Area %1862 Extension
%1890 Extension
%1862 Research
%1890 Research
806 Youth Development 100% 0%
Total 100% 0%
V(C). Planned Program (Inputs)
1. Actual amount of FTE/SYs expended this Program
Year: 2013 Extension Research
1862 1890 1862 1890
Plan 63.0 0.0 0.0 0.0
Actual Paid Professional 87.0 0.0 0.0 0.0
Actual Volunteer 60.2 0.0 0.0 0.0
2. Actual dollars expended in this Program (includes Carryover Funds from previous years)
Extension Research
Smith-Lever 3b & 3c 1890 Extension Hatch Evans-Allen
2000000 0 0 0
1862 Matching 1890 Matching 1862 Matching 1890 Matching
2000000 0 0 0
1862 All Other 1890 All Other 1862 All Other 1890 All Other
6000000 0 0 0
V(D). Planned Program (Activity)
1. Brief description of the Activity
VMS - Recruited, oriented and trained adult volunteers to serve as club and project club leaders and to assume leadership on committees who plan and coordinate local and county activity and events. CMS - Increased the number of 4-H project clubs or project groups within community clubs. LCD Impact Team - Recruited and trained teams of youth and adults, who work in partnership to

identify, organize, conduct and evaluate a service learning project which will benefit the community. EE Impact Team - Provided training and materials for initiating and maintaining teams of youth and adults committed to sharing and promoting environmental education concepts through service learning. OMK - Trained and recruited educators and volunteers to create public awareness of issues affecting military families. STEM - Provided training and materials for initiating and maintaining teams of youth and adults committed to sharing and promoting STEM concepts through service learning. All other - Established, developed, and maintained new and ongoing youth development programming, events, and support materials.
2. Brief description of the target audience
Youth, children, parents, teachers, youth and adult volunteers, middle to low income families; race and ethnicity will also be recognized as an identifier of audiences; caretakers, agencies and service providers, schools, policy makers
3. How was eXtension used?
Companion Animal Communities of Practice, eXtension Modules -The focus of this activity is to develop an online resource for companion animal owners and enthusiasts - from dogs and cats to rabbits and guinea pigs - providing unbiased, research-based information and tools. During this year the COP has developed, reviewed, and posted new articles and FAQ's. The COP conducted 5 educational webinars in 2013 that were recorded and made available for public access. Efforts were made to increase the community's social media presence. 21 new videos posted on Youtube, 18,250 reached on Facebook, and 192 followers on Twitter. The COP has also been developing a companion animal video and photo contest for 4-H youth which will be launched the summer of 2014.
V(E). Planned Program (Outputs)
1. Standard output measures
2013 Direct Contacts
Adults Indirect Contacts
Adults Direct Contacts
Youth Indirect Contacts
Youth
Actual 18040 200000 500700 4000200
2. Number of Patent Applications Submitted (Standard Research Output)
Patent Applications Submitted
Year: 2013
Actual: 0
Patents listed
3. Publications (Standard General Output Measure)
Number of Peer Reviewed Publications

2013 Extension Research Total
Actual 94 0 94
V(F). State Defined Outputs
Output Target
Output #1
Output Measure
● Web-delivered curriculum - lessons developed and tested
Year Actual
2013 91
Output #2
Output Measure
● Educational trainings offered for volunteers and staff
Year Actual
2013 271

V(G). State Defined Outcomes
V. State Defined Outcomes Table of Content
O. No. OUTCOME NAME
1 Certified participants will manage local programming
2
Caring and qualified adults will prepare youth for successful lives as community leaders and contributing citizens
3 The number of active 4-H project clubs and project groups.
4 Project curriculum in support of Mission Mandates
5
Youth will develop a well rounded understanding of mental and emotional health obtained through project work and activities which encourage healthy life style choices - camping, recreation, shooting sports, fitness, safety, hobbies and creative pursuits through the arts.
6
Youth and adults work in partnership to identify and solve/resolve community needs and environmental issues through an organized and executed plan of action.
7
Youth will learn to make healthy lifestyle choices through the use of curricula and educational materials.
8 Increased number of collaborations with youth organizations
9
Participant teams will Increase knowledge of Oklahoma natural resources and environmental stewardship.
10
Participants in livestock programs will focus on acceptable animal husbandry practices, demonstrating knowledge about animal health, breeding, production, marketing and meat science while being conscientious about product quality assurance, animal welfare/well-being and protection and effects on the environment.
11
Participants will increase knowledge and awareness of STEM technologies and career opportunities.
12 Participants will increase knowledge and awareness of plants and soil systems.
13 Increase knowledge and awareness of entomology.
14 Companion animal programs will focus on animal welfare and human-animal interaction.
15
Military families receiving support through 4-H partnerships will increase their use of local support networks
Outcome #1
1. Outcome Measures
Certified participants will manage local programming
2. Associated Institution Types
● 1862 Extension
3a. Outcome Type:
Change in Action Outcome Measure
3b. Quantitative Outcome
Year
Actual
2013
111208
3c. Qualitative Outcome or Impact Statement
Issue (Who cares and Why)
The Oklahoma 4-H Youth Development Program strives to serve as many youth as possible with positive youth development programs during the year. Keeping track of the numbers of youth that participate in different delivery modes such as clubs, special interest, school enrichment, camps and afterschool programs has been a challenge for many years. Over the past year and a half, the Oklahoma 4-H Program has been making a change from a locally designed enrollment management program to ACCESS, a program designed and delivered by the National 4-H Council. The implementation of this program has been mostly accomplished, but there are still some training issues to be resolved, and our confidence in the output of this program is yet to be proven.
What has been done
All county and district 4-H staff have been trained in the implementation of the new ACCESS program. Training was provided to individual counties as well as training offered at the district level. All county educators and their support staff have been invited to participate in the training sessions, and have had access to follow-up consultations from the specialist in charge of the ACCESS program.
Results
The ACCESS program was operational by the fall of 2013, so all of the ES-237 results and other numerical data used to report the number of youth involved in specific programs was generated by this program. Results show that total enrollment for the Oklahoma 4-H Program was 111,208 with duplications eliminated. These youth took 172,631 documented 4-H projects or activities during 2013. There were 48.6% male 4-H participants and 51.4% female participants. The report showed 6,455 adult volunteers and 1,534 teen volunteers for the 2013 year. Ten percent of the participants were Hispanic/Latino. Thirty-one percent of the participants represented non-white categories, with an additional five percent listed as undetermined. Participation by place of residence included the following percentages: 22% farm; 33% rural non-farm; 17% Towns and Cities 10,000 to 50,000; 28% in central cities and suburbs of central cities.
4. Associated Knowledge Areas
KA Code
Knowledge Area
806
Youth Development
Outcome #2
1. Outcome Measures
Caring and qualified adults will prepare youth for successful lives as community leaders and contributing citizens
2. Associated Institution Types
● 1862 Extension
3a. Outcome Type:
Change in Action Outcome Measure
3b. Quantitative Outcome
Year
Actual
2013
6455
3c. Qualitative Outcome or Impact Statement
Issue (Who cares and Why)
Youth development programs prepare young people to meet the challenges of adolescence and adulthood through a structured, progressive series of activities and experiences. In turn youth develop social, emotional, ethical, physical and cognitive competencies.
What has been done
County, district and state staff recruit, orient, train, utilize and manage adult volunteers who provide leadership to local, county, district and state programming. Extension professionals work in partnership with volunteers to develop the human, social and political capital of young citizens. County Extension educators reported well over 23,000 contacts where youth and adults were involved in citizenship activities or projects.
Results
4-H Youth Development addressed the broader developmental assets which all children and youth need - such as safe places (879 4-H clubs and 51 short term project groups) and activities (1000+ 4-H events); opportunities for developing good physical and mental health (14,095 youth); marketable skills (20,469 youth); and opportunities for service and civic participation (133,521 volunteer hours of service). Valued at $17.49 per hour for their time that is a $2.3M contribution.
4. Associated Knowledge Areas
KA Code
Knowledge Area
806
Youth Development

Outcome #3
1. Outcome Measures
The number of active 4-H project clubs and project groups.
2. Associated Institution Types
● 1862 Extension
3a. Outcome Type:
Change in Knowledge Outcome Measure
3b. Quantitative Outcome
Year
Actual
2013
930
3c. Qualitative Outcome or Impact Statement
Issue (Who cares and Why)
Record book evaluations indicate that fewer 4-H members are doing work in projects for a sustained period of time. As a result they may be experiencing a decline in life skill development. Furthermore, positive youth development research has shown that youth gain the greatest benefit from an experience when there is long-term contact with a caring and significant adult.
What has been done
Training was done in all 4 Extension Districts for staff regarding their own professional development. Curriculum In-service was conducted for 72 professional educators along with nearly 300 certification and other training sessions for staff and volunteers.
Results
There were over 14,224 youth involved in 875 community and project clubs and 51 short-term project groups 2013. Second year of new 4-H enrollment system is nearly fully implemented which will allow specialists to better communicate with volunteers and parents about specific 4-H opportunities. It will also allow county staff to more effectively sort membership data and to send specific content information to youth enrolled in specific projects. It is hoped that by doing so we will see increased participation and future growth in the number of project clubs operating in the counties. This is important because research has shown that the best opportunities for positive youth development occur when youth have long term relationships with caring and significant adults.
4. Associated Knowledge Areas
KA Code
Knowledge Area
806
Youth Development
Outcome #4
1. Outcome Measures
Project curriculum in support of Mission Mandates
2. Associated Institution Types
● 1862 Extension
3a. Outcome Type:
Change in Knowledge Outcome Measure
3b. Quantitative Outcome
Year
Actual
2013
14
3c. Qualitative Outcome or Impact Statement
Issue (Who cares and Why)
OCES has a goal of providing current research based information to its program users.
What has been done
4-H training was offered for volunteers, staff, and members related to the Health, STEM and leadership mandates via staff in-services, conferences, and workshops
Results
The Oklahoma Get Fit 4 Life curriculum, complete with 9 lessons, is being expanded to include parent take home newsletters for each lesson to enhance the learning and increase parental awareness. The lessons continue to be used extensively by staff and volunteers and are part of the curriculum used by educators and reported in the Health Outcome (Outcome 5). Over 3,000 youth participated in Healthy Living projects as a result of programs supported by the Wal-mart Healthy Living grant. The focus of the grant is to expand nutrition, fitness and healthy living education to underserved youth audiences Animal Science was the focus of two newly developed curricula developed to meet the needs of Oklahoma youth. Veterinary Science and Youth Beef Quality Assurance educate young people to be responsible animal owners and of future career opportunities. A committee has been formed and is actively researching and writing lessons for a new Personal Development curriculum. The curriculum will focus on bring out the best in youth as they learn about themselves and how to lead in their home, school and community.
4. Associated Knowledge Areas
KA Code
Knowledge Area
806
Youth Development
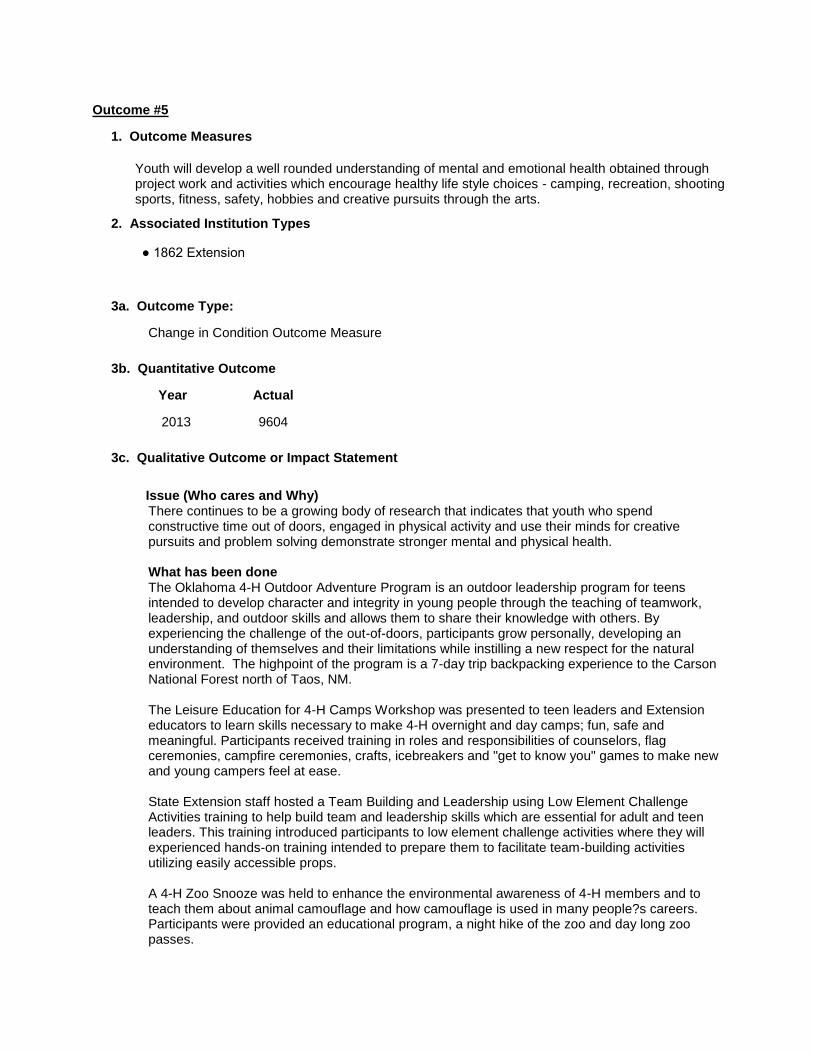
Outcome #5
1. Outcome Measures
Youth will develop a well rounded understanding of mental and emotional health obtained through project work and activities which encourage healthy life style choices - camping, recreation, shooting sports, fitness, safety, hobbies and creative pursuits through the arts.
2. Associated Institution Types
● 1862 Extension
3a. Outcome Type:
Change in Condition Outcome Measure
3b. Quantitative Outcome
Year
Actual
2013
9604
3c. Qualitative Outcome or Impact Statement
Issue (Who cares and Why)
There continues to be a growing body of research that indicates that youth who spend constructive time out of doors, engaged in physical activity and use their minds for creative pursuits and problem solving demonstrate stronger mental and physical health.
What has been done
The Oklahoma 4-H Outdoor Adventure Program is an outdoor leadership program for teens intended to develop character and integrity in young people through the teaching of teamwork, leadership, and outdoor skills and allows them to share their knowledge with others. By experiencing the challenge of the out-of-doors, participants grow personally, developing an understanding of themselves and their limitations while instilling a new respect for the natural environment. The highpoint of the program is a 7-day trip backpacking experience to the Carson National Forest north of Taos, NM. The Leisure Education for 4-H Camps Workshop was presented to teen leaders and Extension educators to learn skills necessary to make 4-H overnight and day camps; fun, safe and meaningful. Participants received training in roles and responsibilities of counselors, flag ceremonies, campfire ceremonies, crafts, icebreakers and "get to know you" games to make new and young campers feel at ease. State Extension staff hosted a Team Building and Leadership using Low Element Challenge Activities training to help build team and leadership skills which are essential for adult and teen leaders. This training introduced participants to low element challenge activities where they will experienced hands-on training intended to prepare them to facilitate team-building activities utilizing easily accessible props. A 4-H Zoo Snooze was held to enhance the environmental awareness of 4-H members and to teach them about animal camouflage and how camouflage is used in many people?s careers. Participants were provided an educational program, a night hike of the zoo and day long zoo passes.

Oklahoma State University 4-H Youth Development was a key partner in the development of ATV Ride Safe Oklahoma. This joint initiative is led by Oklahoma State University Cooperative Extension Service 4-H Youth Development, The Children's Center, and Trauma One Injury Prevention at OU Medical Center. The goal is to provide safety education and injury prevention information as related to all-terrain vehicles (ATVs). Other partners include the Oklahoma State Department of Health, Oklahoma Safe Kids, Tulsa Safe Kids, Polaris Industries, Oklahoma Farm Bureau, Oklahoma Emergency Medical Services for Children and other local/community organizations.
Results
Here is an email excerpt from a parent whose child who participated in the 4-H Outdoor Adventure Program and was recently accepted into the Conserve School in Michigan http://www.conserveschool.org: After Brandon finished his interview during the application process with Conserve School, he told me how much they talked about Brandon?s outdoor experiences. We really believe that the opportunities provided by 4-H played a large role in Brandon?s acceptance to this outdoor/nature focused school. Brandon will be able to take AP Environmental Science, and all his core classes will have a focus on wilderness and nature. He will be doing some backpacking in the Northwoods on weekends, and students participate in a week long wilderness experience, as well as a solo overnight campout. They participate in campus stewardship, and Brandon can choose from a variety of programs including Butterfly Research, (raising, collecting, tagging and testing), invasive Species or working in the Apiary. Almost everything we bought for Outdoor Adventure is also on the supply list, so I am happy we already have all that! Without Outdoor Adventure Brandon would not have had the experiences that very likely placed him ahead of other candidates. Eighty-eight (88) 4-H educators, volunteers and 4-H teen leaders attended the 4-H Leisure Education for 4-H Camps Workshop and learned the basic skills necessary to host a fun and safe 4-H overnight and/or day. Two-hundred-seventy-eight (278) 4-H members and volunteers attended the 4-H Zoo Snooze to enhance their environmental awareness and learn about animal camouflage and how camouflage is used in many people?s careers. Oklahoma 4-H conducted at least 63 state level events, workshops and or encampments that had an education goal of improving participant health. Some had a physical health component, some emotion or social impact, and others were primarily safety oriented. Events include: state shooting sports events, day camps, State 4-H Roundup; reached over 25,000 youth. Additionally about 30 county or multi-county camps were conducted, reaching over 60,000 youth. Oklahoma State University currently has 17 trained educators and volunteers that are ATV Safety Institute licensed instructors to deliver the ATV Safety Institute ATV RiderCourse in each of our four statewide OSU Extension districts. In addition we have 60 plus OSU Extension Educators and 4-H volunteers that are trained to provide community ATV safety education programs to youth and adults. In 2013 we reached over 2,778 youth with two or more hours of classroom ATV safety education, 1,031 plus youth completed the ATV Safety Institute's online ATV Safety E-Course, 460 plus youth completed the national 4-H Treadsylvania ATV Safety online educational game and 100 plus youth received their ATV Safety Institute RiderCourse Certification by completing the 4-5 hour hands-on ATV Safety Institute RiderCourse program taught by our OSU licensed ATV Instructors. Oklahoma had 9 4-H youth participate in the 2013 National ATV Safety PSA "Do the

Ride Thing Contest" receiving three of the nine national awards. Two 2-day 4-H ATV Safety Leader's Guide Curriculum Trainings were held for 24 OSU Extension Educators/Volunteers. During the training the participants completed the ASI RiderCourse. Our ATV Ride Safe Oklahoma team involved over 100,000 youth and adults at events such as the Oklahoma Emergency Medical Services for Children Safety Days, Septemberfest at the Oklahoma Governor's Mansion, state FFA Convention, district 4-H volunteer conferences, state 4-H Youth Roundup, state Injury and Prevention Conference, state Agricultural/Farm shows and state and county fairs.
4. Associated Knowledge Areas
KA Code
Knowledge Area
806
Youth Development
Outcome #6
1. Outcome Measures
Youth and adults work in partnership to identify and solve/resolve community needs and environmental issues through an organized and executed plan of action.
2. Associated Institution Types
● 1862 Extension
3a. Outcome Type:
Change in Action Outcome Measure
3b. Quantitative Outcome
Year
Actual
2013
3690
3c. Qualitative Outcome or Impact Statement
Issue (Who cares and Why)
Stakeholders value programs that involve youth and adult partnerships that address real life community needs. Local youth have mapped storm shelters, illegal dumpsites, and established gardens to improved the quality of life for citizens.
What has been done
For 2013, County Extension Educators and stakeholders identified needs related to health and wellness education. $45,000 in mini-grants were provided to implement local programs. Twenty two counties participated with youth and adults teams (110 leadership participants) at the county and club levels to teach youth the advantages of healthy eating and increased physical activity.
Results
Over 3500 school-aged youth were taught the advantages of healthy eating and increased physical behavior.

Teams of youth and adults taught healthy eating through home gardening and community gardens. Other teams reached their goals by teaching youth ?Get Fit for Life? lessons, and others reached youth through the 4-H Food Showdown and other nutrition and fitness curriculum. Although a variety of curriculum and lessons were taught to participants, each youth and adult training team is meeting the same goal; improved eating habits and healthier lifestyles. The evaluations for this program will be collected at the end of the two year cycle. Youth and adult training teams are working hard to present six hours of program to each participant. The teams are reporting back very positive informal information about the effectiveness of this programmatic outreach and the positive changes they are seeing in the youth participants eating and exercise habits.
4. Associated Knowledge Areas
KA Code
Knowledge Area
806
Youth Development
Outcome #7
1. Outcome Measures
Youth will learn to make healthy lifestyle choices through the use of curricula and educational materials.
2. Associated Institution Types
● 1862 Extension
3a. Outcome Type:
Change in Knowledge Outcome Measure
3b. Quantitative Outcome
Year
Actual
2013
12241
3c. Qualitative Outcome or Impact Statement
Issue (Who cares and Why)
Oklahoma climbs three places from 47th rank to 44th least healthy state in 2013. Factors impacting our rank include obesity, smoking, substance use and risk factors associated with family breakdown. As a State, our citizens do not eat enough fruits and vegetables each day.
What has been done
In 2012-13 through a Walmart Foundation grant 24 projects were carried out related to healthy living. Projects addressed issues of nutrition, physical fitness, obesity and food insecurity among young people. Projects include: Cooking Schools, Exercise classes, educational videos about food production and expansion of the 4-H Food Showdown, cooking contest and educational presentation event. Training related to curricula was provided for educators, volunteers and members in: Food Showdown; Take a Stand, Anti-Bullying; Fuel-up to Play 60; Farm to You; Kids, Cows and More;

and Chemistry in the Kitchen.
Results
Over 3,000 Oklahoma youth have received 6 hours or more of face to face teaching around the importance of maintaining a healthy diet and active lifestyle. As a result, 4-H members are documenting increased intake of fruits and vegetables, choosing water over a sugar sweetened beverage and a decrease in screen time. Within the Health project areas, when 217, 13+ year olds were asked to compare themselves against peers they indicated that they did not always practice the things they knew. The respondents said they often did not like to eat fruits and vegetables but prefer foods/drinks higher in fat, sugar and salt. Yet most indicated they like to each dairy products like milk, cheese and yogurt. As is true of most teens, this group was heavily engaged in social media and would prefer that over planning and preparing food, indicating that they sometimes have trouble balancing healthy choices of good food and drink choices, physical exercise, developing hobbies and making good social decisions. In a larger survey of Oklahoma youth involved in a 4-H Council / Walmart Healthy living grant project, of 800 surveyed, over 90% initiated they had learned how to make better health choices as a result of being involved in 4-H programs related to for foods, nutrition and health. In a similar survey of 217 teens involved in 4-H, ages 13 - 19 years old, were asked to respond to a series of questions related to Positive Youth Development and some project related questions. The youth were 59% female and 41% males and most lived in rural areas or small towns. Most had been in 4-H for 5 or more years and most were in grades 8-12. The majority were white ( 61%) with Native Americans being the second most represented group at 19%. In the PYD section the youth were asked to compare themselves to their peers and determine if they identified with a positive or negative attribute. The survey found that the 4-H members generally (93% of them) felt they had a lot of friends and were doing well in school. They also tended to be generally "happy" with themselves most of the time, but were not necessarily content with their looks. Most did not feel they were necessarily better than their peers at sports but were usually more dedicated to doing well at their school work, but did not perceive that they were less inclined to make bad choices at times. Furthermore, of those in the survey: 89% said that all in all I am glad I am me 70% feel it is important to make the world a better place 76% felt it was quite to extremely important to take responsibility for their actions when they make a mistake or get in trouble 63% enjoy being with people who are of a different race than themselves. 74% said that when they see someone being taken advantage of, "I want to help them". 81% said that when they see someone being picked on "I feel sorry for them". 78% indicated that if they see another person who is hurt or upset, "I feel sorry for them". 63% of the student (88% in public school) said they feel they get a lot of encouragement at school. 80% indicated they feel useful and important in their family 59% of the respondents said the adults in their town make me feel important. 84% said they feel their friends are good friends.
4. Associated Knowledge Areas

KA Code
Knowledge Area
806
Youth Development
Outcome #8
1. Outcome Measures
Increased number of collaborations with youth organizations
2. Associated Institution Types
● 1862 Extension
3a. Outcome Type:
Change in Action Outcome Measure
3b. Quantitative Outcome
Year
Actual
2013
21
3c. Qualitative Outcome or Impact Statement
Issue (Who cares and Why)
All youth serving agencies have similar goals to reach as many youth as possible with increased impact on the lives of those youth. Very few agencies have all the resources they need so collaboration is an important component of any youth development program. The Oklahoma 4-H Youth Development program strives to collaborate with other agencies that can help provide positive youth development experiences for youth.
What has been done
The Oklahoma 4-H Program has established collaborative relationships with several other agencies and programs. The Operation Military Kids programs with Reserve and National Guard Units and DOD base programs continue to grow, while new programs have been established with under-served audiences among the Hispanic/Latino and Native American populations. The 4-H Program has on-going relationships with a number of other youth serving agencies and organizations, including Oklahoma FFA, Public Schools, Scouts, Oklahoma State Fairs in Oklahoma City and Tulsa and the Oklahoma Youth Expo.
Results
The results of most of the collaborative efforts are reported in the appropriate place for those collaborative efforts, such as the Operation: Military Kids report under outcome #15. However, the outcomes for our mentoring programs in five Oklahoma Counties are not included anywhere else, so they are reported here: Oklahoma has 4-H Families with Promise Mentoring Programs in Oklahoma, Tulsa, Cherokee, Pontotoc and Hughes Counties. The program in OK County has a primarily Latino audience emphasis while the other sites target Native American youth and their families. The Latino youth program is conducted primarily through a partnership with the Latino Community Development Agency in cooperation with the Oklahoma County Extension office staff. The programs in the others locations are conducted by program assistants who work with the local Extension office and one or more schools in the area.

At each location teen and adult mentors have been recruited, screened and trained to work with older elementary youth. Each location is required to have at least 45 youth participants; however, most have double or more the required number of youth required. In addition to the youth programming, there are at least quarterly "family night out" events which encourage families to spend time together around fund and educational activities or outings. Programs often relate to tribal culture with crafts, foods, customs, and current issues often being the focus. The programs in Oklahoma also encourage youth to participate in out of community activities. Youth are encouraged to attend camps, tours and other events. In 2013 over 600 youth were involved in programs through the 4-H Mentoring clubs as well as other programs provided by the program assistants in the schools where they serve. Mentors and parents are asked to provide semi-annual assessments of the youth participant's behavior and social interaction as a requirement of the Office or Juvenile Justice and Delinquency Prevention. None of the Oklahoma participants have entered a corrections or delinquency program while being a program participant. Parents report that children often talk out the messages they have learned related to bullying and character through this program.
4. Associated Knowledge Areas
KA Code
Knowledge Area
806
Youth Development
Outcome #9
1. Outcome Measures
Participant teams will Increase knowledge of Oklahoma natural resources and environmental stewardship.
2. Associated Institution Types
● 1862 Extension
3a. Outcome Type:
Change in Knowledge Outcome Measure
3b. Quantitative Outcome
Year
Actual
2013
16034
3c. Qualitative Outcome or Impact Statement
Issue (Who cares and Why)
In his 2006 book Last Child in the Woods, Richard Louv tells of schools eliminating hands-on nature study from the curriculum in an effort to increase standardized test scores. Beyond the changes in school curriculum, the busy life of today's over-stretched and over-stressed parents allow little time for outdoor activities. Unlike earlier generations, many of today's parents see the outdoors as a dangerous place. They

fear strangers and kidnappings, gangs and drug dealers taking over parks and vacant corner lots, and encroaching wildlife from mountain lions to virus-bearing mosquitoes that have been sensationalized by the media. We have scared children straight out of the woods and fields. The 4-H Program is uniquely situated to help address this issue. The 4-H natural resource programs are designed to assist young people in personal development, the establishment of personal environmental ethics, and the exploration of life-long vocational and avocational activities. The program uses experiential learning and positive interactions with youth and adult role models to help young people develop self-concept, self-assurance and a positive self-image. The content provides a framework of knowledge and skills for lifetime participation in recreation, hobbies and careers related to shooting sports and wildlife. Core concepts stress safety, ethical development, personal responsibility and life-time recreational skills.
What has been done
A research study was begun to determine the economic impact of 4-H shooting sports events on the Oklahoma economy. Looking as a series of state-level events, participant families are asked to list the cost of travel, supplies, meals, etc associated with participating in an event. While the majority of the youth involved in Shooting Sports are not likely to be involved in risky behaviors, some may be inclined to become involved in at risk behaviors if not involved in programs that encourage discipline and positive role models. The estimated cost to keep one juvenile delinquent housed in a correctional facility is close to $55,000 per year. In a survey of youth and families in Texas, the estimated cost for a youth to participate in 4-H shooting sports was about $4,320 a year. Ten training workshops were provided in Shooting Sports, Forestry, Wildlife, Range, Water, Homesite and Land judging.
Results
Economic Impact Analysis was conducted for the four counties where 4-H State Shooting Sports Contests were held during 2013. Three economic activity measures indicate that 1 and 1.5 jobs were expanded or created, personal income to the residents within these four counties increased between $18,799 and $33,585, and resulting sales within these counties increased between $30,480 and $55,247. Using Economic Contribution Analysis for the 4-H Shooting Sports Program in the state of Oklahoma, it was determined that between 108 and 112 jobs were expanded or created, personal income to the residents of the state increased between $3.4 and $3.5 million, and resulting sales in the state increased between $5.7 and $5.8 million. Over 6,000 youth are enrolled in the Shooting Sports and nearly 1100 youth competed in one or more state-level shooting sports contest hosted during 2013. To participate in 4-H Shooting Sports youth are required to receive a minimum of 8 hours of instruction under the guidance of a certified shooting sports instructor before being allowed to compete in a shooting sports contest or event. Certified instructors teach the safe use of sporting arms, environmental ethics, and sportsmanship. In 2013, 82 new volunteers received certification in a shooting sports discipline. To receive certification an adult must successfully complete a minimum of 12 hours of training in a specific shooting sports discipline before being allowed to work with youth in clubs. Over 40 4-H youth earned the right to represent Oklahoma at national contests in Shooting Sport, WHEP and Forestry. The compound archery team placed 1st Overall while the shotgun team placed 5th Overall. Forty three percent of the youth who attended the WHEP contest were involved in service learning projects in their locale.
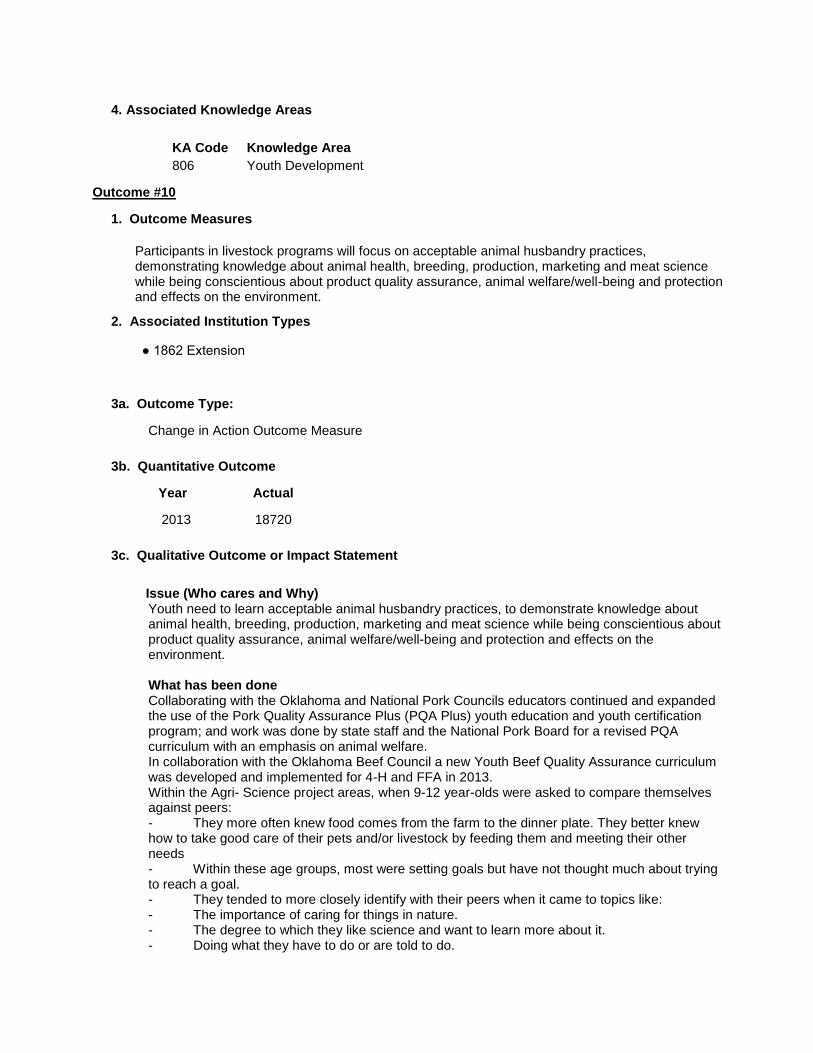
4. Associated Knowledge Areas
KA Code
Knowledge Area
806
Youth Development
Outcome #10
1. Outcome Measures
Participants in livestock programs will focus on acceptable animal husbandry practices, demonstrating knowledge about animal health, breeding, production, marketing and meat science while being conscientious about product quality assurance, animal welfare/well-being and protection and effects on the environment.
2. Associated Institution Types
● 1862 Extension
3a. Outcome Type:
Change in Action Outcome Measure
3b. Quantitative Outcome
Year
Actual
2013
18720
3c. Qualitative Outcome or Impact Statement
Issue (Who cares and Why)
Youth need to learn acceptable animal husbandry practices, to demonstrate knowledge about animal health, breeding, production, marketing and meat science while being conscientious about product quality assurance, animal welfare/well-being and protection and effects on the environment.
What has been done
Collaborating with the Oklahoma and National Pork Councils educators continued and expanded the use of the Pork Quality Assurance Plus (PQA Plus) youth education and youth certification program; and work was done by state staff and the National Pork Board for a revised PQA curriculum with an emphasis on animal welfare. In collaboration with the Oklahoma Beef Council a new Youth Beef Quality Assurance curriculum was developed and implemented for 4-H and FFA in 2013. Within the Agri- Science project areas, when 9-12 year-olds were asked to compare themselves against peers: - They more often knew food comes from the farm to the dinner plate. They better knew how to take good care of their pets and/or livestock by feeding them and meeting their other needs - Within these age groups, most were setting goals but have not thought much about trying to reach a goal. - They tended to more closely identify with their peers when it came to topics like: - The importance of caring for things in nature. - The degree to which they like science and want to learn more about it. - Doing what they have to do or are told to do.

- Most also had dreams of going to college. - Within the Agri-Science project areas, when teens were asked to compare themselves against peers, they more often knew food comes from the farm to the dinner plate but about as many teenagers know food comes from the grocery store but aren't sure how it got there. - Most of the teenagers think it is important to take care of things in nature and some teenagers know how to take good care of their pets and/or livestock by feeding them and meeting their other needs, about half of the respondent teenagers don't really care much or have not thought much about the needs of animals. The teens said they tended to identify with teenagers who do not see much need in knowing any science. Most had given little thought to how things work and find learning more boring. About half of the teens said they tended to set goals and about half did not; however, most like to keep records or know what they have done. Furthermore they plan to go to college and get a degree
Results
Approximately 6500 youth 8-18 years of age in both 4-H and FFA programs were certified in the PQA Plus program as part of their county pork project and enabled them to show at the Oklahoma Youth Expo and the Tulsa State Fair. As a result of this program there has been a decrease in stress related deaths in exhibition animals and a more marketable meat product. See What has been done (above) for more knowledge gained factors.
4. Associated Knowledge Areas
KA Code
Knowledge Area
806
Youth Development
Outcome #11
1. Outcome Measures
Participants will increase knowledge and awareness of STEM technologies and career opportunities.
2. Associated Institution Types
● 1862 Extension
3a. Outcome Type:
Change in Knowledge Outcome Measure
3b. Quantitative Outcome
Year
Actual
2013
1118
3c. Qualitative Outcome or Impact Statement
Issue (Who cares and Why)
The US is falling dangerously behind other nations in developing its future workforce of scientists, engineers, and technology experts. Only 18% of US high school seniors are proficient in science (NAEP, 2005). Oklahoma 4-H is combating this issue by teaching youth about Science Technology, Engineering, and Math (STEM).

What has been done
Oklahoma 4-H STEM program is addressing this issue through STEM curriculum promotion, 4-H trainings in the area of STEM, and professional development of 4-H Educators. Oklahoma's main vehicle for educating youth about science, technology, engineering, and math has been the 4-H STEM Institute. For 2013, this program included, STEM Robotics and Geographic Information Systems. The STEM Institute was designed to train teams of youth and adult in the use and application of technology. These teams were then charged with the tasks of applying their technology specialty to a community service project or the development of a special project club. Once their project is established or complete the team was then expected to go teach other youth about their program and their technology. In 2013, Oklahoma 4-H hosted four statewide STEM conferences/ trainings for youth and adult volunteers; Stem Institute 1 and 2, 4-H Science Biotechnology Lab and the 4-H Forensics conference. Three professional development opportunities were taught to training county educators to teach STEM: 4-H STEM Community Action Teams a Revolution of Responsibility, Digital Media Training. SE District In-Service, Inquiry Based Teaching Methods and Student Centered approaches, and TechXcite for club and school enrichment.
Results
TechXcite is a recently developed Engineering curriculum that is designed for middle school aged students. OK4-H was fortunate to receive a sub-grant from Duke University to pilot these materials. One hundred and twenty eight educational kits have been distributed across the state. These kits are being used by educators to introduce youth to career fields in engineering and the engineering method in 52 locations across the state. Duke University specialists are currently collecting our evaluation data to determine the effectiveness if the TechXcite curriculum. Oklahoma 4-H has submitted over 1000 evaluations that will be analyzed this fall. STEM Geospatial projects are about teaching youth how to think spatially. This is done by training them in GPS/GIS. Once trained, the teams of youth and adults are expected to apply the GIS technology. Once trained our teams work locally to identify a community issue which can be addressed by this powerful technology. The Washita county 4-H team is working on a project to map the Illegal dumpsite around Cordell, Oklahoma. The Washington County 4-H Beef club is working on a GIS to identify areas within their community in need of beautification through environmental conservation. The Oklahoma County Dove Science Academy 4-H is creating a GIS that is focusing on the emergency management of their community and how to locate them using GIS/GPS technology. The Creek County 4-H team is developing a community atlas that can be used to explore their county and the natural resources it has to offer. The STEM Robotics training is designed to help groups of youth and adults begin their own robotics clubs to teach engineering to participating youth. From the 2013 training four new clubs were started and the educational programs of four previously existing clubs were enhanced. These club are competing in Lego First Robotics competitions and educating other youth around their community about engineering through robotics The results of Oklahoma 4-H STEM projects have been published in peer reviewed journal articles, and presented nationally and locally. Sallee, J. & Dewitt, C. (In Press). Digital media creates youth voices heard. Journal of Youth Development (XX)X. Sallee, J. & Peek, G. (In Press). Fitting the framework: The STEM institute and the 4-H essential

elements. Journal of Extension (XX)X. Sallee, J. (2013). The STEM institute, service learning, and youth voice. JCEP Galaxy IV Conference, Pittsburg PA. Daniels J., Stobbe A. Espindola A., Schneider W., Sallee J., Blagden T., Ochoa Corona F., Garzon C., & Fletcher J. (2013). CSI in a tomato disease plot: Engaging 4-H youth and educators in STEM through investigative plant pathology. Poster presented at the American Phytopathological Society; Austin, TX. Sallee, J. & Bender, E (2013). Foundations of 4-H science, 4-H Science E-Academy Virtual Conference Sallee, J. (2013). Building and launching hot air balloons, Poster presented at the 4-H Science E-Academy Virtual Conference. Sallee, J. (2013). Solar cars, 2013 OAE4-HA Conference, Hulbert, OK. Sallee, J. & Frazier, S. (2013). Wind power. REYAP Agricultural Science and Technology Institute, Stillwater, OK. Sallee, J. (2013). 4-H science kits and resources, OCES New Educators Training, OSU, Stillwater, OK.
4. Associated Knowledge Areas
KA Code
Knowledge Area
806
Youth Development
Outcome #12
1. Outcome Measures
Participants will increase knowledge and awareness of plants and soil systems.
2. Associated Institution Types
● 1862 Extension
3a. Outcome Type:
Change in Knowledge Outcome Measure
3b. Quantitative Outcome
Year
Actual
2013
14578
3c. Qualitative Outcome or Impact Statement

Issue (Who cares and Why)
Plants are vital to life on earth. They improve air and water quality, control erosion, provide food and medicine for animals, and have great aesthetic value as well. Children involved in plant science projects increase their agricultural literacy and generally become healthier through physical activity and increased knowledge of healthy eating.
What has been done
The OSU Department of Horticulture and Landscape Architecture and the OSU Department of Plant and Soil Sciences have facilitated plant and soil education for youth in Oklahoma through many activities, productions, and programs. Both departments have sponsored residential academies for youth to experience career-related activities in the plant sciences, hosted judging contests at the state fairs, provided workshops for youth and adults at conferences across the state and have visited individual classrooms and youth groups throughout the state. Activities in 2013 included: Presentations about Junior Master Gardener (JMG) - Oklahoma Environmental Education Expo (OKC Zoo), teacher training at OSU botanic garden, Ag in the Classroom conference (Checotah), Jones Elementary School, Oklahoma County Master Gardeners (twice) College/Career day presentations - Stillwater Area Career Fair, Payne County Career Paths Expo Educational workshops - 50-hour Junior Master Gardener day camp at OSU Botanic Garden, workshop at State 4-H Roundup, NE District in-service, Health and Hunger issue teams in-service Presentations to Youth - Southwest Stampede (Weatherford), Kids Kows and More (Ottawa County), 4H youth groups at OSU, 2 Girl Scout badge workshops, Outdoor Day Sangre Ridge Elementary, Ag Day at elementary schools in Moore, Grandparent University (landscape design major), Colonial Day at Richmond Elementary, Girl Scout flowers presentation (Bethany), presentation at TBG for Crescent Elementary, 3 Stillwater Middle School presentations on flower anatomy, Langston charter school in Tulsa?workshops, McClain County Free Fair Kids Day . Productions - 1 episode for "Oklahoma Gardening" TV show Contests - FFA Career Development Events (nursery/landscaping, agronomy), Oklahoma State Fair, Oklahoma/Arkansas State Fair (Ft. Smith, AR), Tulsa State Fair Residential Camps "Tomorrow's Undergraduates Realizing the Future (Camp TURF)" - 2 weeks of career-related activities for 25 first-generation college students from Oklahoma high schools), Plant Science Academy
Results
There was an increase in the number of registered Junior Master Gardener groups (9 new groups in 2013, 12 new groups in 2012, 8 new groups in 2011, 5 new groups in 2010; 1 new group in 2009). There was an increase in the number of 4H youth participating in the Oklahoma State Fair horticulture judging contest (75 in 2013, 58 in 2012, 47 for 2011; 42 in 2010; 38 in 2009).
4. Associated Knowledge Areas
KA Code
Knowledge Area
806
Youth Development

Outcome #13
1. Outcome Measures
Increase knowledge and awareness of entomology.
2. Associated Institution Types
● 1862 Extension
3a. Outcome Type:
Change in Knowledge Outcome Measure
3b. Quantitative Outcome
Year
Actual
2013
274650
3c. Qualitative Outcome or Impact Statement
Issue (Who cares and Why)
Entomology education has a vital impact on agriculture, human and animal health, and preservation of the environment.
What has been done
Over 300 extension presentations to over 300,000 people allowed the opportunity to observe, study, and directly interact with these animals can have a life-long impact on patrons including: 1) increasing awareness of the vital roles all animals play in the environment and ecological cycles on Earth, 2) breaking down irrational myths and fears commonly held regarding these animals, and 3) fostering feelings of environmental stewardship and personal responsibility that will make them better citizens and more caring people.
Results
Each year, many thousands of Oklahomans are educated on the truth and myths surrounding arthropods through the Insect Adventure program. Participants in the Insect Adventure experience a great reduction in fear regarding the important group of animals called arthropods Adults and youth understand the value of insects and the broad impact of entomology on humans.
4. Associated Knowledge Areas
KA Code
Knowledge Area
806
Youth Development
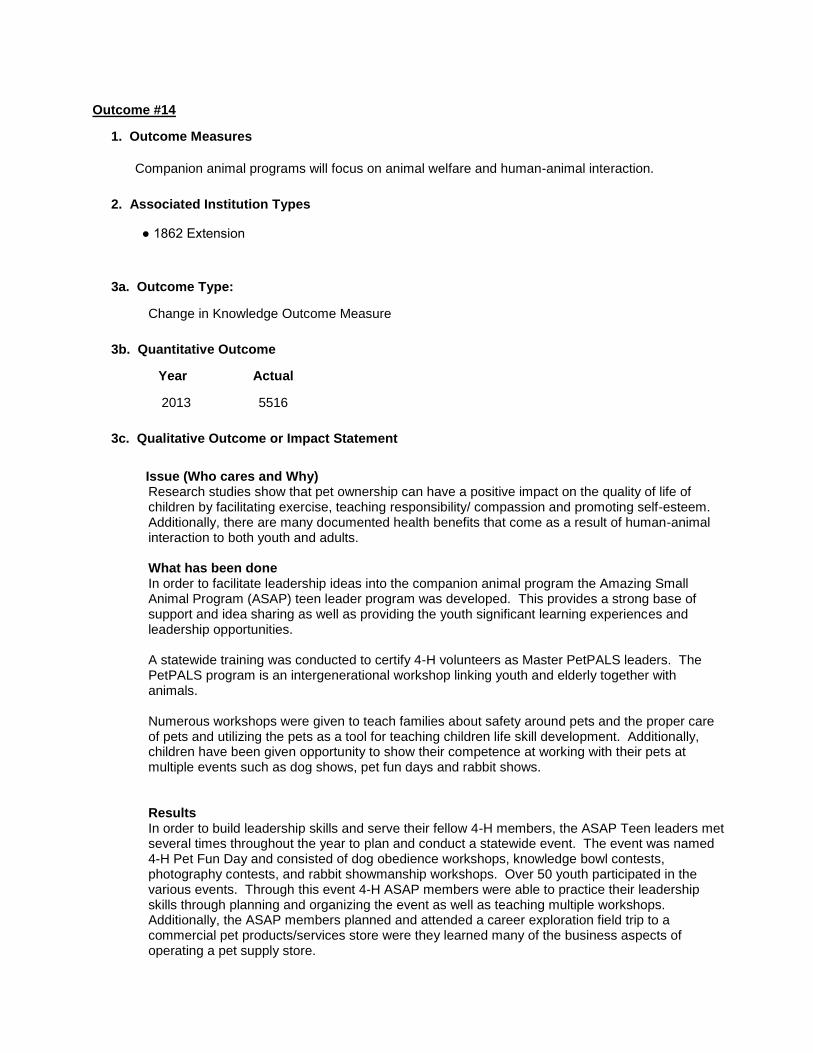
Outcome #14
1. Outcome Measures
Companion animal programs will focus on animal welfare and human-animal interaction.
2. Associated Institution Types
● 1862 Extension
3a. Outcome Type:
Change in Knowledge Outcome Measure
3b. Quantitative Outcome
Year
Actual
2013
5516
3c. Qualitative Outcome or Impact Statement
Issue (Who cares and Why)
Research studies show that pet ownership can have a positive impact on the quality of life of children by facilitating exercise, teaching responsibility/ compassion and promoting self-esteem. Additionally, there are many documented health benefits that come as a result of human-animal interaction to both youth and adults.
What has been done
In order to facilitate leadership ideas into the companion animal program the Amazing Small Animal Program (ASAP) teen leader program was developed. This provides a strong base of support and idea sharing as well as providing the youth significant learning experiences and leadership opportunities. A statewide training was conducted to certify 4-H volunteers as Master PetPALS leaders. The PetPALS program is an intergenerational workshop linking youth and elderly together with animals. Numerous workshops were given to teach families about safety around pets and the proper care of pets and utilizing the pets as a tool for teaching children life skill development. Additionally, children have been given opportunity to show their competence at working with their pets at multiple events such as dog shows, pet fun days and rabbit shows.
Results
In order to build leadership skills and serve their fellow 4-H members, the ASAP Teen leaders met several times throughout the year to plan and conduct a statewide event. The event was named 4-H Pet Fun Day and consisted of dog obedience workshops, knowledge bowl contests, photography contests, and rabbit showmanship workshops. Over 50 youth participated in the various events. Through this event 4-H ASAP members were able to practice their leadership skills through planning and organizing the event as well as teaching multiple workshops. Additionally, the ASAP members planned and attended a career exploration field trip to a commercial pet products/services store were they learned many of the business aspects of operating a pet supply store.

A statewide training was conducted to certify 4-H volunteers as Master PetPALS leaders. This training provided volunteers the skills to train and evaluate animals and youth for human-animal interaction at nursing homes and assisted living centers. Not only do these visits provide healthy interactions with pets for the elderly, it also teaches youth the importance of interacting with their elders. Ten (10) 4-H Volunteers received Master PetPALS training and committed to teaching PetPALS clubs for a minimum of 10 weeks. Over two-thousand 4-H members, youth and volunteers received companion animal workshops about safety and the care of animals at the following venues; Septemberfest at the Governor?s Mansion, Tulsa and OKC State Fairs, State 4-H Roundup, 4-H Pet Fun Day, county and multi-county showmanship clinics, public and private schools, county fairs, State 4-H Volunteer Conference, county workshops, local club meetings, summer day and residential camps, and four district 4-H dog shows.
4. Associated Knowledge Areas
KA Code
Knowledge Area
806
Youth Development
Outcome #15
1. Outcome Measures
Military families receiving support through 4-H partnerships will increase their use of local support networks
2. Associated Institution Types
● 1862 Extension
3a. Outcome Type:
Change in Knowledge Outcome Measure
3b. Quantitative Outcome
Year
Actual
2013
1608
3c. Qualitative Outcome or Impact Statement
Issue (Who cares and Why)
In 2013 the Oklahoma Operation: Military Kids team worked throughout the year to successfully support military youth and their families. There are currently about 33,236 military youth living in the state of Oklahoma. At any given time these youth will face the challenges of deployment, reconnecting with a family member, relocating to a new base, and integrating into a new community.
What has been done
Oklahoma 4-H/OMK implemented six military youth events, five briefings, and six state/local team planning meetings. Three overnight educational events, six day-camps for the Air National Guard and promoted ?Welcome Home Gardens? for returning service members.
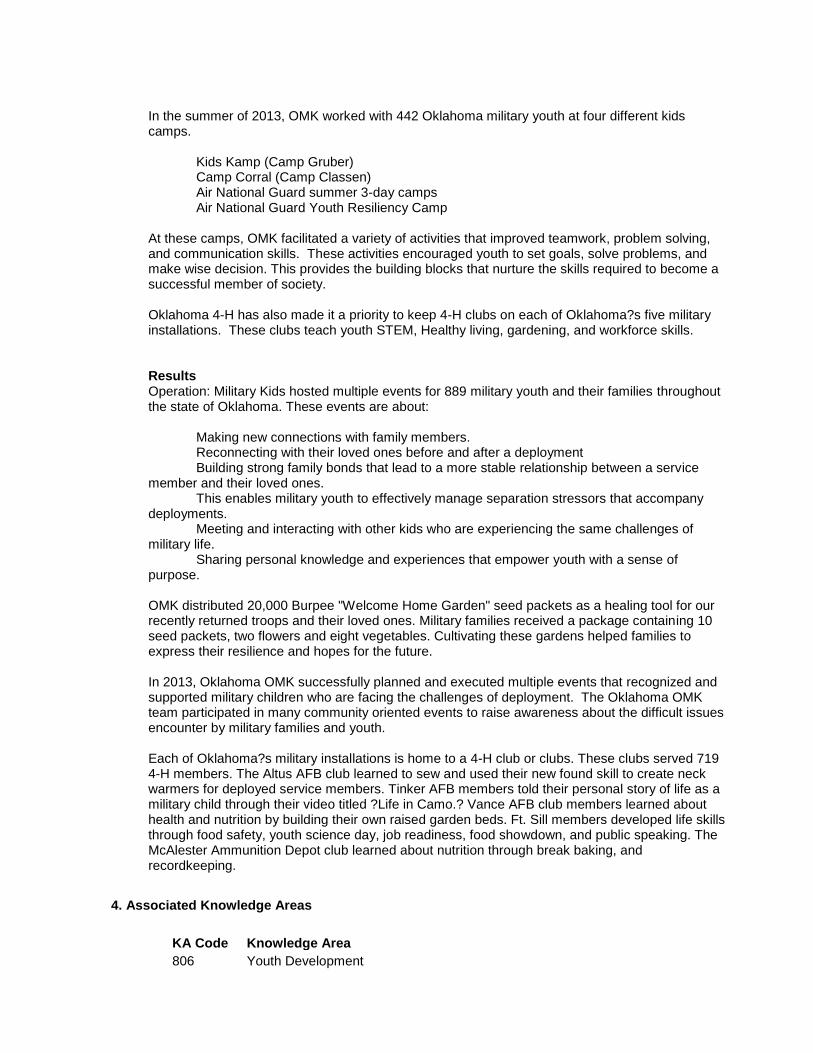
In the summer of 2013, OMK worked with 442 Oklahoma military youth at four different kids camps. Kids Kamp (Camp Gruber) Camp Corral (Camp Classen) Air National Guard summer 3-day camps Air National Guard Youth Resiliency Camp At these camps, OMK facilitated a variety of activities that improved teamwork, problem solving, and communication skills. These activities encouraged youth to set goals, solve problems, and make wise decision. This provides the building blocks that nurture the skills required to become a successful member of society. Oklahoma 4-H has also made it a priority to keep 4-H clubs on each of Oklahoma?s five military installations. These clubs teach youth STEM, Healthy living, gardening, and workforce skills.
Results
Operation: Military Kids hosted multiple events for 889 military youth and their families throughout the state of Oklahoma. These events are about: Making new connections with family members. Reconnecting with their loved ones before and after a deployment Building strong family bonds that lead to a more stable relationship between a service member and their loved ones. This enables military youth to effectively manage separation stressors that accompany deployments. Meeting and interacting with other kids who are experiencing the same challenges of military life. Sharing personal knowledge and experiences that empower youth with a sense of purpose. OMK distributed 20,000 Burpee "Welcome Home Garden" seed packets as a healing tool for our recently returned troops and their loved ones. Military families received a package containing 10 seed packets, two flowers and eight vegetables. Cultivating these gardens helped families to express their resilience and hopes for the future. In 2013, Oklahoma OMK successfully planned and executed multiple events that recognized and supported military children who are facing the challenges of deployment. The Oklahoma OMK team participated in many community oriented events to raise awareness about the difficult issues encounter by military families and youth. Each of Oklahoma?s military installations is home to a 4-H club or clubs. These clubs served 719 4-H members. The Altus AFB club learned to sew and used their new found skill to create neck warmers for deployed service members. Tinker AFB members told their personal story of life as a military child through their video titled ?Life in Camo.? Vance AFB club members learned about health and nutrition by building their own raised garden beds. Ft. Sill members developed life skills through food safety, youth science day, job readiness, food showdown, and public speaking. The McAlester Ammunition Depot club learned about nutrition through break baking, and recordkeeping.
4. Associated Knowledge Areas
KA Code
Knowledge Area
806
Youth Development
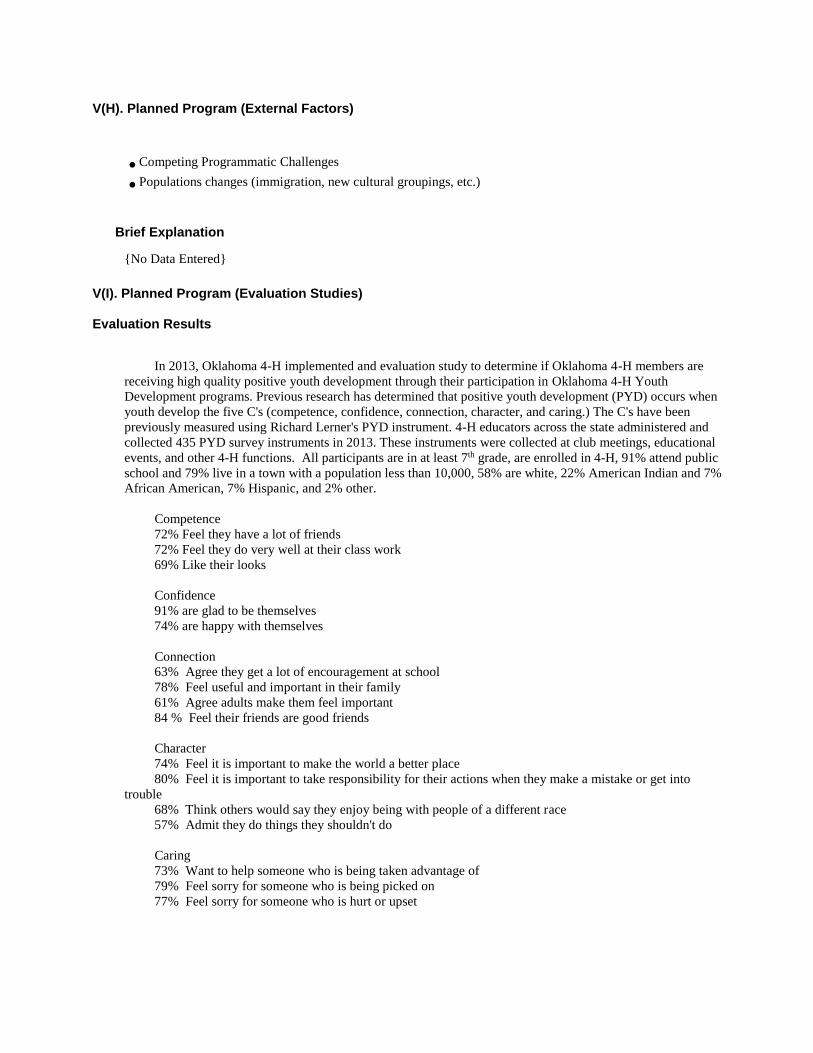
V(H). Planned Program (External Factors)
● Competing Programmatic Challenges
● Populations changes (immigration, new cultural groupings, etc.)
Brief Explanation
{No Data Entered}
V(I). Planned Program (Evaluation Studies)
Evaluation Results
In 2013, Oklahoma 4-H implemented and evaluation study to determine if Oklahoma 4-H members are
receiving high quality positive youth development through their participation in Oklahoma 4-H Youth
Development programs. Previous research has determined that positive youth development (PYD) occurs when
youth develop the five C's (competence, confidence, connection, character, and caring.) The C's have been
previously measured using Richard Lerner's PYD instrument. 4-H educators across the state administered and
collected 435 PYD survey instruments in 2013. These instruments were collected at club meetings, educational
events, and other 4-H functions. All participants are in at least 7th grade, are enrolled in 4-H, 91% attend public
school and 79% live in a town with a population less than 10,000, 58% are white, 22% American Indian and 7%
African American, 7% Hispanic, and 2% other.
Competence
72% Feel they have a lot of friends
72% Feel they do very well at their class work
69% Like their looks
Confidence
91% are glad to be themselves
74% are happy with themselves
Connection
63% Agree they get a lot of encouragement at school
78% Feel useful and important in their family
61% Agree adults make them feel important
84 % Feel their friends are good friends
Character
74% Feel it is important to make the world a better place
80% Feel it is important to take responsibility for their actions when they make a mistake or get into
trouble
68% Think others would say they enjoy being with people of a different race
57% Admit they do things they shouldn't do
Caring
73% Want to help someone who is being taken advantage of
79% Feel sorry for someone who is being picked on
77% Feel sorry for someone who is hurt or upset

Key Items of Evaluation

V(A). Planned Program (Summary)
Program # 8
1. Name of the Planned Program
Turfgrass Development and Management
Reporting on this Program
V(B). Program Knowledge Area(s)
1. Program Knowledge Areas and Percentage
KA Code
Knowledge Area %1862 Extension
%1890 Extension
%1862 Research
%1890 Research
111 Conservation and Efficient Use of Water 15% 10%
201 Plant Genome, Genetics, and Genetic Mechanisms
0% 5%
202 Plant Genetic Resources 8% 10%
203 Plant Biological Efficiency and Abiotic Stresses Affecting Plants
10% 10%
204 Plant Product Quality and Utility (Preharvest)
10% 5%
205 Plant Management Systems 20% 15%
206 Basic Plant Biology 2% 5%
211 Insects, Mites, and Other Arthropods Affecting Plants
10% 10%
212 Pathogens and Nematodes Affecting Plants
15% 10%
216 Integrated Pest Management Systems 10% 20%
Total 100% 100%
V(C). Planned Program (Inputs)
1. Actual amount of FTE/SYs expended this Program
Year: 2013 Extension Research
1862 1890 1862 1890
Plan 1.5 0.0 2.0 0.0
Actual Paid Professional 3.0 0.0 1.9 0.0
Actual Volunteer 0.0 0.0 0.0 0.0
2. Actual dollars expended in this Program (includes Carryover Funds from previous years)

Extension Research
Smith-Lever 3b & 3c 1890 Extension Hatch Evans-Allen
75000 0 81982 0
1862 Matching 1890 Matching 1862 Matching 1890 Matching
75000 0 81982 0
1862 All Other 1890 All Other 1862 All Other 1890 All Other
325000 0 466340 0
V(D). Planned Program (Activity)
1. Brief description of the Activity
Continued efforts to generate new turf germplasm/varieties. Some new germplasm is being further developed into marketable products that have improved abiotic and biotic stress resistance/tolerance. Research was conducted to identify the elite performing species and varieties from both our program and from industry. Research will identify new or refined integrated management practices and comprehensive management systems. Educational materials were developed featuring improved varieties and how to properly maintain them. Intense and effective educational programming were conducted to help integrate this information into existing management programs. Research and extension activities were conducted to improved efficiency of water application and to reduce runoff.
2. Brief description of the target audience
Audiences include governmental, private industry and multiple end-user areas. Research audiences: basic and applied plant science/turf science researchers, including those from the CSSA, and ASHS. Funding agency audiences: USGA, GCSAA, USDA, OTRF and many private corporations. New cultivars developed as well as products such as trade articles, fact sheets, and educational programming will be provided to the target audiences characterized as the turfgrass production sector (sod and seed producers), service sector (landscape/lawncare and pest control operators) and turf managers (which include the golf course, parks & grounds, right of way managers and home consumers).
3. How was eXtension used?
eXtension was not used in this program
V(E). Planned Program (Outputs)
1. Standard output measures
2013 Direct Contacts
Adults Indirect Contacts
Adults Direct Contacts
Youth Indirect Contacts
Youth
Actual 1819 51554 400 1000
2. Number of Patent Applications Submitted (Standard Research Output)
Patent Applications Submitted
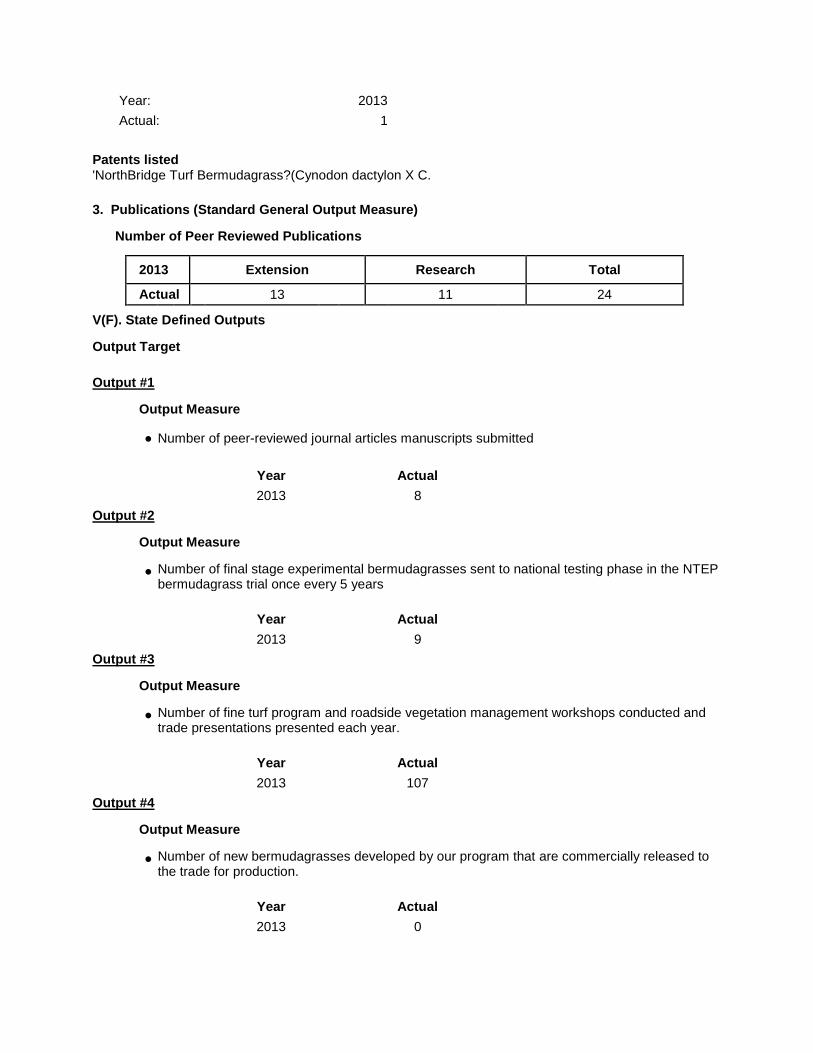
Year: 2013
Actual: 1
Patents listed
'NorthBridge Turf Bermudagrass?(Cynodon dactylon X C.
3. Publications (Standard General Output Measure)
Number of Peer Reviewed Publications
2013 Extension Research Total
Actual 13 11 24
V(F). State Defined Outputs
Output Target
Output #1
Output Measure
● Number of peer-reviewed journal articles manuscripts submitted
Year Actual
2013 8
Output #2
Output Measure
● Number of final stage experimental bermudagrasses sent to national testing phase in the NTEP bermudagrass trial once every 5 years
Year Actual
2013 9
Output #3
Output Measure
● Number of fine turf program and roadside vegetation management workshops conducted and trade presentations presented each year.
Year Actual
2013 107
Output #4
Output Measure
● Number of new bermudagrasses developed by our program that are commercially released to the trade for production.
Year Actual
2013 0
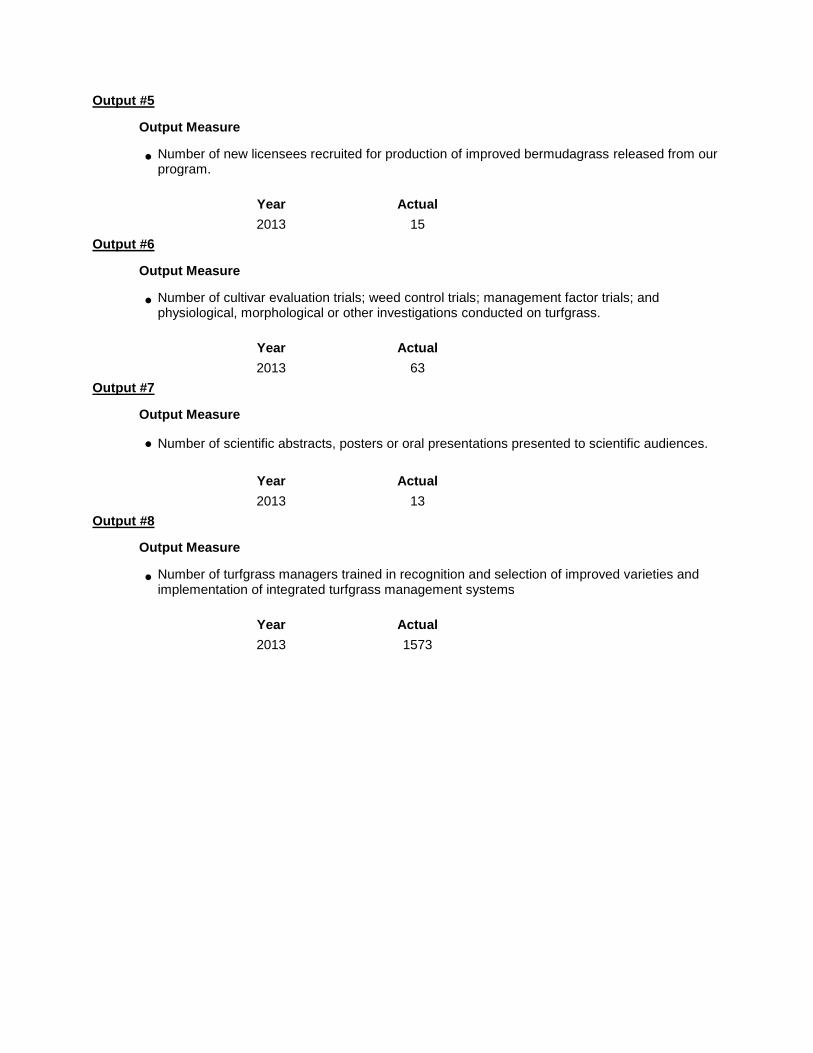
Output #5
Output Measure
● Number of new licensees recruited for production of improved bermudagrass released from our program.
Year Actual
2013 15
Output #6
Output Measure
● Number of cultivar evaluation trials; weed control trials; management factor trials; and physiological, morphological or other investigations conducted on turfgrass.
Year Actual
2013 63
Output #7
Output Measure
● Number of scientific abstracts, posters or oral presentations presented to scientific audiences.
Year Actual
2013 13
Output #8
Output Measure
● Number of turfgrass managers trained in recognition and selection of improved varieties and implementation of integrated turfgrass management systems
Year Actual
2013 1573

V(G). State Defined Outcomes
V. State Defined Outcomes Table of Content
O. No. OUTCOME NAME
1 Number of sod/seed producers growing OSU turf bermudagrasses
2 Number of out-of-state sod/seed producers growing OSU turf bermudagrasses
3 Number of sod/seed producers growing Oklahoma proven turf bermudagrasses
4 Percentage of professionally managed properties using improved turfgrasses
5 Percentage of professional fine turf managers continuing adoption of BMPs and IPM
6 Percentage of ODOT roadside vegetation managers continuing adoption of BMPs and IPM

Outcome #1
1. Outcome Measures
Number of sod/seed producers growing OSU turf bermudagrasses
2. Associated Institution Types
● 1862 Extension
● 1862 Research
3a. Outcome Type:
Change in Action Outcome Measure
3b. Quantitative Outcome
Year
Actual
2013
49
3c. Qualitative Outcome or Impact Statement
Issue (Who cares and Why)
Severe winter-kill plagued warm-season turfgrasses in Oklahoma and across the US transition zone in the late 1970s, early 1980s and again in 1990 and 2010. Proper management of the earlier selections of bermudagrasses could only provide limited protection against losses of bermudagrass to winter-kill and is financial impact when sports fields and golf courses required resodding or reseeding. Following particularly bad winters, sod production facilities would be hit by winter-kill and operators could not full take advantage of the opportunity to meet market demand for bermudagrass sod since their production fields were damaged and limited sod was available for harvest. Consequently, improved high quality seeded and vegetatively propagated turf-type bermudagrasses were needed to better resist the effects of harsh winters and less damage from severe winter-kill events.
What has been done
The Oklahoma State University Bermudagrass Development Team with funding and support from the Oklahoma Agricultural Experimental Station (OAES) and the United States Golf Association from 1986 to date has breed tens of thousands of lines of experimental bermudagrasses for intensive testing. These bermudagrasses have been screening in-depth in Oklahoma for improved winter-hardiness, seed set, establishment rate, pest resistance and overall quality. Only a handful of the most elite performers were sent on for national testing with the National Turfgrass Evaluation Program (NTEP). Additional on-site testing was performed with selected sod and seed producers interested in future production of high quality, improved bermudagrasses with potential for improved profit margins.
Results
To date, we have commercialized and obtained proprietary protection on Yukon and Riviera seeded bermudagrasses as well as Patriot, Latitude 36 and NorthBridge vegetatively propagated bermudagrasses. Seed production licenses for large scale production were granted to one national firm each for Yukon and Riviera seeded bermudagrasses. The licensed seed producer of Riviera bermudagrass has allowed four quality-minded sod producers to produce Riviera bermudagrass sod. These two seeded bermudagrass lines were adopted as standards in the

2013-2018 NTEP bermudagrass trial due to excellent performance and their first-class winter hardiness in seeded turf-type bermudagrass options. Nine sod producers in eight states produce and sell Patriot bermudagrass. Latitude 36 and NorthBridge bermudagrasses were licensed to Sod Solutions who has sublicensed each product to 19 sod producers in eight states. Patriot and Latitude 36 remain a standard for cold hardiness in vegetatively propagated turf bermudagrass in the current 2013-2018 NTEP bermudagrass. Sod producers are able to make at least a three to five cent per square foot premium on production of high quality winter-hardy bermudagrasses and to somewhat escape the "commodity-like" market place of variety-not-stated common bermudagrass sod production which keeps sale prices and grower profits reduced in the industry as a whole. In 2013, 6 and 7 new sublicensees of NorthBridge and Latitude 36 Turf bermudagrasses, respectively, were licensed by our representative, Sod Solutions LLC outside of Oklahoma. The first sod and sprigs from the 2013 producers should be available in the marketplace in late 2014. In 2013, the OSU generated bermudagrass Latitude 36 was installed on two NFL stadiums while NorthBridge was installed on the playing surface at one Major Lead Baseball stadium and one NFL stadium. These installs show the high level of acceptance of the OSU bermudagrasses that demonstrated improved winter hardiness, visual quality and high levels of traffic tolerance. Replacement of winter-susceptible type bermudagrass will be a multi-year, on-going process. Due to outstanding national performance by Latitude 36 in the 2007-2012 NTEP bermudagrass trial, this grass was selected as a new standard for cold hardy, high quality bermudagrass by the NTEP for the 2013-2018 NTEP bermudagrass trial being conducted across the US. The NTEP also selected older but still outstanding performing OSU turf bermudagrasses Patriot, Yukon and Riviera for inclusion in this national trial due to their continued high national performance rankings. Utilization of OSU released bermudagrasses with improved winter-tolerance results in decreased winter-kill in years where winters at a given location are more severe. Decreasing winter-kill results in less weedy turf, since a dense cover of turfgrass results in less invasion by winter and summer annual weeds. Reductions in weed cover and percentage results in less use of herbicide for weed control as well as a resultant higher quality turfgrass surface earlier in the growing season. Based on NTEP trial research in 2010, approximately 20% less winter-kill of turfgrass area can be expected using winter-hardy turf bermudagrass varieties developed by Oklahoma State University. This can result in 15 to 20 % less fertilizer being used and a reduction in need for purchase of replacement seed or sod to repair damaged areas of turfgrass. Damaged turf can often result in negative player preference towards golf courses that suffered winter-kill if other courses in the same area did not have winter-kill and if golfing fees are otherwise the same on both courses under comparison. Latitude 36 and Northbridge have the highest traffic tolerance of any hybrid bermudagrasses with improved cold tolerance. Consequently, they are receiving increased use on professional, college and high school playing surfaces.
4. Associated Knowledge Areas
KA Code
Knowledge Area
202
Plant Genetic Resources
203
Plant Biological Efficiency and Abiotic Stresses Affecting Plants
205
Plant Management Systems

Outcome #2
1. Outcome Measures
Number of out-of-state sod/seed producers growing OSU turf bermudagrasses
2. Associated Institution Types
● 1862 Research
3a. Outcome Type:
Change in Action Outcome Measure
3b. Quantitative Outcome
Year
Actual
2013
44
3c. Qualitative Outcome or Impact Statement
Issue (Who cares and Why)
Severe winter-kill plagued warm-season turfgrasses across the US transition zone in the late 1970s, early 1980s and again in 1990 and 2010. Proper management of the earlier selections of bermudagrasses could only provide limited protection against losses of bermudagrass to winter-kill and is financial impact when sports fields and golf courses required resodding or reseeding. Following particularly bad winters, sod production facilities would be hit by winter-kill and operators could not full take advantage of the opportunity to meet market demand for bermudagrass sod since their production fields were damaged and limited sod was available for harvest. Consequently, improved high quality seeded and vegetatively propagated turf-type bermudagrasses were needed to better resist the effects of harsh winters and less damage from severe winter-kill events.
What has been done
The Oklahoma State University Bermudagrass Development Team with funding and support from the Oklahoma Agricultural Experimental Station (OAES) and the United States Golf Association from 1986 to date has breed tens of thousands of lines of experimental bermudagrasses. These bermudagrasses have been screening in-depth in Oklahoma for improved winter-hardiness, seed set, establishment rate, pest resistance and overall quality. Only a handful of the most elite performers were sent on for national testing with the National Turfgrass Evaluation Program (NTEP). Additional on-site testing was performed with selected sod and seed producers interested in future production of high quality, improved bermudagrasses with potential for improved profit margins.
Results
To date, we have commercialized and obtained proprietary protection on Yukon and Riviera seeded bermudagrasses as well as Patriot, Latitude 36 and NorthBridge vegetatively propagated bermudagrasses. Seed production licenses for large scale production were granted to one national firm each for Yukon and Riviera seeded bermudagrasses. The licensed seed producer of Riviera bermudagrass has allowed four quality-minded sod producers to produce Riviera bermudagrass sod. These two seeded bermudagrass lines were adopted as standards in the

2013-2018 NTEP bermudagrass trial due to excellent performance and their first-class winter hardiness in seeded turf-type bermudagrass options. Nine sod producers in eight states produce and sell Patriot bermudagrass. Latitude 36 and NorthBridge bermudagrasses were licensed to Sod Solutions who has sublicensed each product to 19 sod producers in eight states. Patriot and Latitude 36 remain a standard for cold hardiness in vegetatively propagated turf bermudagrass in the current 2013-2018 NTEP bermudagrass. Sod producers are able to make at least a three to five cent per square foot premium on production of high quality winter-hardy bermudagrasses and to somewhat escape the "commodity-like" market place of variety-not-stated common bermudagrass sod production which keeps sale prices and grower profits reduced in the industry as a whole. In 2013, 6 and 7 new sublicensees of NorthBridge and Latitude 36 Turf bermudagrasses, respectively, were licensed by our representative, Sod Solutions LLC outside of Oklahoma. The first sod and sprigs from the 2013 producers should be available in the marketplace in late 2014. In 2013, the OSU generated bermudagrass Latitude 36 was installed on two NFL stadiums while NorthBridge was installed on the playing surface at one Major Lead Baseball stadium and one NFL stadium. These installs show the high level of acceptance of the OSU bermudagrasses that demonstrated improved winter hardiness, visual quality and high levels of traffic tolerance. Replacement of winter-susceptible type bermudagrass will be a multi-year, on-going process.
4. Associated Knowledge Areas
KA Code
Knowledge Area
202
Plant Genetic Resources
203
Plant Biological Efficiency and Abiotic Stresses Affecting Plants
205
Plant Management Systems
Outcome #3
1. Outcome Measures
Number of sod/seed producers growing Oklahoma proven turf bermudagrasses
2. Associated Institution Types
● 1862 Extension
● 1862 Research
3a. Outcome Type:
Change in Action Outcome Measure
3b. Quantitative Outcome
Year
Actual
2013
6
3c. Qualitative Outcome or Impact Statement
Issue (Who cares and Why)
For 5 decades, 90% of the square footage of warm-season varieties produced and sold as bermudagrass and zoysiagrass sod in Oklahoma consisted of common bermudagrass sold as U-3, Tifway (419) hybrid bermudagrass and Meyer (Z-52) zoysiagrass. These grasses were

considered the standards for operating a successful sod production business and standards understood by the purchasing lawn and landscape industry. However, turfgrass cultivar development programs both within and outside of Oklahoma had generated a number of cultivars with superior quality and stand persistence that were either equal or better in performance than the long term standards in addition to exhibiting higher genetic purity than the old standards.
What has been done
Research, demonstration and extension education efforts intensified in the early 1990s and continue today in an effort to increase product choice available for the consumer and professional alike. A series of 10 trials with newly commercialized and old standard variety bermudagrasses and zoysiagrasses were conducted over the last 24 years to demonstrate to sod producers, seed producers and end users the field performance of newly commercialized varieties compared to old industry standard types. A yearly turfgrass conference and trade show as well as alternate year field day, extension fact sheets and over 14,000 one on one consultations (average of 608 per year) have been conducted over 23 years to these customer groups to discuss new turfgrass options available for licensing, production and purchase.
Results
While U-3, Tifway and Meyer zoysiagrass still make up the greatest majority of square footage of sales to the construction market, approximately 15% (9 of 60 total producers) of the sod production industry in Oklahoma have diversified production to include Astro hybrid bermudagrass, El Toro zoysiagrass and various new tall fescue/Kentucky bluegrass blends. Additionally, 5% of the total producers (3 of 60) producers have diversified to include new proprietary bermudagrasses Riviera, Patriot, Latitude 36 and Northbridge which have superior performance traits compared to old standard types. The new proprietary types offer a 3 to 5 cent per square foot profit potential over older standard types. Adoption of proprietary types is limited based on market structure, requirement for pedigree stock production standards and a cap set on number of producers licensed and in some cases limited access to markets due to presence of "no sole source bid" restrictions. It is hoped that the visibility of successes in production of new proprietary types will lead to increased willingness by producers to adopt additional new varieties in the future as they become available for production.
4. Associated Knowledge Areas
KA Code
Knowledge Area
202
Plant Genetic Resources
203
Plant Biological Efficiency and Abiotic Stresses Affecting Plants
205
Plant Management Systems
Outcome #4
1. Outcome Measures
Percentage of professionally managed properties using improved turfgrasses
2. Associated Institution Types
● 1862 Extension
● 1862 Research
3a. Outcome Type:
Change in Action Outcome Measure

3b. Quantitative Outcome
Year
Actual
2013
13
3c. Qualitative Outcome or Impact Statement
Issue (Who cares and Why)
What has been done
Results
4. Associated Knowledge Areas
KA Code
Knowledge Area
205
Plant Management Systems
Outcome #5
1. Outcome Measures
Percentage of professional fine turf managers continuing adoption of BMPs and IPM
2. Associated Institution Types
● 1862 Extension
● 1862 Research
3a. Outcome Type:
Change in Action Outcome Measure
3b. Quantitative Outcome
Year
Actual
2013
96
3c. Qualitative Outcome or Impact Statement
Issue (Who cares and Why)
A majority of both biotic and abiotic problems facing turfgrass managers can be reduced or completely controlled through the use of Best Management Practices (BMPs) and Integrated Pest Management (IPM) strategies. Use of the best adapted cultivars of turfgrass is the cornerstone of both a successful BMP and IPM program. Pests continue to evolve to exploit weaknesses in defense systems posed by turfgrasses. Because of this arms race between predator and prey or pest and host plant, continued development of and implementation of use of improved turfgrasses and improved management practices will be required for the foreseeable future, just as in any cropping system.
What has been done

Each year over 200 turfgrass industry professionals attend the annual Oklahoma Turfgrass Conference and Trade Show, while another 300 attend various approximately 15 pest management sessions offered by various Turfgrass team members around the state. Over 1,100 professionals receive one-on-one consultations by either phone, email or site visits each year. Simple post conference surveys are administered at several of the sessions and following the annual Turfgrass conference to perform a simple assessment of adoption of improved turf management practices.
Results
Recent surveys following yearly education sessions to professional Turfgrass managers have revealed that 96% of attendees are employing techniques that are Best Management Practices. These practices can involve use of newer or best adapted cultivars/species, soil-test based fertility programs, selection of proper mowing and irrigation regimes as well as regular pest scouting and use of economic thresholds concerning treat or no treat decisions. Use of BMPs and IPM helps reduce un-necessary pesticide and reduce over use of fertilizers and irrigation, yield an acceptable Turfgrass stand at an affordable/acceptable cost.
4. Associated Knowledge Areas
KA Code
Knowledge Area
205
Plant Management Systems
216
Integrated Pest Management Systems
Outcome #6
1. Outcome Measures
Percentage of ODOT roadside vegetation managers continuing adoption of BMPs and IPM
2. Associated Institution Types
● 1862 Extension
3a. Outcome Type:
Change in Action Outcome Measure
3b. Quantitative Outcome
Year
Actual
2013
100
3c. Qualitative Outcome or Impact Statement
Issue (Who cares and Why)
An erosion resistant, aesthetically pleasing, low growing, low maintenance vegetation is required for the 240,000 acres of state department of transportation maintained right of way adjacent to concrete and asphalt roads in Oklahoma.
What has been done
For 27 years the Oklahoma State University Roadside Vegetation Management Team has been performing annual research and extension education aimed at development of Best Management Practices (BMP) as well as Integrated Pest Management Practices (IPM) for Oklahoma

Department of Transportation vegetation management employees.
Results
The OSU RVM team annually trains over 700 ODOT employees in BMPs and IPM. Each employee has adopted at least one (and often several more) of the BMP and IPM techniques transferred through the 3 annual initial pesticide applicator certification schools, 3 annual herbicide sprayer calibration workshops and 15 annual continuing education workshops. There is no single practice or always a ridge set of practices to solve any given problem. ODOT uses an integrated vegetation selection, mowing and herbicide application program to manage the 240,000 acres of right of way. Each ODOT employee engaged in roadside management is using at the minimum at least one integrated practice. Adoption of BMPs and IPM techniques coupled with integration of the latest research results into product bid specifications followed by competitive bid process results annually in a savings of over $120,000 in ODOT roadside vegetation maintenance costs.
4. Associated Knowledge Areas
KA Code
Knowledge Area
205
Plant Management Systems
216
Integrated Pest Management Systems
V(H). Planned Program (External Factors)
● Natural Disasters (drought, weather extremes, etc.)
● Economy
● Appropriations changes
● Public Policy changes
● Government Regulations
● Competing Public priorities
● Competing Programmatic Challenges
Brief Explanation
Drought continues to have negative effects on research and demonstration.
V(I). Planned Program (Evaluation Studies)
Evaluation Results
Recent surveys following yearly education sessions to professional Turfgrass managers have revealed that
96% of attendees are employing techniques that are Best Management Practices. These practices can involve use
of newer or best adapted cultivars/species, soil-test based fertility programs, selection of proper mowing and
irrigation regimes as well as regular pest scouting and use of economic thresholds concerning treat or no treat
decisions. Use of BMPs and IPM helps reduce un-necessary pesticide and reduce over use of fertilizers and
irrigation, yield an acceptable Turfgrass stand at an affordable/acceptable cost.
Key Items of Evaluation

V(A). Planned Program (Summary)
Program # 9
1. Name of the Planned Program
Community Resource and Economic Development
Reporting on this Program
V(B). Program Knowledge Area(s)
1. Program Knowledge Areas and Percentage
KA Code
Knowledge Area %1862 Extension
%1890 Extension
%1862 Research
%1890 Research
608 Community Resource Planning and Development
100% 100%
Total 100% 100%
V(C). Planned Program (Inputs)
1. Actual amount of FTE/SYs expended this Program
Year: 2013 Extension Research
1862 1890 1862 1890
Plan 9.0 0.0 1.0 0.0
Actual Paid Professional 13.0 0.0 5.7 0.0
Actual Volunteer 9.2 0.0 0.0 0.0
2. Actual dollars expended in this Program (includes Carryover Funds from previous years)
Extension Research
Smith-Lever 3b & 3c 1890 Extension Hatch Evans-Allen
360707 0 251263 0
1862 Matching 1890 Matching 1862 Matching 1890 Matching
360707 0 251263 0
1862 All Other 1890 All Other 1862 All Other 1890 All Other
981293 0 1429269 0
V(D). Planned Program (Activity)
1. Brief description of the Activity
Strategic planning training and strategic planning for communities, infrastructure planning, community service plans, medical facilities and services planning, training of county elected officials, engineering and manufacturing consulting, community economic development studies, community leadership and agricultural leadership development, and entrepreneurship training and development.
2. Brief description of the target audience
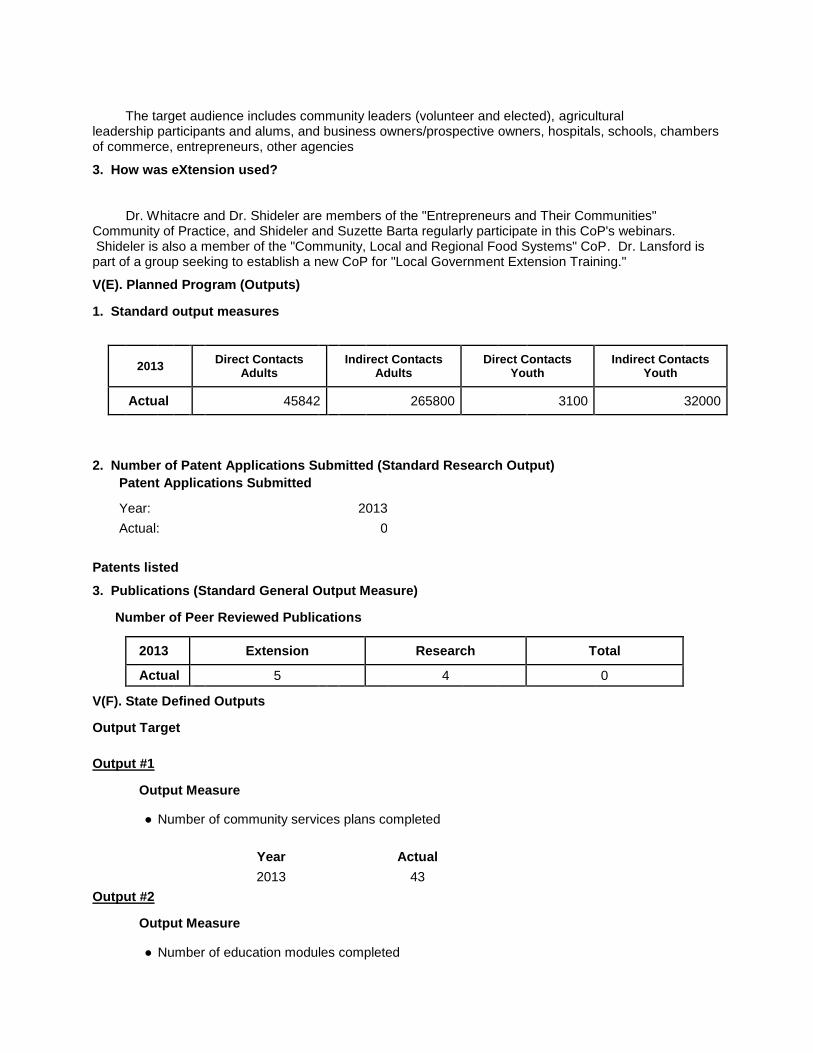
The target audience includes community leaders (volunteer and elected), agricultural leadership participants and alums, and business owners/prospective owners, hospitals, schools, chambers of commerce, entrepreneurs, other agencies
3. How was eXtension used?
Dr. Whitacre and Dr. Shideler are members of the "Entrepreneurs and Their Communities" Community of Practice, and Shideler and Suzette Barta regularly participate in this CoP's webinars. Shideler is also a member of the "Community, Local and Regional Food Systems" CoP. Dr. Lansford is part of a group seeking to establish a new CoP for "Local Government Extension Training."
V(E). Planned Program (Outputs)
1. Standard output measures
2013 Direct Contacts
Adults Indirect Contacts
Adults Direct Contacts
Youth Indirect Contacts
Youth
Actual 45842 265800 3100 32000
2. Number of Patent Applications Submitted (Standard Research Output)
Patent Applications Submitted
Year: 2013
Actual: 0
Patents listed
3. Publications (Standard General Output Measure)
Number of Peer Reviewed Publications
2013 Extension Research Total
Actual 5 4 0
V(F). State Defined Outputs
Output Target
Output #1
Output Measure
● Number of community services plans completed
Year Actual
2013 43
Output #2
Output Measure
● Number of education modules completed

Year Actual
2013 54
Output #3
Output Measure
● Number of county officer training courses conducted
Year Actual
2013 67
Output #4
Output Measure
● Number of manufacturing firms receiving applications engineering assistance
Year Actual
2013 77

V(G). State Defined Outcomes
V. State Defined Outcomes Table of Content
O. No. OUTCOME NAME
1 Number improving business skills
2 Number of manufacturing jobs created or retained
3 Number of communities where capacity was increased
4 Number of participants that plan to open/expand a business
5 Number of communities that build plans for growth and/or improvement
6 Number of leadership class graduates actively participating in community or industry
7
Providing Board Training/Technical Assistance to Emergency Medical Service (EMS) 522 Boards
8 Retail Trade and Economic Impact Analysis
9 Number of People Attending Environmental Law Enforcement - Not Just for Officers
10
Solid Waste Association of North America Symposium, Certificate Training, and Facilities Tours - Number Certified
11 Number Attending the Oklahoma Recycling Association Conference
12 Number of Leadership Wagoner County Graduates in Public Service
Outcome #1
1. Outcome Measures
Number improving business skills
2. Associated Institution Types
● 1862 Extension
3a. Outcome Type:
Change in Knowledge Outcome Measure
3b. Quantitative Outcome
Year
Actual
2013
606
3c. Qualitative Outcome or Impact Statement
Issue (Who cares and Why)
What has been done
Results
4. Associated Knowledge Areas
KA Code
Knowledge Area
608
Community Resource Planning and Development
Outcome #2
1. Outcome Measures
Number of manufacturing jobs created or retained
2. Associated Institution Types
● 1862 Extension
3a. Outcome Type:
Change in Condition Outcome Measure
3b. Quantitative Outcome
Year
Actual
2013
290

3c. Qualitative Outcome or Impact Statement
Issue (Who cares and Why)
Of the over 5,000 manufacturers in Oklahoma, approximately half are located in rural areas and are extremely important to their local economies. The loss or downsizing of even one of these wealth-generating small or mid-sized companies can have devastating consequences for the host and surrounding communities. These rural firms face particular difficulty in getting relevant and usable information and technical assistance that will keep them abreast of the rapid changes in manufacturing technology.
What has been done
To address the difficulties faced by our small rural manufacturers, the College of Engineering, Architecture and Technology and the Division of Agricultural Sciences and Natural Resources at Oklahoma State University work in partnership to provide technical assistance through the Applications Engineering program. Since 1997, Applications Engineers have been deployed in the state in collaboration with the Oklahoma Cooperative Extension Service and the Oklahoma Manufacturing Alliance to provide on-site engineering assistance. In order to receive engineering assistance the client must agree to a post-project impact assessment. This impact assessment is done using procedures developed by the National Institute for Standards and Technology for the Manufacturing Extension Partnership. The client is contacted some months after the completion of an activity and is asked a series of questions designed to assess the impact of the effort.
Results
The impact of this program is measured in several ways. One is the economic value of the service to the company as reported by the client. Another measure is the number of jobs created or retained. Both impacts are measured by an independent survey of the client. Number of jobs created or retained is translated into economic impact using an income multiplier to compute the direct, indirect, and induced effects due to a change in the number of jobs in the manufacturing sector. The multiplier was developed from data collected from two different sources. First, the average salary for manufacturing in Oklahoma ($34,323) was taken from the U.S. Bureau of Labor Statistics published information for 2001. Secondly, the income multiplier of 2.2 was obtained from IMPLAN data for Oklahoma. The total economic impact can be computed by multiplying the average annual salary times the income multiplier to arrive at $75,511 for each new or retained job in the manufacturing sector. In 2013, the Applications Engineers client projects had the following impacts: Sales increase $47,916,000 Sales retained that would have otherwise been lost $14,451,065 Cost savings $6,840,674 Costs avoided $4,507,187 150 new jobs created at $75,511 per job $11,326,650 140 jobs retained at $75,511 per job $10,571,540 Investment in new plant facilities and equipment $20,773,569 Total impact $116,386,685
4. Associated Knowledge Areas
KA Code
Knowledge Area
608
Community Resource Planning and Development

Outcome #3
1. Outcome Measures
Number of communities where capacity was increased
2. Associated Institution Types
● 1862 Extension
● 1862 Research
3a. Outcome Type:
Change in Condition Outcome Measure
3b. Quantitative Outcome
Year
Actual
2013
18
3c. Qualitative Outcome or Impact Statement
Issue (Who cares and Why)
This process, known as a Community Health Needs Assessment (CHNA), is required for all nonprofit hospitals by the Affordable Care Act of 2010. Penalties for non-compliance are assessed through the IRS. The process developed by Oklahoma Cooperative Extension Service (OCES) meets this requirement and also provides a forum for a discussion on health between the hospital and community.
What has been done
OCES, in conjunction with the Oklahoma Office of Rural Health, led 18 communities through a facilitation process focused on community-level health in 2013. The CHNA is a four-meeting process between the local hospital and a wide sampling of community members, and is typically completed in 2-4 months. Three different methods of gathering relevant information are used: (1) demographic, economic, and health indicator data from secondary sources; (2) a survey completed by local residents (available both in print and online); and (3) focus-group meetings of community members. The CHNA process was significantly streamlined in 2013 to meet the pressing time restrictions faced by many rural hospitals. A comprehensive report was also generated that summarized each CHNA product and meeting that took place, including a listing of priorities derived and implementation steps for each priority. The creation of this report (typically published to their website) further assists hospitals in documenting and sharing information derived from the process.
Results
A total of 18 communities completed their CHNA in 2013 yielding 83 staff papers completed. A total of 55 community meetings were held during the year, with 800 individual participants, specifically for the CHNA process. One notable relationship created in 2013 was with Mercy-affiliated hospitals. Six of Mercy's rural facilities completed their CHNA during the year.

The CHNA process is offered at no cost to all facilities. Private-market vendors exist offering to meet the same needs, but their costs and products vary significantly some between $10,000 and $20,000. Other states (Kansas and Kentucky) with similar collaborations among state agencies and resources charge between $5,000 and $7,000 per community. Therefore, if the average of $6,000 per community were applied, a total value of $108,000 could be assumed in 2013 alone. Success stories emerged after the process was completed in several communities that participated. This included a pilot weight loss institute in Cleveland and the creation of community-level committees in Idabel to dig deeper into the health priorities identified.
4. Associated Knowledge Areas
KA Code
Knowledge Area
608
Community Resource Planning and Development
Outcome #4
1. Outcome Measures
Number of participants that plan to open/expand a business
2. Associated Institution Types
● 1862 Extension
● 1862 Research
3a. Outcome Type:
Change in Action Outcome Measure
3b. Quantitative Outcome
Year
Actual
2013
105
3c. Qualitative Outcome or Impact Statement
Issue (Who cares and Why)
Small businesses in rural areas tend to struggle to establish a market presence and compete in today's economy.
What has been done
During 2013, the Oklahoma State University e-commerce program provided training to 105 small businesses on how to plan, effectively set up, and promote their websites, which can help address these issues. Of the 2013 participants, ratings for all relevant e-commerce workshops were quite high. We offered 4 workshops geared to those business owners without websites, and our "Websites 101" class was attended by 40 different people. We held 2 workshops targeted towards individuals or small businesses that might want to consider selling online via an online storefront (Amazon, eBay, or Etsy) instead of building a site themselves. We also held 2 workshops focused on small business owners who already had a website, but were interested in making it more visible. These workshops on Search Engine Optimization proved to be quite popular.

Results
Response to each of these different workshops has been extremely positive. After the training, 92% of respondents planned on increasing their web efforts, and 93% indicated that they would be changing the way they marketed their website. These half-day, hands-on sessions are positively impacting rural businesses as evidenced by success stories of former attendees. These include those who used simple template-based software programs used in the workshops to set up their own websites (an example still in the works is Silk Coins based out of Tulsa), began selling online via an online storefront (such as Butterfly Boutique, who now sells on Etsy and is based in Seminole), or made successful changes to their own site (for example, www.davis-air.com in Lawton utilized many of the SEO examples we suggested to increase their visitors by 15%). Further, anecdotal evidence suggests that the improved advertising offered by a website can increase small business sales anywhere from 20% to over 200%. With average sales of $150,000 (which was the average displayed in a small business report by Mississippi State in 2007) this implies that the e-commerce program increased the revenue of small businesses in Oklahoma by between $2.1M and $21.0M during 2013.
4. Associated Knowledge Areas
KA Code
Knowledge Area
608
Community Resource Planning and Development
Outcome #5
1. Outcome Measures
Number of communities that build plans for growth and/or improvement
2. Associated Institution Types
● 1862 Extension
3a. Outcome Type:
Change in Action Outcome Measure
3b. Quantitative Outcome
Year
Actual
2013
4
3c. Qualitative Outcome or Impact Statement
Issue (Who cares and Why)
Rural communities often struggle with economic development efforts due to their isolation/lack of access to sizable markets, limited infrastructure and workforce, and limited human capacity. Stronger Economies Together (SET) is a program which brings together multiple counties to work together and develop a regional economic development plan that builds upon the existing resources within the region.
What has been done
Oklahoma participated in Phases III and IV of USDA?s Stronger Economies Together (SET) program, which is focused on developing regional partnerships among rural counties. These counties work together to build a high-quality regional plan that is focused on their economic
strengths. Two regions in Oklahoma were selected to participate in Phase III ? the Western OK I-40 Corridor team (4 counties along I-40 in western OK), and the Kiamichi regional team (6 counties in southeastern OK). During 2013, each team completed 6 modules, averaging 30+ participants at each meeting. A wide variety of organizations participated in each meeting, ranging from economic development professionals, to city managers, to business owners, to representatives of the retirement or religious communities. Each region works together to understand their strengths and plan where they want to go in the future. Two additional regions were selected to participate in Phase IV of SET: South Central Oklahoma (5 counties to the south of Pontotoc County) and Route 66 Community Partners (Creek, Lincoln and Payne Counties). These regions each completed 2 modules during 2013.
Results
Western OK I-40 region completed an additional module on entrepreneurship and submitted their plan for peer review. The relationships developed across county boundaries in all four regions will have lasting impacts for years to come.
4. Associated Knowledge Areas
KA Code
Knowledge Area
608
Community Resource Planning and Development
Outcome #6
1. Outcome Measures
Number of leadership class graduates actively participating in community or industry
2. Associated Institution Types
● 1862 Extension
3a. Outcome Type:
Change in Action Outcome Measure
3b. Quantitative Outcome
Year
Actual
2013
26
3c. Qualitative Outcome or Impact Statement
Issue (Who cares and Why)
The Oklahoma Agricultural Leadership Program (OALP)empowers and develops emerging agriculture and community leaders. This is very important because members of OALP are strong advocates for Oklahoma agriculture. OALP graduates have a greater understanding of people and processes. They also have a greater understanding of various systems of economics and government, both locally and nationally, and are able to solve problems and explore opportunities for Oklahoma agriculture and rural communities.
What has been done
During 2013, 26 participants spent 25 days learning about leadership and empowering their leadership skills. This experience resulted in participants being more vocal in sharing with their
local representatives about issues that are important to Oklahoma agriculture and their rural communities.
Results
Several current members of Class XVI have new positions since being in the OALP. Brent Howard was appointed by Governor Mary Fallin as a Regent for Western Oklahoma State College in Altus. Chris Kidd was named Vice President of Organization and Membership for Oklahoma Farm Bureau. Jennifer Jensen accepted a sales position with Dow AgroSciences in Indianapolis, Indiana and has recently been transferred to an office in Fargo, South Dakota. Sandra Stevenson is the Director of the Oklahoma Small Business Development Centers at East Central University in Ada. Debbie Wedel is a Credit Analyst with the National Livestock Credit Corporation in Oklahoma City.
4. Associated Knowledge Areas
KA Code
Knowledge Area
608
Community Resource Planning and Development
Outcome #7
1. Outcome Measures
Providing Board Training/Technical Assistance to Emergency Medical Service (EMS) 522 Boards
2. Associated Institution Types
● 1862 Extension
3a. Outcome Type:
Change in Knowledge Outcome Measure
3b. Quantitative Outcome
Year
Actual
2013
0
3c. Qualitative Outcome or Impact Statement
Issue (Who cares and Why)
EMS systems in Oklahoma are challenged financially to continue operations and provide needed services to community members residing within their district. One funding alternative is the establishment of a 522 district to fund EMS. The special taxation district establishes an annual recurring ad valorem tax levy of not more than three mills per dollar of assessed valuation of taxable property in the district. The initial members of the board are appointed by the board(s) of county commissioners of the newly-formed district.
What has been done
The Oklahoma Cooperative Extension Service at Oklahoma State University, in cooperation with Oklahoma State Department of Health (OSDH) Emergency and Trauma systems, provides two guidebooks for 522 EMS District Boards. The introduction of theses guidebooks and technical assistance is available to all new and existing 522 Boards. Specific programs in 2013 were designed to provide educational assistance to community leaders.
Results
1. One meeting in Ottawa County to discuss the passing of their new countywide 522 district. Approximately 30 people including a county commissioner and representatives of the fire department, two EMS providers operating within the district, local hospital and 522 Board members. 2. Many phone conversations were held with the City of Thomas concerning the establishment of a 522 special taxation district. A meeting was held with approximately 35 community members including the EMS employees, city employees from Custer, Fay and Thomas, County Commissioners from Custer County and Dewey County, the County Assessor from Custer County, OSDH representatives, etc. 3. The election for the 522 Thomas School District passed and another meeting was held with the newly appointed board members to present the guidebooks and provide technical assistance to the five newly appointed board members and 2 county commissioners.
4. Associated Knowledge Areas
KA Code
Knowledge Area
608
Community Resource Planning and Development
Outcome #8
1. Outcome Measures
Retail Trade and Economic Impact Analysis
2. Associated Institution Types
● 1862 Extension
3a. Outcome Type:
Change in Condition Outcome Measure
3b. Quantitative Outcome
Year
Actual
2013
0
3c. Qualitative Outcome or Impact Statement
Issue (Who cares and Why)
Municipal governments rely heavily on sales tax collections for revenue, and retail sales contribute to local quality of life. Yet, many communities in OK lack the human capital necessary to track and identify new retail opportunities.
What has been done
Retail Trade Analysis continues to be a popular Extension program, providing nine communities with data useful to evaluating their retail development programs and creating new retail

opportunities.
Results
One example of high impact results is that Tommy Kramer, Executive Director of the Durant Industrial Authority, requests the reports annually to identify and target new retail establishments for Durant, OK. Particular successes he has had involving this data was securing new, national retail chains like Hibbett Sports and Rue 21 clothing store to the city of Durant.
4. Associated Knowledge Areas
KA Code
Knowledge Area
608
Community Resource Planning and Development
Outcome #9
1. Outcome Measures
Number of People Attending Environmental Law Enforcement - Not Just for Officers
2. Associated Institution Types
● 1862 Extension
3a. Outcome Type:
Change in Knowledge Outcome Measure
3b. Quantitative Outcome
Year
Actual
2013
67
3c. Qualitative Outcome or Impact Statement
Issue (Who cares and Why)
Communication is not always excellent among those with environmental enforcement authority, sometimes because one organization does not understand how another works. This can result in ineffective enforcement.
What has been done
Sixty seven individuals participated in three Environmental Law Enforcement Trainings targeted at Officers, Tribal Environmental Officials, Storm Water Permittees, and citizens in general.
Results
All attendees felt that the quality of the training, the training facilities, and the handouts/resources were above average to excellent. As a result, additional Law Enforcement Trainings have been scheduled for 2014 as well as a pilot conference for the above three groups with enforcement authority. A conference including these three distinct groups that often must work together has not been held in Oklahoma before.
4. Associated Knowledge Areas
KA Code
Knowledge Area

608
Community Resource Planning and Development
Outcome #10
1. Outcome Measures
Solid Waste Association of North America Symposium, Certificate Training, and Facilities Tours - Number Certified
2. Associated Institution Types
● 1862 Extension
3a. Outcome Type:
Change in Knowledge Outcome Measure
3b. Quantitative Outcome
Year
Actual
2013
11
3c. Qualitative Outcome or Impact Statement
Issue (Who cares and Why)
Solid Waste facilities personnel have to maintain certification in their area of expertise.
What has been done
This symposium offers continuing education credits for SWM professionals. The Certificate Training offers SWM professionals the opportunity to become certified in a new area. The Facilities Tour offers all participants to see state of the art facilities. All offer SWM professionals the opportunity to network with other professionals and with vendors.
Results
One hundred twenty from 40 communities around OK participated in the Symposium and 11 participated in the Certification course. All were pleased with the opportunity.
4. Associated Knowledge Areas
KA Code
Knowledge Area
608
Community Resource Planning and Development
Outcome #11
1. Outcome Measures
Number Attending the Oklahoma Recycling Association Conference
2. Associated Institution Types

● 1862 Extension
3a. Outcome Type:
Change in Knowledge Outcome Measure
3b. Quantitative Outcome
Year
Actual
2013
109
3c. Qualitative Outcome or Impact Statement
Issue (Who cares and Why)
Recycling activities and infrastructure are not equal across the state and there is a great advantage in bringing people who share this interest together to learn from one another.
What has been done
The annual OKRA Conference was held on October 17, 2013. The theme was ?Recycling Trends: Past, Present, & Future.?
Results
There were 109 attendees from 30 OK communities and three from out of state. Just over 92% of the participants said that they had received the information that they hoped for. Just over 60% of participants suggested that the location be moved around the state to make it more accessible to those in rural areas rather than holding it in Stillwater each year. That request is before the Board when they meet during the third week of February. A Master Recyclers course is being considered for 2014.
4. Associated Knowledge Areas
KA Code
Knowledge Area
608
Community Resource Planning and Development
Outcome #12
1. Outcome Measures
Number of Leadership Wagoner County Graduates in Public Service
2. Associated Institution Types
● 1862 Extension
3a. Outcome Type:
Change in Condition Outcome Measure
3b. Quantitative Outcome
Year
Actual
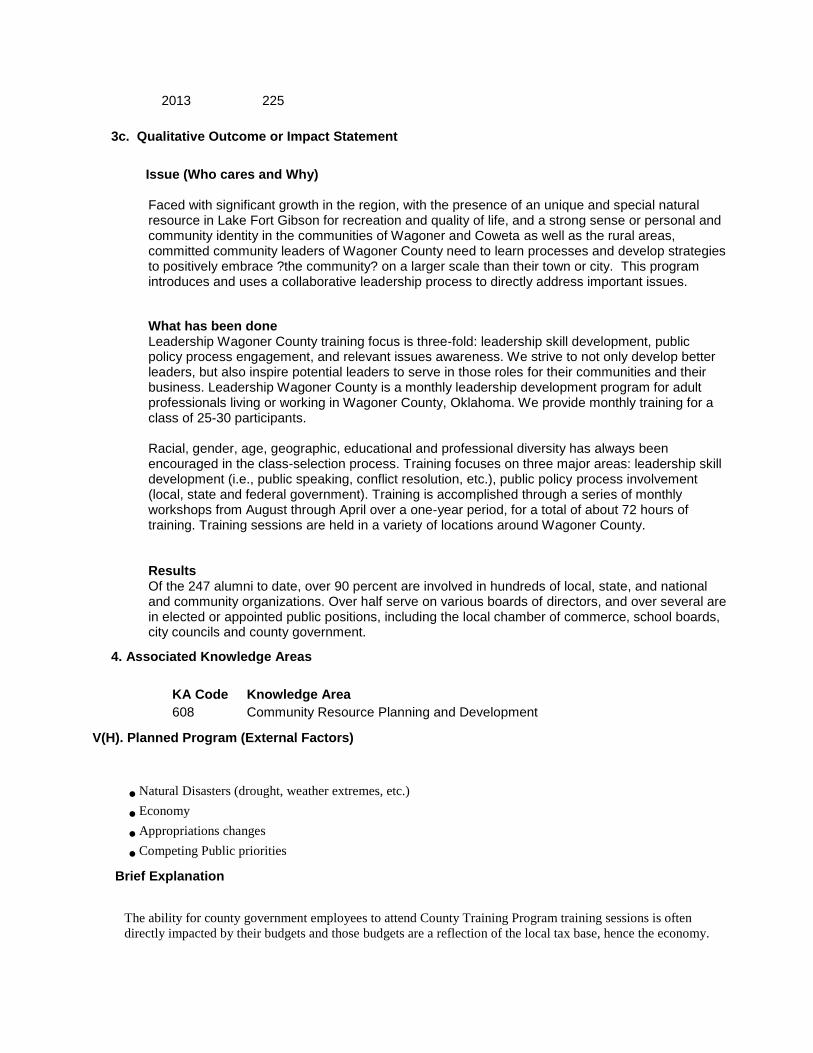
2013
225
3c. Qualitative Outcome or Impact Statement
Issue (Who cares and Why)
Faced with significant growth in the region, with the presence of an unique and special natural resource in Lake Fort Gibson for recreation and quality of life, and a strong sense or personal and community identity in the communities of Wagoner and Coweta as well as the rural areas, committed community leaders of Wagoner County need to learn processes and develop strategies to positively embrace ?the community? on a larger scale than their town or city. This program introduces and uses a collaborative leadership process to directly address important issues.
What has been done
Leadership Wagoner County training focus is three-fold: leadership skill development, public policy process engagement, and relevant issues awareness. We strive to not only develop better leaders, but also inspire potential leaders to serve in those roles for their communities and their business. Leadership Wagoner County is a monthly leadership development program for adult professionals living or working in Wagoner County, Oklahoma. We provide monthly training for a class of 25-30 participants. Racial, gender, age, geographic, educational and professional diversity has always been encouraged in the class-selection process. Training focuses on three major areas: leadership skill development (i.e., public speaking, conflict resolution, etc.), public policy process involvement (local, state and federal government). Training is accomplished through a series of monthly workshops from August through April over a one-year period, for a total of about 72 hours of training. Training sessions are held in a variety of locations around Wagoner County.
Results
Of the 247 alumni to date, over 90 percent are involved in hundreds of local, state, and national and community organizations. Over half serve on various boards of directors, and over several are in elected or appointed public positions, including the local chamber of commerce, school boards, city councils and county government.
4. Associated Knowledge Areas
KA Code
Knowledge Area
608
Community Resource Planning and Development
V(H). Planned Program (External Factors)
● Natural Disasters (drought, weather extremes, etc.)
● Economy
● Appropriations changes
● Competing Public priorities
Brief Explanation
The ability for county government employees to attend County Training Program training sessions is often
directly impacted by their budgets and those budgets are a reflection of the local tax base, hence the economy.

Appropriations changes - losing both area community development specialists has limited my ability to be
responsive to requests for services - either because the services take longer to render, or I cannot commit time to
be physically present for meetings/programming.
Competing public priorities - certainly the drought has shifted some of my time away from traditional CRED
programming to generate the annual impact of the drought and engage constituents about developing additional
measures of impact (e.g., wildfire impacts, municipal and business impacts).
Natural Disasters: There were four Environmental Law Enforcement Trainings scheduled. One had to be
cancelled because of ongoing tornado cleanup from the twisters in May, 2013.
Appropriation Changes: The Solid Waste Management Grant for 2013-2014 was reduced by about 10% by the
USDA. OCES stepped up to make up part of the difference. Still, two program partners had to be removed from
the plan of work - Blue Thumb and Green Schools.
The topic of the SWANA Symposium and Certificate Course for 2014 (Disaster Debris Management) is directly
related to the serious tornados in the state in May of 2013.
Economy - Some OALP donors reduced or eliminated financial support to the program during 2013 as a result
of the effects of the drought and the decrease in farm/ranch income. The reduction was luckily made up by other
donors stepping forward to support the program. However, the financial uncertainty is always a concern for our
program.
Appropriations changes - State legislators reduced support to OALP by $10,000 in FY 2011 and this reduction
has continued since. This continued reduction has a negative impact on the educational and leadership
experiences that can be provided to class members because of the continued increase in costs for transportation
and lodging during seminars.
V(I). Planned Program (Evaluation Studies)
Evaluation Results
Applications Engineering / Manufacturing Consulting Program -Upon the completion of each project, the
program's clients are surveyed to determine their level of satisfaction with the support received and to assess the
impacts made.
In 2013, the Applications Engineers client projects had the following impacts:
Sales increase
$47,916,000
Sales retained that would have otherwise been lost
$14,451,065
Cost savings
$6,840,674
Costs avoided
$4,507,187
150 new jobs created at $75,511 per job
$11,326,650
140 jobs retained at $75,511 per job
$10,571,540
Investment in new plant facilities and equipment

$20,773,569
Total impact
$116,386,685
Community Health Needs Assessment (CHNA) Program -The CHNA team (OCES and the Office of Rural
Health) now meets with communities who have completed the process at regular intervals post-completion: 6
months, 12 months, and 18 months after the final community meeting. These meetings assess how well the
hospital / community are meeting the goals laid out in their implementation plan. The CHNA team is preparing
to share "best practices" from communities across the state in terms of programs and services implemented to
better serve their local communities. The Affordable Care Act requires that 501(c)3 hospitals conduct a CHNA
every 3 years, so this regular evaluation will be crucial in determining the future health needs of the community.
The CHNA team currently utilizes surveys at the completion of the economic impact and survey presentation
meetings for the community members present. Also, the CHNA team encourages hospital administration to
complete an overall evaluation of the process upon completion.
County Training Program (CTP) - All county government personnel program participants were polled via
Survey Monkey regarding the educational programs attended July - Dec. 2013. 90.7% reported a positive
experience. 89.6% said that they learned something that will have an impact back in their community. Here is
an example of specific impacts that respondents provided:
o This (training) could save money in the Court System as well as free up Sheriff's Deputies from transporting
juveniles thus saving the County money also.
o The class helped me realize how important time management and attitude are in my job and therefore, make
me a better employee for the county. I also learned some more effective social skills while interacting with the
citizens I see each day.
o In the future when interest rates increase, we'll have the tools necessary to ensure the county receives the
most interest possible from its investments
o How to prevent or reduce the amount of lawsuits
o By selecting a company to go with by using the bidding sorting they showed us it will help us out by
selecting the best equipment and company to go with while saving the county money to where we can spend that
money on fixed the roads like putting in culverts, laying rock, fixing bridges. etc. also while keeping better track
of our inventory it will help us know what we have and the shape it's in.
E-Commerce Program -Surveys delivered immediately after each workshop validate the content and also
provided input for related topics of interest for rural businesses. Evaluation results have been very positive for
all "Website 101," "Introduction to PayPal," "Getting Your Business Found on the Internet," and "The Ins and
Outs of Online Storefronts" workshops. Future workshops will continue to include suggestions from previous
surveys and will seek to address hot e-commerce topics, such as Google advertising, Facebook advertising, and
Web 2.0 techniques.
Key Items of Evaluation
See Above
V(A). Planned Program (Summary)
Program # 10
1. Name of the Planned Program
Integrated Pest Management
Reporting on this Program
V(B). Program Knowledge Area(s)
1. Program Knowledge Areas and Percentage
KA Code
Knowledge Area %1862 Extension
%1890 Extension
%1862 Research
%1890 Research
133 Pollution Prevention and Mitigation 5% 10%
202 Plant Genetic Resources 3% 5%
205 Plant Management Systems 10% 10%
211 Insects, Mites, and Other Arthropods Affecting Plants
17% 20%
212 Pathogens and Nematodes Affecting Plants
13% 20%
213 Weeds Affecting Plants 12% 5%
215 Biological Control of Pests Affecting Plants 10% 5%
216 Integrated Pest Management Systems 20% 20%
601 Economics of Agricultural Production and Farm Management
5% 5%
901 Program and Project Design, and Statistics
5% 0%
Total 100% 100%
V(C). Planned Program (Inputs)
1. Actual amount of FTE/SYs expended this Program
Year: 2013 Extension Research
1862 1890 1862 1890
Plan 4.0 0.0 6.0 0.0
Actual Paid Professional 6.0 0.0 3.6 0.0
Actual Volunteer 0.8 0.0 0.0 0.0
2. Actual dollars expended in this Program (includes Carryover Funds from previous years)
Extension Research
Smith-Lever 3b & 3c 1890 Extension Hatch Evans-Allen
276970 0 157760 0
1862 Matching 1890 Matching 1862 Matching 1890 Matching
276970 0 157760 0
1862 All Other 1890 All Other 1862 All Other 1890 All Other
523030 0 897389 0
V(D). Planned Program (Activity)
1. Brief description of the Activity
· Fulfill the specific Inputs and Activities outlined in the "Oklahoma State University Coordination Program for IPM Oklahoma!" (as made to USDA-NIFA "Extension Integrated Pest Management Coordination and Support Program (EIPM-CS)") , including the identification of new program priorities for future funding. Have moved forward with 2011-2013 programs that will be finished in 2014, and received 1 year of funding for a new set of projects for 2014. · Provided information on IPM upon request to stakeholder groups, and attend stakeholder sponsored meetings as invited · Conducted targeted research on pest status, suppression and IPM approaches for crop, animal, and urban systems in Oklahoma. (Conducted 5 insecticide evaluations, peanut, soybean, sorghum, wheat, canola) · Developed and delivered extension IPM programs to stakeholders, in the form of workshops, field demonstrations and meetings. · Developed pesticide applicator education and pesticide information through printed media, fact sheets and current reports. Oklahoma Department of Agriculture, Food, and Forestry regularly provides CEU's for IPM. In 2013, CEU's in IPM were provided in 3 workshops, with 400+ applicators receiving them. · Assessed impact of educational activities on stakeholder IPM. Have developed an evaluation tool that will be used in 2014 to evaluate 2-3 extension programs from among - Advanced IPM Master Gardener Workshop, iWheat program, Invasive Species workshop, Bedbug meeting.
2. Brief description of the target audience
Agricultural Producers, Agricultural Groups, Commercial Growers, Retailers, Agricultural Professionals (private, commercial and non-commercial), and landowners, nurseries, individual stakeholders, storers and handlers of grain
3. How was eXtension used?
eXtension was used by the cotton agronomist, he is the subject matter editor for the Ginning and Classing section for the Cotton Community of Practice.
V(E). Planned Program (Outputs)
1. Standard output measures

2013 Direct Contacts
Adults Indirect Contacts
Adults Direct Contacts
Youth Indirect Contacts
Youth
Actual 1769 45550 50 5004
2. Number of Patent Applications Submitted (Standard Research Output)
Patent Applications Submitted
Year: 2013
Actual: 0
Patents listed
3. Publications (Standard General Output Measure)
Number of Peer Reviewed Publications
2013 Extension Research Total
Actual 28 2 30
V(F). State Defined Outputs
Output Target
Output #1
Output Measure
● Stakeholder assessment
Year Actual
2013 1
Output #2
Output Measure
● Pesticide applicator education schools and workshops
Year Actual
2013 26
Output #3
Output Measure
● County-based variety field tours of canola and wheat for growers
Year Actual
2013 20

Output #4
Output Measure
● Research demonstrations will be conducted on confined poultry farms demonstrating IPM strategies for managing litter beetles.
Not reporting on this Output for this Annual Report
Output #5
Output Measure
● Extension publications will be created or revised
Year Actual
2013 27
Output #6
Output Measure
● News releases on the subject of IPM in schools, horticulture crops, livestock, and agronomic crops
Year Actual
2013 47
Output #7
Output Measure
● A summarized annual report will be developed for distribution to involved stakeholders demonstrating the impact of IPM programs to Oklahoma citizens.
Not reporting on this Output for this Annual Report

V(G). State Defined Outcomes
V. State Defined Outcomes Table of Content
O. No. OUTCOME NAME
1 Increased use of pest management approaches for targeted cropping system acres
2 Number of trained certified pesticide applicators
3
Poultry producers will be informed on the utility of alternative IPM strategies for managing litter beetles.
4
Increase in percent of growers with knowledge and adoption of iWheat program for winter wheat.
5 Home gardeners will gain knowledge about IPM practices for their home gardens.
6
People will gain knowledge about IPM programs by visiting the IPM Oklahoma! booth at various meetings, including the Oklahoma Ag Expo and the Oklahoma School Plant Managers Association.

Outcome #1
1. Outcome Measures
Increased use of pest management approaches for targeted cropping system acres
2. Associated Institution Types
● 1862 Extension
● 1862 Research
3a. Outcome Type:
Change in Action Outcome Measure
3b. Quantitative Outcome
Year
Actual
2013
225000
3c. Qualitative Outcome or Impact Statement
Issue (Who cares and Why)
1: Cotton is grown on more than 160,000 acres in Oklahoma. Various weed, disease and insects can cause significant losses in yield. The extension faculty and educators provide a newsletter, "Cotton Comments" that provides advice and suggestions on production, and pest management of cotton. A survey of Oklahoma "Cotton Comments" readers was conducted in 2013 asking them to evaluate the value of the newsletter content. Recipients were asked to rate on a scale of 1 to 5 (1 being not very useful) and 5 (being extremely useful). 2: Winter wheat is grown on 5.5 million acres in Oklahoma for pasture, grain and dual purpose (pasture + grain). Hessian fly has become a prominent pest due to the widespread planting of fly-susceptible wheat varieties. Traditional ?fly free? planting dates that were developed in the 1930?s appear to be ineffective. Estimates of yield loss suffered by Hessian fly infestations can reach five bushels per acre when a susceptible variety is infested with an average 1 fly per stem per acre
What has been done
1: Cotton is grown on more than 160,000 acres in Oklahoma. Various weed, disease and insects can cause significant losses in yield. The extension faculty and educators provide a newsletter, "Cotton Comments" that provides advice and suggestions on production, and pest management of cotton. A survey of Oklahoma "Cotton Comments" readers was conducted in 2013 asking them to evaluate the value of the newsletter content. Recipients were asked to rate on a scale of 1 to 5 (1 being not very useful) and 5 (being extremely useful). 2: A Hessian fly screening program (lab and field) was instituted to evaluate new winter wheat releases through the Oklahoma State winter wheat breeding program. Two resistant varieties of winter wheat ?Duster? and ?Centerfield? were released in 2006. Additional varieties, "Billings" (released in 2009), "Ruby Lee" (released in 2011), and "Gallagher" (released in 2012), are also partially or fully resistant to Hessian fly. In addition, entomologists began evaluating the seasonal emergence of Hessian fly using a recently developed pheromone to better understand its

interaction with winter wheat.
Results
1: Survey respondents indicated that the newsletter?s usefulness was 4.44. With respect to the question of "topics being timely and discussed" the result was 4.44. When asked whether the newsletter should be continued the result was 100% of respondents. Producer respondents estimated that the newsletter content provided a benefit of $21.15 per acre. Extrapolated, the potential value of this newsletter as assessed by the Cotton Comments survey is estimated to be about $3.3 million. 2: In 2012-13, researchers were able to characterize emergence patterns for Hessian fly in Oklahoma. Results suggest that Hessian fly emergence is tied very closely to accumulated degree days, and not so influenced by precipitation. However, there is no correlation between emergence precipitation and subsequent infestation level. Reasons could include use of insecticide seed treatments and weather conditions that cause high mortality of Hessian fly eggs and early-stage larvae. Thus, use of resistant varieties is an important tool for no-till continuous wheat growers who are most susceptible to Hessian fly. Oklahoma wheat producers planted nearly1.3 million acres to "Duster" and "Billings" in 2013. Duster has been rapidly adopted by Oklahoma wheat growers, changing from 0.3% of acres planted in 2008 to more than 19.7% of acres planted in 2013, becoming the most planted variety in Oklahoma. Billings was planted in 1.8% of Oklahoma wheat acres in 2013. Of that, a minimum of 5% or 65,000 acres were planted in areas where Hessian fly was documented to be a serious problem in the 2 years previous to 2013 resulting in an estimated $2.01 million in yield savings.
4. Associated Knowledge Areas
KA Code
Knowledge Area
133
Pollution Prevention and Mitigation
205
Plant Management Systems
211
Insects, Mites, and Other Arthropods Affecting Plants
212
Pathogens and Nematodes Affecting Plants
213
Weeds Affecting Plants
215
Biological Control of Pests Affecting Plants
216
Integrated Pest Management Systems
601
Economics of Agricultural Production and Farm Management
Outcome #2
1. Outcome Measures
Number of trained certified pesticide applicators
2. Associated Institution Types
● 1862 Extension
3a. Outcome Type:
Change in Knowledge Outcome Measure

3b. Quantitative Outcome
Year
Actual
2013
3421
3c. Qualitative Outcome or Impact Statement
Issue (Who cares and Why)
Urban pests are usually unwanted and uninvited house guests, Homeowners, schools and commercial businesses spend more than $255 million in pest control each year for general pest control in Oklahoma.
What has been done
The Oklahoma State Pesticide Safety Education Program offered 24 educational programs targeted at pesticide applicators for certification in General, Structural, Stored Grain, and Ornamental and Turf pest control. Program content includes the use of IPM approaches for managing pests and applying pesticides in a responsible, safe and legal manner. Many programs are held at the Pinkston Educational Facility for Structural and Urban Pest Control. Programs include specific workshops related to pesticide application for initial certification or re-certification for licensure, as well as Extension programs that offer content qualified for Continuing Education Units (CEU?s). These programs allow certified applicators to continually improve their knowledge of IPM and safe use of pesticides. The also provided Pesticide Safety education to 7 Master Gardener programs in 2014.
Results
As of December 2013, more than 3421 applicators from Oklahoma, Kansas, Missouri Colorado, New Mexico and Texas were certified in General Pest Control and other pest management sub-specialties, many at the Pinkston Educational Facility and the Stored Products Research and Educational Center.
4. Associated Knowledge Areas
KA Code
Knowledge Area
133
Pollution Prevention and Mitigation
205
Plant Management Systems
211
Insects, Mites, and Other Arthropods Affecting Plants
212
Pathogens and Nematodes Affecting Plants
213
Weeds Affecting Plants
216
Integrated Pest Management Systems
901
Program and Project Design, and Statistics
Outcome #3
1. Outcome Measures
Poultry producers will be informed on the utility of alternative IPM strategies for managing litter beetles.
2. Associated Institution Types

● 1862 Extension
● 1862 Research
3a. Outcome Type:
Change in Knowledge Outcome Measure
3b. Quantitative Outcome
Year
Actual
2013
1
3c. Qualitative Outcome or Impact Statement
Issue (Who cares and Why)
What has been done
Results
4. Associated Knowledge Areas
KA Code
Knowledge Area
211
Insects, Mites, and Other Arthropods Affecting Plants
216
Integrated Pest Management Systems
Outcome #4
1. Outcome Measures
Increase in percent of growers with knowledge and adoption of iWheat program for winter wheat.
2. Associated Institution Types
● 1862 Extension
● 1862 Research
3a. Outcome Type:
Change in Knowledge Outcome Measure
3b. Quantitative Outcome
Year
Actual
2013
10
3c. Qualitative Outcome or Impact Statement
Issue (Who cares and Why)

What has been done
Results
4. Associated Knowledge Areas
KA Code
Knowledge Area
205
Plant Management Systems
211
Insects, Mites, and Other Arthropods Affecting Plants
212
Pathogens and Nematodes Affecting Plants
213
Weeds Affecting Plants
216
Integrated Pest Management Systems
601
Economics of Agricultural Production and Farm Management
Outcome #5
1. Outcome Measures
Home gardeners will gain knowledge about IPM practices for their home gardens.
2. Associated Institution Types
● 1862 Extension
3a. Outcome Type:
Change in Knowledge Outcome Measure
3b. Quantitative Outcome
Year
Actual
2013
535
3c. Qualitative Outcome or Impact Statement
Issue (Who cares and Why)
What has been done
Results
4. Associated Knowledge Areas
KA Code
Knowledge Area
133
Pollution Prevention and Mitigation
205
Plant Management Systems
211
Insects, Mites, and Other Arthropods Affecting Plants
212
Pathogens and Nematodes Affecting Plants
213
Weeds Affecting Plants

215
Biological Control of Pests Affecting Plants
216
Integrated Pest Management Systems
Outcome #6
1. Outcome Measures
People will gain knowledge about IPM programs by visiting the IPM Oklahoma! booth at various meetings, including the Oklahoma Ag Expo and the Oklahoma School Plant Managers Association.
2. Associated Institution Types
● 1862 Extension
3a. Outcome Type:
Change in Knowledge Outcome Measure
3b. Quantitative Outcome
Year
Actual
2013
225
3c. Qualitative Outcome or Impact Statement
Issue (Who cares and Why)
What has been done
Results
4. Associated Knowledge Areas
KA Code
Knowledge Area
216
Integrated Pest Management Systems
V(H). Planned Program (External Factors)
● Natural Disasters (drought, weather extremes, etc.)
● Economy
● Appropriations changes
● Public Policy changes
● Government Regulations
● Populations changes (immigration, new cultural groupings, etc.)
Brief Explanation
{No Data Entered}
V(I). Planned Program (Evaluation Studies)

Evaluation Results
We have developed a "general IPM evaluation tool" for use with various stakeholders. We will use it on at
least 2-3 different programs in 2014.
Key Items of Evaluation

V(A). Planned Program (Summary)
Program # 11
1. Name of the Planned Program
Food Safety - Agricultural Biosecurity
Reporting on this Program
V(B). Program Knowledge Area(s)
1. Program Knowledge Areas and Percentage
KA Code
Knowledge Area %1862 Extension
%1890 Extension
%1862 Research
%1890 Research
211 Insects, Mites, and Other Arthropods Affecting Plants
13% 5%
212 Pathogens and Nematodes Affecting Plants
12% 50%
213 Weeds Affecting Plants 13% 0%
712
Protect Food from Contamination by Pathogenic Microorganisms, Parasites, and Naturally Occurring Toxins
10% 35%
903 Communication, Education, and Information Delivery
52% 10%
Total 100% 100%
V(C). Planned Program (Inputs)
1. Actual amount of FTE/SYs expended this Program
Year: 2013 Extension Research
1862 1890 1862 1890
Plan 0.7 0.0 2.0 0.0
Actual Paid Professional 0.5 0.0 3.0 0.0
Actual Volunteer 0.0 0.0 0.0 0.0
2. Actual dollars expended in this Program (includes Carryover Funds from previous years)
Extension Research
Smith-Lever 3b & 3c 1890 Extension Hatch Evans-Allen
15000 0 130728 0
1862 Matching 1890 Matching 1862 Matching 1890 Matching
15000 0 130728 0
1862 All Other 1890 All Other 1862 All Other 1890 All Other
25000 0 743623 0
V(D). Planned Program (Activity)

1. Brief description of the Activity
1. Maintain and expand, as appropriate, the OSU National Institute for Microbial Forensics & Food and Agricultural Biosecurity, a multi-disciplinary unit to support and address issues of crop and food safety and biosecurity, and their impacts. 2. Conduct scientific research targeted specifically towards plant pathogen forensics, produce safety, sociological impacts of terrorism and other areas of agricultural biosecurity 3. *Continue to offer targeted coursework for students seeking M.S. or Ph.D. degrees in established programs such as Plant Pathology, Biochemistry, Plant Sciences or Forensic Sciences, who seek plant pathogen forensics. Consider establishingan academic "track" leading to a certificate or Minor in this area. 4. Participate on/in local and national grant panels, advisory boards, review committees, expert bodies and other activities, as appropriate, to maintain visibility of OSU and NIMFFAB in the national biosecurity, homeland security, microbial forensics, and food safety communities.
2. Brief description of the target audience
Key members of National and Oklahoma homeland security community (DHS, FBI, CIA, etc) Key members of National and Oklahoma agricultural leaders and representatives Oklahoma extension personnel Master gardeners Oklahoma producers and crop consultants OSU students and faculty Professional/scientific societies Key industries The public
3. How was eXtension used?
eXtension was not used in this program
V(E). Planned Program (Outputs)
1. Standard output measures
2013 Direct Contacts
Adults Indirect Contacts
Adults Direct Contacts
Youth Indirect Contacts
Youth
Actual 0 0 0 0
2. Number of Patent Applications Submitted (Standard Research Output)
Patent Applications Submitted
Year: 2013
Actual: 0
Patents listed
3. Publications (Standard General Output Measure)
Number of Peer Reviewed Publications

2013 Extension Research Total
Actual 1 6 0
V(F). State Defined Outputs
Output Target
Output #1
Output Measure
● Number of OSU faculty, students and staff affiliated with, or collaborating with NIMFFAB.
Year Actual
2013 27
Output #2
Output Measure
● Number of outside-OSU researchers, agencies and entities sponsoring, collaborating with or benefiting from NIMFFAB activities.
Year Actual
2013 45
Output #3
Output Measure
● Number of grant/contract proposals submitted in agricultural microbial forensics and biosecurity, and food safety.
Year Actual
2013 20
Output #4
Output Measure
● Number of grants/contracts awarded in those areas.
Year Actual
2013 8
Output #5
Output Measure
● Number of journal articles submitted with emphasis on agricultural microbial forensics and biosecurity.
Year Actual
2013 19

Output #6
Output Measure
● Number of students taking classes or seminars developed as part of the OSU Agricultural Biosecurity initiative.
Year Actual
2013 74

V(G). State Defined Outcomes
V. State Defined Outcomes Table of Content
O. No. OUTCOME NAME
1
Number of invitations to agricultural biosecurity team members for participation in initiatives, programs, presentations, and consultations related to agricultural biosecurity and microbial forensics
2
Number of team-associated individuals who a. Performed a project related internship b. Were hired into a professional position in the biosecurity or food safety field c. Served on agricultural biosecurity or food safety review committees or panels
3
Graduate students who will populate laboratories whose testing is related to the protection of human, animal, and plant health from infection by pathogenic organisms.
4
Number of students enrolled in courses that contain a significant portion of material on agro-terrorism, bio-terrorism, or food safety.
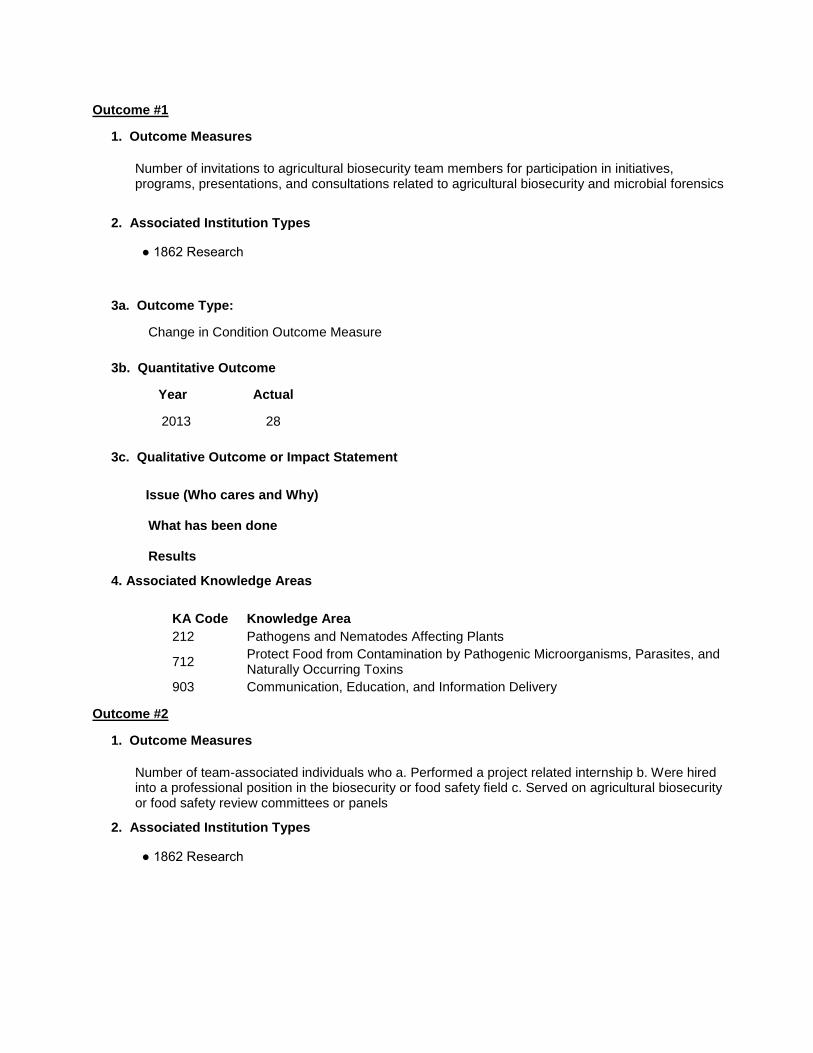
Outcome #1
1. Outcome Measures
Number of invitations to agricultural biosecurity team members for participation in initiatives, programs, presentations, and consultations related to agricultural biosecurity and microbial forensics
2. Associated Institution Types
● 1862 Research
3a. Outcome Type:
Change in Condition Outcome Measure
3b. Quantitative Outcome
Year
Actual
2013
28
3c. Qualitative Outcome or Impact Statement
Issue (Who cares and Why)
What has been done
Results
4. Associated Knowledge Areas
KA Code
Knowledge Area
212
Pathogens and Nematodes Affecting Plants
712
Protect Food from Contamination by Pathogenic Microorganisms, Parasites, and Naturally Occurring Toxins
903
Communication, Education, and Information Delivery
Outcome #2
1. Outcome Measures
Number of team-associated individuals who a. Performed a project related internship b. Were hired into a professional position in the biosecurity or food safety field c. Served on agricultural biosecurity or food safety review committees or panels
2. Associated Institution Types
● 1862 Research

3a. Outcome Type:
Change in Action Outcome Measure
3b. Quantitative Outcome
Year
Actual
2013
4
3c. Qualitative Outcome or Impact Statement
Issue (Who cares and Why)
What has been done
Results
4. Associated Knowledge Areas
KA Code
Knowledge Area
212
Pathogens and Nematodes Affecting Plants
712
Protect Food from Contamination by Pathogenic Microorganisms, Parasites, and Naturally Occurring Toxins
903
Communication, Education, and Information Delivery
Outcome #3
1. Outcome Measures
Graduate students who will populate laboratories whose testing is related to the protection of human, animal, and plant health from infection by pathogenic organisms.
2. Associated Institution Types
● 1862 Research
3a. Outcome Type:
Change in Condition Outcome Measure
3b. Quantitative Outcome
Year
Actual
2013
6
3c. Qualitative Outcome or Impact Statement
Issue (Who cares and Why)
What has been done
Results

4. Associated Knowledge Areas
KA Code
Knowledge Area
211
Insects, Mites, and Other Arthropods Affecting Plants
212
Pathogens and Nematodes Affecting Plants
712
Protect Food from Contamination by Pathogenic Microorganisms, Parasites, and Naturally Occurring Toxins
903
Communication, Education, and Information Delivery
Outcome #4
1. Outcome Measures
Number of students enrolled in courses that contain a significant portion of material on agro-terrorism, bio-terrorism, or food safety.
2. Associated Institution Types
● 1862 Research
3a. Outcome Type:
Change in Knowledge Outcome Measure
3b. Quantitative Outcome
Year
Actual
2013
26
3c. Qualitative Outcome or Impact Statement
Issue (Who cares and Why)
What has been done
Results
4. Associated Knowledge Areas
KA Code
Knowledge Area
211
Insects, Mites, and Other Arthropods Affecting Plants
212
Pathogens and Nematodes Affecting Plants
712
Protect Food from Contamination by Pathogenic Microorganisms, Parasites, and Naturally Occurring Toxins

V(H). Planned Program (External Factors)
● Natural Disasters (drought, weather extremes, etc.)
● Economy
● Appropriations changes
● Public Policy changes
● Government Regulations
● Competing Public priorities
● Other (exotic pathogens, terrorism)
Brief Explanation
V(I). Planned Program (Evaluation Studies)
Evaluation Results
{No Data Entered}
Key Items of Evaluation
{No Data Entered}

V(A). Planned Program (Summary)
Program # 12
1. Name of the Planned Program
Global Food Security and Hunger - Farm and Agribusiness Systems Economics
Reporting on this Program
V(B). Program Knowledge Area(s)
1. Program Knowledge Areas and Percentage
KA Code
Knowledge Area %1862 Extension
%1890 Extension
%1862 Research
%1890 Research
601 Economics of Agricultural Production and Farm Management
28% 60%
602 Business Management, Finance, and Taxation
22% 10%
603 Market Economics 20% 10%
607 Consumer Economics 12% 10%
610 Domestic Policy Analysis 18% 10%
Total 100% 100%
V(C). Planned Program (Inputs)
1. Actual amount of FTE/SYs expended this Program
Year: 2013 Extension Research
1862 1890 1862 1890
Plan 6.0 0.0 4.0 0.0
Actual Paid Professional 7.0 0.0 0.0 0.0
Actual Volunteer 3.3 0.0 3.4 0.0
2. Actual dollars expended in this Program (includes Carryover Funds from previous years)
Extension Research
Smith-Lever 3b & 3c 1890 Extension Hatch Evans-Allen
305000 0 150226 0
1862 Matching 1890 Matching 1862 Matching 1890 Matching
305000 0 150226 0
1862 All Other 1890 All Other 1862 All Other 1890 All Other
445000 0 854536 0
V(D). Planned Program (Activity)
1. Brief description of the Activity

Developed and communicated research based information that farm and agribusiness managers use to improve decisions. Developed decision aids that assist farm and agribusiness managers in improved decisions. Conducted educational programs that improved the management skills of farm and agribusiness managers. Farm and agribusiness managers are able to better understand economic consequences and make more informed decisions.
2. Brief description of the target audience
Managers, owners, and employees of farms and agribusinesses; policy makers; agency leadership
3. How was eXtension used?
The Cooperatives community of practice on eXtension was used extensively to develop and deliver information to cooperative managers, board of director members and producer members. During 2013 two national webinars were conducted, 10 articles in a new blog "Farmer Cooperative Commentary" were published 17 section of educational content were publications on eXtension.
V(E). Planned Program (Outputs)
1. Standard output measures
2013 Direct Contacts
Adults Indirect Contacts
Adults Direct Contacts
Youth Indirect Contacts
Youth
Actual 7409 130000 130 3000
2. Number of Patent Applications Submitted (Standard Research Output)
Patent Applications Submitted
Year: 2013
Actual: 0
Patents listed
3. Publications (Standard General Output Measure)
Number of Peer Reviewed Publications
2013 Extension Research Total
Actual 35 24 59
V(F). State Defined Outputs
Output Target

Output #1
Output Measure
● Number of board members of farmer-owned cooperatives receiving credentialed director training for board goverence
Year Actual
2013 35
Output #2
Output Measure
● Number of software decision analysis aids developed
Year Actual
2013 4
Output #3
Output Measure
● Number of manuscripts submitted to refereed journals
Year Actual
2013 48
Output #4
Output Measure
● Number of farm income tax managment schools conducted
Year Actual
2013 11
Output #5
Output Measure
● Number of participatory experiential learning workshops conducted
Year Actual
2013 3
Output #6
Output Measure
● Number of extension fact sheets, current reports, department staff papers, newsletter articles and other reports developed.
Year Actual
2013 55

V(G). State Defined Outcomes
V. State Defined Outcomes Table of Content
O. No. OUTCOME NAME
1 Number of tax preparers using information from OCES tax schools
2
Number of credentialed board members serving on agricultural cooperative boards (cumulative)
3
Number of beef producers applying some level of financial management decision skills learned through Master Cattleman certification
4 Number of producers and agribusiness managers using OSU developed decision aids
5
Number of producers gaining an improved understanding of risk management through participatory experiential learning experiences
6 Confirming why Use of No-Till Crop Production is Limited in Oklahoma
7 Improved Chicken Litter Handling and Transport
8
Fertilization and economic feasibility of sweet sorghum grown as biofuel feedstock using commercial fertilizer
9 Grain Grading Schools - Agribusiness Personnel Trained
10 Estate Planning - Number trained
11 Grain Handling Infrastructure Replacement in Oklahoma
12
Number of specialty crop producers and goat producers improving farm management and/or financial management skills

Outcome #1
1. Outcome Measures
Number of tax preparers using information from OCES tax schools
2. Associated Institution Types
● 1862 Extension
3a. Outcome Type:
Change in Knowledge Outcome Measure
3b. Quantitative Outcome
Year
Actual
2013
1950
3c. Qualitative Outcome or Impact Statement
Issue (Who cares and Why)
Frequent changes in Federal and Oklahoma State Tax Laws create a need to keep tax preparers informed of the impact of the changes and how to best help their clients utilize the tax planning and management opportunities available in the current tax laws. These tax schools are designed to update tax preparers about new laws and regulations covering farm, non-farm business and individual taxpayer issues.
What has been done
This program has been conducted for the past 48 years. It has grown from a one-day seminar to its present form of two days per location for the fall Farm and Business Tax Institutes and the summer Tax Clinic. The combination of all the schools allows a preparer to get the full 40 hours of CPE/CLE as required by state. Topics covered range from presentation of new tax laws and their implications, agricultural issues, business issues, tax planning opportunities, professional ethics, retirement, and social security to name a few. Twelve two day sessions are conducted each year with two of these in the summer and ten in the fall and two one day special topics courses. Total 2013 attendance for the schools was approximately 1,950 tax preparers in 11 workshops. Certified public accountants make up 46 percent of the attendance, 27 percent are tax preparers and bookkeepers, 10 percent are enrolled agents, 2 percent are attorneys, and the remaining 15 percent come from a variety of backgrounds. These tax preparers file roughly 80 percent of the farm returns for taxpayers in the state of Oklahoma.
Results
High quality, professional instruction is provided to make continuing education credit available for Certified Public Accountants, Enrolled Agents, and Tax Attorneys. Many of those attending have stated that they have been coming to these programs since they began. Participants filed more than 37,000 Federal farm tax returns and 250,000 Federal non-farm tax returns as reported by the participants in the most recent program evaluations. Most of the tax preparers that attend are from Oklahoma however there have been preparers from Kansas, Texas, New Mexico, Arkansas, Florida, and California attending the program in order to maintain their Oklahoma accreditation. An evaluation question asks the participants to place a subjective value on the education received which they then use to assist their clients with tax planning advice to reduce Federal and

Oklahoma income taxes, to increase return filing accuracy, to provide retirement planning assistance, and/or to educate their clients of important estate planning tools. The participants were asked specify a value per return they filed which averaged just slightly greater than $80.00 per return. With a little over 26% responding, and each of them completing about 250 returns means the value of the tax schools to their (just those responding to the survey not all Tax School participants)customers is over $10,000,000 annually.
4. Associated Knowledge Areas
KA Code
Knowledge Area
602
Business Management, Finance, and Taxation
Outcome #2
1. Outcome Measures
Number of credentialed board members serving on agricultural cooperative boards (cumulative)
2. Associated Institution Types
● 1862 Extension
3a. Outcome Type:
Change in Action Outcome Measure
3b. Quantitative Outcome
Year
Actual
2013
150
3c. Qualitative Outcome or Impact Statement
Issue (Who cares and Why)
The board of directors of an agricultural cooperative has responsibility for strategic decisions and for safeguarding the organizations assets. Agricultural cooperative board members are producers who are elected by the membership to serve with only token remuneration. In recent times, all board members, including cooperative board members are under intense scrutiny. The incidence of legal proceedings against board members has increased dramatically. These litigations are typically initiated by owner (member) groups and they focus on the competency and diligence of the board. The severe repercussions from errant business decisions and the intense scrutiny of board member competency have created a critical need for educational programs.
What has been done
In response to the critical need to improve the competencies of cooperative board members the Oklahoma Credential Cooperative Director (OCCD) program was created. The OCCD program involves two days of training on finance, legal responsibilities, parliamentary procedure, effective meeting management, strategic planning and other related topics. In designing the OCCD curriculum, board of director training material from across the U.S. was examined. OCCD instructors include OCES faculty as well as industry experts including bankers, auditors, attorneys and consultants. The OCCD program is supplemented with advanced training open only to directors completing the credentialed training.

The OCCD program was initiated in November of 2001. Since then it has been offered eleven times (spring and fall) with nine advanced sessions. Over 3,600 directors have attended the Credentialing sessions and over 1,800 directors have returned for advanced training.
Results
The directors completing the OCCD program have a better understanding of financial management and the legal roles and responsibilities of the board of directors and are able to make better business decisions and to safeguard the assets of their cooperative organizations. The OCCD program impacts thousands of Oklahoma producers by enhancing the board?s ability to manage and safeguard cooperative assets.
4. Associated Knowledge Areas
KA Code
Knowledge Area
602
Business Management, Finance, and Taxation
Outcome #3
1. Outcome Measures
Number of beef producers applying some level of financial management decision skills learned through Master Cattleman certification
2. Associated Institution Types
● 1862 Extension
3a. Outcome Type:
Change in Action Outcome Measure
3b. Quantitative Outcome
Year
Actual
2013
71
3c. Qualitative Outcome or Impact Statement
Issue (Who cares and Why)
Production management, business planning, risk management and marketing are major issues for the beef producers who comprise Oklahoma?s #1 agricultural industry.
What has been done
An Animal Science Specialist and an Agricultural Economics Specialist developed a comprehensive educational program in cooperation with Animal Science, Plant and Soil Science, Vet Med, Biosystems and Ag Engineering . The OSU Master Cattleman Program was launched in 2004 with the objective of enhancing the profitability of beef operations and the quality of life of beef producers by equipping them with vital information on many aspects of beef production, business planning, risk management and marketing. The educational curriculum is based on the Oklahoma Beef Cattle Manual. Power Point presentations and lesson plans are available to educators via the Master Cattleman website. Producers must complete 4 hours in each of 6 subject matter areas plus an additional four hours of instruction or special projects. Local

Extension educators plan and organize the Master Cattleman educational series and select the specific curriculum offered.
Results
70 additional producers were certified under the OSU Master Cattleman Program in 2013
4. Associated Knowledge Areas
KA Code
Knowledge Area
601
Economics of Agricultural Production and Farm Management
602
Business Management, Finance, and Taxation
Outcome #4
1. Outcome Measures
Number of producers and agribusiness managers using OSU developed decision aids
Not Reporting on this Outcome Measure
Outcome #5
1. Outcome Measures
Number of producers gaining an improved understanding of risk management through participatory experiential learning experiences
2. Associated Institution Types
● 1862 Extension
● 1862 Research
3a. Outcome Type:
Change in Knowledge Outcome Measure
3b. Quantitative Outcome
Year
Actual
2013
125
3c. Qualitative Outcome or Impact Statement
Issue (Who cares and Why)
Price discovery is consistently cited as a critical issue in the beef industry. Increasing consolidation of buyers and changing pricing methods have heightened the need for producers, cattle feeders and affiliated agribusiness professionals to understand fed cattle market dynamics, the behavior of buyers and sellers, and alternative pricing methods.
What has been done
The Fed Cattle Market Simulator was developed at Oklahoma State University in 1990 and has been used in all three missions of the Land Grant University mission ? teaching, extension, and

research. While the focus of simulation workshops is on price discovery, participants also learn the importance of several economic concepts, including value of information, market dynamics, breakeven analysis, derived demand, production efficiency, economies of size, hedging and risk management, and industry behavior and performance. This one-of-a-kind market simulator is used for groups of 24-48 people. The team has conducted workshops with persons as young as teenagers to persons in corporate executive management positions. Workshops of four hours are most common, but more in-depth, intensive workshops are offered to some groups, up to two-day sessions at large agribusiness corporations. Numerous extension and research publications have been written concerning the Fed Cattle Market Simulator in classroom teaching, extension education, and experimental simulation research.
Results
The simulator has been the basis for an OSU course offered once a year for 14 years. It has been the basis for marketing workshops with over 100 groups of 25 or more participants. One of the largest agribusiness firms has incorporated it into its annual employee training program. The developers have conducted 18 workshops with its managers from sales, procurement, and corporate operations. The developers have conducted producer workshops in 17 states, two provinces in Canada, and one state in Mexico, including 8 times at the national convention of the National Cattlemen?s Beef Association. Over 20 workshops with producers have been conducted in Oklahoma. A large foundation in Oklahoma has included the simulator in its annual AgVenture youth camp for the past 9 years. Agricultural economists in other states have adopted the software for use in classroom teaching and extension education programs (Colorado State University, Iowa State University, Kansas State University, Sam Houston State University, South Dakota State University, Texas A&M University, Texas Christian University, and University of Kentucky). During 2013, 3 workshops were conducted with over 125 participants. Workshop evaluations clearly indicate the value of the simulator in teaching economics concepts. Anecdotal evidence indicates the market simulator changes attitudes about how markets work and why; increases knowledge and understanding of pricing methods for various genetic types of cattle; and enhances the bargaining skills of producers. Evaluation comments indicate the market simulator aids participants to better understand price discovery.
4. Associated Knowledge Areas
KA Code
Knowledge Area
601
Economics of Agricultural Production and Farm Management
602
Business Management, Finance, and Taxation
603
Market Economics
Outcome #6
1. Outcome Measures
Confirming why Use of No-Till Crop Production is Limited in Oklahoma
2. Associated Institution Types
● 1862 Research
3a. Outcome Type:
Change in Knowledge Outcome Measure
3b. Quantitative Outcome
Year
Actual
2013
0
3c. Qualitative Outcome or Impact Statement
Issue (Who cares and Why)
Based on data reported by the Conservation Technology Information Center (CTIC), the use of no-till (NT) for crop production in Oklahoma is low compared to the national average. In 2004, NT was used on less than 6% of the acres cropped in the Southern Plains of Texas and Oklahoma. This is less than one-quarter of the national average of 22.6%. This is somewhat disconcerting since the heart of the 1933-35 Dust Bowl that ravaged the nation was in the Southern Plains, and NT is the most soil conserving production system. Most (75 %) of the Oklahoma cropland that is neither in pasture nor in the Conservation Reserve Program (CRP) is seeded to continuous winter wheat. More Oklahoma cropland is currently in CRP than any crop other than wheat. CRP contracts involving thousands of acres are scheduled to expire in the next decade. A conversion from CRP to annual crops with NT rather than intensive tillage (IT) would be more desirable from an environmental perspective. Information regarding the characteristics of farms in the region that currently use NT relative to those that don?t could be used to aid in explaining the relative economics of conversion of CRP acres to annual crops. For years, crop rotations have been recommended to mitigate yield-robbing weed, insect, and disease problems prominent with continuous cropping to wheat. However, crop rotations are not common in Oklahoma. Alternative winter small grain crops such as oats, barley, and rye are not economically competitive. In many cases, attempts to include summer crops such as corn, have not been successful because they do not fit well in a rotation with winter wheat and do not perform well in dryland conditions in western Oklahoma. On average, 17 percent of corn acres planted for grain in the state are not harvested. In some years corn is plagued with mycotoxins. For example, in 2009, grain yields were reported for only one of three OSU corn variety yield trial locations.
What has been done
OSU scientists have been evaluating wheat production tillage systems that maintain surface residue since the 1940s. These studies of continuous wheat production have found that when wheat is grown year after year in the same field, grain yield is reduced when a substantial quantity of wheat residue from the previous wheat crop is retained on the surface. For continuously cropped winter wheat in the region, yields from NT are significantly less than yields from IT. The predominance of continuous cropping to wheat may explain the low rate of NT use in Oklahoma. Additional studies have found that the economics of NT for continuous wheat production depends on farm size. IT is relatively more economical for small sized continuous wheat farms because of the investment required in NT drills and seeders required to use NT.

Results
A survey was mailed to 9,500 Oklahoma farmers. It was found that on average, Oklahoma farms that use NT crop more than twice as many acres as those that use IT. Fifty percent of the farms that use NT plant more than 1,000 acres to annual crops compared to 16 % the farms that use IT. The NT farms have more diversified cropping operations and use crop rotations. The IT farms plant more than 90 percent of their annual crop acres to wheat and seldom rotate to other crops.
4. Associated Knowledge Areas
KA Code
Knowledge Area
601
Economics of Agricultural Production and Farm Management
Outcome #7
1. Outcome Measures
Improved Chicken Litter Handling and Transport
2. Associated Institution Types
● 1862 Research
3a. Outcome Type:
Change in Knowledge Outcome Measure
3b. Quantitative Outcome
Year
Actual
2013
0
3c. Qualitative Outcome or Impact Statement
Issue (Who cares and Why)
The poultry industry has an economic importance in Eastern Oklahoma, serving as a major source of employment in rural areas and often a more profitable alternative to traditional agricultural enterprises in the region. Most of these poultry operations are concentrated animal feeding operations (CAFOs). Poultry CAFOs are supported by the import of animal feed containing nutrients such as nitrogen (N), phosphorus (P), and potassium (K); these nutrients are then exported from the farm in the form of agricultural products. However, much of the nutrients imported with the feed will remain on the farm in the form of manure. There hence lies a need to reduce litter mass with little monetary and labor inputs for the purpose of reducing litter transport costs and increasing hauling distances.
What has been done
A study was conducted to determine to what degree an alternative litter storage process (composting) designed to promote C degradation would decrease mass and affect litter properties including nutrient concentrations and carbon forms, and to conduct an economic analysis of this storage process in the context of transporting litter from poultry dense watersheds to areas deficient in soil P.
Results

Our published results suggest that composting chicken litter will reduce its mass by about 20 percent. This is expected to result in a savings of over $35 million over the next 20 years in subsidies, transportation costs, and reduced fertilizer expenditures. Our on-going research is estimating the impact on energy savings.
4. Associated Knowledge Areas
KA Code
Knowledge Area
601
Economics of Agricultural Production and Farm Management
Outcome #8
1. Outcome Measures
Fertilization and economic feasibility of sweet sorghum grown as biofuel feedstock using commercial fertilizer
2. Associated Institution Types
● 1862 Extension
● 1862 Research
3a. Outcome Type:
Change in Knowledge Outcome Measure
3b. Quantitative Outcome
Year
Actual
2013
0
3c. Qualitative Outcome or Impact Statement
Issue (Who cares and Why)
Oklahoma?s poultry industry creates an excess of poultry litter and its associated nutrients in some watersheds. Strategies for economically using these nutrients in crop enterprises are needed.
What has been done
A reticular set of environmental, agricultural, and energy issues may be alleviated through beneficial re-use of poultry litter as a nutrient source to poor quality soils for production of sweet sorghum as biofuel feedstock. This study assessed the viability of an integrated biofuel system that seeks to increase profitability of producing a biofuel crop using an organic by-product as an alternative to commercial fertilizer (CF). Sweet sorghum was established annually for three years on a relatively poor quality soil. Poultry litter was annually applied at four different application rates and CF applied at equivalent nitrogen (N), phosphorus (P), and potassium (K). Yield and changes in soil properties were monitored. Yield and input costs were used to determine economic return and viable litter transportation distances. Our results are in the process of being extended to producers and stakeholder sin the biofuel industry.
Results
Our field experiment results (under review in Agronomy Journal) found that after three years of litter application, several soil quality parameters increased for litter amended soils compared to CF. Overall yields increased with nutrient application rate and yields from litter were not

significantly different from CF, although economic return was greater for litter. While increased nutrient application rate increased overall economic return, this was a function of the year (i.e. climate). As a result of increased economic return from litter compared to CF, litter could be transported various distances depending on application rate. Break-even transport distance decreased with increased application rates. Use of litter as a nutrient source for growing sweet sorghum as biofuel feedstock can potentially improve water quality in source watersheds, improve soil quality, and reduce dependence on fossil fuels in an economically sustainable manner.
4. Associated Knowledge Areas
KA Code
Knowledge Area
601
Economics of Agricultural Production and Farm Management
Outcome #9
1. Outcome Measures
Grain Grading Schools - Agribusiness Personnel Trained
2. Associated Institution Types
● 1862 Extension
● 1862 Research
3a. Outcome Type:
Change in Knowledge Outcome Measure
3b. Quantitative Outcome
Year
Actual
2013
400
3c. Qualitative Outcome or Impact Statement
Issue (Who cares and Why)
An OSU research team sampled over 3600 trucks delivering grain during harvest The OSU research indicated that grain elevator personnel underestimated dockage, foreign material and over estimated the test weight in loads of grain delivered at harvest. The ten percent of producers delivering the highest quality grain were under compensated by $.05/bushel while the 10% of producers delivering the lowest quality loads were over compensated by $.22/bushel. This price distortion which totaled more than $13M/year reduced the incentive for producers to deliver cleaner, better grain. Inaccuracies in grading hinder communication and increase procurement risk all through the grain supply chain.
What has been done
OSU personnel designed a new hands-on grain grading school. Grain grading school participants received classroom instruction on grain grading principles and federal grain standards. They also grade a series of grain samples and compare their results with official grain inspection service grades on the same samples.
Results
As a result of the workshops, grain grading accuracy improved, reducing risks for both producers and grain handling firms. The grain pricing system became more efficient, increasing the premiums for producers delivering high quality grain. Over 400 agribusiness personnel attended one of the nine grain grading schools offering in 2013.
4. Associated Knowledge Areas
KA Code
Knowledge Area
603
Market Economics
Outcome #10
1. Outcome Measures
Estate Planning - Number trained
2. Associated Institution Types
● 1862 Extension
3a. Outcome Type:
Change in Knowledge Outcome Measure
3b. Quantitative Outcome
Year
Actual
2013
370
3c. Qualitative Outcome or Impact Statement
Issue (Who cares and Why)
Stakeholders (particularly rural landowners and agricultural producers) have made numerous requests for more information and programming regarding the basics of the estate planning process.
What has been done
Presented seminars providing general overview of estate planning considerations for farm operations including basics of the probate and property disposition process, inventory of estate assets, and considerations in choosing estate planning tools.
Results
370 producers received training on estate management at 8 separate workshops offered during 2013. As a result of the training the participants are able to make better decisions regarding estate planning issues.
4. Associated Knowledge Areas
KA Code
Knowledge Area
602
Business Management, Finance, and Taxation

Outcome #11
1. Outcome Measures
Grain Handling Infrastructure Replacement in Oklahoma
2. Associated Institution Types
● 1862 Research
3a. Outcome Type:
Change in Knowledge Outcome Measure
3b. Quantitative Outcome
Year
Actual
2013
0
3c. Qualitative Outcome or Impact Statement
Issue (Who cares and Why)
There are 477 grain storage structures in Oklahoma and 390 of them are past their current design life. Grain industry leaders need information on the regional changes in the structure of the grain storage industry as they make decisions on infrastructure replacement at their firms. Producers also need information as to how structural changes that may occur as facilities are replaced could impact their grain transportation costs.
What has been done
Data on the age, location, capacity, structure type and handling speed was obtained for every commercial grain facility in Oklahoma. Grain production trends were calculated for every township in Oklahoma. A mixed integer programming model was developed to predict the construction decisions that will occur as the oldest facilities are sequentially replaced.
Results
The research findings were extended through the Oklahoma Agricultural Cooperative Council and the Oklahoma Grain and Feed Association. The results indicated that Oklahoma grain cooperative?s and private grain companies are likely to need to make over $125M in re-investment in infrastructure in the coming years. The results also modeled the path of grain facility replacement including locations where existing facilities are likely to be combined into larger regional operations. These results are very useful for grain firms in their strategic planning relating to infrastructure replacement.
4. Associated Knowledge Areas
KA Code
Knowledge Area
602
Business Management, Finance, and Taxation
603
Market Economics
Outcome #12
1. Outcome Measures
Number of specialty crop producers and goat producers improving farm management and/or financial management skills
2. Associated Institution Types
● 1862 Extension
3a. Outcome Type:
Change in Knowledge Outcome Measure
3b. Quantitative Outcome
Year
Actual
2013
50
3c. Qualitative Outcome or Impact Statement
Issue (Who cares and Why)
Production management, business planning, risk management and marketing are major issues for meat goat producers. Meat goat production is an important enterprise for small and medium scale farmers and for those beginning a farming operation.
What has been done
The Oklahoma Meat Goat Boot Camp is a three day camp that uses the combination of classroom exercises and hands-on instructions about the different production practices involved in a meat goat operation. Production practices include but are not limited to ear tagging, castrating, tatooing, hoof trimming, electric fence building, forage testing, forage production, farm business planning, nutrition, ration balancing, FAMACHA, determining fecal egg counts, herd health practices, kidding, neonatal care, reproduction and pregnancy determination using ultra sound. Class size is small to facilitate teacher-participant interaction.
Results
38 producers from 5 states participated in the meat goat boot camp in 2013. The participants knowledge and understanding of a wide range of production issues including: parasite management and control, record keeping, general herd management including herd health, herd nutrition, forages and forage production systems, marketing and business planning were measured by administering tests before and subsequent to the training. Average test scores improved from 58% correct to 80% correct. While it is difficult to place a dollar value on the knowledge gain, it is obvious that the educational program increased the efficiency and profitability of the participants operations.
4. Associated Knowledge Areas
KA Code
Knowledge Area
601
Economics of Agricultural Production and Farm Management
602
Business Management, Finance, and Taxation

V(H). Planned Program (External Factors)
● Natural Disasters (drought, weather extremes, etc.)
● Economy
● Appropriations changes
● Public Policy changes
● Government Regulations
● Competing Public priorities
● Competing Programmatic Challenges
● Populations changes (immigration, new cultural groupings, etc.)
Brief Explanation
{No Data Entered}
V(I). Planned Program (Evaluation Studies)
Evaluation Results
Tax School participants were asked specify a value per return they filed which averaged just slightly greater
than $80.00 per return. With a little over 26% responding, and each of them completing about 250 returns
means the value of the tax schools to their (just those responding to the survey not all Tax School
participants)customers is over $10,000,000 annually.
Key Items of Evaluation

V(A). Planned Program (Summary)
Program # 13
1. Name of the Planned Program
Sustainable Energy - Bio-Based Products Development
Reporting on this Program
V(B). Program Knowledge Area(s)
1. Program Knowledge Areas and Percentage
KA Code
Knowledge Area %1862 Extension
%1890 Extension
%1862 Research
%1890 Research
511 New and Improved Non-Food Products and Processes
100% 100%
Total 100% 100%
V(C). Planned Program (Inputs)
1. Actual amount of FTE/SYs expended this Program
Year: 2013 Extension Research
1862 1890 1862 1890
Plan 2.0 0.0 4.0 0.0
Actual Paid Professional 1.5 0.0 2.2 0.0
Actual Volunteer 0.0 0.0 0.0 0.0
2. Actual dollars expended in this Program (includes Carryover Funds from previous years)
Extension Research
Smith-Lever 3b & 3c 1890 Extension Hatch Evans-Allen
20000 0 97492 0
1862 Matching 1890 Matching 1862 Matching 1890 Matching
20000 0 97492 0
1862 All Other 1890 All Other 1862 All Other 1890 All Other
150000 0 554453 0
V(D). Planned Program (Activity)
1. Brief description of the Activity
· Developing partnerships with universities, industry, and federal laboratories. · Developing project proposals · Preparing and presenting technical papers · Submitting papers for journal articles
· Developing licenses and patents · Taking new and/or improved products to pre-commercialization · Developing educational materials Disseminate research findings through meetings and workshops
2. Brief description of the target audience
Other scientists, industry, agricultural producers, commercial developers
3. How was eXtension used?
eXtension was not used in this program
V(E). Planned Program (Outputs)
1. Standard output measures
2013 Direct Contacts
Adults Indirect Contacts
Adults Direct Contacts
Youth Indirect Contacts
Youth
Actual 0 0 0 0
2. Number of Patent Applications Submitted (Standard Research Output)
Patent Applications Submitted
Year: 2013
Actual: 1
Patents listed
Stewart, D., W.W. Widmer, K. Grohmann, and M.R. Wilkins. 2013. Ethanol production from solid citrus processing waste. U.S. Patent 8,372,614. Awarded 2/12/2013.
3. Publications (Standard General Output Measure)
Number of Peer Reviewed Publications
2013 Extension Research Total
Actual 0 48 48
V(F). State Defined Outputs
Output Target
Output #1
Output Measure
● Technical papers and presentations
Year Actual
2013 92
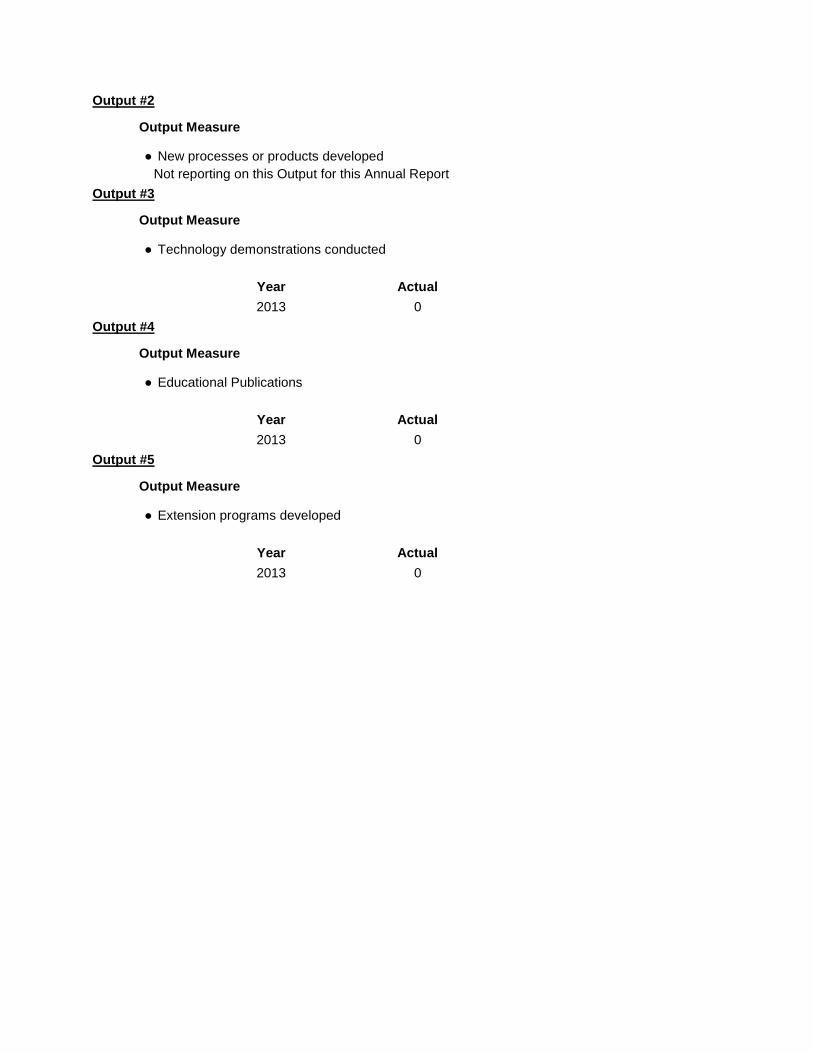
Output #2
Output Measure
● New processes or products developed
Not reporting on this Output for this Annual Report
Output #3
Output Measure
● Technology demonstrations conducted
Year Actual
2013 0
Output #4
Output Measure
● Educational Publications
Year Actual
2013 0
Output #5
Output Measure
● Extension programs developed
Year Actual
2013 0

V(G). State Defined Outcomes
V. State Defined Outcomes Table of Content
O. No. OUTCOME NAME
1 Release and commercialization of new feedstocks varieties
2 Best management practices identified for sustainable feedstock production
3 Fundamental knowledge of engineering or science gained in developing biobased products
4 Number of students graduated (masters and doctoral)
5 New processes or products developed
6 Products/processes taken to pre-commercialization
7 Bioenergy feedstock logistics
8 Eastern redcedar as a cellulosic biomass feedstock
9 Feedstock development for bio-based products
10 Conversion of cellulosic biomass to biofuels and biobased chemicals

Outcome #1
1. Outcome Measures
Release and commercialization of new feedstocks varieties
Not Reporting on this Outcome Measure
Outcome #2
1. Outcome Measures
Best management practices identified for sustainable feedstock production
2. Associated Institution Types
● 1862 Extension
● 1862 Research
3a. Outcome Type:
Change in Knowledge Outcome Measure
3b. Quantitative Outcome
Year
Actual
2013
0
3c. Qualitative Outcome or Impact Statement
Issue (Who cares and Why)
Development of a viable bio-based products industry is contingent on sustainable, dependable, and economical feedstock supply systems. Potential feedstocks include seed and/or vegetative parts (including harvesting/processing residues) of plants grown in Oklahoma for food, feed, or livestock herbage. Oklahoma offers an abundance of opportunity for the growth of a variety of crops that can be converted into biofuels. In addition to biofuels, many other valuable products could be produced from Oklahoma crops and agricultural residues. With the increasing energy cost and concerns of environmental quality, bio-based products such as biopesticide and biofertilizer are gaining increasing attention. Information is needed on species and species cultivars adaptable to selected systems as influenced by: climatic and edaphic differences across the state, cultural requirements, economics of production, and conversion technology requirements. Improving biomass yield and abiotic stress tolerance of the bioenergy crop species are the major target traits for sustainable biofuel production. However, little progress has been made to-date, because relevant genes/factors that control these traits are unknown. Increase in global temperature, air pollutants such as ozone, and the erratic rainfall regimes leading to extended drought pose significant threats to agricultural production not only in Oklahoma, but the entire world. The decrease in arable land compounded by the climate change issues has led to significant reductions in crop yields that will ultimately impact the cost of food, fuels and fodder. Understanding the molecular processes in plants that leads to this decrease in production will provide us with tools for tweaking those pathways and ensure sustainable
production in the wake of climate change.
What has been done
Biofuel crops, switchgrass, mixed grasses, biomass sorghum, sweet sorghum, energy cane and energy beet, were evaluated for biomass production at five locations in OK. The effect of environment, management (row spacing and plant population) and inputs (nitrogen) was evaluated at these locations. Ecosystem level water use and C sequestration potential of switchgrass, mixed grasses, and biomass sorghum were evaluated using eddy covariance system. Exotic sorghum germplasm of 245 lines were evaluated for biomass quality and physiological traits. Algorithms were derived for switchgrass and biomass sorghum to develop crop models.
Results
Results showed that maximum biomass in Oklahoma can be produced with <84 kg N ha-1 and high biomass sorghum has potential to produce more than 20 Mg ha-1 of biomass under normal conditions. Final biomass yield of high biomass sorghum could be predicted using both broadband (aerial photograph) and narrowband (GreenSeeker) normalized difference vegetation index (NDVI) from July to close to harvest, while biomass yield in the perennial grass was best predicted during June to July. Wavebands occurring most frequently for separating the N treatments were 520-560, 650-690 nm (visible region), and 710-730 nm (red edge region). Nitrogen application should be done within 4-6 weeks after planting in high biomass sorghum and within 4 weeks after green-up in switchgrass. The best narrow-band NDVI was computed with the wavebands pair of 400 and 510 nm for the high biomass sorghum and 1500 and 2260 nm for the perennial grass that were strongly correlated to N concentration. Total N can be estimated using SR of R2080/R2190 (r2=0.84), while an SR of R2190/R2230 (r2=0.65) was able to estimate ADF (r2=0.70), NDF (r2=0.65) and ADL (r2=0.67). This indicates opportunities for instrument development for practical purposes. Perennial grasses are more reliable sources of biomass yield under adverse and variable climatic conditions of Oklahoma. The magnitudes of CO2 and H2O fluxes were similar at both ecosystems during the active growing periods. Switchgrass ecosystem was a larger carbon sink with a cumulative seasonal carbon uptake of -490 ± 59 g C m-2 compared to -261 ± 48 g C m-2 by sorghum. Because the magnitude of CO2 exchange was similar, the difference in carbon sink strength between two ecosystems was driven mainly by the length of the growing season. During the growing season, the daily ET reached up to 6.2 mm day-1 for switchgrass and 6.7 mm day-1 for sorghum. The ratio of cumulative GEP to the respective ET yielded monthly ecosystem water use efficiency (EWUE) from 6.3 (March) to 16.1 (June) g CO2 mm-1 ET in switchgrass and from 4.7 (May) to 13.6 (June) g CO2 mm-1 ET in sorghum, with seasonal averages of 12.6 and 9.9 g CO2 mm-1 ET for switchgrass and sorghum, respectively. The result shows that both ecosystems were strong sinks of carbon on seasonal scale and were highly water use efficient. The semivariograms revealed coarse scale OC to be strongly correlated with range values from 56-78 m for both soils. A strong correlation with a range of 5 m was observed for switchgrass yield at the fine scale McLain silty clay for both years. The best estimate of OC could be achieved by systematic sampling, while random sampling may be the most practical way for estimating switchgrass yield.
4. Associated Knowledge Areas
KA Code
Knowledge Area
511
New and Improved Non-Food Products and Processes

Outcome #3
1. Outcome Measures
Fundamental knowledge of engineering or science gained in developing biobased products
Not Reporting on this Outcome Measure
Outcome #4
1. Outcome Measures
Number of students graduated (masters and doctoral)
Not Reporting on this Outcome Measure
Outcome #5
1. Outcome Measures
New processes or products developed
Not Reporting on this Outcome Measure
Outcome #6
1. Outcome Measures
Products/processes taken to pre-commercialization
Not Reporting on this Outcome Measure
Outcome #7
1. Outcome Measures
Bioenergy feedstock logistics
2. Associated Institution Types
● 1862 Research
3a. Outcome Type:
Change in Knowledge Outcome Measure
3b. Quantitative Outcome
Year
Actual
2013
0

3c. Qualitative Outcome or Impact Statement
Issue (Who cares and Why)
Logistics is a critical issue and can make or break a sustainable bioenergy and/or biobased products system. A holistic and integrated logistics research and extension program that includes harvesting, packaging, storage, transportation, and pre-processing are essential. Each of these logistics topic areas is highly dependent on the other logistic topic areas. Logistical systems are also highly dependent on the type of feedstock material and the biorefinery or biobased products industry material specifications. Currently one of the major logistics issues is the lack of industry material specifications. This issue has forced the logistics research to be extremely broad. Another critical issue is feedstock value. Currently the target price per delivered ton for cellulosic feedstock is $45. Delivering feedstocks to the biorefinery at $45/ton is virtually impossible with traditional harvesting, packaging and storage practices unless the feedstocks being delivered are residues such as corn stover. Even delivering feedstocks such as corn stover at $45/ton using conventional practices is challenging. The primary opportunity created by a lack of industry specifications and low feedstock values is that research teams are provided the opportunity to explore concepts outside the traditional hay and forage methodologies.
What has been done
During the past three years, our logistics team has conducted large scale harvesting and storage studies in the Panhandle, Central and South Central Oklahoma. These studies have focused on forage sorghum, switchgrass and mixed grasses from CRP lands. The team partnered with the Samuel Roberts Noble Foundation and the Oklahoma Agricultural Experiment Stations to secure the lands needed for the projects and establish the crops. The team partnered with AGCO and Stinger to provide commercially available or prototype equipment and professional equipment operators to carry out the actual harvesting and storage practices that were evaluated by OSU. The team partnered with Idaho National Laboratories to conduct the feedstock quality assessments. The lands allocated for work included 1,054; 160; and 498 acres of switchgrass, forage sorghum and mixed grass, respectively. The number of acres harvested varied from year to year due to the Oklahoma drought that started in late 2010. Approximately, 3,086; 1,372; and 858 bales of switchgrass, forage sorghum and mixed grasses were produced. These resources were used to evaluate: 1) yield variability in key Oklahoma regions; 2) effect of harvest date on yield, machinery performance and feedstock storage; 3) effect of dual cut systems; 4) common cellulosic feedstock storage practices; 5) production costs; and 6) storage costs. Much of this large scale effort has shifted from field work to laboratory and data analysis in 2013. The field work will be completed in May 2014 and the data analysis and reporting are expected to continue into 2015.
Results
This research will be used directly in determining the economic feasibility using switchgrass, forage sorghum and/or mixed grasses from CRP lands as a bioenergy feedstock. This research will be used in developing the best management practices for harvesting switchgrass, forage sorghum and mixed grass as a bioenergy feedstock. This research will be used in developing the best management practices for storing switchgrass, forage sorghum and mixed grass as a bioenergy feedstock. This research will be used in determining the expected accuracy of moisture content measurements taken in large format square bale switchgrass, forage sorghum and mixed grass bales. This research will provide the basis for a just-in-time delivery and logistics system.
4. Associated Knowledge Areas
KA Code
Knowledge Area
511
New and Improved Non-Food Products and Processes

Outcome #8
1. Outcome Measures
Eastern redcedar as a cellulosic biomass feedstock
2. Associated Institution Types
● 1862 Extension
● 1862 Research
3a. Outcome Type:
Change in Knowledge Outcome Measure
3b. Quantitative Outcome
Year
Actual
2013
0
3c. Qualitative Outcome or Impact Statement
Issue (Who cares and Why)
The US imported 40% of its liquid fuel consumption in 2012 and the import is projected to remain at 32% in 2040. Production of fuels and chemicals by conversion of renewable cellulosic biomass is a viable strategy for reducing US petroleum imports, increasing energy security, and mitigating climate change by decreasing greenhouse gas emissions. The Renewable Fuels Standard (RFS2) mandates production of 16 billion gallons per year (GPY) renewable cellulosic biofuels by 2022 without significantly affecting our current agricultural production. Besides being an energy-producing state, Oklahoma is well-positioned to take a leading role in the biobased economy to meet part of the demand for cellulosic biofuels. Cellulosic biofuel and biobased chemical production would enhance rural farm economies since conversion processes are likely to be located close to feedstock sources, and attract investment capital. However, challenges such as high capital costs and technological obstacles hinder the development of cellulosic biofuel and biobased chemical production.
What has been done
OSU researchers developed biomass pretreatments for improving biomass properties for enzymatic hydrolysis. Redcedar is considered a noxious weed by many landowners due to its ability to spread quickly, replace grasslands, and present a major fire hazard. A sulfite pretreatment process using sodium bisulfite and sulfuric acid was found to be effective in pretreating redcedar for enzymatic hydrolysis. Response surface designs were used to optimize the pretreatment and model the effect of sodium bisulfite and sulfuric acid on the yield of glucose from cellulose hydrolysis by cellulase. In addition, we determined that a low energy, size reduction process developed by a commercial partner can be used to make redcedar particles for pretreatment and enzymatic hydrolysis. Researchers found no difference in yields between new commercially processed particles and particles made through traditional grinding.
Results
Processes to use Eastern redcedar to produce biofuels, such as the sulfite pretreatment and butanol conversion, will provide a venue to reduce redcedar infestation in Oklahoma and across grasslands in the Central Plains by converting redcedar into butanol. The projected economic impact of biorefineries using redcedar to local communities in Oklahoma would be over $1 billion

per year. Over 400 direct jobs would be created by implementing the novel butanol production process using redcedar, which would provide 25% of the 1.26 billion gallons of jet fuel used by the Navy each year. The development of new conversion technologies and new products are expected to create spin-off companies and bring significant investment to Oklahoma and the U.S.
4. Associated Knowledge Areas
KA Code
Knowledge Area
511
New and Improved Non-Food Products and Processes
Outcome #9
1. Outcome Measures
Feedstock development for bio-based products
2. Associated Institution Types
● 1862 Extension
● 1862 Research
3a. Outcome Type:
Change in Knowledge Outcome Measure
3b. Quantitative Outcome
Year
Actual
2013
0
3c. Qualitative Outcome or Impact Statement
Issue (Who cares and Why)
The societal interest in production of biofuels has increased due to rising fossil fuel prices, the desire for less dependence on foreign oil, concerns over air pollutions caused by the use of fossil fuels, and favorable government policies. Most current ethanol plants in the U.S. are corn-based, but in the state of Oklahoma corn production is not a major agricultural activity. However, perennial grasses and annual forages in this state have shown to be viable renewable biomass feedstocks. Switchgrass, a plant native to Oklahoma, has been deemed one of the best options as a sustainable feedstock to support a biorefinery. Switchgrass, other native perennial grasses and annual forage species can be grown on marginal soils for producing large amounts of feedstocks in Oklahoma. The production potential, if realized, will likely bring in huge economic benefits to the rural communities in the state. The scientific investigations we worked on would substantially contribute to the emerging bioenergy industry and its economic success.
What has been done
We performed two field experiments to determine the fertilization mode (i.e., selfing vs. outcrossing) of two self-compatible plants and to assess the mating behavior variability of lowland switchgrass genotypes in populations under field conditions. In Experiment I, two self-compatible genotypes 'NL94 LYE 16x13' and 'SL93 7x15' along with two populations were planted with two replications on the OSU Agronomy Research Farm, Stillwater, OK. Sixty-four progeny derived from half-sib seeds of each genotype per replication per year were genotyped with 4 to 20 simple sequence repeat (SSR) markers. In Experiment II, two genetically narrow-based (NL94 C2-3 and

SL93 C2-3), each having five parents, and two broad-based (NL94 C3 and SL93 C3), each comprising 26 parents, switchgrass populations with three replications were field established at the OSU Cimarron Valley Research Station, Perkins, OK. DNA samples were isolated from 1700 open-pollinated progeny of 62 seed parents in 2010 and 773 progeny of 42 parents in 2011.
Results
In both 2010 and 2011, all progeny plants of the two parents were completely outcrossed exhibiting 100% self-incompatibility. In Experiment II, among all the progeny genotyped with 8 to 16 SSR markers, only one was identified as a selfed progeny, indicating very little variability in outcrossing behavior under the field conditions. The identification of specific genotypes like NL94 LYE 16x13 and SL93 7x15, which are self-incompatible in the open field but self-compatible under the controlled condition, potentially enables efficient production of F1 hybrid seed in switchgrass. Based on the sexual behavior data, we proposed a novel breeding procedure, including development of inbreds and crossing of inbreds to produce hybrid seeds in the field, for dramatically increased biomass production by fully using heterosis in the species. It is expected that hybrid cultivars in lowland switchgrass can produce 40-50% more biomass as compared with the current best synthetic cultivars with the same management input.
4. Associated Knowledge Areas
KA Code
Knowledge Area
511
New and Improved Non-Food Products and Processes
Outcome #10
1. Outcome Measures
Conversion of cellulosic biomass to biofuels and biobased chemicals
2. Associated Institution Types
● 1862 Research
3a. Outcome Type:
Change in Knowledge Outcome Measure
3b. Quantitative Outcome
Year
Actual
2013
0
3c. Qualitative Outcome or Impact Statement
Issue (Who cares and Why)
The US imported 40% of its liquid fuel consumption in 2012 and the import is projected to remain at 32% in 2040. Production of fuels and chemicals by conversion of renewable cellulosic biomass is a viable strategy for reducing US petroleum imports, increasing energy security, and mitigating climate change by decreasing greenhouse gas emissions. The Renewable Fuels Standard (RFS2) mandates production of 16 billion gallons per year (GPY) renewable cellulosic biofuels by 2022 without significantly affecting our current agricultural production. Besides being an energy-producing state, Oklahoma is well-positioned to take a leading role in the biobased economy to meet part of the demand for cellulosic biofuels. Cellulosic biofuel and biobased chemical

production would enhance rural farm economies since conversion processes are likely to be located close to feedstock sources, and attract investment capital. However, challenges such as high capital costs and technological obstacles hinder the development of cellulosic biofuel and biobased chemical production.
What has been done
Biochar, which is a byproduct of biomass gasification, was tested for its effectiveness in removing contaminants from syngas. These contaminants negatively affect both metal and biological catalysts that convert syngas to fuels and chemicals. Researchers showed that biochar effectively and simultaneously removes three common syngas contaminants: toluene, NH3, and H2S. Researchers also studied torrefaction, densification, and combined torrefaction and densification to improve biomass properties for gasification. Combined torrefaction and densification resulted in the highest yields of H2 and CO and the highest syngas heating value among the pretreatments tested. Researchers developed several control methods to sustain culture activity, gas uptake and improve selectivity for ethanol production during syngas fermentation. One of these methods resulted in an ethanol concentration 26 times greater than a conventional method used by most researchers. A mixed culture was discovered that produced ethanol, propanol and butanol from H2 and CO gases. Synergistic interactions between the strains in the mixed culture resulted in over 60% more alcohol production than with monocultures of the two predominant bacteria strains present in the mixed culture. Also, a novel biocatalytic conversion process to produce butanol from cellulosic biomass was developed. Butanol is a valuable commodity chemical and it can be converted with a hydrogenation step to gasoline, diesel and jet fuels.
Results
Syngas cleanup is considered one of the most cost prohibitive operations in using gasification based fuels and chemicals. Implementation of biochar-based catalysts would remove contaminants that inhibit downstream syngas conversion processes and generate a high-value byproduct stream from what is currently a waste product. The control methods for syngas fermentation developed represent a break-through characterization of the production mechanisms that underline the commercially deployed fermentation process, and can be implemented in industrial control systems for process operation. These methods can be used on an industrial scale to maintain high conversion of syngas components to alcohols, which also requires moderately skilled operators and potentially reduce capital and operating costs. Several companies have been attracted by these methods; potential research agreements are in negotiation.
4. Associated Knowledge Areas
KA Code
Knowledge Area
511
New and Improved Non-Food Products and Processes
V(H). Planned Program (External Factors)
● Natural Disasters (drought, weather extremes, etc.)
● Appropriations changes
Brief Explanation

V(I). Planned Program (Evaluation Studies)
Evaluation Results
Key Items of Evaluation
· Numerous breeding lines were bred and evaluated for their potential in the development of new cultivars in
switchgrass for the south central states.
· Transgenic lines with altered leaf size and biomass characteristics have been developed.
· Developed best management practices for biomass production in Oklahoma.
· Ecosystem level water use and carbon sequestration potential of switchgrass was determined under
Oklahoma conditions.
· Identified NIR spectral ratios for determining biomass quality of switchgrass and biomass sorghum.
· Identified spectral ratios for determining N concentration in field plots and dry biomass of switchgrass and
biomass sorghum.
· Identified several candidate miRNAs that could play important roles under drought and heat tolerance of
switchgrass
· Proposals - submitted and awarded
· Journal articles published - number and quality
· Technical/educational presentations
Key Items of Evaluation

V(A). Planned Program (Summary)
Program # 14
1. Name of the Planned Program
Childhood Obesity - Hunger / Health / Risky Behaviors / Resilience Issue Teams
Reporting on this Program
V(B). Program Knowledge Area(s)
1. Program Knowledge Areas and Percentage
KA Code
Knowledge Area %1862 Extension
%1890 Extension
%1862 Research
%1890 Research
134 Outdoor Recreation 15% 0%
703 Nutrition Education and Behavior 15% 0%
724 Healthy Lifestyle 25% 0%
802 Human Development and Family Well-Being
20% 0%
806 Youth Development 25% 0%
Total 100% 0%
V(C). Planned Program (Inputs)
1. Actual amount of FTE/SYs expended this Program
Year: 2013 Extension Research
1862 1890 1862 1890
Plan 35.0 0.0 0.0 0.0
Actual Paid Professional 26.0 0.0 0.0 0.0
Actual Volunteer 18.5 0.0 0.0 0.0
2. Actual dollars expended in this Program (includes Carryover Funds from previous years)
Extension Research
Smith-Lever 3b & 3c 1890 Extension Hatch Evans-Allen
445000 0 0 0
1862 Matching 1890 Matching 1862 Matching 1890 Matching
445000 0 0 0
1862 All Other 1890 All Other 1862 All Other 1890 All Other
945000 0 0 0
V(D). Planned Program (Activity)
1. Brief description of the Activity

•Development and introduction of new curricula •Outreach to families, schools, child care providers, direct assistance, demonstrations, and educational opportunities to food, healthy, eating, exercise, diet, etc. •Development of surveys, evaluation tools •Delivery through classes, One-on-One, News Releases/TV/Radio, Participation in Events, Displays •Provided training and other staff development opportunities to county educators
2. Brief description of the target audience
Youth, children; parents; teachers; adult volunteers; middle to low income families; race and ethnicity will also be recognized as an identifier of audiences; caretakers, agencies & service providers, schools, policy makers.
3. How was eXtension used?
eXtension is provided as an educator resource.
V(E). Planned Program (Outputs)
1. Standard output measures
2013 Direct Contacts
Adults Indirect Contacts
Adults Direct Contacts
Youth Indirect Contacts
Youth
Actual 126900 800000 100083 775000
2. Number of Patent Applications Submitted (Standard Research Output)
Patent Applications Submitted
Year: 2013
Actual: 0
Patents listed
3. Publications (Standard General Output Measure)
Number of Peer Reviewed Publications
2013 Extension Research Total
Actual 0 4 4
V(F). State Defined Outputs
Output Target

Output #1
Output Measure
● Number of OSU Fact s published
Year Actual
2013 5
Output #2
Output Measure
● Number of other publications including but not limited to Bulletins, Technical Manuals, Reports as well as PowerPoint presentation and Spreadsheets, etc. distributed for use by others
Year Actual
2013 29
Output #3
Output Measure
● Number of in-service training sessions
Year Actual
2013 15
Output #4
Output Measure
● Number of certification Training sessions
Year Actual
2013 2
Output #5
Output Measure
● Number of other training sessions, workshops, etc. conducted
Year Actual
2013 8
Output #6
Output Measure
● Number of presentations at Extension organized meetings
Year Actual
2013 5

Output #7
Output Measure
● Number of presentations at other meetings and events (professional metings, invitations to speak to community groups, etc.)
Year Actual
2013 26
Output #8
Output Measure
● Number of workshops, conferences, etc. organized
Year Actual
2013 1
Output #9
Output Measure
● Number of posters or displays
Year Actual
2013 4
Output #10
Output Measure
● Number of other demonstrations, displays, exhibits, and models
Year Actual
2013 0
Output #11
Output Measure
● Number of newsletters
Year Actual
2013 3
Output #12
Output Measure
● Number of website hits
Year Actual
2013 0

Output #13
Output Measure
● Number of radio and television presentations
Year Actual
2013 0
Output #14
Output Measure
● Number of newspaper, and magazine articles written
Year Actual
2013 10
Output #15
Output Measure
● Average number of phone calls and/or email requests responded to on a weekly basis
Year Actual
2013 9
Output #16
Output Measure
● Number of websites
Year Actual
2013 3

V(G). State Defined Outcomes
V. State Defined Outcomes Table of Content
O. No. OUTCOME NAME
1 Percentage increase in consumption of fruits
2 Percentage increase in the consumption of vegetables
3 Percentage increase in the consumption of whole grains
4 Percentage increase in the consumption of dairy foods
5 Percentage decrease in consumption of foods high in fat, sugar and salt
6 Percentage decrease in the consumption of sugar-sweetened beverages
7 Percentage increase in physical activity
8 Percentage decrease of time in front of television, coumputers, etc.
9 Percentage increase of meals prepared at home
10 Percentage increase in safe food handling practices
11 Percentage increase in positive parenting skills
12 Percentage increase in youth positive peer involvement
13 Percentage increase in parenting competence
14 Percentage increase in child competent behaviors
15
Percentage increase in access to affordable, healthy foods such as community gardens and farmers' markets
16 Percnetage increase in opportunities for physical activity
17
Percentage increase in deliberative forums on issues related to high risk behaviors to develop solutions that encourage broad community support
18
Percentage increase in task forces to promote positive activities for youth and increase personal awareness and involvement

Outcome #1
1. Outcome Measures
Percentage increase in consumption of fruits
2. Associated Institution Types
● 1862 Extension
3a. Outcome Type:
Change in Action Outcome Measure
3b. Quantitative Outcome
Year
Actual
2013
30
3c. Qualitative Outcome or Impact Statement
Issue (Who cares and Why)
Oklahoma ranks as the 5th most obese state in the nation, with 17% of Oklahoma youth considered obese. This ranking reflects the state's high density of fast food establishments, low fruit and vegetable consumption (72% did not meet fruit recommendations and 86% did not meet vegetable recommendations) and low levels of physical activity, (30% of Oklahoma high school students reported watching three or more hours of television every day).
What has been done
Oklahoma Cooperative Extension Service programs are committed to the physical, mental and emotional health of our nation's youth so they may lead healthy and productive lives into and throughout adulthood. In order to advance the socio-economic development of the state, and have an impact on issues that address childhood obesity, educational programs have been created and implemented to educate Oklahomans on how to attain a better quality of life related to the critical areas of food, nutrition, and health.
Results
In 2013, 463 programs were presented to 21,907 participants. Oklahoma youth attended programs through 23 different curricula. Programs presented include: OrganWise Guys program. Based on 1,385 pre-post tests, improvements were reported among participating Oklahoman youth in the areas of increasing servings of fruit and vegetables, skim milk and physically activity. Youth also reported decreased consumption of sweets, fat eaten and less screen time which can play a role in reducing overweight and risk of related chronic diseases. Growing Strong Bodies and Minds aims to promote the development of healthful food preferences, physically active lifestyles and literacy skills in young children. Specific goals include: use of pre-reading and reading strategies to teach nutrition and health messages; promote consumption of whole grains, fruits, vegetables, low-fat dairy foods, and increase time spent in active play; and support parents of young children in offering economical, nutrient dense foods to their children and increasing time spent in active play. 3,336 youth across that state participated in this program. In addition to increasing their knowledge of healthy foods, the

students are discussing the foods they eat during lunch and talking to their families about the new foods they try. The Farm to You exhibit was experienced by 14,375 students at 50 schools in 29 counties in Oklahoma. This brings the five year total to over 37,000 youth in 140 schools. The exhibit, when combined with the classroom-based nutrition program, enhanced nutrition behavior change for upper-elementary grade students beyond that achieved with only the classroom-based program.
4. Associated Knowledge Areas
KA Code
Knowledge Area
703
Nutrition Education and Behavior
724
Healthy Lifestyle
Outcome #2
1. Outcome Measures
Percentage increase in the consumption of vegetables
2. Associated Institution Types
● 1862 Extension
3a. Outcome Type:
Change in Action Outcome Measure
3b. Quantitative Outcome
Year
Actual
2013
10
3c. Qualitative Outcome or Impact Statement
Issue (Who cares and Why)
Oklahoma ranks as the 5th most obese state in the nation, with 17% of Oklahoma youth considered obese. This ranking reflects the state's high density of fast food establishments, low fruit and vegetable consumption (72% did not meet fruit recommendations and 86% did not meet vegetable recommendations) and low levels of physical activity, (30% of Oklahoma high school students reported watching three or more hours of television every day).
What has been done
Oklahoma Cooperative Extension Service programs are committed to the physical, mental and emotional health of our nation's youth so they may lead healthy and productive lives into and throughout adulthood. In order to advance the socio-economic development of the state, and have an impact on issues that address childhood obesity, educational programs have been created and implemented to educate Oklahomans on how to attain a better quality of life related to the critical areas of food, nutrition, and health.
Results
In 2013, 463 programs were presented to 21,907 participants. Oklahoma youth attended programs through 23 different curricula. Programs presented include: OrganWise Guys program. Based on 1,385 pre-post tests, improvements were reported among participating Oklahoman youth in the areas of increasing servings of fruit and vegetables, skim milk and physically activity. Youth also reported decreased consumption of sweets, fat eaten and less screen time which can play a role in reducing overweight and risk of related chronic diseases. Growing Strong Bodies and Minds aims to promote the development of healthful food preferences, physically active lifestyles and literacy skills in young children. Specific goals include: use of pre-reading and reading strategies to teach nutrition and health messages; promote consumption of whole grains, fruits, vegetables, low-fat dairy foods, and increase time spent in active play; and support parents of young children in offering economical, nutrient dense foods to their children and increasing time spent in active play. 3,336 youth across that state participated in this program. In addition to increasing their knowledge of healthy foods, the students are discussing the foods they eat during lunch and talking to their families about the new foods they try. The Farm to You exhibit was experienced by 14,375 students at 50 schools in 29 counties in Oklahoma. This brings the five year total to over 37,000 youth in 140 schools. The exhibit, when combined with the classroom-based nutrition program, enhanced nutrition behavior change for upper-elementary grade students beyond that achieved with only the classroom-based program.
4. Associated Knowledge Areas
KA Code
Knowledge Area
703
Nutrition Education and Behavior
724
Healthy Lifestyle
Outcome #3
1. Outcome Measures
Percentage increase in the consumption of whole grains
2. Associated Institution Types
● 1862 Extension
3a. Outcome Type:
Change in Action Outcome Measure
3b. Quantitative Outcome
Year
Actual
2013
20
3c. Qualitative Outcome or Impact Statement
Issue (Who cares and Why)

Oklahoma ranks as the 5th most obese state in the nation, with 17% of Oklahoma youth considered obese. This ranking reflects the state's high density of fast food establishments, low fruit and vegetable consumption (72% did not meet fruit recommendations and 86% did not meet vegetable recommendations) and low levels of physical activity, (30% of Oklahoma high school students reported watching three or more hours of television every day).
What has been done
Oklahoma Cooperative Extension Service programs are committed to the physical, mental and emotional health of our nation's youth so they may lead healthy and productive lives into and throughout adulthood. In order to advance the socio-economic development of the state, and have an impact on issues that address childhood obesity, educational programs have been created and implemented to educate Oklahomans on how to attain a better quality of life related to the critical areas of food, nutrition, and health.
Results
In 2013, 463 programs were presented to 21,907 participants. Oklahoma youth attended programs through 23 different curricula. Programs presented include: OrganWise Guys program. Based on 1,385 pre-post tests, improvements were reported among participating Oklahoman youth in the areas of increasing servings of fruit and vegetables, skim milk and physically activity. Youth also reported decreased consumption of sweets, fat eaten and less screen time which can play a role in reducing overweight and risk of related chronic diseases. Growing Strong Bodies and Minds aims to promote the development of healthful food preferences, physically active lifestyles and literacy skills in young children. Specific goals include: use of pre-reading and reading strategies to teach nutrition and health messages; promote consumption of whole grains, fruits, vegetables, low-fat dairy foods, and increase time spent in active play; and support parents of young children in offering economical, nutrient dense foods to their children and increasing time spent in active play. 3,336 youth across that state participated in this program. In addition to increasing their knowledge of healthy foods, the students are discussing the foods they eat during lunch and talking to their families about the new foods they try. The Farm to You exhibit was experienced by 14,375 students at 50 schools in 29 counties in Oklahoma. This brings the five year total to over 37,000 youth in 140 schools. The exhibit, when combined with the classroom-based nutrition program, enhanced nutrition behavior change for upper-elementary grade students beyond that achieved with only the classroom-based program.
4. Associated Knowledge Areas
KA Code
Knowledge Area
703
Nutrition Education and Behavior
724
Healthy Lifestyle
Outcome #4
1. Outcome Measures
Percentage increase in the consumption of dairy foods
2. Associated Institution Types

● 1862 Extension
3a. Outcome Type:
Change in Action Outcome Measure
3b. Quantitative Outcome
Year
Actual
2013
50
3c. Qualitative Outcome or Impact Statement
Issue (Who cares and Why)
Oklahoma ranks as the 5th most obese state in the nation, with 17% of Oklahoma youth considered obese. This ranking reflects the state's high density of fast food establishments, low fruit and vegetable consumption (72% did not meet fruit recommendations and 86% did not meet vegetable recommendations) and low levels of physical activity, (30% of Oklahoma high school students reported watching three or more hours of television every day).
What has been done
Oklahoma Cooperative Extension Service programs are committed to the physical, mental and emotional health of our nation's youth so they may lead healthy and productive lives into and throughout adulthood. In order to advance the socio-economic development of the state, and have an impact on issues that address childhood obesity, educational programs have been created and implemented to educate Oklahomans on how to attain a better quality of life related to the critical areas of food, nutrition, and health.
Results
In 2013, 463 programs were presented to 21,907 participants. Oklahoma youth attended programs through 23 different curricula. Programs presented include: OrganWise Guys program. Based on 1,385 pre-post tests, improvements were reported among participating Oklahoman youth in the areas of increasing servings of fruit and vegetables, skim milk and physically activity. Youth also reported decreased consumption of sweets, fat eaten and less screen time which can play a role in reducing overweight and risk of related chronic diseases. Growing Strong Bodies and Minds aims to promote the development of healthful food preferences, physically active lifestyles and literacy skills in young children. Specific goals include: use of pre-reading and reading strategies to teach nutrition and health messages; promote consumption of whole grains, fruits, vegetables, low-fat dairy foods, and increase time spent in active play; and support parents of young children in offering economical, nutrient dense foods to their children and increasing time spent in active play. 3,336 youth across that state participated in this program. In addition to increasing their knowledge of healthy foods, the students are discussing the foods they eat during lunch and talking to their families about the new foods they try. The Farm to You exhibit was experienced by 14,375 students at 50 schools in 29 counties in Oklahoma. This brings the five year total to over 37,000 youth in 140 schools. The exhibit, when combined with the classroom-based nutrition program, enhanced nutrition behavior change for upper-elementary grade students beyond that achieved with only the classroom-based program.

4. Associated Knowledge Areas
KA Code
Knowledge Area
703
Nutrition Education and Behavior
724
Healthy Lifestyle
Outcome #5
1. Outcome Measures
Percentage decrease in consumption of foods high in fat, sugar and salt
2. Associated Institution Types
● 1862 Extension
3a. Outcome Type:
Change in Action Outcome Measure
3b. Quantitative Outcome
Year
Actual
2013
10
3c. Qualitative Outcome or Impact Statement
Issue (Who cares and Why)
Oklahoma ranks as the 5th most obese state in the nation, with 17% of Oklahoma youth considered obese. This ranking reflects the state's high density of fast food establishments, low fruit and vegetable consumption (72% did not meet fruit recommendations and 86% did not meet vegetable recommendations) and low levels of physical activity, (30% of Oklahoma high school students reported watching three or more hours of television every day).
What has been done
Oklahoma Cooperative Extension Service programs are committed to the physical, mental and emotional health of our nation's youth so they may lead healthy and productive lives into and throughout adulthood. In order to advance the socio-economic development of the state, and have an impact on issues that address childhood obesity, educational programs have been created and implemented to educate Oklahomans on how to attain a better quality of life related to the critical areas of food, nutrition, and health.
Results
In 2013, 463 programs were presented to 21,907 participants. Oklahoma youth attended programs through 23 different curricula. Programs presented include: OrganWise Guys program. Based on 1,385 pre-post tests, improvements were reported among participating Oklahoman youth in the areas of increasing servings of fruit and vegetables, skim milk and physically activity. Youth also reported decreased consumption of sweets, fat eaten and less screen time which can play a role in reducing overweight and risk of related chronic diseases. Growing Strong Bodies and Minds aims to promote the development of healthful food

preferences, physically active lifestyles and literacy skills in young children. Specific goals include: use of pre-reading and reading strategies to teach nutrition and health messages; promote consumption of whole grains, fruits, vegetables, low-fat dairy foods, and increase time spent in active play; and support parents of young children in offering economical, nutrient dense foods to their children and increasing time spent in active play. 3,336 youth across that state participated in this program. In addition to increasing their knowledge of healthy foods, the students are discussing the foods they eat during lunch and talking to their families about the new foods they try. The Farm to You exhibit was experienced by 14,375 students at 50 schools in 29 counties in Oklahoma. This brings the five year total to over 37,000 youth in 140 schools. The exhibit, when combined with the classroom-based nutrition program, enhanced nutrition behavior change for upper-elementary grade students beyond that achieved with only the classroom-based program.
4. Associated Knowledge Areas
KA Code
Knowledge Area
703
Nutrition Education and Behavior
724
Healthy Lifestyle
Outcome #6
1. Outcome Measures
Percentage decrease in the consumption of sugar-sweetened beverages
2. Associated Institution Types
● 1862 Extension
3a. Outcome Type:
Change in Action Outcome Measure
3b. Quantitative Outcome
Year
Actual
2013
10
3c. Qualitative Outcome or Impact Statement
Issue (Who cares and Why)
Oklahoma ranks as the 5th most obese state in the nation, with 17% of Oklahoma youth considered obese. This ranking reflects the state's high density of fast food establishments, low fruit and vegetable consumption (72% did not meet fruit recommendations and 86% did not meet vegetable recommendations) and low levels of physical activity, (30% of Oklahoma high school students reported watching three or more hours of television every day).
What has been done
Oklahoma Cooperative Extension Service programs are committed to the physical, mental and emotional health of our nation's youth so they may lead healthy and productive lives into and throughout adulthood. In order to advance the socio-economic development of the state, and

have an impact on issues that address childhood obesity, educational programs have been created and implemented to educate Oklahomans on how to attain a better quality of life related to the critical areas of food, nutrition, and health.
Results
In 2013, 463 programs were presented to 21,907 participants. Oklahoma youth attended programs through 23 different curricula. Programs presented include: OrganWise Guys program. Based on 1,385 pre-post tests, improvements were reported among participating Oklahoman youth in the areas of increasing servings of fruit and vegetables, skim milk and physically activity. Youth also reported decreased consumption of sweets, fat eaten and less screen time which can play a role in reducing overweight and risk of related chronic diseases. Growing Strong Bodies and Minds aims to promote the development of healthful food preferences, physically active lifestyles and literacy skills in young children. Specific goals include: use of pre-reading and reading strategies to teach nutrition and health messages; promote consumption of whole grains, fruits, vegetables, low-fat dairy foods, and increase time spent in active play; and support parents of young children in offering economical, nutrient dense foods to their children and increasing time spent in active play. 3,336 youth across that state participated in this program. In addition to increasing their knowledge of healthy foods, the students are discussing the foods they eat during lunch and talking to their families about the new foods they try. The Farm to You exhibit was experienced by 14,375 students at 50 schools in 29 counties in Oklahoma. This brings the five year total to over 37,000 youth in 140 schools. The exhibit, when combined with the classroom-based nutrition program, enhanced nutrition behavior change for upper-elementary grade students beyond that achieved with only the classroom-based program.
4. Associated Knowledge Areas
KA Code
Knowledge Area
703
Nutrition Education and Behavior
724
Healthy Lifestyle
Outcome #7
1. Outcome Measures
Percentage increase in physical activity
2. Associated Institution Types
● 1862 Extension
3a. Outcome Type:
Change in Action Outcome Measure
3b. Quantitative Outcome
Year
Actual

2013
40
3c. Qualitative Outcome or Impact Statement
Issue (Who cares and Why)
Oklahoma ranks as the 5th most obese state in the nation, with 17% of Oklahoma youth considered obese. This ranking reflects the state's high density of fast food establishments, low fruit and vegetable consumption (72% did not meet fruit recommendations and 86% did not meet vegetable recommendations) and low levels of physical activity, (30% of Oklahoma high school students reported watching three or more hours of television every day).
What has been done
Oklahoma Cooperative Extension Service programs are committed to the physical, mental and emotional health of our nation's youth so they may lead healthy and productive lives into and throughout adulthood. In order to advance the socio-economic development of the state, and have an impact on issues that address childhood obesity, educational programs have been created and implemented to educate Oklahomans on how to attain a better quality of life related to the critical areas of food, nutrition, and health.
Results
In 2013, 463 programs were presented to 21,907 participants. Oklahoma youth attended programs through 23 different curricula. Programs presented include: OrganWise Guys program. Based on 1,385 pre-post tests, improvements were reported among participating Oklahoman youth in the areas of increasing servings of fruit and vegetables, skim milk and physically activity. Youth also reported decreased consumption of sweets, fat eaten and less screen time which can play a role in reducing overweight and risk of related chronic diseases. Growing Strong Bodies and Minds aims to promote the development of healthful food preferences, physically active lifestyles and literacy skills in young children. Specific goals include: use of pre-reading and reading strategies to teach nutrition and health messages; promote consumption of whole grains, fruits, vegetables, low-fat dairy foods, and increase time spent in active play; and support parents of young children in offering economical, nutrient dense foods to their children and increasing time spent in active play. 3,336 youth across that state participated in this program. In addition to increasing their knowledge of healthy foods, the students are discussing the foods they eat during lunch and talking to their families about the new foods they try. The Farm to You exhibit was experienced by 14,375 students at 50 schools in 29 counties in Oklahoma. This brings the five year total to over 37,000 youth in 140 schools. The exhibit, when combined with the classroom-based nutrition program, enhanced nutrition behavior change for upper-elementary grade students beyond that achieved with only the classroom-based program.
4. Associated Knowledge Areas
KA Code
Knowledge Area
134
Outdoor Recreation
724
Healthy Lifestyle

Outcome #8
1. Outcome Measures
Percentage decrease of time in front of television, coumputers, etc.
Not Reporting on this Outcome Measure
Outcome #9
1. Outcome Measures
Percentage increase of meals prepared at home
2. Associated Institution Types
● 1862 Extension
3a. Outcome Type:
Change in Action Outcome Measure
3b. Quantitative Outcome
Year
Actual
2013
0
3c. Qualitative Outcome or Impact Statement
Issue (Who cares and Why)
What has been done
Results
4. Associated Knowledge Areas
KA Code
Knowledge Area
703
Nutrition Education and Behavior
724
Healthy Lifestyle
Outcome #10
1. Outcome Measures
Percentage increase in safe food handling practices
2. Associated Institution Types

● 1862 Extension
3a. Outcome Type:
Change in Action Outcome Measure
3b. Quantitative Outcome
Year
Actual
2013
10
3c. Qualitative Outcome or Impact Statement
Issue (Who cares and Why)
What has been done
Results
4. Associated Knowledge Areas
KA Code
Knowledge Area
703
Nutrition Education and Behavior
724
Healthy Lifestyle
Outcome #11
1. Outcome Measures
Percentage increase in positive parenting skills
2. Associated Institution Types
● 1862 Extension
3a. Outcome Type:
Change in Knowledge Outcome Measure
3b. Quantitative Outcome
Year
Actual
2013
60
3c. Qualitative Outcome or Impact Statement
Issue (Who cares and Why)
It is critical to address not only the prevention of childhood obesity but also the social and emotional impacts obesity can have on youth who are already obese. While obese teens engage in high-risk behaviors at the same rate as their healthy weight peers, they do so in more
dangerous ways, such as earlier onset of smoking, and engaging in sexual activity while under the influence of drugs or alcohol before the age of 13. Obese girls are also at increased risk of earlier onset of sex, having more sexual partners, and less consistent use of contraception. These increased risks compound their already elevated health risks due to obesity. In Oklahoma every year on average: 1,800 babies are born to school-age teens, and more teens engage in smoking, alcohol use, sexual activity than the national average. Obese teens also are more likely to drop out of school due to health problems, bullying, and social withdrawal related to poor body image, and poor self-esteem. In Oklahoma every year on average: 5,800 youth under age 19 drop out of high school; 16,000 arrests involve children or adolescents under age 18, and more teens engage in weapon carrying than the national average.
What has been done
Oklahoma Cooperative Extension Service programs are committed to the physical, mental and emotional health of our nation's youth so they may lead healthy and productive lives into and throughout adulthood. In order to advance the socio-economic development of the state, and have an impact on issues that address the critical areas of risky behaviors of youth and family resilience, educational programs have been created and implemented to educate Oklahomans on how to attain a better quality of life.
Results
In 2013, 225 Oklahomans participated in resilience programs including curricula such as Active Parenting Now/Active Parenting Now in 3 and Active Parenting for Teens. These curricula are part of the parenting skills and parent-child relationship program for Oklahoma families. Outcomes improved by these programs include: parental attitudes and beliefs, parent-child relationship problems, and positive and negative child behaviors. In one group of Active Parenting Now participants who were drug court clientele, over half of the parents now have some type of visitation with their children. 15% increase in belief that parents should play or do something fun with their children every day 21% increase in belief that children need to have daily responsibilities around the house 75% increase in belief that parents should give their children choices instead of telling them what to do 63% increase in belief that parents should let children solve their own problems 45% increase in belief that it is better to ?give? a little on smaller, less important things than to always stand firm and provoke a fight
4. Associated Knowledge Areas
KA Code
Knowledge Area
802
Human Development and Family Well-Being
Outcome #12
1. Outcome Measures
Percentage increase in youth positive peer involvement
Not Reporting on this Outcome Measure

Outcome #13
1. Outcome Measures
Percentage increase in parenting competence
2. Associated Institution Types
● 1862 Extension
3a. Outcome Type:
Change in Knowledge Outcome Measure
3b. Quantitative Outcome
Year
Actual
2013
66
3c. Qualitative Outcome or Impact Statement
Issue (Who cares and Why)
It is critical to address not only the prevention of childhood obesity but also the social and emotional impacts obesity can have on youth who are already obese. While obese teens engage in high-risk behaviors at the same rate as their healthy weight peers, they do so in more dangerous ways, such as earlier onset of smoking, and engaging in sexual activity while under the influence of drugs or alcohol before the age of 13. Obese girls are also at increased risk of earlier onset of sex, having more sexual partners, and less consistent use of contraception. These increased risks compound their already elevated health risks due to obesity. In Oklahoma every year on average: 1,800 babies are born to school-age teens, and more teens engage in smoking, alcohol use, sexual activity than the national average. Obese teens also are more likely to drop out of school due to health problems, bullying, and social withdrawal related to poor body image, and poor self-esteem. In Oklahoma every year on average: 5,800 youth under age 19 drop out of high school; 16,000 arrests involve children or adolescents under age 18, and more teens engage in weapon carrying than the national average.
What has been done
Oklahoma Cooperative Extension Service programs are committed to the physical, mental and emotional health of our nation's youth so they may lead healthy and productive lives into and throughout adulthood. In order to advance the socio-economic development of the state, and have an impact on issues that address the critical areas of risky behaviors of youth and family resilience, educational programs have been created and implemented to educate Oklahomans on how to attain a better quality of life.
Results
In 2013, 225 Oklahomans participated in resilience programs including curricula such as Active Parenting Now/Active Parenting Now in 3 and Active Parenting for Teens. These curricula are part of the parenting skills and parent-child relationship program for Oklahoma families. Outcomes improved by these programs include: parental attitudes and beliefs, parent-child relationship problems, and positive and negative child behaviors. In one group of Active Parenting Now participants who were drug court clientele, over half of the parents now have some type of visitation with their children.

55% increase in feeling sure of self as a mother/father 80% increase in knowing they are doing a good job as a mother/father 66% increase in persistence in trying to solve problems between their child and themselves
4. Associated Knowledge Areas
KA Code
Knowledge Area
802
Human Development and Family Well-Being
Outcome #14
1. Outcome Measures
Percentage increase in child competent behaviors
2. Associated Institution Types
● 1862 Extension
3a. Outcome Type:
Change in Action Outcome Measure
3b. Quantitative Outcome
Year
Actual
2013
40
3c. Qualitative Outcome or Impact Statement
Issue (Who cares and Why)
It is critical to address not only the prevention of childhood obesity but also the social and emotional impacts obesity can have on youth who are already obese. While obese teens engage in high-risk behaviors at the same rate as their healthy weight peers, they do so in more dangerous ways, such as earlier onset of smoking, and engaging in sexual activity while under the influence of drugs or alcohol before the age of 13. Obese girls are also at increased risk of earlier onset of sex, having more sexual partners, and less consistent use of contraception. These increased risks compound their already elevated health risks due to obesity. In Oklahoma every year on average: 1,800 babies are born to school-age teens, and more teens engage in smoking, alcohol use, sexual activity than the national average. Obese teens also are more likely to drop out of school due to health problems, bullying, and social withdrawal related to poor body image, and poor self-esteem. In Oklahoma every year on average: 5,800 youth under age 19 drop out of high school; 16,000 arrests involve children or adolescents under age 18, and more teens engage in weapon carrying than the national average.
What has been done
Oklahoma Cooperative Extension Service programs are committed to the physical, mental and emotional health of our nation's youth so they may lead healthy and productive lives into and throughout adulthood. In order to advance the socio-economic development of the state, and have an impact on issues that address the critical areas of risky behaviors of youth and family

resilience, educational programs have been created and implemented to educate Oklahomans on how to attain a better quality of life.
Results
In 2013, 225 Oklahomans participated in resilience programs including curricula such as Active Parenting Now/Active Parenting Now in 3 and Active Parenting for Teens. These curricula are part of the parenting skills and parent-child relationship program for Oklahoma families. Outcomes improved by these programs include: parental attitudes and beliefs, parent-child relationship problems, and positive and negative child behaviors. In one group of Active Parenting Now participants who were drug court clientele, over half of the parents now have some type of visitation with their children. 71% increase in child being considerate of other people?s feelings 40% increase in child?s sharing readily with other children 37% increase in child having at least one good friend 16% increase in child being kind to younger children
4. Associated Knowledge Areas
KA Code
Knowledge Area
802
Human Development and Family Well-Being
806
Youth Development
Outcome #15
1. Outcome Measures
Percentage increase in access to affordable, healthy foods such as community gardens and farmers' markets
Not Reporting on this Outcome Measure
Outcome #16
1. Outcome Measures
Percnetage increase in opportunities for physical activity
Not Reporting on this Outcome Measure
Outcome #17
1. Outcome Measures
Percentage increase in deliberative forums on issues related to high risk behaviors to develop solutions that encourage broad community support
Not Reporting on this Outcome Measure

Outcome #18
1. Outcome Measures
Percentage increase in task forces to promote positive activities for youth and increase personal awareness and involvement
Not Reporting on this Outcome Measure
V(H). Planned Program (External Factors)
● Economy
● Appropriations changes
● Public Policy changes
Brief Explanation
Statewide issue team format has changed educator focus and reduced activity in some planned programs.
V(I). Planned Program (Evaluation Studies)
Evaluation Results
Issue team evaluation items for the above outcomes include:
10 youth respondents to health issue team evaluations reported the following planned behavior changes
after participating in the program:
• 30% increase in those who plan to eat a serving of fruit 2 or more times each day
• 20% increase in those who plan to eat a whole grain food 3 or more times each day
• 50% increase in those who plan to eat or drink a serving of calcium-rich food 2 or 3 times each day
• 40% increase in those who plan to be physically active at least 60 minutes throughout the day
• 10% increase in those who plan to use safe food handling practices
31 adult respondents to family resilience issue team evaluations reported the following changes after
participating in the programs:
• 15% increase in belief that parents should play or do something fun with their children every day
• 21% increase in belief that children need to have daily responsibilities around the house
• 75% increase in belief that parents should give their children choices instead of telling them what to do
• 63% increase in belief that parents should let children solve their own problems
• 45% increase in belief that it is better to "give" a little on smaller, less important things than to always stand
firm and provoke a fight
• 16% increase in belief that parents should give their full attention to children when

children are talking
• 55% increase in feeling sure of self as a mother/father
• 80% increase in knowing they are doing a good job as a mother/father
• 66% increase in persistence in trying to solve problems between their child and themselves
• 71% increase in child being considerate of other people's feelings
• 40% increase in child's sharing readily with other children
• 37% increase in child having at least one good friend
• 16% increase in child being kind to younger children
Based on 1,385 pre-post tests for the OrganWise Guys program, improvements were reported among
participating Oklahoman youth in the areas of increasing servings of fruit and vegetables, skim milk and
physically activity. Youth also reported decreased consumption of sweets, fat eaten and less screen time which
can play a role in reducing overweight and risk of related chronic diseases.
Key Items of Evaluation
In 2013, Issue Team-specific Evaluation Questionnaires were collected after planned program curriculum
delivery. These questions utilized a retrospective approach. In 2013 educators were still adapting to new
evaluation and reporting process, resulting in lower evaluation numbers.

V(A). Planned Program (Summary)
Program # 15
1. Name of the Planned Program
Structure and Function of Macromolecules
Reporting on this Program
V(B). Program Knowledge Area(s)
1. Program Knowledge Areas and Percentage
KA Code
Knowledge Area %1862 Extension
%1890 Extension
%1862 Research
%1890 Research
201 Plant Genome, Genetics, and Genetic Mechanisms
0% 5%
203 Plant Biological Efficiency and Abiotic Stresses Affecting Plants
0% 5%
206 Basic Plant Biology 0% 20%
211 Insects, Mites, and Other Arthropods Affecting Plants
0% 5%
212 Pathogens and Nematodes Affecting Plants
0% 5%
304 Animal Genome 0% 5%
305 Animal Physiological Processes 0% 45%
311 Animal Diseases 0% 5%
312 External Parasites and Pests of Animals 0% 5%
Total 0% 100%
V(C). Planned Program (Inputs)
1. Actual amount of FTE/SYs expended this Program
Year: 2013 Extension Research
1862 1890 1862 1890
Plan 0.0 0.0 8.0 0.0
Actual Paid Professional 0.0 0.0 5.7 0.0
Actual Volunteer 0.0 0.0 0.0 0.0
2. Actual dollars expended in this Program (includes Carryover Funds from previous years)

Extension Research
Smith-Lever 3b & 3c 1890 Extension Hatch Evans-Allen
0 0 252150 0
1862 Matching 1890 Matching 1862 Matching 1890 Matching
0 0 252150 0
1862 All Other 1890 All Other 1862 All Other 1890 All Other
0 0 1434310 0
V(D). Planned Program (Activity)
1. Brief description of the Activity
-Basic research will be conducted that will make fundamental discoveries which will enhance our understanding of molecular mechanisms involved in the regulation of physiological processes in plant and animal systems. - New faculty and staff will be recruited to build, foster and maintain a cohesive critical mass of research faculty with a diverse set of expertise that focuses on the study of structural biology. -Grant proposals will be written to acquire and maintain state of the art equipment to enhance the research capabilities relating to protein structure/ function/ interactions on the OSU campus. - Funds will be solicited from national, state and university sources to acquire, and maintain support for "Core" facilities that are critical to the research mission of DASNR and Oklahoma State University. - Design and conduct basic research to fill critical gaps in scientific knowledge that will address needs, issues and problems that ultimately can be translated into an improvement in plant and animal health. - Develop new research methods and procedures. - Train undergraduate and graduate students, and postdoctoral associates. - Publish scientific articles. - Write and submit grant proposals. - Attend and present scientific findings at professional conferences. - File patents for protection of intellectual property and negotiate licensing agreements for technology transfer. - Interact with other researchers both on and off the OSU campus.
2. Brief description of the target audience
- Departments and department heads - OSU administrators - Other faculty and other scientific researchers in DASNR, at OSU & the scientific community - Students and post-docs

- Federal, state, and private funding agencies - Scientific journal editors, readers & the scientific community - Candidates for open faculty and staff positions. - Patent officers - Agricultural, environmental, life, and human science industries - General public and elected officials
3. How was eXtension used?
eXtension was not used in this program
V(E). Planned Program (Outputs)
1. Standard output measures
2013 Direct Contacts
Adults Indirect Contacts
Adults Direct Contacts
Youth Indirect Contacts
Youth
Actual 0 0 0 0
2. Number of Patent Applications Submitted (Standard Research Output)
Patent Applications Submitted
Year: 2013
Actual: 0
Patents listed
3. Publications (Standard General Output Measure)
Number of Peer Reviewed Publications
2013 Extension Research Total
Actual 0 25 0
V(F). State Defined Outputs
Output Target
Output #1
Output Measure
● Number of graduate students graduated and post doctoral scientists moving on to full employment.
Year Actual
2013 8
Output #2
Output Measure
● Numbers of manuscripts submitted from research efforts
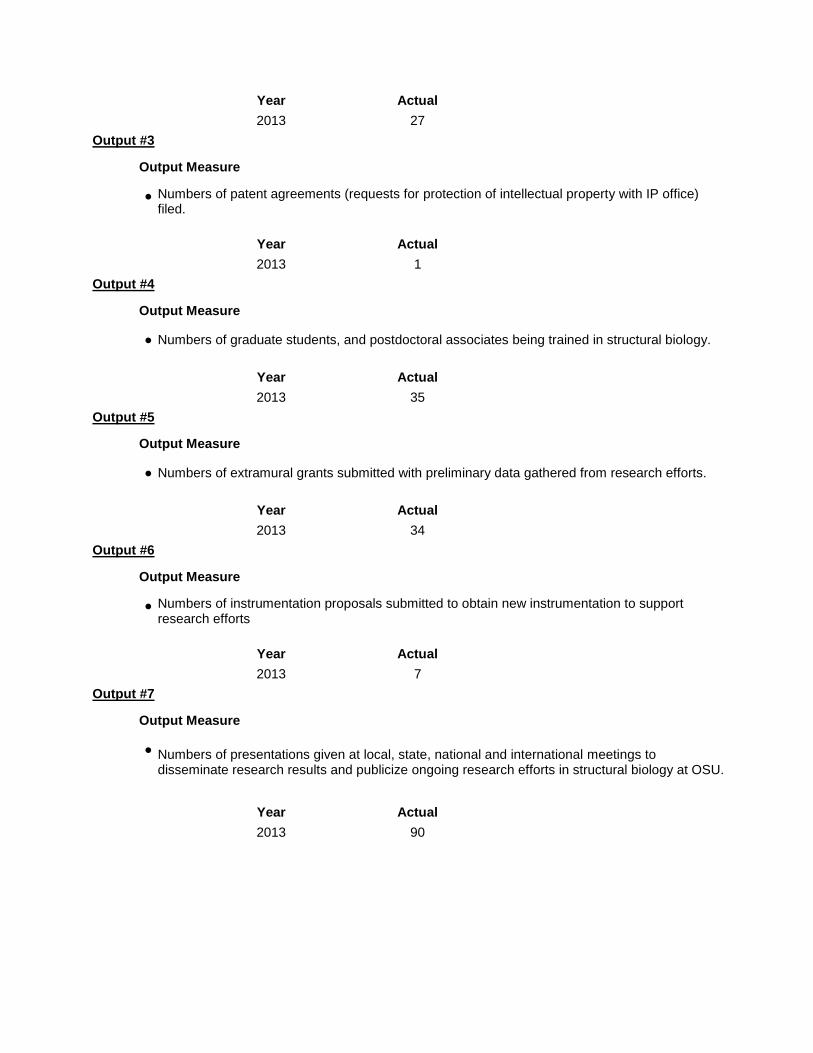
Year Actual
2013 27
Output #3
Output Measure
● Numbers of patent agreements (requests for protection of intellectual property with IP office) filed.
Year Actual
2013 1
Output #4
Output Measure
● Numbers of graduate students, and postdoctoral associates being trained in structural biology.
Year Actual
2013 35
Output #5
Output Measure
● Numbers of extramural grants submitted with preliminary data gathered from research efforts.
Year Actual
2013 34
Output #6
Output Measure
● Numbers of instrumentation proposals submitted to obtain new instrumentation to support research efforts
Year Actual
2013 7
Output #7
Output Measure
● Numbers of presentations given at local, state, national and international meetings to disseminate research results and publicize ongoing research efforts in structural biology at OSU.
Year Actual
2013 90

V(G). State Defined Outcomes
V. State Defined Outcomes Table of Content
O. No. OUTCOME NAME
1 Research development knowledge taken to patent or license stage.
2 Detecting biological contamination of foods and on surfaces used for food processing
3
Increased number of graduate students and post doctoral associates will be recruited into and trained in molecular biology.
4 Increased competitiveness of team members for extramural funding.
5
Increased competitiveness of equipment proposals submitted by team members due to investments made in research infrastructure.
6
Faculty at OSU will become known nationally and internationally for their expertise and research in their particular area of structural biology.
7
Development of new and better therapeutics for the treatment and prevention of inflammatory and autoimmune diseases

Outcome #1
1. Outcome Measures
Research development knowledge taken to patent or license stage.
Not Reporting on this Outcome Measure
Outcome #2
1. Outcome Measures
Detecting biological contamination of foods and on surfaces used for food processing
2. Associated Institution Types
● 1862 Research
3a. Outcome Type:
Change in Knowledge Outcome Measure
3b. Quantitative Outcome
Year
Actual
2013
25
3c. Qualitative Outcome or Impact Statement
Issue (Who cares and Why)
While the need for a method that can detect biological contamination of foods and on surfaces used for food processing and its importance for food safety is well-understood, currently there is no rapid method available for such detection.
What has been done
Researchers demonstrated that laser-induced breakdown spectroscopy (LIBS) can be used to differentiate bacterial pathogens and antimicrobial-resistant bacterial pathogens from isogenic antimicrobial-susceptible strains, and to detect food pathogens on foods and food-processing surfaces. The type (E. coli or S. enterica) of bacteria could also be differentiated in all cases studied along with the metabolic state (viable or heat killed). The main advantages of LIBS-based technology are the speed of analysis, minimal sample preparation, use of few consumables, and the ability to detect pathogens on all types of surfaces.
Results
The rapid detection of biological contaminants, such as Escherichia coli O157:H7 and Salmonella enterica, on foods and food-processing surfaces is important to ensure food safety and streamline the food-monitoring process. LIBS is an ideal candidate technology for this application because sample preparation is minimal and results are available rapidly (seconds to minutes). This study provides data showing the potential of LIBS for the rapid identification of biological contaminants using spectra collected directly from foods and surfaces, and its future application in the food processing industry with a predicted outcome of a significant reduction in the instances of outbreaks of food-borne diseases.

4. Associated Knowledge Areas
KA Code
Knowledge Area
201
Plant Genome, Genetics, and Genetic Mechanisms
203
Plant Biological Efficiency and Abiotic Stresses Affecting Plants
206
Basic Plant Biology
304
Animal Genome
305
Animal Physiological Processes
Outcome #3
1. Outcome Measures
Increased number of graduate students and post doctoral associates will be recruited into and trained in molecular biology.
2. Associated Institution Types
● 1862 Research
3a. Outcome Type:
Change in Action Outcome Measure
3b. Quantitative Outcome
Year
Actual
2013
8
3c. Qualitative Outcome or Impact Statement
Issue (Who cares and Why)
What has been done
Results
4. Associated Knowledge Areas
KA Code
Knowledge Area
201
Plant Genome, Genetics, and Genetic Mechanisms
203
Plant Biological Efficiency and Abiotic Stresses Affecting Plants
206
Basic Plant Biology
304
Animal Genome
305
Animal Physiological Processes

Outcome #4
1. Outcome Measures
Increased competitiveness of team members for extramural funding.
2. Associated Institution Types
● 1862 Research
3a. Outcome Type:
Change in Action Outcome Measure
3b. Quantitative Outcome
Year
Actual
2013
11
3c. Qualitative Outcome or Impact Statement
Issue (Who cares and Why)
What has been done
Results
4. Associated Knowledge Areas
KA Code
Knowledge Area
201
Plant Genome, Genetics, and Genetic Mechanisms
203
Plant Biological Efficiency and Abiotic Stresses Affecting Plants
206
Basic Plant Biology
304
Animal Genome
305
Animal Physiological Processes
Outcome #5
1. Outcome Measures
Increased competitiveness of equipment proposals submitted by team members due to investments made in research infrastructure.
2. Associated Institution Types
● 1862 Research

3a. Outcome Type:
Change in Action Outcome Measure
3b. Quantitative Outcome
Year
Actual
2013
4
3c. Qualitative Outcome or Impact Statement
Issue (Who cares and Why)
What has been done
Results
4. Associated Knowledge Areas
KA Code
Knowledge Area
201
Plant Genome, Genetics, and Genetic Mechanisms
203
Plant Biological Efficiency and Abiotic Stresses Affecting Plants
206
Basic Plant Biology
304
Animal Genome
305
Animal Physiological Processes
Outcome #6
1. Outcome Measures
Faculty at OSU will become known nationally and internationally for their expertise and research in their particular area of structural biology.
2. Associated Institution Types
● 1862 Research
3a. Outcome Type:
Change in Condition Outcome Measure
3b. Quantitative Outcome
Year
Actual
2013
13
3c. Qualitative Outcome or Impact Statement
Issue (Who cares and Why)
The cell walls of plants play a critical role in their growth and vitality. Knowledge on plants cell wall synthesis and structure is critical for advancing our understanding of disease resistance and

approaches for increasing the productivity of plants.
What has been done
Dr. Andrew has an international reputation in cell wall research. Dr. Mort was invited to the 13th Annual International Cell Wall Meeting in Nantes, France to give a presentation on "Half of the xyloglucan in cell walls of tissue cultures is linked to pectin via a highly branched arabinan."
Results
Dr. Mort's research is advancing the scientific community's understanding of the structure and functions of plants cell walls. In the future, this knowledge should facilitate the development of more productive and disease resistant plants. Dr. Mort's invitation to present his laboratory's research results at an international symposium acknowledges the important contributions that are being made by researchers in the Division of Agricultural Sciences and Natural Resources at OSU to the scientific community at large, and the international prominence of its faculty.
4. Associated Knowledge Areas
KA Code
Knowledge Area
201
Plant Genome, Genetics, and Genetic Mechanisms
203
Plant Biological Efficiency and Abiotic Stresses Affecting Plants
206
Basic Plant Biology
304
Animal Genome
305
Animal Physiological Processes
Outcome #7
1. Outcome Measures
Development of new and better therapeutics for the treatment and prevention of inflammatory and autoimmune diseases
2. Associated Institution Types
● 1862 Research
3a. Outcome Type:
Change in Knowledge Outcome Measure
3b. Quantitative Outcome
Year
Actual
2013
0
3c. Qualitative Outcome or Impact Statement
Issue (Who cares and Why)
IL-17 cytokines play a crucial role in the development of a variety of autoimmune and inflammatory diseases that affect both humans and livestock. IL-17 E signals through a receptor complex composed of IL-17RA and IL17RB chains. Components of the IL-17 receptor (IL-17R) contain SEFIR domains that mediate protein-protein interactions critical for IL-17R signaling. Considering the significance of SEFIR mediated interactions in IL-17 signaling, a better

mechanistic understanding of these interactions is vital for the development of novel and improved therapies for the treatment of IL-17-mediated inflammatory diseases.
What has been done
The first crystal structure of SEFIR domain from IL-17RB has been published. Distinct structural elements in SEFIR domain were identified that are key to their ability to mediate protein-protein interactions, and suggest a dual ligand-binding mode for SEFIR domains. Functional analysis of the protein further identified specific regions of the SEFIR domain and Act1 that modulate their interaction. Act1 (activator of NFkappaB, a transcription factor central to the inflammatory response) is an essential component of IL-17 signaling.
Results
The structural and functional analyses of the SEFIR domain of IL-17RB suggest a unique model on how signaling that is mediated by SEFIR?SEFIR interactions take place. The structural insights provided by these analyzes into the molecular mechanisms of IL-17 cytokine signaling will help facilitate the development of new and better therapeutics for the treatment and prevention of inflammatory and autoimmune diseases.
4. Associated Knowledge Areas
KA Code
Knowledge Area
305
Animal Physiological Processes
V(H). Planned Program (External Factors)
● Economy
● Appropriations changes
● Public Policy changes
● Government Regulations
● Competing Public priorities
Brief Explanation
Appropriations for support of research have been shrinking at both the state and federal levels for all of the
reasons listed above. As a result there are fewer grant dollars available, and competition for funding is strong.
While increased grant dollars were generated by the team this year, they for the most part represent short term
seed money to gather preliminary data for submission of competitive grants.
V(I). Planned Program (Evaluation Studies)
Evaluation Results
Despite shrinking appropriations and increased competition for research funding, team members have in
the short term increases their newly acquired funding from 2012 levels. However, overall funding in comparison
to grant funding acquired prior to 2012 is down reflecting the external factors discussed above. The result of this
is that fewer graduate students can be supported, and fewer postdoctoral fellows can be hired. In addition, the
number of faculty members on the Structure and Function of Macromolecules Team has decreased and the
current funding environment has not allowed for their replacement. The impact of this situation on the current
evaluations is that the number of manuscripts published has decreased, as has the number of graduate students
receiving degrees.

Key Items of Evaluation
Compare percent change in output measures with output measures from 2012.
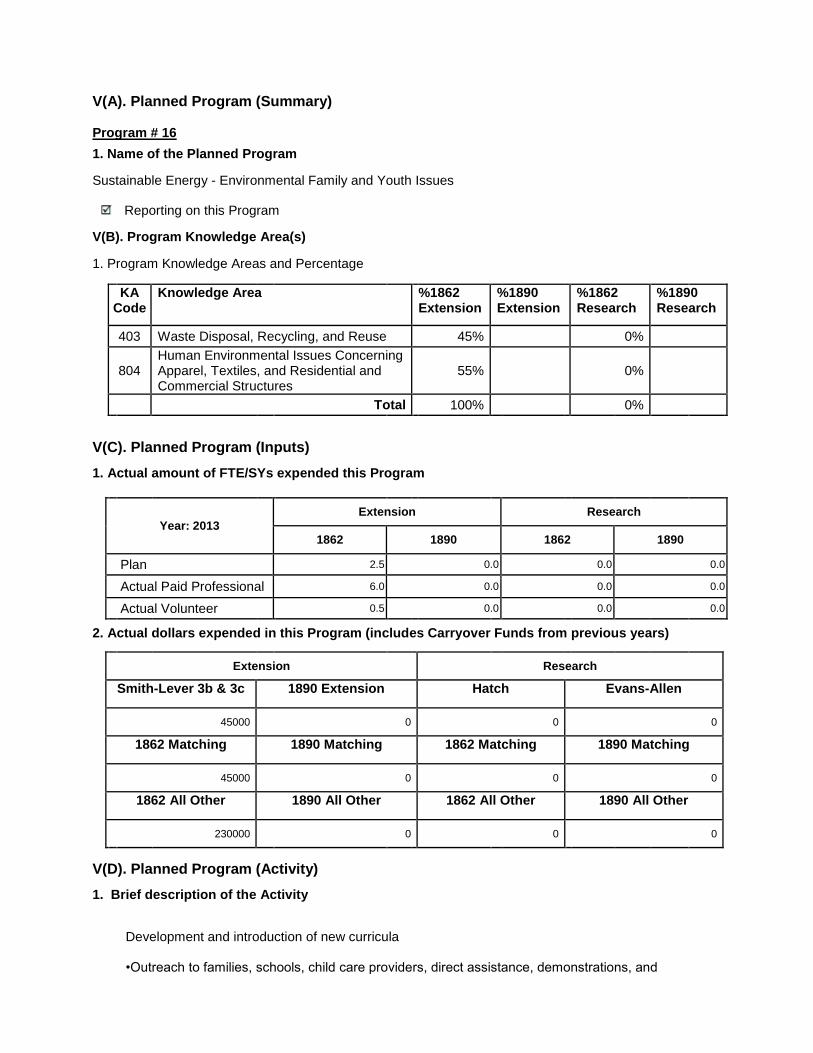
V(A). Planned Program (Summary)
Program # 16
1. Name of the Planned Program
Sustainable Energy - Environmental Family and Youth Issues
Reporting on this Program
V(B). Program Knowledge Area(s)
1. Program Knowledge Areas and Percentage
KA Code
Knowledge Area %1862 Extension
%1890 Extension
%1862 Research
%1890 Research
403 Waste Disposal, Recycling, and Reuse 45% 0%
804
Human Environmental Issues Concerning Apparel, Textiles, and Residential and Commercial Structures
55% 0%
Total 100% 0%
V(C). Planned Program (Inputs)
1. Actual amount of FTE/SYs expended this Program
Year: 2013 Extension Research
1862 1890 1862 1890
Plan 2.5 0.0 0.0 0.0
Actual Paid Professional 6.0 0.0 0.0 0.0
Actual Volunteer 0.5 0.0 0.0 0.0
2. Actual dollars expended in this Program (includes Carryover Funds from previous years)
Extension Research
Smith-Lever 3b & 3c 1890 Extension Hatch Evans-Allen
45000 0 0 0
1862 Matching 1890 Matching 1862 Matching 1890 Matching
45000 0 0 0
1862 All Other 1890 All Other 1862 All Other 1890 All Other
230000 0 0 0
V(D). Planned Program (Activity)
1. Brief description of the Activity
Development and introduction of new curricula •Outreach to families, schools, child care providers, direct assistance, demonstrations, and

educational opportunities to food, healthy, eating, exercise, diet, etc. •Development of surveys, evaluation tools •Delivery through classes, One-on-One, News Releases/TV/Radio, Participation in Events, Displays •Provided training and other staff development opportunities to county educators
2. Brief description of the target audience
Homeowners, youth, adults, families, community leaders
3. How was eXtension used?
eXtension is provided as an educator resource.
V(E). Planned Program (Outputs)
1. Standard output measures
2. Number of Patent Applications Submitted (Standard Research Output)
Patent Applications Submitted
Year: 2013
Actual: 0
Patents listed
3. Publications (Standard General Output Measure)
Number of Peer Reviewed Publications
2013 Extension Research Total
Actual 2 0 2
V(F). State Defined Outputs
Output Target
Output #1
Output Measure
● Number of OSU Fact s published
Year Actual
2013 2

Output #2
Output Measure
● Number of other publications including but not limited to Bulletins, Technical Manuals, Reports as well as PowerPoint presentation and Spreadsheets, etc. distributed for use by others
Year Actual
2013 0
Output #3
Output Measure
● Number of in-service training sessions
Year Actual
2013 4
Output #4
Output Measure
● Number of certification Training sessions
Year Actual
2013 0
Output #5
Output Measure
● Number of other training sessions, workshops, etc. conducted
Year Actual
2013 3
Output #6
Output Measure
● Number of presentations at Extension organized meetings
Year Actual
2013 2
Output #7
Output Measure
● Number of presentations at other meetings and events (professional metings, invitations to speak to community groups, etc.)
Year Actual
2013 2

Output #8
Output Measure
● Number of workshops, conferences, etc. organized
Year Actual
2013 0
Output #9
Output Measure
● Number of posters or displays
Year Actual
2013 0
Output #10
Output Measure
● Number of other demonstrations, displays, exhibits, and models
Year Actual
2013 0
Output #11
Output Measure
● Number of newsletters
Year Actual
2013 0
Output #12
Output Measure
● Number of website hits
Year Actual
2013 0
Output #13
Output Measure
● Number of radio and television presentations
Year Actual
2013 0

Output #14
Output Measure
● Number of newspaper, and magazine articles written
Year Actual
2013 0
Output #15
Output Measure
● Average number of phone calls and/or email requests responded to on a weekly basis
Year Actual
2013 0
Output #16
Output Measure
● Number of websites
Year Actual
2013 0

V(G). State Defined Outcomes
V. State Defined Outcomes Table of Content
O. No. OUTCOME NAME
1
Percentage increase in composting, donation of goods for others to use, repurpose, and recycle
2 Percentage increase in energy efficiency
3 Percentage decrease in food and packaging waste and use of disposable products
4
Percentage increase in maintenance, conservation, and protection of natural resources (air, land, water)
5
Percentage increase in communities that establish or continue collection points/times for recycling or resuse of consumer and agriculture goods

Outcome #1
1. Outcome Measures
Percentage increase in composting, donation of goods for others to use, repurpose, and recycle
2. Associated Institution Types
● 1862 Extension
3a. Outcome Type:
Change in Action Outcome Measure
3b. Quantitative Outcome
Year
Actual
2013
0
3c. Qualitative Outcome or Impact Statement
Issue (Who cares and Why)
Oklahoma ranks 11th in the nation in total energy consumption per capita. The average American produces 4.4 pounds of garbage every day, but only recycles 1.5 pounds of that waste. Just over 50% of Oklahoma households have access to recycling programs.
What has been done
Abuse of the state?s natural resources can have far-reaching and long-lasting consequences for Oklahoma?s economy and the well being of its citizens. In order to advance the socio-economic development of the state, educational programs have been created and implemented to educate Oklahomans on how to be better stewards of the environment.
Results
In 2013 363 individuals attended educational programs which taught them how to decrease food and packaging waste, reuse disposable products and packaging, and turn items that would have been otherwise thrown away into useful items.
4. Associated Knowledge Areas
KA Code
Knowledge Area
403
Waste Disposal, Recycling, and Reuse
Outcome #2
1. Outcome Measures
Percentage increase in energy efficiency
Not Reporting on this Outcome Measure

Outcome #3
1. Outcome Measures
Percentage decrease in food and packaging waste and use of disposable products
2. Associated Institution Types
● 1862 Extension
3a. Outcome Type:
Change in Action Outcome Measure
3b. Quantitative Outcome
Year
Actual
2013
0
3c. Qualitative Outcome or Impact Statement
Issue (Who cares and Why)
Oklahoma ranks 11th in the nation in total energy consumption per capita. The average American produces 4.4 pounds of garbage every day, but only recycles 1.5 pounds of that waste. Just over 50% of Oklahoma households have access to recycling programs.
What has been done
Abuse of the state?s natural resources can have far-reaching and long-lasting consequences for Oklahoma?s economy and the well being of its citizens. In order to advance the socio-economic development of the state, educational programs have been created and implemented to educate Oklahomans on how to be better stewards of the environment.
Results
In 2013 363 individuals attended educational programs which taught them how to decrease food and packaging waste, reuse disposable products and packaging, and turn items that would have been otherwise thrown away into useful items.
4. Associated Knowledge Areas
KA Code
Knowledge Area
403
Waste Disposal, Recycling, and Reuse
Outcome #4
1. Outcome Measures
Percentage increase in maintenance, conservation, and protection of natural resources (air, land, water)
Not Reporting on this Outcome Measure

Outcome #5
1. Outcome Measures
Percentage increase in communities that establish or continue collection points/times for recycling or resuse of consumer and agriculture goods
Not Reporting on this Outcome Measure
V(H). Planned Program (External Factors)
● Natural Disasters (drought, weather extremes, etc.)
● Economy
● Public Policy changes
● Government Regulations
● Competing Public priorities
Brief Explanation
Statewide issue team format has changed educator focus and reduced activity in some planned programs
V(I). Planned Program (Evaluation Studies)
Evaluation Results
In 2013 educators were still adapting to the new evaluation and reporting process, resulting in no formal
evaluation data for this program.
Key Items of Evaluation
In 2013, Issue Team-specific Evaluation Questionnaires were collected after planned program curriculum
delivery. These questions utilized a retrospective approach.

V(A). Planned Program (Summary)
Program # 17
1. Name of the Planned Program
Climate Change - Family and Youth Environmental and Safety Issues
Reporting on this Program
V(B). Program Knowledge Area(s)
1. Program Knowledge Areas and Percentage
KA Code
Knowledge Area %1862 Extension
%1890 Extension
%1862 Research
%1890 Research
102 Soil, Plant, Water, Nutrient Relationships 2% 0%
111 Conservation and Efficient Use of Water 5% 0%
133 Pollution Prevention and Mitigation 5% 0%
134 Outdoor Recreation 40% 0%
141 Air Resource Protection and Management 5% 0%
723 Hazards to Human Health and Safety 18% 0%
804
Human Environmental Issues Concerning Apparel, Textiles, and Residential and Commercial Structures
7% 0%
805 Community Institutions, Health, and Social Services
18% 0%
Total 100% 0%
V(C). Planned Program (Inputs)
1. Actual amount of FTE/SYs expended this Program
Year: 2013 Extension Research
1862 1890 1862 1890
Plan 5.5 0.0 0.0 0.0
Actual Paid Professional 6.0 0.0 0.0 0.0
Actual Volunteer 2.8 0.0 0.0 0.0
2. Actual dollars expended in this Program (includes Carryover Funds from previous years)
Extension Research
Smith-Lever 3b & 3c 1890 Extension Hatch Evans-Allen
160000 0 0 0
1862 Matching 1890 Matching 1862 Matching 1890 Matching
160000 0 0 0
1862 All Other 1890 All Other 1862 All Other 1890 All Other
540000 0 0 0

V(D). Planned Program (Activity)
1. Brief description of the Activity
•Development and introduction of new curricula •Outreach to families, schools, child care providers, direct assistance, demonstrations, and educational opportunities to food, healthy, eating, exercise, diet, etc. •Development of surveys, evaluation tools •Delivery through classes, One-on-One, News Releases/TV/Radio, Participation in Events, Displays •Provided training and other staff development opportunities to county educators
2. Brief description of the target audience
Youth, homeowners, families, children, teachers, communities, community leaders
3. How was eXtension used?
eXtension is provided as an educator resource
V(E). Planned Program (Outputs)
1. Standard output measures
2. Number of Patent Applications Submitted (Standard Research Output)
Patent Applications Submitted
Year: 2013
Actual: 0
Patents listed
3. Publications (Standard General Output Measure)
Number of Peer Reviewed Publications
2013 Extension Research Total
Actual 1 0 1
V(F). State Defined Outputs
Output Target
Output #1
Output Measure
● Number of OSU Fact s published

Year Actual
2013 1
Output #2
Output Measure
● Number of other publications including but not limited to Bulletins, Technical Manuals, Reports as well as PowerPoint presentation and Spreadsheets, etc. distributed for use by others
Year Actual
2013 2
Output #3
Output Measure
● Number of in-service training sessions
Year Actual
2013 3
Output #4
Output Measure
● Number of certification Training sessions
Year Actual
2013 0
Output #5
Output Measure
● Number of other training sessions, workshops, etc. conducted
Year Actual
2013 5
Output #6
Output Measure
● Number of presentations at Extension organized meetings
Year Actual
2013 1
Output #7
Output Measure
● Number of presentations at other meetings and events (professional metings, invitations to speak to community groups, etc.)
Year Actual
2013 6

Output #8
Output Measure
● Number of workshops, conferences, etc. organized
Year Actual
2013 0
Output #9
Output Measure
● Number of posters or displays
Year Actual
2013 0
Output #10
Output Measure
● Number of other demonstrations, displays, exhibits, and models
Year Actual
2013 0
Output #11
Output Measure
● Number of newsletters
Year Actual
2013 0
Output #12
Output Measure
● Number of website hits
Year Actual
2013 0
Output #13
Output Measure
● Number of radio and television presentations
Year Actual
2013 0
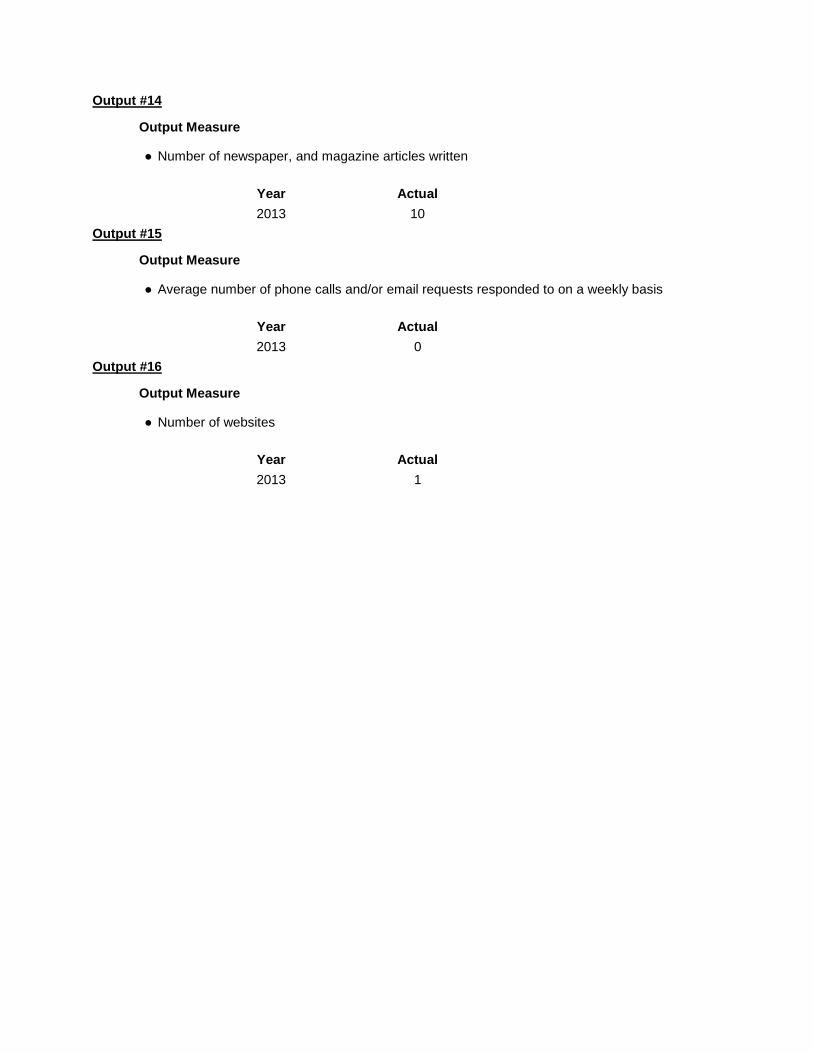
Output #14
Output Measure
● Number of newspaper, and magazine articles written
Year Actual
2013 10
Output #15
Output Measure
● Average number of phone calls and/or email requests responded to on a weekly basis
Year Actual
2013 0
Output #16
Output Measure
● Number of websites
Year Actual
2013 1

V(G). State Defined Outcomes
V. State Defined Outcomes Table of Content
O. No. OUTCOME NAME
1
Percentage increase in selection and home preservation of home, locally and regionally produced foods
2
Percentage increase in composting, donation of goods for others to use, repurpose, and recycle
3 Percnetage decrease in food and packaging waste and use of disposable products
4
Percentage increase in maintenance, conservation, and protection of natural resources (air, land, water)
5 Percentage increase in preparation for emergencies
6
Percentage increase in communities that establish or continue collection points/times for recycling/reuse of consumer and agriculture goods
7 Percentage increase in communities that inaugurate a county beautification campaign

Outcome #1
1. Outcome Measures
Percentage increase in selection and home preservation of home, locally and regionally produced foods
2. Associated Institution Types
● 1862 Extension
3a. Outcome Type:
Change in Action Outcome Measure
3b. Quantitative Outcome
Year
Actual
2013
0
3c. Qualitative Outcome or Impact Statement
Issue (Who cares and Why)
Oklahoma is the sixth unhealthiest state in the nation. This poor health ranking is reflected by our high density of fast food restaurants. Total annual health-related costs of food borne illness in Oklahoma are estimated at $1.7 million. The cost per case is estimated at $1,796.
What has been done
In order to advance the socio-economic development of the state, educational programs have been created and implemented to educate Oklahomans on how to be better stewards of their home and natural environment and resources.
Results
Across the state 231 Oklahomans learned safe food preservation and storage practices through programs such as Home Food Preservation. Participants included not just individuals but also child care providers, and youth working in public concession stands.
4. Associated Knowledge Areas
KA Code
Knowledge Area
805
Community Institutions, Health, and Social Services
Outcome #2
1. Outcome Measures
Percentage increase in composting, donation of goods for others to use, repurpose, and recycle
2. Associated Institution Types

● 1862 Extension
3a. Outcome Type:
Change in Action Outcome Measure
3b. Quantitative Outcome
Year
Actual
2013
0
3c. Qualitative Outcome or Impact Statement
Issue (Who cares and Why)
Oklahoma ranks 11th in the nation in total energy consumption per capita. The average American produces 4.4 pounds of garbage every day, but only recycles 1.5 pounds of that waste. Just over 50% of Oklahoma households have access to recycling programs.
What has been done
Abuse of the state?s natural resources can have far-reaching and long-lasting consequences for Oklahoma?s economy and the well being of its citizens. In order to advance the socio-economic development of the state, educational programs have been created and implemented to educate Oklahomans on how to be better stewards of the environment.
Results
In 2013 364 individuals attended educational programs which taught them how to decrease food and packaging waste, reuse disposable products and packaging, and turn items that would have been otherwise thrown away into useful items.
4. Associated Knowledge Areas
KA Code
Knowledge Area
102
Soil, Plant, Water, Nutrient Relationships
Outcome #3
1. Outcome Measures
Percnetage decrease in food and packaging waste and use of disposable products
2. Associated Institution Types
● 1862 Extension
3a. Outcome Type:
Change in Action Outcome Measure
3b. Quantitative Outcome
Year
Actual

2013
0
3c. Qualitative Outcome or Impact Statement
Issue (Who cares and Why)
Oklahoma is the sixth unhealthiest state in the nation. This poor health ranking is reflected by our high density of fast food restaurants. Total annual health-related costs of food borne illness in Oklahoma are estimated at $1.7 million. The cost per case is estimated at $1,796.
What has been done
In order to advance the socio-economic development of the state, educational programs have been created and implemented to educate Oklahomans on how to be better stewards of their home and natural environment and resources.
Results
Across the state 231 Oklahomans learned safe food preservation and storage practices through programs such as Home Food Preservation. Participants included not just individuals but also child care providers, and youth working in public concession stands.
4. Associated Knowledge Areas
KA Code
Knowledge Area
133
Pollution Prevention and Mitigation
Outcome #4
1. Outcome Measures
Percentage increase in maintenance, conservation, and protection of natural resources (air, land, water)
Not Reporting on this Outcome Measure
Outcome #5
1. Outcome Measures
Percentage increase in preparation for emergencies
2. Associated Institution Types
● 1862 Extension
3a. Outcome Type:
Change in Knowledge Outcome Measure

3b. Quantitative Outcome
Year
Actual
2013
0
3c. Qualitative Outcome or Impact Statement
Issue (Who cares and Why)
Oklahoma is vulnerable to many natural disasters each year such as tornadoes, ice storms, floods and wildfires. These disasters can cause significant financial loss by destroying homes and businesses. Many Oklahomans lack information about how to maintain their health, well being, and safety as it relates to their homes and the near environment.
What has been done
In order to advance the socio-economic development of the state, and have an impact on issues that address safety, educational programs have been created and implemented to educate Oklahomans on how to improve their quality of life
Results
A total of 319 individuals were reached through the emergency preparedness programs and 18 people created emergency kits.
4. Associated Knowledge Areas
KA Code
Knowledge Area
723
Hazards to Human Health and Safety
805
Community Institutions, Health, and Social Services
Outcome #6
1. Outcome Measures
Percentage increase in communities that establish or continue collection points/times for recycling/reuse of consumer and agriculture goods
Not Reporting on this Outcome Measure
Outcome #7
1. Outcome Measures
Percentage increase in communities that inaugurate a county beautification campaign
Not Reporting on this Outcome Measure

V(H). Planned Program (External Factors)
● Natural Disasters (drought, weather extremes, etc.)
● Economy
● Appropriations changes
● Public Policy changes
● Government Regulations
● Competing Programmatic Challenges
Brief Explanation
Statewide issue team format has changed educator focus and reduced activity in some planned programs.
V(I). Planned Program (Evaluation Studies)
Evaluation Results
In 2013 educators were still adapting to the new evaluation and reporting process, resulting in no formal
evaluation data for this program.
Key Items of Evaluation
In 2013, Issue Team-specific Evaluation Questionnaires were collected after planned program curriculum
delivery. These questions utilized a retrospective approach.

V(A). Planned Program (Summary)
Program # 18
1. Name of the Planned Program
Food Safety - Hunger, Health and Safety
Reporting on this Program
V(B). Program Knowledge Area(s)
1. Program Knowledge Areas and Percentage
KA Code
Knowledge Area %1862 Extension
%1890 Extension
%1862 Research
%1890 Research
134 Outdoor Recreation 28% 0%
703 Nutrition Education and Behavior 22% 0%
723 Hazards to Human Health and Safety 30% 0%
804
Human Environmental Issues Concerning Apparel, Textiles, and Residential and Commercial Structures
10% 0%
805 Community Institutions, Health, and Social Services
10% 0%
Total 100% 0%
V(C). Planned Program (Inputs)
1. Actual amount of FTE/SYs expended this Program
Year: 2013 Extension Research
1862 1890 1862 1890
Plan 20.0 0.0 0.0 0.0
Actual Paid Professional 2.0 0.0 0.0 0.0
Actual Volunteer 2.8 0.0 0.0 0.0
2. Actual dollars expended in this Program (includes Carryover Funds from previous years)
Extension Research
Smith-Lever 3b & 3c 1890 Extension Hatch Evans-Allen
45000 0 0 0
1862 Matching 1890 Matching 1862 Matching 1890 Matching
45000 0 0 0
1862 All Other 1890 All Other 1862 All Other 1890 All Other
205000 0 0 0
V(D). Planned Program (Activity)
1. Brief description of the Activity

•Development and introduction of new curricula •Outreach to families, schools, child care providers, direct assistance, demonstrations, and educational opportunities to food, healthy, eating, exercise, diet, etc. •Development of surveys, evaluation tools •Delivery through classes, One-on-One, News Releases/TV/Radio, Participation in Events, Displays •Provided training and other staff development opportunities to county educators
2. Brief description of the target audience
Families, youth, restruant employees, food handlers, children, communities, community leaders
3. How was eXtension used?
eXtension is provided as an educator resource.
V(E). Planned Program (Outputs)
1. Standard output measures
2. Number of Patent Applications Submitted (Standard Research Output)
Patent Applications Submitted
Year: 2013
Actual: 0
Patents listed
3. Publications (Standard General Output Measure)
Number of Peer Reviewed Publications
2013 Extension Research Total
Actual 2 0 2
V(F). State Defined Outputs
Output Target
Output #1
Output Measure
● Number of OSU Fact s published
Year Actual
2013 0

Output #2
Output Measure
● Number of other publications including but not limited to Bulletins, Technical Manuals, Reports as well as PowerPoint presentation and Spreadsheets, etc. distributed for use by others
Year Actual
2013 1
Output #3
Output Measure
● Number of in-service training sessions
Year Actual
2013 7
Output #4
Output Measure
● Number of certification Training sessions
Year Actual
2013 0
Output #5
Output Measure
● Number of other training sessions, workshops, etc. conducted
Year Actual
2013 8
Output #6
Output Measure
● Number of presentations at Extension organized meetings
Year Actual
2013 3
Output #7
Output Measure
● Number of presentations at other meetings and events (professional metings, invitations to speak to community groups, etc.)
Year Actual
2013 8

Output #8
Output Measure
● Number of workshops, conferences, etc. organized
Year Actual
2013 1
Output #9
Output Measure
● Number of posters or displays
Year Actual
2013 1
Output #10
Output Measure
● Number of other demonstrations, displays, exhibits, and models
Year Actual
2013 0
Output #11
Output Measure
● Number of newsletters
Year Actual
2013 0
Output #12
Output Measure
● Number of website hits
Year Actual
2013 3716
Output #13
Output Measure
● Number of radio and television presentations
Year Actual
2013 22

Output #14
Output Measure
● Number of newspaper, and magazine articles written
Year Actual
2013 20
Output #15
Output Measure
● Average number of phone calls and/or email requests responded to on a weekly basis
Year Actual
2013 1
Output #16
Output Measure
● Number of websites
Year Actual
2013 1

V(G). State Defined Outcomes
V. State Defined Outcomes Table of Content
O. No. OUTCOME NAME
1 Percentage increase in meals prepared at home
2 Percentage increase in food cooking skills
3 Percentage increase in safe food handling practices
4 Percentage increase in safe and effective food preservation practices
5
Percentage increase in the number of safety audits completed to identify potential hazards in the home/homestead
6 Percentage increase in practice of safety and injury/secondary injury prevention
7 Percentage increase in use of assistive technology as necessary
8 Percentage increase in use of available assistance by persons with injury/disability

Outcome #1
1. Outcome Measures
Percentage increase in meals prepared at home
2. Associated Institution Types
● 1862 Extension
3a. Outcome Type:
Change in Action Outcome Measure
3b. Quantitative Outcome
Year
Actual
2013
25
3c. Qualitative Outcome or Impact Statement
Issue (Who cares and Why)
Oklahoma ranks as the 5th most obese state in the nation. This ranking reflects the state's high density of fast food establishments, and low fruit and vegetable consumption (72% did not meet fruit recommendations and 86% did not meet vegetable recommendations). Total annual health-related costs of food borne illness in Oklahoma were estimated at $1.7 million by the Produce Safety Project at Georgetown University in 2010.
What has been done
In order to advance the socio-economic development of the state, and have an impact on issues that address maintaining or improving health through safe food choices, educational programs have been created and implemented to educate Oklahomans on how to attain a better quality of life.
Results
In 2013, programs were presented to 231 participants across. Oklahomans learned safe food handling and food preservation and storage practices through programs such as Food Safety Basics, Food Safety for Seniors, Home Food Preservation, and Produce Safety. Participants included not just individuals but also child care providers, and youth working in public concession stands.
4. Associated Knowledge Areas
KA Code
Knowledge Area
703
Nutrition Education and Behavior

Outcome #2
1. Outcome Measures
Percentage increase in food cooking skills
2. Associated Institution Types
● 1862 Extension
3a. Outcome Type:
Change in Action Outcome Measure
3b. Quantitative Outcome
Year
Actual
2013
75
3c. Qualitative Outcome or Impact Statement
Issue (Who cares and Why)
Oklahoma ranks as the 5th most obese state in the nation. This ranking reflects the state's high density of fast food establishments, and low fruit and vegetable consumption (72% did not meet fruit recommendations and 86% did not meet vegetable recommendations). Total annual health-related costs of food borne illness in Oklahoma were estimated at $1.7 million by the Produce Safety Project at Georgetown University in 2010.
What has been done
In order to advance the socio-economic development of the state, and have an impact on issues that address maintaining or improving health through safe food choices, educational programs have been created and implemented to educate Oklahomans on how to attain a better quality of life.
Results
In 2013, programs were presented to 231 participants across. Oklahomans learned safe food handling and food preservation and storage practices through programs such as Food Safety Basics, Food Safety for Seniors, Home Food Preservation, and Produce Safety. Participants included not just individuals but also child care providers, and youth working in public concession stands.
4. Associated Knowledge Areas
KA Code
Knowledge Area
703
Nutrition Education and Behavior

Outcome #3
1. Outcome Measures
Percentage increase in safe food handling practices
2. Associated Institution Types
● 1862 Extension
3a. Outcome Type:
Change in Action Outcome Measure
3b. Quantitative Outcome
Year
Actual
2013
22
3c. Qualitative Outcome or Impact Statement
Issue (Who cares and Why)
Oklahoma ranks as the 5th most obese state in the nation. This ranking reflects the state's high density of fast food establishments, and low fruit and vegetable consumption (72% did not meet fruit recommendations and 86% did not meet vegetable recommendations). Total annual health-related costs of food borne illness in Oklahoma were estimated at $1.7 million by the Produce Safety Project at Georgetown University in 2010.
What has been done
In order to advance the socio-economic development of the state, and have an impact on issues that address maintaining or improving health through safe food choices, educational programs have been created and implemented to educate Oklahomans on how to attain a better quality of life.
Results
In 2013, programs were presented to 231 participants across. Oklahomans learned safe food handling and food preservation and storage practices through programs such as Food Safety Basics, Food Safety for Seniors, Home Food Preservation, and Produce Safety. Participants included not just individuals but also child care providers, and youth working in public concession stands.
4. Associated Knowledge Areas
KA Code
Knowledge Area
703
Nutrition Education and Behavior
723
Hazards to Human Health and Safety

Outcome #4
1. Outcome Measures
Percentage increase in safe and effective food preservation practices
2. Associated Institution Types
● 1862 Extension
3a. Outcome Type:
Change in Action Outcome Measure
3b. Quantitative Outcome
Year
Actual
2013
22
3c. Qualitative Outcome or Impact Statement
Issue (Who cares and Why)
Oklahoma ranks as the 5th most obese state in the nation. This ranking reflects the state's high density of fast food establishments, and low fruit and vegetable consumption (72% did not meet fruit recommendations and 86% did not meet vegetable recommendations). Total annual health-related costs of food borne illness in Oklahoma were estimated at $1.7 million by the Produce Safety Project at Georgetown University in 2010.
What has been done
In order to advance the socio-economic development of the state, and have an impact on issues that address maintaining or improving health through safe food choices, educational programs have been created and implemented to educate Oklahomans on how to attain a better quality of life.
Results
In 2013, programs were presented to 231 participants across. Oklahomans learned safe food handling and food preservation and storage practices through programs such as Food Safety Basics, Food Safety for Seniors, Home Food Preservation, and Produce Safety. Participants included not just individuals but also child care providers, and youth working in public concession stands.
4. Associated Knowledge Areas
KA Code
Knowledge Area
703
Nutrition Education and Behavior
723
Hazards to Human Health and Safety
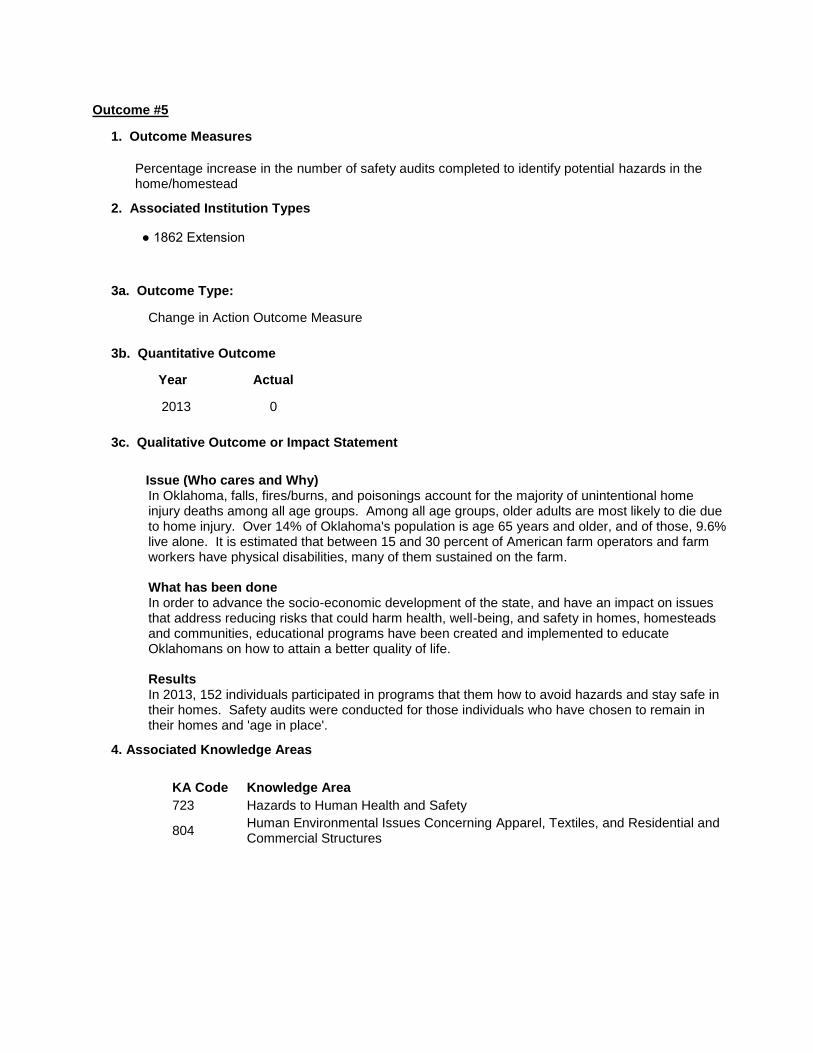
Outcome #5
1. Outcome Measures
Percentage increase in the number of safety audits completed to identify potential hazards in the home/homestead
2. Associated Institution Types
● 1862 Extension
3a. Outcome Type:
Change in Action Outcome Measure
3b. Quantitative Outcome
Year
Actual
2013
0
3c. Qualitative Outcome or Impact Statement
Issue (Who cares and Why)
In Oklahoma, falls, fires/burns, and poisonings account for the majority of unintentional home injury deaths among all age groups. Among all age groups, older adults are most likely to die due to home injury. Over 14% of Oklahoma's population is age 65 years and older, and of those, 9.6% live alone. It is estimated that between 15 and 30 percent of American farm operators and farm workers have physical disabilities, many of them sustained on the farm.
What has been done
In order to advance the socio-economic development of the state, and have an impact on issues that address reducing risks that could harm health, well-being, and safety in homes, homesteads and communities, educational programs have been created and implemented to educate Oklahomans on how to attain a better quality of life.
Results
In 2013, 152 individuals participated in programs that them how to avoid hazards and stay safe in their homes. Safety audits were conducted for those individuals who have chosen to remain in their homes and 'age in place'.
4. Associated Knowledge Areas
KA Code
Knowledge Area
723
Hazards to Human Health and Safety
804
Human Environmental Issues Concerning Apparel, Textiles, and Residential and Commercial Structures

Outcome #6
1. Outcome Measures
Percentage increase in practice of safety and injury/secondary injury prevention
2. Associated Institution Types
● 1862 Extension
3a. Outcome Type:
Change in Action Outcome Measure
3b. Quantitative Outcome
Year
Actual
2013
0
3c. Qualitative Outcome or Impact Statement
Issue (Who cares and Why)
In Oklahoma, falls, fires/burns, and poisonings account for the majority of unintentional home injury deaths among all age groups. Among all age groups, older adults are most likely to die due to home injury. Over 14% of Oklahoma's population is age 65 years and older, and of those, 9.6% live alone. It is estimated that between 15 and 30 percent of American farm operators and farm workers have physical disabilities, many of them sustained on the farm.
What has been done
In order to advance the socio-economic development of the state, and have an impact on issues that address reducing risks that could harm health, well-being, and safety in homes, homesteads and communities, educational programs have been created and implemented to educate Oklahomans on how to attain a better quality of life.
Results
In 2013, 152 individuals participated in programs that them how to avoid hazards and stay safe in their homes. Safety audits were conducted for those individuals who have chosen to remain in their homes and 'age in place'.
4. Associated Knowledge Areas
KA Code
Knowledge Area
723
Hazards to Human Health and Safety

Outcome #7
1. Outcome Measures
Percentage increase in use of assistive technology as necessary
2. Associated Institution Types
● 1862 Extension
3a. Outcome Type:
Change in Action Outcome Measure
3b. Quantitative Outcome
Year
Actual
2013
0
3c. Qualitative Outcome or Impact Statement
Issue (Who cares and Why)
What has been done
Results
4. Associated Knowledge Areas
KA Code
Knowledge Area
723
Hazards to Human Health and Safety
804
Human Environmental Issues Concerning Apparel, Textiles, and Residential and Commercial Structures
805
Community Institutions, Health, and Social Services
Outcome #8
1. Outcome Measures
Percentage increase in use of available assistance by persons with injury/disability
2. Associated Institution Types
● 1862 Extension
3a. Outcome Type:
Change in Action Outcome Measure

3b. Quantitative Outcome
Year
Actual
2013
0
3c. Qualitative Outcome or Impact Statement
Issue (Who cares and Why)
What has been done
Results
4. Associated Knowledge Areas
KA Code
Knowledge Area
723
Hazards to Human Health and Safety
804
Human Environmental Issues Concerning Apparel, Textiles, and Residential and Commercial Structures
805
Community Institutions, Health, and Social Services
V(H). Planned Program (External Factors)
● Economy
● Appropriations changes
● Public Policy changes
● Government Regulations
● Competing Programmatic Challenges
Brief Explanation
Statewide issue team format has changed educator focus and reduced activity in some planned programs.
V(I). Planned Program (Evaluation Studies)
Evaluation Results
Issue team evaluation items for the above outcomes include:
34 adult respondents to hunger issue team evaluations and 42 adult respondents to health issue team
evaluations reported the following planned behavior changes after participating in the program:
• 25% increase in those planning to cook meals at home
• 75% increase in those planning to use simple recipes to cook food
• 22% increase in those planning to use safe food handling practices
• 22% increase in using planning to use safe and effective food preservation practices

Key Items of Evaluation
In 2013, Issue Team-specific Evaluation Questionnaires were collected after planned program curriculum
delivery. These questions utilized a retrospective approach. In 2013 educators were still adapting to new
evaluation and reporting process, resulting in lower evaluation numbers.

V(A). Planned Program (Summary)
Program # 19
1. Name of the Planned Program
Global Food Security and Hunger - Families and Youth
Reporting on this Program
V(B). Program Knowledge Area(s)
1. Program Knowledge Areas and Percentage
KA Code
Knowledge Area %1862 Extension
%1890 Extension
%1862 Research
%1890 Research
604 Marketing and Distribution Practices 3% 0%
607 Consumer Economics 9% 0%
608 Community Resource Planning and Development
8% 0%
703 Nutrition Education and Behavior 30% 0%
704 Nutrition and Hunger in the Population 9% 0%
724 Healthy Lifestyle 9% 0%
801 Individual and Family Resource Management
12% 0%
802 Human Development and Family Well-Being
9% 0%
805 Community Institutions, Health, and Social Services
6% 0%
806 Youth Development 5% 0%
Total 100% 0%
V(C). Planned Program (Inputs)
1. Actual amount of FTE/SYs expended this Program
Year: 2013 Extension Research
1862 1890 1862 1890
Plan 35.0 0.0 0.0 0.0
Actual Paid Professional 22.0 0.0 0.0 0.0
Actual Volunteer 17.1 0.0 0.0 0.0
2. Actual dollars expended in this Program (includes Carryover Funds from previous years)

Extension Research
Smith-Lever 3b & 3c 1890 Extension Hatch Evans-Allen
540000 0 0 0
1862 Matching 1890 Matching 1862 Matching 1890 Matching
540000 0 0 0
1862 All Other 1890 All Other 1862 All Other 1890 All Other
1255000 0 0 0
V(D). Planned Program (Activity)
1. Brief description of the Activity
•Development and introduction of new curricula •Outreach to families, schools, child care providers, direct assistance, demonstrations, and educational opportunities to food, healthy, eating, exercise, diet, etc. •Development of surveys, evaluation tools •Delivery through classes, One-on-One, News Releases/TV/Radio, Participation in Events, Displays •Provided training and other staff development opportunities to county educators
2. Brief description of the target audience
Families, communities, youth, children, parents, community leaders, teachers, job seakers, businesses
3. How was eXtension used?
eXtension is provided as an educator resource
V(E). Planned Program (Outputs)
1. Standard output measures
2. Number of Patent Applications Submitted (Standard Research Output)
Patent Applications Submitted
Year: 2013
Actual: 0
Patents listed
3. Publications (Standard General Output Measure)

Number of Peer Reviewed Publications
2013 Extension Research Total
Actual 0 1 1
V(F). State Defined Outputs
Output Target
Output #1
Output Measure
● Number of OSU Fact s published
Year Actual
2013 3
Output #2
Output Measure
● Number of other publications including but not limited to Bulletins, Technical Manuals, Reports as well as PowerPoint presentation and Spreadsheets, etc. distributed for use by others
Year Actual
2013 8
Output #3
Output Measure
● Number of in-service training sessions
Year Actual
2013 10
Output #4
Output Measure
● Number of certification Training sessions
Year Actual
2013 2
Output #5
Output Measure
● Number of other training sessions, workshops, etc. conducted
Year Actual
2013 14

Output #6
Output Measure
● Number of presentations at Extension organized meetings
Year Actual
2013 23
Output #7
Output Measure
● Number of presentations at other meetings and events (professional metings, invitations to speak to community groups, etc.)
Year Actual
2013 8
Output #8
Output Measure
● Number of workshops, conferences, etc. organized
Year Actual
2013 3
Output #9
Output Measure
● Number of posters or displays
Year Actual
2013 3
Output #10
Output Measure
● Number of other demonstrations, displays, exhibits, and models
Year Actual
2013 0
Output #11
Output Measure
● Number of newsletters
Year Actual
2013 6

Output #12
Output Measure
● Number of website hits
Not reporting on this Output for this Annual Report
Output #13
Output Measure
● Number of radio and television presentations
Year Actual
2013 1
Output #14
Output Measure
● Number of newspaper, and magazine articles written
Year Actual
2013 18
Output #15
Output Measure
● Average number of phone calls and/or email requests responded to on a weekly basis
Year Actual
2013 13
Output #16
Output Measure
● Number of websites
Year Actual
2013 6

V(G). State Defined Outcomes
V. State Defined Outcomes Table of Content
O. No. OUTCOME NAME
1 Percentage increase in money saving meal planning or food shopping practices
2 Percentage increase in food money management practices
3 Percentage increase growing, producing, hunting, or fishing for some food
4
Percentage decrease in likelihood of using high-risk negative financial practices such as overusing credit, failing to save money or planning for the future
5
Percentage decrease in the risk of default on loans, credit card debt, unpaid bills, mortgage foreclosure, and identity theft
6
Percentage increase in financial planning practices across the life cycle and skills to manage financial risk
7 Percentage increase in readiness for employment opportunities
8 Percentage increase in readiness for life changes
9 Percentage increase in life skills for personal competence
10 Percentage increase in ability to manage personal and family finances
11
Percentage increase in utilization by parents, volunteers, and primary caregivers of best practices that enhance the well-being and life skill development of children and youth
12
Percentage increase in use of creativity and lifelong learning by youth and adults to become resilient in their personal and family life
13
Percentage increase in life skills such as critical thinking, problem solving, nurturing relationships, social skills, responsible citizenship, self-discipline, stress management, and self-esteem
14
Percentage increase in youth giving back to their community through entrepreneurial/service learning projects
15 Percentage increase in the environmental and agricultural literacy of Oklahomans
16 Percentage increase in youth knowledge of plant and animal science concepts
17 Percentage increase in ethical decisions of youth related to animal care and well being
18
Percentage increase in life skills such as setting goals, keeping records, and ethical decision making through project work
19
Percentage increase in partnership of agencies and organizations interested in reducing hunger

20
Percentage increase in action to develop and sustain assets that support employment and economic opportunities
21 Percentage increase in use of creativity and innovation to address social problems
22 Number of Families Positively Impacted by Community Nutrition Education Programs
Outcome #1
1. Outcome Measures
Percentage increase in money saving meal planning or food shopping practices
2. Associated Institution Types
● 1862 Extension
3a. Outcome Type:
Change in Condition Outcome Measure
3b. Quantitative Outcome
Year
Actual
2013
81
3c. Qualitative Outcome or Impact Statement
Issue (Who cares and Why)
According to a recent USDA report, for the 3 year period of 2010-2012 an average of 15.3% of Oklahoma's population was classified as food insecure. Food Banks in Oklahoma serve over 150,000 people each week, over half of whom are children, while serving an additional 72,000 Oklahomans each week through non-emergency food programs. Roughly 16% of Oklahoma's adult population receives benefits from the Supplemental Nutrition Assistance Program. Food insecurity and hunger are on the rise across Oklahoma, especially in families with children; 1 in 4 Oklahoma children are at risk of being hungry.
What has been done
In order to advance the socio-economic development of the state, and have an impact on issues that address food insecurity & hunger, educational programs have been created and implemented to educate Oklahomans on how to attain a better quality of life.
Results
In 2013, 377 Oklahomans participated in educational programs that focused on reducing hunger. Programs like Adults Need Dairy, Too were taught to TANF clients at a work preparation class. Loving Your Family, Feeding Their Future offered cooking principles and budget friendly recipes.
4. Associated Knowledge Areas
KA Code
Knowledge Area
607
Consumer Economics
704
Nutrition and Hunger in the Population
801
Individual and Family Resource Management
Outcome #2
1. Outcome Measures
Percentage increase in food money management practices
2. Associated Institution Types
● 1862 Extension
3a. Outcome Type:
Change in Action Outcome Measure
3b. Quantitative Outcome
Year
Actual
2013
16
3c. Qualitative Outcome or Impact Statement
Issue (Who cares and Why)
According to a recent USDA report, for the 3 year period of 2010-2012 an average of 15.3% of Oklahoma's population was classified as food insecure. Food Banks in Oklahoma serve over 150,000 people each week, over half of whom are children, while serving an additional 72,000 Oklahomans each week through non-emergency food programs. Roughly 16% of Oklahoma's adult population receives benefits from the Supplemental Nutrition Assistance Program. Food insecurity and hunger are on the rise across Oklahoma, especially in families with children; 1 in 4 Oklahoma children are at risk of being hungry.
What has been done
In order to advance the socio-economic development of the state, and have an impact on issues that address food insecurity & hunger, educational programs have been created and implemented to educate Oklahomans on how to attain a better quality of life.
Results
In 2013, 377 Oklahomans participated in educational programs that focused on reducing hunger. Programs like Adults Need Dairy, Too were taught to TANF clients at a work preparation class. Loving Your Family, Feeding Their Future offered cooking principles budget friendly recipes.
4. Associated Knowledge Areas
KA Code
Knowledge Area
607
Consumer Economics
703
Nutrition Education and Behavior
704
Nutrition and Hunger in the Population
801
Individual and Family Resource Management
Outcome #3
1. Outcome Measures
Percentage increase growing, producing, hunting, or fishing for some food
2. Associated Institution Types
● 1862 Extension
3a. Outcome Type:
Change in Action Outcome Measure
3b. Quantitative Outcome
Year
Actual
2013
71
3c. Qualitative Outcome or Impact Statement
Issue (Who cares and Why)
According to a recent USDA report, for the 3 year period of 2010-2012 an average of 15.3% of Oklahoma's population was classified as food insecure. Food Banks in Oklahoma serve over 150,000 people each week, over half of whom are children, while serving an additional 72,000 Oklahomans each week through non-emergency food programs. Roughly 16% of Oklahoma's adult population receives benefits from the Supplemental Nutrition Assistance Program. Food insecurity and hunger are on the rise across Oklahoma, especially in families with children; 1 in 4 Oklahoma children are at risk of being hungry.
What has been done
In order to advance the socio-economic development of the state, and have an impact on issues that address food insecurity & hunger, educational programs have been created and implemented to educate Oklahomans on how to attain a better quality of life.
Results
In 2013, 377 Oklahomans participated in educational programs that focused on reducing hunger. Programs like Adults Need Dairy, Too were taught to TANF clients at a work preparation class. Loving Your Family, Feeding Their Future offered cooking principles budget friendly recipes.
4. Associated Knowledge Areas
KA Code
Knowledge Area
607
Consumer Economics
703
Nutrition Education and Behavior
704
Nutrition and Hunger in the Population
801
Individual and Family Resource Management

Outcome #4
1. Outcome Measures
Percentage decrease in likelihood of using high-risk negative financial practices such as overusing credit, failing to save money or planning for the future
2. Associated Institution Types
● 1862 Extension
3a. Outcome Type:
Change in Action Outcome Measure
3b. Quantitative Outcome
Year
Actual
2013
60
3c. Qualitative Outcome or Impact Statement
Issue (Who cares and Why)
Oklahoma has some of the nation's highest populations of unbanked and underbanked households, families without savings accounts, and consumers with subprime credit. Nearly 44% of Oklahoma households are considered "asset poor", having little or no financial cushion to subsist at the poverty level for three months in the event of unemployment or other emergency. The state ranks 42nd in unbanked households and 44th in consumers with subprime credit. Sixteen percent of Oklahomans have an annual income below the federal poverty threshold. The state ranks 34thin average annual pay. Oklahoma ranks 46th in residents with low-wage jobs. Unemployed Oklahomans may have more than a bad economy working against them; irresponsible use of social media such as Facebook, YouTube, and Twitter can eliminate a job applicant from consideration for employment. A lack of business etiquette can cost not only job applicants but also employers, who can lose profits due to a decrease in business and eventual increase in employee turnover. Oklahoma ranks among the top 5 in all states for number of divorces. Oklahomans marry an average of 2.5 years younger than the national median age at first marriage, and those marrying under the age of 20 are the most likely to have gotten a divorce. Oklahoma families with children and headed by single mothers are 4.5 times more likely to be in poverty than families headed by married couples.
What has been done
In order to advance the socio-economic development of the state, and have an impact on issues that address financial management and planning skills, jobs and employment, and families, educational programs have been created and implemented to educate Oklahomans on how to attain a better quality of life.
Results
In 2013, 26 programs using various curricula were presented to 886 individuals across Oklahoma. Programs presented include: Making Sense of Money Management classes offered in partnership with the District Attorney's

Bogus Check Division. Participants demonstrate how to balance checking account statements and personal check records. Participants are offered this class as an alternative to having bogus check charges filed in district court. Dollar Decisions participants work alongside community banks to create spending plans and savings accounts, as well as work alongside bankers to introduce the use of technology to better track their income and expenses. Oklahoma Cooperative Extension conducted Co-parenting Through Divorce classes in 17 counties and helped 317 parents learn how to reduce the effects of divorce on their children. 66% decrease in adults who plan to use a payday loan company for small loans 78% decrease in adults who plan to have a check returned for insufficient funds 30% decrease in youth who spend money right away when they get it
4. Associated Knowledge Areas
KA Code
Knowledge Area
607
Consumer Economics
801
Individual and Family Resource Management
806
Youth Development
Outcome #5
1. Outcome Measures
Percentage decrease in the risk of default on loans, credit card debt, unpaid bills, mortgage foreclosure, and identity theft
2. Associated Institution Types
● 1862 Extension
3a. Outcome Type:
Change in Condition Outcome Measure
3b. Quantitative Outcome
Year
Actual
2013
60
3c. Qualitative Outcome or Impact Statement
Issue (Who cares and Why)
Oklahoma has some of the nation's highest populations of unbanked and underbanked households, families without savings accounts, and consumers with subprime credit. Nearly 44% of Oklahoma households are considered "asset poor", having little or no financial cushion to subsist at the poverty level for three months in the event of unemployment or other emergency. The state ranks 42nd in unbanked households and 44th in consumers with subprime credit. Sixteen percent of Oklahomans have an annual income below the federal poverty threshold. The state ranks 34thin average annual pay. Oklahoma ranks 46th in residents with low-wage jobs.

Unemployed Oklahomans may have more than a bad economy working against them; irresponsible use of social media such as Facebook, YouTube, and Twitter can eliminate a job applicant from consideration for employment. A lack of business etiquette can cost not only job applicants but also employers, who can lose profits due to a decrease in business and eventual increase in employee turnover. Oklahoma ranks among the top 5 in all states for number of divorces. Oklahomans marry an average of 2.5 years younger than the national median age at first marriage, and those marrying under the age of 20 are the most likely to have gotten a divorce. Oklahoma families with children and headed by single mothers are 4.5 times more likely to be in poverty than families headed by married couples.
What has been done
In order to advance the socio-economic development of the state, and have an impact on issues that address financial management and planning skills, jobs and employment, and families, educational programs have been created and implemented to educate Oklahomans on how to attain a better quality of life.
Results
In 2013, 26 programs using various curricula were presented to 886 individuals across Oklahoma. Programs presented include: ? Making Sense of Money Management classes offered in partnership with the District Attorney?s Bogus Check Division. Participants demonstrate how to balance checking account statements and personal check records. Participants are offered this class as an alternative to having bogus check charges filed in district court. ? Dollar Decisions participants work alongside community banks to create spending plans and savings accounts, as well as work alongside bankers to introduce the use of technology to better track their income and expenses. ? Oklahoma Cooperative Extension conducted Co-parenting Through Divorce classes in 17 counties and helped 317 parents learn how to reduce the effects of divorce on their children.
4. Associated Knowledge Areas
KA Code
Knowledge Area
607
Consumer Economics
801
Individual and Family Resource Management
806
Youth Development
Outcome #6
1. Outcome Measures
Percentage increase in financial planning practices across the life cycle and skills to manage financial risk
2. Associated Institution Types
● 1862 Extension
3a. Outcome Type:
Change in Action Outcome Measure
3b. Quantitative Outcome
Year
Actual
2013
25
3c. Qualitative Outcome or Impact Statement
Issue (Who cares and Why)
Oklahoma has some of the nation's highest populations of unbanked and underbanked households, families without savings accounts, and consumers with subprime credit. Nearly 44% of Oklahoma households are considered "asset poor", having little or no financial cushion to subsist at the poverty level for three months in the event of unemployment or other emergency. The state ranks 42nd in unbanked households and 44th in consumers with subprime credit. Sixteen percent of Oklahomans have an annual income below the federal poverty threshold. The state ranks 34thin average annual pay. Oklahoma ranks 46th in residents with low-wage jobs. Unemployed Oklahomans may have more than a bad economy working against them; irresponsible use of social media such as Facebook, YouTube, and Twitter can eliminate a job applicant from consideration for employment. A lack of business etiquette can cost not only job applicants but also employers, who can lose profits due to a decrease in business and eventual increase in employee turnover. Oklahoma ranks among the top 5 in all states for number of divorces. Oklahomans marry an average of 2.5 years younger than the national median age at first marriage, and those marrying under the age of 20 are the most likely to have gotten a divorce. Oklahoma families with children and headed by single mothers are 4.5 times more likely to be in poverty than families headed by married couples.
What has been done
In order to advance the socio-economic development of the state, and have an impact on issues that address financial management and planning skills, jobs and employment, and families, educational programs have been created and implemented to educate Oklahomans on how to attain a better quality of life.
Results
In 2013, 26 programs using various curricula were presented to 886 individuals across Oklahoma. Programs presented include: ? Making Sense of Money Management classes offered in partnership with the District Attorney?s Bogus Check Division. Participants demonstrate how to balance checking account statements and personal check records. Participants are offered this class as an alternative to having bogus check charges filed in district court. ? Dollar Decisions participants work alongside community banks to create spending plans and savings accounts, as well as work alongside bankers to introduce the use of technology to better track their income and expenses. ? Oklahoma Cooperative Extension conducted Co-parenting Through Divorce classes in 17 counties and helped 317 parents learn how to reduce the effects of divorce on their children. 18% increase in adults who plan to establish or update estate plans 33% increase in adults who plan to regularly write down financial goals
4. Associated Knowledge Areas
KA Code
Knowledge Area
607
Consumer Economics
801
Individual and Family Resource Management
806
Youth Development
Outcome #7
1. Outcome Measures
Percentage increase in readiness for employment opportunities
2. Associated Institution Types
● 1862 Extension
3a. Outcome Type:
Change in Knowledge Outcome Measure
3b. Quantitative Outcome
Year
Actual
2013
0
3c. Qualitative Outcome or Impact Statement
Issue (Who cares and Why)
Oklahoma has some of the nation's highest populations of unbanked and underbanked households, families without savings accounts, and consumers with subprime credit. Nearly 44% of Oklahoma households are considered "asset poor", having little or no financial cushion to subsist at the poverty level for three months in the event of unemployment or other emergency. The state ranks 42nd in unbanked households and 44th in consumers with subprime credit. Sixteen percent of Oklahomans have an annual income below the federal poverty threshold. The state ranks 34thin average annual pay. Oklahoma ranks 46th in residents with low-wage jobs. Unemployed Oklahomans may have more than a bad economy working against them; irresponsible use of social media such as Facebook, YouTube, and Twitter can eliminate a job applicant from consideration for employment. A lack of business etiquette can cost not only job applicants but also employers, who can lose profits due to a decrease in business and eventual increase in employee turnover. Oklahoma ranks among the top 5 in all states for number of divorces. Oklahomans marry an average of 2.5 years younger than the national median age at first marriage, and those marrying under the age of 20 are the most likely to have gotten a divorce. Oklahoma families with children and headed by single mothers are 4.5 times more likely to be in poverty than families headed by married couples.
What has been done
In order to advance the socio-economic development of the state, and have an impact on issues that address financial management and planning skills, jobs and employment, and families,
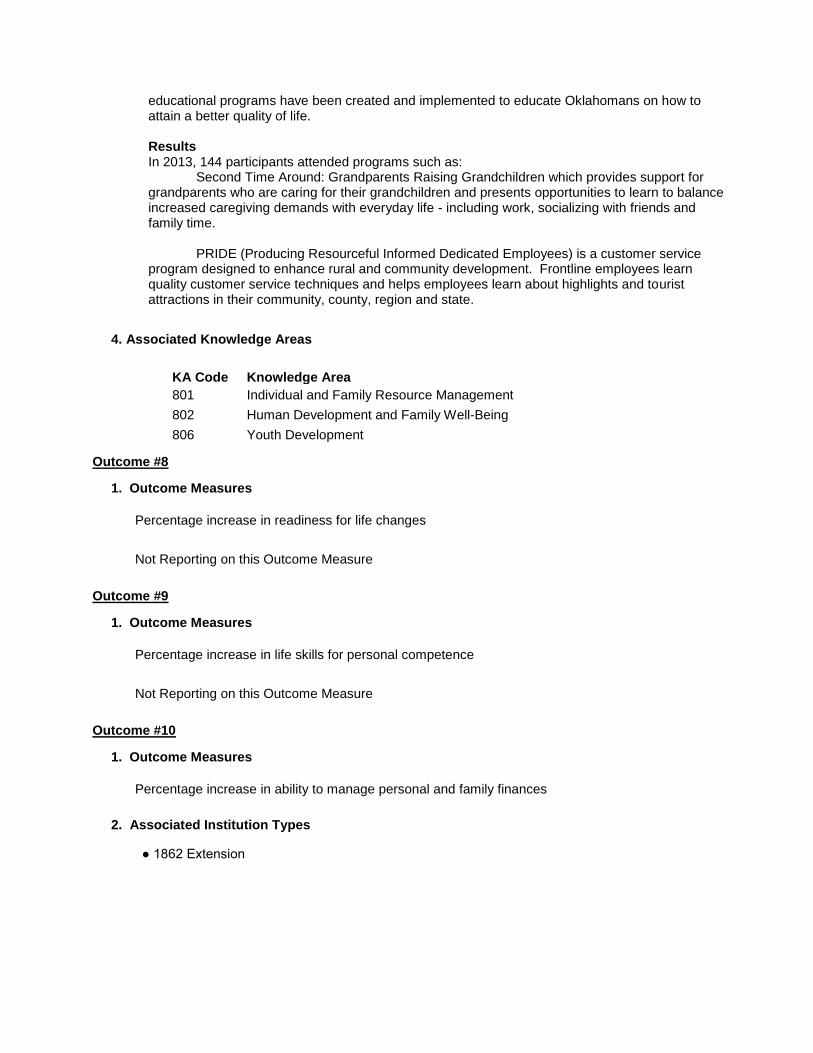
educational programs have been created and implemented to educate Oklahomans on how to attain a better quality of life.
Results
In 2013, 144 participants attended programs such as: Second Time Around: Grandparents Raising Grandchildren which provides support for grandparents who are caring for their grandchildren and presents opportunities to learn to balance increased caregiving demands with everyday life - including work, socializing with friends and family time. PRIDE (Producing Resourceful Informed Dedicated Employees) is a customer service program designed to enhance rural and community development. Frontline employees learn quality customer service techniques and helps employees learn about highlights and tourist attractions in their community, county, region and state.
4. Associated Knowledge Areas
KA Code
Knowledge Area
801
Individual and Family Resource Management
802
Human Development and Family Well-Being
806
Youth Development
Outcome #8
1. Outcome Measures
Percentage increase in readiness for life changes
Not Reporting on this Outcome Measure
Outcome #9
1. Outcome Measures
Percentage increase in life skills for personal competence
Not Reporting on this Outcome Measure
Outcome #10
1. Outcome Measures
Percentage increase in ability to manage personal and family finances
2. Associated Institution Types
● 1862 Extension

3a. Outcome Type:
Change in Knowledge Outcome Measure
3b. Quantitative Outcome
Year
Actual
2013
43
3c. Qualitative Outcome or Impact Statement
Issue (Who cares and Why)
Oklahoma has some of the nation's highest populations of unbanked and underbanked households, families without savings accounts, and consumers with subprime credit. Nearly 44% of Oklahoma households are considered "asset poor", having little or no financial cushion to subsist at the poverty level for three months in the event of unemployment or other emergency. The state ranks 42nd in unbanked households and 44th in consumers with subprime credit. Sixteen percent of Oklahomans have an annual income below the federal poverty threshold. The state ranks 34thin average annual pay. Oklahoma ranks 46th in residents with low-wage jobs. Unemployed Oklahomans may have more than a bad economy working against them; irresponsible use of social media such as Facebook, YouTube, and Twitter can eliminate a job applicant from consideration for employment. A lack of business etiquette can cost not only job applicants but also employers, who can lose profits due to a decrease in business and eventual increase in employee turnover. Oklahoma ranks among the top 5 in all states for number of divorces. Oklahomans marry an average of 2.5 years younger than the national median age at first marriage, and those marrying under the age of 20 are the most likely to have gotten a divorce. Oklahoma families with children and headed by single mothers are 4.5 times more likely to be in poverty than families headed by married couples.
What has been done
In order to advance the socio-economic development of the state, and have an impact on issues that address financial management and planning skills, jobs and employment, and families, educational programs have been created and implemented to educate Oklahomans on how to attain a better quality of life.
Results
In 2013, 26 programs using various curricula were presented to 886 individuals across Oklahoma. Programs presented include: Making Sense of Money Management classes offered in partnership with the District Attorney?s Bogus Check Division. Participants demonstrate how to balance checking account statements and personal check records. Participants are offered this class as an alternative to having bogus check charges filed in district court. Dollar Decisions participants work alongside community banks to create spending plans and savings accounts, as well as work alongside bankers to introduce the use of technology to better track their income and expenses. Oklahoma Cooperative Extension conducted Co-parenting Through Divorce classes in 17 counties and helped 317 parents learn how to reduce the effects of divorce on their children. 43% increase in adults who plan to regularly make a written spending plan 13% increase in adults who plan to regularly track income and spending 48% increase in youth who know importance of putting money in the bank

4. Associated Knowledge Areas
KA Code
Knowledge Area
607
Consumer Economics
801
Individual and Family Resource Management
806
Youth Development
Outcome #11
1. Outcome Measures
Percentage increase in utilization by parents, volunteers, and primary caregivers of best practices that enhance the well-being and life skill development of children and youth
Not Reporting on this Outcome Measure
Outcome #12
1. Outcome Measures
Percentage increase in use of creativity and lifelong learning by youth and adults to become resilient in their personal and family life
Not Reporting on this Outcome Measure
Outcome #13
1. Outcome Measures
Percentage increase in life skills such as critical thinking, problem solving, nurturing relationships, social skills, responsible citizenship, self-discipline, stress management, and self-esteem
Not Reporting on this Outcome Measure
Outcome #14
1. Outcome Measures
Percentage increase in youth giving back to their community through entrepreneurial/service learning projects
Not Reporting on this Outcome Measure
Outcome #15
1. Outcome Measures
Percentage increase in the environmental and agricultural literacy of Oklahomans
Not Reporting on this Outcome Measure
Outcome #16
1. Outcome Measures
Percentage increase in youth knowledge of plant and animal science concepts
Not Reporting on this Outcome Measure
Outcome #17
1. Outcome Measures
Percentage increase in ethical decisions of youth related to animal care and well being
Not Reporting on this Outcome Measure
Outcome #18
1. Outcome Measures
Percentage increase in life skills such as setting goals, keeping records, and ethical decision making through project work
Not Reporting on this Outcome Measure
Outcome #19
1. Outcome Measures
Percentage increase in partnership of agencies and organizations interested in reducing hunger
Not Reporting on this Outcome Measure
Outcome #20
1. Outcome Measures
Percentage increase in action to develop and sustain assets that support employment and economic opportunities
Not Reporting on this Outcome Measure
Outcome #21
1. Outcome Measures
Percentage increase in use of creativity and innovation to address social problems
Not Reporting on this Outcome Measure

Outcome #22
1. Outcome Measures
Number of Families Positively Impacted by Community Nutrition Education Programs
2. Associated Institution Types
● 1862 Extension
3a. Outcome Type:
Change in Action Outcome Measure
3b. Quantitative Outcome
Year
Actual
2013
3351
3c. Qualitative Outcome or Impact Statement
Issue (Who cares and Why)
? Oklahoma loses an estimated $1.4 billion each year from hunger through illness, increased illness and decreased academic achievement alone. ? Among seniors receiving food through Oklahoma?s Food Bank System, 45% report having to choose between buying food or paying for medicine or medical care. ? In 2012, 24.1% of children under the age of 18 lived in poverty. ? More than 55% of low-income families don?t regularly plan meals before going to the store, and 34 % don?t regularly use a written grocery list. ? During SFY2012, Supplemental Nutrition Assistance Program participation increased nearly 4% more than the previous year and increased by 37% the amount distributed five years ago.
What has been done
Through the Community Nutrition Education Programs (CNEP), OCES has leveraged state monies to provide more than $2.7 million (FY13) in federal nutrition education program funds. This funding supports 75 jobs in 29 Oklahoma counties. CNEP is a voluntary program for adults participating in federal food assistance programs as well as impoverished youth in qualifying schools and communities. Program participants learn to feed their families in order to promote good health and to plan and budget their food dollars so their family will not go hungry at the end of the month. Working through OCES county offices, teaching paraprofessionals, known as Nutrition Education Assistants (NEAs), coach participants during weekly lessons to build skills that enable them to stretch their family food dollars, plan and prepare more nutritious meals and increase physical activity. The research-based lessons involve hands-on learning experiences and can take place in participants? homes or in small group settings. CNEP educates Oklahoma youth on healthy food choices, safe food practices and physical activity with the purpose of reducing obesity and the associated risk of related chronic diseases. ? CNEP staff provided a total of 5,305 hours of nutrition information on healthy eating practices, food preparation and food safety to 22,714 qualifying Oklahoma youth during the 2013 fiscal year. ? The majority of enrolled youth (18,407) were taught through school enrichment programs; while

4,307 children received their nutrition education through short- term community-based programs.
Results
In FY13, CNEP had a positive impact on the health and wellness of 3,351 low-income Oklahoma families. More than 98% of adult graduates demonstrate a positive change towards a healthy diet. In addition, 43% of graduates less often ran out of food by the end of the month and 25% report that their children ate breakfast more often. In FY13, CNEP and OCES leveraged state monies to bring $2.7 million in federal nutrition education program funds to the state. Based on a 2009 study, estimated potential health care savings associated with nutrition education programs similar to the CNEP were approximately $20 million due to increased prevention of nutrition-related chronic diseases and conditions.
4. Associated Knowledge Areas
KA Code
Knowledge Area
703
Nutrition Education and Behavior
704
Nutrition and Hunger in the Population
724
Healthy Lifestyle
V(H). Planned Program (External Factors)
● Economy
● Appropriations changes
● Public Policy changes
● Government Regulations
● Competing Public priorities
Brief Explanation
Statewide issue team format has changed educator focus and reduced activity in some planned programs.
V(I). Planned Program (Evaluation Studies)
Evaluation Results
Issue team evaluation items for the above outcomes include:
34 adult respondents to hunger issue team evaluations reported the following planned behavior changes
after participating in the program:
• 81% increase in those who plan to use money saving meal planning or food shopping practices
• 16% increase in those who plan to not run out of money for food
• 71% increase in those who plan to grow, produce, hunt or fish for some of their own food
21 adult respondents to finance issue team evaluations reported the following planned behavior changes
after participating in the program:

• 71% decrease in those who plan to regularly stress about money matters
• 13% increase in those to plan to regularly track income and spending
• 43% increase in those who plan to regularly make a written spending plan
• 66% decrease in those who plan to use a payday loan company for small loans
• 78% decrease in those who plan to have a check returned for insufficient funds
• 57% decrease in those who do not plan on paying off their credit card balance each month
• 66% decrease in those who do not plan to take steps to prevent identity theft
· 83% decrease in those adults who do not plan to order a copy of their credit report on a regular basis
• 18% increase in those who plan to establish or update estate plans
• 33% increase in those who plan to regularly write down financial goals
39 youth respondents to finance issue team evaluations reported the following planned changes after
participating in the program:
• 76% increase in caution in how money is spent
• 30% decrease in those who plan to spend money right away when they get it
• 48% increase in knowing importance of putting money in the bank
• 55% increase in understanding it costs money to make money
• 38% increase in knowledge that the best time to start saving money is now
• 22% increase in those who would rather have $15 a week from now than $10 now
Key Items of Evaluation
In 2013, Issue Team-specific Evaluation Questionnaires were collected after planned program curriculum
delivery. These questions utilized a retrospective approach. In 2013 educators were still adapting to new
evaluation and reporting process, resulting in lower evaluation numbers.