2013 ISO New England Electric Generator Air Emissions Report
55
2013 ISO New England Electric Generator Air Emissions Report i ISO New England Inc. 2013 ISO New England Electric Generator Air Emissions Report ISO New England Inc. System Planning December 2014
Transcript of 2013 ISO New England Electric Generator Air Emissions Report

2013 ISO New England Electric Generator Air Emissions Report i ISO New England Inc.
2013 ISO New England
Electric Generator Air Emissions Report
ISO New England Inc.
System Planning
December 2014

2013 ISO New England Electric Generator Air Emissions Report ii ISO New England Inc.
{ This page left intentionally blank }

2013 ISO New England Electric Generator Air Emissions Report iii ISO New England Inc.
Contents
Figures ........................................................................................................................................................ iv
Tables ........................................................................................................................................................... v
Section 1 Executive Summary ............................................................................................................. 1
Section 2 Background ............................................................................................................................ 5
2.1 History of Marginal Emissions Methodologies ..................................................................................... 5
Section 3 Methodologies ....................................................................................................................... 7
3.1 Calculating Total System Emission Rate .................................................................................................. 7 3.2 Calculating Marginal Emission Rate .......................................................................................................... 7
3.2.1 Fuel Type Assumed (FTA) Marginal Units ................................................................................. 7 3.2.2 Locational Marginal Units (LMU) ................................................................................................... 8 3.2.3 Definition of Time Periods ................................................................................................................ 8
Section 4 Data and Assumptions ..................................................................................................... 10
4.1 2013 New England Weather ...................................................................................................................... 10 4.2 Emission Data Sources ................................................................................................................................. 10 4.3 ISO New England System Installed Capacity ...................................................................................... 11 4.4 ISO New England System Energy Production .................................................................................... 13 4.5 Locational Marginal Units (LMUs) .......................................................................................................... 14
4.5.1 All LMUs ................................................................................................................................................. 15 4.5.2 Emitting LMUs .................................................................................................................................... 17 4.5.3 Oil- & Natural Gas-Fired LMUs ..................................................................................................... 18
Section 5 Results ................................................................................................................................... 19
5.1 2013 New England System Emissions .................................................................................................. 19 5.1.1 Observations ........................................................................................................................................ 22
5.2 2013 New England Marginal Heat Rate ................................................................................................ 22 5.2.1 Fuel Type Assumed (FTA) Marginal Heat Rate ..................................................................... 23 5.2.2 Locational Marginal Unit (LMU) Marginal Heat Rate ......................................................... 24 5.2.3 Observations ........................................................................................................................................ 25
5.3 2013 New England Marginal Emission Rates ..................................................................................... 25 5.3.1 Fuel Type Assumed (FTA) Marginal Emission Rates .......................................................... 25 5.3.2 Locational Marginal Unit (LMU) Marginal Emission Rates .............................................. 29 5.3.3 High Electric Demand Day (HEDD) Marginal Emission Rate .......................................... 35 5.3.4 Observations ........................................................................................................................................ 36
Section 6 Appendix .............................................................................................................................. 37

2013 ISO New England Electric Generator Air Emissions Report iv ISO New England Inc.
Figures
Figure 1-1: 2004 vs. 2013 Energy Generation by Fuel Type ................................................................................. 2 Figure 1-2: Comparison of 2013 New England Emission Rates (lb/MWh) ..................................................... 4 Figure 4-1: 2013 New England Summer Capacity by State ................................................................................. 11 Figure 4-2 : 2004 – 2013 ISO New England Generator Additions ..................................................................... 12 Figure 4-3: 2013 Monthly Generation by Fuel Type ............................................................................................... 13 Figure 4-4 : 2009 - 2013 Annual Generation by Fuel Type .................................................................................. 14 Figure 4-5: 2013 Percent of Time Fuel Types Marginal – All LMUs ................................................................. 15 Figure 4-6: 2009 - 2013 Percent of Time Fuel Types Marginal – All LMUs ................................................... 16 Figure 4-7: 2013 Percent of Time Fuel Types Marginal – Emitting LMUs ..................................................... 17 Figure 4-8: 2009 - 2013 Percent of Time Fuel Types Marginal – Emitting LMUs....................................... 17 Figure 4-9: 2013 Percent of Time Fuel Types Marginal – O&NG LMUs .......................................................... 18 Figure 4-10: 2009 - 2013 Percent of Time Fuel Types Marginal – O&NG LMUs ......................................... 18 Figure 5-1: 2013 New England System Annual Emission of NOX, SO2, and CO2 (kTons) ........................ 19 Figure 5-2: 2004 - 2013 New England System Annual Emissions of NOX, SO2, and CO2 (kTons)......... 20 Figure 5-3: 2013 New England System Monthly Average NOX, SO2, and CO2 Emission Rates
(lb/MWh) ........................................................................................................................................................................ 21 Figure 5-4: 2004-2013 New England System Annual Average NOX, SO2, and CO2 Emission Rates
(lb/MWh) ........................................................................................................................................................................ 21 Figure 5-5: 2004 - 2013 New England System Annual FTA Marginal Heat Rate (MMBtu/MWh) ....... 23 Figure 5-6: 2013 LMU Monthly Marginal Heat Rate (MMBtu/MWh) .............................................................. 24 Figure 5-7: 2009-2013 LMU Annual Marginal Heat Rate (MMBtu/MWh) .................................................... 24 Figure 5-8: 2004 - 2013 New England NOX FTA Marginal Emission Rates (lb/MWh) ............................. 27 Figure 5-9: 2004 - 2013 New England SO2 FTA Marginal Emission Rates (lb/MWh) .............................. 28 Figure 5-10: 2004 - 2013 New England CO2 FTA Marginal Emission Rates (lb/MWh) ........................... 28 Figure 5-11: 2013 Monthly LMU Marginal Emission Rates – All LMUs (lb/MWh) .................................... 30 Figure 5-12: 2013 Monthly LMU Marginal Emission Rates – Emitting LMUs (lb/MWh) ........................ 31 Figure 5-13: 2013 Monthly LMU Marginal Emission Rates – O&NG LMUs (lb/MWh) ............................. 32 Figure 5-14: 2009 - 2013 LMU Marginal Emission Rates – All LMUs (lb/MWh) ........................................ 33 Figure 5-15: 2009 - 2013 LMU Marginal Emission Rates – Emitting LMUs (lb/MWh) ............................ 34 Figure 5-16: 2009 - 2013 LMU Marginal Emission Rates – O&NG LMUs (lb/MWh) ................................. 34

2013 ISO New England Electric Generator Air Emissions Report v ISO New England Inc.
Tables
Table 1-1: 2012 & 2013 New England System Emissions (kTons) and Emission Rates (lb/MWh) .... 2 Table 1-2: 2012 & 2013 FTA Marginal Emission Rates (lb/MWh) ..................................................................... 3 Table 1-3: 2012 & 2013 LMU Marginal Emission Rates (lb/MWh) .................................................................... 3 Table 1-4: Differences between LMU O&NG and FTA Marginal Emissions Rates (lb/MWh) .................. 3 Table 5-1: 2013 New England System Annual Average NOX, SO2, and CO2 Emission Rates (lb/MWh)
............................................................................................................................................................................................. 20 Table 5-2: 2013 New England FTA Marginal Emission Rates (lb/MWh), ...................................................... 25 Table 5-3: 2013 New England NOX FTA Marginal Emission Rates by State (lb/MWh), ........................... 26 Table 5-4: 2013 New England SO2 FTA Marginal Emission Rates by State (lb/MWh) ............................. 26 Table 5-5: 2013 New England CO2 FTA Marginal Emission Rates by State (lb/MWh) ............................ 27 Table 5-6: 2013 LMU Marginal Emission Rates – All LMUs (lb/MWh) ........................................................... 29 Table 5-7: 2013 LMU Marginal Emission Rates – Emitting LMUs (lb/MWh) ............................................... 31 Table 5-8: 2013 LMU Marginal Emission Rates – O&NG LMUs (lb/MWh) .................................................... 32 Table 5-9: High Electric Demand Day LMU Marginal Emission Rates (lb/MWh) ....................................... 35 Appendix Table 1: 1994 - 2013 New England Total Cooling and Heating Degree Days .......................... 37 Appendix Table 2: 2013 New England Summer Capacity, ................................................................................... 37 Appendix Table 3: 2013 New England Winter Capacity12, 13 ............................................................................... 38 Appendix Table 4: 2001 - 2013 ISO New England System Annual Emissions of NOX, SO2, and CO2
(kTons) ............................................................................................................................................................................. 38 Appendix Table 5: 1999 - 2013 New England System Annual Average NOX, SO2, and CO2 Emission
Rates (lb/MWh) ............................................................................................................................................................ 39 Appendix Table 6: 2009 - 2013 LMU Marginal Heat Rate (MMBtu/MWh) ................................................... 40 Appendix Table 7: 2013 New England FTA Marginal Emission Rates (lb/MMBtu) .................................. 40 Appendix Table 8: 1993 - 2013 New England NOX FTA Marginal Emission Rates (lb/MWh) .............. 41 Appendix Table 9: 1993 - 2013 New England SO2 FTA Marginal Emission Rates (lb/MWh) ............... 42 Appendix Table 10: 1993 - 2013 New England CO2 FTA Marginal Emission Rates (lb/MWh) ............ 43 Appendix Table 11: 2013 LMU Marginal Emission Rates – All LMUs (lb/MMBtu) ................................... 43 Appendix Table 12: 2013 Monthly LMU Marginal Emission Rates – All LMUs (lb/MWh) ..................... 44 Appendix Table 13: 2013 LMU Marginal Emission Rates – Emitting LMUs (lb/MMBtu) ....................... 44 Appendix Table 14: 2013 Monthly LMU Marginal Emission Rates – Emitting LMUs (lb/MWh) ......... 44 Appendix Table 15: 2013 LMU Marginal Emission Rates – O&NG LMUs (lb/MMBtu) ............................ 45 Appendix Table 16: 2013 Monthly LMU Marginal Emission Rates – O&NG LMUs (lb/MWh) .............. 45 Appendix Table 17: 2009 - 2013 NOX LMU Marginal Emission Rates – All LMUs (lb/MWh) ................ 45 Appendix Table 18: 2009 - 2013 NOX LMU Marginal Emission Rates – Emitting LMUs (lb/MWh) ... 46 Appendix Table 19: 2009 - 2013 NOX LMU Marginal Emission Rates – O&NG LMUs (lb/MWh) ........ 46 Appendix Table 20: 2009 - 2013 SO2 LMU Marginal Emission Rates – All LMUs (lb/MWh) ................ 46 Appendix Table 21: 2009 - 2013 SO2 LMU Marginal Emission Rates – Emitting LMUs (lb/MWh) .... 47 Appendix Table 22: 2009 - 2013 SO2 LMU Marginal Emission Rates – O&NG LMUs (lb/MWh) ......... 47 Appendix Table 23: 2009 - 2013 CO2 LMU Marginal Emission Rates – All LMUs (lb/MWh) ............... 47 Appendix Table 24: 2009 - 2013 CO2 LMU Marginal Emission Rates – Emitting LMUs (lb/MWh) ... 48 Appendix Table 25: 2009 - 2013 CO2 LMU Marginal Emission Rates – O&NG LMUs (lb/MWh) ........ 48

2013 ISO New England Electric Generator Air Emissions Report vi ISO New England Inc.
{ This page left intentionally blank }

2013 ISO New England Electric Generator Air Emissions Report 1 ISO New England Inc.
Section 1 Executive Summary
This ISO New England (ISO-NE) report provides a comprehensive analysis of New England electric generator air emissions (NOX, SO2, and CO2) and review of relating system conditions. The following is a highlight of analysis results available in this report.
System and marginal emissions (kTons)1
System and marginal emission rates (lb/MWh & lb/MMBtu)
System and marginal heat rate (MMBtu/MWh)
The information is also provided in different time periods of interest.
On-Peak vs. Off-Peak hours
Ozone Season vs. Non-Ozone Season
Monthly variations [New]
High Electric Demand Days (HEDDs) [New]
The ISO New England Electric Generator Air Emissions Report (Emissions Report), first developed in 1993, has evolved through the years in response to stakeholder needs. It was initially motivated by the need to determine the emission reductions that demand-side management (DSM) programs have had upon New England’s aggregate NOX, SO2, and CO2 generating unit air emissions. The use of these emission rates was subsequently broadened to include the benefits of energy efficiency programs and renewable resource projects within the region.
There has been an overall decrease in NOX (60%), SO2 (88%), and CO2 (28%) emissions from 2004 through 2013. A shift in the fuel mix powering the region has direct contribution to the changing total system emissions. Figure 1-1 shows an increase of natural gas generation and a decrease of coal- and oil-fired generation.
Compared to the 20-year average for cooling and heating days (indicator of weather), 2013 had a 25% warmer summer and an average winter. From 2012 to 2013, net energy for load was 1% higher, but system generation was lower by 4%. New England received more imported energy from neighboring areas in 2013. The energy generation by non-emitting generators increased from 39% to 42%. However, the energy generation by air-emitting generators had a decrease in natural gas (lower emission rates) to more coal- and oil-fired generators (higher emission rates).
1The mass value of “tons” is equivalent to a US short ton or 2,000 lb and “kTons” is equivalent to 2,000,000 lb.

2013 ISO New England Electric Generator Air Emissions Report 2 ISO New England Inc.
Figure 1-1: 2004 vs. 2013 Energy Generation by Fuel Type
Table 1-1 shows the total New England system emissions (kTons) and average system emission rates (lb/MWh) of NOX, SO2 and CO2. There was an increase in emission rates observed from 2012 to 2013.
Table 1-1: 2012 & 2013 New England System Emissions (kTons) and Emission Rates (lb/MWh)
Table 1-2 and Table 1-3 show the 2012 and 2013 annual average marginal emission rates as calculated by the two marginal emissions analysis methodologies. The Fuel Type Assumed (FTA) Marginal Emission Analysis method has been used to calculate marginal emission rates since 2004. The FTA marginal units are assumed to be those that are fueled with oil (including residual, distillate, diesel, kerosene, and jet fuel), and/or natural gas.2FTA marginal emission rates are calculated using the energy-weighted, average emission rates of all oil- and natural gas-fired generating units, which are assumed to increase their output in response to higher regional energy demand.
The Locational Marginal Unit (LMU) Marginal Emission Analysis uses the emissions rates from the ISO-NE identified marginal unit(s) that set the Energy Market hourly Locational Marginal Price(s) (LMP). The LMP results from a process that minimizes total energy costs for the entire New England region, subject to a set of constraints reflecting physical limitations of the power system.
2 All fuel types refer to the generating unit’s primary fuel type, as reported within the 2013 CELT Report.
0%
10%
20%
30%
40%
50%
60%
70%
80%
90%
100%
2004 2013
Oil
Coal
Natural Gas
Nuclear
Pumped Storage
Hydro
Wind
Other Renewables
9%
15%
37%
28%
5%5%
0.9%
6%
45%
33%
6%
6%
1%1%
0% 2%
2012 Emissions
(kTons)
2013 Emissions
(kTons)
Total Emissions
% Change
2012 Emission
Rate (lb/MWh)
2013 Emission
Rate (lb/MWh)
Emission Rate
% Change
NOX 20.32 20.32 0.0 0.35 0.36 2.9
SO2 16.61 18.04 8.6 0.28 0.32 14.3
CO2 41,975 40,901 -2.6 719 730 1.5
Annual System Emissions

2013 ISO New England Electric Generator Air Emissions Report 3 ISO New England Inc.
Three sets of emission rate results are presented in this report utilizing this methodology. They are: 1) All LMUs; 2) Emitting LMUs; and 3) Oil- and Natural Gas-Fired (O&NG) LMUs.
Table 1-2: 2012 & 2013 FTA Marginal Emission Rates (lb/MWh)
Table 1-3: 2012 & 2013 LMU Marginal Emission Rates (lb/MWh)
Table 1-4 compares the two marginal emission analysis methods that have the same fuel type based assumption, which only accounts for oil- and natural gas-fired generators as marginal units. The difference for CO2 marginal emission rates has been within 3.5% in the last four years. Although SO2 and NOX marginal emission rates have a larger percentage of difference, the magnitudes of the marginal emission rates are similar.
Table 1-4: Differences between LMU O&NG and FTA Marginal Emissions Rates (lb/MWh)
2012 Annual
Rate (lb/MWh)
2013 Annual
Rate (lb/MWh)
Percent Change
2012 to 2013 (%)
NOX 0.14 0.16 14.3
SO2 0.03 0.11 266.7
CO2 899 914 1.7
Fuel Type Assumed Marginal Emissions
2012 Annual
Rate (lb/MWh)
2013 Annual
Rate (lb/MWh)
Percent Change
2012 to 2013 (%)
2012 Annual
Rate (lb/MWh)
2013 Annual
Rate (lb/MWh)
Percent Change
2012 to 2013 (%)
NOX 0.22 0.34 56.7 0.26 0.42 62.8
SO2 0.35 0.55 55.8 0.42 0.69 64.3
CO2 854 930 8.9 1,010 1,125 11.4
LMU Marginal Emissions
All LMUs Emitting LMUs
LMU
Annual
Rate
(lb/MWh)
FTA
Annual
Rate
(lb/MWh)
Difference
Between
Methods
(%)
LMU
Annual
Rate
(lb/MWh)
FTA
Annual
Rate
(lb/MWh)
Difference
Between
Methods
(%)
LMU
Annual
Rate
(lb/MWh)
FTA
Annual
Rate
(lb/MWh)
Difference
Between
Methods
(%)
2009 0.18 0.17 -7.1 0.15 0.22 46.7 928 930 0.2
2010 0.26 0.18 -30.8 0.13 0.09 -30.8 965 943 -2.3
2011 0.19 0.14 -27.8 0.09 0.05 -46.2 877 907 3.4
2012 0.16 0.14 -11.9 0.04 0.03 -28.6 915 899 -1.7
2013 0.20 0.16 -20.0 0.21 0.11 -47.6 928 914 -1.5
CO2
LMU O&NG vs. FTA Marginal Emissions
NOX SO2

2013 ISO New England Electric Generator Air Emissions Report 4 ISO New England Inc.
The 2013 Emissions Report presents a variety of emission rates and is summarized in Figure 1-2. The HEDD LMU Marginal Emission Rates characterize the emissions profile of the top five HEDDs and the marginal units responding to system demand during these days.
Figure 1-2: Comparison of 2013 New England Emission Rates (lb/MWh)
The 2013 calculated FTA marginal heat rate was determined to be 7.598 MMBtu/MWh, increasing approximately 8% from the 2012 marginal heat rate of 7.407 MMBtu/MWh. The 2013 calculated All LMU marginal heat rate was 6.841 MMBtu/MWh compared to 6.678 MMBtu/MWh or 2% higher than in 2012. When considering emitting units only, the LMU marginal heat rate increased 5%, from 7.870 MMBtu/MWh to 8.271 MMBtu/MWh.
NOX SO2 CO2

2013 ISO New England Electric Generator Air Emissions Report 5 ISO New England Inc.
Section 2 Background
In early 1994, the NEPOOL Environmental Planning Committee (EPC) conducted a study to analyze the impact that demand-side management (DSM) programs had on NEPOOL’s generating unit NOX air emissions in the calendar year 1992. The results were presented in a report entitled 1992 Marginal NOX Emission Rate Analysis. This report was subsequently used to support applications for obtaining NOX Emission Reduction Credits (ERC) resulting from the impacts of those DSM programs. Such applications were filed under the Massachusetts ERC banking and trading program, which became effective on January 1, 1994. The ERC program allows inventoried sources of NOX, VOC, and CO in Massachusetts to earn bankable and tradable emission credits by reducing actual power plant emissions below regulatory requirements.
Later in 1994, the 1993 Marginal Emission Rate Analysis (MEA Report) was published, which provided expanded analysis of the impact of DSM programs on power plant NOX, SO2, and CO2 air emissions for the calendar year 1993. MEA Reports were published annually from 1994 to 2007, to provide similar annual environmental analyses for those years. For the 2008 emissions analysis, members of ISO New England’s Environmental Advisory Group (EAG) requested that the MEA Report be restructured and renamed to reflect the importance of emissions from the entire New England electric generation system.3 The name of the MEA Report was changed to the ISO New England Electric Generator Air Emissions Report (Emissions Report), and the new report includes calculated system and marginal emissions for the entire ISO New England generation system, rather than focusing primarily on marginal emissions. The calculated marginal emissions can be used to estimate the impact DSM programs and non-emitting renewable energy projects have had on reducing New England’s NOX, SO2, and CO2 power plant air emissions.
Currently, the Emissions Report includes system emissions analysis and two methodologies to calculate marginal emissions analysis. The Fuel Type Assumed (FTA) methodology, started in 2004, assumes that all natural gas- and oil-fired units are the marginal fossil units. The Locational Marginal Unit (LMU) methodology, begun as a pilot program in 2011, uses marginal units identified by the Locational Marginal Price. Each methodology provides a different perspective of marginal emissions. The 2013 Emissions Report focuses on analysis and observations over the past decade (2004 – 2013). The Appendix includes data of years prior to 2004 and values of the figures presented.
The Emissions Report has been used by a variety of stakeholders to track air emissions from New England’s electric generation system, and to estimate the avoided emissions resulting from DSM programs and renewable energy projects.
2.1 History of Marginal Emissions Methodologies
In MEA studies performed prior to 2004, production simulation models were used to replicate, as closely as possible, the actual system operations for the study year (reference case). Then an incremental load scenario was modeled in which the system load was increased by 500 MW in each hour (marginal case). The marginal air emission rates were calculated based on the differences in
3 The EAG is a stakeholder working group that assists the Planning Advisory Committee (PAC), the Reliability Committee (RC) and the associated Power Supply Planning Committee (PSPC). The EAG’s web site is located at: http://www.iso-ne.com/eag
2013 ISO New England Electric Generator Air Emissions Report 6 ISO New England Inc.
generator air emissions between these two scenarios. However, this methodology had some drawbacks. The reference case simulation could not exactly match the actual unit-specific energy production levels of the study year due to a number of limitations in the production simulation model, including the inability to accurately represent historical overall dynamics of the energy dispatch, out-of-merit and reliability-based dispatches, unit specific outages and deratings, and effects of the daily volatility of regional (power plant) fuel prices.
Beginning in 2004, the Fuel Type Assumed (FTA) methodology was used to calculate the average marginal emission rates. This method was based on all natural gas and oil-fired generators; assumed to respond to changing system load by increasing or decreasing their loading. Units fueled with other sources, such as coal, wood, biomass, refuse, or landfill gas were excluded from the calculation; they historically (2000s) operated as base-load or were non-dispatchable units and would typically not be dispatched to balance supply with demand on the system.4 Other non-emitting resources, such as hydro-electric, pumped storage, wind, solar, and nuclear units that do not vary in output to follow load, are also assumed not to be marginal units; they were excluded from the calculation of FTA marginal emission rates.
In 2011, ISO-NE began developing a methodology for calculating the marginal emission rate based on the Locational Marginal Unit (LMU), which stemmed from recommendations of the Environmental Advisory Group. This methodology identifies marginal units using the Locational Marginal Price (LMP), a process that minimizes total cost of energy production for New England while accounting for transmission and other constraints. By using this method, the Locational Marginal Unit (LMU), or the last unit dispatched to balance the system, can be identified. Results are presented starting in 2009, as this is the earliest year of available data.
4 In determining whether to consider coal units as marginal units, it was observed that higher or lower loads change the number of committed natural gas and/or oil units, while coal units would be dispatched when available. During the low-load troughs of the daily cycle, coal units were seen to be load following. It is reasonable to expect that the coal units would continue to be available for load following during such low-load periods of the night and would likely continue to be marginal for establishing Locational Marginal Prices during those off-peak hours.

2013 ISO New England Electric Generator Air Emissions Report 7 ISO New England Inc.
Section 3 Methodologies
The New England power system emissions and marginal emission rate calculations for NOx, SO2 and CO2 were based primarily on the tons of air emissions reported in the U.S. EPA Clean Air Markets Division (CAMD) database.5 When unit specific emissions data were not available from the CAMD database, emission rates from the New England Power Pool Generation Information System (NEPOOL GIS) or the U.S. eGRID database, or, alternatively, emission rates that were assumed based on a similar generator type were used. These unit-specific emission rates were used in conjunction with the actual megawatt-hours (MWh) of generation, from the ISO-NE database used for energy market settlement purposes, to calculate tons of emissions.6
All electric generators dispatched by ISO New England are included in these emissions calculations. Emissions from “behind the meter” generators or those generators not within the ISO New England balancing authority area are not part of this analysis.
3.1 Calculating Total System Emission Rate
The total annual system emission rate (lb/MWh) is based on the emissions produced by all ISO New England generators during a calendar year. The formula for calculating the total annual system emission rate is:
3.2 Calculating Marginal Emission Rate
3.2.1 Fuel Type Assumed (FTA) Marginal Units
In calculating the FTA marginal emission rates, the hourly emissions (lb) for those units in the U.S. EPA CAMD were grouped into on-peak and off-peak periods. When only monthly NEPOOL GIS or annual eGRID data were available, those emission rates (lb/MWh) were multiplied by the associated monthly on-peak and off-peak generation. The amount of emissions (lb) from each individual marginal fossil generator was added together to obtain the annual total FTA marginal emissions. This quantity was then divided by the total on-peak or off-peak generation to get the corresponding FTA marginal emission rates (lb/MWh) for that time period. In the case of NOX emission rates, the monthly totals (lb) were grouped into ozone and non-ozone season emissions and divided by the respective ozone and non-ozone season generation.
The average NOX, SO2, and CO2 emission rates of the assumed marginal fossil units in each time period analyzed are referred to as the FTA marginal emission rates. These emission rates are calculated as:
5 EPA Clean Air Markets Program Data can be found at http://ampd.epa.gov/ampd/. 6 U.S. EPA’s eGRID Ninth Edition Version 1.0 at: http://www.epa.gov/cleanenergy/energy-resources/egrid/ .

2013 ISO New England Electric Generator Air Emissions Report 8 ISO New England Inc.
3.2.2 Locational Marginal Units (LMU)
LMUs are identified through the Locational Marginal Price (LMP) process, which minimizes total energy costs for the entire New England region, subject to a set of constraints reflecting physical limitation of the power system.
For each five minute-period, at least one marginal unit (LMU) is identified by the LMP. In some time periods, there may be physical limitations on the power system, such as a transmission constraint. For each binding constraint, this will add an additional marginal unit. This results in n + 1 marginal unit (LMUs) for every n binding constraints, in each five minute period.
The percent of time each generator is marginal in each month is calculated and linked to the generator’s month-specific on-/off-peak average emissions rate. The month and generator-specific average emission rates are obtained from the process of calculating system emission rates. The LMU Marginal Emission Rates are calculated as described below, where generator k is identified to be marginal during hour h, and has a specific monthly emission rate during month m. This calculation is used for on-peak and off-peak hours.
The annual LMU marginal emission rate is then calculated by combining the on-peak and off-peak in a weighted calculation.
3.2.3 Definition of Time Periods
The 2013 marginal air emission rates for on and off-peak periods for New England have been calculated for this report. The on-peak period, which excludes nights and weekends, is provided to enable typical industrial and commercial users that can provide load response during a traditional weekday to explicitly account for their emissions reductions during those hours. The marginal emission rates for NOX are calculated for five time periods:7
On-Peak Ozone Season consisting of all weekdays between 8 A.M. and 10 P.M. from May 1 to September 30
Off-Peak Ozone Season consisting of all weekdays between 10 P.M. and 8 A.M. and all weekend hours from May 1 to September 30
7 There was a special report, developed by ISO-NE, titled Analysis of New England Electric Generator’s NOX Emissions on 25 Peak-load Days in 2005-2009 released in 2011 that summarized ISO-NE’s effort in conducting an analysis of NOX emissions during peak days. This report is located at: http://www.iso-ne.com/genrtion_resrcs/reports/emission/peak_nox_analysis.pdf

2013 ISO New England Electric Generator Air Emissions Report 9 ISO New England Inc.
On-Peak Non-Ozone Season consisting of all weekdays between 8 A.M. and 10 P.M. from January 1 to April 30 and from October 1 to December 31
Off-Peak Non-Ozone Season consisting of all weekdays between 10 P.M. and 8 A.M. and all weekend hours from January 1 to April 30 and from October 1 to December 31
Annual average
Since the ozone and non-ozone seasons are only relevant to NOX emissions, the SO2 and CO2 emission rates were only calculated for the following time periods:
On-Peak Annual consisting of all weekdays between 8 A.M. and 10 P.M.
Off-Peak Annual consisting of all weekdays between 10 P.M. and 8 A.M. and all weekend hours
Annual average

2013 ISO New England Electric Generator Air Emissions Report 10 ISO New England Inc.
Section 4 Data and Assumptions
The key parameters and assumptions modeled in the 2013 ISO New England Emissions Report are highlighted in this section. They include weather, emissions data sources, installed capacity and system generation.
4.1 2013 New England Weather
Since the demand for energy and peak loads are significantly affected by the weather, it is useful to provide perspective for the changes in emission rates by comparing 2013 total energy use and both cooling and heating degree days to previous years.
The 2013 summer peak electricity demand of 27,379 MW was 1,499 MW higher than the 2012 summer peak of 25,880 MW. There were 401 cooling degree days, which is 25% higher than the 20-year average.8 The net energy for load was 1% higher in 2013 than 2012. With respect to the winter months, there were 6,156 heating degree days, which is an 18% increase compared to 2012, while staying near the 20-year average at 1.4% difference.
New England’s historical cooling degree days and heating degree days for 1994 through 2013 are shown in Appendix Table 1. The difference between the cooling and heating degree days for a particular year and the average is also provided.
4.2 Emission Data Sources
Individual generating unit emissions were calculated primarily from the 2013 actual emissions (tons) as reported under the U.S. EPA’s Acid Rain Program, NOX Clean Air Interstate Rule and the Regional Greenhouse Gas Initiative (Clean Air Markets data).9 10 Prior to 2005, the MEA reports used annual data obtained primarily from the U.S. EPA Emissions Scorecard. In the 2005 and 2006 MEA Reports, monthly U.S. EPA data rather than hourly data were used for calculating marginal rates.
For those units that were not required to file emissions data under the Acid Rain Program, Clean Air Interstate Rule or the Regional Greenhouse Gas Initiative, monthly emission rates (lb/MWh) from the NEPOOL Generation Information System (GIS) were used instead. If the data could not be obtained from either of those sources, annual emission rates (lb/MWh) from the U.S. EPA’s eGRID Ninth edition Version 1.0 (Year 2010 data) were used.11 If that information was not available,
8 Over the 20-year span of 1994 to 2013, the average number of cooling degree days is 322 and the average number of heating degree days is 6,070. 9 The U.S. EPA’s Clean Air Markets emissions data can be accessed from http://www.epa.gov/airmarkets/. 10 Generators report emissions to the U.S. EPA under the Acid Rain Program, which covers generators 25 MW or larger, and the NOX Budget Trading Program, which includes generators 15 MW or greater in the affected states of Connecticut and Massachusetts. (Starting in 2009, the Clean Air Interstate Rule (CAIR) took the place of the NOX Budget Trading Program.) Generators subject to the Regional Greenhouse Gas Initiative also report CO2 emissions to the U.S. EPA. 11 The U.S. EPA’s eGRID Ninth edition Version 1.0 (Year 2010 data) is located at: http://www.epa.gov/cleanenergy/energy-resources/egrid/index.html.

2013 ISO New England Electric Generator Air Emissions Report 11 ISO New England Inc.
emission rates based on eGRID data were obtained for similar type units. The emission rates were then multiplied by the 2013 energy generation reported to ISO-NE to obtain the emissions (tons) by each generator.
The U.S. EPA Clean Air Markets data were the primary source of emissions data used for this report. For calculating total system emissions, approximately 89% of the SO2 emissions and 75% of the CO2 emissions were based on Clean Air Markets data. For NOX, Clean Air Markets data were used for 47% of total emissions. For the total FTA marginal emissions, approximately 96% of the SO2, 98% of the CO2 and 92% of the NOX emissions were based on Clean Air Markets data.
4.3 ISO New England System Installed Capacity
The ISO-NE power grid operates as a unified system serving all loads in the region. The amount of generation by fuel type and its associated emissions are affected by a number of factors, including forced and scheduled maintenance outages of resources and transmission system elements, fuel and emission allowance costs, imports from and exports to neighboring regions, system peak load and energy consumption, water availability to hydro facilities and for thermal system cooling, and a variety of other factors.
Figure 4-1 shows the total ISO New England generation 2013 summer capacity as obtained from ISO New England’s 2014 – 2023 Forecast Report of Capacity, Energy, Loads and Transmission (CELT).12 Appendix Table 2 and Appendix Table 3 show a summary of the total ISO New England generation summer and winter capacity by state and fuel type.
Figure 4-1: 2013 New England Summer Capacity by State
12 The ISO-NE CELT Report is typically issued in April of each year. The 2014 CELT Report (using the January 1, 2014 ratings) was used in order to completely capture all the new capacity additions that occurred during the prior calendar year 2013. It can be accessed from http://www.iso-ne.com/system-planning/system-plans-studies/celt.
0
2,000
4,000
6,000
8,000
10,000
12,000
14,000
CT ME MA NH RI VT
Cap
caci
ty (M
W)
Wind
Solar
Hydro
Nuclear
Other Renewables
Oil
Natural Gas
Coal

2013 ISO New England Electric Generator Air Emissions Report 12 ISO New England Inc.
Figure 4-2 illustrates the new generating capacity that was added to the ISO New England system during 2004 through 2013. A total of 2,998 MW was added, with combustion turbines and combined cycle plants capable of burning natural gas or distillate oil making up nearly 50% of this new capacity. The remaining additions consist of nuclear uprates and renewable generation.
Figure 4-2 : 2004 – 2013 ISO New England Generator Additions13
13 The generator additions and uprate values are based on the Seasonal Claimed Capabilities as reported in the ISO-NE CELT Report of the year following the addition.
0
100
200
300
400
500
600
700
800
900
1,000
2004 2005 2006 2007 2008 2009 2010 2011 2012 2013
MW
Wind and Solar
Water
Other Renewables
Coal Uprates
Oil
Nuclear Uprates
Natural Gas

2013 ISO New England Electric Generator Air Emissions Report 13 ISO New England Inc.
4.4 ISO New England System Energy Production
Emissions characteristics of an electric generator are directly contributed by the type of fuel that powers it. Direct correlation can be drawn between the different fuel burned and the magnitude of a unit’s emissions. Section 4.4 compares the generation changes across months and years to explore one of the main factors that contribute to changing system emission rates and heat rates.
Figure 4-3 shows the 2013 monthly generation by fuel type. The overlaid black line represents the total generation. Natural gas-fired generation accounts for 34% - 55% of the total generation. The lower monthly percentage of natural gas-fired generation is observed when the amount of system generation and energy demand is higher, such as January, February, July and December. Correspondingly, these are also the months where coal- and oil-fired generation have a larger contribution. In the past few years, natural gas has been observed to have overall lower prices coupled with highly efficient generating units leading to the growing contribution of energy generation. However, during higher energy demand months and when tied with natural gas availability limitations, other fuel types have increased their contribution to support the New England system. During winter months, natural gas supplies are targeted for use by firm customers of the regional gas LDCs. 14 Hydro-electric and wind generation have seasonal differences which reflect their fuel availability, as there is less rain (water) and on-shore wind during summer months.
Figure 4-3: 2013 Monthly Generation by Fuel Type
14 Firm customers of regional gas local distribution companies (LDCs) include residential, commercial and industrial (RCI) customers.
0
2,000
4,000
6,000
8,000
10,000
12,000
14,000
0%
10%
20%
30%
40%
50%
60%
70%
80%
90%
100%
1 2 3 4 5 6 7 8 9 10 11 12
Tota
l Ge
ne
rati
on
(GW
h)
Ge
ne
rati
on
(MW
h)
Month
Other Renewables Wind Solar Hydro Nuclear Natural Gas Coal Oil Total Generation (Right Axis)

2013 ISO New England Electric Generator Air Emissions Report 14 ISO New England Inc.
Figure 4-4 shows the generation (MWh) by fuel types from 2009-2013, based on the resource’s primary fuel type listed in the 2014 CELT Report. In 2013, coal- and oil-fired generation was about 2,558 GWh and 244 GWh higher, respectively, than in 2012. In contrast, natural gas-fired generation decreased by about 10,061 GWh, or about 17%. Overall system generation was about 4,902 GWh lower in 2013 than 2012; 2013 total energy generation was 112,040 GWh.
Figure 4-4 : 2009 - 2013 Annual Generation by Fuel Type
4.5 Locational Marginal Units (LMUs)
The Locational Marginal Unit (LMU) is identified by the LMP, which is set by the cost of the generation dispatched to meet the next increment of load at the pricing location. The resource that sets price is called the marginal unit. Because the price of electricity changes as the determination and price of the marginal unit changes, the price of the marginal unit largely is determined by its fuel type and heat rate. Thus, examining marginal units by fuel type can explain changes in electricity prices. The system has at least one marginal unit associated with meeting the energy requirements on the system during each pricing interval. If transmission is not constrained, the marginal unit is classified as the unconstrained marginal unit. In intervals with binding transmission constraints, there is one additional marginal unit for each constraint.
The analysis of LMU marginal emission rates was conducted in three different scenarios. Each scenario provides a different perspective by including or excluding certain generators depending on their characteristics. The three scenarios are described as followed:
All LMUs – includes all Locational Marginal Units identified by the LMP Emitting LMUs - excludes all non-emitting units, such as pumped storage, hydro-electric
generation, external transactions and other renewables with no associated air emissions Oil- and Natural Gas-fired (O&NG) LMUs – includes only oil- and natural gas-fired units
identified by LMP
0
10,000
20,000
30,000
40,000
50,000
60,000
70,000
Ge
ne
rati
on
(G
Wh
)
2009 2010 2011 2012 2013

2013 ISO New England Electric Generator Air Emissions Report 15 ISO New England Inc.
4.5.1 All LMUs
In this scenario, all identified locational marginal units (LMUs) are used to develop the marginal emission rates. Non-emitting generators such as hydro-electric generation and external transactions are associated with a zero emission rate. Each fuel type’s time on the margin and month-to-month variations is shown in Figure 4-5. Natural gas is marginal 47% to 81% of the time. August, September and October was higher in the 80% range, while January, February and December were at the lower range of 47% - 59%. During January, February and December, coal- and oil-fired generation was on the margin more than other months at 10% - 21% (coal) and 6% (oil).
Figure 4-5: 2013 Percent of Time Fuel Types Marginal – All LMUs
0%
10%
20%
30%
40%
50%
60%
70%
80%
90%
100%
1 2 3 4 5 6 7 8 9 10 11 12
% o
f Ti
me
Mar
gin
al
Month
Oil
Coal
Natural Gas
External TransactionsPumped Storage -PumpPumped Storage -GenHydro
Other Renewables

2013 ISO New England Electric Generator Air Emissions Report 16 ISO New England Inc.
Figure 4-6 shows the historical percentages that each fuel type is marginal within a calendar year. It can be observed that natural gas has been the primary fuel type marginal in the last five years. But from 2012 to 2013, natural gas had a decrease, while coal and other renewables increased.
Figure 4-6: 2009 - 2013 Percent of Time Fuel Types Marginal – All LMUs
63
3
14
1
9 9
1
70
3
14
16 5
1
72
2
10
1
95
1
78
14
18 6
1
68
28
59 6
20%
10%
20%
30%
40%
50%
60%
70%
80%
90%
Natural Gas Oil Coal Other Renewables
Pumped Storage-Gen
Pumped Storage-Pump
Other Hydro External Transaction
% o
f Ti
me
Mar
gin
al
2009
2010
2011
2012
2013
2009: 0.12%2010: 0.04%2011: 0.06%2012: 0.04%2013: 0.10%

2013 ISO New England Electric Generator Air Emissions Report 17 ISO New England Inc.
4.5.2 Emitting LMUs
Generating resources with no air emissions are excluded in this scenario. Therefore, hydro, pumped storage, external transaction and other renewables with no air emissions are not taken into account, while all other LMUs are.
Figure 4-7: 2013 Percent of Time Fuel Types Marginal – Emitting LMUs
Figure 4-8: 2009 - 2013 Percent of Time Fuel Types Marginal – Emitting LMUs
0%
10%
20%
30%
40%
50%
60%
70%
80%
90%
100%
1 2 3 4 5 6 7 8 9 10 11 12
% o
f Ti
me
Mar
gin
al
Month
Oil
Coal
Natural Gas
Other Renewables
77
4
17
2
79
3
16
2
84
2
12
1
92
25
2
81
310
6
0%
10%
20%
30%
40%
50%
60%
70%
80%
90%
100%
Natural Gas Oil Coal Other Renewables
% o
f Ti
me
Mar
gin
al
2009
2010
2011
2012
2013

2013 ISO New England Electric Generator Air Emissions Report 18 ISO New England Inc.
4.5.3 Oil- & Natural Gas-Fired LMUs
This scenario only includes natural gas and oil-fired generators from all LMUs identified by the LMP, and was created to provide a benchmark comparison with the previous method of Fuel Type Assumed (FTA) Marginal Emission Analysis.
Figure 4-9: 2013 Percent of Time Fuel Types Marginal – O&NG LMUs
Figure 4-10: 2009 - 2013 Percent of Time Fuel Types Marginal – O&NG LMUs
82%
84%
86%
88%
90%
92%
94%
96%
98%
100%
1 2 3 4 5 6 7 8 9 10 11 12
% o
f Ti
me
Mar
gin
al
Month
Oil
Natural Gas
95%
5%
96%
4%
98%
2%
98%
2%
96%
4%
0%
20%
40%
60%
80%
100%
120%
Natural Gas Oil
% M
arg
inal
2009
2010
2011
2012
2013
2013 ISO New England Electric Generator Air Emissions Report 19 ISO New England Inc.
Section 5 Results
5.1 2013 New England System Emissions
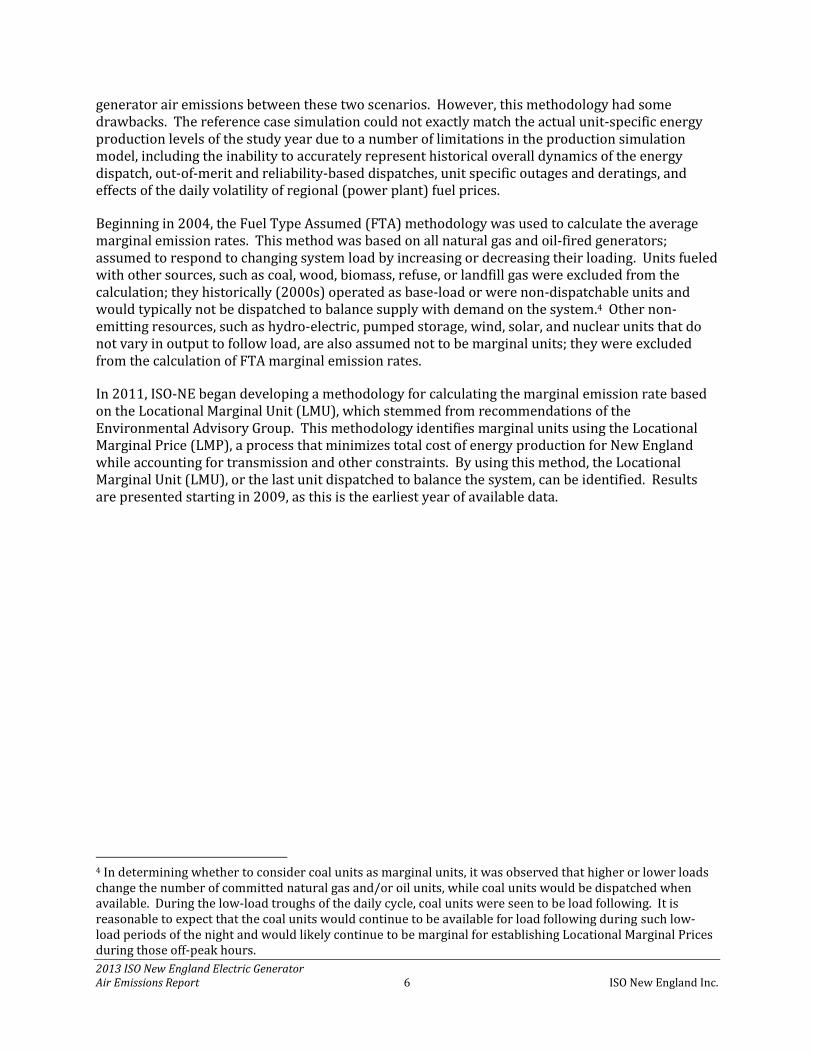
Section 5.1 provides analysis results that represent all ISO New England generators. Figure 5-1 shows the annual aggregate 2013 NOX, SO2, and CO2 air emissions for each state. The New England system total emissions for NOX, SO2, and CO2 were 20.32 kTons, 18.04 kTons and 40,901 kTons, respectively. These emissions were calculated based on the actual generation of all generating units in ISO-NE’s balancing authority area and the actual or assumed unit-specific emission rates.15 While it can be observed that some states have more total emissions than others, it is relevant to consider that these figures are based on the physical location of the generating units as shown in Figure 4-1. ISO New England operates the New England power system as one unified grid. Therefore, a unit physically located in one state is dispatched to serve the entire system, not only its own state.
Figure 5-1: 2013 New England System Annual Emission of NOX, SO2, and CO2 (kTons) 16
Figure 5-2 shows the annual aggregate NOX, SO2, and CO2 air emissions for the years 2004 through 2013. Since 2004, NOX emissions have dropped by 60% and SO2 by 88%, while CO2 has decreased by about 28%. Refer to Appendix Table 4 for historical system emissions by kTons.
15 This does not include Northern Maine and the Citizens Block Load (Northern Vermont), which is typically served by New Brunswick and Quebec. These areas are not electrically connected to the ISO-NE Control Area. 16 Sum may not equal New England system total due to rounding.
4.29
2.1
9.31
3.63
0.55 0.430
2
4
6
8
10
CT ME MA NH RI VT
NOX
1.49 1.37
11.79
3.33
0.02 0.040
5
10
15
CT ME MA NH RI VT
SO2SO2
9,613
4,653
17,026
5,9102,866
8320
5,000
10,000
15,000
20,000
CT ME MA NH RI VT
CO2CO2
NOX
An
nu
al E
mis
sio
ns
of N
OX, S
O2,
CO
2(k
Ton
s)

2013 ISO New England Electric Generator Air Emissions Report 20 ISO New England Inc.
Figure 5-2: 2004 - 2013 New England System Annual Emissions of NOX, SO2, and CO2 (kTons)
Table 5-1 shows the 2013 annual average NOX, SO2, and CO2 air emission rates (lb/MWh), by state and for New England, calculated based on the actual hourly unit generation of ISO-NE generating units located within that specific state and the actual or assumed unit-specific emission rates.
Table 5-1: 2013 New England System Annual Average NOX, SO2, and CO2 Emission Rates (lb/MWh)
Monthly variations shown in Figure 5-3 reflect the different system fuel mixes from Figure 4-3. Emission rates are at a higher magnitude during January, February, July and December, which had lower natural gas generation and higher coal- and oil-fired generation. Values can be found in Appendix Table 5.
0
10,000
20,000
30,000
40,000
50,000
60,000
70,000
0
20
40
60
80
100
120
140
160
2004 2005 2006 2007 2008 2009 2010 2011 2012 2013
CO
2Sy
ste
m E
mis
sio
n (k
Ton
s)
NO
xan
d S
O2
Syst
em
Em
issi
on
(kTo
ns)
NOx SO2 CO2
State NOx SO2 CO2
Connecticut 0.25 0.09 552
Maine 0.41 0.27 917
Massachusetts 0.54 0.69 996
New Hampshire 0.37 0.34 602
Rhode Island 0.18 0.01 918
Vermont 0.12 0.01 239
New England 0.36 0.32 730

2013 ISO New England Electric Generator Air Emissions Report 21 ISO New England Inc.
Figure 5-3: 2013 New England System Monthly Average NOX, SO2, and CO2 Emission Rates (lb/MWh)
Figure 5-4 illustrates the annual average NOX, SO2, and CO2 air emission rate values (lb/MWh), for the 2004 – 2013 time period. These annual emission rates were calculated by dividing the total air emissions by the total generation from all units. Since 2004, the annual average NOX emission rate has decreased by 54%, SO2 by 86%, and CO2 by 17%. All historical emission rates can be seen in Appendix Table 6.
Figure 5-4: 2004-2013 New England System Annual Average NOX, SO2, and CO2 Emission Rates (lb/MWh)
0
100
200
300
400
500
600
700
800
900
0
0.1
0.2
0.3
0.4
0.5
0.6
0.7
0.8
0.9
1
1 2 3 4 5 6 7 8 9 10 11 12
CO
2 E
mis
sio
n R
ate
(lb
/MW
h)
NO
X a
nd
SO
2 E
mis
sio
n R
ate
(lb
/MW
h)
Month
NOX
SO2
CO2
0
200
400
600
800
1,000
1,200
0.00
0.50
1.00
1.50
2.00
2.50
3.00
3.50
4.00
2004 2005 2006 2007 2008 2009 2010 2011 2012 2013
CO
2Sy
ste
m E
mis
sio
n R
ate
(l
b/M
Wh
)
NO
xan
d S
O2
Syst
em
Em
issi
on
Rat
e
(lb
/MW
h)
NOx
SO2
CO2

2013 ISO New England Electric Generator Air Emissions Report 22 ISO New England Inc.
5.1.1 Observations
While total energy generation declined 4% in 2013 from 2012, there was little to no change in system emissions. There was less natural gas generation and more coal- and oil-fired generation in 2013 than in the 2012. Total NOX system emissions had no change, while SO2 system emissions increased 9% and CO2 system emissions decreased 3%. The system emission rates for 2013 were higher than 2012 values. The 2013 NOX, SO2 and CO2 emission rates have increased by 3%, 14%, and 2%, respectively from 2012 values. Table 1-1 summarizes the above system emission changes.
There remains a decreasing trend in emissions during the last ten years, which can be attributed to the increased use of new, more efficient natural-gas-fired power plants, a decline in the cost of natural gas, and the implementation of new emission controls on some of the region’s oil- and coal-fired power plants.
5.2 2013 New England Marginal Heat Rate
Prior to 1999, MEA studies assumed a fixed marginal heat rate of 10.0 MMBtu/MWh which was used to convert from lb/MWh to lb/MMBtu.17 In the 1999-2003 MEA studies, the marginal heat rate was calculated using the results of production simulation runs. Beginning with the 2004 MEA study, the marginal heat rate was based on the actual generation of marginal fossil units only. Since a unit’s heat rate is equal to its fuel consumption divided by its generation, the calculated marginal heat rate is defined as follows:18
Beginning with the 2007 MEA Report, the marginal heat rate has been calculated using a combination of both U.S. EPA heat input data and ISO-NE’s heat rate data. For those marginal fossil units with U.S. EPA data, the heat inputs reported to U.S. EPA were used. For those units without U.S. EPA data, the heat inputs were calculated by multiplying each unit’s monthly generation by the heat rate information collected and maintained by ISO-NE. The individual heat input values using the two methods, in MMBtu, were then added and the sum divided by total generation of the marginal fossil units.
The calculated annual marginal heat rate reflects the average annual efficiency of all of the marginal fossil units dispatched throughout 2013. The lower the marginal heat rate value, the more efficient the system or marginal generator(s) is with respect to converting raw fuel into electric energy. Section 5.2 presents two methodologies of Marginal Heat Rates.
17 10 MMBtu/MWh is equivalent to 10,000,000 Btu/kWh. 18 Heat rate is the measure of efficiency in converting fuel input to electricity. The heat rate for a power plant depends on the individual plant design, its operating conditions, and its level of electrical power output. The lower the heat rate, the more efficient the power plant.
2013 ISO New England Electric Generator Air Emissions Report 23 ISO New England Inc.
5.2.1 Fuel Type Assumed (FTA) Marginal Heat Rate
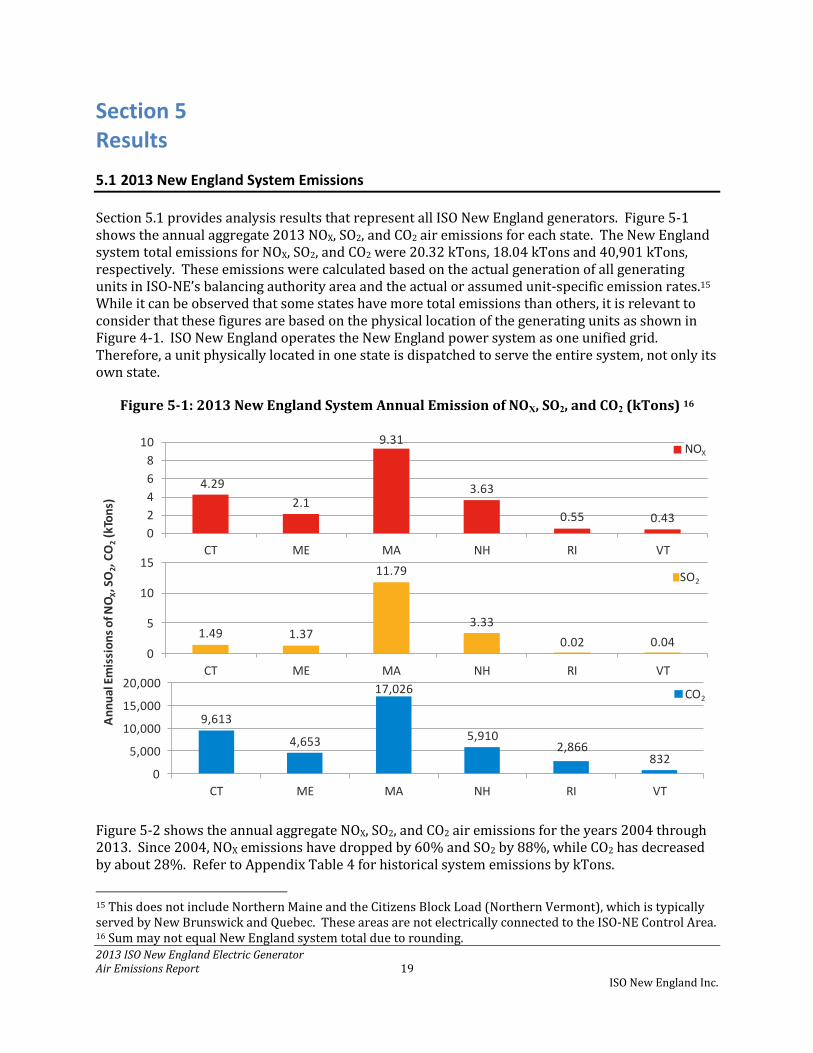
Assuming natural gas and oil-fired generators as marginal units, the FTA Marginal Heat Rate is calculated with their heat input (MMBtu) and generation.
The 2013 calculated FTA marginal heat rate is 7.598 MMBtu/MWh. It was used as the conversion factor to convert from lb/MWh to lb/MMBtu for the marginal emission rates in this report. The FTA heat rate has declined 7% since 2004. Figure 5-5 illustrates the calculated annual marginal heat rate spanning the 2004 to 2013.
Figure 5-5: 2004 - 2013 New England System Annual FTA Marginal Heat Rate (MMBtu/MWh)
8.210
8.140
7.667
8.095
7.932
7.774
7.926
7.628
7.407
7.598
7.0
7.2
7.4
7.6
7.8
8.0
8.2
8.4
2004 2005 2006 2007 2008 2009 2010 2011 2012 2013Calc
ula
ted
FT
A M
arg
inal H
eat
Rate
(M
MB
tu/M
Wh
)
Year

2013 ISO New England Electric Generator Air Emissions Report 24 ISO New England Inc.
5.2.2 Locational Marginal Unit (LMU) Marginal Heat Rate
In the LMU methodology, a heat rate is calculated for each individual generator. The percentage of time each generator is marginal per year leads to the amount of contribution of that unit’s heat rate to the LMU Marginal Heat Rate. The historical LMU marginal heat rates for the years 2009-2013 can be found in Appendix Table 7. Figure 5-7 displays Appendix Table 7 in graphical form while also adding the FTA Marginal Heat Rate for comparing against the O&NG LMU Marginal Heat Rate.
Figure 5-6: 2013 LMU Monthly Marginal Heat Rate (MMBtu/MWh)
Figure 5-7: 2009-2013 LMU Annual Marginal Heat Rate (MMBtu/MWh)
5
5.5
6
6.5
7
7.5
8
8.5
9
9.5
10
1 2 3 4 5 6 7 8 9 10 11 12
LMU
Mar
gin
al H
eat
Rat
e (M
MB
tu/M
Wh
)
Month
All LMUs Emitting LMUs O&NG LMUs
6
6.5
7
7.5
8
8.5
9
2009 2010 2011 2012 2013
LMU
Mar
gin
al H
eat
Rat
e (
MM
Btu
/MW
h)
All LMUs Emitting LMUs O&NG LMUs FTA

2013 ISO New England Electric Generator Air Emissions Report 25 ISO New England Inc.
5.2.3 Observations
Overall, the trend of decreasing marginal heat rates has been continuing, with rates declining from 10.013 MMBtu/MWh to 7.598 MMBtu/MWh over the past ten years according to the FTA methodology. There has also been a downward trend with the LMU-based Marginal Heat Rate methodology. Both methodologies reflect a system that is mostly powered by natural gas units (lower heat rates).
When only studying natural gas- and oil-fired units for marginal heat rate, the FTA and LMU O&NG results can be compared. They track similarly to each other, concluding that both methodologies lead to similar results when considering the same unit types.
5.3 2013 New England Marginal Emission Rates
5.3.1 Fuel Type Assumed (FTA) Marginal Emission Rates
Table 5-2 shows the NOX, SO2, and CO2 calculated marginal emission rates in lb/MWh for ISO New England’s generation system. The NOX data are provided for each of the five time periods studied. Since the ozone and non-ozone seasons are not relevant to SO2 and CO2, only the on-peak, off-peak, and annual rates are provided for those emissions. Appendix Table 8 shows the same information expressed in lb/MMBtu. As noted earlier, the 2013 calculated marginal heat rate of 7.598 MMBtu/MWh was used as the conversion factor.
Table 5-2: 2013 New England FTA Marginal Emission Rates (lb/MWh)19,20
FTA Marginal Emission Rates by State in Table 5-3, Table 5-4, and Table 5-5 show the 2013 calculated NOX, SO2 and CO2 FTA marginal air emission rates for each state based on the generation that operated in that state. The NOX emission rates are shown for ozone and non-ozone seasons, and the SO2 and CO2 rates are shown for the annual on-peak and off-peak hours.
19 The Ozone Season is defined as occurring between May 1 and September 30, while the Non-Ozone Season is defined as occurring from January 1 to April 30 and from October 1 to December 31. 20 On-Peak hours consist of all weekdays between 8 A.M. and 10 P.M. Off-Peak hours consist of all weekdays between 10 P.M. and 8 A.M. and all weekend hours.
On-Peak Off-Peak On-Peak Off-Peak
NOX 0.17 0.14 0.15 0.18 0.16
On-Peak Off-Peak
SO2 0.12 0.11 0.11
CO2 904 924 914
Ozone Season Non-Ozone Season
Annual
Annual Emissions (SO2 and CO2)
Ozone / Non-Ozone Season Emissions (NOx)
Annual
Average
(All Hours)
Air
Emission
Annual
Average
(All Hours)
Air
Emission

2013 ISO New England Electric Generator Air Emissions Report 26 ISO New England Inc.
The type of capacity located within each state is the major factor in the calculated state marginal emission rates. For example, Rhode Island, where 99% of the in-state capacity is gas-fired combined cycle, has much lower marginal emission rates than Vermont, which has the highest (primarily due to the large amount of oil-fired peaking capacity). The total amount of emissions (lb) in Vermont is the lowest in New England; representing 0.02% of the total New England FTA marginal emissions. However, the marginal emission rates are high because the generating units in the marginal fossil category are mostly older, oil-fired, internal combustion engines and gas turbines (peaking units).
Table 5-3: 2013 New England NOX FTA Marginal Emission Rates by State (lb/MWh)
Table 5-4: 2013 New England SO2 FTA Marginal Emission Rates by State (lb/MWh)21
21 Actual values may differ from values due to rounding.
State On-Peak Off-Peak On-Peak Off-Peak
Annual
Average
(All Hours)
Connecticut 0.13 0.10 0.11 0.13 0.12
Maine 0.20 0.22 0.24 0.32 0.25
Massachusetts 0.20 0.14 0.17 0.17 0.17
New Hampshire 0.12 0.08 0.13 0.14 0.12
Rhode Island 0.15 0.18 0.15 0.23 0.17
Vermont 18.43 7.93 8.94 5.59 12.10
New England Average 0.17 0.14 0.15 0.18 0.16
Ozone Season Non-Ozone Season
Annual
Average
(All Hours)
Connecticut 0.05 0.04 0.04
Maine 0.37 0.35 0.36
Massachusetts 0.14 0.12 0.13
New Hampshire 0.18 0.15 0.17
Rhode Island 0.01 0.01 0.01
Vermont 1.16 0.47 0.92
New England Average 0.12 0.11 0.11
StateAnnual
On-Peak
Annual
Off-Peak

2013 ISO New England Electric Generator Air Emissions Report 27 ISO New England Inc.
Table 5-5: 2013 New England CO2 FTA Marginal Emission Rates by State (lb/MWh)
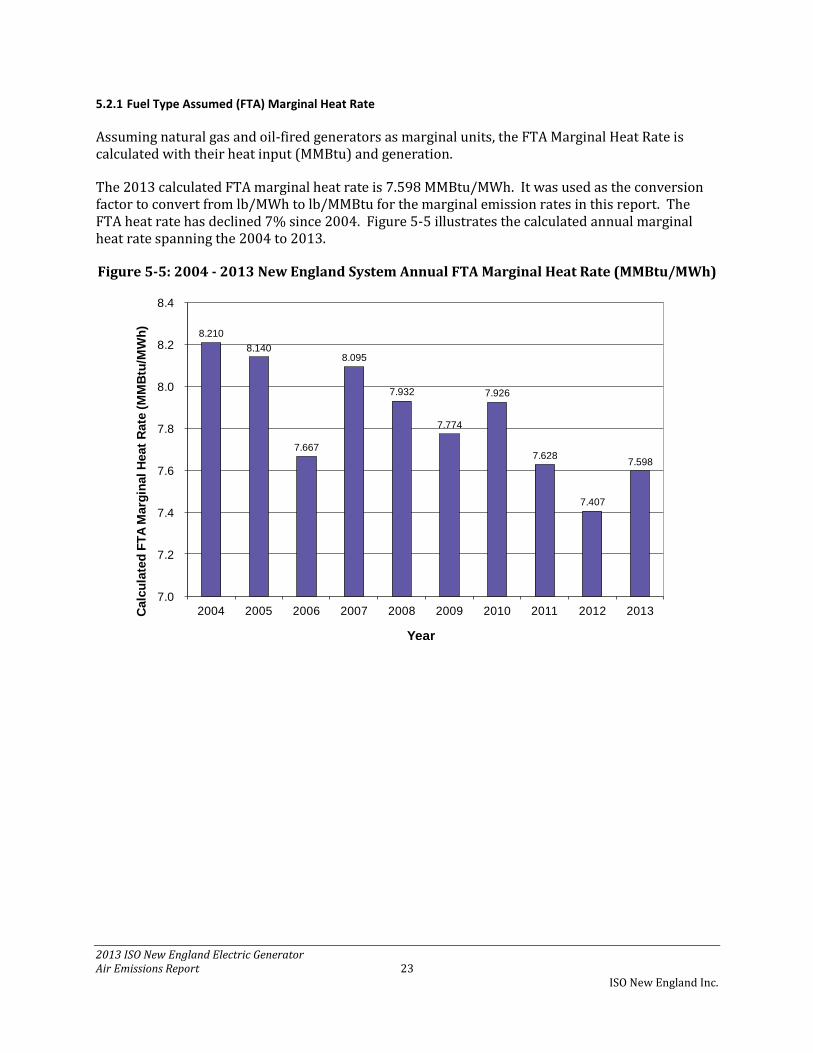
5.3.1.1 2004 - 2013 FTA Marginal Emission Rates
Figure 5-8 , Figure 5-9 and Figure 5-10 show the historical calculated FTA marginal emission rates for NOX, SO2, and CO2, respectively, in lb/MWh for the years 2004 through 2013. Figure 5-8 shows the ozone and non-ozone season rates, while the SO2 and CO2 figures include only the annual average emission rates. Appendix Table 9, Appendix Table 10 and Appendix Table 11 show the historical emission rates in detail. All three tables show the annual average percentage change from the previous year.
Figure 5-8: 2004 - 2013 New England NOX FTA Marginal Emission Rates (lb/MWh)
Annual
Average
(All Hours)
Connecticut 849 858 853
Maine 1,028 1,150 1,084
Massachusetts 912 924 918
New Hampshire 914 941 925
Rhode Island 894 919 904
Vermont 4,033 1,809 3,264
New England Average 904 924 914
StateAnnual
On-Peak
Annual
Off-Peak
0.00
0.10
0.20
0.30
0.40
0.50
0.60
0.70
2004 2005 2006 2007 2008 2009 2010 2011 2012 2013
NO
XF
TA
Ma
rgin
al E
mis
sio
n R
ate
(lb
/MW
h)
Ozone On-Peak
Ozone Off-Peak
Non-Ozone On-Peak
Non-Ozone Off-Peak
Annual Average (All Hours)
2013 ISO New England Electric Generator Air Emissions Report 28 ISO New England Inc.
Figure 5-9: 2004 - 2013 New England SO2 FTA Marginal Emission Rates (lb/MWh)
Figure 5-10: 2004 - 2013 New England CO2 FTA Marginal Emission Rates (lb/MWh)
0.00
0.50
1.00
1.50
2.00
2.50
2004 2005 2006 2007 2008 2009 2010 2011 2012 2013
SO
2F
TA
Marg
inal
Rate
(lb
/MW
h)
Annual Average (All Hours)
0
200
400
600
800
1,000
1,200
2004 2005 2006 2007 2008 2009 2010 2011 2012 2013
CO
2F
TA
Ma
rgin
al E
mis
sio
n R
ate
(lb
/MW
h)
Annual Average (All Hours)
Annual Marginal SO2 Emission Rate
Annual Marginal CO2 Emission Rate
2013 ISO New England Electric Generator Air Emissions Report 29 ISO New England Inc.
5.3.2 Locational Marginal Unit (LMU) Marginal Emission Rates
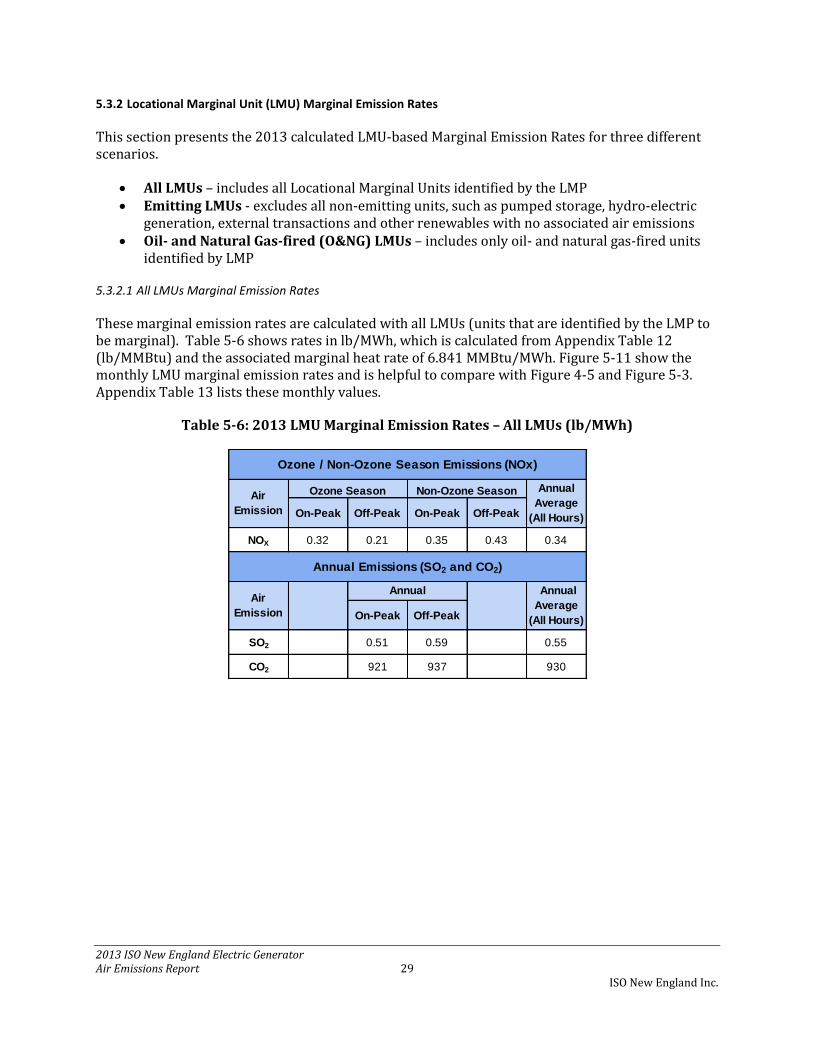
This section presents the 2013 calculated LMU-based Marginal Emission Rates for three different scenarios.
All LMUs – includes all Locational Marginal Units identified by the LMP Emitting LMUs - excludes all non-emitting units, such as pumped storage, hydro-electric
generation, external transactions and other renewables with no associated air emissions Oil- and Natural Gas-fired (O&NG) LMUs – includes only oil- and natural gas-fired units
identified by LMP
5.3.2.1 All LMUs Marginal Emission Rates
These marginal emission rates are calculated with all LMUs (units that are identified by the LMP to be marginal). Table 5-6 shows rates in lb/MWh, which is calculated from Appendix Table 12 (lb/MMBtu) and the associated marginal heat rate of 6.841 MMBtu/MWh. Figure 5-11 show the monthly LMU marginal emission rates and is helpful to compare with Figure 4-5 and Figure 5-3. Appendix Table 13 lists these monthly values.
Table 5-6: 2013 LMU Marginal Emission Rates – All LMUs (lb/MWh)
On-Peak Off-Peak On-Peak Off-Peak
NOX 0.32 0.21 0.35 0.43 0.34
On-Peak Off-Peak
SO2 0.51 0.59 0.55
CO2 921 937 930
Annual
Average
(All Hours)
Air
Emission
Annual
Annual Emissions (SO2 and CO2)
Non-Ozone Season Annual
Average
(All Hours)
Air
Emission
Ozone Season
Ozone / Non-Ozone Season Emissions (NOx)

2013 ISO New England Electric Generator Air Emissions Report 30 ISO New England Inc.
Figure 5-11: 2013 Monthly LMU Marginal Emission Rates – All LMUs (lb/MWh)
0
200
400
600
800
1000
1200
1400
1600
0
0.2
0.4
0.6
0.8
1
1.2
1.4
1.6
1.8
2
1 2 3 4 5 6 7 8 9 10 11 12
CO
2LM
U M
argi
nal
Em
issi
on
s R
ate
(lb
/MW
h)
SO2
& N
OX
LMU
Mar
gin
al E
mis
sio
ns
Rat
e
(lb
/MW
h)
Month
SO2 - All LMUs NOX - All LMUs CO2 - ALL LMUs

2013 ISO New England Electric Generator Air Emissions Report 31 ISO New England Inc.
5.3.2.2 Emitting LMUs Marginal Emission Rates
Presented in Table 5-7 and Appendix Table 14 are the marginal emissions rates from emitting LMUs. The marginal heat rate for this scenario is 8.271 MMBtu/MWh. The monthly rates seen in Figure 5-12 can be found in Appendix Table 15.
Table 5-7: 2013 LMU Marginal Emission Rates – Emitting LMUs (lb/MWh)
Figure 5-12: 2013 Monthly LMU Marginal Emission Rates – Emitting LMUs (lb/MWh)
On-Peak Off-Peak On-Peak Off-Peak
NOX 0.37 0.26 0.41 0.56 0.42
On-Peak Off-Peak
SO2 0.59 0.76 0.69
CO2 1,079 1,163 1,125
Air
Emission
Annual Annual
Average
(All Hours)
Annual Emissions (SO2 and CO2)
Air
Emission
Ozone Season Non-Ozone Season Annual
Average
(All Hours)
Ozone / Non-Ozone Season Emissions (NOx)
0
200
400
600
800
1000
1200
1400
1600
0
0.2
0.4
0.6
0.8
1
1.2
1.4
1.6
1.8
2
1 2 3 4 5 6 7 8 9 10 11 12
CO
2LM
U M
argi
nal
Em
issi
on
s R
ate
(lb
/MW
h)
SO2
& N
OX
LMU
Mar
gin
al E
mis
sio
ns
Rat
e
(lb
/MW
h)
Month
SO2 - Emitting LMUs NOX - Emitting LMUs CO2 - Emitting LMUs

2013 ISO New England Electric Generator Air Emissions Report 32 ISO New England Inc.
5.3.2.3 O&NG Marginal Emission Rates
Table 5-8 and Appendix Table 16 include the O&NG marginal emission rates. These rates are calculated for benchmarking purposes to give a framework for how the FTA and O&NG LMU Marginal Emission Rates compare when only looking at natural gas and oil-fueled units. Since natural gas has low sulfur content and O&NG LMU reflect natural gas on the margin 96% of the time (Figure 4-10), SO2 emission rates are very low. The associated marginal heat rate is 7.604 MMBtu/MWh. The monthly rates seen in Figure 5-13 can be found in Appendix Table 17.
Table 5-8: 2013 LMU Marginal Emission Rates – O&NG LMUs (lb/MWh)
Figure 5-13: 2013 Monthly LMU Marginal Emission Rates – O&NG LMUs (lb/MWh)
On-Peak Off-Peak On-Peak Off-Peak
NOX 0.036 0.016 0.026 0.026 0.026
On-Peak Off-Peak
SO2 0.030 0.026 0.028
CO2 123 121 122
Annual Annual
Average
(All Hours)
Air
Emission
Air
Emission
Ozone Season Non-Ozone Season Annual
Average
(All Hours)
Annual Emissions (SO2 and CO2)
Ozone / Non-Ozone Season Emissions (NOx)
0
200
400
600
800
1000
1200
1400
1600
0
0.2
0.4
0.6
0.8
1
1.2
1.4
1.6
1.8
2
1 2 3 4 5 6 7 8 9 10 11 12
CO
2 LM
U M
argi
nal
Em
issi
on
s R
ate
(lb
/MW
h)
SO2
& N
OX
LMU
Mar
gin
al E
mis
sio
ns
Rat
e
(lb
/MW
h)
Month
SO2 - O&NG LMUs NOX - O&NG LMUs CO2 - O&NG LMUs

2013 ISO New England Electric Generator Air Emissions Report 33 ISO New England Inc.
5.3.2.4 2009 - 2013 LMU Marginal Emission Rates
The LMUs (marginal units identified from the LMP) actively exhibit the changes in New England’s energy production. When considering all LMUs versus emitting LMUs, the latter will result in higher rates due to not accounting for zero air emission resources (e.g. wind, solar, nuclear and hydro-electric), which would lower the average emission rate. Figure 5-14, Figure 5-15 and Figure 5-16 summarize the three scenario of results calculated for the LMU Marginal Emission Rates, which are detailed in Appendix Table 18 through Appendix Table 26 in lb/MWh.
Figure 5-14: 2009 - 2013 LMU Marginal Emission Rates – All LMUs (lb/MWh)
500
600
700
800
900
1000
1100
1200
1300
0
0.5
1
1.5
2
2.5
2009 2010 2011 2012 2013
CO
2LM
U M
arg
ina
l Em
issi
on
s R
ate
(l
b/M
Wh
)
SO2
& N
OX
LMU
Ma
rgin
al E
mis
sio
ns
Ra
te
(lb
/MW
h)
SO2-All Hours
SO2-On Peak
SO2-Off Peak
NOx-All Hours
NOx-Ozone On Peak
NOx-Ozone Off Peak
NOx-NonOzone On Peak
NOx-NonOzone Off Peak
CO2-All Hours
CO2-On Peak
CO2-Off Peak

2013 ISO New England Electric Generator Air Emissions Report 34 ISO New England Inc.
Figure 5-15: 2009 - 2013 LMU Marginal Emission Rates – Emitting LMUs (lb/MWh)
Figure 5-16: 2009 - 2013 LMU Marginal Emission Rates – O&NG LMUs (lb/MWh)
500
600
700
800
900
1000
1100
1200
1300
0
0.5
1
1.5
2
2.5
2009 2010 2011 2012 2013
CO
2LM
U M
arg
ina
l Em
issi
on
s R
ate
(l
b/M
Wh
)
SO2
& N
OX
LMU
Ma
rgin
al E
mis
sio
ns
Ra
te
(lb
/MW
h)
SO2-All Hours
SO2-On Peak
SO2-Off Peak
NOx-All Hours
NOx-Ozone On Peak
NOx-Ozone Off Peak
NOx-NonOzone On Peak
NOx-NonOzone Off Peak
CO2-All Hours
CO2-On Peak
CO2-Off Peak
500
600
700
800
900
1000
1100
1200
1300
0
0.5
1
1.5
2
2.5
2009 2010 2011 2012 2013
CO
2LM
U M
arg
inal
Em
issi
on
s R
ate
(l
b/M
Wh
)
SO2
& N
OX
LMU
Ma
rgin
al E
mis
sio
ns
Rat
e
(lb
/MW
h)
SO2-All Hours
SO2-On Peak
SO2-Off Peak
NOx-All Hours
NOx-Ozone On Peak
NOx-Ozone Off Peak
NOx-NonOzone On Peak
NOx-NonOzone Off Peak
CO2-All Hours
CO2-On Peak
CO2-Off Peak
2013 ISO New England Electric Generator Air Emissions Report 35 ISO New England Inc.
5.3.3 High Electric Demand Day (HEDD) Marginal Emission Rate
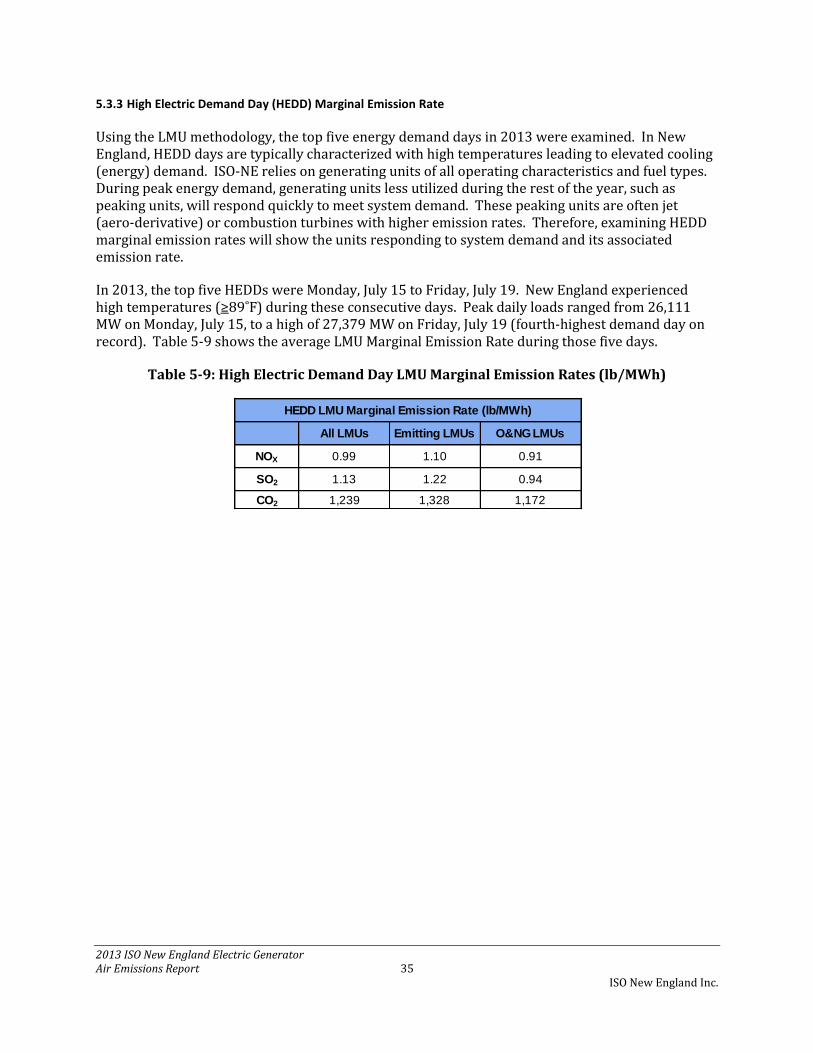
Using the LMU methodology, the top five energy demand days in 2013 were examined. In New England, HEDD days are typically characterized with high temperatures leading to elevated cooling (energy) demand. ISO-NE relies on generating units of all operating characteristics and fuel types. During peak energy demand, generating units less utilized during the rest of the year, such as peaking units, will respond quickly to meet system demand. These peaking units are often jet (aero-derivative) or combustion turbines with higher emission rates. Therefore, examining HEDD marginal emission rates will show the units responding to system demand and its associated emission rate.
In 2013, the top five HEDDs were Monday, July 15 to Friday, July 19. New England experienced high temperatures (≥89˚F) during these consecutive days. Peak daily loads ranged from 26,111 MW on Monday, July 15, to a high of 27,379 MW on Friday, July 19 (fourth-highest demand day on record). Table 5-9 shows the average LMU Marginal Emission Rate during those five days.
Table 5-9: High Electric Demand Day LMU Marginal Emission Rates (lb/MWh)
All LMUs Emitting LMUs O&NG LMUs
NOX 0.99 1.10 0.91
SO2 1.13 1.22 0.94
CO2 1,239 1,328 1,172
HEDD LMU Marginal Emission Rate (lb/MWh)

2013 ISO New England Electric Generator Air Emissions Report 36 ISO New England Inc.
5.3.4 Observations
New England’s power plant air emissions are directly dependent on the specific units that are available and dispatched to serve load for each hour of the year. Therefore, there could be wide variations in seasonal emissions, primarily due to changes in economic and reliability dispatch, unit availability, fuel price and consumption, fuel switching, transmission topology, and load levels. The amount of imports, the use of pumped storage and significant generator outages, such as a nuclear unit outage, could also affect emissions. The FTA and LMU Marginal Emission Rates reflect the dynamics of the New England power system.
As compared with 2004, the 2013 FTA SO2 and NOX annual marginal rates have declined by 95% and 70%, while CO2 decreased by 17%. This decline is clearly illustrated in Appendix Table 9, Appendix Table 10 and Appendix Table 11. Other factors have also contributed throughout the years to the reduction in calculated marginal emission rates. Since 1993, there has been an increase in the availability of New England’s nuclear units as well as increases in some of their capacity ratings, and they have therefore been contributing more toward satisfying the base load electrical demand of the system.
There was a noticeable decrease in the FTA marginal emission rates for NOX in 1995 primarily due to the implementation of Reasonable Available Control Technology (RACT) regulations for NOX as required under Title I of the 1990 Clean Air Act Amendments. Most of the decrease in emission rates that took place through 2004 can be attributed to the commercial installation of many highly efficient, low-emitting, natural gas-fired combined cycle plants prior to that time in New England (see Figure 4-2), as well as a decrease in the price of natural gas. This was combined with the additional emission reductions as required under the Ozone Transport Commission’s 1999 and U.S. EPA’s 2003 NOX Budget Program. Because few new natural gas-fired power plants have been added since 2004, the decline in marginal NOX emission rates has tapered off.
In 2013, the off-peak marginal rate is generally higher than the on-peak rate for NOX, SO2 and CO2 in both methodologies. Prior years show higher emission rates in SO2 and NOX during on-peak hours and ozone season (for NOX) compared to off-peak hours. That was most likely because additional generation brought on line to meet the higher demand during on-peak periods generally had higher emission rates. These were typically peaking units that are more expensive and economic to operate only during high energy price hours. They may also have been older, fossil-steam resources with higher individual heat rates (lower thermal efficiency). The change from higher on-peak rates to higher off-peak rates may be due to the retirement of older fossil-steam resources.
FTA NOx and SO2 marginal emission rates both increased by 14% and 267% between 2012 and 2013, while there was 2% change for the FTA CO2 marginal emission rates. This is compared to an average increase of 58%, 60% and 10% when averaging the scenario of including all LMUs and the scenario of emitting LMUs marginal emission rates for NOX, SO2 and CO2. The increase observed across all three emissions was also observed in system emissions between 2012 and 2013. This can primarily be attributed to the decrease in generation by natural gas-fired units and the increase of coal- and oil-fired units.
Although FTA and LMU marginal emission rates use two different assumptions, the years 2009 - 2013 exhibit similar trends for the region’s marginal emissions rates. NOX and SO2 have both continued their historical downward trend while CO2 has had minimal changes and remained at about the same level. When comparing the FTA and the O&NG LMU marginal emission rates, they are within the same magnitude.

2013 ISO New England Electric Generator Air Emissions Report 37 ISO New England Inc.
Section 6 Appendix
Appendix Table 1: 1994 - 2013 New England Total Cooling and Heating Degree Days
Appendix Table 2: 2013 New England Summer Capacity22, 23
22 Sum may not equal total due to rounding. 23 Season Claimed Capability as of January 1, 2013.
Year
Total
Cooling
Degree
Days
Difference
from
Average
(%)
Total
Heating
Degree
Days
Difference
from
Average
(%)
1994 374 16.3% 6,403 5.5%
1995 312 -3.0% 6,318 4.1%
1996 245 -23.8% 6,454 6.3%
1997 211 -34.4% 6,432 6.0%
1998 312 -3.0% 5,483 -9.7%
1999 360 11.9% 5,774 -4.9%
2000 217 -32.5% 6,399 5.4%
2001 323 0.4% 5,895 -2.9%
2002 354 10.1% 5,959 -1.8%
2003 355 10.4% 6,651 9.6%
2004 251 -22.0% 6,354 4.7%
2005 418 30.0% 6,353 4.7%
2006 335 4.2% 5,552 -8.5%
2007 288 -10.5% 6,175 1.7%
2008 281 -12.6% 6,049 -0.3%
2009 224 -30.4% 6,278 3.4%
2010 406 26.2% 5,653 -6.9%
2011 357 11.0% 5,826 -4.0%
2012 409 27.2% 5,235 -13.8%
2013 401 24.7% 6,156 1.4%
Unit Type MW % MW % MW % MW % MW % MW %
Coal 383.4 4.6 1,198.8 10.2 0.5 0.0 533.3 13.0 - - - -
Natural Gas 2,843.1 33.9 6,078.2 51.7 1,523.9 49.1 1,183.1 28.9 1,833.8 99.8 - -
Nuclear 2,097.3 25.0 677.3 5.8 - - 1,247.1 30.5 - - 619.4 56.6
Oil 2,758.6 32.9 1,591.9 13.5 810.5 26.1 482.9 11.8 - - 127.4 11.6
Hydro 97.0 1.2 207.1 1.8 496.7 16.0 462.6 11.3 0.7 0.0 252.9 23.1
Pumped
Storage
28.9 0.3 1,690.2 14.4 - - - - - - - -
Solar - - 52.5 0.4 - - 0.0 0.0 3.7 0.2 - -
Wind - - 13.9 0.1 50.4 1.6 23.6 0.6 0.2 0.0 13.2 1.2
Other
Renewables
171.9 2.1 249.6 2.1 223.6 7.2 162.7 4.0 - - 81.8 7.5
Total 8,380.1 100.0 11,759.6 100.0 3,105.6 100.0 4,095.3 100.0 1,838.3 100.0 1,094.8 100.0
VermontConnecticut Massachusetts Maine New Hampshire Rhode Island

2013 ISO New England Electric Generator Air Emissions Report 38 ISO New England Inc.
Appendix Table 3: 2013 New England Winter Capacity12, 13
Appendix Table 4: 2001 - 2013 ISO New England System Annual Emissions of NOX, SO2, and CO2 (kTons)
Unit Type MW % MW % MW % MW % MW % MW %
Coal 385.0 4.2 1,379.9 9.6 - - 535.1 12.5 - - - -
Natural Gas 3,144.6 34.0 6,963.6 48.6 1,669.6 49.2 1,322.3 30.8 2,092.6 99.6 - -
Nuclear 2,110.9 22.8 683.4 4.8 - - 1,246.7 29.0 - - 615.0 53.7
Oil 3,310.1 35.7 3,080.6 21.5 880.9 26.0 502.1 11.7 - - 166.0 14.5
Hydro 106.4 1.1 225.6 1.6 530.3 15.6 479.1 11.2 2.1 0.1 261.5 22.8
Pumped
Storage
28.1 0.3 1,701.9 11.9 - - - - - - - -
Solar - - 23.3 0.2 - - - - 3.6 0.2 - -
Wind - - 20.6 0.1 81.5 2.4 42.3 1.0 2.0 0.1 18.6 1.6
Other
Renewables
174.2 1.9 259.3 1.8 231.0 6.8 164.5 3.8 - - 84.4 7.4
Total 9,259.3 100.0 14,338.4 100.0 3,393.2 100.0 4,292.1 100.0 2,100.3 100.0 1,145.5 100.0
Connecticut Massachusetts Maine New Hampshire Rhode Island Vermont
Year NOx SO2 CO2
2001 59.73 200.01 52,991
2002 56.40 161.10 54,497
2003 54.23 159.41 56,278
2004 50.64 149.75 56,723
2005 58.01 150.00 60,580
2006 42.86 101.78 51,649
2007 35.00 108.80 59,169
2008 32.57 94.18 55,427
2009 27.55 76.85 49,380
2010 28.79 80.88 52,321
2011 25.30 57.01 46,959
2012 20.32 16.61 41,975
2013 20.32 18.04 40,901
Percent Reduction,
2001-201366 91 23

2013 ISO New England Electric Generator Air Emissions Report 39 ISO New England Inc.
Appendix Table 5: 2013 Monthly System Emission Rates of NOX, SO2, and CO2 (lb/MWh)
Appendix Table 6: 1999 - 2013 New England System Annual Average NOX, SO2, and CO2 Emission Rates (lb/MWh)
Month NOX SO2 CO2
1 0.47 0.94 804
2 0.51 0.92 800
3 0.43 0.52 753
4 0.33 0.18 687
5 0.30 0.10 706
6 0.30 0.14 666
7 0.38 0.20 789
8 0.29 0.09 716
9 0.29 0.10 686
10 0.26 0.05 637
11 0.32 0.17 687
12 0.47 0.49 805
System Marginal Emission Rates (lb/MWh)
YearTotal Generation
(GWh)NOx SO2 CO2
1999 104,409 1.36 4.52 1,009
2000 110,199 1.12 3.88 913
2001 114,626 1.05 3.51 930
2002 120,539 0.94 2.69 909
2003 127,195 0.93 2.75 970
2004 129,459 0.78 2.31 876
2005 131,874 0.88 2.27 919
2006 128,046 0.67 1.59 808
2007 130,723 0.54 1.66 905
2008 124,749 0.52 1.51 890
2009 119,282 0.46 1.29 828
2010 126,383 0.46 1.28 829
2011 120,612 0.42 0.95 780
2012 116,942 0.35 0.28 719
2013 112,040 0.36 0.32 730
Percent Reduction, 1999 - 2013 74 93 28

2013 ISO New England Electric Generator Air Emissions Report 40 ISO New England Inc.
Appendix Table 7: 2009 - 2013 LMU Marginal Heat Rate (MMBtu/MWh)
Appendix Table 8: 2013 New England FTA Marginal Emission Rates (lb/MMBtu)
YearAll Marginal
LMUs
Emitting
LMUs
O&NG
LMUs
2009 8.591 8.507 7.881
2010 7.414 8.385 7.821
2011 6.907 8.190 7.758
2012 6.678 7.870 7.676
2013 6.841 8.271 7.604
LMU Marginal Heat Rate (MMBtu/MWh)
On-Peak Off-Peak On-Peak Off-Peak
NOX 0.022 0.018 0.020 0.024 0.021
On-Peak Off-Peak
SO2 0.016 0.014 0.014
CO2 119 122 120
Annual Emissions (SO2 and CO2)
Air
Emission
Annual Annual
Average
(All Hours)
Ozone / Non-Ozone Season Emissions (NOx)
Air
Emission
Ozone Season Non-Ozone Season Annual
Average
(All Hours)
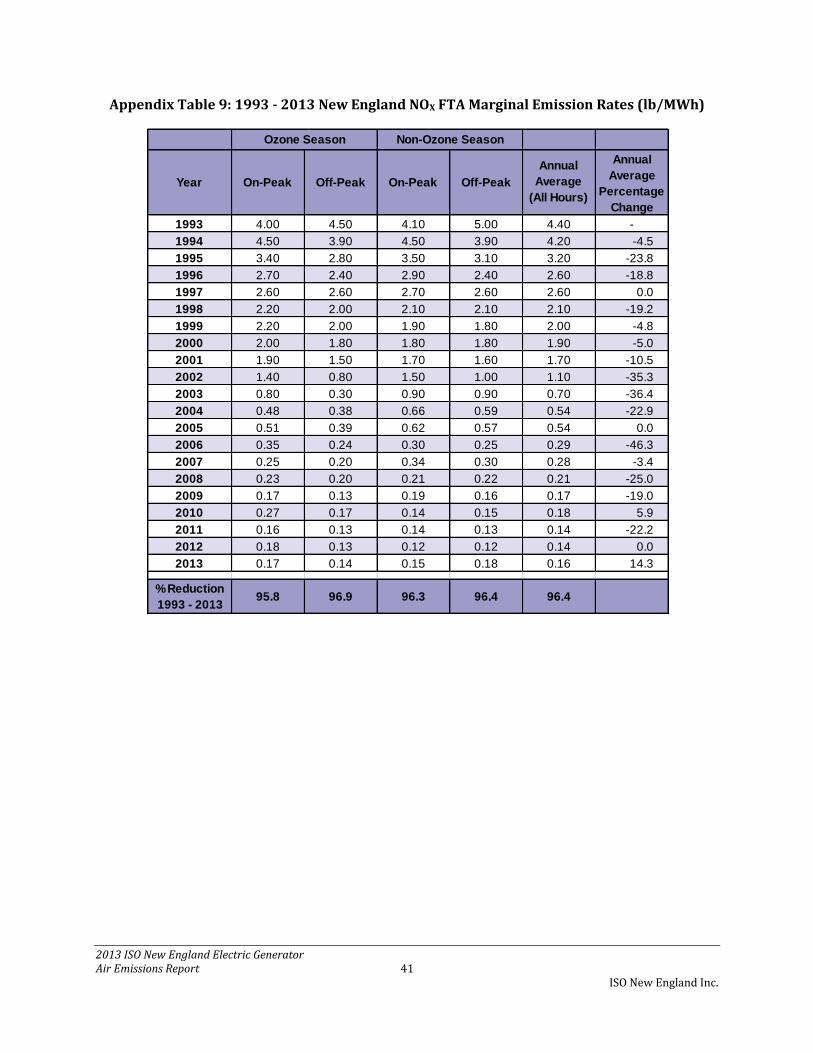
2013 ISO New England Electric Generator Air Emissions Report 41 ISO New England Inc.
Appendix Table 9: 1993 - 2013 New England NOX FTA Marginal Emission Rates (lb/MWh)
Annual
Average
(All Hours)
1993 4.00 4.50 4.10 5.00 4.40 -
1994 4.50 3.90 4.50 3.90 4.20 -4.5
1995 3.40 2.80 3.50 3.10 3.20 -23.8
1996 2.70 2.40 2.90 2.40 2.60 -18.8
1997 2.60 2.60 2.70 2.60 2.60 0.0
1998 2.20 2.00 2.10 2.10 2.10 -19.2
1999 2.20 2.00 1.90 1.80 2.00 -4.8
2000 2.00 1.80 1.80 1.80 1.90 -5.0
2001 1.90 1.50 1.70 1.60 1.70 -10.5
2002 1.40 0.80 1.50 1.00 1.10 -35.3
2003 0.80 0.30 0.90 0.90 0.70 -36.4
2004 0.48 0.38 0.66 0.59 0.54 -22.9
2005 0.51 0.39 0.62 0.57 0.54 0.0
2006 0.35 0.24 0.30 0.25 0.29 -46.3
2007 0.25 0.20 0.34 0.30 0.28 -3.4
2008 0.23 0.20 0.21 0.22 0.21 -25.0
2009 0.17 0.13 0.19 0.16 0.17 -19.0
2010 0.27 0.17 0.14 0.15 0.18 5.9
2011 0.16 0.13 0.14 0.13 0.14 -22.2
2012 0.18 0.13 0.12 0.12 0.14 0.0
2013 0.17 0.14 0.15 0.18 0.16 14.3
% Reduction
1993 - 201395.8 96.9 96.3 96.4 96.4
Ozone Season Non-Ozone Season
Year On-Peak Off-Peak On-Peak Off-Peak
Annual
Average
Percentage
Change
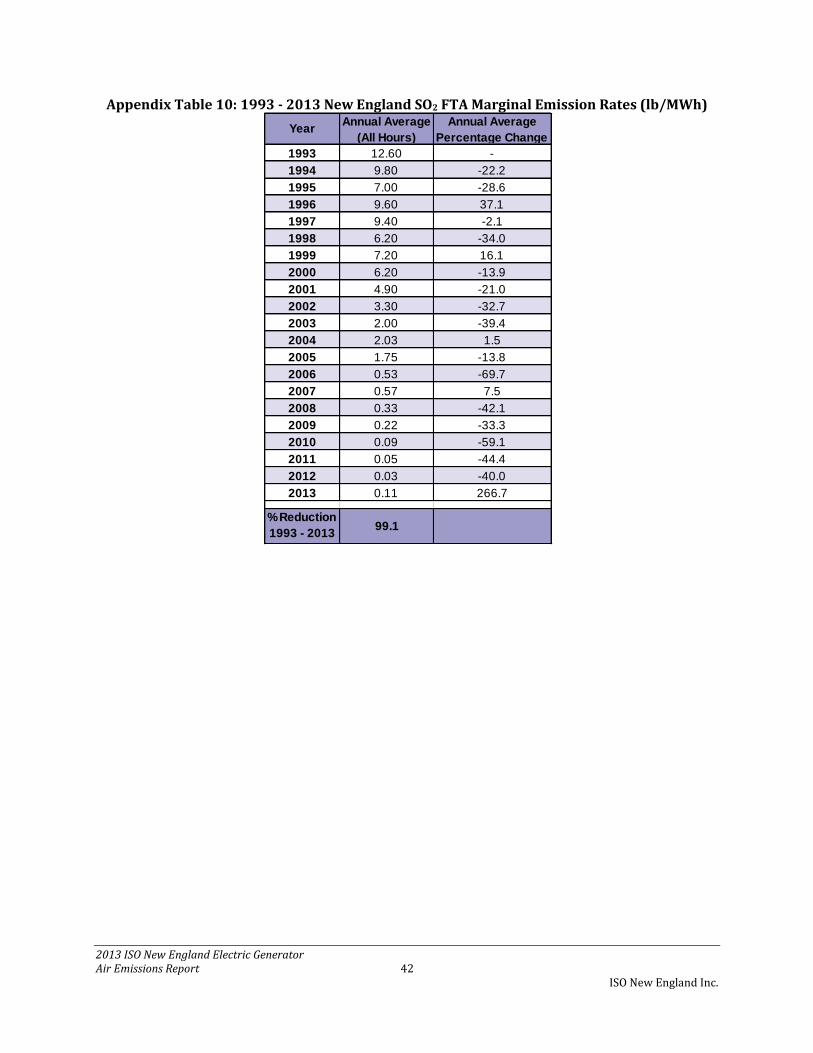
2013 ISO New England Electric Generator Air Emissions Report 42 ISO New England Inc.
Appendix Table 10: 1993 - 2013 New England SO2 FTA Marginal Emission Rates (lb/MWh)
1993 12.60 -
1994 9.80 -22.2
1995 7.00 -28.6
1996 9.60 37.1
1997 9.40 -2.1
1998 6.20 -34.0
1999 7.20 16.1
2000 6.20 -13.9
2001 4.90 -21.0
2002 3.30 -32.7
2003 2.00 -39.4
2004 2.03 1.5
2005 1.75 -13.8
2006 0.53 -69.7
2007 0.57 7.5
2008 0.33 -42.1
2009 0.22 -33.3
2010 0.09 -59.1
2011 0.05 -44.4
2012 0.03 -40.0
2013 0.11 266.7
% Reduction
1993 - 201399.1
Annual Average
(All Hours)
Annual Average
Percentage ChangeYear

2013 ISO New England Electric Generator Air Emissions Report 43 ISO New England Inc.
Appendix Table 11: 1993 - 2013 New England CO2 FTA Marginal Emission Rates (lb/MWh)
Appendix Table 12: 2013 LMU Marginal Emission Rates – All LMUs (lb/MMBtu)
1993 1,643 -
1994 1,573 -4.3
1995 1,584 0.7
1996 1,653 4.4
1997 1,484 -10.2
1998 1,520 2.4
1999 1,578 3.8
2000 1,488 -5.7
2001 1,394 -6.3
2002 1,338 -4.0
2003 1,179 -11.9
2004 1,102 -6.5
2005 1,107 0.5
2006 993 -10.3
2007 1,004 1.1
2008 964 -4.0
2009 930 -3.5
2010 943 1.4
2011 907 -3.8
2012 899 -0.9
2013 914 1.7
% Reduction
1993 - 201344.4
YearAnnual
Average
Annual
Average
On-Peak Off-Peak On-Peak Off-Peak
NOX 0.047 0.031 0.051 0.063 0.050
On-Peak Off-Peak
SO2 0.075 0.086 0.080
CO2 135 137 136
Air
Emission
Ozone Season
Ozone / Non-Ozone Season Emissions (NOx)
Annual Emissions (SO2 and CO2)
Non-Ozone Season Annual
Average
(All Hours)
Air
Emission
Annual Annual
Average
(All Hours)

2013 ISO New England Electric Generator Air Emissions Report 44 ISO New England Inc.
Appendix Table 13: 2013 Monthly LMU Marginal Emission Rates – All LMUs (lb/MWh)
Appendix Table 14: 2013 LMU Marginal Emission Rates – Emitting LMUs (lb/MMBtu)
Appendix Table 15: 2013 Monthly LMU Marginal Emission Rates – Emitting LMUs (lb/MWh)
Month NOX SO2 CO2
1 0.50 1.61 1047
2 0.61 1.44 1099
3 0.45 0.77 948
4 0.21 0.25 820
5 0.21 0.16 812
6 0.31 0.23 970
7 0.48 0.40 1017
8 0.15 0.08 813
9 0.15 0.10 830
10 0.12 0.03 770
11 0.26 0.37 919
12 0.61 1.27 1124
LMU Marginal Emission Rates (lb/MWh)
On-Peak Off-Peak On-Peak Off-Peak
NOX 0.045 0.031 0.050 0.068 0.051
On-Peak Off-Peak
SO2 0.071 0.092 0.083
CO2 130 141 136
Air
Emission
Ozone Season Non-Ozone Season Annual
Average
(All Hours)
Ozone / Non-Ozone Season Emissions (NOx)
Annual Emissions (SO2 and CO2)
Air
Emission
Annual Annual
Average
(All Hours)
Month NOX SO2 CO2
1 0.59 1.89 1251
2 0.81 1.90 1421
3 0.59 1.01 1208
4 0.26 0.34 1029
5 0.25 0.18 979
6 0.38 0.32 1192
7 0.55 0.44 1143
8 0.19 0.10 958
9 0.19 0.11 970
10 0.14 0.03 936
11 0.33 0.47 1099
12 0.73 1.53 1341
LMU Marginal Emission Rates (lb/MWh)

2013 ISO New England Electric Generator Air Emissions Report 45 ISO New England Inc.
Appendix Table 16: 2013 LMU Marginal Emission Rates – O&NG LMUs (lb/MMBtu)
Appendix Table 17: 2013 Monthly LMU Marginal Emission Rates – O&NG LMUs (lb/MWh)
Appendix Table 18: 2009 - 2013 NOX LMU Marginal Emission Rates – All LMUs (lb/MWh)
On-Peak Off-Peak On-Peak Off-Peak
NOX 0.036 0.016 0.026 0.026 0.026
On-Peak Off-Peak
SO2 0.030 0.026 0.028
CO2 123 121 122
Ozone / Non-Ozone Season Emissions (NOx)
Air
Emission
Ozone Season Non-Ozone Season Annual
Average
(All Hours)
Annual Emissions (SO2 and CO2)
Annual Annual
Average
(All Hours)
Air
Emission
Month NOX SO2 CO2
1 0.28 0.58 989
2 0.33 0.89 1019
3 0.10 0.03 884
4 0.10 0.07 892
5 0.14 0.01 872
6 0.15 0.03 892
7 0.38 0.19 986
8 0.14 0.01 890
9 0.13 0.02 888
10 0.11 0.01 890
11 0.14 0.02 908
12 0.38 0.82 1044
LMU Marginal Emission Rates (lb/MWh)
Annual
Average
(All Hours)
2009 0.36 0.39 0.29 0.45 0.38 -
2010 0.62 0.47 0.33 0.47 0.46 21.7
2011 0.24 0.29 0.14 0.36 0.27 -42.2
2012 0.35 0.21 0.19 0.16 0.22 -18.4
2013 0.32 0.21 0.35 0.43 0.34 56.7
% Change
2009 - 2013-10.4 -46.0 20.7 -3.8 -10.1
Annual
Average
Percentage
Change
Ozone Season Non-Ozone Season
Year On-Peak Off-Peak On-Peak Off-Peak

2013 ISO New England Electric Generator Air Emissions Report 46 ISO New England Inc.
Appendix Table 19: 2009 - 2013 NOX LMU Marginal Emission Rates – Emitting LMUs (lb/MWh)
Appendix Table 20: 2009 - 2013 NOX LMU Marginal Emission Rates – O&NG LMUs (lb/MWh)
Appendix Table 21: 2009 - 2013 SO2 LMU Marginal Emission Rates – All LMUs (lb/MWh)
Annual
Average
(All Hours)
2009 0.45 0.53 0.33 0.61 0.49 -
2010 0.69 0.49 0.40 0.62 0.55 11.8
2011 0.32 0.31 0.17 0.46 0.33 -39.8
2012 0.40 0.26 0.23 0.19 0.26 -22.0
2013 0.37 0.26 0.42 0.56 0.42 62.7
% Change
2009 - 2013-17.0 -50.9 25.7 -7.7 -14.6
Ozone Season Non-Ozone Season
Year On-Peak Off-Peak On-Peak Off-Peak
Annual
Average
Percentage
Change
Annual
Average
(All Hours)
2009 0.18 0.11 0.20 0.23 0.18 -
2010 0.55 0.25 0.17 0.18 0.26 42.1
2011 0.35 0.11 0.20 0.17 0.19 -25.4
2012 0.32 0.11 0.12 0.14 0.16 -18.1
2013 0.27 0.12 0.20 0.20 0.20 25.9
% Change
2009 - 201354.3 7.1 2.0 -12.3 9.3
Annual
Average
Percentage
Change
Ozone Season Non-Ozone Season
Year On-Peak Off-Peak On-Peak Off-Peak
2009 1.12 1.72 1.47 -
2010 1.05 1.45 1.29 -12.2
2011 1.34 1.35 1.35 4.7
2012 0.39 0.32 0.35 -73.9
2013 0.51 0.59 0.55 56.0
% Change
2009 - 2013-54.5 -65.7 -62.6
Year On-Peak Off-PeakAnnual Average
(All Hours)
Annual Average
Percentage Change

2013 ISO New England Electric Generator Air Emissions Report 47 ISO New England Inc.
Appendix Table 22: 2009 - 2013 SO2 LMU Marginal Emission Rates – Emitting LMUs (lb/MWh)
Appendix Table 23: 2009 - 2013 SO2 LMU Marginal Emission Rates – O&NG LMUs (lb/MWh)
Appendix Table 24: 2009 - 2013 CO2 LMU Marginal Emission Rates – All LMUs (lb/MWh)
2009 1.40 2.28 1.90 -
2010 1.19 1.76 1.52 -20.0
2011 1.65 1.60 1.62 6.6
2012 0.45 0.39 0.42 -74.3
2013 0.59 0.76 0.69 65.9
% Change
2009 - 2013-57.9 -66.7 -63.7
Year On-Peak Off-PeakAnnual Average
(All Hours)
Annual Average
Percentage Change
2009 0.13 0.16 0.15 -
2010 0.25 0.05 0.13 -13.3
2011 0.12 0.07 0.09 -28.5
2012 0.07 0.02 0.04 -55.3
2013 0.23 0.20 0.21 405.4
% Change
2009 - 201371.6 22.7 40.0
Year On-Peak Off-PeakAnnual Average
(All Hours)
Annual Average
Percentage Change
2009 882 946 919 -
2010 1019 1036 1029 12.0
2011 943 908 922 -10.4
2012 876 839 854 -7.4
2013 921 937 930 8.9
% Change
2009 - 20134.4 -1.0 1.2
Year On-Peak Off-PeakAnnual Average
(All Hours)
Annual Average
Percentage Change

2013 ISO New England Electric Generator Air Emissions Report 48 ISO New England Inc.
Appendix Table 25: 2009 - 2013 CO2 LMU Marginal Emission Rates – Emitting LMUs (lb/MWh)
Appendix Table 26: 2009 - 2013 CO2 LMU Marginal Emission Rates – O&NG LMUs (lb/MWh)
2009 1,042 1,242 1,157 -
2010 1138 1215 1183 2.2
2011 1148 1061 1097 -7.3
2012 1019 1003 1010 -7.9
2013 1079 1163 1125 11.4
% Change
2009 - 20133.6 -6.4 -2.8
Year On-Peak Off-PeakAnnual Average
(All Hours)
Annual Average
Percentage Change
2009 893 956 928 -
2010 987 948 965 4.0
2011 884 872 877 -9.1
2012 933 902 915 4.3
2013 933 923 928 1.4
% Change
2009 - 20134.5 -3.5 0.0
Year On-Peak Off-PeakAnnual Average
(All Hours)
Annual Average
Percentage Change

2013 ISO New England Electric Generator Air Emissions Report 49 ISO New England Inc.
Prepared by:
ISO New England Inc. – System Planning
Customer Service: (413) 540-4220
http://www.iso-ne.com