2013 Greater Los Angeles Homeless Count - LAHSA...
31
1 2013 Greater Los Angeles Homeless Count Key Findings for Service Planning Areas and Supervisorial Districts Published by: The Los Angeles Homeless Services Authority Updated August 27, 2013
Transcript of 2013 Greater Los Angeles Homeless Count - LAHSA...

1
2013 Greater Los Angeles Homeless Count Key Findings for Service Planning Areas and Supervisorial Districts
Published by: The Los Angeles Homeless Services Authority
Updated August 27, 2013
2013 Greater Los Angeles Homeless Count Key Findings – Service Planning Areas Homelessness Population Totals
2
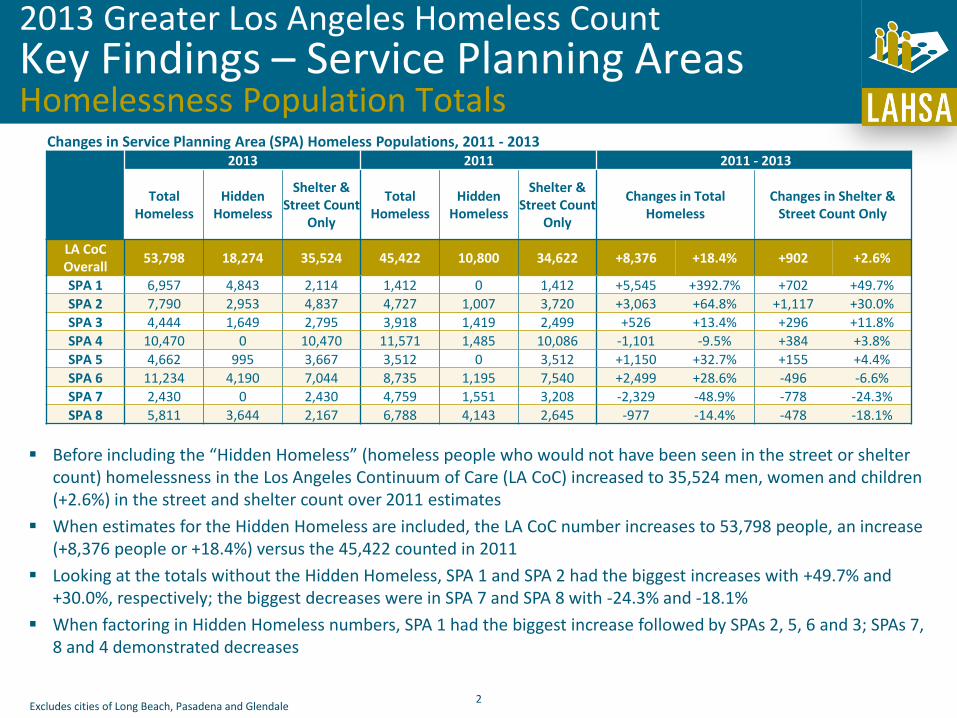
Before including the “Hidden Homeless” (homeless people who would not have been seen in the street or shelter count) homelessness in the Los Angeles Continuum of Care (LA CoC) increased to 35,524 men, women and children (+2.6%) in the street and shelter count over 2011 estimates
When estimates for the Hidden Homeless are included, the LA CoC number increases to 53,798 people, an increase (+8,376 people or +18.4%) versus the 45,422 counted in 2011
Looking at the totals without the Hidden Homeless, SPA 1 and SPA 2 had the biggest increases with +49.7% and +30.0%, respectively; the biggest decreases were in SPA 7 and SPA 8 with -24.3% and -18.1%
When factoring in Hidden Homeless numbers, SPA 1 had the biggest increase followed by SPAs 2, 5, 6 and 3; SPAs 7, 8 and 4 demonstrated decreases
Changes in Service Planning Area (SPA) Homeless Populations, 2011 - 2013
2013 2011 2011 - 2013
Total Homeless
Hidden Homeless
Shelter & Street Count
Only
Total Homeless
Hidden Homeless
Shelter & Street Count
Only
Changes in Total Homeless
Changes in Shelter & Street Count Only
LA CoC Overall
53,798 18,274 35,524 45,422 10,800 34,622 +8,376 +18.4% +902 +2.6%
SPA 1 6,957 4,843 2,114 1,412 0 1,412 +5,545 +392.7% +702 +49.7%
SPA 2 7,790 2,953 4,837 4,727 1,007 3,720 +3,063 +64.8% +1,117 +30.0%
SPA 3 4,444 1,649 2,795 3,918 1,419 2,499 +526 +13.4% +296 +11.8%
SPA 4 10,470 0 10,470 11,571 1,485 10,086 -1,101 -9.5% +384 +3.8%
SPA 5 4,662 995 3,667 3,512 0 3,512 +1,150 +32.7% +155 +4.4%
SPA 6 11,234 4,190 7,044 8,735 1,195 7,540 +2,499 +28.6% -496 -6.6%
SPA 7 2,430 0 2,430 4,759 1,551 3,208 -2,329 -48.9% -778 -24.3%
SPA 8 5,811 3,644 2,167 6,788 4,143 2,645 -977 -14.4% -478 -18.1%
Excludes cities of Long Beach, Pasadena and Glendale
2013 Greater Los Angeles Homeless Count Key Findings – Service Planning Areas Homelessness by Household Type
3
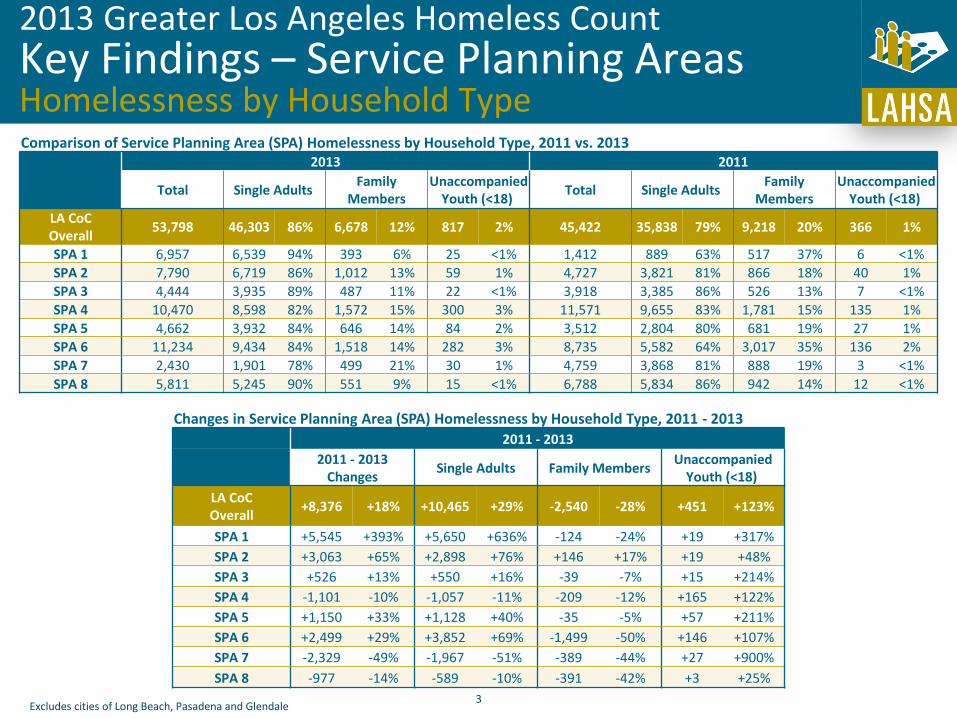
Comparison of Service Planning Area (SPA) Homelessness by Household Type, 2011 vs. 2013
2013 2011
Total Single Adults Family
Members Unaccompanied
Youth (<18) Total Single Adults
Family Members
Unaccompanied Youth (<18)
LA CoC Overall
53,798 46,303 86% 6,678 12% 817 2% 45,422 35,838 79% 9,218 20% 366 1%
SPA 1 6,957 6,539 94% 393 6% 25 <1% 1,412 889 63% 517 37% 6 <1%
SPA 2 7,790 6,719 86% 1,012 13% 59 1% 4,727 3,821 81% 866 18% 40 1%
SPA 3 4,444 3,935 89% 487 11% 22 <1% 3,918 3,385 86% 526 13% 7 <1%
SPA 4 10,470 8,598 82% 1,572 15% 300 3% 11,571 9,655 83% 1,781 15% 135 1%
SPA 5 4,662 3,932 84% 646 14% 84 2% 3,512 2,804 80% 681 19% 27 1%
SPA 6 11,234 9,434 84% 1,518 14% 282 3% 8,735 5,582 64% 3,017 35% 136 2%
SPA 7 2,430 1,901 78% 499 21% 30 1% 4,759 3,868 81% 888 19% 3 <1%
SPA 8 5,811 5,245 90% 551 9% 15 <1% 6,788 5,834 86% 942 14% 12 <1%
Changes in Service Planning Area (SPA) Homelessness by Household Type, 2011 - 2013
2011 - 2013
2011 - 2013
Changes Single Adults Family Members
Unaccompanied Youth (<18)
LA CoC Overall
+8,376 +18% +10,465 +29% -2,540 -28% +451 +123%
SPA 1 +5,545 +393% +5,650 +636% -124 -24% +19 +317%
SPA 2 +3,063 +65% +2,898 +76% +146 +17% +19 +48%
SPA 3 +526 +13% +550 +16% -39 -7% +15 +214%
SPA 4 -1,101 -10% -1,057 -11% -209 -12% +165 +122%
SPA 5 +1,150 +33% +1,128 +40% -35 -5% +57 +211%
SPA 6 +2,499 +29% +3,852 +69% -1,499 -50% +146 +107%
SPA 7 -2,329 -49% -1,967 -51% -389 -44% +27 +900%
SPA 8 -977 -14% -589 -10% -391 -42% +3 +25%
Excludes cities of Long Beach, Pasadena and Glendale

2013 Greater Los Angeles Homeless Count Key Findings – Service Planning Areas Homelessness Population Totals
4
2011 Comparison
Excludes cities of Long Beach, Pasadena and Glendale

2013 Greater Los Angeles Homeless Count Key Findings – Service Planning Areas Single Adult Homelessness
5 Excludes cities of Long Beach, Pasadena and Glendale

2013 Greater Los Angeles Homeless Count Key Findings – Service Planning Areas Family Homelessness
6 Excludes cities of Long Beach, Pasadena and Glendale

2013 Greater Los Angeles Homeless Count Key Findings – Service Planning Areas Unaccompanied Youth Homelessness
7
For the purposes of HUD
reporting, CoCs must be able
to report separately on
unaccompanied homeless
children who are under age
18.
Defining youth as under age
18 allows HUD to use the
same definition for all
reporting related to homeless
programs. Transition Age
Youth (TAY), or youth
between ages 18-25, are
counted as part of the Single
Adult population.
Excludes cities of Long Beach, Pasadena and Glendale
2013 Greater Los Angeles Homeless Count Key Findings – Service Planning Areas Homelessness by Household Type
The LA CoC had an overall increase in homelessness (18.4%);
there were increases in 5 of the 8 SPAs with the biggest
increase in homelessness in SPA 1 (+393%) and decreases in
SPAs 4 (-10%), 7 (-49%) and 8 (-14%)
– Single Adults biggest increase in household types in 5 of the 8 SPAs
with the biggest increase also occurring in SPA 1 (+636%);
– Family Members decreased in every SPA except for SPA 2 (+17%);
biggest decreases were in SPAs 6 (-50%), 7 (-44%) and 8 (-42%)
– Unaccompanied Youth increased in every single SPA with the biggest
increases in SPA 7 (+900%), SPA 1 (+317%), SPA 3 (+214%) and SPA 5
(+211%)
8 Excludes cities of Long Beach, Pasadena and Glendale
9
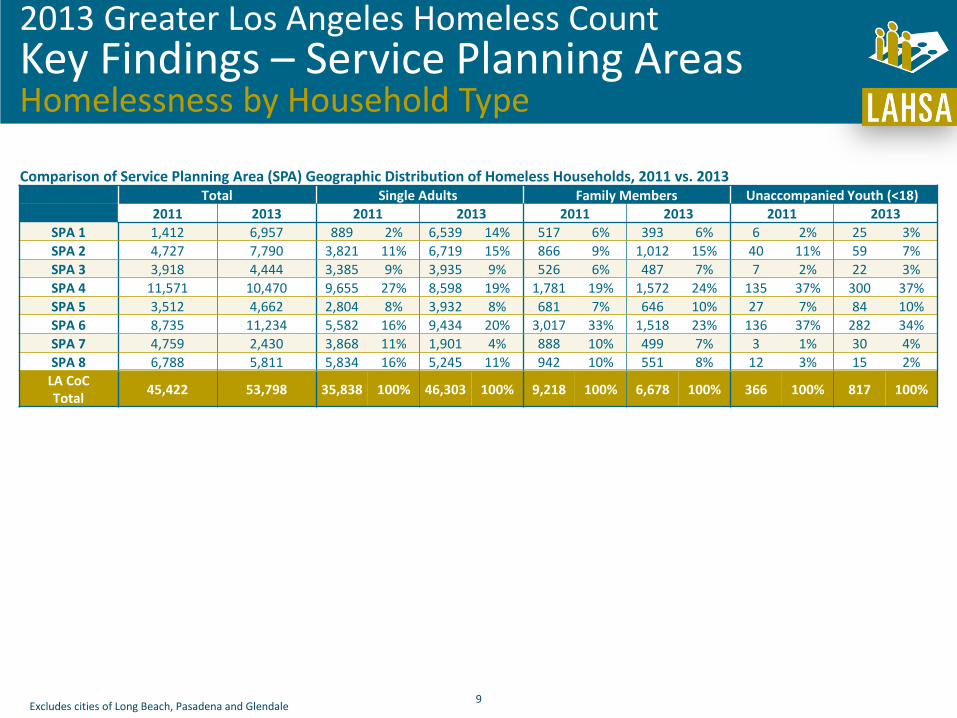
Comparison of Service Planning Area (SPA) Geographic Distribution of Homeless Households, 2011 vs. 2013 Total Single Adults Family Members Unaccompanied Youth (<18)
2011 2013 2011 2013 2011 2013 2011 2013
SPA 1 1,412 6,957 889 2% 6,539 14% 517 6% 393 6% 6 2% 25 3%
SPA 2 4,727 7,790 3,821 11% 6,719 15% 866 9% 1,012 15% 40 11% 59 7%
SPA 3 3,918 4,444 3,385 9% 3,935 9% 526 6% 487 7% 7 2% 22 3%
SPA 4 11,571 10,470 9,655 27% 8,598 19% 1,781 19% 1,572 24% 135 37% 300 37%
SPA 5 3,512 4,662 2,804 8% 3,932 8% 681 7% 646 10% 27 7% 84 10%
SPA 6 8,735 11,234 5,582 16% 9,434 20% 3,017 33% 1,518 23% 136 37% 282 34%
SPA 7 4,759 2,430 3,868 11% 1,901 4% 888 10% 499 7% 3 1% 30 4%
SPA 8 6,788 5,811 5,834 16% 5,245 11% 942 10% 551 8% 12 3% 15 2%
LA CoC Total
45,422 53,798 35,838 100% 46,303 100% 9,218 100% 6,678 100% 366 100% 817 100%
Excludes cities of Long Beach, Pasadena and Glendale
2013 Greater Los Angeles Homeless Count Key Findings – Service Planning Areas Homelessness by Household Type
10 Excludes cities of Long Beach, Pasadena and Glendale
2013 Greater Los Angeles Homeless Count Key Findings – Service Planning Areas Homelessness by Shelter Type
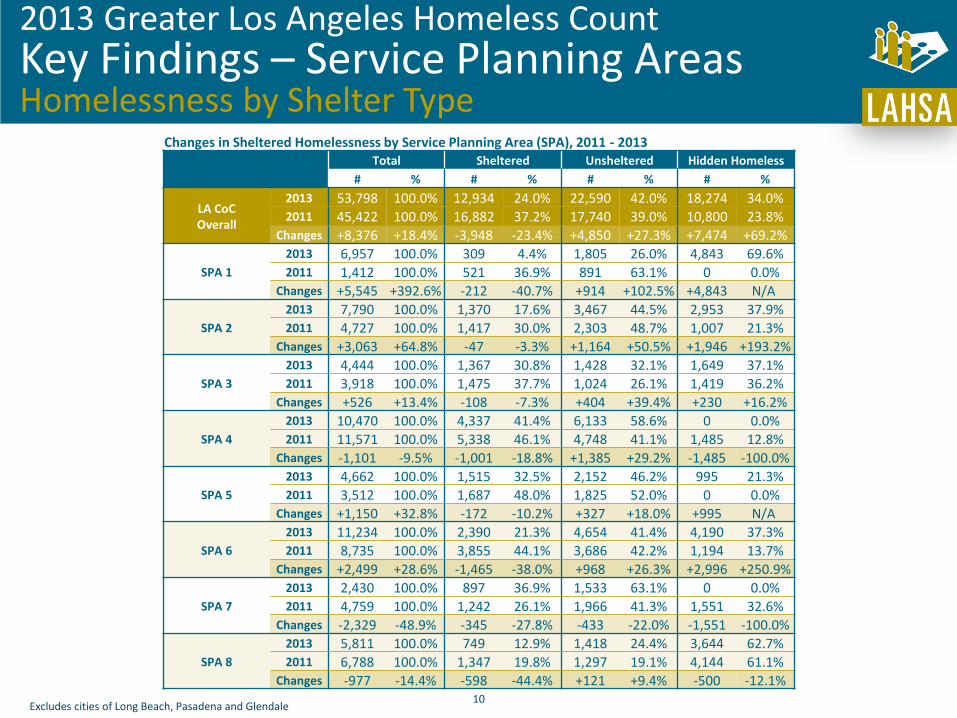
Changes in Sheltered Homelessness by Service Planning Area (SPA), 2011 - 2013
Total Sheltered Unsheltered Hidden Homeless
# % # % # % # %
LA CoC Overall
2013 53,798 100.0% 12,934 24.0% 22,590 42.0% 18,274 34.0% 2011 45,422 100.0% 16,882 37.2% 17,740 39.0% 10,800 23.8%
Changes +8,376 +18.4% -3,948 -23.4% +4,850 +27.3% +7,474 +69.2%
SPA 1
2013 6,957 100.0% 309 4.4% 1,805 26.0% 4,843 69.6% 2011 1,412 100.0% 521 36.9% 891 63.1% 0 0.0%
Changes +5,545 +392.6% -212 -40.7% +914 +102.5% +4,843 N/A
SPA 2
2013 7,790 100.0% 1,370 17.6% 3,467 44.5% 2,953 37.9% 2011 4,727 100.0% 1,417 30.0% 2,303 48.7% 1,007 21.3%
Changes +3,063 +64.8% -47 -3.3% +1,164 +50.5% +1,946 +193.2%
SPA 3
2013 4,444 100.0% 1,367 30.8% 1,428 32.1% 1,649 37.1% 2011 3,918 100.0% 1,475 37.7% 1,024 26.1% 1,419 36.2%
Changes +526 +13.4% -108 -7.3% +404 +39.4% +230 +16.2%
SPA 4
2013 10,470 100.0% 4,337 41.4% 6,133 58.6% 0 0.0% 2011 11,571 100.0% 5,338 46.1% 4,748 41.1% 1,485 12.8%
Changes -1,101 -9.5% -1,001 -18.8% +1,385 +29.2% -1,485 -100.0%
SPA 5
2013 4,662 100.0% 1,515 32.5% 2,152 46.2% 995 21.3% 2011 3,512 100.0% 1,687 48.0% 1,825 52.0% 0 0.0%
Changes +1,150 +32.8% -172 -10.2% +327 +18.0% +995 N/A
SPA 6
2013 11,234 100.0% 2,390 21.3% 4,654 41.4% 4,190 37.3% 2011 8,735 100.0% 3,855 44.1% 3,686 42.2% 1,194 13.7%
Changes +2,499 +28.6% -1,465 -38.0% +968 +26.3% +2,996 +250.9%
SPA 7
2013 2,430 100.0% 897 36.9% 1,533 63.1% 0 0.0% 2011 4,759 100.0% 1,242 26.1% 1,966 41.3% 1,551 32.6%
Changes -2,329 -48.9% -345 -27.8% -433 -22.0% -1,551 -100.0%
SPA 8
2013 5,811 100.0% 749 12.9% 1,418 24.4% 3,644 62.7% 2011 6,788 100.0% 1,347 19.8% 1,297 19.1% 4,144 61.1%
Changes -977 -14.4% -598 -44.4% +121 +9.4% -500 -12.1%

2013 Greater Los Angeles Homeless Count Key Findings – Service Planning Areas Homelessness by Age
11
Comparison of Service Planning Area (SPA) Homelessness Age Totals, 2011 vs. 2013
2013 2011
LA CoC Overall
SPA 1 SPA 2 SPA 3 SPA 4 SPA 5 SPA 6 SPA 7 SPA 8 LA CoC Overall
SPA 1 SPA 2 SPA 3 SPA 4 SPA 5 SPA 6 SPA 7 SPA 8
Antelope Valley
San Fernando
Valley
San Gabriel Valley
Metro LA
West LA South LA East LA County
South Bay
Antelope Valley
San Fernando
Valley
San Gabriel Valley
Metro LA
West LA South LA East LA County
South Bay
Under 18 4,667 256 625 308 1,203 439 1,209 305 322 6,112 339 553 363 1,230 427 2,053 540 607
18-24 4,046 495 567 355 843 367 807 188 424 3,708 60 89 321 1,303 358 568 467 542
25-54 33,043 4,542 4,833 2,773 6,184 2,828 6,754 1,421 3,708 25,585 902 2,787 2,374 7,033 1,881 4,324 2,818 3,466
55-61 7,570 1,034 1,105 637 1,425 650 1,545 327 847 6,468 66 765 383 1,391 527 1,192 701 1,443
62 & Older 4,472 630 660 371 815 378 919 189 510 3,549 45 533 477 614 319 598 233 730 Total 53,798 6,957 7,790 4,444 10,470 4,662 11,234 2,430 5,811 45,422 1,412 4,727 3,918 11,571 3,512 8,735 4,759 6,788
Comparison of Service Planning Area (SPA) Homelessness by Age Prevalence Rates, 2011 vs. 2013
LA CoC Overall
SPA 1 SPA 2 SPA 3 SPA 4 SPA 5 SPA 6 SPA 7 SPA 8 Antelope
Valley San Fernando
Valley San Gabriel
Valley Metro LA West LA South LA East LA County South Bay
2011 2013 2011 2013 2011 2013 2011 2013 2011 2013 2011 2013 2011 2013 2011 2013 2011 2013
Under 18 14% 9% 24% 4% 12% 8% 9% 7% 11% 11% 12% 9% 23% 11% 11% 13% 9% 5%
18-24 8% 8% 4% 7% 2% 7% 8% 8% 11% 8% 10% 8% 7% 7% 10% 8% 8% 7%
25-54 56% 61% 64% 65% 59% 62% 61% 63% 61% 59% 54% 61% 49% 60% 59% 58% 51% 64%
55-61 14% 14% 5% 15% 16% 14% 10% 14% 12% 14% 15% 14% 14% 14% 15% 13% 21% 15%
62 & Older 8% 8% 3% 9% 11% 9% 12% 8% 5% 8% 9% 8% 7% 8% 5% 8% 11% 9%
Excludes cities of Long Beach, Pasadena and Glendale
12
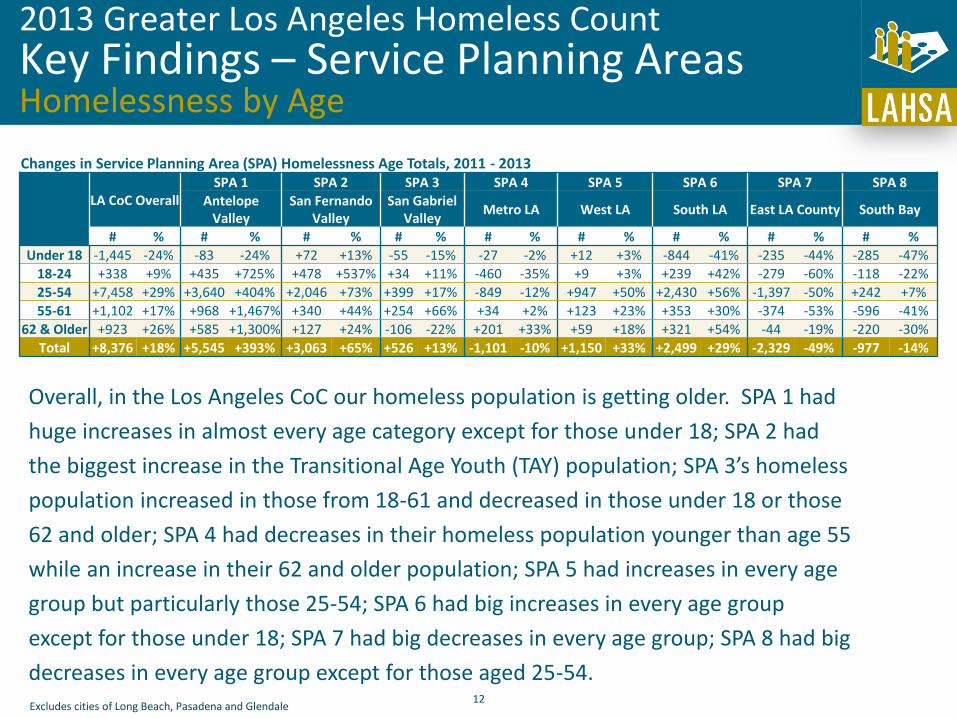
Overall, in the Los Angeles CoC our homeless population is getting older. SPA 1 had
huge increases in almost every age category except for those under 18; SPA 2 had
the biggest increase in the Transitional Age Youth (TAY) population; SPA 3’s homeless
population increased in those from 18-61 and decreased in those under 18 or those
62 and older; SPA 4 had decreases in their homeless population younger than age 55
while an increase in their 62 and older population; SPA 5 had increases in every age
group but particularly those 25-54; SPA 6 had big increases in every age group
except for those under 18; SPA 7 had big decreases in every age group; SPA 8 had big
decreases in every age group except for those aged 25-54.
Changes in Service Planning Area (SPA) Homelessness Age Totals, 2011 - 2013
LA CoC Overall
SPA 1 SPA 2 SPA 3 SPA 4 SPA 5 SPA 6 SPA 7 SPA 8 Antelope
Valley San Fernando
Valley San Gabriel
Valley Metro LA West LA South LA East LA County South Bay
# % # % # % # % # % # % # % # % # %
Under 18 -1,445 -24% -83 -24% +72 +13% -55 -15% -27 -2% +12 +3% -844 -41% -235 -44% -285 -47%
18-24 +338 +9% +435 +725% +478 +537% +34 +11% -460 -35% +9 +3% +239 +42% -279 -60% -118 -22%
25-54 +7,458 +29% +3,640 +404% +2,046 +73% +399 +17% -849 -12% +947 +50% +2,430 +56% -1,397 -50% +242 +7%
55-61 +1,102 +17% +968 +1,467% +340 +44% +254 +66% +34 +2% +123 +23% +353 +30% -374 -53% -596 -41%
62 & Older +923 +26% +585 +1,300% +127 +24% -106 -22% +201 +33% +59 +18% +321 +54% -44 -19% -220 -30%
Total +8,376 +18% +5,545 +393% +3,063 +65% +526 +13% -1,101 -10% +1,150 +33% +2,499 +29% -2,329 -49% -977 -14%
Excludes cities of Long Beach, Pasadena and Glendale
2013 Greater Los Angeles Homeless Count Key Findings – Service Planning Areas Homelessness by Age
13
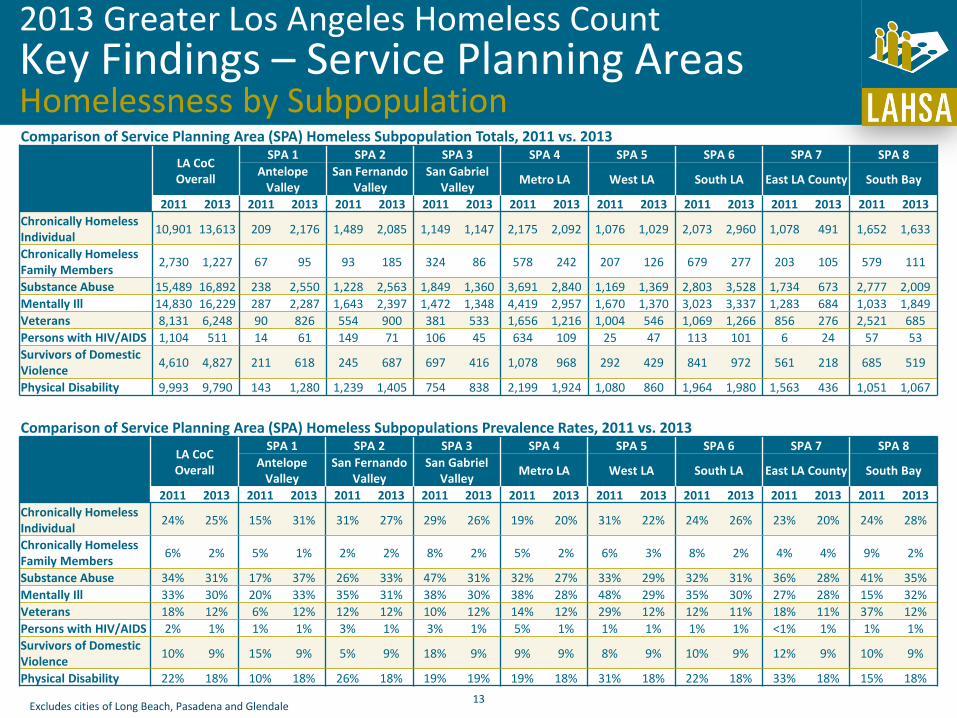
Comparison of Service Planning Area (SPA) Homeless Subpopulation Totals, 2011 vs. 2013
LA CoC Overall
SPA 1 SPA 2 SPA 3 SPA 4 SPA 5 SPA 6 SPA 7 SPA 8
Antelope Valley
San Fernando Valley
San Gabriel Valley
Metro LA West LA South LA East LA County South Bay
2011 2013 2011 2013 2011 2013 2011 2013 2011 2013 2011 2013 2011 2013 2011 2013 2011 2013
Chronically Homeless Individual
10,901 13,613 209 2,176 1,489 2,085 1,149 1,147 2,175 2,092 1,076 1,029 2,073 2,960 1,078 491 1,652 1,633
Chronically Homeless Family Members
2,730 1,227 67 95 93 185 324 86 578 242 207 126 679 277 203 105 579 111
Substance Abuse 15,489 16,892 238 2,550 1,228 2,563 1,849 1,360 3,691 2,840 1,169 1,369 2,803 3,528 1,734 673 2,777 2,009
Mentally Ill 14,830 16,229 287 2,287 1,643 2,397 1,472 1,348 4,419 2,957 1,670 1,370 3,023 3,337 1,283 684 1,033 1,849
Veterans 8,131 6,248 90 826 554 900 381 533 1,656 1,216 1,004 546 1,069 1,266 856 276 2,521 685
Persons with HIV/AIDS 1,104 511 14 61 149 71 106 45 634 109 25 47 113 101 6 24 57 53
Survivors of Domestic Violence
4,610 4,827 211 618 245 687 697 416 1,078 968 292 429 841 972 561 218 685 519
Physical Disability 9,993 9,790 143 1,280 1,239 1,405 754 838 2,199 1,924 1,080 860 1,964 1,980 1,563 436 1,051 1,067
Comparison of Service Planning Area (SPA) Homeless Subpopulations Prevalence Rates, 2011 vs. 2013
LA CoC Overall
SPA 1 SPA 2 SPA 3 SPA 4 SPA 5 SPA 6 SPA 7 SPA 8
Antelope Valley
San Fernando Valley
San Gabriel Valley
Metro LA West LA South LA East LA County South Bay
2011 2013 2011 2013 2011 2013 2011 2013 2011 2013 2011 2013 2011 2013 2011 2013 2011 2013
Chronically Homeless Individual
24% 25% 15% 31% 31% 27% 29% 26% 19% 20% 31% 22% 24% 26% 23% 20% 24% 28%
Chronically Homeless Family Members
6% 2% 5% 1% 2% 2% 8% 2% 5% 2% 6% 3% 8% 2% 4% 4% 9% 2%
Substance Abuse 34% 31% 17% 37% 26% 33% 47% 31% 32% 27% 33% 29% 32% 31% 36% 28% 41% 35%
Mentally Ill 33% 30% 20% 33% 35% 31% 38% 30% 38% 28% 48% 29% 35% 30% 27% 28% 15% 32%
Veterans 18% 12% 6% 12% 12% 12% 10% 12% 14% 12% 29% 12% 12% 11% 18% 11% 37% 12%
Persons with HIV/AIDS 2% 1% 1% 1% 3% 1% 3% 1% 5% 1% 1% 1% 1% 1% <1% 1% 1% 1%
Survivors of Domestic Violence
10% 9% 15% 9% 5% 9% 18% 9% 9% 9% 8% 9% 10% 9% 12% 9% 10% 9%
Physical Disability 22% 18% 10% 18% 26% 18% 19% 19% 19% 18% 31% 18% 22% 18% 33% 18% 15% 18%
Excludes cities of Long Beach, Pasadena and Glendale
2013 Greater Los Angeles Homeless Count Key Findings – Service Planning Areas Homelessness by Subpopulation

2013 Greater Los Angeles Homeless Count Key Findings – Service Planning Areas Homelessness by Subpopulation
14
Comparison of Service Planning Area (SPA) Homeless Subpopulation Totals, 2013 vs. 2011
2013 2011
LA CoC Overall
SPA 1 SPA 2 SPA 3 SPA 4 SPA 5 SPA 6 SPA 7 SPA 8
LA CoC Total
SPA 1 SPA 2 SPA 3 SPA 4 SPA 5 SPA 6 SPA 7 SPA 8
Antelope Valley
San Fernando
Valley
San Gabriel Valley
Metro LA
West LA South
LA East LA County
South Bay
Antelope Valley
San Fernando
Valley
San Gabriel Valley
Metro LA
West LA South
LA East LA County
South Bay
Chronically Homeless Individual
13,613 2,176 2,085 1,147 2,092 1,029 2,960 491 1,633 10,901 209 1,489 1,149 2,175 1,076 2,073 1,078 1,652
Chronically Homeless Family
1,227 95 185 86 242 126 277 105 111 2,730 67 93 324 578 207 679 203 579
Substance Abuse 16,892 2,550 2,563 1,360 2,840 1,369 3,528 673 2,009 15,489 238 1,228 1,849 3,691 1,169 2,803 1,734 2,777
Mentally Ill 16,229 2,287 2,397 1,348 2,957 1,370 3,337 684 1,849 14,830 287 1,643 1,472 4,419 1,670 3,023 1,283 1,033
Veterans 6,248 826 900 533 1,216 546 1,266 276 685 8,131 90 554 381 1,656 1,004 1,069 856 2,521 Persons with HIV/AIDS
511 61 71 45 109 47 101 24 53 1,104 14 149 106 634 25 113 6 57
Survivors of Domestic Violence
4,827 618 687 416 968 429 972 218 519 4,610 211 245 697 1,078 292 841 561 685
Physical Disability 9,790 1,280 1,405 838 1,924 860 1,980 436 1,067 9,993 143 1,239 754 2,199 1,080 1,964 1,563 1,051
Changes in Service Planning Area (SPA) Homeless Subpopulation Totals, 2011 - 2013
LA CoC Overall
SPA 1 SPA 2 SPA 3 SPA 4 SPA 5 SPA 6 SPA 7 SPA 8
Antelope Valley San Fernando
Valley San Gabriel
Valley Metro LA West LA South LA East LA County South Bay
# % # % # % # % # % # % # % # % # %
Chronically Homeless Individual
+2,712 +25% +1,967 +941% +596 +40% -2 -<1% -83 -4% -47 -4% +887 +43% -587 -54% -19 -1%
Chronically Homeless Family
-1,503 -55% +28 +42% +92 +99% -238 -73% -336 -58% -81 -39% -402 -59% -98 -48% -468 -81%
Substance Abuse +1,403 +9% +2,312 +971% +1,335 +109% -489 -26% -851 -23% +200 +17% +725 +26% -1,061 -61% -768 -28%
Mentally Ill +1,399 +9% +2,000 +697% +754 +46% -124 -8% -1,462 -33% -300 -18% +314 +10% -599 -47% +816 +79%
Veterans -1,883 -23% +736 +818% +346 +62% +152 +40% -440 -27% -458 -46% +197 +18% -580 -68% -1,836 -73% Persons with HIV/AIDS
-593 -54% +47 +336% -78 -52% -61 -58% -525 -83% +22 +88% -12 -11% +18 +300% -4 -7%
Survivors of Domestic Violence
+217 +5% +407 +193% +442 +180% -281 -40% -110 -10% +137 +47% +131 +16% -343 -61% -166 -24%
Physical Disability -203 -2% +1,137 +795% +166 +13% +84 +11% -275 -13% -220 -20% +16 +1% -1,127 -72% +16 +2%
Excludes cities of Long Beach, Pasadena and Glendale

2013 Greater Los Angeles Homeless Count Key Findings – Service Planning Areas Homelessness by Subpopulation
15
Comparison of Service Planning Area (SPA) Homeless Subpopulation Totals, 2011 vs. 2013
LA CoC Overall
SPA 1 SPA 2 SPA 3 SPA 4 SPA 5 SPA 6 SPA 7 SPA 8
Antelope Valley
San Fernando Valley
San Gabriel Valley
Metro LA West LA South LA East LA County South Bay
2011 2013 2011 2013 2011 2013 2011 2013 2011 2013 2011 2013 2011 2013 2011 2013 2011 2013
Chronically Homeless Individual
10,901 13,613 209 2,176 1,489 2,085 1,149 1,147 2,175 2,092 1,076 1,029 2,073 2,960 1,078 491 1,652 1,633
Chronically Homeless Family Members
2,730 1,227 67 95 93 185 324 86 578 242 207 126 679 277 203 105 579 111
Substance Abuse 15,489 16,892 238 2,550 1,228 2,563 1,849 1,360 3,691 2,840 1,169 1,369 2,803 3,528 1,734 673 2,777 2,009
Mentally Ill 14,830 16,229 287 2,287 1,643 2,397 1,472 1,348 4,419 2,957 1,670 1,370 3,023 3,337 1,283 684 1,033 1,849
Veterans 8,131 6,248 90 826 554 900 381 533 1,656 1,216 1,004 546 1,069 1,266 856 276 2,521 685
Persons with HIV/AIDS 1,104 511 14 61 149 71 106 45 634 109 25 47 113 101 6 24 57 53
Survivors of Domestic Violence
4,610 4,827 211 618 245 687 697 416 1,078 968 292 429 841 972 561 218 685 519
Physical Disability 9,993 9,790 143 1,280 1,239 1,405 754 838 2,199 1,924 1,080 860 1,964 1,980 1,563 436 1,051 1,067
Comparison of Service Planning Area (SPA) Distribution by Homeless Subpopulations, 2011 vs. 2013
LA CoC Overall
SPA 1 SPA 2 SPA 3 SPA 4 SPA 5 SPA 6 SPA 7 SPA 8
Antelope Valley
San Fernando Valley
San Gabriel Valley
Metro LA West LA South LA East LA County South Bay
2011 2013 2011 2013 2011 2013 2011 2013 2011 2013 2011 2013 2011 2013 2011 2013 2011 2013
Chronically Homeless Individual
100% 100% 1.9% 16.0% 13.7% 15.3% 10.5% 8.4% 20.0% 15.4% 9.9% 7.6% 19.0% 21.7% 9.9% 3.6% 15.2% 12.0%
Chronically Homeless Family Members
100% 100% 2.5% 7.7% 3.4% 15.1% 11.9% 7.0% 21.2% 19.7% 7.6% 10.3% 24.9% 22.6% 7.4% 8.6% 21.2% 9.0%
Substance Abuse 100% 100% 1.5% 15.1% 7.9% 15.2% 11.9% 8.1% 23.8% 16.8% 7.5% 8.1% 18.1% 20.9% 11.2% 4.0% 17.9% 11.9%
Mentally Ill 100% 100% 1.9% 14.1% 11.1% 14.8% 9.9% 8.3% 29.8% 18.2% 11.3% 8.4% 20.4% 20.6% 8.7% 4.2% 7.0% 11.4%
Veterans 100% 100% 1.1% 13.2% 6.8% 14.4% 4.7% 8.5% 20.4% 19.5% 12.3% 8.7% 13.1% 20.3% 10.5% 4.4% 31.0% 11.0%
Persons with HIV/AIDS 100% 100% 1.3% 11.9% 13.5% 13.9% 9.6% 8.8% 57.4% 21.3% 2.3% 9.2% 10.2% 19.8% 0.5% 4.7% 5.2% 10.4%
Survivors of Domestic Violence
100% 100% 4.6% 12.8% 5.3% 14.2% 15.1% 8.6% 23.4% 20.1% 6.3% 8.9% 18.2% 20.1% 12.2% 4.5% 14.9% 10.8%
Physical Disability 100% 100% 1.4% 13.1% 12.4% 14.4% 7.5% 8.6% 22.0% 19.7% 10.8% 8.8% 19.8% 20.2% 15.6% 4.5% 10.5% 10.9%
Excludes cities of Long Beach, Pasadena and Glendale
2013 Greater Los Angeles Homeless Count Key Findings – Service Planning Areas Homelessness by Subpopulation
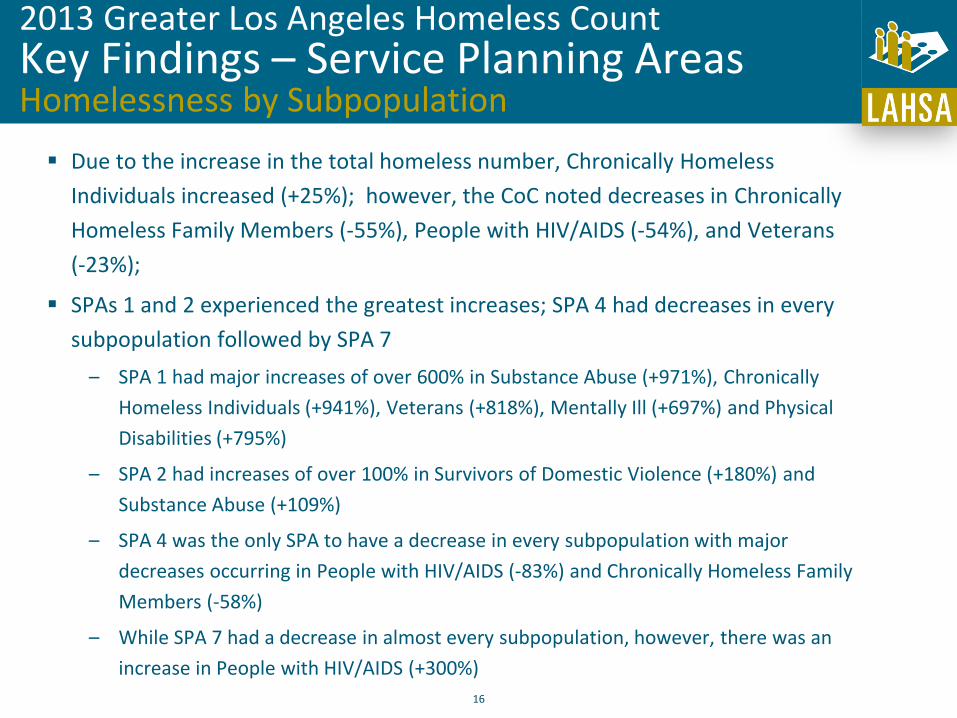
Due to the increase in the total homeless number, Chronically Homeless
Individuals increased (+25%); however, the CoC noted decreases in Chronically
Homeless Family Members (-55%), People with HIV/AIDS (-54%), and Veterans
(-23%);
SPAs 1 and 2 experienced the greatest increases; SPA 4 had decreases in every
subpopulation followed by SPA 7
– SPA 1 had major increases of over 600% in Substance Abuse (+971%), Chronically
Homeless Individuals (+941%), Veterans (+818%), Mentally Ill (+697%) and Physical
Disabilities (+795%)
– SPA 2 had increases of over 100% in Survivors of Domestic Violence (+180%) and
Substance Abuse (+109%)
– SPA 4 was the only SPA to have a decrease in every subpopulation with major
decreases occurring in People with HIV/AIDS (-83%) and Chronically Homeless Family
Members (-58%)
– While SPA 7 had a decrease in almost every subpopulation, however, there was an
increase in People with HIV/AIDS (+300%)
16

2013 Greater Los Angeles Homeless Count Key Findings – Supervisorial Districts Homelessness Population Totals
17
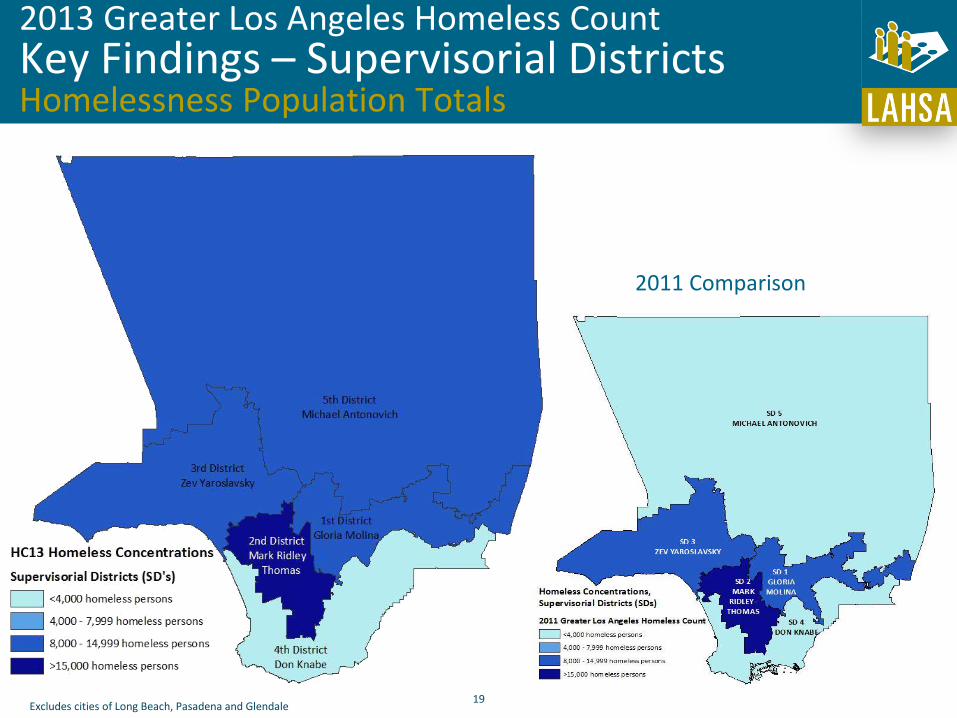
Total Homeless Counts, including the Shelter, Street and Hidden Homeless numbers:
– SD 5 reflected the largest increase, followed by SD 3 and SD 4 with +216%, +53% and +44%,
respectively; there were decreases in SD 1 and SD 2 with -28% and -7%
When looking at the Shelter and Street Count numbers only, SD 5, SD 3, and SD 1
reflected increases of +51%, +19%, +8%, respectively, and SD 4 and SD 2 reflected
decreases of -15% and -10%, respectively
Changes in Supervisorial District (SD) Homeless Populations, 2011 - 2013
2013 2011 2011 - 2013
Total Homeless
Hidden Homeless
Shelter & Street
Count Only
Total Homeless
Hidden Homeless
Shelter & Street
Count Only
Changes in Total Homeless
Changes in Shelter & Street Count Only
LA CoC Overall
53,798 18,274 35,524 45,422 10,800 34,622 +8,376 +18% +902 +3%
SD 1 8,063 0 8,063 11,269 3830 7,439 -3,206 -28% +624 +8%
SD 2 17,976 5,309 12,667 19,380 4,529 14,851 -1,404 -7% -2,184 -15%
SD 3 12,319 3,948 8,371 8,048 1,007 7,041 +4,271 +53% +1,330 +19%
SD 4 4,840 2524 2,316 3,372 809 2,563 +1,468 +44% -247 -10%
SD 5 10,600 6,493 4,107 3,353 625 2,728 +7,247 +216% +1,379 +51%
Excludes cities of Long Beach, Pasadena and Glendale

2013 Greater Los Angeles Homeless Count Key Findings – Supervisorial Districts Homelessness by Household Type
18
Comparison of Supervisorial District (SD) Geographic Distribution of Homeless Households, 2011 vs. 2013 Total Single Adults Family Members Unaccompanied Youth (<18)
2011 2013 2011 2013 2011 2013 2011 2013
SD 1 11,269 8,063 9,186 25.7% 6,245 13.5% 2,053 22.3% 1,713 25.7% 30 8.2% 105 12.8%
SD 2 19,380 17,976 14,740 41.1% 15,289 33.0% 4,484 48.6% 2,372 35.5% 156 42.6% 315 38.6%
SD 3 8,048 12,319 6,744 18.8% 10,758 23.2% 1,152 12.5% 1,242 18.6% 152 41.5% 319 39.0%
SD 4 3,372 4,840 2,695 7.5% 4,292 9.3% 661 7.2% 535 8.0% 16 4.4% 13 1.6%
SD 5 3,353 10,600 2,473 6.9% 9,719 21.0% 868 9.4% 816 12.2% 12 3.3% 65 8.0%
LA CoC Total
45,422 53,798 35,838 100% 46,303 100% 9,218 100% 6,678 100% 366 100% 817 100%
Comparison of Supervisorial District (SD) Homelessness by Household Type, 2013 vs. 2011
2013 2011
Total Single Adults Family Members Unaccompanied
Youth (<18) Total Single Adults Family Members
Unaccompanied Youth (<18)
LA CoC Overall
53,798 46,303 86% 6,678 12% 817 2% 45,422 35,838 79% 9,218 20% 366 1%
SD 1 8,063 6,245 78% 1,713 21% 105 1% 11,269 9,186 81% 2,053 18% 30 <1%
SD 2 17,976 15,289 85% 2,372 13% 315 2% 19,380 14,740 76% 4,484 23% 156 1%
SD 3 12,319 10,758 87% 1,242 10% 319 3% 8,048 6,744 84% 1,152 14% 152 2%
SD 4 4,840 4,292 88% 535 11% 13 <1% 3,372 2,695 80% 661 19% 16 <1%
SD 5 10,600 9,719 92% 816 7% 65 1% 3,353 2,473 74% 868 25% 12 <1%
Excludes cities of Long Beach, Pasadena and Glendale
2013 Greater Los Angeles Homeless Count Key Findings – Supervisorial Districts Homelessness Population Totals
19
2011 Comparison
Excludes cities of Long Beach, Pasadena and Glendale

2013 Greater Los Angeles Homeless Count Key Findings – Supervisorial Districts Single Adult Homelessness
20 Excludes cities of Long Beach, Pasadena and Glendale

2013 Greater Los Angeles Homeless Count Key Findings – Supervisorial Districts Family Homelessness
21 Excludes cities of Long Beach, Pasadena and Glendale

2013 Greater Los Angeles Homeless Count Key Findings – Supervisorial Districts Unaccompanied Youth Homelessness
22
For the purposes of HUD
reporting, CoCs must be able
to report separately on
Unaccompanied Youth,
homeless children who are
under age 18.
Defining youth as under age
18 allows HUD to use the
same definition for all
reporting related to homeless
programs. Transition Age
Youth (TAY), or youth
between ages 18-24, are
counted as part of the Single
Adult population.
Excludes cities of Long Beach, Pasadena and Glendale
2013 Greater Los Angeles Homeless Count Key Findings – Supervisorial Districts Homelessness by Household Type
23
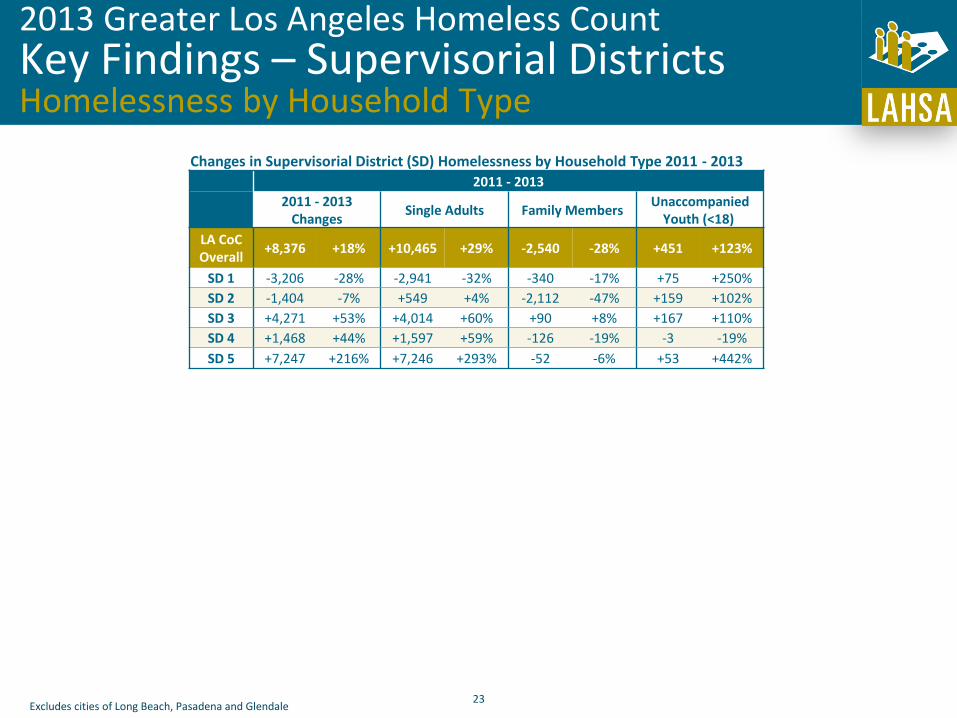
Changes in Supervisorial District (SD) Homelessness by Household Type 2011 - 2013
2011 - 2013
2011 - 2013
Changes Single Adults Family Members
Unaccompanied Youth (<18)
LA CoC Overall
+8,376 +18% +10,465 +29% -2,540 -28% +451 +123%
SD 1 -3,206 -28% -2,941 -32% -340 -17% +75 +250%
SD 2 -1,404 -7% +549 +4% -2,112 -47% +159 +102%
SD 3 +4,271 +53% +4,014 +60% +90 +8% +167 +110%
SD 4 +1,468 +44% +1,597 +59% -126 -19% -3 -19%
SD 5 +7,247 +216% +7,246 +293% -52 -6% +53 +442%
Excludes cities of Long Beach, Pasadena and Glendale

2013 Greater Los Angeles Homeless Count Key Findings – Supervisorial Districts Homelessness by Household Type
The Los Angeles CoC had an overall increase in homelessness
(+18%); there were increases in 3 of the 5 SDs with the
biggest increase in homelessness in SD 5 (+216%) and largest
decreases in SDs 1 (-28%) and 2 (-7%)
– Single Adults increased in every SD except for SD 1 (-32%), with SD 5
having the biggest increase (+293%)
– Family Members decreased in every SD except for SD 3 (+8%);
biggest decrease was in SD 2 (-47%)
– Unaccompanied Youth increased in 4 of the 5 SDs with the biggest
increases occurring in SD 5 (+442%) and SD 2 (+250%). SD 4 is the
only SD with a decrease (-19%)
24
25 Excludes cities of Long Beach, Pasadena and Glendale
2013 Greater Los Angeles Homeless Count Key Findings – Supervisorial Districts Homelessness by Shelter Type
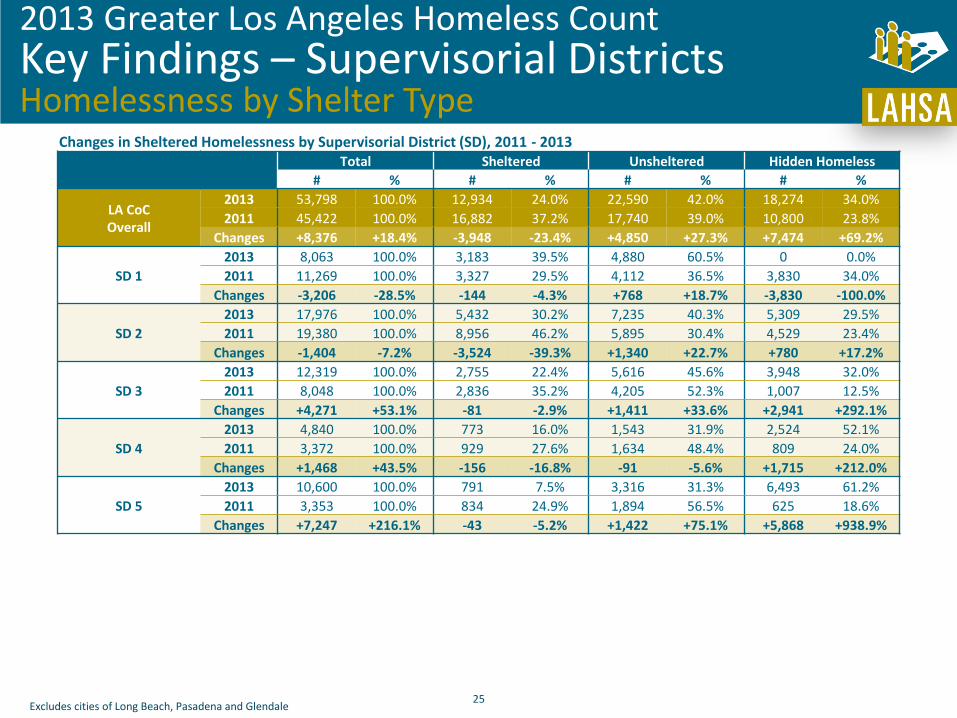
Changes in Sheltered Homelessness by Supervisorial District (SD), 2011 - 2013
Total Sheltered Unsheltered Hidden Homeless
# % # % # % # %
LA CoC Overall
2013 53,798 100.0% 12,934 24.0% 22,590 42.0% 18,274 34.0%
2011 45,422 100.0% 16,882 37.2% 17,740 39.0% 10,800 23.8%
Changes +8,376 +18.4% -3,948 -23.4% +4,850 +27.3% +7,474 +69.2%
SD 1
2013 8,063 100.0% 3,183 39.5% 4,880 60.5% 0 0.0%
2011 11,269 100.0% 3,327 29.5% 4,112 36.5% 3,830 34.0%
Changes -3,206 -28.5% -144 -4.3% +768 +18.7% -3,830 -100.0%
SD 2
2013 17,976 100.0% 5,432 30.2% 7,235 40.3% 5,309 29.5%
2011 19,380 100.0% 8,956 46.2% 5,895 30.4% 4,529 23.4%
Changes -1,404 -7.2% -3,524 -39.3% +1,340 +22.7% +780 +17.2%
SD 3
2013 12,319 100.0% 2,755 22.4% 5,616 45.6% 3,948 32.0%
2011 8,048 100.0% 2,836 35.2% 4,205 52.3% 1,007 12.5%
Changes +4,271 +53.1% -81 -2.9% +1,411 +33.6% +2,941 +292.1%
SD 4
2013 4,840 100.0% 773 16.0% 1,543 31.9% 2,524 52.1%
2011 3,372 100.0% 929 27.6% 1,634 48.4% 809 24.0%
Changes +1,468 +43.5% -156 -16.8% -91 -5.6% +1,715 +212.0%
SD 5
2013 10,600 100.0% 791 7.5% 3,316 31.3% 6,493 61.2%
2011 3,353 100.0% 834 24.9% 1,894 56.5% 625 18.6%
Changes +7,247 +216.1% -43 -5.2% +1,422 +75.1% +5,868 +938.9%

2013 Greater Los Angeles Homeless Count Key Findings – Supervisorial Districts Homelessness by Age
26
Comparison of Supervisorial District (SD) Homelessness Age Totals, 2011 vs. 2013
2013 2011
LA CoC Overall
SD 1 SD 2 SD 3 SD 4 SD 5
LA CoC Overall
SD 1 SD 2 SD 3 SD 4 SD 5
Gloria Molina
Mark Ridley-Thomas
Zev Yaroslavsky
Don Knabe Michael D. Antonovich
Gloria Molina
Mark Ridley-Thomas
Zev Yaroslavsky
Don Knabe Michael D. Antonovich
Under 18 4,667 1,087 1,713 990 327 550 6,107 1,309 3,010 829 399 560
18-24 4,046 619 1,389 931 354 753 3,432 941 1,087 945 362 97
25-54 33,043 4,663 10,908 7,621 3,046 6,805 26,353 6,801 11,256 4,353 1,835 2,108
55-61 7,570 1,074 2,504 1,745 696 1,551 6,249 1,350 2,834 1,237 554 274
62 & Older 4,472 620 1,462 1,032 417 941 3,281 868 1,193 684 222 314
Total 53,798 8,063 17,976 12,319 4,840 10,600 45,422 11,269 19,380 8,048 3,372 3,353
Comparison of Supervisorial District (SD) Homelessness Age Prevalence Rates, 2011 vs. 2013
LA CoC Overall
SD 1 SD 2 SD 3 SD 4 SD 5
Gloria Molina Mark Ridley-Thomas Zev Yaroslavsky Don Knabe Michael D. Antonovich
2011 2013 2011 2013 2011 2013 2011 2013 2011 2013 2011 2013
Under 18 13.4% 8.7% 11.6% 13.5% 15.5% 9.6% 10.3% 8.0% 11.8% 6.8% 16.7% 5.2%
18-24 7.6% 7.5% 8.3% 7.7% 5.6% 7.7% 11.7% 7.5% 10.8% 7.3% 2.9% 7.1%
25-54 58.0% 61.4% 60.4% 57.8% 58.1% 60.7% 54.1% 61.9% 54.4% 62.9% 62.8% 64.2%
55-61 13.8% 14.1% 12.0% 13.3% 14.6% 13.9% 15.4% 14.2% 16.4% 14.4% 8.2% 14.6%
62 & Older 7.2% 8.3% 7.7% 7.7% 6.2% 8.1% 8.5% 8.4% 6.6% 8.6% 9.4% 8.9%
Excludes cities of Long Beach, Pasadena and Glendale

2013 Greater Los Angeles Homeless Count Key Findings – Supervisorial Districts Homelessness by Age
27
Overall, our homeless population is getting older. SD 1 had decreases in all of its age
groups. SD 2 had the biggest decrease in those under 18 (-43%), and increases in
the TAY population (+28%) and 62 and older (+23%); SD 3 had big increases in every
age category except for the TAY population; SD 4 had increases in those 25 and
older but decreases in those 24 and younger; SD 5 had significant increases in every
age category except for those under 18
Changes in Supervisorial District (SD) Homelessness Age Totals, 2011 - 2013
LA CoC Overall
SD 1 SD 2 SD 3 SD 4 SD 5
Gloria Molina Mark Ridley-Thomas Zev Yaroslavsky Don Knabe Michael D. Antonovich
# % # % # % # % # % # %
Under 18 -1,440 -24% -222 -17% -1,297 -43% +161 +19% -72 -18% -10 -2%
18-24 +614 +18% -322 -34% +302 +28% -14 -1% -8 -2% +656 +676%
25-54 +6,690 +25% -2,138 -31% -348 -3% +3,268 +75% +1,211 +66% +4,697 +223%
55-61 +1,321 +21% -276 -20% -330 -12% +508 +41% +142 +26% +1,277 +466%
62 & Older +1,191 +36% -248 -29% +269 +23% +348 +51% +195 +88% +627 +200%
Total +8,376 +18% -3,206 -28% -1,404 -7% +4,271 +53% +1,468 +44% +7,247 +216%
Excludes cities of Long Beach, Pasadena and Glendale

2013 Greater Los Angeles Homeless Count Key Findings – Supervisorial Districts Homelessness by Subpopulation
28
Comparison of Supervisorial District (SD) Homeless Subpopulation Totals, 2011 vs. 2013
LA CoC Overall
SD 1 SD 2 SD 3 SD 4 SD 5
Gloria Molina Mark Ridley-Thomas Zev Yaroslavsky Don Knabe Michael D. Antonovich
2011 2013 2011 2013 2011 2013 2011 2013 2011 2013 2011 2013
Chronically Homeless Individual
10,901 24% 13,613 25% 2,289 20% 1,725 21% 4,419 23% 4,225 24% 2,205 27% 3,124 25% 1,055 31% 1,350 28% 933 28% 3,189 30%
Chronically Homeless Family Members
2,730 6% 1,227 2% 819 7% 259 3% 1,348 7% 462 3% 169 2% 224 2% 259 8% 108 2% 135 4% 174 2%
Substance Abuse 15,489 34% 16,892 31% 3,963 35% 2,204 27% 6,918 36% 5,375 30% 2,556 32% 3,905 32% 1,210 36% 1,628 34% 842 25% 3,780 36%
Mentally Ill 14,830 33% 16,229 30% 4,216 37% 2,246 28% 6,140 32% 5,307 30% 3,108 39% 3,745 30% 628 19% 1,514 31% 738 22% 3,417 32%
Veterans 8,131 18% 6,248 12% 1,020 9% 908 11% 3,788 20% 2,092 12% 2,073 26% 1,440 12% 865 26% 566 12% 385 11% 1,242 12%
Persons with HIV/AIDs
1,104 2% 511 1% 318 3% 80 1% 467 2% 177 1% 273 3% 117 1% 0 0% 44 1% 46 1% 93 1%
Survivors of Domestic Violence
4,610 10% 4,827 9% 1,703 15% 717 9% 1,605 8% 1,634 9% 694 9% 1,111 9% 329 10% 431 9% 279 8% 934 9%
Physical Disability 9,993 22% 9,790 18% 2,527 22% 1,433 18% 3,931 20% 3,289 18% 2,008 25% 2,256 18% 873 26% 882 18% 654 20% 1,930 18%
Excludes cities of Long Beach, Pasadena and Glendale

2013 Greater Los Angeles Homeless Count Key Findings – Supervisorial Districts Homelessness by Subpopulation
29
Comparison of Supervisorial District (SD) Homeless Subpopulation Totals, 2011 vs. 2013
2013 2011
LA CoC Overall
SD 1 SD 2 SD 3 SD 4 SD 5
LA CoC Total
SD 1 SD 2 SD 3 SD 4 SD 5
Gloria Molina
Mark Ridley-Thomas
Zev Yaroslavsky
Don Knabe
Michael D. Antonovich
Gloria Molina
Mark Ridley-Thomas
Zev Yaroslavsky
Don Knabe
Michael D. Antonovich
Chronically Homeless Individual
13,613 1,725 4,225 3,124 1,350 3,189 10,901 2,289 4,419 2,205 1,055 933
Chronically Homeless Family Members
1,227 259 462 224 108 174 2,730 819 1,348 169 259 135
Substance Abuse 16,892 2,204 5,375 3,905 1,628 3,780 15,489 3,963 6,918 2,556 1,210 842
Mentally Ill 16,229 2,246 5,307 3,745 1,514 3,417 14,830 4,216 6,140 3,108 628 738
Veterans 6,248 908 2,092 1,440 566 1,242 8,131 1,020 3,788 2,073 865 385
Persons with HIV/AIDS 511 80 177 117 44 93 1,104 318 467 273 0 46
Survivors of Domestic Violence
4,827 717 1,634 1,111 431 934 4,610 1,703 1,605 694 329 279
Physical Disability 9,790 1,433 3,289 2,256 882 1,930 9,993 2,527 3,931 2,008 873 654
Changes in Supervisorial District (SD) Homeless Subpopulation Totals, 2011 - 2013
LA CoC Overall
SD 1 SD 2 SD 3 SD 4 SD 5
Gloria Molina Mark Ridley-Thomas Zev Yaroslavsky Don Knabe Michael D. Antonovich
# % # % # % # % # % # %
Chronically Homeless Individual
+2,712 +25% -564 -25% -194 -4% +919 +42% +295 +28% +2,256 +242%
Chronically Homeless Family Members
-1,503 -55% -560 -68% -886 -66% +55 +33% -151 -58% +39 +29%
Substance Abuse +1,403 +9% -1,759 -44% -1,543 -22% +1,349 +53% +418 +35% +2,938 +349%
Mentally Ill +1,399 +9% -1,970 -47% -833 -14% +637 +20% +886 +141% +2,679 +363%
Veterans -1,883 -23% -112 -11% -1,696 -45% -633 -31% -299 -35% +857 +223%
Persons with HIV/AIDS -593 -54% -238 -75% -290 -62% -156 -57% +44 - +47 +102%
Survivors of Domestic Violence
+217 +5% -986 -58% +29 +2% +417 +60% +102 +31% +655 +235%
Physical Disability -203 -2% -1,094 -43% -642 -16% +248 +12% +9 +1% +1,276 +195%
Excludes cities of Long Beach, Pasadena and Glendale

2013 Greater Los Angeles Homeless Count Key Findings – Supervisorial Districts Homelessness by Subpopulation
30
Comparison of Supervisorial District (SD) Homeless Subpopulations Distribution, 2011 vs. 2013
LA CoC Overall
SD 1 SD 2 SD 3 SD 4 SD 5
Gloria Molina Mark Ridley-Thomas Zev Yaroslavsky Don Knabe Michael D. Antonovich
2011 2013 2011 2013 2011 2013 2011 2013 2011 2013 2011 2013
Chronically Homeless Individual
10,901 100% 13,613 100% 2,289 21% 1,725 13% 4,419 41% 4,225 31% 2,205 20% 3,124 23% 1,055 10% 1,350 10% 933 9% 3,189 23%
Chronically Homeless Family Members
2,730 100% 1,227 100% 819 30% 259 21% 1,348 49% 462 38% 169 6% 224 18% 259 9% 108 9% 135 5% 174 14%
Substance Abuse 15,489 100% 16,892 100% 3,963 26% 2,204 13% 6,918 45% 5,375 32% 2,556 17% 3,905 23% 1,210 8% 1,628 10% 842 5% 3,780 22%
Mentally Ill 14,830 100% 16,229 100% 4,216 28% 2,246 14% 6,140 41% 5,307 33% 3,108 21% 3,745 23% 628 4% 1,514 9% 738 5% 3,417 21%
Veterans 8,131 100% 6,248 100% 1,020 13% 908 15% 3,788 47% 2,092 33% 2,073 25% 1,440 23% 865 11% 566 9% 385 5% 1,242 20%
Persons with HIV/AIDS
1,104 100% 511 100% 318 29% 80 16% 467 42% 177 35% 273 25% 117 23% 0 0% 44 9% 46 4% 93 18%
Survivors of Domestic Violence
4,610 100% 4,827 100% 1,703 37% 717 15% 1,605 35% 1,634 34% 694 15% 1,111 23% 329 7% 431 9% 279 6% 934 19%
Physical Disability 9,993 100% 9,790 100% 2,527 25% 1,433 15% 3,931 39% 3,289 34% 2,008 20% 2,256 23% 873 9% 882 9% 654 7% 1,930 20%
Excludes cities of Long Beach, Pasadena and Glendale

2013 Greater Los Angeles Homeless Count Key Findings – Supervisorial Districts Homelessness by Subpopulation
The Los Angeles CoC had increases in Chronically Homeless Individuals (+25%) and
decreases in Veterans (-23%), People with HIV/AIDS (-54%), and Chronically
Homeless Family Members (-55%); SD 1 had decreases in every subpopulation
followed by SD 2, while SD 3 and SD 5 both had major increases in every
subpopulation
– SD 1 had decreases in every category with People with HIV/AIDS (-75%), Chronically
Homeless Family Members (-68%), and Survivors of Domestic Violence (-58%)
– SD 2 had big decreases in Chronically Homeless Family Members (-66%) and People
with HIV/AIDS (-62%),
– SD 3 had increases in every category with the largest increases in Survivors of
Domestic Violence (+60%), Substance Abuse (+53%) and Chronically Homeless
Individuals (+42%)
– SD 5 had major increases of over 200% in Veterans (+223%), Survivors of Domestic
Violence (+235%), Chronically Homeless Individuals (+242%) , Substance Abuse
(+349%) and Mentally Ill (+363%)
31