2013-14 FACT BOOK 2013-2014 Just the Facts · PDF file2013-14 FACT BOOK2013-2014 Just the...
32
2013-2014 Just the Facts
-
Upload
phunghuong -
Category
Documents
-
view
221 -
download
7
Transcript of 2013-14 FACT BOOK 2013-2014 Just the Facts · PDF file2013-14 FACT BOOK2013-2014 Just the...

2013-14 FACT BOOK2013-2014 Just the Facts

UWG Fast Facts
• Fall2013enrollmentwas11,929.
• 84%ofundergraduatestudentsand35%ofgraduatestudentsareenrolledfull-time.
• 14%areCarrollCountyresidents.
• 94%areGeorgiaresidents.
• 3%areout-of-state.
• 3%arefromforeigncountries.
• 64%arefemale.
• 56%areCaucasianstudents.
• 31%ofundergraduatesliveinuniversityhousing.
• 84%ofalumniresideinGeorgia.(excludingunknown,deceased,andinforeigncountries).
• UWGhas549instructionalfacultyofwhich73%arefull-time.
• InFY2013,UWG’seconomicimpactwas$456,000,000.
1

2
Composition of UWG Student Body - Fall 2012 and 2013
Notes: Other category includes transients students. New Transfers category includes freshman, sophomore, juniors, and seniors. Beginning fall 2013, students receiving veterans benefits are separated to reflect both the veteran and their families.
Source: Offices of the Registrar and Institutional Effectiveness and Assessment
Composition of UWG Student Body
N
on-H
ispa
nic
Fall FallClassification 2012 2013Joint Enrolled 117 129Freshman 3,467 3,477Sophomore 2,162 2,279Junior 1,915 1,882Senior 2,243 2,137Graduate 1,806 1,970Other 59 55
Total Enrollment 11,769 11,929
New Students Beginning Freshman 1,952 2,121Transfers 692 677Graduate Students 487 489Joint Enrolled/ Others 135 99
Total 3,266 3,416
Gender Female 7,376 7,675Male 4,393 4,254
Students Receiving Veterans Benefits Veterans 141Others receiving benefits 165
Total 420 306
Fall FallAttendance Status 2012 2013Full-time Undergraduate 8,178 8,369Full-time Graduate 636 698
Total 8,814 9,067
Part-time Undergraduate 1,785 1,590Part-time Graduate 1,170 1,272
Total 2,955 2,862
DiversityHispanic 470 484
American Indian/ Alaskan Native 26 23 Asian 200 165 African/Black 3,692 4,002 Native Hawaiian/ 10 12 Pacific Islander Caucasian/White 6,755 6,719 Two or More Races 372 347
Not Reported 244 177
3
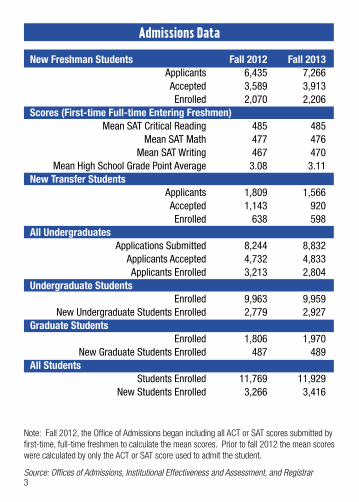
Admissions Data
New Freshman Students Fall 2012 Fall 2013 Applicants 6,435 7,266 Accepted 3,589 3,913 Enrolled 2,070 2,206Scores (First-time Full-time Entering Freshmen) Mean SAT Critical Reading 485 485 Mean SAT Math 477 476 Mean SAT Writing 467 470 Mean High School Grade Point Average 3.08 3.11New Transfer Students Applicants 1,809 1,566 Accepted 1,143 920 Enrolled 638 598All Undergraduates Applications Submitted 8,244 8,832 Applicants Accepted 4,732 4,833 Applicants Enrolled 3,213 2,804Undergraduate Students Enrolled 9,963 9,959 New Undergraduate Students Enrolled 2,779 2,927Graduate Students Enrolled 1,806 1,970 New Graduate Students Enrolled 487 489All Students
Students Enrolled 11,769 11,929 New Students Enrolled 3,266 3,416
Note: Fall 2012, the Office of Admissions began including all ACT or SAT scores submitted by first-time, full-time freshmen to calculate the mean scores. Prior to fall 2012 the mean scores were calculated by only the ACT or SAT score used to admit the student.
Source: Offices of Admissions, Institutional Effectiveness and Assessment, and Registrar

4
Geographic Origin of Enrolled Students by ClassificationFall 2013
Undergraduate Top Five Counties Graduateexcluding Carroll County
Coweta Cobb Douglas Fulton Cobb Coweta Fulton Douglas Dekalb Dekalb
Top Five Statesexcluding Georgia
Alabama Alabama Florida Florida California North Carolina New York Tennessee Tennessee South Carolina
Top Five Countries excluding the United States
China India Nigeria Nigeria Jamaica Canada Canada Trinidad and Tobago Kenya Russia

5
Geographic Origin of Enrolled Students by Georgia CountyFall 2013
Service Area Service Area (cont.)Counties Undergraduate Graduate Total Counties Undergraduate Graduate TotalBartow 88 20 108 Paulding 322 87 409Butts 17 1 18 Pickens 8 2 10Carroll 1,382 267 1,649 Pike 5 5 10Catoosa 31 12 43 Polk 81 19 100Chattooga 33 5 38 Rockdale 131 14 145Cherokee 118 19 137 Spalding 55 13 68Coweta 991 151 1,142 Talbot 5 - 5Dade 4 3 7 Troup 185 21 206Dawson 10 2 12 Upson 24 2 26Douglas 828 123 951 Walker 55 8 63Fannin 2 3 5 Whitfield 63 10 73Fayette 401 78 479 Total 6,094 1,037 7,131Floyd 137 33 170 Forsyth 88 4 92 Five County Metro AreaGilmer 4 2 6 Counties Undergraduate Graduate TotalGordon 58 12 70 Clayton 252 44 296Haralson 262 23 285 Cobb 656 184 840Harris 29 7 36 Dekalb 567 97 664Heard 82 4 86 Fulton 614 156 770Henry 339 37 376 Gwinnett 543 54 597Lamar 7 1 8 Total 2,632 535 3,167Meriwether 36 6 42 Monroe 9 1 10 Undergraduate Graduate TotalMurray 15 4 19 Other Georgia Muscogee 71 21 92 Counties 705 151 856Newton 118 17 135
Source: Institutional Effectiveness and Assessment

6
Geographic Origin of Enrolled Students by State Fall 2013
State Undergraduate Graduate Total
Alabama 69 25 94Arizona 5 - 5Arkansas 1 2 3California 12 9 21Colorado 3 1 4Connecticut 1 4 5Florida 21 16 37Georgia 9,431 1,723 11,154Hawaii 1 - 1Idaho 1 - 1Illinois 8 5 13Indiana 3 5 8Iowa 1 1 2Kansas 1 - 1Kentucky 2 2 4Louisiana 3 3 6Maryland 6 5 11Massachusetts 1 3 4Michigan 6 5 11Minnesota 5 3 8Mississippi 4 5 9Missouri 4 2 6Nebraska 1 - 1Nevada 1 - 1
New Hampshire 1 1 2New Jersey 5 - 5New York 11 7 18North Carolina 5 15 20Ohio 6 5 11Oklahoma - 1 1Oregon - 1 1Pennsylvania 4 5 9Puerto Rico* 1 - 1Rhode Island 2 - 2South Carolina 5 13 18South Dakota 1 - 1Tennessee 11 15 26Texas 5 5 10Utah - 4 4Virgin Islands* 1 - 1Virginia 10 2 12Washington 2 3 5Wisconsin 3 1 4 Total 9,664 1,897 11,561
Undergraduate Graduate TotalOut of the Country 293 73 366Overseas Military 2 - 2
* US Territory
State Undergraduate Graduate Total

7
Geographic Origin of Enrolled Students by Country Fall 2013Country Undergraduate Graduate Total
Antigua and Barbuda 2 - 2Argentina - 1 1Australia 5 - 5Azerbaijan 1 - 1Bahamas 1 1 2Bangladesh 1 - 1Bermuda - 1 1Brazil 3 1 4Burundi 1 - 1Cameroon 10 - 10Canada 16 5 21Cayman Islands 1 - 1Central African Republic 1 - 1Chile - 1 1China 52 2 54Columbia 3 1 4Comoros - 1 1Cote D’lvoire 1 1 2Cuba 1 - 1Dominican Republic 1 - 1East Timor - 1 1Ecuador 1 - 1Egypt - 1 1El Salvador 1 - 1Eritrea - 1 1Ethiopia 4 1 5Finland 2 - 2France 8 - 8Gabon 1 2 3Gambia 1 - 1Germany 11 1 12Ghana 9 2 11Guatemala 2 - 2Guinea 1 1 2Haiti 6 - 6India 11 8 19Iran - 3 3Jamaica 23 3 26

8
Jersey 1 - 1Kenya 13 1 14Korea, Republic of 8 - 8Lebanon 1 - 1Liberia 3 - 3Mexico 7 1 8Nepal - 1 1New Zealand - 1 1Nicaragua 2 1 3Niger - 1 1Nigeria 33 5 38Norway 1 1 2Pakistan - 2 2Peru 1 - 1Poland 3 - 3Romania 1 1 2Russia 4 3 7Sierra Leone 1 - 1South Africa 1 2 3Spain 5 1 6Sri Lanka 2 - 2Sweden 1 - 1Syria 1 - 1Taiwan 1 - 1Tanzania 1 - 1Thailand 1 1 2Trinidad and Tobago 1 4 5Turkey - 2 2Uganda - 1 1United Kingdom 9 - 9United States of America 9,666 1,897 11,563Uruguay - 1 1Venezuela 4 4Yemen 2 2 4Zambia 2 - 2Zimbabwe 2 2 4
Total 9,959 1,970 11,929
Geographic Origin of Enrolled Students by Country Fall 2013Country Undergraduate Graduate Total
Source: Institutional Effectiveness and Assessment

9
Total Student Credit Hours by Level 2013-2014 Undergraduate Graduate Total
Summer 2013 24,414 7,516 31,930
Fall 2013 129,649 13,201 142,850
Spring 2014 120,078 12,786 132,864
FY Total 274,141 33,503 307,644
Total Full-Time Equivalent (FTE) Summer 2013 1,959 842 2,801Fall 2013 9,376 1,469 10,846Spring 2014 8,670 1,363 10,033
FY Total 20,006 3,674 23,680
FTE definition: set by the Board of Regents (Total full-time undergraduate students taking 12 or more hours + total full-time graduate students taking 9 or more hours) + (Total part-time undergraduate credit hours/12 + total part-time graduate credit hours/9). Total rounded to the nearest whole number.
Total Student Credit Hours by College and Level 2013-2014College or Campus Undergraduate Graduate TotalArts and Humanities 70,094 1,361 71,455Business 39,075 3,273 42,348Education 27,550 21,650 49,200Nursing 8,505 1,806 10,311Science and Mathematics 69,424 1,773 71,197Social Sciences 57,046 3,115 60,161Newnan 6,745 579 7,324
UWG 1101, XIDS, and other interdisciplinary credit hours are attributed to individual colleges based on course instructor.
Source: Institutional Effectiveness and Assessment

10
Extended Learning
Extended Learning is responsible for the administration of UWG Online/Distance and Distributed education Evening/Weekend University, eCore, Continuing Education, and various off-campus instructional sites.
Headcount and Credit Hours Enrolled inOnline Courses by Delivery Method
Fall 2012 Fall 2013 Head Credit Head Credit Method Count Hours Count Hours
G - eCore 674 3,053 625 2,800D - 51-94% Distance 1,605 5,734 1,652 6,490N - 95% or more Distance 3,895 17,669 4,133 19,693Y - GeorgiaOnMyLine (GML) . . . Total - All. Methods 5,384 26,456 5,615 28,983
Note: Headcount is unduplicated and is as of census date.
Electronic core courses (eCore) enables the University System of Georgia students to complete the first two years of college courses entirely online, except to occasional proctored exams.
Source: Institutional Effectiveness and Assessment

11
Note: Distance courses (N) taught 95 percent or more online are not included.
Source: Off-Campus Course Report
Off Campus Site Profile
The Board of Regents, in August 1988, approved and established a West Georgia satellite campus in Newnan, Georgia offering degree and non-degree programs. In August 2002, as a cooperative effort between Georgia Highlands College and the University of West Georgia, the Board of Regents approved the External Degree Program which services students in the Floyd County area who wish to continue formal education beyond the associate degree.
Unduplicated Headcount and Credit Hours Enrolledby Off Campus Sites
No. of Credit HoursOff Campus Sites Courses Students Undergraduate Graduate Total
Summer 2013
Newnan, Georgia 29 275 1,168 111 1,279Middle Georgia 3 22 48 12 60Atlanta Area 10 113 0 448 448
Fall 2013Newnan, Georgia 45 449 3,142 273 3,415Middle Georgia 3 20 0 84 84North Georgia 11 34 460 0 460Atlanta Area 11 136 0 627 627

12
Student Financial AidFiscal Year 2012-2013
The Office of Financial Aid coordinates financial assistance for nearly seven-ty-three percent of West Georgia’s students. Its staff determines eligibility for aid awarded and records aid received from other sources, such as the West Georgia Foundation, corporations, and individuals. The Office coordinates and reports awards to the University System Board of Regents and the University.
Undergraduate Graduate No. of No. of Awards Amount Awards AmountLoans
Perkins 68 $114,025 4 $10,279 Ford Direct Stafford 7,188 $49,270,261 1,363 $17,185,321 PLUS 809 $6,658,311 16 $105,002 UWG Emergency 335 $187,061 73 $47,550 Private 266 $1,840,895 22 $139,479
Total 8,666 $58,070,553 1,478 $17,487,631Scholarships Institutional 676 $1,860,612 62 $92,695 Private 539 $778,453 38 $34,503 State 16 $40,500 - -
Total 1,231 $2,679,565 100 $127,198Grants Hope 3,481 $11,516,228 - - Pell 5,249 $20,811,558 - - SEOG 272 $191,364 - -
Total 9,002 $32,519,150 - -Federal Programs College Work Study 210 $291,797 3 $2,982 Americorps 3 $7,820 1 $2,212
Total 213 $299,617 4 $5,194 Grand Total 19,112 93,568,885 1,582 17,620,023
Note: Fiscal year (summer 2012, fall 2012, and spring 2013). Awards may represent duplicated headcount, some students received more than one type of financial aid.
Source: Financial Aid

13
Accreditations and Affiliations
The University of West Georgia is accredited by the Commission on Colleges of the Southern Association of Colleges and Schools to award baccalaureate, master, and doctorate degrees. For questions about accreditation of the University of West Georgia contact the Commission on Colleges at 1866 Southern Lane, Decatur, Georgia 30033-4097 or call 404-679-4501.
Accreditations also include the following:• The Association to Advance Collegiate Schools of Business
(International)
• CouncilforAccreditationofCounselingandRelatedEducationalPrograms
• Council on Academic Accreditation in Audiology and Speech-Language Pathology of the American Speech-Language Hearing Association
• Commission on Collegiate Nursing Education
• Computing Accreditation Commission of ABET
• National Association of Schools of Arts and Design
• National Association of Schools of Music
• National Association of Schools of Public Affairs and Administration
• National Association of Schools of Theatre
• National Council for Accreditation of Teacher Education
Organizations in which the University holds institutional membership include the American Council on Education, the American Association of State Colleges and Universities, the American Association of Colleges for Teacher Education, the Georgia Association of Colleges, and the National Association for Business Teacher Education, and the National Collegiate Honors Council.
Source: Institutional Effectiveness and Assessment

14
Degrees and Majors Offered Fall 2013
Bachelor of ArtsArtEnglishForeign Languages and LiteraturesGeographyGlobal StudiesHistoryInternational Economic AffairsMathematicsPhilosophyPolitical SciencePsychologyTheatre
Bachelor of Business AdministrationAccountingEconomicsFinanceManagementManagement Information SystemsMarketingReal Estate
Bachelor of Fine ArtsArt
Bachelor of MusicCompositionMusic EducationPerformance
Bachelor of ScienceAnthropologyBiologyComputer ScienceCriminologyEarth Science/Secondary EducationEconomicsEconomics/Secondary EducationEnvironmental ScienceEnvironmental StudiesGeographyGeologyMass CommunicationsMathematicsPhyscisPhysics/Secondary EducationPolitical ScienceSociologySport Management
Bachelor of Science in Chemistry
Bachelor of Science in EducationBusiness EducationEarly Childhood EducationPhysical EducationSecondary EducationSpeech-Language PathologySpecial Education
Bachelor of Science in Nursing
Bachelor of Science in Nursing, RN to BSN

15
Degrees and Majors Offered Fall 2013
Master of ArtsCriminologyEnglishHistoryPsychologySociology
Master of Arts in Teaching
Master of Business Administration
Master of EducationBusiness EducationEarly Childhood EducationEducational LeadershipMediaProfessional CounselingReading EducationSecondary EducationSpecial EducationSpeech-Language Pathology
Master of MusicMusic EducationPerformance
Master of Professional Accounting
Master of Public Administration
Master of ScienceApplied Computer ScienceBiologyMathematics
Master of Science in Nursing
Master of Urban and Regional Planning
Specialist in EducationBusiness EducationEarly Childhood EducationEducational LeadershipMediaProfessional CounselingSpecial Education
Doctor of EducationProfessional Counseling and SupervisionSchool ImprovementNursing Education (online)
Doctor of PhilosophyPsychology: Consciousness and Society
Post-Baccalaureate CertificateEuropean Union StudiesMuseum StudiesPublic ManagementPublic HistoryGeographic Information SystemsIntergrative Health Studies
Post-Master’s CertificateHealth Systems LeadershipNursing Education
Source: USG Degrees and Majors Authorized Report (as of September 19, 2013)

16
Top Five Declared Majors by ClassificationFall 2013
Undergraduate
Biology 944 majors
Mass Communications 459 majors
Criminology 443 majors
Early Childhood Education 320 majors
Computer Science 283 majors
Graduate
Media 304 majors
Professional Counseling 204 majors
Special Education - General 158 majors
Teacher Education 112 majors
School Improvement 95 majors
Note: Majors are based on the self-declared, primary major and excludes pre-majors, undeclared/undecided, and non-degree students.
Source: Institutional Effectiveness and Assessment

17
Degrees Awarded by College and LevelFiscal Year 2012-2013
College or School Bachelor’s Master’s Specialist Doctorate Certificates Total Percent
Arts and Humanities 149 12 - - 3 164 7.5% Business 366 67 - - - 433 19.8% Education 341 246 150 11 - 748 34.3% Nursing 200 25 - - 1 226 10.4% Science and Mathematics 211 15 - - 3 229 10.5% Social Sciences 337 37 - 1 3 378 17.3% No College Assigned 5 - - - - 5 0.2%
Total 1,609 402 150 12 10 2,183 100.0%
Note: Degrees awarded are reported by major program, department, and college based on the student’s self-declared, primary major.
Double Majors - Students completing one degree within a single term such as Bachelor of Arts (BA) with two or more majors are awarded only one degree. Both majors are noted on the student’s transcript and diploma. Double major policy can be found in the UWG Undergraduate Catalog.
Dual Degree - Requires completion of two separate degree designations, such as a Bachelor of Arts (BA) and a Bachelor of Science (BS) or any combination. In this case the University awards two separate degrees.
Source: Institutional Effectiveness and Assessment

18
Retention and Graduation Rates of First-Time Full-Time Freshman
The improvement of UWG’s first-year retention rates, progression rates toward graduation, and graduation rates for undergraduate students is an institutional strategic priority that is underscored by the University System of Georgia’s Board of Regents. Retention and graduation rates represent the percentage of a full-time, first-time-in-college undergraduate cohort (entering in fall term or summer continuing to fall) that is still enrolled or has graduated from the same institution in the following fall term.
UWG Retention Rates (Each Fall Cohort*)Semester First Year Second Year Third Year Fourth YearFall 2003 1,728 71.76% 53.24% 46.93%Fall 2004 1,701 70.72% 51.68% 44.15%Fall 2005 1,653 70.36% 55.72% 48.94%Fall 2006 1,700 72.82% 53.94% 47.53%Fall 2007 1,793 75.01% 57.00% 51.98%Fall 2008 2,007 73.29% 56.10% 50.52%Fall 2009 1,909 73.18% 57.62% 48.40%Fall 2010 1,848 72.84% 56.82% 48.00%Fall 2011 1,931 70.17% 55.41% Fall 2012 2,021 70.76%
UWG Graduation Rates (Each Fall Cohort*)Semester First Year Fourth Year Fifth Year Sixth YearFall 2003 1,728 12.04% 29.34% 36.28%Fall 2004 1,701 11.64% 27.87% 34.51%Fall 2005 1,653 12.52% 29.76% 38.23%Fall 2006 1,700 14.59% 31.35% 36.35%Fall 2007 1,793 16.62% 35.75% 42.44%Fall 2008 2,007 15.74% 34.23% Fall 2009 1,909 15.61% Note: Graduation Rates updated as of end of summer 2013 and Retention Rates as of census date fall 2013. The data reported above may differ from data reported to federal, state, and regional agencies due to differences in reporting guidelines, reporting definitions, and the timing of when the information was prepared.*Each entering cohort includes all entering freshmen enrolled full-time whose first-term is the fall indicated or the previous summer.
Source: Institutional Effectiveness and Assessment

19
Housing and Residence Life provides a living/learning community environment that complements the University’s educational process. More than 3,000 students are housed in seven residence halls and the Greek Village Complex. Co-ed housing options are for students who live on campus. Traditional res-idence halls have separate areas for men and women, typically separated by units. Residence halls provide students with the convenience of being close to campus life and its activities as well as comfortable and attractive surround-ings. On campus living provides community living experience, which fosters the development of disciplined minds, social conscientiousness, and respon-sibility for governing hall affairs. In addition, the department offers a variety of social, educational, and recreational programs that promote individual growth and development.
Student Housing OccupancyResidence Hall Type Fall 2012 Fall 2013
Arbor View Co-ed 588 574Bowdon Co-ed 0 275Center Pointe Suites Co-ed 590 592Gunn Co-ed 113 81Strozier Complex Co-ed 172 113Tyus Co-ed 169 165University Suites Co-ed 578 566Watson Women 260 0Greek Village 263 251The Oaks Co-ed 0 460
By LevelAcademy 89 60Freshman 2,098 2,143Sophomore 462 517Junior 48 232Senior 21 122Graduate 5 3Other 10 0 Total 2,733 3,077Note: Fall 2012 Bowdon Hall was renovated. Fall 2013 Watson Hall was renovated and The Oaks opened.
Source: Housing and Residence Life
Housing and Residence Life

20
Sponsored Operations Projects MetricsFiscal Years 2005-2013
No. of Proposals Amount Fiscal Year Submitted Funded Requested Awarded
2013 85 48 $8,923,279 $3,731,5692012 63 59 $10,642,057 $4,053,0612011 82 40 $6,521,438 $3,176,2032010 75 53 $7,152,437 $2,422,1452009 75 46 $7,411,645 $2,494,8252008 74 59 $4,027,924 $2,097,7032007 74 60 $4,144,252 $2,396,3492006 48 38 $2,681,068 $1,909,2582005 66 47 $4,649,668 $2,056,983
Note: Amounts exclude awards for student financial aid.
Source: Research and Sponsored Projects
Facilities and Administrative costs (F&A)-formerly Indirect costs (IDCs), are general operating costs incurred by the University in support of sponsored research, public service, and instruction. The Office of Research and Spon-sered Projects (ORSP) distributes the IDCs recieved in accordance with Office of Management and Budget (OMB Circular A-21 http:// www.whitehouse.gov/omb/circulars_a021_2004).
In fiscal year 2013 the University of West Georgia was reimbursed $187,530 in Indirect Costs incurred by sponsored grants and contracts. Of these recovered costs, a total of $13,947 was returned to the Project Investigators (PI’s) to fur-ther their individual research efforts. In addition, $13,697 was returned to the Colleges and $9,863 to the Departments to further research within their units.
Research and Sponsored Projects

21
Continuing Education and Public Services
The Department of Continuing Education and Public Services identifies and provides non-credit educational opportunities to the public that will enhance the quality of life and provide training support to business and industry that will serve as a catalyst for economic growth. The CEU is defined as ten contact hours of participation in a qualified continuing education program and is recognized as the national standard for measuring an individual’s participation in a non-credit program. Category I programs qualifying for CEU credit are designed to enhance occupational skills, and individual permanent transcripts are maintained. Category II courses designed primarily for personal enrichment and are social, cultural, or recreational in nature and no individual permanent transcripts are maintained.
Continuing Education and Public Services MetricsFiscal Years 2005-2013
No. of Fiscal Year Programs Participants CEUs
2013 210 1,556 2,5462012 189 1,834 2,2092011 191 2,553 2,4762010 242 2,255 2,7422009 250 2,816 2,5942008 260 2,261 2,6892007 266 2,909 2,9452006 226 2,589 2,6172005 332 4,403 6,478
Note: Number include categories I and II.
Source: Continuing Education and Public Services

22
University AdvancementThe Division of University Advancement (UA) works to secure the support and financial resources needed to create an environment for UWG students – an environment that supports the pursuit of scholarly achievement, creative expression and service to humanity.
University of West Georgia Foundation Fund RaisingCalendar Year 2004-2013
Calendar Year Dollars Raised No. of Donors2013 $6,724,000 3,6082012 $5,636,000 3,7562011 $2,952,000 3,1112010 $2,021,000 3,1142009 $2,096,000 3,5152008 $2,424,000 3,9862007 $2,960,000 4,2582006 $2,444,000 4,0412005 $2,566,000 4,0932004 $1,626,000 4,457
Note: Numbers are reported by calendar year (January through December) and Dollars Raised are rounded to the nearest thousand. Total raised in 2013 included gifts, pledges, gifts -in-kind secured, and planned gifts booked.
Source: University of West Georgia Foundation, Inc.
Geographic Origin of UWG Alumnias of December 2013
Top Five Georgia Counties Top Five States excluding Carroll County excluding Georgia Cobb Florida Coweta Alabama Fulton Tennessee Douglas North Carolina Gwinnett South Carolina

23
UWG Alumni in the United States as of December 31, 2013
State Total State TotalAlabama 1,274 Montana 22Alaska 27 Nebraska 8Arizona 132 Nevada 40Arkansas 63 New Hampshire 19California 394 New Jersey 87Colorado 184 New Mexico 34Connecticut 45 New York 151Delaware 19 North Carolina 735District of Columbia 32 North Dakota 6Florida 1,425 Ohio 135Georgia 45,783 Oklahoma 46Hawaii 15 Oregon 60Idaho 17 Pennsylvania 140Illinois 132 Rhode Island 10Indiana 109 South Carolina 505Iowa 18 South Dakota 8Kansas 41 Tennessee 878Kentucky 147 Texas 498Louisiana 96 Utah 34Maine 11 Vermont 8Maryland 141 Virginia 356Massachusetts 72 Washington 118Michigan 85 West Virginia 21Minnesota 47 Wisconsin 46Mississippi 128 Wyoming 16Missouri 74 Total in USA 54,492
Note: 5,088 are lost, deceased, or in a foreign country.
Source: Development and Alumni Relations

24
UWG Alumni by Georgia County as of December 31, 2013County Total County Total County Total County Total
Note: 2,759 are lost, deceased, or in a foreign country.
Source: Development and Alumni Relations
Appling 7Atkinson 2Bacon 10Baker 1Baldwin 32Banks 25Barrow 162Bartow 807Ben Hill 10Berrien 6Bibb 179Bleckley 7Brantley 2Brooks 10Bryan 22Bulloch 34Burke 13Butts 107Calhoun 1Camden 33Candler 6Carroll 6,903Catoosa 466Charlton 3Chatham 172Chattahoochee 0Chattooga 200Cherokee 1,097Clarke 191Clay 2Clayton 786Clinch 1Cobb 3,984Coffee 13Colquitt 17Columbia 93Cook 6Coweta 3,208Crawford 8Crisp 10
Dade 56Dawson 53Decatur 19Dekalb 2,101Dodge 11Dooly 5Dougherty 57Douglas 2,591Early 7Echols 0Effingham 22Elbert 32Emanuel 11Evans 5Fannin 103Fayette 1,744Floyd 1,298Forsyth 655Franklin 28Fulton 2,869Gilmer 133Glascock 1Glynn 130Gordon 500Grady 12Greene 53Gwinnett 2,263Habersham 81Hall 440Hancock 6Haralson 1,197Harris 113Hart 51Heard 300Henry 1,054Houston 144Irwin 7Jackson 129Jasper 50Jeff Davis 3
Jefferson 9Jenkins 3Johnson 4Jones 36Lamar 119Lanier 2Laurens 29Lee 36Liberty 18Lincoln 5Long 2Lowndes 46Lumpkin 56Macon 7Madison 36Marion 5McDuffie 13McIntosh 18Meriwether 184Miller 8Mitchell 9Monroe 61Montgomery 5Morgan 78Murray 347Muscogee 238Newton 354Oconee 115Oglethorpe 21Paulding 1,658Peach 12Pickens 160Pierce 13Pike 190Polk 851Pulaski 4Putnam 47Quitman 2Rabun 52Randolph 9
Richmond 80Rockdale 366Schley 3Screven 5Seminole 6Spalding 451Stephens 32Stewart 1Sumter 27Talbot 19Taliaferro 1Tattnall 5Taylor 7Telfair 3Terrell 3Thomas 33Tift 33Toombs 22Towns 30Treutlen 5Troup 691Turner 5Twiggs 3Union 57Upson 163Walker 453Walton 306Ware 28Warren 4Washington 12Wayne 13Webster 1Wheeler 1White 55Whitfield 990Wilcox 1Wilkes 17Wilkinson 8Worth 11Total 45,783

25
University Revenue by Source July 1, 2013 Operating Revenue Budgeted
Tuition and Fees $68,856,148 Less: Scholarship Allowances ($12,381,689) Grants and Contracts - Federal - State - Other - Sales and Services 4,280,682 Rents and Royalties - Auxiliary Residence Halls 16,415,918 Bookstore 5,454,676 Food Services 8,294,688 Parking/Transportation 1,491,040 Health Services 2,284,833 Intercollegiate Athletics 5,974,724 Other Organizations 953,224 Other - Total $101,624,244

26
Non-operating Revenue
State Appropriations $44,301,877 Federal Stimulus - Stabilization Funds - Grants and Contracts* 23,091,465 Gifts - Investment Income 500,000 Other - Total $67,893,342
Capital Gifts and Grants
State - Other Capital Gifts and Grants -
Total -
Total Revenue $169,517,586
Notes: Total Revenue includes all funding sources, internal revenue, special initiative, departmental sales and service, and sponsored operations. Grants and contracts does not include federal tuition scholarships. Information is subject to audit.
Source: Budget Services
University Revenue by Source (cont)

27
Institutional Faculty and Staff Profile Fall 2013
Teaching Faculty Full Part time time Administrators Librarians Total Percent Rank Professor 67 6 44 2 119 19.1% Associate Professor 91 17 1 109 17.5% Assistant Professor 138 5 7 11 161 25.9% Instructor 58 119 3 2 182 29.3% Lecturer 49 2 51 8.2% Highest Degree Earned Doctorate 287 32 64 383 61.6% Masters or EDS 114 92 9 16 231 37.1% Professional Bachelor 2 6 8 1.3% Tenure Status Tenured 152 60 2 214 34.4% Tenure track 117 6 12 135 21.7% Non-Tenure track 134 130 7 2 273 43.9% Gender Female 228 92 35 13 368 59.2% Male 175 38 38 3 254 40.8% Total Faculty 403 130 73 16 622 100.0% Support Staff Administrative 416 52.3% Clerical 210 26.4% Maintenance 170 21.3% Total Support Staff 796 100.0%
Notes: Administrators include the Provost and Vice President for Academic Affairs, Deputy Provost, Associate Vice President for Academic Affairs, Associate Vice President for Institutional Effectiveness and Assessment, Deans, Associate Deans, Department Chairpersons, and Academic Directors. Graduate Teaching Assistants and staff who teach courses are not included in the faculty profile.
Source: Office of the Provost and Vice President for Academic Affairs
28
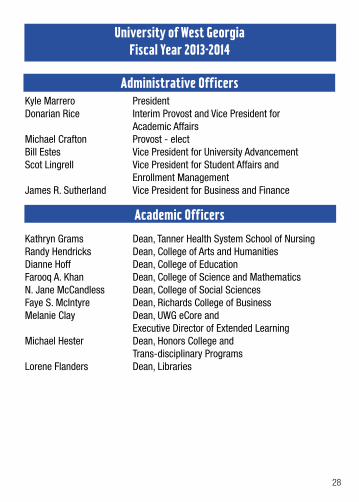
Administrative OfficersKyle Marrero PresidentDonarian Rice Interim Provost and Vice President for
Academic Affairs Michael Crafton Provost - electBill Estes Vice President for University AdvancementScot Lingrell Vice President for Student Affairs and
Enrollment ManagementJames R. Sutherland Vice President for Business and Finance
Academic Officers
Kathryn Grams Dean, Tanner Health System School of NursingRandy Hendricks Dean, College of Arts and HumanitiesDianne Hoff Dean, College of Education Farooq A. Khan Dean, College of Science and MathematicsN. Jane McCandless Dean, College of Social SciencesFaye S. McIntyre Dean, Richards College of Business Melanie Clay Dean, UWG eCore and
Executive Director of Extended Learning Michael Hester Dean, Honors College and
Trans-disciplinary ProgramsLorene Flanders Dean, Libraries
University of West GeorgiaFiscal Year 2013-2014

29
Contact Information(678)
University of West Georgia Home Page www.westga.edu 839-5000
Banweb http://banweb.westga.edu
Fact Book www.westga.edu/iea
DivisionsPresident’s Office www.westga.edu/president 839-6442
Academic Affairs www.westga.edu/vpaa 839-6445
Business and Finance www.westga.edu/bf 839-6410
Student Affairs and Enrollment Management www.westga.edu/vpsa 839-6423
University Advancement www.westga.edu/vpua 839-6447
Colleges/SchoolArts and Humanities www.westga.edu/coah 839-5450
Business www.westga.edu/business 839-6467
Education www.westga.edu/coe 839-6570
Nursing nursing.westga.edu 839-6552
Science and Mathematics www.westga.edu/cosm 839-5190
Social Sciences www.westga.edu/coss 839-5170

(678)
Admissions www.westga.edu/admissions 839-5600
Athletics www.uwgsports.com 839-6533
Bookstore www.bookstore.westga.edu 839-6523
Career Services http://careerweb.westga.edu 839-6431
Continuing Education www.westga.edu/conted 839-6611
Development and Alumni Relations www.westga.edu/alumni 839-6582
Distance and Distributed Education uwgonline.westga.edu 839-6248
Enrollment Services Center www.westga.edu/esc 839-6421
Financial Aid wwww.westga.edu/finaid 839-6424
Honors College and Trans-Disciplinary Programs www.westga.edu/~honors 839-6636
Housing and Residence Life www.westga.edu/housing 839-6426
Human Resources www.westga.edu/hrpay 839-6403
Institutional Effectiveness and Assessment www.westga.edu/iea 839-6449
International Services and Programs www.westga.edu/isp 839-4780
Library www.westga.edu/library 839-6495
Registrar www.westga.edu/registrar 839-6436
University Police www.westga.edu/police 839-6000
Support Units
Please email all Open Records Requests to [email protected]

This publication is prepared by the Department of Institutional Effectiveness and Assessment.
Produced on campus by Publications and Printing
University of West Georgia 1601 Maple Street Carrollton, GA 30118
More Information:www.westga.edu | 678.839.5000