20121114 Q3 2012 Results Presentation Final -...
34
Herbert K. Haas, CEO Dr. Immo Querner, CFO Results Presentation Q3 2012 Hannover, 14 November 2012
Transcript of 20121114 Q3 2012 Results Presentation Final -...

Herbert K. Haas, CEODr. Immo Querner, CFO
Results Presentation Q3 2012 Hannover, 14 November 2012

Results Presentation Q3 2012, Hannover, 14 November 2012
Agenda
2
IPO and Equity StoryI
Q3 2012 FinancialsII
OutlookIII

Results Presentation Q3 2012, Hannover, 14 November 2012
Agenda
3
Q3 2012 FinancialsII
OutlookIII
IPO and Equity StoryI

Results Presentation Q3 2012, Hannover, 14 November 2012
� Largest German IPO since March 2010
� Successful IPO despite difficult market backdrops
� Well-received equity story
� Secured high quality investor base
� Fairly priced to promote healthy after market trading
4
HDI V.a.G82.3%
Meiji Yasuda6.5%
Freefloat11.2%
Long-onlyinvestors
65%
PWM + Retail 18%
Hedge Fonds17%
Shareholder structure post IPO
Split by investor *)
*) as of 2 October 2012
+8.4%
-1.7%
+2.6%
€ 17.50
€ 18.00
€ 18.50
€ 19.00
€ 19.50
€ 20.00
€ 20.50
01-Oct-2012 08-Oct-2012 15-Oct-2012 22-Oct-2012 29-Oct-2012 05-Nov-2012
Talanx DAXEurostoxx 600 Insurance
Share price (indices rebased to Talanx)
Talanx re-opened the German IPO marketI
Results Presentation Q3 2012, Hannover, 14 November 20125
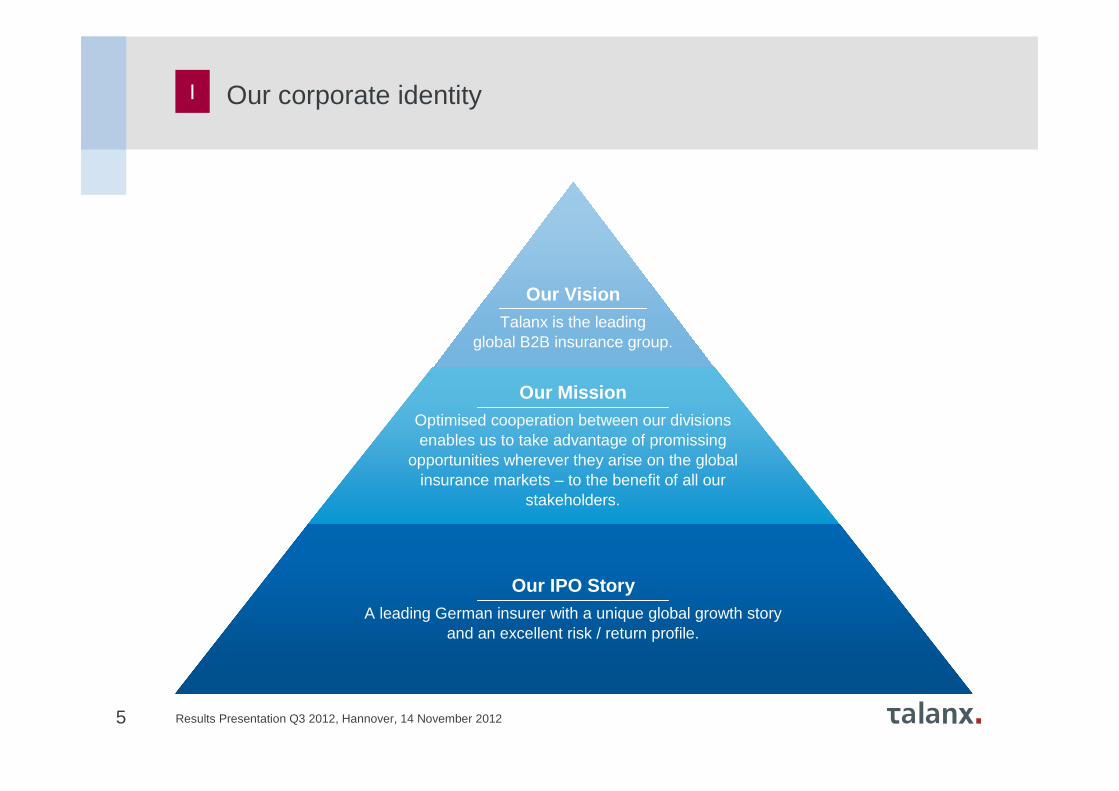
Our VisionTalanx is the leading
global B2B insurance group.
Our MissionOptimised cooperation between our divisions enables us to take advantage of promissing
opportunities wherever they arise on the global insurance markets – to the benefit of all our
stakeholders.
Our IPO StoryA leading German insurer with a unique global growth story
and an excellent risk / return profile.
Our corporate identityI

Results Presentation Q3 2012, Hannover, 14 November 20126
B2B competence allows business integration across all divisions and enhances profitability
2
Sophisticated underwriter with low gearing to market risk3
Proven earnings resilience demonstrates attractive risk-return profile
4
Earnings momentum driven by defined cost efficiencies, focused international growth and increased retention
5
Solid capitalisation enhanced by diversification benefit embedded in business model
6
Shareholder value-based targets delivered by best-in-class management team
7
Global insurance group with leading market positions and strong roots in Germany
1
Key investment highlightsI

Results Presentation Q3 2012, Hannover, 14 November 2012
Corporate Operations
IndustrialLines
17% of GWP1
RetailGermany
37% of GWP1
Retail International
14% of GWP1
Reinsurance
32% of GWP1
7
[ ]Talanx is an integrated global insurance group, stro ngly rooted in Germany, running a multi-brand approach
1 2011 gross written premium adjusted for Talanx’s 50.2% stake in Hannover Re
Our divisional structure I

Results Presentation Q3 2012, Hannover, 14 November 2012
Agenda
8
Q3 2012 FinancialsII
OutlookIII
IPO and Equity StoryI

Results Presentation Q3 2012, Hannover, 14 November 2012
Q3 2012 results – Key messages
9
II
Shareholders’ equity up 21% ytd to ~ €6.6bn (before capital hike from listing in October)
Material increase in off-balance sheet reserves to ~€4.4bn (year-end 2011: ~€2.7bn)
Warta transaction closed on 1 July and first-time consolidated in Q3 2012
Warta upgraded from “BBB+” to “A” by Standard & Poor’s (July 2012)Hannover Re upgraded from “A” to “A+” by A.M. Best (Sept 2012)S&P confirms Insurer Financial Strength Rating of Talanx Primary Group (A+/stable). ERM rated “strong” (Sept 2012)
Increase in 9M 2012 group income primarily driven by improved technical result and higher net investment income

Results Presentation Q3 2012, Hannover, 14 November 201210
Group – Key financials
Summary of 9M 2012
1 AnnualisedNote: Differences due to rounding may occur.
Ability to translate top-line growth into strong bo ttom-line momentum
€m, IFRS 9M 2012 9M 2011 ChangeGross written premium 19,847 17,843 +11%
Net premium earned 15,851 14,216 +12%
Net underwriting result (1,146) (1,366) n.a.
Net investment income 2,817 2,352 +20%
Operating result (EBIT) 1,312 718 +83%
Net income after minorities 549 327 +68%
Key ratios 9M 2012 9M 2011 Change
Combined ratio non-life insurance and reinsurance
97.1% 102.0% -4.9%pts
Return on investment1 4.3% 3.8% +0.5%pts
Balance sheet 9M 2012 FY 2011 Change
Investments und. own mgmt.
83,200 75,750 +10%
Goodwill 1,153 690 +67%
Total assets 128,559 115,273 +12%
Technical provisions 89,733 83,118 +8%
Total shareholders’ equity 10,627 8,694 +22%
Shareholders’ equity 6,572 5,409 +22%
II
Comments
� Double-digit growth in gross written premium and in net premium earned
� Strong rise in net investment income reflecting both an increased return on investment as well as a larger asset base
� Materially improved technical result despite policyholder participation in net investment income
� Combined ratio down 4.9%pts to 97.1%
� Bottom-line result benefits from low tax rate of below 19% in 9M 2012

Results Presentation Q3 2012, Hannover, 14 November 201211
Group – Key financials
Summary of Q3 2012
1 AnnualisedNote: Differences due to rounding may occur.
Strong top- and bottom-line momentum continues in Q3 2012
€m, IFRS Q3 2012 Q3 2011 ChangeGross written premium 6,264 5,421 +16%
Net premium earned 5,556 4,826 +15%
Net underwriting result (452) (217) n.a.
Net investment income 1,068 713 +50%
Operating result (EBIT) 459 289 +59%
Net income after minorities 196 114 +72%
Key ratios Q3 2012 Q3 2011 Change
Combined ratio non-life insurance and reinsurance
95.4% 91.9% +3.5%pts
Return on investment1 4.8% 3.4% +1.4%pts
Balance sheet Q3 2012 Q4 2011 Change
Investments und. own mgmt.
83,200 75,750 +10%
Goodwill 1,153 690 +67%
Total assets 128,559 115,273 +12%
Technical provisions 89,733 83,118 +8%
Total shareholders’ equity 10,627 8,694 +22%
Shareholders’ equity 6,572 5,409 +22%
II
Comments
� Strong growth momentum in gross written premium and net premium earned
� Decline in net underwriting result largely driven by a negative base effect from Q3 2011
� Even higher EBIT momentum on the back of excellent net investment income
� Net income additionally boosted by a positive Q3 tax effect: intended merger of legal entities within Retail Germany in Q4 2012 allows for the capitalisation of €280m tax losses carry forward, leading to a gross tax revenue of €84m in Q3

Results Presentation Q3 2012, Hannover, 14 November 2012
46 14 108 153 101 60 5459 53
(2)
(1)
4233
(11)
4 19
(7)
38 3517 23
(17)
186 184
277283
173351
68
1861
78 107
33
76
(16)(7)
(54)(18)
(24) (7)
(32)
145
284289
528 544
309
459
P&L – GWP and EBIT trend
12
GWP development (€bn)
EBIT development (€m)
� Q3 2012 result improved on top-line and on bottom-line level
� Adjusted for acquisition growth, GWP grew by well above 10% in Q3 2012
� EBIT in 9M 2012 has already surpassed the FY2011 level by ~6%
Growth in GWP and EBIT well supported by strong org anic growth momentum
Industrial Lines Retail Germany Retail InternationalNon-Life Reinsurance Life/Health Reinsurance Corporate Functions and Consolidation
7.6
2011 2012
1.4 1.6
2.1
1.5 1.5 1.7
2.0
1.5 1.5
0.6
0.6 0.6 0.7
0.6
0.7 0.9
1.9
1.6 1.7 1.6
2.1
2.0 1.8
1.2
1.3 1.3 1.4
1.4
1.4 1.6
(0.2) (0.2) (0.2) (0.2) (0.2) (0.2) (0.2)
7.0
5.4 5.4 5.8 6.0 6.3
Q1 Q2 Q3 Q4 Q1 Q2 Q3
Q1 Q2 Q3 Q4
2011 2012
II
0.6 0.5 0.6 0.6 0.6
Q1 Q2 Q3

Results Presentation Q3 2012, Hannover, 14 November 2012
Q3 2012 Q3 2011
Industrial Lines 97.5% 61.0%
Retail Germany 90.1% 101.1%
Retail International 96.1% 99.8%
HDI Seguros S.A., Brazil 96.1% 99.8%
HDI Seguros S.A., Mexico 87.3% 93.0%
TUiR Warta S.A., Poland* 78.8% --
TU Europa S.A., Poland* 102.1% --
HDI Asekuracja TU S.A., Poland 121.3% 93.4%
HDI Sigorta A.Ş., Turkey 120.9% 135.6%
HDI Assicurazioni S.p.A., Italy 98.1% 96.8%
Non-Life Reinsurance 95.8% 95.1%
P&L – Combined ratio
13
Development of net combined ratio Combined ratio by segment/selected carrier
Net combined ratio for Talanx Group remains well bel ow 100%
25.0% 27.7% 27.1% 27.1% 26.2% 27.5% 24.6%
87.8%74.7%
65.0%71.0% 70.3% 72.0%
70.9%
112.6%
102.2%
91.9%98.1% 96.4%
99.5%95.4%
Q1 Q2 Q3 Q4 Q1 Q2 Q3
2011 2012
Expense ratio Loss ratio
II
* TU Europa transaction closed on 1 June 2012; Warta on 1 July 2012

Results Presentation Q3 2012, Hannover, 14 November 2012
Substantial decline in major losses (net)
14
II
(€m) Primary insurance Reinsurance Talanx Group
NatCat
Winter damages Poland
February/March 10.7 10.7
Storm USA 2 – 3 March 6.1 6.1
Earthquake Italy (I) 20 May 40.7 40.7
Earthquake Italy (II) 29 May 6.7 18.3 25.0
Draught USA July 49.2 49.2
Typhoon “Haikui”, Taiwan
2 August 12.5 12.5
Hurricane “Isaac”, USA
24 – 31 August 11.4 11.4
Total NatCat 17.4 138.2 155.6
Costa Concordia 13 January 38.2 38.2
Chemistry park Marl 31 March 13.2 13.2
Fire / Property 19.4 19.4
Transport 16.6 16.6
Total other large losses 32.6 54.8 87.4
Total major losses 50.0 193.0 243.0
Impact on Combined Ratio 2.8%pts
� Net burden from major losses of €243m in 9M 2012
� This compares with €860m in 9M 2011
� Impact on combined ratio decreases from 11.3%pts in 2011 to 2.8%pts in 2012
� Q3 2012 major loss events only in Reinsurance

Results Presentation Q3 2012, Hannover, 14 November 201215
Segments – Industrial Lines
€m, IFRS Q3 2012 Q3 2011 change
Gross written premium 602 550 +10%
Net premium earned 400 367 +9%
Net underwriting result 11 143 (93%)
Net investment income 68 28 +143%
Operating result (EBIT) 54 108 (50%)
Group net income 35 85 (59%)
Return on investment (annualised)
4.0% 1.7% +2.3%pts
P&L for Q3 results Comments
� Strong top-line momentum both on 9M (+11% y/y) as well as on quarterly level (+10% y/y)
� Favourable premium momentum continues in Q3 2012, with special momentum from fire, liability and fleet business
� Target to increase self-retention with capital raised from the IPO to lever organic growth potential
� Dublin-based captive Talanx Reinsurance prepared to expand business. A.M. Best just assigned a “A” Financial Strength Rating
� Combined ratio over the first nine months 2012 at an excellent 94.3%
Combined ratio*
*incl. net interest income on funds withheld and contract deposits
18% 30% 20% 24% 18% 24% 21%
80%98%
41% 47% 64%78% 76%
98%128%
61% 71% 83%102% 97%
Q1 2011 Q2 2011 Q3 2011 Q4 2011 Q1 2012 Q2 2012 Q3 2012
Expense ratio Loss ratio
II
Strong organic growth momentum backed by favourable trend in various lines

Results Presentation Q3 2012, Hannover, 14 November 201216
Segments – Retail Germany
€m, IFRS Q3 2012 Q3 2011 change
Gross written premium 1,540 1,482 +4%Of which Life 1,269 1,202 +6%Of which Non-Life 271 280 (3)%
Net premium earned 1,298 1,294 +-0%Net underwriting result (411) (375) n.a.
Of which Life (448) (370) n.a.Of which Non-Life 37 (5) n.a.
Net investment income 423 385 +10%Operating result (EBIT) (11) (2) n.a.Group net income 55 10 +436%
Return on investment (annualised)
4.3% 4.1% +0.2%pts
P&L for Q3 results
� Retail Germany fully in line with target to achieve a flat top-line result in FY2012
� Material improvement in Q3 combined ratio offsets special effects from H1 2012
� Merger of two German P&C entities into HDI Versicherung AG was decisive step to streamline product offering and processes and raise efficiency
� ZZR forecast at ~€290m (HGB) for FY 2012 (FY2011: €112m). PVFP impairment of ~€30m post taxes taken under IFRS
� €83m reserve strengthening for the four German life carriers on the back of BGH court ruling on surrender values (FY2012 estimate fully taken in Q3 2012)
Combined ratio*
*incl. net interest income on funds withheld and contract deposits
28% 36% 37% 35% 37% 36% 32%
71% 69% 64% 66% 68% 75%58%
99% 105% 101% 101% 105% 112%90%
Expense ratio Loss ratio
Q1 2011 Q2 2011 Q3 2011 Q4 2011 Q1 2012 Q2 2012 Q3 2012
II
Comments
Decisive quarter to strengthen the segment and rais e its efficiency

Results Presentation Q3 2012, Hannover, 14 November 201217
Preparation Detailed design/planning Implementation
Phase 1 Phase 2 Phase 3
t
� Basic agreement on restructuring paper achieved with group workers’ council
�
� Adoption of the social plan as a follow-up to the basic agreement
�
� Major implementation milestones defined and synchronized between e.g. sales & back office
�
� Implementation plan finalized �
Decision about basic agreement, 24 Apr 2012
Start implementation1 Jun 2012
� Implementation started with first specific measures focused on HR and business premises
�
− First on-site moves took place (Hamburg/Leipzig to Hannover, Dortmund/Düsseldorf to Essen)
− Detailed plan for consolidation of further locations in 2013: Mainz, Cologne, Munich to Essen, Berlin to Hannover
− Build-up of central scanning/indexing in Hannover completed
− Concrete steps to raise efficiency and effectiveness of sales network
� Key objectives formulated �
− Establishment of “Retail Germany” as a separate business segment
− Strengthening the division and its customer focus
− Substantial cost savings through state-of-the-art workflow processes
− One single P&C carrier in the future
WIR program implementation on track to deliver tota l ~€140m run-rate saving p.a. by 2016 (before taxes and policyholders’ share). Fully on tr ack to reach 2012 interim targets
Status WIR: First milestones in implementation reachedII
Implementation in 2012 on track, implementation pla n 2013 started

Results Presentation Q3 2012, Hannover, 14 November 201218
Segments – Retail International
€m, IFRS Q3 2012 Q3 2011 changeGross written premium 897 580 +55%
Of which Life 256 143 +79%Of which Non-Life 642 437 +47%
Net premium earned 723 441 +64%
Net underwriting result (4) (19) n.a.Of which Life (27) (19) n.a.
Of which Non-Life 23 1 n.a.
Net investment income 83 26 +219%
Operating result (EBIT) 23 (7) n.a.Group net income 8 (6) n.a.
Return on investment (annualised)
7.0% 3.1% +3.9%pts
P&L for Q3 results
� Material improvement of top-line and technical result supported by recent acquisitions
� Organic gross written premium growth at mid-single digit percentage level
� Closure of Warta transaction on 1 July 2012 makes Talanx the second-largest player on the Polish P&C and life insurance markets
� Warta and TU Europa already make a sizeable contribution to the business in Q3, delivering some €270m in GWP and a material share of this quarter’s EBIT
� Improvement in the segment’s combined ratio continued in Q3 2012
Combined ratio*
Acquired companies play a significant part in boost ing sales and profitability
*incl. net interest income on funds withheld and contract deposits
30% 30% 30% 27% 29% 28%
70% 70% 70% 71% 71% 70% 71%
100% 100% 100% 98% 100% 98% 96%
25%
II
Comments
Expense ratio Loss ratio
Q1 2011 Q2 2011 Q3 2011 Q4 2011 Q1 2012 Q2 2012 Q3 2012

Results Presentation Q3 2012, Hannover, 14 November 2012
TU Europa
� Joint acquisition by Talanx International and Meiji Yasuda closed on 1 June
� Talanx, Meiji Yasuda and Getin Holding have squeezed out remaining shareholders
� Stock delisted in October 2012
Warta
� Acquisition by Talanx International from KBC closed on 1 July and subsequent transfer of 30% stake to Meiji Yasuda on 3 July
� Planned merger of existing HDI and Warta non-life businesses and integration of existing HDI life business into Warta Life well underway
� Transaction likely to trigger a higher final shareholding of Talanx in Warta
19
TU Europa
Warta
Shareholding in Polish entities
Highly attractive acquisitions make Talanx the No 2 player in the most important CEE market
Getin Holding16.54%
Meiji Yasuda33.46%
Talanx 50.0%+ 1Share
Talanx 70.0%
Meiji Yasuda30.0%
Status Poland: Successful closing of both transactions II
Warta impact on Talanx Q3 2012:~€203m GWP contribution~double-digit €m EBIT contribution€271m goodwill

Results Presentation Q3 2012, Hannover, 14 November 2012
Implementation
10 July 2012S&P raised Warta’s Counterparty Credit
and Insurer Financial Strength Rating from
BBB+ to A
20
Warta integration project “BEST” (BE Stronger Togeth er) in implementation phase
Making use of the best components from both worlds, Warta’s and HDI’s
Status Poland: Implementation phase started for WartaII
Integration plan Detailed design/planning
Phase 1 Phase 2 Phase 3
t
� Organizational set-up second level �
� Brand positioning �
� Closing of deal with KBC �
� Transfer of 30% stake to Meiji Yasuda �
Signing,19 Jan 2012
Closing of acquisition, 1 July 2012
� Warta Re-Branding �
Next steps:
� Legal merger of the companies
� Implementation of organizational changes (functional structure, centralized operations, multi-channel distribution)
� Launch of implementation projects in IT (common IT, P&C architecture from HDI, life system from Warta)
� Integration sponsors �
� Organizational set-up first level �
� IT target systems �
� Brand decision �
� Internal and external communication plan �
Identified cost synergies of
€40m
Approval of integration plan, 20 April 2012
3 July 2012Common management
team in place

Results Presentation Q3 2012, Hannover, 14 November 201221
Segments – Non-Life Reinsurance
€m, IFRS Q3 2012 Q3 2011 change
Gross written premium 1,817 1,676 +8%
Net premium earned 1,714 1,543 +11%
Net underwriting result 70 71 (1)%
Net investment income 302 181 +67%
Operating result (EBIT) 351 184 +91%
Group net income 108 64 +69%
Return on investment (annualised)
5.0% 3.5% +1.5%pts
P&L for Q3 results
� Strong GWP growth both on Q3 (+8% y/y) as well as on 9M 2012 level (+13% y/y); growth momentum from specialty lines, US and Asian property, European markets
� Net major losses of €193m ytd (3.8% of NPE) stand €550m below last year‘s leveland €215m below budget
� Impressively increased net investmentincome despite low interest rate environment
� GWP growth target raised for 2012 to ~+8-9% (previously: ~+5-7%)
Combined ratio*
Strong bottom-line outperforms top-line growth
*incl. net interest income on funds withheld and contract deposits
26% 25% 26% 26% 25% 27% 24%
98%73% 69% 76% 72% 70% 72%
124%97% 95% 102% 97% 97% 96%
Expense ratio Loss ratio
II
Comments
Q1 2011 Q2 2011 Q3 2011 Q4 2011 Q1 2012 Q2 2012 Q3 2012

Results Presentation Q3 2012, Hannover, 14 November 201222
Segments – Life/Health Reinsurance
€m, IFRS Q3 2012 Q3 2011 change
Gross written premium 1,590 1,344 +18%
Net premium earned 1,420 1,189 +19%
Net underwriting result (117) (37) n.a.
Net investment income 201 99 +102%
Operating result (EBIT) 76 61 +25%
Group net income 29 20 +46%
Return on investment (annualised)
6.4% 1.3% +5.1%pts
P&L for Q2 results
� Very strong top-line momentum: +18% y/y in 3Q 2012, +14% y/y in 9M 2012
� Momentum mainly from US, Australia, China and UK-longevity BATs
� Technical result impacted by lessfavourable mortality results in the US
� Net investment income affected byincrease in assets under management; unrealised gains from ModCo derivativescontributed €~35m in 3Q (9M: €46m)
� Low tax ratio due to good profitability of Irish and Bermudan subsidiaries
� GWP growth target raised for 2012 to ~+8-9% (previously: ~+5-7%)
EBIT (€m)
Accelerated growth in life and health reinsurance
6818
61 78 107
3376
II
Comments
Q1 2011 Q2 2011 Q3 2011 Q4 2011 Q1 2012 Q2 2012 Q3 2012

Results Presentation Q3 2012, Hannover, 14 November 201223
Fixed-income-portfolio split as of 30 Sept 2012 Comments
� Investment portfolio strongly dominated by fixed-income securities
� Investment in equities stable at low level (€0.9bn)
� Well-balanced mix of fixed-income investments in government, corporate and covered bonds
� 83% of fixed-income portfolio invested in A or higher-rated bonds
1 Includes government and semi-government entities part of which are guaranteed by the Federal Republic of Germany, other EU countries or German federal states
Asset allocation
Investments – Breakdown of investment portfolio
90%
1%9%
Breakdown by rating
Breakdown by type
Total: €83.2bn Total: €75.2bn
BBB and below
A
AA
AAA
Other
Covered bonds
Corporate bonds
Government bonds
Other
Equities
Fixed income securities
32%
31%
20%
17%
38%
29%
31%
2%
II
High share of investments in highly rated fixed-inc ome securities

Results Presentation Q3 2012, Hannover, 14 November 2012
Investments – Details on GIIPS exposure
24
Details on sovereign exposure in €m (30 Sept 2012)
Total GIIPS exposure manageable
� GIIPS sovereign exposure represents only 0.8% of total assets (Q2 2012: 0.9%), or 1.2% of assets under own management (1.3%)
� Total GIIPS exposure incl. private sector assets stands at well below 3.5% of total assets
� 63% of the group’s exposure to Italian government bond exposure is held by Italian subsidiary HDI Assicurazioni S.p.A.
� Majority of “Italy” exposure in financials and covered bonds stems from non-Italian subsidiaries of Italian banks
� More than 80% of Spanish banking exposure in Spanish covered bonds. €120m of these issued by non-Spanish subsidiaries of Spanish banks
Total: €1,026m (amortized cost), €1,027m (fair value)
Total unrealised gain: €1m
€m Government bonds Corporate bonds
GIIPS exposure (30 Sept 2012)
Sovereign Semi-Sovereign
Financial Corporate Covered Other Total
Greece 3 - - - - - 3
Ireland 243 - 19 34 157 175 628
Italy 636 - 419 269 949 - 2,273
Portugal 26 - - 3 7 - 36
Spain 119 222 103 237 579 - 1,260
Total 1,027 222 541 543 1,692 175 4,200
3
240
633
27123
3
243
636
26119
Greece Ireland Italy Portugal Spain
Amortized cost Fair value
II
Comments
Exposure to GIIPS sovereigns accounts for less than 1% of total assets

Results Presentation Q3 2012, Hannover, 14 November 201225
Net investment income
€m, IFRS Q3 2012 Q3 2011 change
Ordinary investment income 819 768 +7%
thereof current investment income from interest 746 702 +6%
Thereof profit/loss from shares in associated companies 0 1 n.a.
Realised net gains on investments 107 109 (2)%
Write-ups/write-downs on investments (8) (79) n.a.
Unrealised net gains/losses on investments 89 (131) n.a.
Investment expenses 23 33 (30)%
Income from investments under own management 984 634 +55%
Income from investment contracts 3 0 n.a.
Interest income on funds withheld and contract deposits 82 79 +4%
Total 1,069 713 +50%
Net investment income Talanx Group
� In 9M 2012, the 22% increase in income frominvestments under own management is primarilydriven by unrealised net gains on investments(43% contribution) and by a remarkable increasein ordinary investment income (38% contribution)
� Write-downs have come down for each segmentytd given the market environment and risk-sensitive investment strategy
� This is also reflected in the very low level of write-downs in Q3 2012
II
Comments
Unrealised net gains on investments as well as ordi nary investment income as driving factors

Results Presentation Q3 2012, Hannover, 14 November 2012
5.4
3.3
2.6
11.3
6.1
3.6
3.1
12.8
6.6
4.14.1
6.6
4.1
2.9
13.5
7.3
4.1
2.6
14.0
Equity and capitalization – Solid equity base
26
Optimized capital structure (€bn)
� Significant increase in shareholders’ equity in 9M 2012 driven by €549m net income and unrealised (on-balance sheet) gains from investments
� In addition, off-balance sheet reserves, as shown on p. 27, up by nearly €1.7bn from FY 2011
� Successful buy-back of two selected hybrid bonds at a nominal amount of ~€204m settled in July 2012. Interest saving of ~€12m p.a. until first call date
� Goodwill rises by €463m ytd from acquisitions of Metropolitana in Q1 (€43m), TU Europa in Q2 (€134m) and Warta in Q3 (€271) to a still moderate level of €1,153m
Capital breakdown
31.12.2011 30.06.2012 30.09.2012
II
Shareholders‘ equity Minorities Subordinated liabilities
pro forma post IPO
Material improvement of Talanx’s capital position ev en ahead of the IPO

Results Presentation Q3 2012, Hannover, 14 November 2012
Equity and capitalisation – Unrealised gains
27
Unrealised gains and losses (off and on balance she et) as of 30 September 2012 (€m)
∆ market value vs. book value
3,892215 115 79 134 4,434
2,456328 2,784 7,219
Loans andreceivables
Held tomaturity
Investmentproperty
Real estateown use
Subordinatedloans
Off balancesheet reserves
Available forsale
Other assets On balancesheet reserves
Totalunrealised
gains (losses)
II
Talanx’s off-balance sheet reserves stand at above € 4.4bn end of September 2012

Results Presentation Q3 2012, Hannover, 14 November 2012
Agenda
28
Q3 2012 FinancialsII
OutlookIII
IPO and Equity StoryI

Results Presentation Q3 2012, Hannover, 14 November 2012
Forecast for Talanx Group 2012
29
Gross Written Premium ~ €26bn
• Industrial Lines ~ €3.4bn
• Retail Germany ~ €6.7bn
• Retail International ~ €3.3bn
• Non-Life Reinsurance ~ +8-9%
• Life and Health Reinsurance ~ +8-9%
III
Return on investment ~ 4%
Group net income > €600m
Return on equity close to 10%
[ ]Targets are subject to no major losses exceeding bu dget ( cat ), no turbulences on capital markets ( capital ), and no material currency fluctuations ( currency ).
Dividend payout ratio 35-45% target rangetowards the upper end of

Results Presentation Q3 2012, Hannover, 14 November 2012
Targets for Talanx Group 2013
30
Gross Written Premium ≥ €27bn
• Industrial Lines ≥ 4%
• Retail Germany ≥ 0%
• Retail International ≥ 17%
• Non-Life Reinsurance ~ +3-5%
• Life and Health Reinsurance ~ +5-7%
III
Return on investment ~ 3.5%
Group net income ≥ €650m
Return on equity ≥ 9%
Dividend payout ratio 35-45% target range
[ ]Targets are subject to no major losses exceeding bu dget ( cat ), no turbulences on capital markets ( capital ), and no material currency fluctuations ( currency ).

Results Presentation Q3 2012, Hannover, 14 November 201231
APPENDIX: Key financials – 9M 2012
€m, IFRS 9M 2012 9M 2011 ChangeP&L
Gross written premium 2,849 2,556 +11%
Net premium earned 1,182 1,095 +8%
Net underwriting result 69 74 (7)%
Net investment income 181 151 +20%
Operating result (EBIT) 215 168 +28%
Net income after minorities 136 125 +9%
Key ratios
Combined ratio non-life insurance and reinsurance
94.3% 93.1% +1.2%pts
Return on investment1 3.6% 3.0% +0.6%
Industrial Lines
9M 2012 9M 2011 Change
5,056 5,006 +1%
3,908 3,882 +1%
(1,121) (972) n.a.
1,236 1,149 +8%
64 111 (42)%
106 85 (24)%
102.3% 101.8% +0.5%pts
4.3% 4.1% +0.2%pts
9M 2012 9M 2011 Change
2,231 1,775 +26%
1,801 1,359 +33%
(25) (52) n.a.
201 112 79%
75 16 +369%
39 10 +290%
97.8% 99.9% -2.1%pts
5.9% 4.5% +1.4%
Retail Germany Retail International
1 AnnualisedNote: Differences due to rounding may occur.

Results Presentation Q3 2012, Hannover, 14 November 201232
APPENDIX: Key financials – 9M 2012 (continued)
€m, IFRS 9M 2012 9M 2011 ChangeP&L
Gross written premium 5,897 5,221 +13%
Net premium earned 5,018 4,391 +14%
Net underwriting result 170 (224) n.a.
Net investment income 730 608 +20%
Operating result (EBIT) 806 352 +129%
Net income after minorities 255 134 +90%
Key ratios
Combined ratio non-life insurance and reinsurance
96,5% 104.9% -8.4%pts
Return on investment1 4.1% 3.8% +0.3%pts
1 AnnualisedNote: Differences due to rounding may occur.
9M 2012 9M 2011 Change
4,399 3,844 +15%
3,941 3,487 +13%
(238) (193) n.a.
486 350 +39%
215 147 +47%
81 61 +33%
--- --- ---
5.2% 2.9% +2.3%pts
9M 2012 9M 2011 Change
19,847 17,843 +11%
15,851 14,216 +12%
(1,146) (1,366) n.a.
2,817 2,352 20%
1,312 718 +83%
549 327 +68%
97.1% 102.0% -4.9%pts
4.3% 3.8% +0.5%pts
Non-Life Reinsurance Life and Health Reinsurance
Group

Results Presentation Q3 2012, Hannover, 14 November 201233
APPENDIX: Q3 2012 results – GWP of main risk carriers
GWP, €m, IFRS Q3 2012 Q3 2011 change
Non-life Insurance 271 280 (3)%
HDI Versicherung AG1 235 233 +1%
Life and Health Reinsurance 1,269 1,202 +6%
HDI Lebensversicherung AG 533 565 (6)%
neue leben Lebensversicherung AG2 246 214 +15%
TARGO Lebensversicherung AG 243 223 +9%
PB Lebensversicherung AG3 213 40 +430%
PBV Lebensversicherung AG3 – 126 n.a.
Total 1,540 1,482 +4%
Retail Germany
GWP, €m, IFRS Q3 2012 Q3 2011 change
Non-life Insurance 642 437 +47%
HDI Seguros S.A., Brazil 203 219 (7)%
TUiR Warta S.A4., Poland* 132 – n.a.
TU Europa S.A5., Poland* 20 – n.a.
HDI Asekuracja TU S. A., Poland 65 60 +10%
HDI Assicurazioni S. p. A., Italy (P&C) 76 69 +10%
HDI Seguros S.A. De C.V., Mexico 23 21 +8%
Metropolitana, Mexico (P&C) 12 – n.a.
HDI Sigorta A.Ş., Turkey 42 28 +49%
Life and Health Reinsurance 256 143 +79%
TU Warta Zycie S.A.4, Poland 70–
n.a.
TU Europa5, Poland 21 – n.a.
Open Life5 28 – n.a.
HDI-Gerling Zycie, Poland 24 41 (42)%
HDI Assicurazioni S. p. A., Italy (Life) 34 30 +15%
Total 897 580 +55%
Retail International
1 Entity results from Sept 2012 merger of HDI Direkt Versicherung AG and HDI-Gerling Firmen und Privat Versicherung AG
2 Talanx ownership 67.5%3 PB Leben and PBV Leben have been merged in 20114 Talanx ownership 70%; closed on 1 July 20125 Talanx ownership 50% + 1 share; closed on 1 June 2012
Numbers for main carriers represent data entry values.

Results Presentation Q3 2012, Hannover, 14 November 2012
Disclaimer
This presentation contains certain forward-looking statements, including assumptions, opinions and views of Talanx Aktiengesellschaft(the "Company") or cited from third-party sources. Various known and unknown risks, uncertainties and other factors could cause the actual results, financial positions, development or performance of the Company or the Company’s industry to differ materially from the those projected, estimated, expressed or implied herein. The Company does not guarantee that the assumptions underlying such forward-looking statements are free from errors nor does the Company accept any responsibility for the future accuracy of the opinions expressed in this presentation or the actual occurrence of the forecasted developments. The Company accepts no obligation to update any forward-looking statements set forth herein to reflect actual results, changes in assumptions or changes in factors affecting these statements. Where any information and statistics are quoted from any external source, such information or statistics should not be interpreted as having been adopted or endorsed by the Company as being accurate.
This presentation contains supplemental financial measures (e.g., return on investment, return on equity, gross/net combined ratios, gross/net retention ratios, solvency ratios) which the Company believes to be useful performance measures but which are not recognised as measures under International Financial Reporting Standards, as adopted by the European Union ("IFRS"). Therefore, such measures should be viewed as supplemental to, but not as substitute for, balance sheet, statement of income or cash flow statement data determined in accordance with IFRS. Since not all companies define such measures in the same way, the respective measures may not be comparable to similarly-titled measures used by other companies.
This presentation is dated as of 14 November 2012. Neither the delivery of this presentation nor any further discussions of the Company with any of the recipients shall, under any circumstances, create any implication that there has been no change in the affairs of the Company since such date. This material is being delivered in conjunction with an oral presentation by the Company and should not be taken out of context.
34


![[Public Document] - Talanx](https://static.fdocuments.net/doc/165x107/6203da7fc411ef574f365fe4/public-document-talanx.jpg)