20120626 chapter1 ok - msn.org.my · 19119919TH REPORT OFREPORT OF THE MALAYSIAN DIALYSIS &...
40
Transcript of 20120626 chapter1 ok - msn.org.my · 19119919TH REPORT OFREPORT OF THE MALAYSIAN DIALYSIS &...

19191919TH TH TH TH REPORT OFREPORT OFREPORT OFREPORT OF
THE MALAYSIAN DIALYSIS & TRANSPLANT THE MALAYSIAN DIALYSIS & TRANSPLANT THE MALAYSIAN DIALYSIS & TRANSPLANT THE MALAYSIAN DIALYSIS & TRANSPLANT
REGISTRYREGISTRYREGISTRYREGISTRY
2011201120112011
Sponsors: Malaysian Society of Nephrology
Association of Dialysis Medical Assistants and Nurses
The National Renal Registry is funded with grants from:
The Ministry of Health Malaysia
Roche
AIN Medicare
Baxter Healthcare
Fresenius Medical Care
Lucenxia
ii
June 2012
© National Renal Registry, Malaysia
ISSN 1675-8862
Published by:
The National Renal Registry Malaysian Society of Nephrology
Suite 1604, Plaza Permata
6, Jalan Kampar
50400 Kuala Lumpur
Malaysia
Telephone. : (603) 4045 8636
Direct Fax : (603) 4042 7694
e-mail : [email protected]
Web site : http://www.msn.org.my/nrr
Important information:
This report is copyrighted. However it may be freely reproduced without the permission of the National
Renal Registry. Acknowledgment would be appreciated.
Suggested citation is: YN Lim, LM Ong, BL Goh (Eds) Nineteenth Report of the Malaysian Dialysis and
Transplant 2011, Kuala Lumpur 2012
This report is also published electronically on the website of the National Renal Registry at:
http://www.msn.org.my/nrr
Hard copies of the report can be made available with donation of RM60.00 per copy to defray the cost of
printing.
iii
ACKNOWLEDGEMENTSACKNOWLEDGEMENTSACKNOWLEDGEMENTSACKNOWLEDGEMENTS
The Malaysian Dialysis and Transplant Registry of the National Renal Registry would like to thank each and everyone who have in one way or another contributed to the success of the Malaysian Dialysis and Transplant Registry. In particular we would like to thank the following: The Nephrologists, physicians and staff of the Dialysis and Transplant follow-up centres: thank you for participating in the Registry. The success of the Registry depends on you. The Ministry of Health, Malaysia for financial support and other support seen and unseen; The Clinical Research Centre, in particular Dr Goh Pik Pin, Dr Jamaiyah and Dr Jaya Purany for their tireless effort in supporting the work of registries. For their generous financial support:- • Roche • AIN Medicare • Baxter Healthcare • Fresenius Medical Care • Lucenxia
Terima kasihTerima kasihTerima kasihTerima kasih

iv
NRR ADVISORY COMMITTEE MEMBERS 2010 TO 2012
Members: MSN appointment: Facilities
Datuk Dr. Ghazali Ahmad Chairman Hospital Kuala Lumpur
Dr. Abdul Halim Abd Gafor University representative University Kebangsaan Malaysia Medical
Centre
Dr. S. Prasad Menon Private sector representative Sime Darby Medical Centre Subang Jaya
Dato' Dr. Zaki Morad B Mohd Zaher NGO representative National Kidney Foundation
Dr. Ong Loke Meng CRC representative Hospital Penang
Mr. Husin Harun ADMAN representative Hospital Kuala Lumpur
Dr. Wong Hin Seng eMOSS sub-committee
Chairperson
Hospital Selayang
Dato' Dr. Wan Shaariah Md Yusuf MRRB sub-committee
Chairperson
Tuanku Ja'afar Hospital
Dr. Lim Yam Ngo MDTR sub-committee
Chairperson
Hospital Kuala Lumpur
Dr. Lim Teck Onn MDTR advisor Indepandent consultant
Dr. Goh Bak Leong MINR sub-committee
Chairperson
Hospital Serdang
Dr. Rafidah Abdullah Honorary MSN Treasurer Hospital Selayang
Statistician Jasmine Chew Sze Ming
NRR Manager Lee Day Guat
Clinical Registry Assistant Manager Choo Cheh Loo
Suhazelini Ali
v
ABOUT THE MALAYSIAN DIALYSIS AND TRANSPLANT REGISTRY (MDTR)
The Malaysia Dialysis and Transplant Registry (MDTR) collects information on patients with end stage
renal disease (ESRD) on renal replacement therapy (RRT) in Malaysia.
Objectives:
The objectives of the registry are as follows:
1. Describe the natural history of ESRD. The registry shall describe the characteristics of patients with
ESRD, its management, and patient survival and quality of life outcomes with treatment; and shall
describe variation thereof across different groups, healthcare sectors or geographic regions, and its
secular trend over time in Malaysia.
2. Determine effectiveness of treatments for ESRD. The registry shall determine clinical effectiveness
and cost effectiveness of treatments of ESRD in real-world clinical practices in Malaysia.
3. Monitor safety and harm of products and services used in the treatment of ESRD. The registry
shall serve as an active surveillance system for the occurrence of unexpected or harmful events for
products and services.
4. Evaluating access to and quality of treatment services for ESRD. The registry shall assess
differences between providers or patient populations based on performance measures that compare
treatments provided or outcomes achieved with "gold standards" (e.g., evidence-based guidelines) or
comparative benchmarks for specific health outcomes (e.g., risk-adjusted survival rates). Such
programs may be used to identify disparities in access to care, demonstrate opportunities for
improvement, establish differentials for payment by third parties, or provide transparency through
public reporting.
5. To maintain the national renal transplant waiting list electronically – the eMOSS or electronic
Malaysian Organ Sharing System. The dialysis registry shall maintain and update patients on dialysis
who do not have contraindications to kidney transplantation onto the national renal transplant waiting
list according to published agreed criteria. This list is available on the web for ready access by the
transplant physicians any time a deceased kidney becomes available
Registry design:
This is a multi-center, observational cohort study designed to evaluate the health outcomes of patients with
ESRD undergoing treatment at participating clinical centres. Patient inclusion criterion is deliberately
broad and shall include any patient with a confirmed diagnosis of ESRD.
There is no prescribed study visits. Patient shall attend the clinical site as and when required per the
standard of care at the site. Required data shall be collected as they become available.
1. A clinical site shall notify all new patients to the registry, and shall continue to do so until the
termination of the registry. Patients shall be follow-up for life.
2. Participation. Site shall notify the patients’ treatment to the registry in a calendar year of its
participation. A site shall similarly notify patients during each year of its participation in the registry.
.
vi
Registry study population:
The registry study population consists of male or female patients with ESRD to be recruited from
participating sites in Malaysia. Participation in this study is voluntary. However, in accordance with the
Private Health-care Facilities Act 1998 (AKTA 586), all dialysis health facility are required to submit data
to the Malaysian Dialysis and Transplant Registry (MDTR).
All clinical centres or sites that satisfy the following selection criteria will be invited to participate:
1. This registry is opened to all clinical sites that provide RRT services for patients with ESRD in
Malaysia.
2. Each site shall have a Principal Investigator who is also a licensed physician / Surgeon and a qualified
professional experienced with ESRD management.
3. Each site shall appoint a Site Coordinator (SC). The SC is the person at the participating clinical site
who is responsible for all aspects of registry management and data collection at site, and who will liaise
with the Clinical Registry Manager (CRM) and Clinical Registry Assistant (CRA) at the Registry
Coordinating Centre (RCC).
4. Each site shall accept responsibility for data collection, as well as for ensuring proper record keeping
and registry document filing.
5. Each site shall agree to comply with the registry procedures and shall be willing to be subjected to
ongoing review of data by CRM or CRA or other representative of MDTR. This may include one or
more site visits by prior arrangement
Patient eligibility criteria:
• All new patients with ESRD undergoing treatment at a participating clinical site are eligible for entry
into the registry.
• In addition, a site may opt to enter existing patients on follow-up at the site into the registry.
Registry data:
The data elements to be collected by the registry shall be relevant and reliable with modest burden to sites,
shall comply with existing data standard where this exists, shall be compatible with established data set
used by other existing registries, and shall employ standard terminology (dictionary) where available.
Two datasets are defined:
• Core dataset: These are data elements that are needed to address the key questions for which the
registry was created.
• Non-core dataset: these are speculative data elements included to provide an opportunity to generate
hypotheses or to explore other subsidiary questions not of primary interest to the registry.
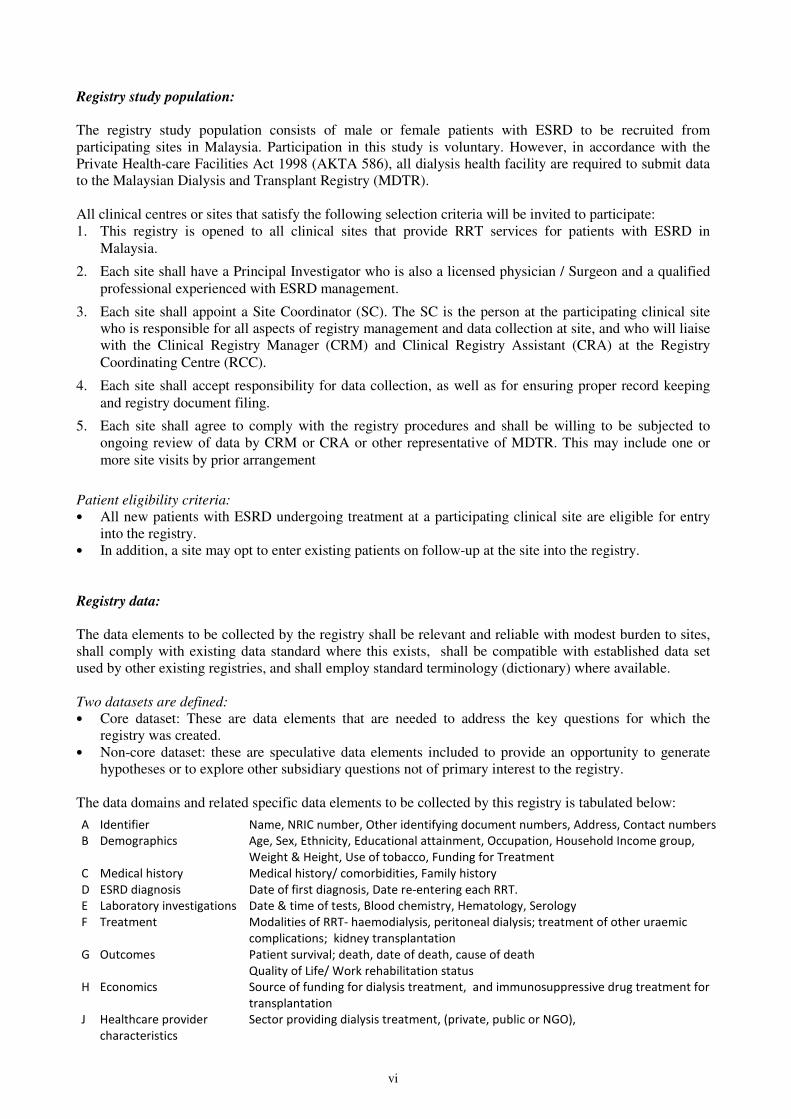
The data domains and related specific data elements to be collected by this registry is tabulated below:
A Identifier Name, NRIC number, Other identifying document numbers, Address, Contact numbers
B Demographics Age, Sex, Ethnicity, Educational attainment, Occupation, Household Income group,
Weight & Height, Use of tobacco, Funding for Treatment
C Medical history Medical history/ comorbidities, Family history
D ESRD diagnosis Date of first diagnosis, Date re-entering each RRT.
E Laboratory investigations Date & time of tests, Blood chemistry, Hematology, Serology
F Treatment Modalities of RRT- haemodialysis, peritoneal dialysis; treatment of other uraemic
complications; kidney transplantation
G Outcomes Patient survival; death, date of death, cause of death
Quality of Life/ Work rehabilitation status
H Economics Source of funding for dialysis treatment, and immunosuppressive drug treatment for
transplantation
J Healthcare provider
characteristics
Sector providing dialysis treatment, (private, public or NGO),

vii
PARTICIPATING HAEMODIALYSIS CENTRES 2011
Johor Darul Takzim
1. Batu Pahat Hospital
2. Batu Pahat Rotary
3. BP Renal Care ( Rengit)
4. BP Renal Care (Batu Pahat)
5. BP Renal Care (Kluang)
6. BP Renal Care (Segamat)
7. BP Renal Care Simpang Renggam
8. BP Renalcare (Yong Peng)
9. Che Eng Khor Centre
10. Hospital Pakar Sultanah Fatimah (Muar)
11. JB Lions MAA-Medicare Charity Dialysis Centre (1)
12. JB Lions MAA-Medicare Charity Dialysis Centre (2)
13. JJ Lions Dialysis Centre
14. Johor Quarries Association Dialysis Centre
15. Johor Specialist Hospital
16. Kluang Hospital
17. Kluang Utama Specialist Hospital
18. Kota Tinggi Hospital
19. Mersing Hospital
20. Mersing Rotary Centre
21. Muar Dialysis
22. Muar Lions Renal Centre
23. Persatuan Membaiki Akhlak-Che Luan Khor_NKF
24. Pertubuhan Hemodialisis Muhibbah
25. Pertubuhan Hemodialisis Muhibbah Segamat
(Labis)
26. Pertubuhan Kebajikan Amitabha
27. Pontian Hospital
28. Pontian Rotary Haemodialysis Centre
29. Premier Renal Care
30. Prima Dialysis Kluang
31. Prima Dialysis Masai
32. Pusat Dialisis Nefro Utama (Johor Bahru)
33. Pusat Dialisis Nefro Utama (Kota Tinggi)
34. Pusat Dialisis Nefro Utama Pontian
35. Pusat Dialisis Perbadanan Islam (Johor Bahru)
36. Pusat Dialisis Perbadanan Islam (Pontian)
37. Pusat Dialisis Waqaf An-nur (Batu Pahat)
38. Pusat Dialisis Waqaf An-nur (Kota Raya)
39. Pusat Dialisis Waqaf An-nur (Pasir Gudang)
40. Pusat Dialysis Ikhlas
41. Pusat Dialysis Makmur (Senai)
42. Pusat Haemodialisis Suria (Tangkak)
43. Pusat Haemodialysis Amal Lexin
44. Pusat Hemodialisis Ar-Raudhah
45. Pusat Hemodialisis Bandar Mas
46. Pusat Hemodialisis Darul Takzim (Batu Pahat)
47. Pusat Hemodialisis Darul Takzim (Parit Raja)
48. Pusat Hemodialisis Hidayah
49. Pusat Hemodialisis Iman
50. Pusat Hemodialisis MAIJ
51. Pusat Hemodialisis Mawar (Yong Peng) HD Unit
52. Pusat Hemodialisis Muar
53. Pusat Hemodialisis Rotary Kota Tinggi
54. Pusat Hemodialisis Rotary Kulai
55. Pusat Hemodialisis Sejahtera (Batu Pahat)
56. Pusat Hemodialisis Sejahtera Muar
57. Pusat Hemodialisis Syifa (Bukit Gambir)
58. Pusat Kesihatan Universiti (UTHO)
59. Pusat Perubatan Perbadanan Islam (Segamat)
60. Pusat Rawatan Perbadanan Islam (Kota Tinggi)
61. Puteri Specialist Hospital
62. Segamat Hospital
63. Sinar Haemodialysis (Batu Pahat)
64. Sinar Haemodialysis (Parit Raja)
65. Sultan Ismail Hospital
66. Sultan Ismail Hospital (Paed)
67. Sultanah Aminah Hospital
68. Systemic Dialysis Centre
69. Systemic Dialysis Centre (2)
70. Tangkak Hospital
71. Tangkak Lions Renal Centre
72. Temenggong Seri Maharaja Tun Ibrahim Hospital
73. The Rotary HD Centre (Johor Bahru)
74. Total Kidney Care Haemodialysis
75. Yayasan Pembangunan Keluarga Johor-NKF
76. Yayasan Rotary Kluang
77. Zhi En Dialysis Centre

viii
PARTICIPATING HAEMODIALYSIS CENTRES 2011
Kedah Darul Aman
78. Asia Renal Care (Penang) Kulim
79. Baling Hospital
80. Buddhist Tzu Chi Dialysis Centre (Kedah)
81. Caring Dialysis (Sg. Petani-Selatan)
82. Caring Dialysis (Sungai Petani-Utara)
83. Kuala Nerang Hospital
84. Kulim Hospital
85. Langkawi Hospital
86. Metro Specialist Hospital
87. Northern Dialysis Centre
88. Pantai Hospital Sungai Petani
89. Pertubuhan Bakti Fo En Bandar Kulim
90. Pusat Dialisis Albukhary
91. Pusat Dialisis Marjina
92. Pusat Dialisis NKF-Kelab Lions Alor Star
93. Pusat Dialyisis Ibnu Sina (Kuala Ketil)
94. Pusat Dialysis K K Tan (Sg Petani)
95. Pusat Haemodialisis Dr. Ismail
96. Pusat Haemodialisis Zakat Kedah
97. Pusat Hemodialisis Beng Siew
98. Pusat Hemodialisis Mergong
99. Pusat Hemodialisis S P
100. Pusat Hemodialisis Syifa (Pendang)
101. Pusat Kesihatan Jitra
102. Pusat Pakar Dialisis Traktif (Jitra)
103.
Pusat Rawatan Hemodialisis Yayasan Emkay &
Sultanah Bahiyah
104. Putra Haemodialysis Centre
105. Putra Medical Centre
106. Renal Care (Kedah)
107. Sik Hospital
108. Sultan Abdul Halim Hospital
109. Sultanah Bahiyah Hospital
110. Superkids Trinity-NKF Dialysis Centre
111. Yan Hospital
112. Zaharah Dialisis Center
Kelantan Darul Naim
113. Gua Musang Hospital
114. Hudaz Dialysis Centre
115. Jeli Hospital
116. KB Rotary-MAA Charity Dialysis
117. Keluarga Bahagia Haemodialisis
118. Kuala Krai Hospital
119. Lions Club Kota Budaya Dialysis Centre
120. Machang Hospital
121. Nephrolife Dialysis Centre
122. Pakar Perdana Hospital
123. Pasir Mas Hospital
125. Pusat Hemodialisis Berkat Seroja (Machang)
126. Pusat Perubatan Tentera (Kota Bharu)
127. Pusat Rawatan Dialisis Islah (Kota Bharu)
128. Raja Perempuan Zainab II Hospital
129. Renal-Link (Kelantan)
130. Tanah Merah Hospital
131. Tengku Anis Hospital
132. Tumpat Hospital
133. Universiti Sains Malaysia Hospital
124. Pusat Dialisis Yayasan Buah Pinggang
Kebangsaan (Kota Bharu)
Negeri Melaka
134. 94 Hospital Angkatan Tentera (Terendak)
135. Alor Gajah Dialysis Centre
136. Alor Gajah Hospital
137. Damai Medical & Heart Clinic
138. Jasin Hospital
139. Mahkota Medical Centre
140. Melaka Hospital
141. Pantai Air Keroh Hospital
142. Pertubuhan Kebajikan Hemodialisis Hospital
Pakar Putra Melaka
143. Pusat Dialisis Giat Kurnia (Masjid Tanah)
144. Pusat Dialisis Giat Kurnia (Merlimau)
145. Pusat Dialisis Nephrocare (Bukit Piatu)
146. Pusat Dialysis Comfort
147. Pusat HD SJAM Bacang Melaka
148. Pusat Hemodialisis Impian
149. Pusat Hemodialisis Krisda
150. Pusat Hemodialisis SJAM Pulau Sebang
151. Pusat Hemodialisis Yayasan Toh Puan Zurina
152. Pusat Hemodialysis Suria (Melaka)
153. Pusat Rawatan Dialisis Nefro Utama (Masjid
Tanah)
154. Sinar Hemodialisis
155. Tenang Haemodialysis Centre
156. Tenang Haemodialysis Jasin
ix
PARTICIPATING HAEMODIALYSIS CENTRES 2011
Negeri Sembilan Darul Khusus
157. D'kasih Hemodialysis
158. Giat Kurnia Dialysis Centre (Nilai)
159. Haemodialysis Mawar Gemas
160. Jelebu Hospital
161. Jempol Hospital
162. Persada Dialysis Centre
163. Port Dickson Hospital
164. Pusat Dialisis Suria (Tampin)
165. Pusat Dialisis Veteran ATM (Senawang)
166. Pusat Dialysis Azalea
167. Pusat Haemodialisis Renalife
168. Pusat Haemodialisis USIM
169. Pusat Haemodialysis Suria (Senawang)
170. Pusat Hemodialisis Bayu
171. Pusat Hemodialisis Berkat Seroja (Kuala Pilah)
172. Pusat Hemodialisis Gemencheh
173. Pusat Hemodialisis Mawar (Kuala Pilah)
174. Pusat Hemodialisis Mawar (Mantin)
175. Pusat Hemodialisis Mawar N. Sembilan (Bahau)
176. Pusat Hemodialisis Mawar N. Sembilan (Lukut)
177. Pusat Hemodialisis Mawar N. Sembilan (Rantau)
178. Pusat Hemodialisis Mawar N. Sembilan
(Seremban)
179. Pusat Hemodialsis Mutiara
180. Pusat Pakar Dialisis Traktif (Kuala Pilah)
181. Pusat Waqaf An-nur (Senawang)
182. Seremban Specialist Hospital
183. Sinar Identiti
184. Tampin Hospital
185. Tuanku Ampuan Najihah Hospital
186. Tuanku Ja'afar Hospital
187. Tuanku Ja'afar Hospital (Paed)
188. YKN Dialisis Kuala Pilah
Pahang Darul Makmur
189. Bentong Hospital
190. Caring Dialysis (Jerantut)
191. Fitra Med
192. Hospital Sultanah Hajjah Kalsom
193. Jengka Hospital
194. Jerantut Hospital
195. Kuala Lipis Hospital
196. Kuantan Clinical Diagnostic Centre
197. Kuantan Medical Centres
198. Kuantan Specialist Centre
199. Lipis Dialysis Centre
200. MAA-Medicare Charity (Mentakab)
201. Mentakab Haemodialysis Unit
202. Muadzam Shah Hospital
203. Nur Iman Dialysis Pahang
204. Pahang Buddhist Association
205. Pekan Hospital
206. Pusat Hemodialisis Islam Makmur
207. Pusat Hemodialisis Jerantut
208. Pusat Hemodialysis Suria (Bentong)
209. Pusat Rawatan Dialisis Fitra (Jengka)
210. Pusat Rawatan Dialisis Fitra (Kuantan)
211. Pusat Rawatan Dialisis Tun Abdul Razak-NKF
Kuantan
212. Pusat Rawatan Fitra (Muadzam)
213. Raub Hospital
214. SJAM-KPS Haemodialysis Centre 9 (Raub)
215. Sultan Haji Ahmad Shah Hospital
216. Suria Dialysis Centre (Temerloh)
217. Tengku Ampuan Afzan Hospital
218. Tengku Ampuan Afzan Hospital (Paed)
Perak Darul Ridzuan
219. 96 Hospital Angkatan Tentera (Lumut)
220. Batu Gajah Hospital
221. Berchaam Dialysis Centre
222. C.S. Loo Kidney & Medical Specialist Centre
223. Caring Dialysis Centre (Sg Siput)
224. Caring Dialysis Centre (Teluk Intan)
225. Changkat Melintang Hospital
226. Fatimah Hospital
227. Gerik Hospital
228. Hope Haemodialysis Society Ipoh
229. Kampar Hospital
230. Kuala Kangsar Hospital
231. MAA-Medicare Charity (Teluk Intan)
232. MB Star Rawatan Dialisis
233. Nur Dialysis Centre
234. Parit Buntar Hospital
235. Persatuan Amal Chin Malaysia Barat
236. Pertubuhan Perkhidmatan Haemodialisis Ar-
Ridzuan
237. Pertubuhan Perkhidmatan Hemodialisis AIXIN
Kerian

x
PARTICIPATING HAEMODIALYSIS CENTRES 2011
Perak Darul Ridzuan (cont)
238. PMA Chan Meng Khor-MAA Medicare Charity
Dialysis Centre
239. Pulau Pangkor Hospital
240. Pusat Dialisis Darul Iltizam (Slim River)
241. Pusat Dialisis Darul Iltizam (Taiping)
242. Pusat Dialisis Ehsan Perak (Parit Buntar)
243. Pusat Dialisis Intan
244. Pusat Dialisis Kuala Kangsar
245. Pusat Dialisis Makmur (Batu Gajah)
246. Pusat Dialisis Mutiara
247. Pusat Dialisis Mutiara (Ayer Tawar)
248. Pusat Dialisis Penawar Permai
249. Pusat Dialisis Setia (Ipoh)
250. Pusat Dialisis Taiping
251. Pusat Dialisis Taiping (Kamunting)
252. Pusat Dialisis Taiping (Kuala Kangsar)
253. Pusat Dialisis Taiping (Parit Buntar)
254. Pusat Dialysis Setia
255. Pusat Hemodialisis Darul Iltizam (Ipoh)
256. Pusat Hemodialisis Felda
257. Pusat Hemodialisis Kampar Yayasan Nanyang-
SJAM
258. Pusat Hemodialisis Manjung
259. Pusat Hemodialisis Qaseh
260. Pusat Hemodialysis Nyata Segar
261. Pusat Rawatan Dialisis Wan Nong
262. Putri Haemodialysis Centre (Ipoh)
263. Raja Permaisuri Bainun Hospital
264. Raja Permaisuri Bainun Hospital (Home)
265. Renal Care (Ipoh Specialist)
266. Selama Hospital
267. Seri Manjung Hospital
268. Sg Siput Hospital
269. SJ Dialysis Centre (Bidor)
270. SJ Dialysis Centre (Ipoh)
271. SJAM_KPS Pusat Hemodialisis Centre 15 (Ipoh)
272. Slim River Hospital (Tanjong Malim)
273. Taiping Hospital
274. Tapah Hospital
275. Teluk Intan Hospital
276. Woh Peng Cheang Seah
277. Yayasan Akhlak-NKF Taiping
278. Yayasan Dialysis Pendidikan Akhlak Perak-NKF
Ipoh
Perlis Indera Kayangan
279. Caring Dialysis (Kangar)
280. Pusat Dialysis Tuanku Syed Putra_NKF
281. Tuanku Fauziah Hospital
Penang
282. Alkom Bakti Dialysis
283. AMD Rotary (Penang)
284. Asia Renal Care (Penang) BM
285. Balik Pulau Hospital
286. BBA (Butterworth) Dialysis Centre
287. Buddhist Tzu Chi Dialysis Centre (Butterworth)
288. Buddhist Tzu Chi HD Centre (Penang)
289. Bukit Mertajam Hospital
290. Fo Yi NKF Dialysis Centre (1)
291. Fo Yi NKF Dialysis Centre (2)
292. Gleneagles Medical Centre
293. Happy Kid Nees Dialysis Centre
294. Island Hospital
295. K K Tan Specialist (BM)
296. Kepala Batas Hospital
297. KPJ Penang Specialist Hospital
298. Lam Wah Ee Hospital
299. Lim Boon Sho Dialysis Centre
300. Loh Guan Lye Specialist Centre
301. MAA-Medicare Charity (Butterworth)
302. Muhibah Renal Care
303. NEPH Sdn Bhd
304. Nucare Dialysis Centre
305. Pantai Hospital Penang
306. Penang Adventist Hospital
307. Penang Caring Dialysis Society
308. Persatuan Kebajikan Haemodialysis St Anne BM
309. Pertubuhan Dialisis Rotary-Satu Hati
310. Pertubuhan Hemodialisis SPS
311. Province Wellesley Renal Medifund
312. Pulau Pinang Hospital
313. Pulau Pinang Hospital (Home)
314. Pulau Pinang Hospital (Paed)
315. Pusat Dialisis BMC
316. Pusat Dialisis Ehsan Perak (Pedar)
317. Pusat Dialisis SJ (Sg Bakap)
xi
PARTICIPATING HAEMODIALYSIS CENTRES 2011
Penang (cont)
318. Pusat Haemodialisis Zakat (Jawi)
319. Pusat Haemodialisis Zakat Tasek Gelugor
320. Pusat Hemodialisis Bayan Baru
321. Pusat Hemodialisis Sinona
322. Pusat Hemodialisis Zakat (Balik Pulau)
323. Pusat Hemodialisis Zakat (Bukit Mertajam)
324. Pusat Hemodialisis Zakat (Butterworth)
325. Pusat Hemodialisis Zakat (Kepala Batas)
326. Pusat Hemodialisis Zakat (P. Pinang)
327. Pusat Hemodialysis Bestari
328. Pusat Rawatan Dialisis Lions-NKF (Penang)
329. PWRM (BM) Dialysis Centre
330. Renal Link (Penang)
331. Seberang Jaya Hospital
332. Seberang Perai (Bagan)
333. SJ Dialysis Centre (Seberang Jaya)
334. Sungai Bakap Hospital
335. The Penang Community HD Society
336. TSC Renal Care
Sabah
337. BBA (Kota Kinabalu) Dialysis Centre
338. BBA (Tawau) Dialysis Centre
339. Beaufort Hospital
340. Beluran Hospital
341. Caring Dialysis Centre (Sandakan)
342. Caring Dialysis Centre Kota Kinabalu
343. Duchess of Kent Hospital
344. Keningau Hospital
345. Kota Belud Hospital
346. Kota Kinabatangan Hospital
347. Kota Marudu Hospital
348. Kudat Hospital
349. Labuan Hospital
350. Lahad Datu Hospital
351. Likas Hospital
354. Papar Hospital
355. Persatuan Buah Pinggang Sabah
356. Persatuan Hemodialysis Kinabalu Sabah
357. Pusat Rawatan Dialisis NKF-MUIS
358. Queen Elizabeth Hospital
359. Ranau Hospital
360. Sabah Medical Centre
361. Sandakan Kidney Society
362. Semporna Hospital
363. Sipitang Hospital
364. Tambunan Hospital
365. Tawau Hospital
366. Tenom Hospital
353. Nobel Dialysis Centre
352. MAA-Medicare Charity (Kota Kinabalu)
Sarawak
367. 801 Rumah Sakit Angkatan Tentera (Kuching)
368. Bau Hospital
369. Betong Hospital
370. Bintulu Hospital
371. CHKMUS-MAA Medicare Charity
372. Hospital Daerah Daro
373. Kanowit Hospital
374. Kapit Hospital
375. KAS-Rotary-NKF
376. Kuching Specialist Hospital
377. Lawas Hospital
378. Limbang Hospital
379. Lundu Hospital
380. Marudi Hospital
381. Miri Hospital
382. Miri Red Crescent Dialysis Centre
383. Mukah Hospital
384. Normah Medical Specialist Centre
385. Pusat Dialisis Cahaya
386. Pusat Dialisis Waqaf An-Nur (Sarawak)
387. Rejang Medical Centre
388. Renal Life Dialysis Centre
389. Renal Therapy Services
390. Saratok Hospital
391. Sarawak General Hospital
392. Sarikei Hospital
393. Serian Hospital
394. Sibu Hospital
395. Sibu Kidney Foundation
396. Simunjan Hospital
397. SJAM_KPS Pusat Hemodialisis Centre 10
(Bintulu)
398. SJAM-KPS Haemodialysis Centre 8 (Sibu)
399. Sri Aman Hospital
400. Timberland Medical Centre

xii
PARTICIPATING HAEMODIALYSIS CENTRES 2011
Selangor Darul Ehsan
401. 819 Rumah Sakit Angkatan Tentera
402. Ampang Hospital
403. Apex Club of Klang-NKF Charity Dialysis Centre
404. Assunta Hospital
405. Bakti-NKF Dialysis Centre
406. Bangi Dialysis Centre
407. Banting Hospital
408. BBA (Puchong) Dialysis Centre
409. Caring Dialysis Centre (Cheras)
410. Caring Dialysis Centre (Sabak Bernam)
411. Caring Dialysis Centre (Sg. Besar)
412. Caring Dialysis Centre (Tanjong Karang)
413. Caring Dialysis Centre Andalas (Klang)
414. Damansara Specialist Hospital
415. DEMC Dialysis Centre
416. EAM Dialysis Centre
417. Haemodialysis Association Klang
418. Harmoni Dialysis (Damansara)
419. Harmoni Dialysis (Sg Long)
420. Healthcare Dialysis Centre
421. Hemodialisis Yayasan Veteran ATM (S
Kembangan)
422. Ibnu Al-Nafis Dialysis Centre
423. Jerteh Dialysis Centre
424. Kajang Hospital
425. Kelana Jaya Medical Centre
426. KPJ Ampang Puteri Specialist Hospital
427. KPJ Kajang Specialist Hospital
428. KPJ Selangor Specialist Hospital
429. Kuala Kubu Bharu Hospital
430. MAA-Medicare Charity (Kajang)
431. MB Star Rawatan Dialisis (Kelana Jaya)
432. Nefrol I-Care
433. Persatuan Dialisis Kurnia PJ
434. Pertubuhan Hemodialisis Pasar Besar Meru
435. Ping Rong-NKF
436. PJCC Dialysis Centre
437. PNSB Dialisis Centre
438. Pusat Dialisis Aiman (Shah Alam)
439. Pusat Dialisis An'nur
440. Pusat Dialisis An'nur Seksyen 13
441. Pusat Dialisis LZS (Kapar)
442. Pusat Dialisis LZS (Sg. Besar)
443. Pusat Dialisis LZS (Shah Alam)
444. Pusat Dialisis MAIS
445. Pusat Dialisis MAIS Taman Melawati
446. Pusat Dialisis Mesra (Kuala Selangor)
447. Pusat Dialisis Mukmin Sungai Buloh
448. Pusat Dialisis NKF - Dato' Dr GA Sreenevasan
449. Pusat Dialisis NKF-Rotary Damansara
450. Pusat Dialisis Pakar Medi-Nefron (Lestari)
451. Pusat Dialisis Putra Jaya (Kajang)
452. Pusat Dialisis Rakyat Ampang
453. Pusat Dialisis Rakyat Sementa
454. Pusat Dialisis Sijangkang
455. Pusat Dialisis Touch
456. Pusat Dialysis Mesra (Kapar)
457. Pusat Dialysis Mesra (Rahman Putra)
458. Pusat Dialysis Mesra (Shah Alam)
459. Pusat Dialysis Mesra KKB
460. Pusat Haemodialysis Nilam (Seri Kembangan)
461. Pusat Hemodialisis Fasa (Kg Medan)
462. Pusat Hemodialisis Fasa (Sri Manja)
463. Pusat Hemodialisis Kau Ong Yah Ampang
464. Pusat Hemodialisis Mawar N. Sembilan (Sepang)
465. Pusat Hemodialisis Mawar N. Sembilan (Seri
Kembangan)
466. Pusat Hemodialisis Nilam (Semenyih)
467. Pusat Hemodialisis Permata
468. Pusat Hemodialisis Shah Alam
469. Pusat Hemodialysis Yayasan Veteran ATM (Batu
Caves)
470. Pusat Perubatan Dialisis
471. Pusat Perubatan Dialisis Dengkil
472. Pusat Perubatan Primier HUKM
473. Pusat Rawatan Dialisis Hidayah
474. Pusat Rawatan Dialisis Hidayah (Sepang)
475. Pusat Rawatan Dialisis Islah (Batu Caves)
476. Pusat Rawatan Dialisis Islah (Selayang)
477. Pusat Rawatan Dialisis Mukmin
478. Pusat Rawatan Dialisis Nefro Utama (Puchong)
479. Pusat Rawatan Dialysis Nefro Utama (Kajang
Prima)
480. Pusat Rawatan Hemodialisis Felina
481. Putrajaya Hospital
482. Rawatan Dialysis Bukit Tinggi
483. Renal Associates
484. Renal Care Dialysis Services
485. S.P. Menon Dialysis Centre (Klang)
486. S.P. Menon Dialysis Centre (Petaling Jaya)
487. Sayang Dialysis Selayang
488. Selayang Hospital
489. Selayang Hospital (Paed)
490. Serdang Hospital
491. Sime Darby Medical Centre Subang Jaya
492. SJAM-KPS Haemodialysis Centre 1 (Raja Muda
Musa)
493. SJAM-KPS Haemodialysis Centre 11 (Shah Alam)
494. SJAM-KPS Haemodialysis Centre 12 (Balakong)
495. SJAM-KPS Haemodialysis Centre 2 (Klang)
496. SJAM-KPS Haemodialysis Centre 3 (Banting)
497. SJAM-KPS Haemodialysis Centre 5 (Rawang)
498. SJAM-KPS Haemodialysis Centre 6 (Kuala
Selangor)
499. SJAM-KPS Pusat Hemodialisis Tasik Puteri
500. SJAM-KPS Pusat Hemodialysis Serdang (Station
14)

xiii
PARTICIPATING HAEMODIALYSIS CENTRES 2011
Selangor Darul Ehsan (cont)
501. Smartcare Dialysis Centre (Subang Jaya)
502. Sri Kota Medical Centre
503. Sungai Buloh Hospital
504. Sunway Medical Centre
505. Sunway Medical Centre (2)
506. Bangi Dialysis Centre
507. Banting Hospital
508. BBA (Puchong) Dialysis Centre
509. Bangi Dialysis Centre
510. Banting Hospital
511. BBA (Puchong) Dialysis Centre
512. Caring Dialysis Centre (Cheras)
513. Tulips Dialysis Centre
514. Universiti Kebangsaan Malaysia Bangi
515. Yayasan Kebajikan SSL
516. Yayasan Kebajikan SSL Puchong
Terengganu Darul Iman
517. Besut Hospital
518. Dungun Hospital
519. Hulu Terengganu Hospital
520. Kemaman Hospital
521. Pusat Dialisis MAIDAM
522. Pusat Dialisis Nuraeen
523. Pusat Dialisis Terengganu/NKF
524. Pusat Hemodialisis Nabilah
525. Pusat Pakar Dialisis Traktif (Besut)
526. Pusat Rawatan Dialisis Islah (Kuala Terengganu)
527. Setiu Hospital
528. Sultanah Nur Zahirah Hospital
529. YKN Dialisis (Terengganu)
Wilayah Persekutuan Kuala Lumpur
530. Aiman Dialysis Centre
531. Al-Islam Specialist Hospital
532. Caring Dialysis (Wangsa Maju)
533. Charis-NKF Dialysis Centre
534. Cheras Dialysis Centre
535. Hospital Angkatan Tentera Tuanku Mizan
536. Kuala Lumpur Hospital (Home)
537. Kuala Lumpur Hospital (Paed.)
538. Kuala Lumpur Hospital (Unit 1)
539. Kuala Lumpur Hospital (Unit 3)
540. Kuala Lumpur Hospital (Unit 4)
541. Kuala Lumpur Lions Renal Centre
542. MAA-Medicare Charity (Cheras)
543. MAA-Medicare Charity (Kuala Lumpur)
544. National Kidney Foundation Dialysis Centre (KL)
545. Pantai ARC Dialysis Services
546. Pantai Hospital Ampang
547. Poliklinik Komuniti Tanglin
548. Prince Court Medical Centre
549. Pusat Dialisis Amal MAA-Medicare (Sg Besi)
550. Pusat Dialisis Bandar Sri Permaisuri
551. Pusat Dialisis Nefro Utama (Bangsar)
552. Pusat Dialisis Pusat Punggutan Zakat (Kuala
Lumpur)
553. Pusat Dialisis Veteran ATM (Seri Rampai)
554. Pusat Hemodialisis Dato' Lee Kok Chee
555. Pusat Hemodialisis Desa Aman Puri
556. Pusat Hemodialisis Harmoni (Cheras)
557. Pusat Hemodialisis Harmoni (Shamelin)
558. Pusat Hemodialisis MAIWP-PICOMS
559. Pusat Hemodialisis Mawar N. Sembilan (Seputih)
560. Pusat Hemodialisis PMKL
561. Pusat Hemodialisis PUSRAWI
562. Pusat Hemodialisis Waz Lian
563. Pusat Hemodialisis Yayasan Felda
564. Pusat Hemodialysis Medipro Alliance
565. Pusat Pakar Dialysis Traktif
566. Pusat Pakar Tawakal
567. Pusat Perubatan Universiti Kebangsaan Malaysia
568. Pusat Rawatan Dialisis Fungates Superflow-NKF
569. Pusat Rawatan Dialisis Good Health-NKF (Kg
Pandan)
570. Pusat Rawatan Dialisis Islah (KL)
571. Pusat Rawatan Dialisis Nefro Utama (Setapak)
572. Renal Dialysis Centre
573. S.P. Menon Dialysis Centre (Kuala Lumpur)
574. Sentosa Medical Centre
575. Smartcare Dialysis Clinic (Cheras)
576. The Kidney Dialysis Centre (1)
577. The Kidney Dialysis Centre (2)
578. The Nayang-NKF Dialysis Centre
579. Tung Shin Hospital
580. Tung Shin Hospital & Yayasan Nanyang Press
581. University Malaya Medical Centre
582. University Malaya Specialist Centre
583. YKN Dialisis (Kuala Lumpur)

xiv
PARTICIPATING PD CENTRES 2011
Johor Darul Takzim
1. BP Renal Care (Batu Pahat)
2. BP Renal Care (Segamat)
3. Hospital Pakar Sultanah Fatimah (Muar)
4. Puteri Specialist Hospital,
5. Sultan Ismail Hospital (Paed)
6. Sultanah Aminah Hospital
Kedah Darul Aman
7. Sultanah Bahiyah Hospital
Kelantan Darul Naim
8. Raja Perempuan Zainab II Hospital
9. Universiti Sains Malaysia Hospital
Negeri Melaka
10. Melaka Hospital
Negeri Sembilan Darul Khusus
11. Tuanku Ja'afar Hospital (Paed)
12. Tuanku Ja'afar Hospital
Pahang Darul Makmur
13. Tengku Ampuan Afzan Hospital (Paed)
14. Tengku Ampuan Afzan Hospital
Perak Darul Ridzuan
15. Raja Permaisuri Bainun Hospital
16. Renal Care (Ipoh Specialist)
17. Pulau Pinang Hospital (Paed)
Penang
18. Pulau Pinang Hospital
Sabah
19. Duchess of Kent Hospital
20. Likas Hospital (Paed)
21. Queen Elizabeth Hospital
Sarawak
22. Normah Medical Specialist Centre
23. Sarawak General Hospital
Selangor Darul Ehsan
24. Selayang Hospital (Paed)
25. Selayang Hospital
26. Serdang Hospital
27. Sri Kota Medical Centre
28. Tengku Ampuan Rahimah Hospital
Terengganu Darul Iman
29. Sultanah Nur Zahirah Hospital
Wilayah Persekutuan Kuala Lumpur
30. Kuala Lumpur Hospital (Paed.), CAPD Unit
31. Kuala Lumpur Hospital, CAPD Unit
32. Prince Court Medical Centre, CAPD Unit
33. Pusat Perubatan Universiti Kebangsaan
Malaysia, CAPD Unit
34. Renal Dialysis Centre, CAPD Unit
35. University Malaya Medical Centre, CAPD Unit

xv
Johor Darul Takzim
1. Batu Pahat Hospital
2. Kluang Hospital
3. Mersing Hospital
4. Pakar Sultanah Fatimah Muar Hospital
5. Pontian Hospital
6. Segamat Hospital
7. Sultan Ismail Hospital (Paed)
8. Sultan Ismail Pandan Hospital
9. Sultanah Aminah Hospital
Kedah Darul Aman
10. Sultanah Bahiyah Hospital
Kelantan Darul Naim
11. Raja Perempuan Zainab II Hospital
12. Universiti Sains Malaysia Hospital
Negeri Melaka
13. Melaka Hospital
Negeri Sembilan Darul Khusus
14. Tuanku Ja'afar Hospital
Pahang Darul Makmur
15. Tengku Ampuan Afzan Hospital
Perak Darul Ridzuan
16. Raja Permaisuri Bainun Hospital
17. Renal Care (Ipoh Specialist)
18. Taiping Hospital
Penang
19. Pulau Pinang Hospital
Sabah
20. Duchess of Kent Hospital
25. Tawau Hospital
Sarawak
26. Bintulu Hospital
27. Miri Hospital
Selangor Darul Ehsan
31. Assunta Hospital
32. KPJ Ampang Puteri Specialist Hospital
33. Selayang Hospital
34. Serdang Hospital
35. Smartcare Dialysis Centre, Subang Jaya
Terengganu Darul Iman
39. Sultanah Nur Zahirah Hospital
Wilayah Persekutuan Kuala Lumpur
40. Fan Medical Renal Clinic
41. Kuala Lumpur Hospital (Paed)
42. Kuala Lumpur Hospital
43. Prince Court Medical Centre
44. Pusat Perubatan Universiti Kebangsaan
Malaysia
45. University Malaya Medical Centre
21. Klinik Dr Choo & Liew
22. Labuan Hospital
23. Queen Elizabeth Hospital
24. Sabah Medical Centre
28. Sarawak General Hospital
29. Sibu Hospital
30. Timberland Medical Centre
36. Tan Medical Renal Clinic
37. Tg. Ampuan Rahimah Hospital
38. Kemaman Hospital
PARTICIPATING TRANSPLANT FOLLOW-UP CENTRES 2011
xvi
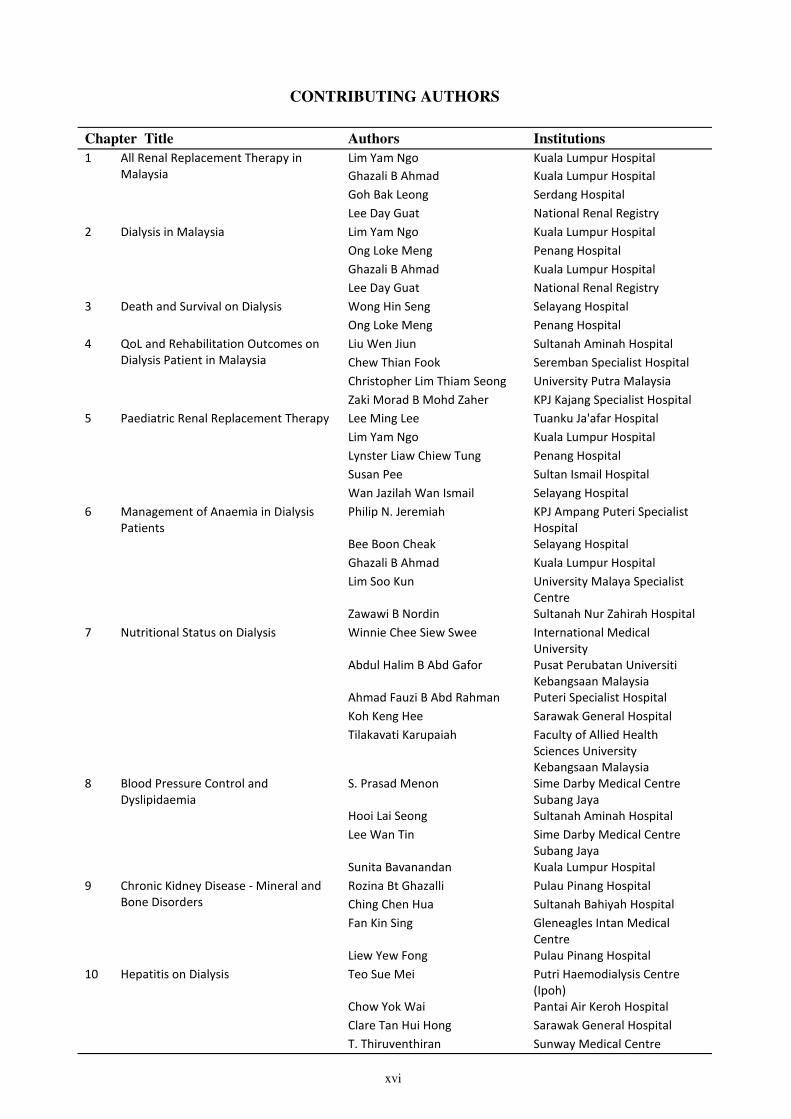
CONTRIBUTING AUTHORS
Chapter Title Authors Institutions
1 All Renal Replacement Therapy in
Malaysia
Lim Yam Ngo Kuala Lumpur Hospital
Ghazali B Ahmad Kuala Lumpur Hospital
Goh Bak Leong Serdang Hospital
Lee Day Guat National Renal Registry
2 Dialysis in Malaysia Lim Yam Ngo Kuala Lumpur Hospital
Ong Loke Meng Penang Hospital
Ghazali B Ahmad Kuala Lumpur Hospital
Lee Day Guat National Renal Registry
3 Death and Survival on Dialysis Wong Hin Seng Selayang Hospital
Ong Loke Meng Penang Hospital
4 QoL and Rehabilitation Outcomes on
Dialysis Patient in Malaysia
Liu Wen Jiun Sultanah Aminah Hospital
Chew Thian Fook Seremban Specialist Hospital
Christopher Lim Thiam Seong University Putra Malaysia
Zaki Morad B Mohd Zaher KPJ Kajang Specialist Hospital
5 Paediatric Renal Replacement Therapy Lee Ming Lee Tuanku Ja'afar Hospital
Lim Yam Ngo Kuala Lumpur Hospital
Lynster Liaw Chiew Tung Penang Hospital
Susan Pee Sultan Ismail Hospital
Wan Jazilah Wan Ismail Selayang Hospital
6 Management of Anaemia in Dialysis
Patients
Philip N. Jeremiah KPJ Ampang Puteri Specialist
Hospital
Bee Boon Cheak Selayang Hospital
Ghazali B Ahmad Kuala Lumpur Hospital
Lim Soo Kun University Malaya Specialist
Centre
Zawawi B Nordin Sultanah Nur Zahirah Hospital
7 Nutritional Status on Dialysis Winnie Chee Siew Swee International Medical
University
Abdul Halim B Abd Gafor Pusat Perubatan Universiti
Kebangsaan Malaysia
Ahmad Fauzi B Abd Rahman Puteri Specialist Hospital
Koh Keng Hee Sarawak General Hospital
Tilakavati Karupaiah Faculty of Allied Health
Sciences University
Kebangsaan Malaysia
8 Blood Pressure Control and
Dyslipidaemia
S. Prasad Menon Sime Darby Medical Centre
Subang Jaya
Hooi Lai Seong Sultanah Aminah Hospital
Lee Wan Tin Sime Darby Medical Centre
Subang Jaya
Sunita Bavanandan Kuala Lumpur Hospital
9 Chronic Kidney Disease - Mineral and
Bone Disorders
Rozina Bt Ghazalli Pulau Pinang Hospital
Ching Chen Hua Sultanah Bahiyah Hospital
Fan Kin Sing Gleneagles Intan Medical
Centre
Liew Yew Fong Pulau Pinang Hospital
10 Hepatitis on Dialysis Teo Sue Mei Putri Haemodialysis Centre
(Ipoh)
Chow Yok Wai Pantai Air Keroh Hospital
Clare Tan Hui Hong Sarawak General Hospital
T. Thiruventhiran Sunway Medical Centre
xvii
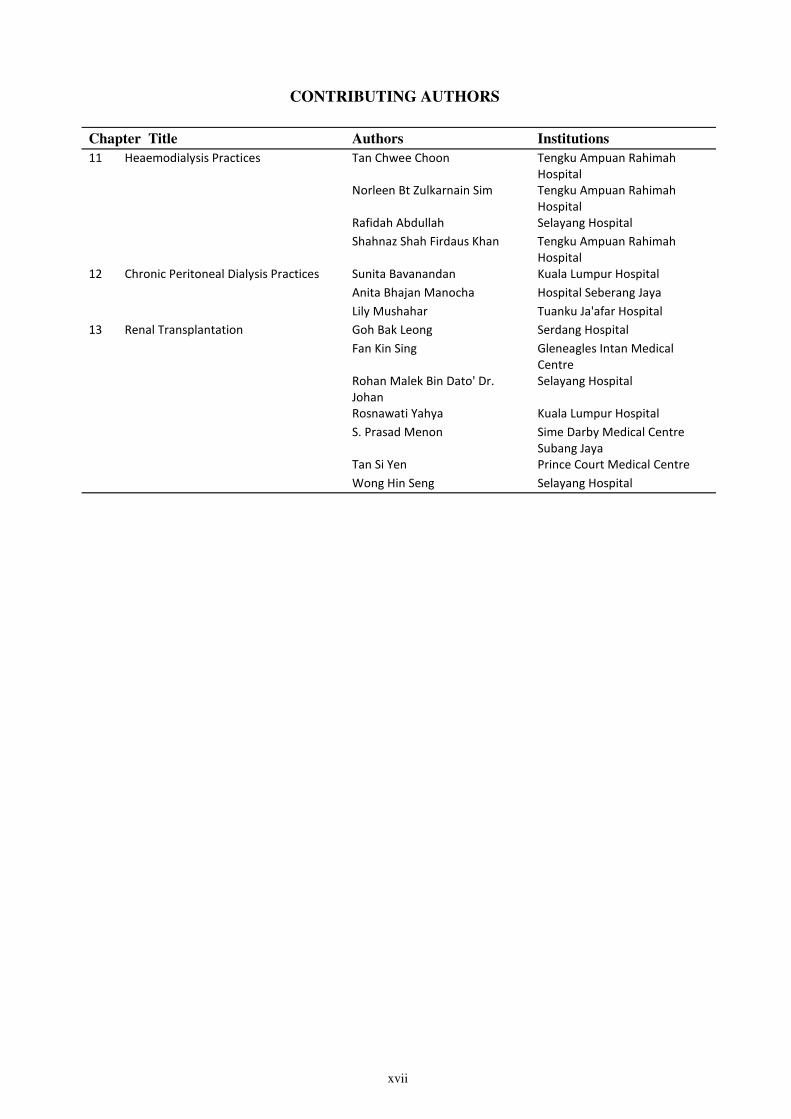
CONTRIBUTING AUTHORS
Chapter Title Authors Institutions
11 Heaemodialysis Practices Tan Chwee Choon Tengku Ampuan Rahimah
Hospital
Norleen Bt Zulkarnain Sim Tengku Ampuan Rahimah
Hospital
Rafidah Abdullah Selayang Hospital
Shahnaz Shah Firdaus Khan Tengku Ampuan Rahimah
Hospital
12 Chronic Peritoneal Dialysis Practices Sunita Bavanandan Kuala Lumpur Hospital
Anita Bhajan Manocha Hospital Seberang Jaya
Lily Mushahar Tuanku Ja'afar Hospital
13 Renal Transplantation Goh Bak Leong Serdang Hospital
Fan Kin Sing Gleneagles Intan Medical
Centre
Rohan Malek Bin Dato' Dr.
Johan
Selayang Hospital
Rosnawati Yahya Kuala Lumpur Hospital
S. Prasad Menon Sime Darby Medical Centre
Subang Jaya
Tan Si Yen Prince Court Medical Centre
Wong Hin Seng Selayang Hospital

xviii
FOREWORD
The last twelve months saw further increase in new dialysis centres across the nation to accommodate new
patients with chronic kidney disease (CKD) needing renal replacement therapy. This increase is fuelled by
a significant growth in the private haemodialysis sector helping to maintain an exceptionally high ratio of
the usage of haemodialysis modality compared to peritoneal dialysis. Even though a positive growth in the
number of local renal transplant from deceased donors is seen lately, the actual number remains seriously
low and is unable to match the rising number of patients being listed in the national transplant waiting list.
Several initiatives taken at the national level to address some of the issues highlighted in past MDTR
reports requiring attention will need further scrutiny to judge its effectiveness. The low ratio of trained
dialysis nurses and medical assistants working in private and NGO HD units is being addressed by
increasing the capacity of post basic renal nursing training and providing more places for such training for
applicants from these two sectors. The need to lower the percentage of patients with renal anaemia
without access to the therapeutically effective treatment with Erythropoeisis Stimulating Agents (ESA)
had prompted the Ministry of Health to introduce ESA subsidy scheme for eligible patients in NGO units
in late 2009. At the regulatory end, formal process of licencing and renewal of licensing of HD units is
happening regularly receiving mixed response from the operators. Whether these developments actually
led to progressive improvements in the quality of the services rendered will require close scrutiny and
further evaluation.
While we are encouraged by the consistently high percentage of participation in the MDTR, the quality of
the participation including the percentage of response in the fields surveyed in the annual return still has
room for improvement. Several initiatives at the national level are being considered to improve the quality
of the annual returns in addition to convincing the habitual non participators that it will be in their interest
to do so eventually.
In addition to providing standard reports annually, we do encourage and welcome further research and
clinical studies related to the data published in the annual report. Currently, a group of researchers from
International Islamic University Malaysia and University Putra Malaysia are working together in
collaboration with the registry and several data providers to focus on specific areas relevant to the
rehabilitation and quality of life in dialysis patients. A study on depression, anxiety and stress in patients
on maintenance Peritoneal and Hemodialysis (Evaluation of Psychological Profile and Quality of Life of
Dialysis Patents in Malaysia) in this country will provide additional information beyond that which was
provided in the annual report. NRR welcome an expression of interest from any relevant party to perform
more quality initiatives aimed at improving the specific or overall outcome of patients on dialysis or post
renal transplant in this country.
As usual, issues related to funding of this useful national initiative loom in the air causing trepidations that
this registry will not out-last its usefulness. All efforts and contributions towards ensuring continued
funding for this important national registry is highly appreciated and treasured.
My heartfelt thanks to everyone including SDPs, corporate sponsors , expert panel members, the Editors,
MDTR advisory committee and NRR committee members, Ministry of Health Malaysia and lastly but not
the least all the members of the management team led by Staff Nurse Lee Day Guat for all the
contributions towards making this 19th MDTR report possible.
Datuk Dr Ghazali Ahmad
Chairman
NRR Advisory Committee
2010-2012
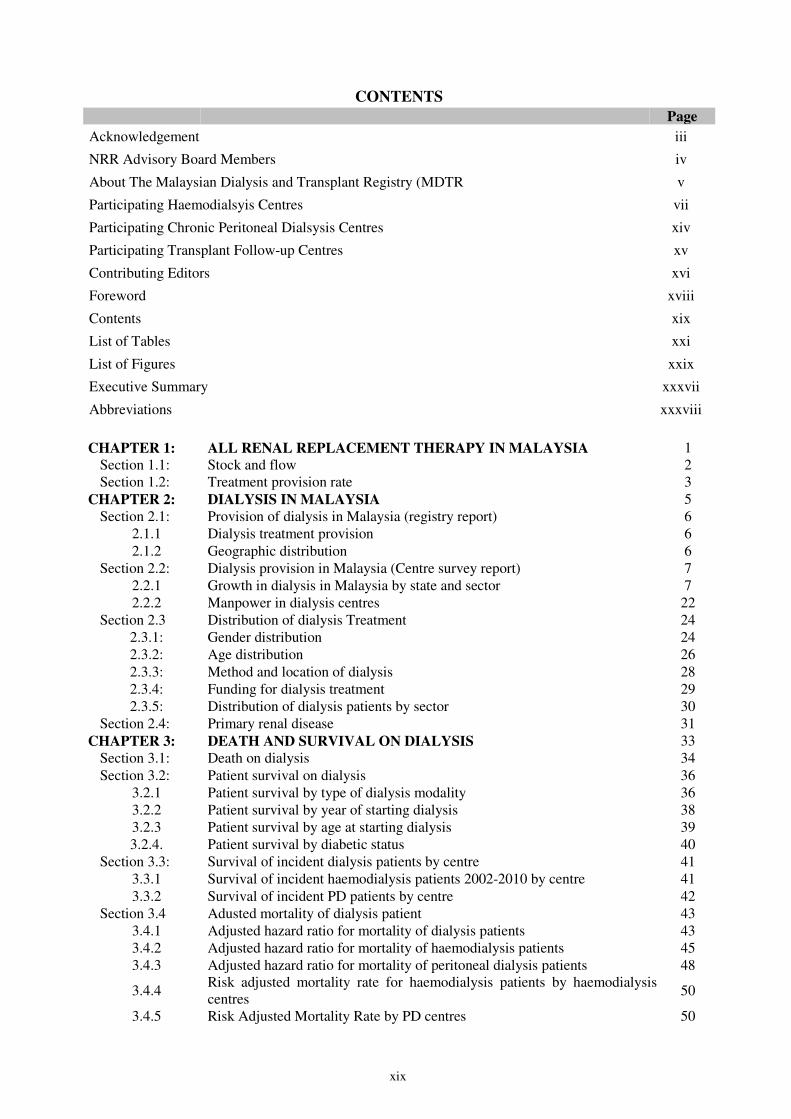
xix
Acknowledgement iii
NRR Advisory Board Members iv
About The Malaysian Dialysis and Transplant Registry (MDTR v
Participating Haemodialsyis Centres vii
Participating Chronic Peritoneal Dialsysis Centres xiv
Participating Transplant Follow-up Centres xv
Contributing Editors xvi
Foreword xviii
Contents xix
List of Tables xxi
List of Figures xxix
Executive Summary xxxvii
Abbreviations xxxviii
CONTENTS
CHAPTER 1: ALL RENAL REPLACEMENT THERAPY IN MALAYSIA 1
Section 1.1: Stock and flow 2
Section 1.2: Treatment provision rate 3
CHAPTER 2: DIALYSIS IN MALAYSIA 5
Section 2.1: Provision of dialysis in Malaysia (registry report) 6
2.1.1 Dialysis treatment provision 6
2.1.2 Geographic distribution 6
Section 2.2: Dialysis provision in Malaysia (Centre survey report) 7
2.2.1 Growth in dialysis in Malaysia by state and sector 7
2.2.2 Manpower in dialysis centres 22
Section 2.3 Distribution of dialysis Treatment 24
2.3.1: Gender distribution 24
2.3.2: Age distribution 26
2.3.3: Method and location of dialysis 28
2.3.4: Funding for dialysis treatment 29
2.3.5: Distribution of dialysis patients by sector 30
Section 2.4: Primary renal disease 31
CHAPTER 3: DEATH AND SURVIVAL ON DIALYSIS 33
Section 3.1: Death on dialysis 34
Section 3.2: Patient survival on dialysis 36
3.2.1 Patient survival by type of dialysis modality 36
3.2.2 Patient survival by year of starting dialysis 38
3.2.3 Patient survival by age at starting dialysis 39
3.2.4. Patient survival by diabetic status 40
Section 3.3: Survival of incident dialysis patients by centre 41
3.3.1 Survival of incident haemodialysis patients 2002-2010 by centre 41
3.3.2 Survival of incident PD patients by centre 42
Section 3.4 Adusted mortality of dialysis patient 43
3.4.1 Adjusted hazard ratio for mortality of dialysis patients 43
3.4.2 Adjusted hazard ratio for mortality of haemodialysis patients 45
3.4.3 Adjusted hazard ratio for mortality of peritoneal dialysis patients 48
3.4.4 Risk adjusted mortality rate for haemodialysis patients by haemodialysis
centres 50
3.4.5 Risk Adjusted Mortality Rate by PD centres 50
Page

xx
Page
CHAPTER 4: QUALITY OF LIFE AND REHABILITATION OUTCOMES OF
DIALYSIS PATIENTS IN MALAYSIA 51
Section A: QoL Index score 52
Section B: Work related rehabilitation 55
CHAPTER 5: PAEDIATRIC RENAL REPLACEMENT THERAPY 57
Section A: RRT provision for paediatric patients 58
Section B: Distribution of paediatric dialysis patients 59
Section C: Primary renal disease 62
Section D: Types of renal transplantation 62
Section E: Survival analysis 63
CHAPTER 6: MANAGEMENT OF ANAEMIA IN DIALYSIS PATIENTS 65
Section 6.1: Treatment for anaemia in patient on Dialysis 66
Section 6.2: Iron status on dialysis 71
Section 6.3: Haemoglobin outcomes on dialysis 79
CHAPTER 7: NUTRITIONAL STATUS ON DIALYSIS 85
Section 7.1: Serum albumin levels on dialysis 86
Section 7.2: Body Mass Index (BMI) on dialysis 89
Section 7.3: Nutritional parameters 92
CHAPTER 8: BLOOD PRESSURE CONTROL AND DYSLIPIDAEMIA 93
Section 8.1: Blood Pressure Control on dialysis 94
Section 8.2: Dyslipidaemia in dialysis patients 102
CHAPTER 9: CHRONIC KIDNEY DISEASE - MINERAL BONE DIORDERS 109
Section 9.1: Treatment of hyperphosphateamia 110
Section 9.2: Serum calcium and phosphate control 112
Section 9.3: Serum parathyroid hormone control 122
CHAPTER 10: HEPATITIS ON DIALYSIS 131
Section A: Prevalence 132
Section B: Centre variation 133
Section C: Seroconversion risks 135
CHAPTER 11: HAEMODIALYSIS PRACTICES 139
Section 11.1: Vascular access and its complications 140
Section 11.2: HD prescription 143
Section 11.3: Technique survival on dialysis 154
CHAPTER 12: PERITONEAL DIALYSIS PRACTICES 161
Section 12.1 Modalities and prescription of PD 162
Section 12. 2 Achievement of solute clearance and peritoneal transport 164
Section 12.3 Technique survival on PD 166
Section 12.4 PD Peritonitis 175
CHAPTER 13: RENAL TRANSPLANTATION 181
Section 13.1: Stock and flow 182
Section 13.2: Recipients' charateristics 184
Section 13.3: Transplant practices 185
Section 13.4: Transplant outcomes 189
13.4.1: Post ransplant complications 189
13.4.2 Deaths and graft loss 189
Section 13.5: Patient and graft survival 191
Section 13.6: Cardiovascular risk in renal transplant recipients 197
13.6.1 Risk factors for ischaemic heart disease 197
13.6.2 Blood pressure classification according to JNC VI criteria, 2007-2011 198
13.6.3 Level of allograft function 200
13.6.4 Body mass Index 200
13.6.5 Lipid profile 201
13.6.7 Blood pressure control 202
Section 13.7: QoL index score in renal transplant recipients 204
APPENDIX I DATA MANAGEMENT I – IV
APPENDIX II ANALYSIS SETS, STATISTICAL METHODS AND DEFINITIONS V– X

xxi
LIST OF TABLES
Chapter Table Listing Page
Table 1.1 Stock and flow of RRT, Malaysia 2002-2011 2
Table 1.2 New dialysis acceptance rate and new transplant rate per million population
2002-2011 3
Table 1.3 RRT prevalence rate per million population 2002-2011 3
Table 2.1.1 Stock and flow-Dialysis Patients 2002-2011 6
Table 2.1.2 Dialysis Treatment Rate per million population 2002-2011 6
Table 2.1.3 Dialysis Treatment Rate by state, per million population 2002-2011 6
Table 2.2.1 Number and density of Dialysis Centres in Malaysia by State and Sector,
Year 2002 to 2011. 7
Table 2.2.2 Number and density of HD centres in Malaysia by State and Sector, 2002-
2011 9
Table 2.2.3 Number and density of PD centres in Malaysia by State and Sector, 2002-
2011 11
Table 2.2.4 Number and density of HD machines in Malaysia by State and Sector, 2002-
2011 13
Table 2.2.5 Number and Prevalence Rate of Dialysis Patients (HD & PD) in Malaysia by
State and Sector, 2002-2011 15
Table 2.2.6 Number and Prevalence Rate of Hemodialysis Patients in Malaysia by State
and Sector, 2002-2011 17
Table 2.2.7 Number and Prevalence Rate of PD Patients in Malaysia by State and Sector,
2002-2011 18
Table 2.2.8 HD Capacity to Patient Ratio among HD Centres in Malaysia by State and
Sector, 2002-2011 20
Table 2.2.9 Number & density of Certified Dialysis Nurses/ Medical technicians in
Malaysia by State and Sector, 2002-2011 22
Table 2.3.1(a) Dialysis Treatment Rate by Gender, per million male or female population
2002-2011 24
Table 2.3.1(b) Gender Distribution of Dialysis Patients 2002-2011 25
Table 2.3.2 (a) Dialysis Treatment Rate by Age Group, per million age group population
2002-2011 26
Table 2.3.2 Percentage Age Distribution of Dialysis Patients 2002-2011 27
Table 2.3.3 Method and Location of Dialysis Patients 2002-2011 28
Table 2.3.4 Funding for Dialysis Treatment 2002-2011 29
Table 2.3.5 Distribution of Dialysis Patients by Sector 2002-2011 30
Table 2.4.1 Primary Renal Diseases 2002-2011 31
Table 3.1.1 Deaths on dialysis 2002-2011 34
Table 3.1.2 Causes of death on dialysis 2002-2011 35
Table 3.2.1(a) Patient survival by dialysis modality analysis (censored for change of
modality) 36
Table 3.2.1(b) Patient survival by dialysis modality analysis (not censored for change of
modality) 37
Table 3.2.2 Unadjusted patient survival by year of entry, 2002-2011 38
Table 3.2.3 Unadjusted patient survival by age, 2002-2011 39
Table 3.2.4 Unadjusted patient survival by diabetes mellitus status, 2002-2011 40
Table 3.4.1 Adjusted hazard ratio for mortality of dialysis patients uncensored for change
of modality (2002-2011) 43
Table 3.4.2 Adjusted hazard ratio for mortality of HD patients uncensored for change of
modality (2002-2011 cohort) 46
Table 3.4.3 Adjusted hazard ratio for mortality of PD patients uncensored for change of
modality (2002-2011 cohort) 48
Table 4.1 Cumulative distribution of QoL-Index score in relation to dialysis modality,
all dialysis patients 2002-2011 52

xxii
LIST OF TABLES
Chapter Table Listing Page
Table 4.2 Cumulative distribution of QoL-Index score in relation to DM, all dialysis
patients 2002-2011 52
Table 4.3 Cumulative distribution of QoL-index score in relation to gender, all dialysis
patients 2002-2011 53
Table 4.4 Cumulative distribution of QoL-index score in relation to age, all dialysis
patients 2002-2011 53
Table 4.5 Cumulative distribution of QoL-Index score in relation to year of entry, HD
patients 2002-2011 53
Table 4.6 Cumulative distribution of QoL-Index score in relation to year of entry, PD
patients 2002-2011 54
Table 4.7 Work related rehabilitation in relation to modality, dialysis patients, 2002 to
2011 55
Table 4.8: Work related rehabilitation in relation to year of entry, HD patients 2002 to
2011 55
Table 4.9: Work related rehabilitation in relation to year of entry, PD patients 2002 to
2011 55
Table 5.1 Stock and flow of Paediatric Renal Replacement Therapy (RRT) 2002-2011 58
Table 5.2 Paediatric dialysis and transplant rates per million age-group population 2002-
2011 59
Table 5.3(a) Dialysis treatment rate by state, per million state age group populations, 2002-
2011 59
Table 5.3(b) New dialysis patients by state, 2002-2011 59
Table 5.4 Number of new dialysis and transplant patients by gender 2002-2011 60
(a) New Dialysis 60
(b) New Transplant 60
Table 5.5 New RRT rate, per million age related population by age group 2002-2011 60
Table 5.6 New dialysis by treatment modality 2002-2011 61
Table 5.7 New dialysis by sector 2002-2011 61
Table 5.8 Primary renal disease by sex, 2002-2011 62
Table 5.9 Types of renal transplantation, 2002-2011 62
Table 5.10(a) Patient survival by dialysis modality analysis (not censored with change of
modality) 63
Table 5.10(b) Patient survival by dialysis modality analysis (censored with change of
modality) 64
Table 5.11 Dialysis technique survival by modality, 2002-2011 64
Table 5.12 Transplant graft survival, 2002-2011 64
Table 6.1.1 Treatment for anaemia, HD patients 2002-2011 66
Table 6.1.2 Treatment for anaemia, PD patients 2002-2011 66
Table 6.1.3 Variation in Erythropoiesis-Stimulating Agents (ESAs) utilization (%
patients) among HD centres, 2002-2011 67
Table 6.1.4 Variation in ESAs utilization (% patients) among PD centres, 2002-2011 68
Table 6.1.5 Variation in mean weekly ESAs dose (u/week) among HD centres, 2002-2011 68
Table 6.1.6 Variation in mean weekly ESAs dose (u/week) among PD centres, 2002-2011 69
Table 6.1.7 Variation in use of blood transfusion (% patients) among HD centres, 2002-
2011 69
Table 6.1.8 Variation in use of blood transfusion (% patients) among PD centres, 2002-
2011 70
Table 6.2.1 Distribution of serum ferritin without ESAs, HD patients 2002-2011 71
Table 6.2.2 Distribution of serum ferritin without ESAs, PD patients 2002-2011 72
Table 6.2.3 Distribution of serum ferritin on ESAs, HD patients 2002-2011 72
Table 6.2.4 Distribution of serum ferritin on ESAs, PD patients 2002-2011 72
Table 6.2.5 Distribution of transferrin saturation without ESAs, HD patients, 2002-2011 73

xxiii
LIST OF TABLES
Chapter Table Listing Page
Table 6.2.9(a) Variation in medium serum ferritin among patients on ESAs 75
Table 6.2.9 (b) Proportion of patients on ESAs with serum ferritin ≥200 ng/ml, HD centres 75
Table 6.2.9(c) Median transferrin saturation among patients on ESAs, HD centres 76
Table 6.2.9 (d) Proportion of patients on ESAs with transferrin saturation ≥ 20%, HD centres 76
Table 6.2.10(d) Proportion of patients on ESAs with transferring saturation ≥ 20%, PD
centres 78
Table 6.3.1 Distribution of haemoglobin concentration without ESAs, HD patients 2002-
2011 79
Table 6.3.2 Distribution of haemoglobin concentration without ESAs, PD patients 2002-
2011 80
Table 6.3.3(a) Distribution of haemoglobin concentration on ESAs, diabetes HD patients
2002-2011 80
Table 6.3.3(b) Distribution of haemoglobin concentration on ESAs, non-diabetes HD
patients 2002-2011 81
Table 6.3.4(a) Distribution of haemoglobin concentration on ESAs, diabetes PD patients
2002-2011 81
Table 6.3.4(b) Distribution of haemoglobin concentration on ESAs, non-diabetes PD
patients 2002-2011 82
Table 6.3.5(a) Variation in median haemoglobin level among patients on ESAs, HD centres
2002-2011 83
Table 6.3.5 (b) Proportion of patients on ESAs with haemoglobin level > 10g/dL, HD centres 83
Table 6.3.6 (a) Variation in Median haemoglobin level among patients on ESAs, PD centres
2002-2011 84
Table 6.3.6 (b) Proportion of patients on ESAs with haemoglobin level > 10g/dL, PD centres 84
Table 7.1.1 Distribution of serum albumin, HD patients, 2002-2011 86
Table 7.1.2 Distribution of serum albumin, PD patients, 2002-2011 87
Table 7.1.3 Proportion of patients with serum albumin ≥40g/L among HD centres, 2002-
2011 88
Table 7.1.4 Proportion of patients with serum albumin ≥40g/L among PD centres, 2002-
2011 88
Table 7.2.1 Distribution of BMI, HD patients, 2002-2011 89
Table 7.2.2 Distribution of BMI, PD patients 2002-2011 89
Table 7.2.3 Proportion of patients with BMI ≥18.5 among HD centres, 2002-2011 90
Table 7.2.4 Proportion of patients with BMI ≥18.5 among PD centres, 2002-2011 90
Table 7.2.5 Proportion of patients with BMI ≥18.5 and serum albumin ≥40 g/dL among
HD centres, 2002-2011 91
Table 7.2.6 Proportion of patients with BMI ≥18.5 and serum albumin ≥40 g/dL among
PD centres, 2002-2011 91
Table 7.3.1 Nutritional parameters between HD and PD patients, 2011 92
Table 7.3.2(a) Nutritional parameters between diabetic and non-diabetic HD patients, 2011 92
Table 7.3.2(b) Nutritional parameters between diabetic and non-diabetic PD patients, 2011 92
Table 7.3.3(a) Distribution of serum albumin and BMI by duration of dialysis among HD
patients, 2002-2011 92
Table 7.3.3(b) Distribution of serum albumin and BMI by duration of dialysis among PD
patients, 2002-2011 92
Table 6.2.10(c) Median transferrin saturation among patients on ESAs, PD centres 78
Table 6.2.10(b) Proportion of patients on ESAs with serum ferritin ≥100 ng/ml, PD centres 77
Table 6.2.10 Variation in iron status outcomes among patients on ESAs, PD centres 2002-
2011 77
Table 6.2.9 Variation in iron status outcomes among HD centres, 2002-2011 75
Table 6.2.10(a) Medium serum ferritin among patients on ESAs 77
Table 6.2.8 Distribution of transferrin saturation on ESAs, PD patients, 2002-2011 74
Table 6.2.7 Distribution of transferrin saturation on ESAs, HD patients, 2002-2011 74
Table 6.2.6 Distribution of transferrin saturation without ESAs, PD patients, 2002-2011 73

xxiv
LIST OF TABLES
Chapter Table Listing Page
Table 8.1.1 Distribution of pre dialysis systolic blood pressure, HD patients 2002-2011 94
Table 8.1.2 Distribution of pre dialysis systolic blood pressure, PD patients 2002-2011 95
Table 8.1.3 Distribution of pre dialysis diastolic blood pressure, HD patients 2002-2011 96
Table 8.1.4 Distribution of pre dialysis diastolic blood pressure, PD patients 2002-2011 97
Table 8.1.5 Variation in BP control among HD centres 2002-2011 98
Table 8.1.5(a) Median systolic blood pressure among HD patients, HD centres 98
Table 8.1.5(b) Median diastolic blood pressure among HD patients, HD centres 98
Table 8.1.5(c) Proportion of HD patients with pre dialysis blood pressure < 140/90 mmHg,
HD centres 99
Table 8.1.6 Variation in BP control among PD centres 2002-2011 100
Table 8.1.6 (a) Median systolic blood pressure among PD patients, PD centres 100
Table 8.1.6 (b) Median diastolic blood pressure among PD patients, PD centres 100
Table 8.1.6 (c) Proportion of PD patients with pre dialysis blood pressure <140/90 mmHg,
PD centres 101
Table 8.2.1 Distribution of serum cholesterol, HD patients 2002-2011 102
Table 8.2.2 Distribution of serum cholesterol, PD patients 2002-2011 102
Table 8.2.3 Distribution of serum triglyceride, HD patients 2002-2011 103
Table 8.2.4 Distribution of serum triglyceride, PD patients 2002-2011 103
Table 8.2.5 Variation in dyslipidaemia among HD centres 2002-2011 104
Table 8.2.5(a) Median serum cholesterol level among HD patients, HD centres 104
Table 8.2.5(b) Proportion of HD patients with serum cholesterol < 5.3 mmol/l, HD centres 104
Table 8.2.5(c) Median serum triglyceride level among HD patients, HD centres 105
Table 8.2.5(d) Proportion of HD patients with serum triglyceride < 2.1 mmol/L, HD centres 105
Table 8.2.6 Variation in dyslipidaemia among PD centres 2002-2011 106
Table 8.2.6(a) Median serum cholesterol level among PD patients, PD centres 106
Table 8.2.6(b) Proportion of PD patients with serum cholesterol < 5.3 mmol/L, PD centres 106
Table 8.2.6(c) Median serum triglyceride level among PD patients, PD centres 107
Table 8.2.6(d) Proportion of PD patients with serum triglyceride < 2.1 mmol/L, PD centres 107
Table 9.1.1 Phosphate binder in HD patients, 2002-2011 110
Table 9.1.2 Phosphate binder in PD patients, 2002-2011 110
Table 9.1.3 Phosphate binders by sector in HD patients 111
Table 9.2.1 Distribution of corrected serum calcium, HD patients, 2002-2011 112
Table 9.2.2 Distribution of corrected serum calcium, PD patients, 2002-2011 112
Table 9.2.3 Distribution of serum phosphate, HD patients, 2002-2011 113
Table 9.2.4 Distribution of serum phosphate, PD patients, 2002-2011 113
Table 9.2.5 Distribution of corrected calcium x phosphate product, HD patients 2002-
2011 114
Table 9.2.6 Distribution of corrected calcium x phosphate product, PD patients 2002-
2011 114
Table 9.2.7(a) Variation in corrected median serum calcium level among HD centres 2002-
2011 115
Table 9.2.8(a) Variation in corrected median serum calcium level among PD centres 2002-
2011 115
Table 9.2.7(b) Proportion of patients with serum calcium 2.1 to 2.37 mmol/L, HD centres,
2002- 2011 116
Table 9.2.8(b) Proportion of patients with serum calcium 2.1 to 2.37 mmol/L, PD centres 116
Table 9.2.9(a) Variation in median serum phosphate level among HD centres, 2002- 2011 117
Table 9.2.10(a) Variation in median serum phosphate levels among PD centres 2002-2011 117
Table 9.2.9(b) Proportion of patients with serum phosphate 1.13-1.78 mmol/L, HD centres,
2002-2011 118
Table 9.2.10(b) Proportion of patients with serum phosphate 1.13-1.78 mmol/L, PD centres
2002-2011 118
Table 9.2.9(c) Proportion of patients with serum phosphate 0.8-1.3 mmol/L, HD centres,
2011 119
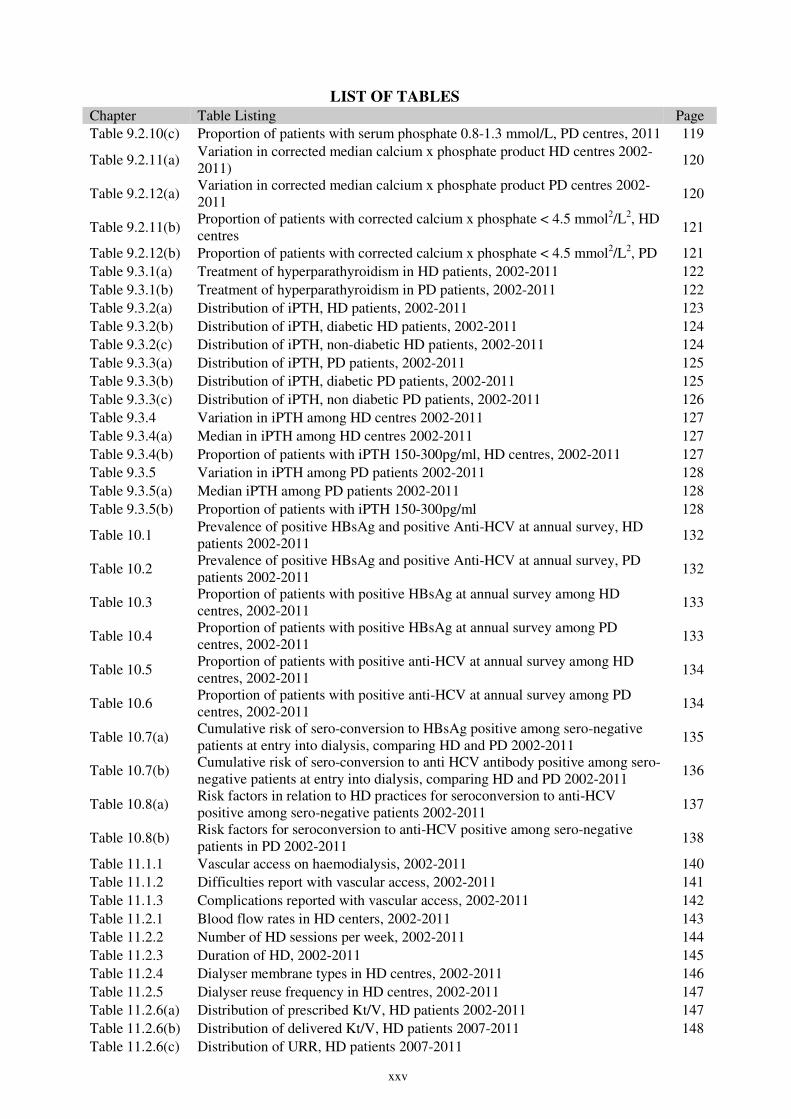
xxv
LIST OF TABLES
Chapter Table Listing Page
Table 9.2.10(c) Proportion of patients with serum phosphate 0.8-1.3 mmol/L, PD centres, 2011 119
Table 9.2.11(a) Variation in corrected median calcium x phosphate product HD centres 2002-
2011) 120
Table 9.2.12(a) Variation in corrected median calcium x phosphate product PD centres 2002-
2011 120
Table 9.2.11(b) Proportion of patients with corrected calcium x phosphate < 4.5 mmol2/L2, HD
centres 121
Table 9.2.12(b) Proportion of patients with corrected calcium x phosphate < 4.5 mmol2/L2, PD 121
Table 9.3.1(a) Treatment of hyperparathyroidism in HD patients, 2002-2011 122
Table 9.3.1(b) Treatment of hyperparathyroidism in PD patients, 2002-2011 122
Table 9.3.2(a) Distribution of iPTH, HD patients, 2002-2011 123
Table 9.3.2(b) Distribution of iPTH, diabetic HD patients, 2002-2011 124
Table 9.3.2(c) Distribution of iPTH, non-diabetic HD patients, 2002-2011 124
Table 9.3.3(a) Distribution of iPTH, PD patients, 2002-2011 125
Table 9.3.3(b) Distribution of iPTH, diabetic PD patients, 2002-2011 125
Table 9.3.3(c) Distribution of iPTH, non diabetic PD patients, 2002-2011 126
Table 9.3.4 Variation in iPTH among HD centres 2002-2011 127
Table 9.3.4(a) Median in iPTH among HD centres 2002-2011 127
Table 9.3.4(b) Proportion of patients with iPTH 150-300pg/ml, HD centres, 2002-2011 127
Table 9.3.5 Variation in iPTH among PD patients 2002-2011 128
Table 9.3.5(a) Median iPTH among PD patients 2002-2011 128
Table 9.3.5(b) Proportion of patients with iPTH 150-300pg/ml 128
Table 10.1 Prevalence of positive HBsAg and positive Anti-HCV at annual survey, HD
patients 2002-2011 132
Table 10.2 Prevalence of positive HBsAg and positive Anti-HCV at annual survey, PD
patients 2002-2011 132
Table 10.3 Proportion of patients with positive HBsAg at annual survey among HD
centres, 2002-2011 133
Table 10.4 Proportion of patients with positive HBsAg at annual survey among PD
centres, 2002-2011 133
Table 10.5 Proportion of patients with positive anti-HCV at annual survey among HD
centres, 2002-2011 134
Table 10.6 Proportion of patients with positive anti-HCV at annual survey among PD
centres, 2002-2011 134
Table 10.7(a) Cumulative risk of sero-conversion to HBsAg positive among sero-negative
patients at entry into dialysis, comparing HD and PD 2002-2011 135
Table 10.7(b) Cumulative risk of sero-conversion to anti HCV antibody positive among sero-
negative patients at entry into dialysis, comparing HD and PD 2002-2011 136
Table 10.8(a) Risk factors in relation to HD practices for seroconversion to anti-HCV
positive among sero-negative patients 2002-2011 137
Table 10.8(b) Risk factors for seroconversion to anti-HCV positive among sero-negative
patients in PD 2002-2011 138
Table 11.1.1 Vascular access on haemodialysis, 2002-2011 140
Table 11.1.2 Difficulties report with vascular access, 2002-2011 141
Table 11.1.3 Complications reported with vascular access, 2002-2011 142
Table 11.2.1 Blood flow rates in HD centers, 2002-2011 143
Table 11.2.2 Number of HD sessions per week, 2002-2011 144
Table 11.2.3 Duration of HD, 2002-2011 145
Table 11.2.4 Dialyser membrane types in HD centres, 2002-2011 146
Table 11.2.5 Dialyser reuse frequency in HD centres, 2002-2011 147
Table 11.2.6(a) Distribution of prescribed Kt/V, HD patients 2002-2011 147
Table 11.2.6(b) Distribution of delivered Kt/V, HD patients 2007-2011 148
Table 11.2.6(c) Distribution of URR, HD patients 2007-2011
xxvi
LIST OF TABLES
Chapter Table Listing Page
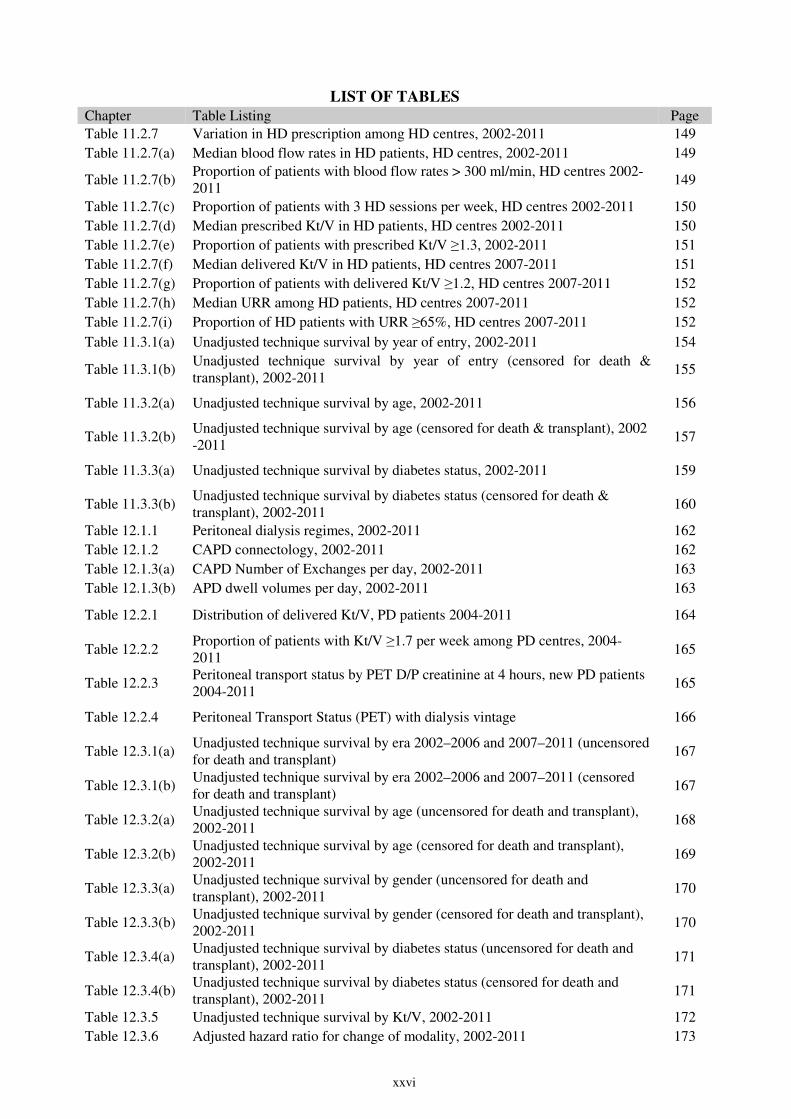
Table 11.2.7 Variation in HD prescription among HD centres, 2002-2011 149
Table 11.2.7(a) Median blood flow rates in HD patients, HD centres, 2002-2011 149
Table 11.2.7(b) Proportion of patients with blood flow rates > 300 ml/min, HD centres 2002-
2011 149
Table 11.2.7(c) Proportion of patients with 3 HD sessions per week, HD centres 2002-2011 150
Table 11.2.7(d) Median prescribed Kt/V in HD patients, HD centres 2002-2011 150
Table 11.2.7(e) Proportion of patients with prescribed Kt/V ≥1.3, 2002-2011 151
Table 11.2.7(f) Median delivered Kt/V in HD patients, HD centres 2007-2011 151
Table 11.2.7(g) Proportion of patients with delivered Kt/V ≥1.2, HD centres 2007-2011 152
Table 11.2.7(h) Median URR among HD patients, HD centres 2007-2011 152
Table 11.2.7(i) Proportion of HD patients with URR ≥65%, HD centres 2007-2011 152
Table 11.3.1(a) Unadjusted technique survival by year of entry, 2002-2011 154
Table 11.3.3(a) Unadjusted technique survival by diabetes status, 2002-2011 159
Table 11.3.3(b) Unadjusted technique survival by diabetes status (censored for death &
transplant), 2002-2011 160
Table 12.1.1 Peritoneal dialysis regimes, 2002-2011 162
Table 12.1.2 CAPD connectology, 2002-2011 162
Table 12.1.3(a) CAPD Number of Exchanges per day, 2002-2011 163
Table 12.1.3(b) APD dwell volumes per day, 2002-2011 163
Table 12.2.1 Distribution of delivered Kt/V, PD patients 2004-2011 164
Table 12.2.2 Proportion of patients with Kt/V ≥1.7 per week among PD centres, 2004-
2011 165
Table 12.2.3 Peritoneal transport status by PET D/P creatinine at 4 hours, new PD patients
2004-2011 165
Table 12.2.4 Peritoneal Transport Status (PET) with dialysis vintage 166
Table 12.3.1(a) Unadjusted technique survival by era 2002–2006 and 2007–2011 (uncensored
for death and transplant) 167
Table 12.3.1(b) Unadjusted technique survival by era 2002–2006 and 2007–2011 (censored
for death and transplant) 167
Table 12.3.2(a) Unadjusted technique survival by age (uncensored for death and transplant),
2002-2011 168
Table 12.3.2(b) Unadjusted technique survival by age (censored for death and transplant),
2002-2011 169
Table 12.3.3(a) Unadjusted technique survival by gender (uncensored for death and
transplant), 2002-2011 170
Table 12.3.3(b) Unadjusted technique survival by gender (censored for death and transplant),
2002-2011 170
Table 12.3.4(a) Unadjusted technique survival by diabetes status (uncensored for death and
transplant), 2002-2011 171
Table 12.3.4(b) Unadjusted technique survival by diabetes status (censored for death and
transplant), 2002-2011 171
Table 12.3.5 Unadjusted technique survival by Kt/V, 2002-2011 172
Table 12.3.6 Adjusted hazard ratio for change of modality, 2002-2011 173
Table 11.3.2(b) Unadjusted technique survival by age (censored for death & transplant), 2002
-2011 157
Table 11.3.2(a) Unadjusted technique survival by age, 2002-2011 156
Table 11.3.1(b) Unadjusted technique survival by year of entry (censored for death &
transplant), 2002-2011 155

xxvii
LIST OF TABLES
Chapter Table Listing Page
Table 12.3.7(a) Reasons for drop-out from PD program, 2002-2011 174
Table 12.3.7(b) Drop-out rate from PD program with time on treatment, 2002-2011 174
Table 12.3.8 Time on PD (2002-2011) 174
Table 12.4.1 Variation in peritonitis rate (pt-month/epi) among PD centres, 2002-2011 175
Table 12.4.2(a) Causative organism in PD peritonitis, 2002-2011 176
Table 12.4.3(a) Outcome of peritonitis by causative organism, 2002-2006 177
Table 12.4.3(b) Outcome of peritonitis by causative organism, 2007-2011 178
Table 12.4.4 Risk factor influencing peritonitis rate, 2002-2011 179
Table 13.1.1 Stock and flow of renal transplantation, 2002-2011 182
Table 13.1.2 New transplant rate per million population (pmp), 2002-2011 183
Table 13.1.3 Transplant prevalence rate per million population (pmp), 2002-2011 183
Table 13.1.4 Place of transplantation, 2002-2011 183
Table 13.2.1 Renal transplant recipients’ characteristics, 2002-2011 184
Table 13.2.2 Primary causes of end stage renal failure, 2002-2011 (new) 184
Table 13.3.1 Type of renal transplantation, 2002-2011 185
Table 13.3.2 Biochemical data, 2007-2011 186
Table 13.3.3 Medication data, 2007-2011 188
Table 13.4.1 Post-transplant complications, 2007-2011 189
Table 13.4.2 Transplant patients death rate and graft loss, 2002-2011 190
Table 13.4.3 Causes of death in transplant recipients, 2002-2011 190
Table 13.4.4 Causes of graft failure, 2002-2011 191
Table 13.5.1(a) Patient survival, 2002-2011 191
Table 13.5.1(b) Risk factors for transplant patient survival 2002-2011 192
Table 13.5.2(a) Graft survival, 2002-2011 193
Table 13.5.2(b) Risk factors for transplant graft survival 2002-2011 193
Table 13.5.3 Unadjusted patient survival by type of transplant, 2002-2011 194
Table 13.5.4 Graft survival by type of transplant, 2002-2011 195
Table 13.5.5 Patient survival by year of transplant (Living related transplant, 2002-2011) 195
Table13.5.6 Graft survival by year of transplant (Living related transplant, 2002-2011) 196
Table 13.5.7 Patient survival by year of transplant (Commercial cadaver transplant, 2002-
2011) 196
Table 13.5.8 Graft survival by year of transplant (Commercial cadaver transplant, 2002-
2011) 197
Table 13.6.1 Risk factors for IHD in renal transplant recipients at year 2007-2011 197
Table 13.6.2(a) Systolic BP, 2007-2011 199
Table 13.6.2(b) Diastolic BP, 2007-2011 199
Table 13.6.3 CKD stages, 2007-2011 200
Table 13.6.4 BMI, 2007-2011 200
Table 13.6.5(a) LDL, 2007-2011 201
Table 13.6.5(b) Total cholesterol, 2007-2011 201
Table 13.6.5(c) HDL, 2007-2011 202
Table 13.6.6(a) Treatment for hypertension, 2007-2011 202
Table 13.6.6(b) Distribution of systolic BP without anti-hypertensives, 2007-2011 202
Table 13.6.6(c) Distribution of diastolic BP without anti-hypertensives, 2007-2011 203
Table 13.6.6(d) Distribution of systolic BP on anti-hypertensives, 2007-2011 203
Table 13.6.6(e) Distribution of diastolic BP on anti-hypertensives, 2007-2011 203
Table 13.7.1 Cumulative distribution of QoL-Index score in relation to dialysis modality,
transplant recipient patients 2002-2011 204
Table 13.7.2 Cumulative distribution of QoL-Index score in relation to diabetes mellitus,
transplant recipient patients 2002-2011 204
xxviii
LIST OF TABLES
Chapter Table Listing Page
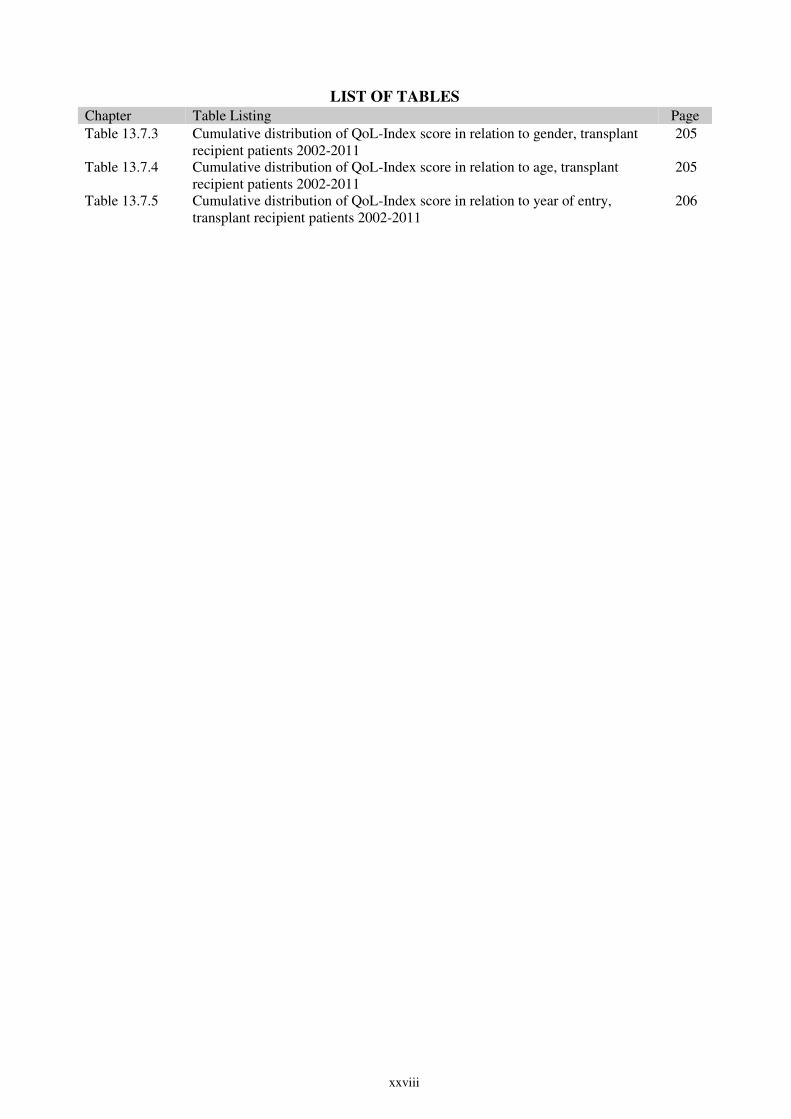
Table 13.7.3 Cumulative distribution of QoL-Index score in relation to gender, transplant
recipient patients 2002-2011
205
Table 13.7.4 Cumulative distribution of QoL-Index score in relation to age, transplant
recipient patients 2002-2011
205
Table 13.7.5 Cumulative distribution of QoL-Index score in relation to year of entry,
transplant recipient patients 2002-2011
206

xxix
LIST OF FIGURES
Table/Figure Label Page
Figure 1.1 Stock and flow of RRT, Malaysia 2002-2011 2
(a) New dialysis and transplant patients 2
(b) Patients dialysing and with functioning transplant at 31st December 2002-
2011 2
Figure 1.2 New dialysis acceptance and new transplant rate 2002-2011 3
Figure 1.3 Dialysis and transplant prevalence rate per million population 2002-2011 3
Figure 2.2.1(a) Number of Dialysis Centre in Malaysia by Sector, 2002 to 2011 9
Figure 2.2.1(b) Number of Dialysis Centre in Malaysia by State and Sector in 2011 9
Figure 2.2.4(a) Number of HD machines in Malaysia by Sector from Year 2002 to 2011 14
Figure 2.2.4(b) Number of HD machines in Malaysia by State and Sector in Year 2011 14
Figure 2.2.5(a) Number of Dialysis Patient (HD+PD) in Malaysia by Sector from 2002-2011 16
Figure 2.2.5(b) Number of Dialysis Patient (HD+PD) in Malaysia by State and Sector in
2011 16
Figure 2.2.8(a) HD Capacity to Patient Ratio among HD Centres in Malaysia by State and
Sector, 2002-2011 22
Figure 2.2.8(b) HD Capacity to Patient Ratio among HD Centres in Malaysia by State and
sector, 2011 22
Figure 2.2.9(a) Number of Certified Dialysis Nurses/ Medical technicians in Malaysia by
Sector, 2002-2011 24
Figure 2.2.9(b) Number of Certified Dialysis Nurses/ Medical technicians in Malaysia by
State and Sector, 2011 24
Figure 2.3.1(a) Dialysis Treatment Rate by Gender 2002-2011 24
Figure 2.3.1(b) Gender Distribution of Dialysis Patients 2002-2011 25
(i) New Dialysis patients 25
(ii) Dialysing patients at 31st December 25
Figure 2.3.2(a) Dialysis Treatment Rate by Age Group 2002-2011 26
Figure 2.3.2(b) Age Distribution of New Dialysis Patients 2002-2011 27
(i) New Dialysis Patients 27
(ii) Dialysing patients at 31st December 27
Figure 2.3.3 Method and Location of Dialysis Patients 2002-2011 28
(i) New Dialysis Patients 28
(ii) Dialysing patients at 31st December 28
Figure 2.3.4 Funding for Dialysis Treatment 2002-2011 29
(i) New Dialysis Patients 29
(ii) Dialysing patients at 31st December 29
Figure 2.3.5 Distribution of Dialysis Patients by Sector 2002-2011 30
(i) New Dialysis Patients 30
(ii) Dialysing patients at 31st December 30
Figure 2.4.1 Primary Renal Diseases for New Dialysis Patients 2002-2011 31
Figure 3.1.1 Death rates on dialysis 2002-2011 34
Figure 3.2.1(a) Patient survival by dialysis modality analysis (censored for change of
modality) 36
Figure 3.2.1(b) Patient survival by dialysis modality analysis (not censored for change of
modality) 37
Figure 3.2.2 Unadjusted patient survival by year of entry, 2002-2011 38
Figure 3.2.3 Unadjusted patient survival by age, 2002-2011 39
Figure 3.2.4 Unadjusted patient survival by diabetes mellitus status, 2002-2011 40
Figure 3.3.1(a) Variation in patient survival at 1-year among HD centres adjusted for age and
diabetes mellitus status, 2006-2010 41
Figure 3.3.1(b) Funnel plot for adjusted age at 1-year among HD centres adjusted for age and
diabetes mellitus status, 2006-2010 cohort 41

xxx
LIST OF FIGURES
Chapter Figure Listing Page
Figure 3.3.1(c) Variation in patient survival at 5-years among HD centres adjusted for age
and diabetes mellitus status, 2002-2006 41
Figure 3.3.1(d) Funnel plot for patient survival at 5-years among HD centres adjusted age and
diabetes mellitus, 2002-2006 cohort 41
Figure 3.3.2(a) Variation in patient survival at 1-year among PD centres adjusted for age and
diabetes mellitus , 2006-2010 42
Figure 3.3.2(b) Funnel plot of 1-year patient survival from the 90th day of dialysis adjusted
for age and diabetes mellitus among PD centres, 2006-2010 cohort 42
Figure 3.3.2(c) Variation in patient survival at 5-years among PD centres adjusted for age and
diabetes mellitus, 2002-2006 42
Figure 3.3.2(d) Funnel plot of 5-years patient survival from 90 day of dialysis adjusted for
age and diabetes mellitus among PD centres, 2002-2006 cohort 42
Figure 3.4.1 (a) Adjusted hazard ratio for mortality of dialysis patients uncensored for change
of modality by diastolic blood pressure (2002-2011 cohort) 42
Figure 3.4.1 (b) Adjusted hazard ratio for mortality of dialysis patients uncensored for change
of modality by serum phosphate (2002-2011 cohort) 45
Figure 3.4.1 (c) Adjusted hazard ratio for mortality of dialysis patients uncensored for change
of modality by hemoglobin (2002-2011 cohort) 45
Figure 3.4.2 Adjusted hazard ratio for mortality of HD patients uncensored for change of
modality by Kt/V (2002-2011 cohort) 47
Figure 3.4.4(a) Variations in RAMR by HD centre, 2010 50
Figure 3.4.4(b) Funnel plot of RAMR by HD centre, 2010 50
Figure 3.4.5(a) Variations in RAMR by PD centres, 2010 50
Figure 3.4.5(b) Funnel plot for RAMR by PD centres, 2010 50
Figure 4.1 Cumulative distribution of QoL-Index score in relation to dialysis modality,
all dialysis patients 2002-2011 52
Figure 4.2 Cumulative distribution of QoL-Index score in relation to DM, all Dialysis
patients 2002-2011 52
Figure 4.3 Cumulative distribution of QoL-Index score in relation to gender, all dialysis
patients 2002-2011 53
Figure 4.4 Cumulative distribution of QoL-Index score in relation to age, all dialysis
patients 2002-2011 53
Figure 4.5 Cumulative distribution of QoL-Index score in relation to year of entry, HD
patients 2002-2011 54
Figure 4.6 Cumulative distribution of QoL-Index score in relation to year of entry, PD
patients 2002-2011 54
Figure 5.1(a) Incidence cases of RRT by modality in children under 20 years old, 2002-
2011 58
Figure 5.1(b) Prevalence cases of RRT by modality in children under 20 years old, 2002-
2011 58
Figure 5.2 Incidence and prevalence rate per million age related population years old on
RRT, 2002-2011 59
Figure 5.4 Number of new dialysis and transplant patients by gender 2002-2011 60
Figure 5.5 New RRT rate by age group 2002-2011 60
Figure 5.6 New dialysis by treatment modality 2002-2011 61
Figure 5.7 New dialysis by sector 2002-2011 61
Figure 5.10(a) Patient survival by dialysis modality analysis (not censored with change of
modality) 63
Figure 5.11 Dialysis technique survival by modality, 2002-2011 64
Figure 5.10(b) Patient survival by dialysis modality analysis (censored with change of
modality) 63
Figure 5.12 Transplant graft survival, 2002-2011 64

xxxi
LIST OF FIGURES
Chapter Figure Listing Page
Figure 6.1.3 Variation in ESAs utilization (% patients) among HD centres, 2011 67
Figure 6.1.4 Variation in ESAs utilization (% patients) among PD centres, 2011 67
Figure 6.1.5 Variation in mean weekly ESAs dose (u/week) among HD centres, 2011 68
Figure 6.1.6 Variation in mean weekly ESAs dose (u/week) among PD centres, 2011 69
Figure 6.1.7 Variation in use of blood transfusion (% patients) among HD centres, 2011 69
Figure 6.1.8 Variation in use of blood transfusion (% patients) among PD centres, 2011 70
Figure 6.2.1 Distribution of serum ferritin without ESAs, HD patients 2002-2011 71
Figure 6.2.2 Distribution of serum ferritin without ESAs, PD patients 2002-2011 71
Figure 6.2.3 Cumulative distribution of serum ferritin on ESAs, HD patients 2002-2011 72
Figure 6.2.4 Cumulative distribution of serum ferritin on ESAs, PD patients 2002-2011 72
Figure 6.2.5 Cumulative distribution of transferrin saturation without ESAs, HD patients
2002-2011 73
Figure 6.2.6 Cumulative distribution of transferrin saturation without ESAs, PD patients
2002-2011 73
Figure 6.2.7 Cumulative distribution of transferrin saturation on ESAs, HD patients 2002-
2011 74
Figure 6.2.8 Cumulative distribution of transferrin saturation on ESAs, PD patients 2002-
2011 74
Figure 6.2.9(a) Variation in medium serum ferritin among patients on ESAs, HD centres
2011 75
Figure 6.2.9(b) Variation in proportion of patients on ESAs with serum ferritin ≥ 100 ng/ml,
HD centres 2011 75
Figure 6.2.9(c) Variation in median transferring saturation among patients on ESAs HD
centres, 2011 76
Figure 6.2.9(d) Variation in proportion of patients on ESAs with transferring saturation ≥
20%, HD centres, 2011 76
Figure 6.2.10(a) Variation in medium serum ferritin among patients on ESAs, PD centres
2011 77
Figure 6.2.10(b) Variation in proportion of patients on ESAs with serum ferritin ≥ 100ng/ml,
PD centres 2011 77
Figure 6.2.10(c) Variation in median transferrin saturation among patients on ESAs, PD
centres 2011 78
Figure 6.2.10(d) Variation in proportion of patients on ESAs with transferrin saturation ≥ 20
%, PD centres 2011 78
Figure 6.3.1 Cumulative distribution of haemoglobin concentration without ESAs, HD
patients 2002-2011 79
Figure 6.3.2 Cumulative distribution of haemoglobin concentration without ESAs, PD
patients 2002-2011 80
Figure 6.3.3(a) Cumulative distribution of haemoglobin concentration on ESAs, diabetes
HD patients 2002-2011 80
Figure 6.3.3(b) Cumulative distribution of haemoglobin concentration on ESAs, non-
diabetes HD patients 2002-2011 81
Figure 6.3.4(a) Cumulative distribution of haemoglobin concentration on ESAs, diabetes PD
patients 2002-2011 81
Figure 6.3.4(b) Cumulative distribution of haemoglobin concentration on ESAs, non-
diabetes PD patients 2002-2011 82
Figure 6.3.5(a) Variation in median haemoglobin level among patients on ESAs, HD centres
2011 83
Figure 6.3.5(b) Variation in proportion of patients on ESAs with haemoglobin level > 10g/
dL, HD centres 2011 83
Figure 6.3.6(b) Variation in proportion of patients on ESAs with haemoglobin level > 10g/
dL, PD centres, 2011 84
Figure 6.3.6(a) Variation in median haemoglobin level among patients on ESAs, PD centres
2011 84
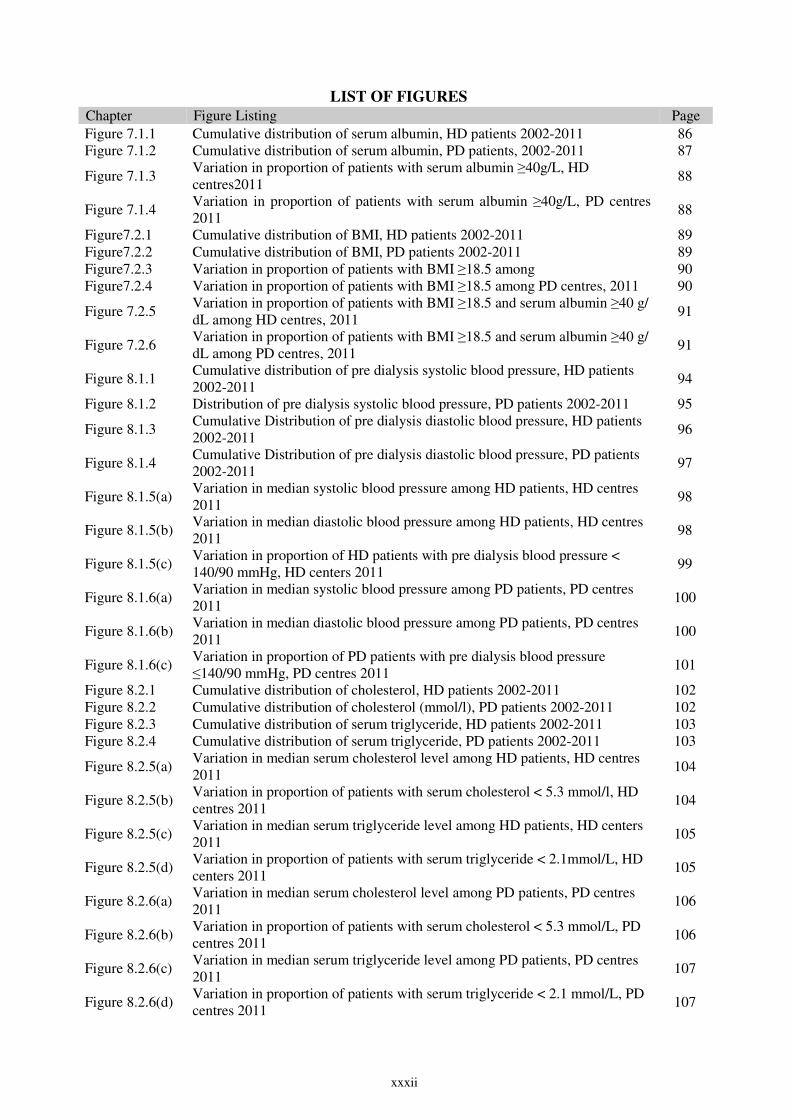
xxxii
LIST OF FIGURES
Chapter Figure Listing Page
Figure 7.1.1 Cumulative distribution of serum albumin, HD patients 2002-2011 86
Figure 7.1.2 Cumulative distribution of serum albumin, PD patients, 2002-2011 87
Figure 7.1.3 Variation in proportion of patients with serum albumin ≥40g/L, HD
centres2011 88
Figure 7.1.4 Variation in proportion of patients with serum albumin ≥40g/L, PD centres
2011 88
Figure7.2.1 Cumulative distribution of BMI, HD patients 2002-2011 89
Figure7.2.2 Cumulative distribution of BMI, PD patients 2002-2011 89
Figure7.2.3 Variation in proportion of patients with BMI ≥18.5 among 90
Figure7.2.4 Variation in proportion of patients with BMI ≥18.5 among PD centres, 2011 90
Figure 7.2.5 Variation in proportion of patients with BMI ≥18.5 and serum albumin ≥40 g/
dL among HD centres, 2011 91
Figure 7.2.6 Variation in proportion of patients with BMI ≥18.5 and serum albumin ≥40 g/
dL among PD centres, 2011 91
Figure 8.1.1 Cumulative distribution of pre dialysis systolic blood pressure, HD patients
2002-2011 94
Figure 8.1.2 Distribution of pre dialysis systolic blood pressure, PD patients 2002-2011 95
Figure 8.1.3 Cumulative Distribution of pre dialysis diastolic blood pressure, HD patients
2002-2011 96
Figure 8.1.4 Cumulative Distribution of pre dialysis diastolic blood pressure, PD patients
2002-2011 97
Figure 8.1.5(a) Variation in median systolic blood pressure among HD patients, HD centres
2011 98
Figure 8.1.5(b) Variation in median diastolic blood pressure among HD patients, HD centres
2011 98
Figure 8.1.5(c) Variation in proportion of HD patients with pre dialysis blood pressure <
140/90 mmHg, HD centers 2011 99
Figure 8.1.6(a) Variation in median systolic blood pressure among PD patients, PD centres
2011 100
Figure 8.1.6(b) Variation in median diastolic blood pressure among PD patients, PD centres
2011 100
Figure 8.1.6(c) Variation in proportion of PD patients with pre dialysis blood pressure
≤140/90 mmHg, PD centres 2011 101
Figure 8.2.1 Cumulative distribution of cholesterol, HD patients 2002-2011 102
Figure 8.2.2 Cumulative distribution of cholesterol (mmol/l), PD patients 2002-2011 102
Figure 8.2.3 Cumulative distribution of serum triglyceride, HD patients 2002-2011 103
Figure 8.2.4 Cumulative distribution of serum triglyceride, PD patients 2002-2011 103
Figure 8.2.5(a) Variation in median serum cholesterol level among HD patients, HD centres
2011 104
Figure 8.2.5(b) Variation in proportion of patients with serum cholesterol < 5.3 mmol/l, HD
centres 2011 104
Figure 8.2.5(c) Variation in median serum triglyceride level among HD patients, HD centers
2011 105
Figure 8.2.5(d) Variation in proportion of patients with serum triglyceride < 2.1mmol/L, HD
centers 2011 105
Figure 8.2.6(a) Variation in median serum cholesterol level among PD patients, PD centres
2011 106
Figure 8.2.6(b) Variation in proportion of patients with serum cholesterol < 5.3 mmol/L, PD
centres 2011 106
Figure 8.2.6(d) Variation in proportion of patients with serum triglyceride < 2.1 mmol/L, PD
centres 2011 107
Figure 8.2.6(c) Variation in median serum triglyceride level among PD patients, PD centres
2011 107
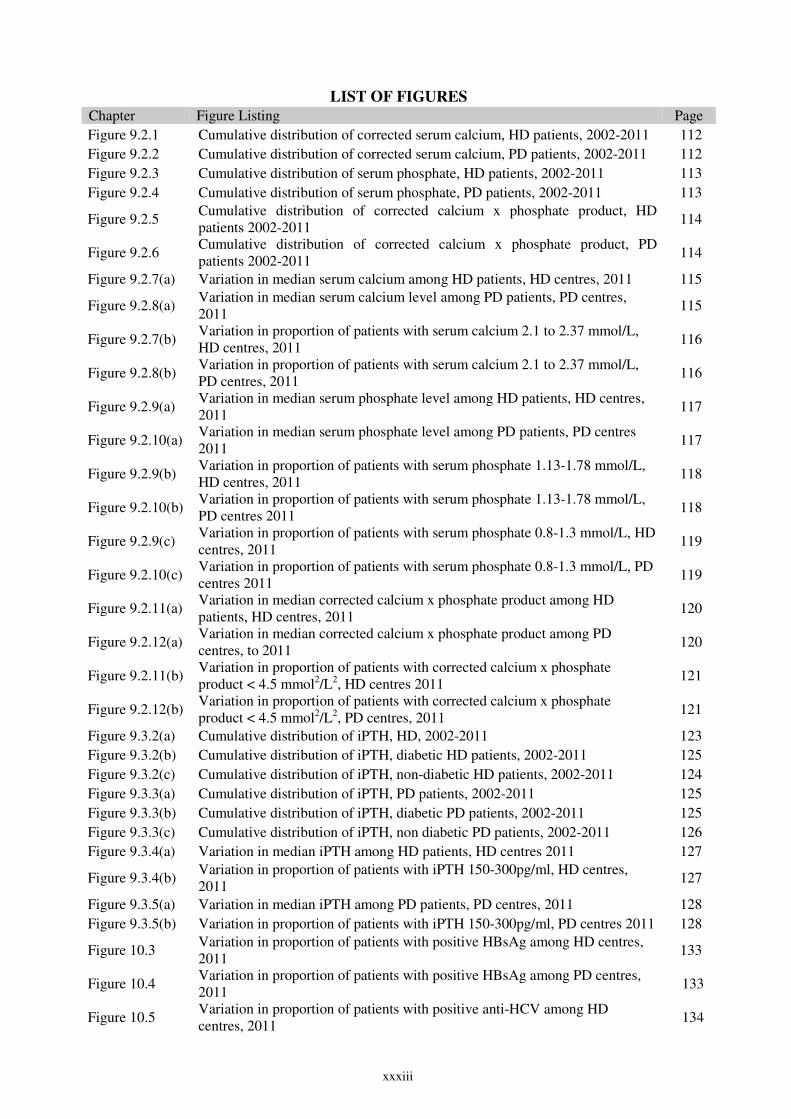
xxxiii
LIST OF FIGURES
Chapter Figure Listing Page
Figure 9.2.1 Cumulative distribution of corrected serum calcium, HD patients, 2002-2011 112
Figure 9.2.2 Cumulative distribution of corrected serum calcium, PD patients, 2002-2011 112
Figure 9.2.3 Cumulative distribution of serum phosphate, HD patients, 2002-2011 113
Figure 9.2.4 Cumulative distribution of serum phosphate, PD patients, 2002-2011 113
Figure 9.2.5 Cumulative distribution of corrected calcium x phosphate product, HD
patients 2002-2011 114
Figure 9.2.6 Cumulative distribution of corrected calcium x phosphate product, PD
patients 2002-2011 114
Figure 9.2.7(a) Variation in median serum calcium among HD patients, HD centres, 2011 115
Figure 9.2.8(a) Variation in median serum calcium level among PD patients, PD centres,
2011 115
Figure 9.2.7(b) Variation in proportion of patients with serum calcium 2.1 to 2.37 mmol/L,
HD centres, 2011 116
Figure 9.2.8(b) Variation in proportion of patients with serum calcium 2.1 to 2.37 mmol/L,
PD centres, 2011 116
Figure 9.2.9(a) Variation in median serum phosphate level among HD patients, HD centres,
2011 117
Figure 9.2.10(a) Variation in median serum phosphate level among PD patients, PD centres
2011 117
Figure 9.2.9(b) Variation in proportion of patients with serum phosphate 1.13-1.78 mmol/L,
HD centres, 2011 118
Figure 9.2.10(b) Variation in proportion of patients with serum phosphate 1.13-1.78 mmol/L,
PD centres 2011 118
Figure 9.2.9(c) Variation in proportion of patients with serum phosphate 0.8-1.3 mmol/L, HD
centres, 2011 119
Figure 9.2.10(c) Variation in proportion of patients with serum phosphate 0.8-1.3 mmol/L, PD
centres 2011 119
Figure 9.2.11(a) Variation in median corrected calcium x phosphate product among HD
patients, HD centres, 2011 120
Figure 9.2.12(a) Variation in median corrected calcium x phosphate product among PD
centres, to 2011 120
Figure 9.2.11(b) Variation in proportion of patients with corrected calcium x phosphate
product < 4.5 mmol2/L2, HD centres 2011 121
Figure 9.2.12(b) Variation in proportion of patients with corrected calcium x phosphate
product < 4.5 mmol2/L2, PD centres, 2011 121
Figure 9.3.2(a) Cumulative distribution of iPTH, HD, 2002-2011 123
Figure 9.3.2(b) Cumulative distribution of iPTH, diabetic HD patients, 2002-2011 125
Figure 9.3.2(c) Cumulative distribution of iPTH, non-diabetic HD patients, 2002-2011 124
Figure 9.3.3(a) Cumulative distribution of iPTH, PD patients, 2002-2011 125
Figure 9.3.3(b) Cumulative distribution of iPTH, diabetic PD patients, 2002-2011 125
Figure 9.3.3(c) Cumulative distribution of iPTH, non diabetic PD patients, 2002-2011 126
Figure 9.3.4(a) Variation in median iPTH among HD patients, HD centres 2011 127
Figure 9.3.4(b) Variation in proportion of patients with iPTH 150-300pg/ml, HD centres,
2011 127
Figure 9.3.5(a) Variation in median iPTH among PD patients, PD centres, 2011 128
Figure 9.3.5(b) Variation in proportion of patients with iPTH 150-300pg/ml, PD centres 2011 128
Figure 10.3 Variation in proportion of patients with positive HBsAg among HD centres,
2011 133
Figure 10.4 Variation in proportion of patients with positive HBsAg among PD centres,
2011 133
Figure 10.5 Variation in proportion of patients with positive anti-HCV among HD
centres, 2011 134

xxxiv
LIST OF FIGURES
Chapter Figure Listing Page
Figure 10.6 Variation in proportion of patients with positive anti-HCV among PD centres,
2011 134
Figure 10.7(a) Cumulative risk of sero-conversion to HBsAg positive among sero-negative
patients at entry into dialysis, comparing HD and PD 2002-2011 135
Figure 10.7(b) Cumulative risk of sero-conversion to anti HCV antibody positive among sero
-negative patients at entry into dialysis, comparing HD and PD 2002-2011 136
Figure 11.2.1 Blood flow rates in HD centers, 2002-2011 143
Figure 11.2.4 Dialyser membrane types in HD centres, 2002-2011 145
Figure 11.2.6(a) Cumulative distribution of prescribed Kt/V, HD patients 2002-2011 147
Figure 11.2.6(b) Cumulative distribution of delivered Kt/V, HD patients 2007-2011 147
Figure 11.2.6(c) Cumulative distribution of URR, HD patients 2007-2011 148
Figure 11.2.7(a) Variation in median blood flow rates in HD patients among centres 2011 149
Figure 11.2.7(b) Variation in Proportion of patients with blood flow rates ≥300 ml/min among
HD centres 2011 149
Figure 11.2.7(c) Variation in proportion of patients with 3 HD sessions per week among HD
centres 2011 150
Figure 11.2.7(d) Variation in median prescribed Kt/V in HD patients among HD centres 2011 150
Figure 11.2.7(e) Variation in proportion of patients with prescribed Kt/V ≥1.3 among HD
centres 2011 151
Figure 11.2.7(f) Variation in median delivered Kt/V in HD patients among HD centres 2011 151
Figure 11.2.7(g) Variation in proportion of patients with delivered Kt/V ≥1.2, HD centres 2011 152
Figure 11.2.7(h) Variation in median URR among HD patients, HD centres 2011 153
Figure 11.2.7(i) Variation in proportion of patients with URR ≥65% among HD centres 2011 154
Figure 11.3.1(a) Unadjusted technique survival by year of entry, 2002-2011 154
Figure 11.3.1(b) Unadjusted technique survival by year of entry (censored for death &
transplant), 2002-2011 156
Figure 11.3.2(a) Unadjusted technique survival by age, 2002-2011 158
Figure 11.3.2(b) Unadjusted technique survival by age (censored for death & transplant), 2002
-2011 158
Figure 11.3.3(a) Unadjusted technique survival by diabetes status, 2002-2011 159
Figure 11.3.3(b) Unadjusted technique survival by diabetes status (censored for death &
transplant), 2002-2011 160
Figure 12.2.1 Cumulative distribution of delivered Kt/V, PD patients 2004-2011 164
Figure 12.2.2 Variation in proportion of patients with Kt/V ≥1.7 per week among PD
centres 2011 165
Figure 12.3.1(a) Unadjusted technique survival by era 2002–2006 and 2007–2011 (uncensored
for death and transplant) 167
Figure 12.3.1(b) Unadjusted technique survival by era 2002–2006 and 2007–2011 (censored
for death and transplant) 167
Figure 12.3.2(a) Unadjusted technique survival by age (uncensored for death and transplant),
2002-2011 168
Figure 12.3.2(b) Unadjusted technique survival by age (censored for death and transplant),
2002-2011 169
Figure 12.3.3(a) Unadjusted technique survival by gender (uncensored for death and
transplant), 2002-2011 170

xxxv
LIST OF FIGURES
Chapter Figure Listing Page
Figure 12.3.3(b) Unadjusted technique survival by gender (censored for death and transplant),
2002-2011 170
Figure 12.3.4(a) Unadjusted technique survival by diabetes status (uncensored for death and
transplant), 2002-2011 171
Figure 12.3.4(b) Unadjusted technique survival by diabetes status (censored for death and
transplant), 2002-2011 171
Figure 12.3.5 Unadjusted technique survival by Kt/V, 2002-2011 172
Figure 12.4.1 Variation in peritonitis rate among PD centres, 2011 175
Figure12.4.2(b) Causative organism in PD peritonitis, 2002-2011 176
Figure 12.4.3(a) Outcome of peritonitis by causative organism, 2002-2006 177
Figure 12.4.3(b) Outcome of peritonitis by causative organism, 2007-2011 178
Figure 12.4.3(c)
Comparing outcome of peritonitis by causative organism in 2002-2006
versus 2007-2011
(removed form chapter. There are 2 figures for outcome by causative
organism. With daates to be removed)
178
Figure 13.1.1 Stock and flow of renal transplantation, 2002-2011 182
Figure 13.1.2 New transplant rate, 2002-2011 183
Figure 13.1.3 Transplant prevalence rate, 2002-2011 183
Figure 13.4.2(a) Transplant recipient death rate, 2002-2011 190
Figure 13.4.2(b) Transplant recipient graft loss rate, 2002-2011 190
Figure 13.5.1(a) Patient survival, 2002-2011 191
Figure 13.5.1(b)
Adjusted transplant patient survival related to year of transplant, 2002-2011
(adjusted for age, gender, primary diagnosis, type of transplant, HBsAg and
Anti-HCV status)
192
Figure 13.5.2(a) Graft survival, 2002-2011 193
Figure 13.5.2(b)
Adjusted transplant graft survival related to year of transplant, 2002-2011
(adjusted for age, gender, primary diagnosis, type of transplant, HBsAg and
Anti-HCV status)
194
Figure 13.5.3 Patient survival by type of transplant, 2002-2011 194
Figure 13.5.4 Graft survival by type of transplants, 2002-2011 195
Figure 13.5.5 Patient survival by year of transplant (Living related transplant, 2002-2011) 195
Figure 13.5.6 Graft survival by year of transplant (Living related transplant, 2002-2011) 196
Figure 13.5.7 Patient survival by year of transplant (Commercial cadaver transplant, 2002-
2011) 196
Figure 13.5.8 Graft survival by year of transplant (Commercial cadaver transplant, 2002-
2011) 197
Figure 13.6.1(a) Venn diagram for pre and post transplant complications (in %) at year 2007 198
Figure 13.6.1(b) Venn diagram for pre and post transplant complications (in %) at year 2008 198
Figure 13.6.1(c) Venn diagram for pre and post transplant complications (in %) at year 2009 198
Figure 13.6.1(d) Venn diagram for pre and post transplant complications (in %) at year 2010 198
Figure 13.6.1(e) Venn diagram for pre and post transplant complications (in %) at year 2011 198
Figure 13.6.2(a) Systolic BP, 2007-2011 199
Figure 13.6.2(b) Diastolic BP, 2007-2011 199
Figure 13.6.3 CKD stages by year 200
Figure 13.6.4 BMI, 2007-2011 200
Figure 13.6.5(a) LDL, 2007-2011 201
Figure 13.6.5(b) Total cholesterol, 2007-2011 201
Figure 13.6.5(c) HDL, 2007-2011 202
Figure 13.7.1 Cumulative distribution of QoL-Index score in relation to dialysis modality,
transplant recipient patients 2002-2011 204

xxxvi
LIST OF FIGURES
Chapter Figure Listing Page
Figure 13.7.2 Cumulative distribution of QoL-Index score in relation to diabetes mellitus,
transplant recipient patients 2002-2011 204
Figure 13.7.3 Cumulative distribution of QoL-Index score in relation to gender, transplant
recipient patients 2002-2011 205
Figure 13.7.4 Cumulative distribution of QoL-Index score in relation to age, transplant
recipient patients 2002-2011 205
Figure 13.7.5 Cumulative distribution of QoL-Index score in relation to year of entry,
transplant recipient patients 2002-2011 206

xxxvii
EXECUTIVE SUMMARY In 2011, there were 26159 patients receiving dialysis in Malaysia of whom 25688 were notified to the
Malaysian Dialysis and Transplant Registry. Slightly more than 5000 new patients started dialysis in 2011.
The equivalent incidence and prevalence rate of patients on dialysis were 181 and 900 per million
population for Malaysia in 2011. The majority (92%) of these patients were on haemodialysis (HD)
treatment, 8% were on peritoneal dialysis (PD). The increase in the dialysis population were mainly
contributed by the rapid growth in private haemodialysis in the last 5 years. Patients more than 65 years
old made up 27% of new dialysis patients. 56% of end stage kidney disease were reported to be caused by
diabetes mellitus, a disease well proven to be highly preventable yet not prevented.
Although the public, NGO and private sector provided 31%, 27% and 42% of overall dialysis treatment in
2011, the government provided 59% of total funding for dialysis channelled through various funding and
subsidy programmes. However, more than 90% of patients younger than 20 years of age were on
government-funded dialysis programmes.
The annual death rate on dialysis in 2011 was 11.4%. The annual death rate for haemodialysis patients was
11.0% and chronic peritoneal dialysis patients 15.6%. Death due to cardiovascular disease appeared to be
increasing in the last 7 years to 38% in 2011 probably due to the increasing number of elderly and diabetic
patients undergoing dialysis. Death from infection (excluding peritonitis in PD) has increased over the last
7 years and has now became the second commonest cause of death. Despite attempts at adjusting for
multiple variables contributing to death, there were wide variations in adjusted mortality rates between
dialysis centres.
90% of dialysis patients receive Erythropoeisis Stimulating Agents (ESAs) yet the percentage of patients
who received blood transfusions remained high at 14 to 18%.About 90% of patients were on calcium
based phosphate binders. The use of newer and more expensive phosphate binders remained less than 3%.
Although intermediate outcomes in patients on dialysis have seen some improvement over the years,
achievement of various targets in treatment of anaemia, mineral bone disease, blood pressure and
dyslipidaemia and malnutrition still have some way to go. There were also demonstrable variations in the
achievement of these various targets between dialysis centres. The contributing factors may be case mix,
adequacy of funding for the different medications required, and adequacy of dialysis and medical care.
HD patients run the risk of Hepatitis infection due to nosocomial transmission. However, over the years,
we have seen an encouraging decline in its prevalence with lower seroconversion rates. This is largely due
to constant surveillance and strict implementation of infection control protocols within HD facilities
around the country.
Despite the rapid increase in dialysis population, the number of kidney transplantation performed in
Malaysia has remained very low. There were only 41 live related and 38 deceased donor kidney
transplantation done in 2011. The transplantation rate has dropped to the lowest rate of 4 per million
population compared to 6-7 per million in the previous 20 years. The patient survival rates were 95% and
88% at 1- year and 5-years respectively. Graft survival rate at 1-year was 93%, and at 5-years 83%

xxxviii
ABBREVIATIONS
BMI Body Mass Index
BP Blood pressure
CAPD Continuous Ambulatory Peritoneal Dialysis
CCPD/APD Continuous cycling peritoneal dialysis/automated peritoneal dialysis
CI Concentration Index
CKD Chronic kidney disease
CRA Clinical Registry Assistant
CRA Clinical Registry assistant
CRC Clinical Research Centre
CRF Case report form
CRM Clinical Registry Manager
CVD Cardiovascular Disease
DAPD Daytime Ambulatory Peritoneal Dialsysis
DM Diabetes Mellitus
DOQI Dialysis Outcome Quality Initiative
eMOSS Malaysian Organ Sharing System (Renal)
ESAs Erythropoeisis Stimulating Agents
ESRD End Stage Renal Disease
GDP Gross domestic product
GNI Gross National Income
HD Haemodialysis
HKL Kuala Lumpur Hospital
ITT Intention to treat
iPTH Intact parathyroid hormone
JNC VI Joint National Committee on management of hypertension
Kt/V Number used to quantify Hemodialysis and peritoneal dialysis treatment adequacy
LQ Lower quartile
MDTR Malaysian Dialysis and Transplant Registry
MOH Ministry of Health, Malaysia
MOSS Malaysian Organ Sharing System
MRRB Malaysian Registry of Renal Biopsy
MSN Malaysian Society of Nephrology
NGO Non-governmental organization
NRIC National Registration Identity Card
NRR National Renal Registry, Malaysia
PD Peritoneal dialysis
PET D/P peritoneal transport status dialysate and plasma (D/P ratio)
pmarp per million age related population
xxxix
QoL Quality of Life
ref Reference
RCC Registry coordinating centre
RRT Renal replacement therapy
SC Site coordinator
SDP Source data producer
SMR Standardised Mortality Ratio
UQ Upper quartile
URR Urea reduction rate
pmp per million population
ABBREVIATIONS