2012 REPORT - Ron Wyden
32
INTERNATIONAL TRADE in ENVIRONMENTAL GOODS 2012 REPORT LOSING THE ENVIRONMENTAL GOODS ECONOMY TO CHINA By Senator Ron Wyden February 28, 2012
Transcript of 2012 REPORT - Ron Wyden

1
INTERNATIONAL TRADE in ENVIRONMENTAL GOODS
2012 REPORT
LOSING THE ENVIRONMENTAL GOODS ECONOMY TO CHINA
By
Senator Ron Wyden
February 28, 2012

2

3
Summary _____________________________________________________________________________________ This fourth report about trade flows in environmental goods, “Losing the Environmental Goods Economy to China,” is a continuation of my office’s efforts to analyze global trade in environmental goods. Its key findings: In 2011:
The U.S. trade deficit in environmental goods with China reached an all-time high.
Driven by rising imports from China, the overall U.S. deficit in environmental goods grew by 87 percent.
U.S. imports of solar cells and modules from China grew in value by 135 percent in 2011; solar cells alone grew by nearly 300 percent.
Exports of solar cells and modules from China to the U.S. grew by over 300 percent by volume. (Taking the U.S. from a nearly $2 billion trade surplus in solar energy products in 2010 to over $1.5 billion deficit in 2011.)
U.S. imports of utility scale wind towers from China grew by over 100 percent.
In each of the largest and fastest-growing markets throughout the world, U.S.
exporters of environmental goods are rapidly losing market share to China. “Losing the Environmental Goods Economy to China" also finds that:
Between the years 2005 and 2010, China’s market share of environmental goods in the E.U., the biggest regional market for such products, increased sevenfold (to 21 percent), while U.S. market share shrank during the same period.
In other regional export markets of environmental goods, Chinese market share
generally doubled (Africa, Asia, and Middle East) or tripled (NAFTA, Latin America).
E.U. and Japanese exporters of environmental goods are also losing market share to China in most major markets in the world.

4
Introduction _____________________________________________________________________________________ Why a report on the trade of environmental goods? As more and more nations and citizens embrace environmentally friendly policies and practices, the demand for environmental goods and services – products and services that contribute to a cleaner and more sustainable environment – grows. In fact, between 2005 and 2010, the global export market for environmental goods alone doubled and reached an estimated $298 billion in 2011. Much of the technology behind environmental goods – like solar panels and wind turbines – was, and continues to be, developed in the United States. Therefore, not only is global demand for environmental goods on the rise, Americans are manufacturing cutting edge products to meet that demand. As long as U.S. manufacturers have a level-playing field to compete in that growing market, exporting environmental goods presents a significant opportunity to sell more American-made products, grow American manufacturing and create more good-paying American jobs. Since becoming Chairman of the Senate Finance Committee’s Subcommittee on International Trade, Customs and Global Competitiveness, I have focused on ensuring a level-playing field exists for U.S. producers, especially manufacturers of environmental goods. Since 2009, I have issued an annual report examining the major opportunities and challenges facing U.S. exports of environmental goods. While the initial goal was to examine a wide array of challenges and opportunities facing these U.S. exports abroad, the work has increasingly focused on China’s unprecedented rise in the global market for environmental goods. This year’s report shows the broader trend in trade flows of environmental goods while highlighting specific areas – such as solar goods – in which the U.S. is “Losing the Environmental Goods Economy to China.” How is the U.S. losing the environmental goods economy to China? In recent years, the Chinese Government has undertaken an aggressive strategy to capitalize on the growing market for environmental goods by making China a leading producer of environmental goods. Plans issued by the Chinese Government have detailed this strategy. For example, a 2007 report released by China’s National Development and Reform Commission (NDRC) outlined efforts to “speed up the development and deployment of hydropower, wind power, solar energy, and biomass energy; . . . {and} increase market competitiveness” by directing local authorities to “allocate the necessary funds to support renewable energy development.” “Losing the Environmental Goods Economy to China” finds that China’s strategy has been working for China. In just the last five years, China rose from playing a minor role in the global market for environmental goods to become the dominant actor in the world’s biggest and fastest growing markets. Exports of environmental goods from the U.S. and other similarly-positioned countries are not growing at a rate commensurate with the technology their industries hold, the productivity of their workforce and the overall growth in global demand, because they appear crowded-out by China’s exports. China has neither

5
a technological advantage nor any clear comparative advantage in terms of the production of environmental goods, yet China’s environmental goods exports are experiencing a rate of growth far afield of its competitors, which are losing to China. What makes this report timely? While “Losing the Environmental Goods Economy to China” does not examine the reasons behind China’s rapid growth in the world market for environmental goods, its findings track recent complaints that U.S. solar manufactures and producers of utility scale wind towers have filed with the International Trade Commission (ITC) and the U.S. Department of Commerce. The report's findings correct the contention that the U.S. continues to enjoy a trade surplus with China in solar products. Overall, it supports the assertion that China’s environmental goods industries are experiencing rapid growth that industries located in other countries appear unable to duplicate, suggesting that China’s competitiveness is significantly due to its violation of norms and rules of international trade. Why do trade rules matter? Since the Second World War, the world’s advanced economies – led by the United States – set out to establish a rules-based trading system that would promote innovation, competition and efficiency in a way that facilitates rising living standards. This global, rules-based trading system is designed to prevent trade wars by establishing clear, enforceable standards for all of the world’s participants. Its rules ensure that competition is based – not on the amount of assistance a government provides its industries – on each industry’s ability to innovate quality products and produce them efficiently. Congress and the Administration’s work to promote trade and help American producers gain from foreign markets not only follows the rules of the global trading system, it requires other participants in the trading system to follow the rules as well. The system breaks down when the world’s participants fail to abide by its rules. That is especially true when the country that appears to be breaking the rules has the world’s second largest economy.

6
Reports _____________________________________________________________________________________ “Major Opportunities and Challenges to U.S. Exports of Environmental Goods 2009:” Released in December 2009, the report showed that while the global market for environmental goods was quickly growing, U.S. producers were beginning to lose market share to China. The report identified trade barriers in fast-growing markets abroad that constrain U.S. environmental goods exports. “U.S. Trade in Environmental Goods Addendum:” Released in May 2010, this report updated the 2009 report and demonstrated that mainstream estimates of trade in environmental goods were significantly overstated. This report was the first to estimate U.S. trade flows of “real” environmental goods. Because trade figures are generally calculated by tracking a group of products that are similarly categorized in the Harmonized Tariff Schedule, other trade reports have included categories of goods that – while similar to environmentally friendly goods – are not helpful to the environment. For example, the category of electricity generators found in the tariff schedule could include generators that burn gas and those that use photovoltaic solar technology. It is important and helpful to distinguish these two technologies to determine the type of trade that policy makers work to facilitate to promote environmentally friendly practices. By examining trade flows on a narrower set of goods, the report (and subsequent reports examining this set of merchandise) provided the most accurate assessment of trade in “real” environmental goods. The results of the May 2010 report were cited extensively and form the basis of estimates of renewable energy exports in President Obama’s Renewable Energy and Energy Efficiency Export Initiative, a component of the President’s National Export Initiative. “Major Opportunities and Challenges to U.S. Exports of Environmental Goods 2010:” Released in December 2010, this report continued earlier analysis on the global market for environmental goods and demonstrated China’s growing dominance in the environmental goods sector in nearly every important global market. It also identified tariff barriers to U.S. environmental goods in the Asia Pacific region that could be dismantled to promote U.S. exports. “China’s Grab for Green Jobs:” Released in October of 2011, this report looked exclusively at the market for solar panels. The report showed that U.S. imports of solar panels and components from China catapulted by over 1,500 percent between 2006 and 2010. Furthermore, it highlighted that over the course of the previous 12 months, imports of solar panels and components surged an additional 300 percent. “Losing the Environmental Goods Economy to China:” Released in February 2012, this report shows China’s continued and growing dominance in this sector. The following report picks up where last December’s report ended and shows that many of the trends are now more dramatic and support the growing concern among domestic producers that China’s growing presence is likely a result of its abuse of global trade rules.

7
Recent Developments _____________________________________________________________________________________ September 2010. The United Steel Workers filed a Section “301” petition asking the Obama Administration to investigate a myriad of subsidies that were identified in the petition and which allegedly provide Chinese producers unfair advantages that are inconsistent with China’s World Trade Organization (WTO) obligations. This 301 petition relied on Major Opportunities and Challenges to U.S. Exports of Environmental Goods 2009. October 2010. Forty-three Senators expressed strong, formal support to President Obama for the 301 petition submitted by United Steel Workers in September 2010. The Obama Administration successfully challenged certain subsidies that China provides its wind energy producers and continues to investigate the other allegations contained in the Steelworkers’ petition. December 2010. The Obama Administration established the Renewable Energy and Energy Efficiency Export Initiative, a multi-agency effort to significantly increase exports of environmental goods related to renewable energy production and energy efficiency. March 2011. China’s National People’s Congress approves the Twelfth Five-Year Plan. This plan establishes spending and preferential tax and procurement policies designed to promote industries related to solar, biomass and wind energy technology. September 2011. As imports of Chinese solar panels dramatically surged into the U.S., President Obama was urged to take appropriate measures to prevent Chinese manufacturers from unfairly harming U.S. solar cell and panel producers. The following month, the administration provided the WTO with evidence of 200 potentially illegal Chinese subsidies that China failed to report to the WTO, despite requirements to do so. October 2011. The Oregon- and California-based company, SolarWorld, along with six other U.S. solar manufacturers filed a complaint with the U.S. Department of Commerce and the ITC against the perceived dumping practices by solar manufacturers from China and the subsidies provided by China to its solar industry. In December 2011, the ITC made a unanimous preliminary determination that U.S. solar producers were harmed by surging Chinese imports, which advanced the investigation of the case. It is possible that U.S. producers of solar cells and panels will be provided import relief from surging Chinese imports in early 2012. November 2011. Leaders of the Asia Pacific Economic Council (APEC), which was hosted by President Obama in Hawaii, adopted the Honolulu Declaration that committed members to ensuring that tariff rates on environmental goods would not exceed five percent. In many instances, APEC members were assigning tariffs on environmental goods that exceeded 30 percent. This was welcome news because, in of November of 2009, I and three other Senators called on the Administration to conclude such an agreement.

8
January 2012. Pursuant to a complaint filed by producers of utility scale wind towers, the U.S. Department of Commerce initiated an investigation on imports from China and Vietnam and whether they are illegally subsidized or are being dumped into the United State. On February 10, 2012, the ITC preliminarily determined that these imports are threatening American producers with injury, advancing the investigation and moving closer to providing U.S. producers with import relief.
Background, Methodology and Data Sources _____________________________________________________________________________________
Environmental goods and services cover a wide range of products and services that cut across many different industrial sectors. Although there is not an internationally accepted definition, environmental goods and services are generally defined as goods and services associated with environmental protection, including those related to air, water, or soil pollution control and prevention; waste management; environmental monitoring and recycling; and renewable energy, among others. Like the earlier reports compiled by my office, this report focuses on 43 environmental goods categories (using the six-digit Harmonized Commodity Description and Coding System (HS)) identified by the World Bank as broadly being climate friendly. U.S. import and export data are derived from the ITC. Export market shares are based on trade data for the 43 HS 6-digit product groups. Data for the latest six-year period (2005–10) were obtained from Global Trade Information Service’s Global Trade Atlas online database and analyzed with assistance from the Congressional Research Service. The database relies on information reporting by each individual country, so 2010 is the latest year for which there is full-year data. Figure 6, which shows the trade balance in ‘solar technology,’ utilized official data from the ITC and data from an August 2011 report by Greentech Media (GTM), U.S. Solar Energy Trade Assessment 2011: Trade Flows and Domestic Content for Solar Energy-Related Goods and Services in the United States (GTM report). Because certain product category tariff classifications, such as for polysilicon and solar manufacturing equipment, also include non-solar-related items, solar-specific 2011 trade values for these categories were estimated by applying the observed 2010 ratio of GTM’s solar-specific estimates to total 2010 trade on a category specific basis to the 2011 data. For solar manufacturing equipment, ranges in the GTM report were averaged. The GTM report included U.S. exports of polysilicon and plant equipment to determine that the United States enjoyed a trade surplus in the solar industry in 2010.
9
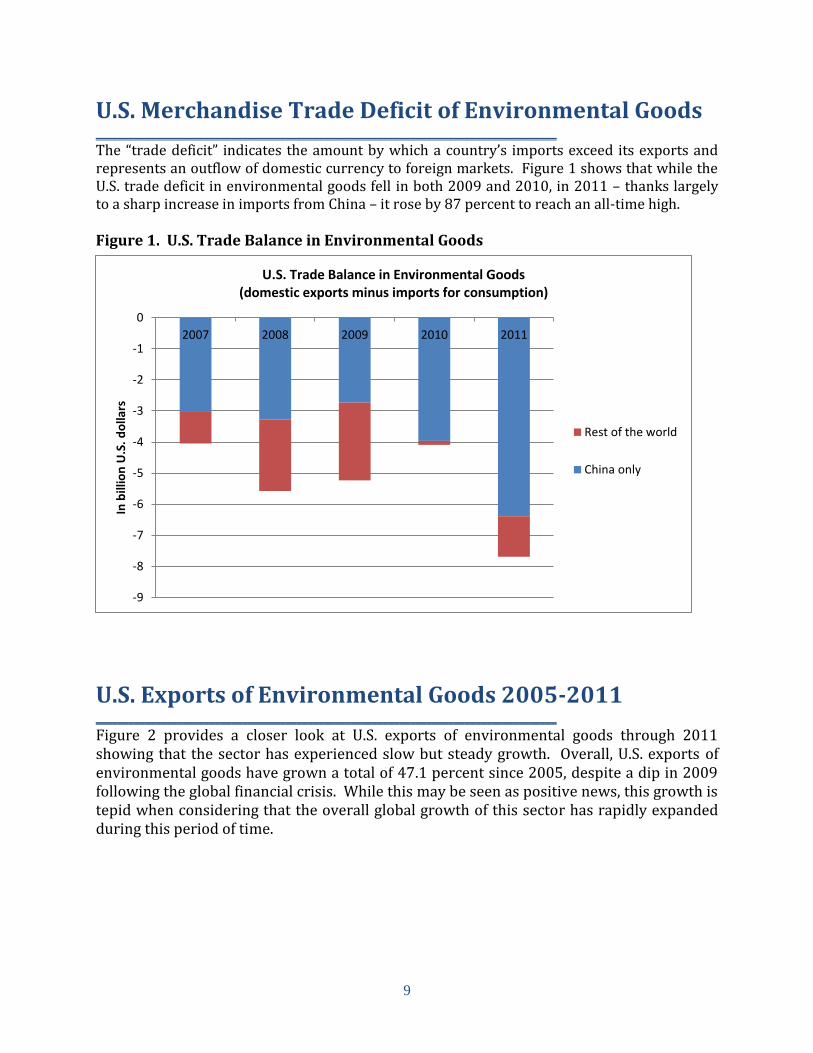
U.S. Merchandise Trade Deficit of Environmental Goods _____________________________________________________________________________________ The “trade deficit” indicates the amount by which a country’s imports exceed its exports and represents an outflow of domestic currency to foreign markets. Figure 1 shows that while the U.S. trade deficit in environmental goods fell in both 2009 and 2010, in 2011 – thanks largely to a sharp increase in imports from China – it rose by 87 percent to reach an all-time high. Figure 1. U.S. Trade Balance in Environmental Goods
U.S. Exports of Environmental Goods 2005-2011 _____________________________________________________________________________________ Figure 2 provides a closer look at U.S. exports of environmental goods through 2011 showing that the sector has experienced slow but steady growth. Overall, U.S. exports of environmental goods have grown a total of 47.1 percent since 2005, despite a dip in 2009 following the global financial crisis. While this may be seen as positive news, this growth is tepid when considering that the overall global growth of this sector has rapidly expanded during this period of time.
-9
-8
-7
-6
-5
-4
-3
-2
-1
0
2007 2008 2009 2010 2011
In b
illio
n U
.S.
do
llars
U.S. Trade Balance in Environmental Goods (domestic exports minus imports for consumption)
Rest of the world
China only

10
0
50
100
150
200
250
300
350
2006 2007 2008 2009 2010 2011
US
do
llars
in b
illio
ns
U.S. exports
Global exports
Figure 2. U.S. Exports of Environmental Goods
Key EMAA Environmental monitoring, analysis and assessment equipment CRET Cleaner or more resource efficient technologies and products WWM Waste water management and potable water treatment HEM Heat and energy management APC Air pollution control SHW Management of solid and hazardous waste and recycling systems REP Renewable energy plant equipment
Despite some recent growth in U.S. exports, a comparison with global growth numbers (figure 3) reveals that the U.S. producers trading environmental goods are falling behind at an ever greater pace. While U.S. exports rose to a little more than $22 billion by 2011, worldwide exports have recovered from a dip during the global financial crisis and grew to the record high of almost $300 billion in 2011. Figure 3. Exports of environmental goods
0
5
10
15
20
25
2005 2006 2007 2008 2009 2010 2011
Bill
ion
U.S
. d
olla
rs
EMAA
CRET
WWM
HEM
APC
SHW
REP
2011 growth rate is estimated based on average growth of previous three years

11
0
1,000
2,000
3,000
4,000
5,000
6,000
7,000
8,000
2005 2006 2007 2008 2009 2010 2011
U.S
. d
olla
rs in
mill
ion
s
U.S. Imports of Photosensitive Semiconductor Device inc. Photovoltaic cells (HS 854140)
all other
India
Canada
South Korea
Mexico
Japan
Germany
China
U.S. Imports and Exports of Solar Panels _____________________________________________________________________________________ An examination of trade in solar equipment provides an acute example of how, left unchecked, an American industry fairs in the face of likely unfairly traded imports from China. This is particularly remarkable given the fast-growing global market for solar technology.
Figure 4. U.S. General Imports of Solar Panel Equipment
Although solar technology has long been developed and advanced in the U.S., U.S. imports of solar equipment, such as cells, modules, and finished photovoltaic panels, are steeply rising. Between just 2009 and 2011, U.S. imports from China grew by more than 500 percent, totaling $3.4 billion (figure 4). Given that China’s Five Year Plan specifically called for advancing its solar technology industry, among others, it is important to ask: “Is the American solar industry merely the first casualty of China’s latest Five Year Plan?”
U.S. exports of solar equipment more than doubled between 2005 and 2010 but experienced a decline of almost 10 percent in 2011 (figure 5). In 2011, China imported only
a small and declining amount of U.S. solar equipment ($98 million) included in the U.S.’s $2.96 billion in exports. This decline may be due to a number of factors, including oversupply and the internalization of the supply chain within China.
Figure 5. U.S. Exports of Solar Panel Equipment
0
500
1,000
1,500
2,000
2,500
3,000
3,500
2005 2006 2007 2008 2009 2010 2011
U.S
. d
olla
rs in
mill
ion
s
U.S. Exports of Photosensitive Semiconductor Device inc. Photovoltaic cells (HS 854140)
all other
India
Canada
South Korea
Mexico
Japan
Germany
China

12
-2000
-1500
-1000
-500
0
500
1000
1500
2000
2500
2010 2011
U.S
. d
olla
rs in
mill
ion
s
China
World
0
500
1,000
1,500
2,000
2010 2011
U.S
. d
olla
rs in
mill
ion
s
U.S.-China cells and modules trade
exports to China
imports fromChina
0
500
1,000
1,500
2,000
2,500
2010 2011
U.S
. d
olla
rs in
mill
ion
s
China
World withoutChina
World
Figure 6. U.S. Balance of Trade in Solar Technology The balances of trade in solar products between both the United States and China and the United States and the world dramatically reversed course from 2010 to 2011. As a result, and by the broadest measure, the U.S. now faces a trade deficit in solar products and technology, both with China and the world (figure 6).
Figure 7. U.S. Trade Balance for Solar Cells and Modules A leading cause of this reversal is the massive surge in U.S. imports of solar cells and modules from China. These imports more than doubled from 2010 totals, increasing from nearly $1.2 billion to more than $2.84 billion (figure 7). Further, exports of products for which the U.S. enjoyed a significant trade surplus in 2010 – polysilicon and solar manufacturing equipment – declined in 2011, with polysilicon falling by nearly $100 million globally and $200 million to China (figure 8).
Figure 8. U.S. Trade Balance for Polysilicon
The reversal in trade flows is accompanied by an unprecedented deterioration in U.S. manufacturing capabilities. Over the past two years many domestic producers – across all regions of the U.S. – closed plants, undertook layoffs or went bankrupt. China’s predicted increases in capacity and production in the solar cell, module and polysilicon sectors strongly suggests that American suppliers, and suppliers in
other major economies, will experience additional and sustained solar product trade deficits and export market erosion into the foreseeable future, accompanied by further deterioration of their manufacturing base.

13
U.S. Imports of Wind Energy Equipment _____________________________________________________________________________________ Another segment of the environmental goods sector to watch is merchandise related to wind energy. U.S. imports from China of utility scale wind towers surged in 2011. This sector is worth watching to determine whether the competitiveness of the American wind energy industry erodes due to imports from China (figure 9). Figure 9. Imports of Towers and Lattice Masts of Iron or Steel, Tubular
and other Electric Generating Sets, Wind-Powered
0
50
100
150
200
250
2010 2011
U..
S d
olla
rs in
mill
ion
s
China

14
05
101520253035404550
Pe
rce
nt
Largest import market (country rank)
2005
201005
101520253035404550
Pe
rce
nt
Fastest growing import market (2005-10 CAGR in percent)
2005
2010
01020304050607080
Pe
rce
nt
Largest import market (country rank)
2005
20100
1020304050607080
Pe
rce
nt
Fastest growing import market (2005-10 CAGR in percent)
2005
2010
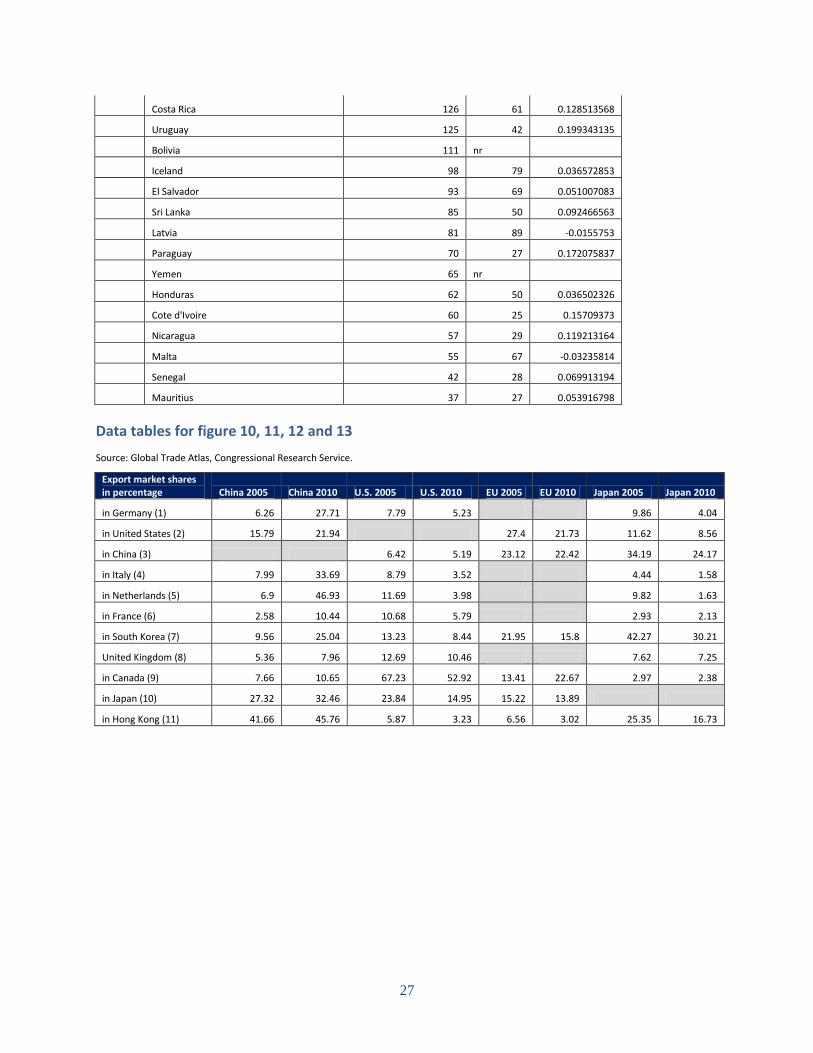
Export Market Shares of Environmental Goods _____________________________________________________________________________________ The impacts of China’s policies are not just evident in the U.S. market. Between 2005 and 2010 (the last full year for which data is available), China’s exports of environmental goods increased substantially and captured a larger and growing share of the largest export markets, as well as the fastest growing markets (figure 10). During the same period, exports from mature supply chains found in the U.S., the E.U. and Japan declined to the same markets (figures 11-13). Figure 10. China Export Market Shares by Largest and Fastest Growing Import Markets, 2005 and 2010 Figure 11. U.S. Export Market Shares by Largest and Fastest Growing Import Markets, 2005 and 2010

15
0
5
10
15
20
25
30
Pe
rce
nt
Fastest growing import market (2005-10 CAGR in percent)
2005
201005
1015202530354045
Pe
rce
nt
Largest import market (country rank)
2005
2010
0
5
10
15
20
25
30
Pe
rce
nt
Largest import market (country rank)
2005
2010 0
10
20
30
40
50
60
70
80
Pe
rce
nt
Fastest growing import market (2005-10 CAGR in percent)
2005
2010
Export Market Shares of Environmental Goods (cont’d) _____________________________________________________________________________________
Figure 12. E.U. Export Market Shares by Largest and Fastest Growing Import Markets
Figure 13. Japan Export Market Shares by Largest and Fastest Growing Import Markets

16
China 3%
Germany 23%
Netherlands 4%
Italy 9% France
8% United States 6%
Spain 3%
Czech Republic
3%
Belgium 5%
Japan 6%
All other 30%
2005 ($44.2 billion)
China 21%
Germany 19%
Netherlands 7%
Italy 5%
France 4%
United States
4%
Spain 3%
Czech Republic 3%
Belgium 3%
Japan 3%
All other 28%
2010 ($104.1 billion)
Japan 32%
China 10% Taiwan
6% United States
12%
Germany 9%
South Korea 4%
Hong Kong 6%
Singapore 3%
Malaysia 3%
Thailand 1%
All other 14%
2005 ($31.7 billion)
Japan 21%
China 18%
Taiwan 9%
United States 9%
Germany 9%
South Korea 9%
Hong Kong 5%
Singapore 3%
Malaysia 3%
Thailand 2% All other
12%
2010 ($60.5 billion)
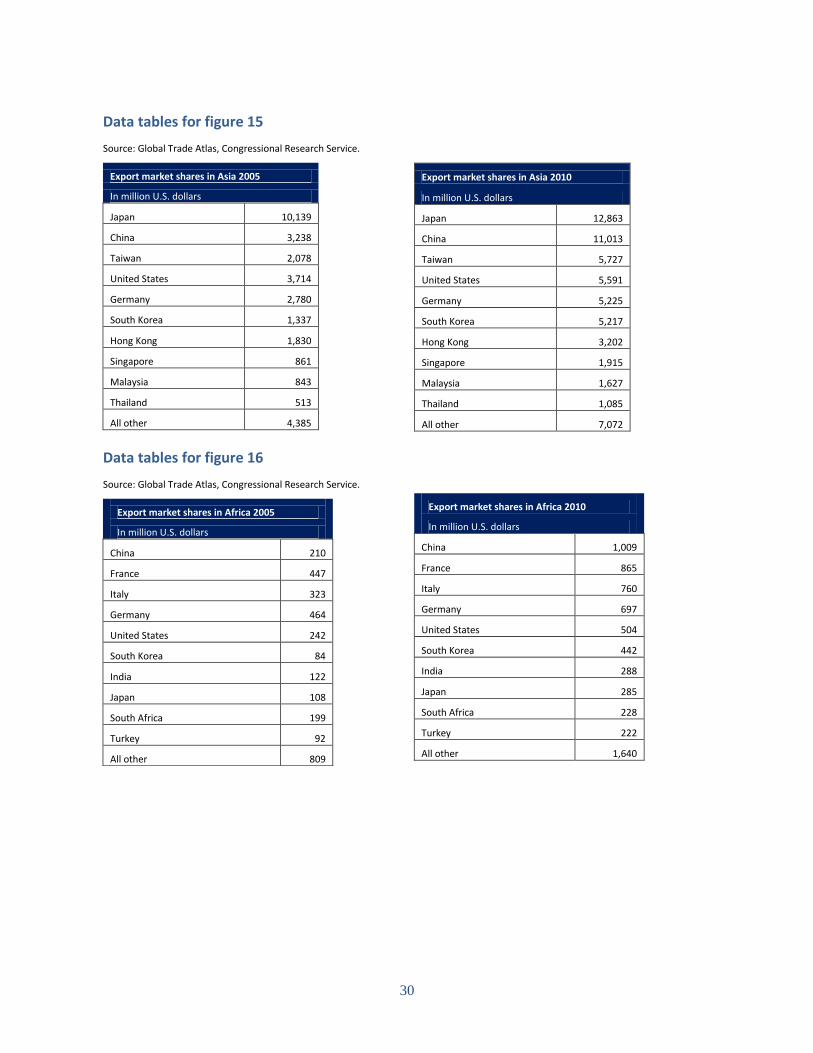
Regional Export Market Shares of Environmental Goods _____________________________________________________________________________________ China’s regional market shares of environmental goods exports increased considerably during the 2005–10 period. During this same period of time, the U.S., E.U. member countries, and Japanese export market shares in most of the top regional markets declined. Between 2005 and 2010, China’s export market share in the E.U., the biggest regional market for environmental goods by volume, increased sevenfold, whereas U.S. market share decreased from six to four percent (figure 14). In other regional export markets (figures 15-19) such as in Asia or Africa (figures 15 and 16), Chinese market share doubled or even tripled (NAFTA (figure 18), Latin America (figure 19)) during the last five years whereas U.S. shares in those markets remained stable or shrank slightly. Figure 14. Export Market Shares in the EU Figure 15. Export Market Shares in Asia

17
China 7%
France 14%
Italy 10%
Germany 15% United States
8% South Korea
3% India 4%
Japan 4%
South Africa 6%
Turkey 3%
All other 26%
2005 ($3.1 billion)
China 15%
France 13%
Italy 11%
Germany 10%
United States
7%
South Korea 6%
India 4%
Japan 4%
South Africa 3%
Turkey 3%
All other 24%
2010 ($6.9 billion)
United States 15%
Germany 15%
Italy 12% China
4% South Korea
12%
France 8%
India 2%
Japan 5%
Turkey 3%
United Kingdom
5%
All other 19%
2005 ($4.5 billion)
United States 17%
Germany 13%
Italy 10%
China 9%
South Korea 8%
France 7%
India 7%
Japan 4%
Turkey 3%
United Kingdom
3%
All other 19%
2010 ($9.4 billion)
Figure 16. Export Market Shares in Africa Figure 17. Export Market Shares in the Middle East

18
United States 21%
Mexico 13%
China 5% Canada
10% Germany
9%
Japan 12%
Malaysia 7%
Denmark 2%
Taiwan 1%
United Kingdom
3%
All other 17%
2005 ($21.7 billion)
United States 19%
Mexico 17%
China 14%
Canada 8%
Germany 8%
Japan 8%
Malaysia 4%
Denmark 3%
Taiwan 2%
United Kingdom
2% All other
15%
2010 ($32.1 billion)
United States 27%
China 3%
Germany 10%
Brazil 9%
Mexico 5%
Italy 4%
Argentina 4%
Spain 3%
Japan 4%
United Kingdom
3%
All other 28%
2005 ($3.1 billion)
United States 28%
China 10%
Germany 10%
Brazil 6%
Mexico 5%
Italy 4%
Argentina 4%
Spain 4%
Japan 3%
United Kingdom
2%
All other 24%
2010 ($7.1 billion)
Figure 18. Export Market Shares in NAFTA partners Figure 19. Export Market Shares in Latin America

19
Conclusion _____________________________________________________________________________________ As the United States and its international trade partners work to develop clean energy, reduce emissions of greenhouse gases, mitigate climate change, and protect the environment, those countries that develop and foster competitive environmental goods industries should be positioned to take advantage of growing international demand for these products. This report shows that over the last several years, the U.S. and other seemingly well-positioned countries have not adequately benefited from this growing demand as they continue to be outpaced by China’s efforts to supply global markets with environmental goods. By specifically examining U.S. trade flows in solar and wind technology, this report also shows that U.S. imports from China continue to rapidly surge, strengthening the preliminary determinations by the ITC that such imports are a cause of domestic industry harm that, left unmitigated, could wipe out U.S. manufacturers in this sector. China’s rapid and punctuated growth appears to be the outcome of aggressive industrial policies employed by Chinese authorities to become one of the world’s leading producers and exporters of environmental goods, a stated goal in China’s two most recent Five Year Plans. Programs that distort trade by providing unfair advantage to Chinese exporters of environmental goods not only harm American producers but also those in other major environmental goods producing countries like E.U. member states and Japan. These Chinese programs need to be further identified and investigated to determine their consistency with WTO rules. WTO violations in this sector, and any other, must be aggressively challenged by the U.S. and its trading partners bilaterally and in multilateral forums. The complaints filed by U.S. producers of solar and wind energy products represent a test as to whether international trade rules can be respected and whether U.S. trade laws provide a sufficient remedy to illegal dumping and subsidization by China. The recent efforts by the Obama Administration to challenge some of China’s unfair trade practices are welcome and encouraging. A strategy to eliminate foreign barriers to American environmental goods and a strong effort to enforce global trade rules to combat unfair trade are necessary steps toward ensuring a level playing field for U.S. producers in global markets. However, these steps alone are insufficient given that the myriad practices employed by China are not likely to be sufficiently remedied in the near term. Insufficient political appetite in Washington, D.C. to more fully challenge China’s tactics, and weak enforcement of international trade rules, undermine America’s environmental goods industry, and many others. As a result, the U.S. domestic policy environment will also remain critical to the success or failure of an American environmental goods industry. Policy makers in Congress would be wise to develop and implement policies that reflect a lasting, bipartisan consensus that establishes a pro-growth environment that enables the development of the American environmental goods industry.

20
Appendix
Data table for Figure 1
Source: U.S. International Trade Commission, Dataweb.
U.S. imports for consumption of environmental goods, by group and HS code, 2006-2011
In 1,000 dollars
2006 2007 2008 2009 2010 2011
REP
841182 106,989 171,125 231,452 195,576 258,158 430,070
853710 4,337,287 4,829,246 5,082,868 4,030,860 5,260,229 5,961,295
854140 1,823,448 2,111,857 2,727,402 2,584,649 4,368,614 7,105,569
841869 388,970 812,189 918,369 831,227 874,789 943,899
848340 1,609,799 1,859,704 2,219,280 1,619,423 1,743,293 2,287,305
900190 311,683 332,082 365,597 275,580 341,824 380,052
841181 152,374 148,473 213,884 330,706 212,568 249,240
841990 579,568 720,159 829,154 652,301 667,675 773,013
850720 425,393 550,336 642,164 481,844 657,369 703,568
850164 224,997 561,206 825,357 551,322 436,883 527,207
848360 226,741 295,383 305,473 198,887 295,659 333,498
841581 47,158 24,441 32,420 52,925 75,290 108,392
850162 63,061 52,217 70,640 51,900 75,005 80,760
841919 304,776 360,228 383,367 328,084 365,382 387,739
850161 158,955 138,885 169,747 114,650 132,773 176,747
730820 247,659 578,729 944,405 612,183 467,814 557,047
900290 147,083 114,093 137,448 129,224 159,881 177,252
841861 364,252 15,869 51,135 56,630 86,540 98,519
841090 40,418 36,274 45,244 49,095 59,150 53,414
761100 3,173 4,134 2,350 2,337 2,390 3,506
850231 1,208,667 2,379,940 2,503,349 2,279,968 1,221,804 1,233,940
840681 68,103 57,559 39,524 31,880 31,910 51,432
850163 37,259 69,623 81,397 36,716 39,560 40,458
841011 472 455 1,939 5,474 4,197 1,367
Subtotal 12,878,285 16,224,207 18,823,965 15,503,441 17,838,757 22,665,289
SHW
392010 472 455 1,939 5,474 4,197 1,367
761290 175,824 194,439 203,378 175,740 184,265 183,935
840290 114,922 274,105 298,271 374,375 136,889 85,151
841940 104,240 142,798 233,470 414,250 258,486 135,843
840219 9,577 10,312 18,322 74,567 15,030 20,961
840410 22,401 48,064 110,356 108,963 57,604 92,604
Subtotal 427,436 670,173 865,736 1,153,369 656,471 519,861
APC
841989 313,167 346,104 373,477 269,602 297,072 347,173
840510 19,583 24,427 15,927 36,953 7,120 11,126
840490 66,941 116,658 128,602 152,871 83,320 79,658
Subtotal 399,691 487,189 518,006 459,426 387,512 437,957
HEM

21
841950 371,189 477,373 722,684 808,975 515,980 542,830
701931 69,281 73,623 56,868 43,918 82,406 84,021
Subtotal 440,470 550,996 779,552 852,893 598,386 626,851
WWM
730900 166,576 227,080 308,930 587,328 289,458 299,443
560314 59,596 58,011 57,249 82,529 103,165 110,260
732490 226,172 285,091 366,179 669,857 392,623 409,703
Subtotal 452,344 570,182 732,358 1,339,714 785,246 819,406
CRET
732111 1,336,355 1,587,267 1,330,962 1,100,523 1,245,651 1,323,715
850680 94,347 91,466 86,295 66,413 64,617 56,497
732190 328,842 308,700 296,864 218,149 239,733 221,972
Subtotal 1,759,544 1,987,433 1,714,121 1,385,085 1,550,001 1,602,184
EMAA
903210 538,283 500,197 526,922 475,674 614,605 614,804
903220 32,812 39,749 45,553 31,507 31,072 34,085
Subtotal 571,095 539,946 572,475 507,181 645,677 648,889
Data table for figures 1 as well as 2
Source: U.S. International Trade Commission, Dataweb.
U.S. domestic exports of environmental goods, by group and HS code, 2006-2011
In 1,000 dollars
2006 2007 2008 2009 2010 2011
REP
841182 2,271,448 3,381,026 3,140,607 2,833,996 2,685,455 2,760,585
853710 2,117,908 2,303,292 2,341,176 1,911,080 2,176,700 2,542,000
854140 1,298,083 1,582,206 1,976,071 2,017,633 2,706,096 2,427,000
841869 206,819 849,532 928,021 705,070 864,852 1,152,254
848340 667,244 743,038 885,890 732,804 929,642 1,189,944
900190 1,474,915 1,344,295 874,813 847,957 1,208,440 1,001,546
841181 496,631 592,548 738,480 390,437 209,630 234,056
841990 503,782 588,307 655,848 564,203 655,352 831,239
850720 301,595 388,302 520,860 374,786 539,586 639,300
850164 268,144 302,080 419,095 370,467 579,837 615,004
848360 198,433 215,737 235,405 203,886 251,645 292,436
841581 109,107 109,305 142,954 140,762 160,909 145,178
850162 94,821 110,505 118,284 121,336 129,179 144,080
841919 79,982 92,312 114,685 119,257 186,639 120,063
850161 66,175 69,991 94,410 79,057 78,450 95,412
730820 83,721 85,080 91,117 65,544 70,935 102,287
900290 95,678 99,062 86,912 62,823 91,326 106,540
841861 628,778 77,914 76,489 80,265 40,030 39,916
841090 34,347 28,636 35,072 50,452 40,632 35,038
761100 16,276 18,842 22,670 13,767 16,555 26,914
850231 83,310 14,158 22,073 116,998 142,116 125,977
840681 2,765 3,150 13,149 78,156 94,573 167,221

22
850163 9,812 10,751 10,446 10,008 13,173 30,486
841011 1,680 3,789 6,749 3,813 5,833 4,828
Subtotal 11111453 13013858 13551275 11894557 13877585 14829304
SHW
392010 892,876 955,339 1,189,459 990,029 1,127,190 1,187,622
761290 296,446 347,518 333,848 371,271 462,376 365,933
840290 155,578 170,438 220,772 237,092 116,309 151,266
841940 29,953 52,332 89,721 92,374 111,404 169,050
840219 41,425 29,729 36,289 27,167 32,209 47,380
840410 22,759 27,638 29,391 28,155 48,533 82,980
Subtotal 1439037 1582994 1899480 1746088 1898021 2004231
APC
841989 556,005 518,246 836,420 525,932 675,840 576,070
840510 47,029 58,228 65,378 78,772 63,702 86,657
840490 75,699 54,607 46,486 59,066 85,945 95,158
Subtotal 678733 631081 948284 663770 825487 757885
HEM
841950 582,203 668,159 764,933 651,456 652,835 814,540
701931 62,567 84,232 117,455 99,974 55,072 53,918
Subtotal 644770 752391 882388 751430 707907 868458
WWM
730900 200,384 253,859 379,312 268,434 270,201 317,741
560314 147,886 165,159 206,538 156,686 217,956 250,124
732490 48,140 66,766 73,622 64,995 70,907 65,656
Subtotal 396410 485785 659472 490115 559064 633521
CRET
732111 153,366 207,111 208,879 205,483 251,212 276,773
850680 146,235 112,858 86,570 68,453 90,347 90,058
732190 68,343 64,084 65,061 48,894 47,825 50,046
Subtotal 367944 384053 360509 322830 389384 416877
EMAA
903210 123,707 109,291 112,027 90,332 92,398 96,257
903220 24,386 19,929 14,424 10,288 17,600 20,356
Subtotal 148092 129220 126450 100620 109998 116613
Summary: Imports in thousand U.S. dollars
2006 2007 2008 2009 2010 2011
REP 12,878,285 16,224,207 18,823,965 15,503,441 17,838,757 22,665,289
SHW 427,436 670,173 865,736 1,153,369 656,471 519,861
APC 399,691 487,189 518,006 459,426 387,512 437,957
HEM 440,470 550,996 779,552 852,893 598,386 626,851
WWM 452,344 570,182 732,358 1,339,714 785,246 819,406
CRET 1,759,544 1,987,433 1,714,121 1,385,085 1,550,001 1,602,184
EMAA 571,095 539,946 572,475 507,181 645,677 648,889
Total 16,928,865 21,030,126 24,006,213 21,201,109 22,462,050 27,320,437

23
Summary: Exports in thousand U.S. dollars
2006 2007 2008 2009 2010 2011
REP 11,111,453 13,013,858 13,551,275 11,894,557 13,878,585 14,829,304
SHW 1,439,037 1,582,994 1,899,480 1,746,088 1,898,021 2,004,231
APC 678,733 631,081 948,284 663,770 825,487 757,885
HEM 644,770 752,391 882,388 751,430 707,907 868,458
WWM 396,410 485,785 659,472 485,785 559,064 633,521
CRET 367,944 384,053 360,509 322,830 389,384 416,877
EMAA 148,092 129,220 126,450 100,620 109,998 116,613
Total 14,786,439 16,979,382 18,427,858 15,965,080 18,368,446 19,626,889
U.S. trade balance with the world -2,142,426 -4,050,744 -5,578,355 -5,236,029 -4,093,604 -7,693,548
U.S. Trade Balance World and China (in million dollars)
2006 2007 2008 2009 2010 2011
With China Not in graph -3,004 -3,277 -2,733 -3,967 -6,389
World without China Not in graph -1,047 -2,301 -2,503 -127 -1,305
With the World Not in graph -4,051 -5,578 -5,236 -4,094
-7,694
Data table for figure 3
Source: ITC Dataweb, Congressional Research Service.
Exports of environmental goods
in million U.S. dollars 2006 2007 2008 2009 2010 2011
U.S. exports 14,818 17,119 18,630 17,645 21,064 22,190
China 10,070 16,173 27,371 24,397 42,572 49,113
Global exports 137,526 173,129 215,570 185,198 236,690 298,466
Data table for figure 4
Source: ITC Dataweb, Congressional Research Service.
U.S. General Imports of Photosensitive Semiconductor Device inc. Photovoltaic cells (HS code 854140) from 7 exemplary countries
in thousand U.S. dollars
2005 2006 2007 2008 2009 2010 2011
China 165,570 260,483 386,313 462,400 636,925 1,567,452 3,365,164
Germany 38,543 66,744 150,606 227,681 126,878 175,698 316,763
Japan 483,339 597,169 662,545 756,335 500,675 734,937 876,648
Mexico 112,732 160,512 133,035 284,188 393,650 543,507 579,228
South Korea 11,631 14,241 16,983 26,562 23,112 46,906 119,056
Canada 28,049 25,611 35,745 33,023 23,901 28,107 44,471
India 8,205 18,452 25,899 15,237 12,658 42,469 52,800
all other 522,981 681,430 711,952 916,671 834,256 1,199,276 1,728,499
Worldwide 1,371,050 1,824,642 2,123,078 2,722,097 2,552,055 4,338,352 7,082,629

24
Data table for figure 5
Source: U.S. International Trade Commission, Dataweb.
U.S. Total Exports of Photosensitive Semiconductor Device inc. Photovoltaic cells (HS code 854140) to 7 exemplary countries
in thousand U.S. dollars
2005 2006 2007 2008 2009 2010 2011
China 33,802 50,280 87,560 83,113 93,008 157,859 98,836
Germany 260,056 301,146 404,754 503,203 656,460 742,970 381,892
Japan 270,292 177,230 130,728 171,706 126,917 219,795 240,140
Mexico 171,174 213,292 226,722 263,408 223,703 259,835 314,163
South Korea 47,572 82,510 92,810 138,683 95,128 73,897 34,186
Canada 104,198 114,507 112,507 122,763 189,449 382,273 423,843
India 18,092 20,600 39,062 33,189 60,676 56,520 132,793
all other 719,780 664,918 819,834 1,048,144 971,782 1,357,126 1,335,934
Worldwide 1,626,971 1,624,483 1,913,977 2,364,209 2,417,123 3,250,275 2,961,787
Data table for figure 6
Source: U.S. International Trade Commission, Dataweb, GTM.
U.S. trade balance of solar goods (PV Capital Equipment, PV Polysilicon, Thin Film PV Feedstock, PV Wafers, PV Cells, PV Modules, PV Inverters, CSP, SHC)
in million U.S. dollars 2010 2011
Balance with China 395 -1,635
Balance with the World 1,882 -1,598
Data table for figure 7
Source: U.S. International Trade Commission, Dataweb.
Trade balance for PV Cells and modules (added together)
in million U.S. dollars 2010 2011
China -1,110 -2778.4
World without China 3,755 -1155.7
World 2645 -3934.1
Data table for figure 8
Source: U.S. International Trade Commission, Dataweb.
Trade balance for PV Polysilicon
in million U.S. dollars 2010 2011
China 869 672.3
World without China 1502 1607.9
World 2371 2280.2

25
Data table for figure 9
Source: U.S. International Trade Commission, Dataweb.
U.S. Domestic Imports of Towers and Lattice Masts of Iron or Steel (HTS 7308200000)
and Generating Sets, Electric, Wind-powered (HTS 8502310000) (added together)
2010 2011
in 1,000 U.S. dollars by FAS value
China 103,573 222,085
rest of the world 1,586,045 1,452,189
total 1,689,618 1,674,274
Data tables for figure 10, 11, 12 and 13
Source: Global Trade Atlas, Congressional Research Service.
Top importers of environmental goods in 2010
Rank Country Amount (mil) 2010 2005 CAGR 05 10
1 Germany 26,267 10,201 0.17074224
2 United States 23,573 14,879 0.079709325
3 China 21,569 11,370 0.112615035
4 Italy 14,847 3,309 0.28427193
5 Netherlands 9,749 2,916 0.222818757
6 France 8,065 4,350 0.108372782
7 South Korea 7,363 3,540 0.129818261
8 United Kingdom 6,313 4,543 0.056368661
9 Canada 6,222 3,720 0.089509892
10 Japan 6,147 4,625 0.048556683
11 Hong Kong 5,094 2,623 0.116974971
12 Spain 4,866 3,484 0.057261278
13 Belgium 4,591 2,366 0.116817195
14 Czech Republic 4,470 1,107 0.261904969
15 Mexico 4,418 2,754 0.081957735
16 Taiwan 3,792 3,605 0.008464257
17 Russia 3,613 1,970 0.106369741
18 Australia 3,363 1,626 0.128758554
19 Thailand 3,081 1,666 0.107905666
20 Brazil 2,845 980 0.194380486
21 Singapore 2,827 1,399 0.124392696
22 Turkey 2,587 996 0.172436999
23 Switzerland 2,518 1,661 0.071801471
24 India 2,470 791 0.208982678
25 Austria 2,470 1,720 0.062171761
26 Sweden 2,449 1,445 0.091909949
27 Indonesia 2,301 619 0.24462254

26
28 Malaysia 2,233 1,457 0.073754166
29 Poland 2,082 1,143 0.105110612
30 Denmark 1,882 1,254 0.070007973
31 United Arab Emirates 1,765
32 Algeria 1,662 428 0.253712266
33 South Africa 1,482 666 0.142603796
34 Venezuela 1,404 410 0.227714001
35 Hungary 1,391 845 0.086621775
36 Slovakia 1,319 460 0.191921976
37 Iran 1,035
38 Norway 1,026 1,222 -0.028716467
39 Romania 1,009 484 0.130249441
40 Chile 997 407 0.161047867
41 Greece 970 450 0.136562188
42 Nigeria 864 nr
43 Finland 852 641 0.048568791
44 Portugal 841 595 0.059367158
45 Kazakhstan 703 478 0.066402705
46 Egypt 623 124 0.308712931
47 Argentina 572 325 0.098800322
48 Slovenia 520 246 0.132864687
49 Ukraine 490 396 0.036136125
50 Bulgaria 476 173 0.183750408
51 Ireland 460 527 -0.022407481
52 Colombia 382 212 0.103116169
53 Morocco 361 198 0.105283454
54 Peru 358 155 0.149719475
55 Jordan 345 78 0.281211266
56 New Zealand 345 285 0.032354937
57 Croatia 344 200 0.094598229
58 Ecuador 326 81 0.261213944
59 Philippines 314 217 0.063518345
60 Luxemburg 272 151 0.103058789
61 Azerbaijan 211 112 0.111332646
62 Cyprus 201 65 0.207018102
63 Lithuania 175 182 -0.006515467
64 Guatemala 154 131 0.027325901
65 Panama 143 31 0.290215903
Kenya 142 nr
Serbia 141 127 0.017581568
Estonia 129 165 -0.040192157
27
Costa Rica 126 61 0.128513568
Uruguay 125 42 0.199343135
Bolivia 111 nr
Iceland 98 79 0.036572853
El Salvador 93 69 0.051007083
Sri Lanka 85 50 0.092466563
Latvia 81 89 -0.0155753
Paraguay 70 27 0.172075837
Yemen 65 nr
Honduras 62 50 0.036502326
Cote d'Ivoire 60 25 0.15709373
Nicaragua 57 29 0.119213164
Malta 55 67 -0.03235814
Senegal 42 28 0.069913194
Mauritius 37 27 0.053916798
Data tables for figure 10, 11, 12 and 13
Source: Global Trade Atlas, Congressional Research Service.
Export market shares in percentage China 2005 China 2010 U.S. 2005 U.S. 2010 EU 2005 EU 2010 Japan 2005 Japan 2010
in Germany (1) 6.26 27.71 7.79 5.23 9.86 4.04
in United States (2) 15.79 21.94 27.4 21.73 11.62 8.56
in China (3) 6.42 5.19 23.12 22.42 34.19 24.17
in Italy (4) 7.99 33.69 8.79 3.52 4.44 1.58
in Netherlands (5) 6.9 46.93 11.69 3.98 9.82 1.63
in France (6) 2.58 10.44 10.68 5.79 2.93 2.13
in South Korea (7) 9.56 25.04 13.23 8.44 21.95 15.8 42.27 30.21
United Kingdom (8) 5.36 7.96 12.69 10.46 7.62 7.25
in Canada (9) 7.66 10.65 67.23 52.92 13.41 22.67 2.97 2.38
in Japan (10) 27.32 32.46 23.84 14.95 15.22 13.89
in Hong Kong (11) 41.66 45.76 5.87 3.23 6.56 3.02 25.35 16.73

28
Export market shares in percentage China 2005 China 2010 U.S. 2005 U.S. 2010 EU 2005 EU 2010 Japan 2005 Japan 2010
in Egypt (46) 5.56 8.42 10.09 5.22 47.58 59.87 4.87 8.78
in Panama (65) 2.28 5.61 48.01 24.04 9.68 12.59 0.77 0.33
in Italy (4) 7.99 33.69 8.79 3.52 4.44 1.58
in Jordan (55) 9.02 7.72 3.57 2.82 47.44 71.3 0.89 0.53
in Czech Republic (14) 1.36 35.28 1.71 1.34 2.08 5.85
in Ecuador (58) 3.34 5.66 33.24 67.23 13.58 9.2 0.98 0.35
in Algeria (32) 6.41 2.8 11.12 7.55 64.02 57.94 1.05 4.71
in Indonesia (27) 14.8 29.56 9.28 5.72 14.54 8.87 26.5 24.63
in Venezuela (34) 5.66 3.15 46.13 67.22 21.46 11.68 1.89 2.02
in Netherlands (5) 6.9 46.93 11.69 3.98 9.82 1.63
China export market shares (percentage)
By largest import markets 2005 2010
Germany (1) 6.26 27.71
United States (2) 15.79 21.94
Italy (4) 7.99 33.69
Netherlands (5) 6.9 46.93
France (6) 2.58 10.44
South Korea (7) 9.56 25.04
United Kingdom (8) 5.36 7.96
Canada (9) 7.66 10.65
Japan (10) 27.32 32.46
Hong Kong (11) 41.66 45.76
China export market shares (percentage)
By fastest growing import markets 2005 2010
Egypt (46) 5.56 8.42
Panama (65) 2.28 5.61
Italy (4) 7.99 33.69
Jordan (55) 9.02 7.72
Czech Republic (14) 1.36 35.28
Ecuador (58) 3.34 5.66
Algeria (32) 6.41 2.8
Indonesia (27) 14.8 29.56
Venezuela (34) 5.66 3.15
Netherlands (5) 6.9 46.93
U.S. export market shares (percentage)
By largest import markets 2005 2010
Germany (1) 7.79 5.23
China (3) 6.42 5.19
Italy (4) 8.79 3.52
Netherlands (5) 11.69 3.98
France (6) 10.68 5.79
South Korea (7) 13.23 8.44
United Kingdom (8) 12.69 10.46
Canada (9) 67.23 52.92
Japan (10) 23.84 14.95
Hong Kong (11) 5.87 3.23
U.S. export market shares (percentage)
By fastest growing import markets 2005 2010
Egypt (46) 10.09 5.22
Panama (65) 48.01 24.04
Italy (4) 8.79 3.52
Jordan (55) 3.57 2.82
Czech Republic (14) 1.71 1.34
Ecuador (58) 33.24 67.23
Algeria (32) 11.12 7.55
Indonesia (27) 9.28 5.72
Venezuela (34) 46.13 67.22
Netherlands (5) 11.69 3.98

29
EU exports market shares (percentage)
largest import markets 2005 2010
United States (2) 27.4 21.73
China (3) 23.12 22.42
South Korea (7) 21.95 15.8
Canada (9) 13.41 22.67
Japan (10) 15.22 13.89
Hong Kong (11) 6.56 3.02
EU export market shares (percentage)
By fastest growing import markets 2005 2010
Egypt (46) 47.58 59.87
Panama (65) 9.68 12.59
Jordan (55) 47.44 71.3
Ecuador (58) 13.58 9.2
Algeria (32) 64.02 57.94
Indonesia (27) 14.54 8.87
Venezuela (34) 21.46 11.68
Japan export market shares (percentage)
By largest import markets 2005 2010
Germany (1) 9.86 4.04
United States (2) 11.62 8.56
China (3) 34.19 24.17
Italy (4) 4.44 1.58
Netherlands (5) 9.82 1.63
France (6) 2.93 2.13
South Korea (7) 42.27 30.21
United Kingdom (8) 7.62 7.25
Canada (9) 2.97 2.38
Hong Kong (11) 25.35 16.73
Japan export market shares (percentage)
By fastest growing import markets 2005 2010
Egypt (46) 4.87 8.78
Panama (65) 0.77 0.33
Italy (4) 4.44 1.58
Jordan (55) 0.89 0.53
Czech Republic (14) 2.08 5.85
Ecuador (58) 0.98 0.35
Algeria (32) 1.05 4.71
Indonesia (27) 26.5 24.63
Venezuela (34) 1.89 2.02
Netherlands (5) 9.82 1.63
Data tables for figure 14
Source: Global Trade Atlas, Congressional Research Service.
Export market shares in EU 2005
In million U.S. dollars
China 1,493
Germany 9,995
Netherlands 1,770
Italy 4,080
France 3,423
United States 2,520
Spain 1,147
Czech Republic 1,319
Belgium 2,281
Japan 2,738
All other 13,434
Export market shares in EU 2010
In million U.S. dollars
China 22,168
Germany 20,367
Netherlands 6,884
Italy 5,016
France 4,322
United States 4,148
Spain 3,549
Czech Republic 3,116
Belgium 2,844
Japan 2,809
All other 28,851
30
Data tables for figure 15
Source: Global Trade Atlas, Congressional Research Service.
Export market shares in Asia 2005
In million U.S. dollars
Japan 10,139
China 3,238
Taiwan 2,078
United States 3,714
Germany 2,780
South Korea 1,337
Hong Kong 1,830
Singapore 861
Malaysia 843
Thailand 513
All other 4,385
Export market shares in Asia 2010
In million U.S. dollars
Japan 12,863
China 11,013
Taiwan 5,727
United States 5,591
Germany 5,225
South Korea 5,217
Hong Kong 3,202
Singapore 1,915
Malaysia 1,627
Thailand 1,085
All other 7,072
Data tables for figure 16
Source: Global Trade Atlas, Congressional Research Service.
Export market shares in Africa 2005
In million U.S. dollars
China 210
France 447
Italy 323
Germany 464
United States 242
South Korea 84
India 122
Japan 108
South Africa 199
Turkey 92
All other 809
Export market shares in Africa 2010
In million U.S. dollars
China 1,009
France 865
Italy 760
Germany 697
United States 504
South Korea 442
India 288
Japan 285
South Africa 228
Turkey 222
All other 1,640

31
Data tables for figure 17
Source: Global Trade Atlas, Congressional Research Service.
Export market shares in Middle East 2005
In million U.S. dollars
United States 699
Germany 658
Italy 543
China 179
South Korea 523
France 353
India 112
Japan 223
Turkey 137
United Kingdom 228
All other 845
Export market shares in Middle East 2010
In million U.S. dollars
United States 1,607
Germany 1,242
Italy 932
China 863
South Korea 749
France 684
India 631
Japan 433
Turkey 254
United Kingdom 250
All other 1,794
Data tables for figure 18
Source: Global Trade Atlas, Congressional Research Service.
Export market shares in NAFTA countries 2005
In million U.S. dollars
United States 4,507
Mexico 2,829
China 1,161
Canada 2,078
Germany 1,857
Japan 2,493
Malaysia 1,608
Denmark 538
Taiwan 311
United Kingdom 707
All other 3,611
Export market shares in NAFTA countries 2010
In million U.S. dollars
United States 6,243
Mexico 5,304
China 4,489
Canada 2,602
Germany 2,555
Japan 2,412
Malaysia 1,193
Denmark 1,111
Taiwan 745
United Kingdom 743
All other 4,663

32
Data tables for figure 19
Source: Global Trade Atlas, Congressional Research Service.
Export market shares in Latin American Countries 2005
In million U.S. dollars
United States 834
China 104
Germany 300
Brazil 263
Mexico 170
Italy 133
Argentina 111
Spain 81
Japan 133
United Kingdom 91
All other 880
Export market shares in Latin American Countries 2010
In million U.S. dollars
United States 1,993
China 726
Germany 684
Brazil 446
Mexico 347
Italy 318
Argentina 283
Spain 252
Japan 241
United Kingdom 126
All other 1,675