Evaluation of an Essential Oil Blend and a Novel Soybean ...
Upload
nguyenngocCategory
view
222download
0
2012REPORT OF INSECTICIDE
EVALUATION
Department of EntomologyAmes, Iowa 50011-3140
Sue Blodgett, Chair
Soybean Pests InvestigatedSoybean Aphid
Japanese BeetleTwospotted Spider Mite
Project Leaders Erin Hodgson Greg VanNostrand
21 November 2012File Number 291-12


To see a digital copy of the Iowa State UniversitySoybean Pests Efficacy Evaluation Reports
from 2005-2012, visit our website:
www.soybeanaphid.info
Or scan this QR code on your smartphone or tabletto go directly to Erin Hodgson’s website:
2012 Soybean Insecticide Evaluation Page i
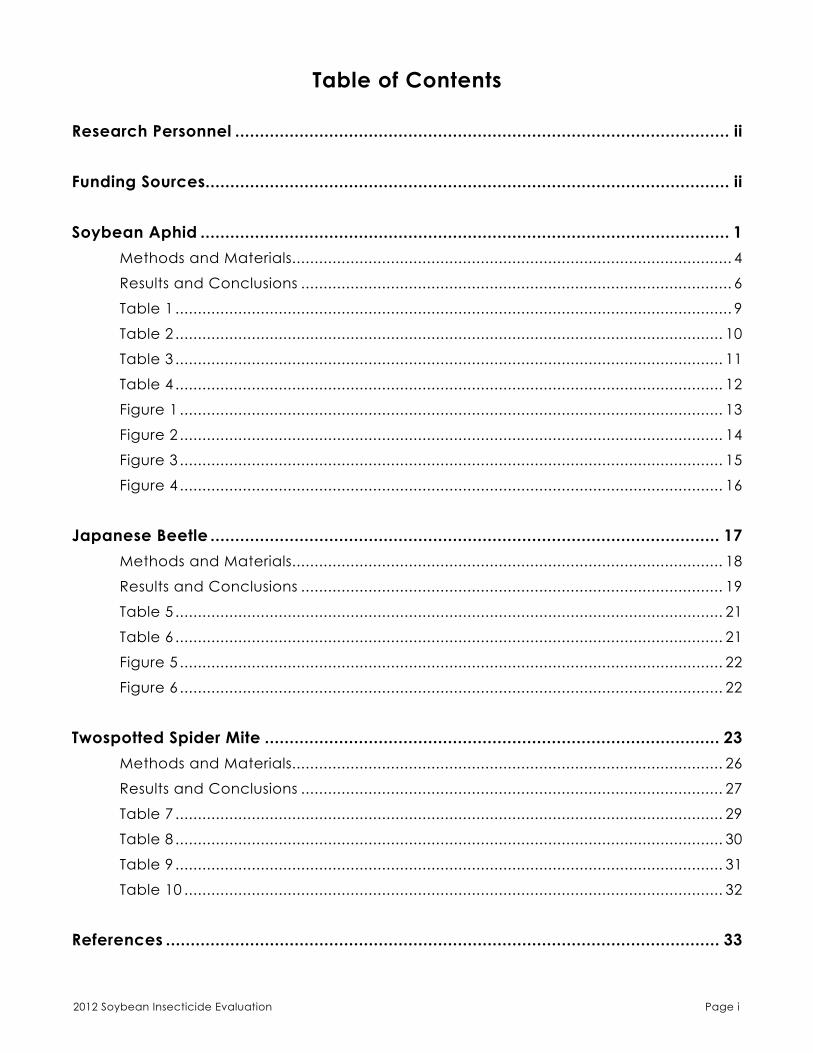
Table of Contents
Research Personnel .................................................................................................... ii
Funding Sources.......................................................................................................... ii
Soybean Aphid ........................................................................................................... 1Methods and Materials�������������������������������������������������������������������������������������������������� 4
Results and Conclusions ������������������������������������������������������������������������������������������������ 6
Table 1 ���������������������������������������������������������������������������������������������������������������������������� 9
Table 2 �������������������������������������������������������������������������������������������������������������������������� 10
Table 3 �������������������������������������������������������������������������������������������������������������������������� 11
Table 4 �������������������������������������������������������������������������������������������������������������������������� 12
Figure 1 ������������������������������������������������������������������������������������������������������������������������� 13
Figure 2 ������������������������������������������������������������������������������������������������������������������������� 14
Figure 3 ������������������������������������������������������������������������������������������������������������������������� 15
Figure 4 ������������������������������������������������������������������������������������������������������������������������� 16
Japanese Beetle ....................................................................................................... 17Methods and Materials������������������������������������������������������������������������������������������������ 18
Results and Conclusions ���������������������������������������������������������������������������������������������� 19
Table 5 �������������������������������������������������������������������������������������������������������������������������� 21
Table 6 �������������������������������������������������������������������������������������������������������������������������� 21
Figure 5 ������������������������������������������������������������������������������������������������������������������������� 22
Figure 6 ������������������������������������������������������������������������������������������������������������������������� 22
Twospotted Spider Mite ............................................................................................ 23Methods and Materials������������������������������������������������������������������������������������������������ 26
Results and Conclusions ���������������������������������������������������������������������������������������������� 27
Table 7 �������������������������������������������������������������������������������������������������������������������������� 29
Table 8 �������������������������������������������������������������������������������������������������������������������������� 30
Table 9 �������������������������������������������������������������������������������������������������������������������������� 31
Table 10 ������������������������������������������������������������������������������������������������������������������������ 32
References ................................................................................................................ 33

2012 Soybean Insecticide Evaluation Page ii
Iowa State University Research Personnel
Project Leaders Erin Hodgson, Assistant Professor, Department of Entomology Greg VanNostrand, Research Associate, Department of Entomology
Other Personnel Josh Sievers, Northwest Research Farm Manager Ryan Rusk, Northwest Research Farm Manager Kenneth Pecinovsky, Northeast Research Farm Manager Kent Berns, Research Farm Superintendent Stith Wiggs, Research Associate, Department of Plant Pathology and Microbiology Cody Kuntz, graduate student, Department of Entomology Mike McCarville, graduate student, Department of Entomology Taylor Mordhorst, undergraduate student Tyler Netsch, undergraduate student Tyler Stallman, undergraduate student
Funding Sources Iowa Soybean Association and the soybean checkoff BASF Bayer CropScience Cheminova Dow AgroSciences Dupont Gowan Grain Processing Corporation Nichino Syngenta Crop Protection Valent

2012 Soybean Insecticide Evaluation Page 1
Soybean Aphid
SOYBEAN, Glycine max (L�), grown in most of the north central region of the United States has historically used low amounts of insecticide� Before 2000, less than 0�1% of soybean was treated with insecticides (USDA-NASS)� However, soybean pest management has drastically changed in the last decade due to the establishment of soybean aphid, Aphis glycines Matsumura (Hemiptera: Aphididae), in 2000� As a result of the potential economic loss from soybean aphid, there was approximately a 130-fold increase of foliar insecticide applications from 2000 to 2010 (Ragsdale et al� 2011)� There was an estimated 1,400% increase of Iowa soybean acres treated with a foliar insecticide in 2009 compared to 2000 (Hodgson et al� 2012a)� Farmers are also increasing the adoption of insecticidal seed treatments to control early-season establishment of insects on soybean� Approximately 73% of Iowa soybean had an insecticidal seed treatment in 2009 (Hodgson et al� 2012a)�
A multistate research effort showed that over a wide range of growing conditions, 650 aphids per plant are needed before economic injury will occur (Ragsdale et al� 2007)� An economic threshold of 250 aphids per plant was developed and adopted throughout the north central region (Ragsdale et al� 2007, Hodgson et al� 2012b)� The economic threshold should be used from R1–R5�5 (i�e�, flowering through seed set) to protect yield, reduce control costs, and preserve insecticide efficacy (Hodgson and O’Neal 2011)�
Host plant resistance is a new and complementary tool to manage soybean aphid� Aphid-resistant varieties have the potential to simultaneously reduce insecticide usage and associated production costs, and preserve natural enemies in soybean (Tilmon et al� 2011)� To date, host plant resistant genes for soybean aphid are prefixed with “Rag,” which is an abbreviation for “Resistant Aphis glycines�” The Rag1 gene expresses antibiosis and has been commercially available since 2010� Antibiosis is a type of resistance where exposed insects do not live as long or produce as many offspring as they could on susceptible plants� About fifteen soybean varieties are available with Rag-gene technology (McCarville et al� 2012)�
Soybean aphid is Iowa’s primary soybean pest. Photo by Rob Venette.

2012 Soybean Insecticide Evaluation Page 2
Soybean Aphid Description. Wingless adults are a typical pear-shape and are 1/16 inch long (Voegtlin et al� 2004)� The body is bright yellow-green with dark eyes and black cornicles (i�e�, “tailpipes” at the end of the abdomen)� They have pale legs, antennae and dusky-colored cauda (i�e�, small appendage on the tip of the abdomen)� Winged aphids have a dark head and thorax, and two pairs of clear wings that extend well past the end of the abdomen�
Soybean Aphid Life Cycle. Soybean aphid has a complex life cycle similar to other host-alternating aphids (Ragsdale et al� 2004)� In the fall, eggs are laid on buckthorn (Rhamnus spp�) to overwinter� Buckthorn is a woody shrub found in shelter belts throughout the north central region� Egg hatch is synchronized with buckthorn bud burst in the spring� A few asexual wingless generations are produced before winged adults are formed� Spring migrants move to emerging soybean during May and June� There can be 15–18 asexual generations on soybean depending on the temperature (McCornack et al� 2004)� During the summer, there is a mixture of wingless and winged adults formed� Aphid crowding, plant quality and the presence of natural enemies may prompt winged aphids to develop� Long distance migration can occur because the aphids move with jet streams� As soybean matures and day length decreases, winged soybean aphids move back to buckthorn to mate and deposit eggs�
Soybean Aphid Feeding Damage. As with all aphids, they have a piercing-sucking stylet mouthpart� Nymphs and adults feed on plant sap in the phloem of all aboveground plant parts� Heavily infested plants may be discolored or wilted� Prolonged aphid feeding results in large amounts of cast skins and excreted honeydew on all aboveground plant parts� Honeydew is sugar-rich and sticky, and can promote black sooty mold growth� Severe aphid infestations can cause flower and small pods to abort� The combination of aphids removing plant nutrients and mold-covered leaves can result in up to 40% yield reduction (Ragsdale et al� 2007)�
Soybean aphids have a host-alternating life cycle that includes soybean and buckthorn.

2012 Soybean Insecticide Evaluation Page 3
Scouting for Soybean Aphid. Most IPM (integrated pest management) programs involve regular sampling of the pest� This can be especially important for a multigenerational insect with a complex life cycle like soybean aphid (Hodgson et al� 2012b)� Regular scouting for soybean aphid in July and August, or at least from R1–R5�5 (i�e�, bloom through seed set) is recommended (Hodgson et al� 2004), even if using an insecticidal seed treatment and/or host plant resistance� Winged aphids are more prevalent and likely to migrate within and between fields during the reproductive soybean period (Hodgson et al� 2005)� Regular sampling throughout the growing season will help farmers track trends and improve foliar application timing�
Although colonies can be initially patchy, populations can quickly spread throughout the field under favorable weather conditions� Soybean aphid prefers the newest soybean foliage (e�g�, expanding trifoliates), and are attracted to late-planted soybean� Scouting every 7–10 days is ideal to monitor naturally fluctuating populations� Plants covered with honeydew or sooty mold indicates soybean aphids have been there for a long time� Count aphids on 40 plants for every 50 acres of soybean, and be sure to look at different areas of the field� Alternatively, use a binomial sequential sampling plan, Speed Scouting for Soybean Aphid (Hodgson et al� 2007)�
2012 Statewide Summary. The severity and abundance of soybean aphid in Iowa has fluctuated over the last decade� In 2012, most soybean fields in Iowa had low soybean aphid densities� Most infestations started late in the growing season (e�g�, 5–20 August), and did not significantly impact yield� Very few fields reached the economic threshold and warranted an insecticidal application to protect yield� However, some commercial fields were prophylactically sprayed with a combination of an insecticide and fungicide during R1–R3 (i�e�, flowering through beginning pod set)� We do not generally recommend preventative insecticide applications for soybean aphid because the erratic population dynamics in Iowa make predicting outbreaks difficult, and unnecessary exposure is not in alignment with an IPM program�
Sooty mold (top) on leaves can negatively impact yield. Photo by Brian McCornack.

2012 Soybean Insecticide Evaluation Page 4
Soybean aphid was not an economic factor in 2012� In Iowa, the 2011–2012 winter was exceptionally warm and the entire 2012 growing season was under drought stress� This had positive and negative implications for insect development depending on the species (Hodgson and Jesse 2012)� The abnormal growing conditions could have affected the development of soybean aphid eggs and also the first few generations on buckthorn� In other words, if egg hatch was accelerated on buckthorn and forced migratory aphids to move before soybean emerged, they may not have been able survive long enough to start colonies later in the season�
Methods and MaterialsWe established plots at two Iowa State University Research Farms in 2012� A Syngenta soybean variety 05RM310021 was used for all the soybean aphid-susceptible treatments, and a Syngenta soybean variety 07JR801843 was used for the Rag1 treatments� The two seed types were not genetically related, but plants were visually similar�
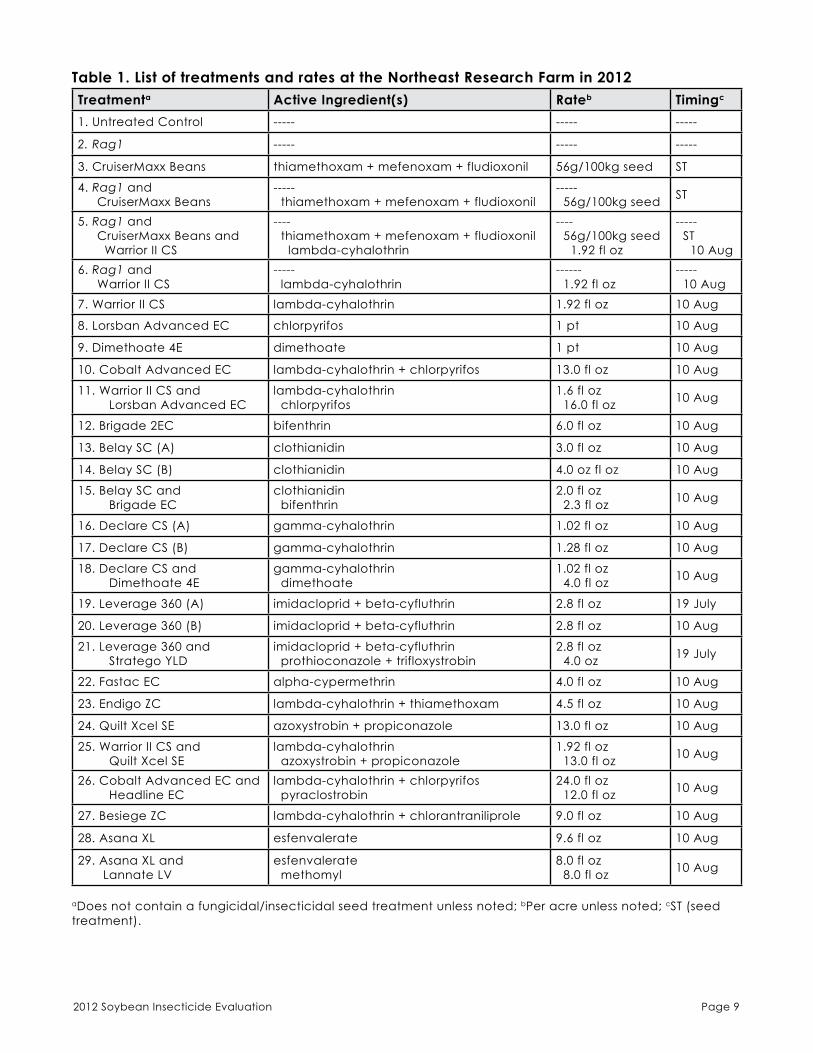
Northeast Research Farm. The first location was at the Iowa State University Northeast Research Farm in Floyd County, Iowa� The treatments were arranged in a randomized complete block design with four replications, and soybean was planted in 30-inch rows using no-till production practices on 16 May 2012� Each plot was six rows wide and 50 feet long� In total, we evaluated 29 treatments that included products alone or in combination (Table 1)�
Northwest Research Farm. The second location was at the Iowa State University Northwest Research Farm in O’Brien County, Iowa� The treatments were arranged in a randomized complete block design with four replications, and soybean was planted in 30-inch rows using standard production practices on 14 May 2012� Each plot was six rows wide and 50 feet long� In total, we evaluated 14 treatments including products alone or in combination (Table 3)�
Plant Stand. Plant stands were taken at the V2 growth stage at the Northeast and Northwest Research Farms on 13 June and 11 June, respectively� Two 10-foot sections were randomly selected within each plot, and the number of emerged plants were counted� The average plant stand per 10 linear feet was 115�6 ± 0�67 (± SEM) plants for the Northeast Research Farm and 83�0 ± 0�64 plants for the Northwest Research Farm�
Soybean Aphid Populations. Soybean aphids were counted on randomly selected plants within each plot� All aphids (adults, nymphs, and winged aphids) were counted on whole plants� The number of plants counted ranged from 20 to 3, and was determined by plant

2012 Soybean Insecticide Evaluation Page 5
growth stage and by the severity of aphid infestation� Twenty plants were counted in each plot during the vegetative growth� At R1 (i�e�, beginning bloom), ten plants were sampled in each plot� The number of plants sampled further decreased to 5 and then to 3 per plot as plants matured from R3–R5 (i�e�, pod fill to seed fill)� Estimating soybean aphid pressure over the entire growing season provides a measure of the seasonal aphid exposure that a soybean plant experiences, similar to calculating area under the curve� To estimate the total exposure of soybean plants to soybean aphid, we calculated cumulative aphid days (CAD) based on the number of aphids per plant counted on each sampling date� We estimated CAD with the following equation:
equation [1]
where x is the mean number of aphids on sample day i, xi-1 is the mean number of aphids on the previous sample day, and t is the number of days between samples i - 1 and i� We would expect to see economic injury around 5,000–6,000 CAD (Ragsdale et al� 2007)� Flucuating market values and control costs will influence the actual economic injury level each year�
Insecticide Application Techniques. Most of seed used in 2012 did not have a seed treatment, but those treatments containing CruiserMaxx Beans were applied by Syngenta� For all locations, foliar treatments were applied using a 6-row backpack sprayer and TeeJet (Springfield, IL) twinjet nozzles (TJ 11002) with 20 gallons of water per acre at 40 pounds of pressure per square inch� Our target aphid density for most foliar insecticide treatments was at the economic threshold; however, plots were sprayed at R5 (i�e�, beginning seed fill) if aphids did not reach threshold�
Yield. Each plot was harvested using a small plot combine� The Northeast Research Farm was harvested on 26 September and the Northwest Research Farm was harvested on 27 September� Yields were determined by weighing grain with a hopper which rested on a digital scale sensor custom designed for each of the combines� Yields were corrected to 13% moisture and reported as bushels per acre�
Statistical Analysis. One way analysis of variance (ANOVA) was used to determine treatment effects within each experiment� Means separation for all treatments were achieved using a least significant difference (LSD) test (alpha = 0�10)� All statistical analyses were performed using SAS® software (SAS 2012)�
txx
n
ii ×
+=∑
∞
=
−
1
1
2

2012 Soybean Insecticide Evaluation Page 6
Results and ConclusionsThere was very low soybean aphid pressure at both locations in 2012, and the economic threshold was never reached� The plots at the Northwest Research Farm were colonized in mid-July, and the plots at the Northeast Research Farm were colonized in early August� At each location, aphids were suppressed by the treatments with the Rag1 gene� This is supportive of our previous Yellow Book reports that compared susceptible and resistant varieties (Hodgson and VanNostrand 2011)�
Northeast Research Farm. This location had very low soybean aphid pressure in 2012, with some plots never being colonized the entire summer� Treatments 19 and 21 had a R3 (i�e�, beginning pod set) targeted application and were made on 19 July� Treatments 5–18, 20 and 22–29 received a foliar application on 10 August when plants were in the R5 growth stage (Table 1)� The untreated control plots were not infested with soybean aphid three days prior to the 10 August application� A few aphids colonized untreated control plots in late August� Treatment 10 (Cobalt Advanced at 13�0 fl oz) had significantly more CAD than all other treatments (P<0�56; F = 0�94; df = 28, 3), but this is misleading because one plot within the treatment was colonized for a brief time before the foliar applications were made� This patchy infestation greatly influenced seasonal accumulation (Table 1; Figure 1)� Note treatments with the Rag1 gene had the fewest CAD for 2012�
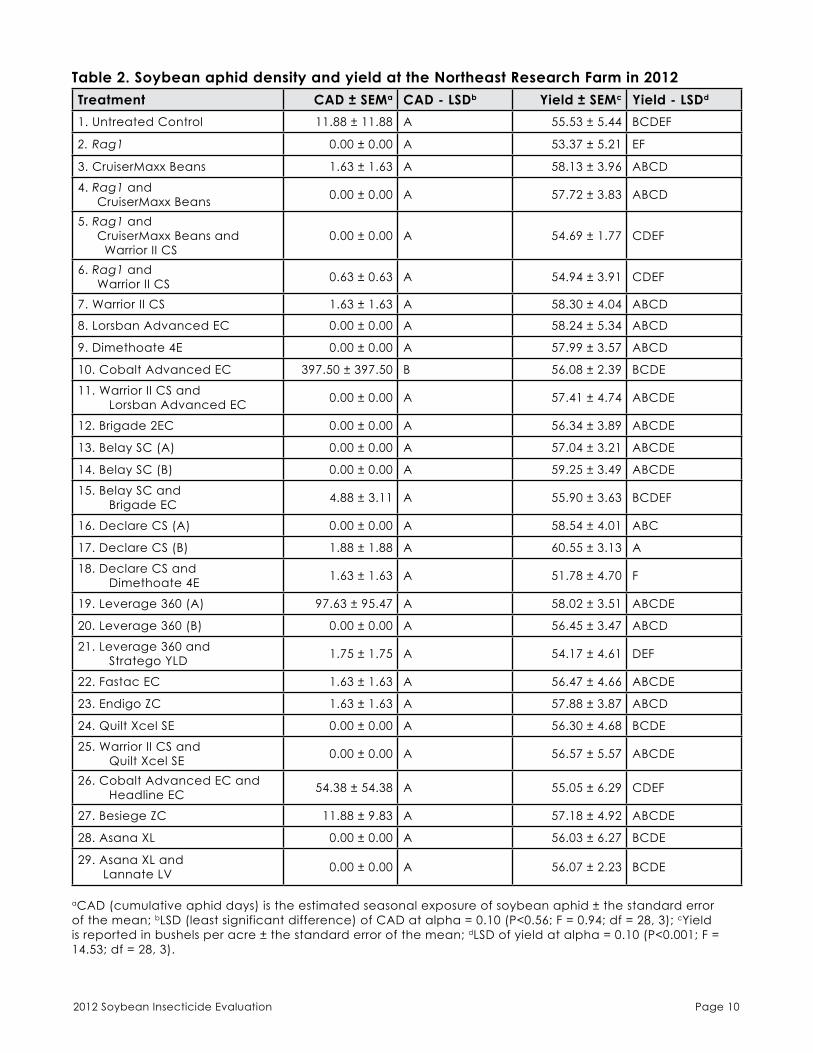
Overall CAD was extremely low for treatments and well below any expected economic injury level� However, there was some differences in yield at the Northeast Research Farm (P<0�001; F = 14�53; df = 28, 3) (Table 2; Figure 2)� Overall, treatment 17 (Declare at 1�28 fl oz) had the highest yield (60�55 ± 3�13), while treatment 18 (Declare at 1�02 fl oz and Dimethoate at 4�0 fl oz) had the lowest yield (51�78 ± 4�70)� This yield difference is not believed to be related to soybean aphid�
Northwest Research Farm. There was low soybean aphid pressure at this location in 2012� Treatments 11 and 14 had a beginning pod set (R3) targeted application and were made on 20 July� Treatments 6–10 and 12–13 received a foliar application on 16 August when plants were in the R5 growth stage (Table 2)� Soybean aphid populations in the untreated control plots averaged 0�80 ± 0�43 aphids per plant three days prior to the 16 August application� Aphids peaked on 26 August at 5�60 ± 1�86 aphids per plant and reached 678�25 ± 273�57 CAD in the untreated control treatment by the end of the season� There were some significant differences in CAD among treatments (P<0�03; F = 2�07; df = 13, 3)� But like with the Northeast Research Farm, soybean aphid colonization was very patchy and influenced the mean separation analysis (e�g�, treatments 7 and 10)� Note that treatment 2 (Rag1) had virtually no aphid development (Table 4; Figure 3)�

2012 Soybean Insecticide Evaluation Page 7
As with the Northeast Research Farm, soybean aphid seasonal accumulation was well below an expected economic injury level� There were no significant differences among any of the treatments in regards to yield (P<0�99; F = 0�30; df = 13, 3) (Table 4; Figure 4)� In the absence of soybean aphid, the yield was similar between the susceptible and Rag1 seed types�
Overall Summary. In 2011, seasonal aphid populations between three locations were highly variable (Hodgson and VanNostrand 2011), but both locations in 2012 were very low� Obviously infestations were highly patchy as demonstrated by the large standard error of the mean within a treatment (Tables 1–2; Figures 1–2)� We included several established insecticides and a few new products marketed for soybean aphid; however, it is difficult to compare management strategies in the absence of aphid pressure� Most foliar products were effective at reducing CAD and protecting yield� We did not detect any thriving aphid populations three days after foliar application for any product�
Treatment Recommendations. Population fluctuations between locations and years is typical soybean aphid dynamics for Iowa� In the absence of heavy aphid pressure, we do not expect to see a yield difference between insecticide treatments� Therefore, our recommendation for soybean aphid management is to:
• Continue to scout soybean fields and to apply a full rate of a foliar insecticide when populations exceed 250 aphids per plant (see Hodgson et al� 2011b for a more detailed description)� • One well-timed foliar application applied after aphids exceed the economic threshold will protect yield and increase profits in most situations� To date, most foliar insecticides are very effective at reducing soybean aphid populations if the coverage is sufficient�
• We would also strongly encourage farmers to incorporate host plant resistance into their seed selection if appropriate for their area�
• At this time, we are not recommending insecticidal seed treatments for aphid management because of soybean aphid biology in Iowa�

2012 Soybean Insecticide Evaluation Page 8
2012 Soybean Insecticide Evaluation Page 9
Table 1. List of treatments and rates at the Northeast Research Farm in 2012Treatmenta Active Ingredient(s) Rateb Timingc
1� Untreated Control ----- ----- -----
2. Rag1 ----- ----- -----
3� CruiserMaxx Beans thiamethoxam + mefenoxam + fludioxonil 56g/100kg seed ST
4� Rag1 and CruiserMaxx Beans
----- thiamethoxam + mefenoxam + fludioxonil
----- 56g/100kg seed ST
5� Rag1 and CruiserMaxx Beans and Warrior II CS
---- thiamethoxam + mefenoxam + fludioxonil lambda-cyhalothrin
---- 56g/100kg seed 1�92 fl oz
----- ST 10 Aug
6� Rag1 and Warrior II CS
----- lambda-cyhalothrin
------ 1�92 fl oz
----- 10 Aug
7� Warrior II CS lambda-cyhalothrin 1�92 fl oz 10 Aug
8� Lorsban Advanced EC chlorpyrifos 1 pt 10 Aug
9� Dimethoate 4E dimethoate 1 pt 10 Aug
10� Cobalt Advanced EC lambda-cyhalothrin + chlorpyrifos 13�0 fl oz 10 Aug
11� Warrior II CS and Lorsban Advanced EC
lambda-cyhalothrin chlorpyrifos
1�6 fl oz 16�0 fl oz 10 Aug
12� Brigade 2EC bifenthrin 6�0 fl oz 10 Aug
13� Belay SC (A) clothianidin 3�0 fl oz 10 Aug
14� Belay SC (B) clothianidin 4�0 oz fl oz 10 Aug
15� Belay SC and Brigade EC
clothianidin bifenthrin
2�0 fl oz 2�3 fl oz 10 Aug
16� Declare CS (A) gamma-cyhalothrin 1�02 fl oz 10 Aug
17� Declare CS (B) gamma-cyhalothrin 1�28 fl oz 10 Aug
18� Declare CS and Dimethoate 4E
gamma-cyhalothrin dimethoate
1�02 fl oz 4�0 fl oz 10 Aug
19� Leverage 360 (A) imidacloprid + beta-cyfluthrin 2�8 fl oz 19 July
20� Leverage 360 (B) imidacloprid + beta-cyfluthrin 2�8 fl oz 10 Aug
21� Leverage 360 and Stratego YLD
imidacloprid + beta-cyfluthrin prothioconazole + trifloxystrobin
2�8 fl oz 4�0 oz 19 July
22� Fastac EC alpha-cypermethrin 4�0 fl oz 10 Aug
23� Endigo ZC lambda-cyhalothrin + thiamethoxam 4�5 fl oz 10 Aug
24� Quilt Xcel SE azoxystrobin + propiconazole 13�0 fl oz 10 Aug
25� Warrior II CS and Quilt Xcel SE
lambda-cyhalothrin azoxystrobin + propiconazole
1�92 fl oz 13�0 fl oz 10 Aug
26� Cobalt Advanced EC and Headline EC
lambda-cyhalothrin + chlorpyrifos pyraclostrobin
24�0 fl oz 12�0 fl oz 10 Aug
27� Besiege ZC lambda-cyhalothrin + chlorantraniliprole 9�0 fl oz 10 Aug
28� Asana XL esfenvalerate 9�6 fl oz 10 Aug
29� Asana XL and Lannate LV
esfenvalerate methomyl
8�0 fl oz 8�0 fl oz 10 Aug
aDoes not contain a fungicidal/insecticidal seed treatment unless noted; bPer acre unless noted; cST (seed treatment)�
2012 Soybean Insecticide Evaluation Page 10
Table 2. Soybean aphid density and yield at the Northeast Research Farm in 2012Treatment CAD ± SEMa CAD - LSDb Yield ± SEMc Yield - LSDd
1� Untreated Control 11�88 ± 11�88 A 55�53 ± 5�44 BCDEF
2. Rag1 0�00 ± 0�00 A 53�37 ± 5�21 EF
3� CruiserMaxx Beans 1�63 ± 1�63 A 58�13 ± 3�96 ABCD
4� Rag1 and CruiserMaxx Beans 0�00 ± 0�00 A 57�72 ± 3�83 ABCD
5� Rag1 and CruiserMaxx Beans and Warrior II CS
0�00 ± 0�00 A 54�69 ± 1�77 CDEF
6� Rag1 and Warrior II CS 0�63 ± 0�63 A 54�94 ± 3�91 CDEF
7� Warrior II CS 1�63 ± 1�63 A 58�30 ± 4�04 ABCD
8� Lorsban Advanced EC 0�00 ± 0�00 A 58�24 ± 5�34 ABCD
9� Dimethoate 4E 0�00 ± 0�00 A 57�99 ± 3�57 ABCD
10� Cobalt Advanced EC 397�50 ± 397�50 B 56�08 ± 2�39 BCDE
11� Warrior II CS and Lorsban Advanced EC 0�00 ± 0�00 A 57�41 ± 4�74 ABCDE
12� Brigade 2EC 0�00 ± 0�00 A 56�34 ± 3�89 ABCDE
13� Belay SC (A) 0�00 ± 0�00 A 57�04 ± 3�21 ABCDE
14� Belay SC (B) 0�00 ± 0�00 A 59�25 ± 3�49 ABCDE
15� Belay SC and Brigade EC 4�88 ± 3�11 A 55�90 ± 3�63 BCDEF
16� Declare CS (A) 0�00 ± 0�00 A 58�54 ± 4�01 ABC
17� Declare CS (B) 1�88 ± 1�88 A 60�55 ± 3�13 A
18� Declare CS and Dimethoate 4E 1�63 ± 1�63 A 51�78 ± 4�70 F
19� Leverage 360 (A) 97�63 ± 95�47 A 58�02 ± 3�51 ABCDE
20� Leverage 360 (B) 0�00 ± 0�00 A 56�45 ± 3�47 ABCD
21� Leverage 360 and Stratego YLD 1�75 ± 1�75 A 54�17 ± 4�61 DEF
22� Fastac EC 1�63 ± 1�63 A 56�47 ± 4�66 ABCDE
23� Endigo ZC 1�63 ± 1�63 A 57�88 ± 3�87 ABCD
24� Quilt Xcel SE 0�00 ± 0�00 A 56�30 ± 4�68 BCDE
25� Warrior II CS and Quilt Xcel SE 0�00 ± 0�00 A 56�57 ± 5�57 ABCDE
26� Cobalt Advanced EC and Headline EC 54�38 ± 54�38 A 55�05 ± 6�29 CDEF
27� Besiege ZC 11�88 ± 9�83 A 57�18 ± 4�92 ABCDE
28� Asana XL 0�00 ± 0�00 A 56�03 ± 6�27 BCDE
29� Asana XL and Lannate LV 0�00 ± 0�00 A 56�07 ± 2�23 BCDE
aCAD (cumulative aphid days) is the estimated seasonal exposure of soybean aphid ± the standard error of the mean; bLSD (least significant difference) of CAD at alpha = 0�10 (P<0�56; F = 0�94; df = 28, 3); cYield is reported in bushels per acre ± the standard error of the mean; dLSD of yield at alpha = 0�10 (P<0�001; F = 14�53; df = 28, 3)�

2012 Soybean Insecticide Evaluation Page 11
Table 3. List of treatments and rates at the Northwest Research Farm in 2012Treatmenta Active Ingredient(s) Rateb Timingc
1� Untreated Control ----- ----- -----
2. Rag1 ----- ----- -----
3� CruiserMaxx Beans thiamethoxam + mefenoxam + fludioxonil 56g/100kg seed ST
4� Rag1 and CruiserMaxx Beans
----- thiamethoxam + mefenoxam + fludioxonil
-----56g/100kg seed ST
5� Rag1 and CruiserMaxx Beans and Warrior II CS
---- thiamethoxam + mefenoxam + fludioxonil lambda-cyhalothrin
---- 56g/100kg seed 1�92 fl oz
----- ST
6. Rag1 and Warrior II CS
----- lambda-cyhalothrin
------ 1�92 fl oz 16 Aug
7� Warrior II CS lambda-cyhalothrin 1�92 fl oz 16 Aug
8� Endigo ZC lambda-cyhalothrin + thiamethoxam 3�5 fl oz 16 Aug
9� Cobalt Advanced EC lambda-cyhalothrin + chlorpyrifos 13�0 fl oz 16 Aug
10� Warrior II CS and Lorsban Advanced EC
lambda-cyhalothrin chlorpyrifos
1�6 fl oz 16�0 fl oz 16 Aug
11� Leverage 360 (A) imidacloprid + beta-cyfluthrin 2�8 fl oz 20 July
12� Leverage 360 (B) imidacloprid + beta-cyfluthrin 2�8 fl oz 16 Aug
13� Leverage 360 (C) imidacloprid + beta-cyfluthrin 3�8 fl oz 16 Aug
14� Leverage 360 and Stratego YLD
imidacloprid + beta-cyfluthrin prothioconazole + trifloxystrobin
2�8 fl oz 4�0 oz 20 July
aDoes not contain a fungicidal/insecticidal seed treatment unless noted; bPer acre unless noted; cST (seed treatment)�

2012 Soybean Insecticide Evaluation Page 12
Table 4. Soybean aphid density and yield at the Northwest Research Farm in 2012Treatment CAD ± SEMa CAD - LSDb Yield ± SEMc Yield - LSDd
1� Untreated Control 678�25 ± 273�57 BCD 53�77 ± 1�23 A
2. Rag1 17�13 ± 9�91 A 53�82 ± 1�67 A
3� CruiserMaxx Beans 311�63 ± 81�88 ABC 55�87 ± 1�06 A
4� Rag1 and CruiserMaxx Beans 367�88 ± 344�27 ABC 53�68 ± 2�43 A
5� Rag1 and CruiserMaxx Beans and Warrior II CS
14�88 ± 9�55 A 54�01 ± 2�19 A
6. Rag1 and Warrior II CS 224�25 ± 199�10 AB 55�10 ± 2�03 A
7� Warrior II CS 746�00 ± 423�53 CD 55�73 ± 1�28 A
8� Endigo ZC 227�63 ± 81�73 AB 55�42 ± 1�64 A
9� Cobalt Advanced EC 175�38 ± 72�05 A 54�50 ± 1�61 A
10� Warrior II CS and Lorsban Advanced EC 948�25 ± 378�41 D 56�58 ± 1�23 A
11� Leverage 360 (A) 93�88 ± 42�68 A 57�22 ± 1�54 A
12� Leverage 360 (B) 193�25 ± 95�40 A 56�71 ± 1�64 A
13� Leverage 360 (C) 212�25 ± 102�66 AB 54�84 ± 2�35 A
14� Leverage 360 and Stratego YLD 44�75 ± 25�64 A 57�76 ± 1�33 A
aCAD (cumulative aphid days) is the estimated seasonal exposure of soybean aphid ± the standard error of the mean; bLSD (least significant difference) of CAD at alpha = 0�10 (P<0�03; F = 2�07; df = 13, 3); cYield is reported in bushels per acre ± the standard error of the mean; dLSD of yield at alpha = 0�10 (P<0�99; F = 0�30; df = 13, 3)�

2012 Soybean Insecticide Evaluation Page 13
Figure 1. Mean separation of treatments for cumulative aphid days + standard error of the mean at the Northeast Research Farm in 2012. See Table 1 for a full list of treatments and rates. Means with a unique letter are significantly different at alpha = 0.10 (P<0.56; F = 0.94; df = 28, 3).

2012 Soybean Insecticide Evaluation Page 14
Figure 2. Mean separation of treatments for yield + standard error of the mean at the Northeast Research Farm in 2012. See Table 1 for a full list of treatments and rates. Means with a unique letter are significantly different at alpha = 0.10 (P<0.00103; F = 14.53; df = 28, 3).

2012 Soybean Insecticide Evaluation Page 15
Figure 3. Mean separation of treatments for cumulative aphid days + standard error of the mean at the Northwest Research Farm in 2012. See Table 3 for a full list of treatments and rates. Means with a unique letter are significantly different at alpha = 0.10 (P<0.03; F = 2.07; df = 13, 3).

2012 Soybean Insecticide Evaluation Page 16
Figure 4. Mean separation of treatments for yield + standard error of the mean at the Northwest Research Farm in 2012. See Table 3 for a full list of treatments and rates. There were no significant differences at alpha = 0.10 (P<0.99; F = 0.30; df = 13, 3).

2012 Soybean Insecticide Evaluation Page 17
Japanese Beetle
JAPANESE BEETLE, Popillia japonica Newman (Coleoptera: Scarabaeidae), is an introduced pest originating from Japan and has been present in Iowa since 1994� Beetles are slowly spreading from eastern Iowa and are confirmed in 56 out of 99 counties (Hodgson et al� 2011)� Japanese beetle adults will feed on approximately 300 plant species including corn, soybean, ornamentals, trees, and shrubs (USDA-APHIS 2004)� Their plant damage in Iowa has been erratic and generally confined to urban areas� However, significant adult feeding in soybean and corn was detected in 2011, and so we developed a small efficacy evaluation for the most common foliar insecticides�
Japanese Beetle Description. Adults are ½-inch long and oval in shape with a metallic green head and copper forewings (USDA-APHIS 2004)� There are six white tufts of hair along each side of the abdomen and the antennae are clubbed� The adults are distinctive, but can be confused with several look-alike beetles that can be found in soybean and urban areas (e�g�, false Japanese beetles, masked chafers, bumble flower beetle, etc�) (Hodgson and Alston 2006, Cranshaw 2007)� Larvae are white grubs with a brown head and three pairs of thoracic legs� Larvae are 1-inch long when fully developed, but are always found in a c-shape (Cranshaw 2007)�
Japanese Beetle Life Cycle. Japanese beetles have one generation per year� Males emerge a few days before females in late May or early June (Cook and Gray 2004)� Adults emerge from grass in late June and immediately begin to feed on low-lying plants such as roses and shrubs� Adults eventually move up on trees and field crop foliage to feed and mate� Mated females move back to grass in August and September to lay small egg masses in soil cavities� To be a suitable egg-laying site, an area must have moderate to high soil moisture, moderate soil texture, sunlight, and short grass cover (Potter and Held 2002)� Females prefer to lay eggs in grasses, however, they may also lay eggs within field crops with sufficient soil moisture� Cultivation may also be an
Japanese beetle is metallic bronze and green with white tufts along the side of the abdomen.
Photo by David Cappaert.

2012 Soybean Insecticide Evaluation Page 18
important factor in determining a site’s suitability for Japanese beetle females� Higher adult Japanese beetle densities are found in no-till or reduced-till soybean and larvae have been found to be 10-fold more abundant in weedy nursery fields compared with cultivated fields (Szendrei and Isaacs 2006)� The eggs hatch into small grubs that feed on roots underground until late September when the temperature cools� The almost fully-grown grubs burrow down in the soil and remain inactive all winter� In the early spring, grubs become active again and feed until turning into resting pupae� The pupae hatch into adults and emerge from the soil�
Japanese Beetle Damage. Japanese beetles release a strong aggregation pheromone, and are commonly seen feeding and mating in clusters� Adults are also highly mobile and move frequently in the summer (Cook and Gray 2004, Hodgson and Alston 2006)� Adults are skeletonizers in soybean and can cause severe defoliation� Adults prefer to feed on the upper leaf surface� Heavily defoliated leaves look scorched or bronze in color�
Methods and MaterialsWe established plots at the Iowa State University Johnson Research Farm in Story County, Iowa� The treatments were arranged in a randomized complete block design with four replications, and soybean was planted in 30-inch rows on 15 May� An untreated Syngenta Roundup Ready soybean variety 05RM310021 was used for all treatments� Each plot was six rows wide and 50 feet long with 3-foot alleys separating rows of treatments� The plots were located in a 1-acre field with soybean to the north and corn surrounding all other sides� In total for 2012, we evaluated 4 treatments with products alone or in combination (Table 5)� The experiment included an untreated control to allow for comparisons of yield protection against Japanese beetle�
Insecticide Application Techniques. Seed did not have a fungicidal/insecticidal seed treatment� All applications were made using a 4-row backpack sprayer and TeeJet (Springfield, IL) twinjet nozzles (TJ 11002) with 20 gallons of water per acre at 40 pounds of pressure per square inch� All foliar insecticide treatments were made on 23 July when plants were at R3 growth stage�
Typical Japanese beetle defoliation in soybean.

2012 Soybean Insecticide Evaluation Page 19
Japanese Beetle Populations. Adults tend to aggregate and are highly mobile, and therefore economic thresholds are not typically based on beetle abundance (e�g�, through sweep netting or density of beetles per plant)� We estimated percent defoliation for each plot by visual approximation� In addition, we estimated the number of beetles by taking 10 sweeps per plot�
Yield. Each plot was harvested using a small plot combine� Yields were determined by weighing grain with a grain hopper which rested on a digital scale sensor custom designed for the harvester� Plots were harvested on 24 September and yields were corrected to 13% moisture and reported as bushels per acre�
Statistical Analysis. One way analysis of variance (ANOVA) was used to determine treatment effects within each experiment� Means separation for all studies was achieved using a least significant difference (LSD) test (αlpha = 0.10). All statistical analyses were performed using SAS® software (SAS 2012)�
Results and ConclusionsJapanese beetle adults were first observed about three weeks earlier at the Johnson Research Farm than in 2011 (Hodgson and VanNostrand 2011)� Weekly sweep netting of adult beetles started on 2 July and continued until 21 August� Visual approximation of defoliation started on 16 July with percent defoliation ranging from 5-15%, and beetle abundance ranging from 8-11 beetles per sweep (Figure 5)� Adults were abundant and some of the plants had extensive defoliation in June� Although the treatment threshold of 20% after bloom was not reached, foliar insecticides were applied on 23 July� Foliar insecticides reduced Japanese beetle densities to less than two per sweep while the untreated control was 6 per sweep� However, within seven days, there were no differences between foliar treatments and the untreated control� The foliar applications killed the beetles in plots, but did not provide sufficient residual to control populations beyond seven days� Migratory beetles continued to move into plots and feed past pod fill, but percent defoliation never exceeded 20%�
The plots near the field edge had more obvious damage compared to interior plots� But yield comparisons indicated no significant differences between treatments (P<0�03; F = 3�92; df = 3, 3) (Figure 6)� These results are not unexpected given the defoliation was very patchy in plots� Current data combined with our 2011 evaluation support the currently established economic threshold for Japanese beetle� Applying a foliar insecticide was not a cost-effective decision in either year�
2012 Soybean Insecticide Evaluation Page 20
Treatment Recommendations. Japanese beetle is a highly mobile pest, and frequently moves within and between fields� In 2012, we observed adults feeding in plots for over 60 days� Scouts tend to greatly over-estimate the percent defoliation caused by Japanese beetle, and foliar insecticides can be applied before economic thresholds are reached� Therefore, our recommendation for Japanese beetle management is:
• We strongly recommend scout entire fields to assess overall defoliation, as field edges will result in an over-estimate of damage�
• The treatment threshold for Japanese beetles in soybean is 30% defoliation during the vegetative growth stages and 20% defoliation between R1–R6 (i�e�, bloom through seed set) (Cook and Gray 2004), and therefore the most important time to scout in soybean�
• If only the field edges exceed treatment thresholds, consider making border application, if practical, to reduce application costs�

2012 Soybean Insecticide Evaluation Page 21
Table 5. List of treatments and rates at the Johnson Research Farm in 2012Treatmenta Active Ingredient(s) Rateb Timingc
Untreated Control ----- ----- -----
Warrior II CS and Lorsban Advanced EC
lambda-cyhalothrin chlorpyrifos
1�6 fl oz 16�0 fl oz 23 July
Warrior II CS lambda-cyhalothrin 1�92 fl oz 23 July
Lorsban Advanced EC chlorpyrifos 1 pt 23 July
aDoes not contain a fungicidal/insecticidal seed treatment unless noted; bPer acre unless noted; cST = seed treatment�
Table 6. List of yield at the Johnson Research Farm in 2012Treatment Yield ± SEMa Yield - LSDb
Untreated Control 56�63 ± 2�59 A
Warrior II CS and Lorsban Advanced EC 54�83 ± 1�46 A
Warrior II CS 56�43 ± 1�70 A
Lorsban Advanced EC 54�80 ± 1�95 A
aYield is reported in bushels per acre ± the standard error of the mean; bLSD (least significant difference) of yield at alpha = 0�10 (P<0�03; F = 3�92; df = 3, 3)�

2012 Soybean Insecticide Evaluation Page 22
Figure 5. Japanese beetle populations ± standard error of the mean at the Johnson Research Farm in 2012. See Table 5 for a full list of treatments and rates. Arrow indicates timing of foliar applications.
Figure 6. Mean separation of treatments for yield + standard error of the mean at the Johnson Research Farm in 2012. See Table 5 for a full list of treatments and rates. There were no significant differences at alpha = 0.10 (P<0.03; F = 3.92; df = 3, 3).

2012 Soybean Insecticide Evaluation Page 23
Twospotted Spider Mite
TWOSPOTTED SPIDER MITE, Tetranychus urticae (Arachnida: Acari: Tetranychidae), is an occasional pest of corn and soybean in Iowa� However, spider mite damage is more pronounced in crops during moisture-stressed growing conditions (Haile and Higley 2003)� In 2012, many fields had significant spider mite feeding and subsequent yield loss (Hodgson 2012)�
Description and Biology. Adult twospotted spider mites are oval, hairy, and minute (1/50th of an inch long or about half as big as a first instar soybean aphid)� Body color can range from tan, brown, yellow, orange or red depending on the species and quality of the host plant� Adults will have eight legs and two dark spots on top of the body�
Spider mites are considered common pests in temperate zones and can be found throughout the United States� Females move out of row crops in the fall and deposit overwintering eggs� In the spring, eggs hatch and nymphs begin feeding on weeds, grasses and other permanent vegetation� As these areas are mowed or decline in quality, mites will move back to crops by ballooning on silken webs� In most years around Iowa, we find twospotted spider mites in corn and soybean in August� But this year, we could find them in field crops in June due to the drought� Having spider mites present during vegetative growth can be very stressful to plants and an early indicator of outbreak conditions during the important grain fill stages� The last time spider mites were a widespread, economic issue was the summer of 1988�
Twospotted spider mites normally produce 10–20 generations every year in Iowa� This pest can have exponential growth when temperatures are consistently above 85 degrees, humidity is less than 90 percent, and plants are lacking sufficient moisture� Under ideal conditions, spider mites can mature from egg to adult in 5 days; cooler temperatures can extend development to 19 days�
Twospotted spider mites are often surrounded by fine silken webbing. Photo by David Cappaert.

2012 Soybean Insecticide Evaluation Page 24
Damage and Distribution. Spider mites injure plants by crushing cells and removing sap� Heavily infested plants will experience lower chlorophyll content and decreased photosynthesis� Injured plants will have decreased transpiration rates (i�e�, cooling potential) compared to healthy plants (Haile and Higley 2003)� Yield losses exceeding 40 percent are possible in drought-stressed growing conditions (Bynum et al� 1990)� Spider mite damage is not reversible on injured leaves� But rain events and mite suppression can help new growth on plants�
Spider mites prefer to feed on the undersides of leaves, and typically start building colonies in the lower plant canopy and along field edges� Initial feeding injury can be described as white spots, stippling or discoloration of the leaves� As mite populations increase, they will move to the upper canopy to feed� Large infestations are usually accompanied with fine silken webbing� Prolonged spider mite feeding can cause premature leafdrop and death�
How to scout for spider mites. Mites are very small pests and some people have trouble seeing them with the naked eye� A hand lens will help with the first detections on leaves� Consider shaking leaves on a piece of white paper and watching for mites to start moving around (they resemble specks of dust)� Scout for spider mites on a regular basis throughout the growing season, especially during drought-stressed growing seasons� To see if a field should be scouted, first look at plants along the field edges� If you find mites, take time to sample the entire field by walking a “W” or “Z” pattern� Stop at 20 locations and check 2–3 plants at each location� Note the presence of mites, location on plants, webbing and any discoloration from feeding�
Twospotted spider mite injury often appears as light-colored stippling on leaves. Photo by
Whitney Cranshaw.
Premature leafdrop in soybean in an indication of prolonged twospotted spider mite feeding.
Photo by Marlin E. Rice.

2012 Soybean Insecticide Evaluation Page 25
Treatment thresholds. There are not specific spider mite density thresholds (i�e�, # mites/leaf)� Instead foliar applications should be based on your estimation of plant quality� For corn, the goal is to prevent spider mites from reaching the ear leaf� Consider treating when most plants are infested in the lower canopy and discoloration is starting� Treatments should be made before R1–R4 (i�e�, silking through dough)� The most important soybean growth stages to protect are R4–R5 (i�e�, full pod through beginning seed set)� In soybean, consider using a 0-5 rating scale to make treatment decisions:
0 – no spider mites or feeding damage observed;
1 – spider mites detected on a few plants, and minor stippling on lower leaves;
2 – spider mites detected on most plants, stippling common on lower leaves, and small patches of yellowing plants can be found;
3 – spider mites can be found in the middle canopy, yellow plants common and some premature leaf loss (THRESHOLD); 4 – spider mites and stippling can be found in the upper canopy, and prematue leafdrop is common (ECONOMIC LOSS); and
5 – spider mites are easy to find in the upper canopy, plants are browning, and some plants are dead�
Pesticide considerations. Product selection is extremely important for spider mite management (Ostlie and Potter 2012a, 2012b)� Some products will not kill eggs, and populations can rebound and continue to injure plants� Most products labeled for corn and soybean in Iowa rely on direct contact to successfully reduce spider mites� Therefore, use sufficient volume to reach mites in the lower canopy and on the undersides of leaves (e�g�, 20 gpa by ground or 5 gpa by aerial application)� Continue scouting after an application to determine if additional sprays are required� Consider rotating chemistries if additional sprays are needed�
Organophosphates. Several active ingredients are available for spider mites in corn and soybean� Dimethoate should perform well against spider mites, but has a short residual� Others, like propargite, spiromesifen and etoxazole, are efficacious against all mite life stages on corn, but are most effective when used as a preventative because they are slow acting products� For soybean, another effective option is chlorpyrifos�

2012 Soybean Insecticide Evaluation Page 26
Pyrethroids. In general, pyrethroids are not effective in reducing spider mite populations� Pyrethroids have poor efficacy on spider mites, and some populations have developed resistance to this chemistry� Pyrethroids will kill natural enemies and can allow mites to flare to higher densities than before the spray� In some regions of the United States, pyrethroid applications actually trigger females to increase their reproductive rate� One exception, bifenthrin, is shown to be effective against spider mites in soybean� Also pyrethroids can volatilize under high temperatures (i�e�, above 90 degrees) and typically do not perform as well as organophosphates�
Fungicides. Naturally-occurring beneficial fungi can reduce spider mite populations, but environmental conditions must be ideal for sporulation� The application of fungicides can eliminate beneficial fungi that kill spider mites and allow for exponential growth of the existing population�
Methods and MaterialsAlthough our intention was to evaluate soybean aphid at the Northeast and Northwest Research Farms, we noticed twospotted spider mite in plots and decided to evaluate insecticide performance on this sporadic pest� Twenty nine treatments were evaluated at the Northeast Research Farm and fourteen treatments were evaluated at the Northwest Research Farm in 2012� See page 4 for the plot descriptions and pages 6-7 for yield and statistical analysis summary, and Tables 1 and 3 for a list of treatments and rates�
Soybean plots were sampled for spider mites weekly in 2012 from 2 August through 30 August and from 31 July through 26 August at the Northeast and Northwest Research Farms, respectively (i�e�, plant stages R4–R7)� Spider mites were evaluated in two ways� The first way was based on the 0-5 injury rating scale outlined on page 25� The second method was to randomly select 10 leafs from the lower half of the soybean canopy in each plot and note the presence or absence of live spider mites�
Results and ConclusionsPlots were generally not infested with twospotted spider mites until late July, when plants were in R4 (i�e�, full pod set)� Mites were generally found in the lower canopy, with populations peaking on 21 August at the Northeast Research Farm and on 13 August at the Northwest Research Farm (Tables 7 and 9)� Throughout August, visual ratings ranged from 0–2, and plots never exceeded 40 percent infestation of leaves (Tables 8 and 10)� So although there were live mites in every plot, they did not build up to significant densities to start causing leaf discoloration� At this density and injury score, we would not expect yield differences between treatments due to spider mite injury�

2012 Soybean Insecticide Evaluation Page 27
The average number of infested leaves and average injury score were higher at the Northeast Research Farm� Our ANOVA indicated time was significant of spider mite density (P < 0�0001; F = 32�92; df = 28, 3) and the interaction of time*treatment was also significant (P = 0�04; F = 1�44; df = 28, 3) (Table 8)� This allowed us to analyze mite densities by the five sampling dates (2, 7, 16, 21, 30 August)� Two dates had significant treatment differences, including 16 August (P = 0�0451; F = 1�61; df = 28, 3) and 21 August (P = 0�0338; F = 1�67; df = 28, 3); these two dates were six and eleven dates after foliar application of most treatments�
Treatment Recommendations. Although twospotted spider mites are not a persistent corn and soybean pest in Iowa, they are capable of devastating yield loss during drought-stressed growing conditions� Therefore, our recommendation for spider mites is to:
• Scout corn and soybean for twospotted spider mites regularly throughout the summer, especially during moisture-stressed growing seasons�
• Monitor for developing and dispersing mite populations and plant injury�
• Treat spider mites before widespread plant discoloration and leafdrop occur; continue to monitor fields for resurgent populations�
• If practical, use sufficient volume and pressure with organophosphates to achieve the greatest efficacy�

2012 Soybean Insecticide Evaluation Page 28

2012 Soybean Insecticide Evaluation Page 29
Table 7. Average number of leaves (10 per plot) infested with twospotted spider mite at the Northeast Research Farm in 2012Treatment 2 Augusta 7 Augusta 16 Augusta 21 Augusta 30 Augusta
1� Untreated Control 1�00 ± 0�71 0�25 ± 0�25 1�50 ± 0�65 3�75 ± 0�75 0�75 ± 0�48
2. Rag1 2�50 ± 1�44 1�50 ± 1�19 1�75 ± 0�48 0�50 ± 0�29 0�25 ± 0�25
3� CruiserMaxx Beans 2�50 ± 1�50 1�50 ± 0�65 2�75 ± 1�25 0�75 ± 0�25 0�25 ± 0�25
4� Rag1 and CruiserMaxx Beans 3�00 ± 1�91 2�25 ± 1�11 1�25 ± 0�25 1�00 ± 0�58 0�25 ± 0�25
5� Rag1 and CruiserMaxx Beans and Warrior II CS
1�25 ± 1�25 1�25 ± 0�48 2�25 ± 0�75 0�25 ± 0�25 0�00 ± 0�00
6� Rag1 and Warrior II CS 3�25 ± 1�89 1�75 ± 0�75 2�00 ± 1�08 0�75 ± 0�48 0�25 ± 0�25
7� Warrior II CS 2�00 ± 0�58 1�75 ± 0�48 0�75 ± 0�75 2�75 ± 0�75 0�25 ± 0�25
8� Lorsban Advanced EC 2�00 ± 0�41 0�50 ± 0�29 0�75 ± 0�48 2�00 ± 0�91 1�25 ± 0�63
9� Dimethoate 4E 2�00 ± 1�08 2�25 ± 0�48 1�25 ± 0�95 0�50 ± 0�29 0�25 ± 0�25
10� Cobalt Advanced EC 2�00 ± 0�82 0�25 ± 0�25 0�25 ± 0�25 1�5 ± 1�19 0�25 ± 0�25
11� Warrior II CS and Lorsban Advanced EC 3�00 ± 1�78 0�50 ± 0�29 1�75 ± 0�48 2�25 ± 0�75 0�25 ± 0�25
12� Brigade 2EC 1�25 ± 0�48 0�25 ± 0�25 0�50 ± 0�29 2�50 ± 1�26 1�25 ± 1�25
13� Belay SC (A) 2�00 ± 0�71 1�25 ± 0�95 1�50 ± 0�29 1�50 ± 0�29 0�50 ± 0�50
14� Belay SC (B) 1�25 ± 0�75 1�50 ± 0�29 0�75 ± 0�25 1�25 ± 0�48 0�75 ± 0�48
15� Belay SC and Brigade EC 3�00 ± 1�47 0�50 ± 0�50 2�25 ± 0�95 0�75 ± 0�25 0�25 ± 0�25
16� Declare CS (A) 2�75 ± 0�48 1�25 ± 0�48 0�50 ± 0�29 1�50 ± 0�29 0�25 ± 0�25
17� Declare CS (B) 1�25 ± 0�63 2�00 ± 0�41 1�25 ± 0�75 1�25 ± 0�25 0�25 ± 0�25
18� Declare CS and Dimethoate 4E 2�25 ± 0�85 2�00 ± 0�41 0�5 ± 0�29 1�00 ± 0�41 1�00 ± 0�71
19� Leverage 360 (A) 2�50 ± 0�65 1�25 ± 0�48 0�00 ± 0�00 1�00 ± 0�00 0�00 ± 0�00
20� Leverage 360 (B) 2�75 ± 1�11 1�50 ± 0�29 0�75 ± 0�48 0�75 ± 0�48 0�00 ± 0�00
21� Leverage 360 and Stratego YLD 1�25 ± 0�63 2�25 ± 0�25 0�75 ± 0�75 0�50 ± 0�29 0�25 ± 0�25
22� Fastac EC 1�00 ± 0�41 2�25 ± 0�75 0�25 ± 0�25 0�50 ± 0�50 1�00 ± 0�58
23� Endigo ZC 0�25 ± 0�25 1�00 ± 0�41 0�00 ± 0�00 0�75 ± 0�48 0�25 ± 0�25
24� Quilt Xcel SE 1�50 ± 0�65 1�25 ± 0�75 0�75 ± 0�25 1�25 ± 0�48 0�00 ± 0�00
25� Warrior II CS and Quilt Xcel SE 1�00 ± 0�00 2�50 ± 0�96 1�00 ± 0�41 1�50 ± 0�65 0�00 ± 0�00
26� Cobalt Advanced EC and Headline EC 1�50 ± 0�29 0�75 ± 0�48 0�25 ± 0�25 0�50 ± 0�29 0�00 ± 0�00
27� Besiege ZC 0�25 ± 0�25 0�75 ± 0�48 0�50 ± 0�50 1�25 ± 0�95 0�00 ± 0�00
28� Asana XL 1�25 ± 0�75 0�50 ± 0�29 0�50 ± 0�29 1�50 ± 0�50 0�25 ± 0�25
29� Asana XL and Lannate LV 1�25 ± 0�48 0�75 ± 0�25 1�75 ± 1�03 1�25 ± 0�25 0�50 ± 0�29
aAverage number of infested leaves based on the presence or absence of live twospotted spider mites on ten leaves per plot ± the standard error of the mean�

2012 Soybean Insecticide Evaluation Page 30
Table 8. Twospotted spider mite injury ratings at the Northeast Research Farm in 2012
Treatment2 August 7 August 16 August 21 August 30 August
Ratinga LSDb Ratinga LSDb Ratinga LSDb Ratinga LSDb Ratinga LSDb
1� Untreated Control 1�00 AB 0�25 E 1�50 A-E 3�75 A 0�75 A-C
2. Rag1 2�50 AB 1�50 A-E 1�75 A-D 0�50 F 0�25 BC
3� CruiserMaxx Beans 2�50 AB 1�50 A-E 2�75 A 0�75 EF 0�25 BC
4� Rag1 and CruiserMaxx Beans 3�00 A 2�25 A-E 1�25 B-F 1�00 D-F 0�25 BC
5� Rag1 and CruiserMaxx Beans and Warrior II CS
1�25 AB 1�25 E 2�25 AB 0�25 F 0�00 C
6� Rag1 and Warrior II CS 3�25 A 1�75 A-D 2�00 A-C 0�75 EF 0�25 BC
7� Warrior II CS 3�00 A 0�50 DE 1�75 A-D 2�25 B-D 0�25 BC
8� Lorsban Advanced EC 2�00 AB 1�25 A-E 1�50 A-E 1�50 B-F 0�50 A-C
9� Dimethoate 4E 3�00 A 0�50 DE 2�25 AB 0�75 EF 0�25 BC
10� Cobalt Advanced EC 1�25 AB 1�50 A-E 0�75 C-F 1�25 C-F 0�75 A-C
11� Warrior II CS and Lorsban Advanced EC 1�25 AB 0�50 DE 0�50 DF 1�50 B-F 0�25 BC
12� Brigade 2EC 1�25 AB 0�75 C-E 1�75 A-D 1�25 C-F 0�50 A-C
13� Belay SC (A) 2�75 A 1�25 A-E 0�50 DF 1�50 B-F 0�25 BC
14� Belay SC (B) 1�25 AB 2�00 A-C 1�25 B-F 1�25 C-F 0�25 BC
15� Belay SC and Brigade EC 2�25 AB 2�00 A-C 0�50 DF 1�00 DF 1�00 AB
16� Declare CS (A) 2�00 AB 2�25 AB 1�25 B-F 0�50 F 0�25 BC
17� Declare CS (B) 2�50 AB 1�25 A-E 0�00 F 1�00 DF 0�00 C
18� Declare CS and Dimethoate 4E 2�75 A 1�50 A-E 0�75 C-F 0�75 E-F 0�00 C
19� Leverage 360 (A) 1�25 AB 2�25 AB 0�75 C-F 0�50 F 0�25 BC
20� Leverage 360 (B) 1�00 AB 2�25 AB 0�25 EF 0�50 F 1�00 AB
21� Leverage 360 and Stratego YLD 0�25 B 1�00 BE 0�00 F 0�75 EF 0�25 BC
22� Fastac EC 1�00 AB 2�50 A 1�00 B-F 1�50 B-F 0�00 C
23� Endigo ZC 1�50 AB 1�25 A-E 0�75 C-F 1�25 C-F 0�00 C
24� Quilt Xcel SE 2�00 AB 0�25 E 0�25 EF 1�50 B-F 0�25 BC
25� Warrior II CS and Quilt Xcel SE 1�50 AB 0�75 C-E 0�25 EF 0�50 F 0�00 C
26� Cobalt Advanced EC and Headline EC 2�00 AB 1�75 A-D 0�75 C-F 2�75 AB 0�25 BC
27� Besiege ZC 0�25 B 0�75 C-E 0�50 DF 1�25 C-F 0�00 C
28� Asana XL 1�25 AB 0�25 E 0�50 DF 2�50 A-C 1�25 A
29� Asana XL and Lannate LV 2�00 AB 0�50 DE 0�75 C-F 2�00 B-E 1�25 A
aAverage injury score based on 10 plants per plot on the 0-5 scale; bLSD (least significant difference) of average rating score at alpha = 0�10 (2 August: P<0�90; F = 0�66; df = 28, 3) (7 August: P<0�12; F = 1�38; df = 28, 3) (16 August: P<0�045; F = 1�61; df = 28, 3) (21 August: P<0�03; F = 1�67; df = 28, 3) (30 August: P<0�56; F = 0�94; df = 28, 3)�

2012 Soybean Insecticide Evaluation Page 31
Table 9. Average number of leaves (10 per plot) infested with twospotted spider mite at the Northwest Research Farm in 2012 Treatment 31 Julya 6 Augusta 13 Augusta 26 Augusta
1� Untreated Control 1�00 ± 0�00 1�00 ± 0�00 1�00 ± 0�00 1�00 ± 0�00
2. Rag1 1�00 ± 0�41 1�00 ± 0�00 1�00 ± 0�00 1�00 ± 0�00
3� CruiserMaxx Beans 1�25 ± 0�25 1�00 ± 0�00 1�25 ± 0�25 1�00 ± 0�00
4� Rag1 and CruiserMaxx Beans 1�25 ± 0�48 1�00 ± 0�00 1�00 ± 0�00 1�00 ± 0�00
5� Rag1 and CruiserMaxx Beans and Warrior II CS
0�75 ± 0�25 1�00 ± 0�00 1�25 ± 0�25 1�00 ± 0�00
6. Rag1 and Warrior II CS 0�75 ± 0�25 1�00 ± 0�00 1�00 ± 0�00 1�00 ± 0�00
7� Warrior II CS 1�25 ± 0�48 1�00 ± 0�00 1�25 ± 0�25 1�00 ± 0�00
8� Endigo ZC 1�25 ± 0�25 1�00 ± 0�00 1�00 ± 0�00 1�00 ± 0�00
9� Cobalt Advanced EC 1�25 ± 0�25 1�00 ± 0�00 1�00 ± 0�00 1�00 ± 0�00
10� Warrior II CS and Lorsban Advanced EC 1�25 ± 0�25 1�00 ± 0�00 1�00 ± 0�00 1�00 ± 0�00
11� Leverage 360 (A) 1�00 ± 0�00 1�00 ± 0�00 1�00 ± 0�00 1�00 ± 0�00
12� Leverage 360 (B) 1�50 ± 0�29 1�00 ± 0�00 1�00 ± 0�00 1�00 ± 0�00
13� Leverage 360 (C) 1�50 ± 0�29 1�00 ± 0�00 1�00 ± 0�00 1�00 ± 0�00
14� Leverage 360 and Stratego YLD 1�00 ± 0�00 1�00 ± 0�00 1�00 ± 0�00 1�00 ± 0�00
aAverage number of infested leaves based on the presence or absence of live twospotted spider mites on ten leaves per plot ± the standard error of the mean�

2012 Soybean Insecticide Evaluation Page 32
Table 10. Twospotted spider mite injury ratings at the Northwest Research Farm in 2012
Treatment31 July 6 August 13 August 26 August
Ratinga LSDb Ratinga LSDb Ratinga LSDb Ratinga LSDb
1� Untreated Control 0�25 A 1�50 AB 3�00 AB 0�75 BC
2. Rag1 0�50 A 2�00 AB 3�00 AB 1�25 A-C
3� CruiserMaxx Beans 0�25 A 2�50 A 4�50 AB 1�00 BC
4� Rag1 and CruiserMaxx Beans 0�50 A 1�75 AB 3�00 AB 0�50 C
5� Rag1 and CruiserMaxx Beans and Warrior II CS
0�50 A 1�25 AB 1�75 B 1�25 A-C
6. Rag1 and Warrior II CS 0�50 A 0�50 B 2�25 AB 1�50 A-C
7� Warrior II CS 0�50 A 1�50 AB 4�75 A 1�00 BC
8� Endigo ZC 0�50 A 1�25 AB 1�75 B 0�75 BC
9� Cobalt Advanced EC 0�50 A 2�50 A 3�50 AB 1�00 BC
10� Warrior II CS and Lorsban Advanced EC 0�50 A 1�50 AB 2�50 AB 0�75 BC
11� Leverage 360 (A) 0�00 A 0�25 AB 2�00 AB 1�50 A-C
12� Leverage 360 (B) 0�25 A 1�25 AB 3�00 AB 2�75 A
13� Leverage 360 (C) 0�25 A 2�00 B 3�00 AB 2�25 AB
14� Leverage 360 and Stratego YLD 1�00 A 2�00 AB 3�25 AB 0�25 C
aAverage injury score based on 10 plants per plot on the 0-5 scale; bLSD (least significant difference) of average rating score at alpha = 0�10 (31 July: P<0�92; F = 0�51; df = 13, 3) (6 August: P<0�65; F = 0�83; df = 13, 3) (13 August: P<0�70; F = 0�78; df = 13, 3) (26 August: P<0�11; F = 1�60; df = 13, 3)�

2012 Soybean Insecticide Evaluation Page 33
References
Bynum, E� D�, T� L� Archer, and F� W� Plapp� 1990� Action of insecticides to spider mites (Acari: Tetranychidae) on corn in the Texas High Plains: Toxicity, resistance, and synergistic combinations� Journal of Economic Entomology 83: 1236-1242�
Cook, C� A�, and M� E� Gray� 2004� Japanese beetle� University of Illinois Extension, Integrated Pest Management Publication, http://ipm�illinois�edu/fieldcrops/insects/ japanese_beetles/�
Cranshaw, W� 2007� Japanese beetle� Colorado State University Extension fact sheet 5�601�
Haile, F� J�, and L� G� Higley� 2003� Changes in soybean gas-exchange after moisture stress and spider mite injury� Environmental Entomology 32: 433-440�
Hodgson, E� W�, E� C� Burkness, W� D� Hutchison, and D� W� Ragsdale� 2004� Enumerative and binomial sequential sampling plans for soybean aphid (Homoptera: Aphididae) in soybean� Journal of Economic Entomology 97: 2127-2136�
Hodgson, E� W�, R� C� Venette, M� Abrahamson, and D� W� Ragsdale� 2005� Alate production of soybean aphid (Homoptera: Aphididae) in Minnesota� Environmental Entomology 34: 1456-1463�
Hodgson, E� W�, and D� Alston� 2006� Utah Pests fact sheet: Japanese beetle, 3 pp� ENT-100-06PR�
Hodgson, E� W�, B� P� McCornack, K� A� Koch, D� W� Ragsdale, K� D� Johnson, M� E� O’Neal, E� M� Cullen, H� J� Kraiss, C� D� DiFonzo, M� Jewett, and L� M� Behnken� 2007� Field validation of Speed Scouting for soybean aphid� Crop Management� DOI: 10�1094/CM-2007-0511-01-RS�
Hodgson, E� W�, and M� O’Neal� 2011� Soybean aphid management field guide, 2nd ed� Corn and Soybean Initiative, Iowa State University Extension Publication CSI 0011�
Hodgson, E� W�, and G� VanNostrand� 2011� 2011 Yellow Book Report of insecticide evaluation for soybean insects, 31 pp� Department of Entomology, Iowa State University, Publication 288-11�

2012 Soybean Insecticide Evaluation Page 34
Hodgson, E� W�, M� E� O’Neal, G� VanNostrand, and C� Kuntz� 2011� Japanese beetle biology and management in corn and soybean, pp� 63-66� In Proceedings: Iowa State University Integrated Crop Management Conference, Ames, IA, 30 November - 1 December 2011�
Hodgson, E� 2012� Scout for twospotted spider mite this summer� In Integrated Crop Management News� 9 July 2012�
Hodgson, E�, and L� Jesse� 2012� “What does this warm winter mean for insects?” In Integrated Crop Management News� 17 February 2012�
Hodgson, E� W�, M� Kemis, and B� Geisinger� 2012a� Assessment of Iowa soybean growers for insect pest management practices� Journal of Extension RIB6�
Hodgson, E� W�, B� McCornack, K� Tilmon, and J� Knodel� 2012b� Management of the soybean aphid, Aphis glycines (Hemiptera: Aphididae) in the United States� Journal of Integrated Pest Management� DOI: 10�1603/IPM11019�
McCarville, M�, E� Hodgson, and M� O’Neal� 2012� Soybean aphid-resistant soybean varieties for Iowa, 4 pp� Iowa State University Extension Publication PM 3023�
McCornack, B� P�, D� W� Ragsdale, and R� C� Venette� 2004� Demography of soybean aphid (Homoptera: Aphididae) at summer temperatures� Journal of Economic Entomology 97: 854-861�
Ostlie, K�, and B� Potter� 2012a� Managing two-spotted spider mites on corn� University of Minnesota Extension, www�soybeans�umn�edu/crop/insects/spider_mites�htm�
Ostlie, K�, and B� Potter� 2012b� Managing two-spotted spider mites on soybeans� University of Minnesota Extension, www�soybeans�umn�edu/crop/insects/spider_ mites�htm�
Potter, D� A�, and D� W� Held� 2002� Biology and management of the Japanese beetle� Annual Review of Entomology 47: 175-205�
Ragsdale, D� W�, D� J� Voegtlin, and R� J� O’Neil� 2004� Soybean aphid biology in North America� Annals of the Entomological Society of America 97: 204-208�

2012 Soybean Insecticide Evaluation Page 35
Ragsdale, D� W�, B� P� McCornack, R� C� Venette, E� W� Hodgson, B� E� Potter, I� V� MacRae, M� E� O’Neal, K� D� Johnson, R� J� O’Neil, C� D� DiFonzo, T� E� Hunt, P� A� Glogoza, and E� M� Cullen� 2007� Economic threshold for soybean aphid (Homoptera: Aphididae)� Journal Economic Entomology 100: 1258-1267�
Ragsdale, D� W�, D� A Landis, J� Brodeur, G� E� Heimpel, and N� Desneux� 2011� Ecology and management of the soybean in North America� Annual Review of Entomology� DOI: 10�1146/annurev-ento-120709-144755�
SAS Institute� 2012� SAS/STAT user’s guide, version 9�3� SAS Institute, Cary, NC�
Szendrei, Z�, and R� Isaacs� 2006� Ground covers influence the abundance and behavior of Japanese beetles� Environmental Entomology 35: 789-796�
Tilmon, K� J�, E� W� Hodgson, M� E� O’Neal, and D� W� Ragsdale� 2011� Biology of the soybean aphid, Aphis glycines (Hemiptera: Aphididae), in the United States� Journal of Integrated Pest Management� DOI: 10�1603/IPM10016�
[USDA-APHIS] United States Department of Agriculture – Animal and Plant Health Inspection Service� 2004� Managing the Japanese beetle: A homeowner’s handbook� Program Aid No� 1599� www�aphis�usda�gov/lpa/pubs/pub_ phjbeetle04�pdf�
[USDA-NASS] United States Department of Agriculture - National Agricultural Statistics Service� www�nass�usda�gov/�
Voegtlin, D� J�, S� E� Halbert, and G� Qiao� 2004� A guide to separating Aphis glycines Matsumura and morphologically similar species that share its hosts� Annals of the Entomological Society of America 97: 227-232�

2012 Soybean Insecticide Evaluation Page 36

2012 Soybean Insecticide Evaluation Page 37

2012 Soybean Insecticide Evaluation Page 38

2012 Soybean Insecticide Evaluation Page 39