2012 Plastic Surgery Statistics Report · Plastic Surgery Procedural Statistics ... 2012 Plastic...
23
ASPS National Clearinghouse of Plastic Surgery Procedural Statistics American Society of Plastic Surgeons 2012 Plastic Surgery Statistics Report ASPS Public Relations Phone: 847-228-9900 Fax: 847-981-5482 Email: [email protected] Website: www.plasticsurgery.org
Transcript of 2012 Plastic Surgery Statistics Report · Plastic Surgery Procedural Statistics ... 2012 Plastic...
ASPS National Clearinghouse of Plastic Surgery Procedural Statistics
American Society of Plastic Surgeons 2012 Plastic Surgery Statistics Report
ASPS Public RelationsPhone: 847-228-9900Fax: 847-981-5482Email: [email protected] Website: www.plasticsurgery.org
Please credit the American Society of Plastic Surgeons when citing statistical data or using graphics.
2012 Plastic Surgery Statistics Report
2
ASPS Public RelationsPhone: 847-228-9900Fax: 847-981-5482Email: [email protected] Website: www.plasticsurgery.org
2012 Plastic Surgery StatisticsTable of Contents
Introduction
About the American Society of Plastic Surgeons ................................................................................. 3
Methodology and Validity .................................................................................................................. 4
2012 Quick Facts - Plastic Surgery Trends ........................................................................................ 5
2012 Quick Facts - Demographic Trends ........................................................................................... 6
Statistical Reports
Cosmetic Procedure Trends .............................................................................................................. 7
Cosmetic Procedure Charts .............................................................................................................. 8
Reconstructive Procedure Trends and Charts ..................................................................................... 9
Cosmetic Surgery Gender Distribution – Female .............................................................................. 10
Top Five Cosmetic Surgery Gender Distribution Charts – Female ....................................................... 11
Cosmetic Surgery Gender Distribution – Male .................................................................................. 12
Top Five Cosmetic Surgery Gender Distribution Charts – Male .......................................................... 13
Cosmetic Surgery Age Distribution (13-19) ...................................................................................... 14
Cosmetic Surgery Age Distribution (20-29) ...................................................................................... 15
Cosmetic Surgery Age Distribution (30-39) ...................................................................................... 16
Cosmetic Surgery Age Distribution (40-54) ...................................................................................... 17
Cosmetic Surgery Age Distribution (55 and Over) ............................................................................. 18
Regional Distribution – Cosmetic Procedures ................................................................................... 19
Average Surgeon/Physician Fees – Cosmetic Procedures ................................................................. 20
Cosmetic Demographics ................................................................................................................. 21
Reconstructive Demographics ......................................................................................................... 22
Reconstructive Breast Procedures ................................................................................................... 22
Body Contouring after Massive Weight Loss ..................................................................................... 23
Please credit the American Society of Plastic Surgeons when citing statistical data or using graphics.
2012 Plastic Surgery Statistics Report
3
ASPS Public RelationsPhone: 847-228-9900Fax: 847-981-5482Email: [email protected] Website: www.plasticsurgery.org
2012 Plastic Surgery StatisticsAbout the American Society of Plastic Surgeons
The American Society of Plastic Surgeons®
ASPS®, a non-profit organization, supports members in their efforts to provide the highest quality patient care through education, research and advocacy. It is the only organization with two decades of plastic surgery statistics – 1992-2012. ASPS is the largest organization of board-certified plastic surgeons in the world. With more than 7,000 members, the Society is recognized as a leading authority and information source on cosmetic and reconstructive plastic surgery. ASPS comprises more than 94 percent of all board-certified plastic surgeons in the United States. Founded in 1931, the Society represents physicians certified by The American Board of Plastic Surgery, Inc.® (ABPS®) or The Royal College of Physicians and Surgeons of Canada.
The ASPS mission is to advance quality care to plastic surgery patients by encouraging high standards of training, ethics, physician practice, and research in plastic surgery.
ASPS Member Surgeons are uniquely qualified to perform cosmetic and reconstructive plastic surgery on the face and all areas of the body.
Consumers can visit the ASPS at PlasticSurgery.org to find ASPS Member Surgeons in their area or learn more about cosmetic and reconstructive plastic surgery, like us on Facebook.com/PlasticSurgeryASPS and follow us at Twitter.com/ASPS_News.
ASPS Spokespersons Network
The ASPS Spokespersons Network is a valuable plastic surgery resource. It comprises more than 100 plastic surgeons from across the United States and Canada trained and available to assist journalists.
These spokespersons provide expert perspectives on a broad range of plastic surgery topics including procedural details, the patient-physician relationship, emerging trends, teens, and minorities.
They are also knowledgeable about the Society’s positions on health care reform, scope of practice and other issues that affect patient care.
To arrange interviews with members of the ASPS Spokespersons Network, contact the ASPS Public Relations Department.
PlasticSurgery.org
The ASPS online newsroom is the most comprehensive site for journalistic research on cosmetic and reconstructive plastic surgery on the Internet. The latest news releases and the online version of the National Clearinghouse of Plastic Surgery Statistics are available.
Full color graphics and statistical graphs can be downloaded or are available by contacting the ASPS Public Relations Department.
Pre- and Postoperative Photos and B-Roll
ASPS has a library of pre- and postoperative images and B-roll available to the media by contacting the ASPS Public Relations Department.
ASPS Member Surgeons have the following qualifications:
✔ Are certified by The American Board of Plastic Surgery and trained specifically in plastic surgery.
✔ Have at least 6 years surgical training, minimum of 3 years plastic surgery training.
✔ Operate only in accredited medical facilities.
✔ Adhere to a strict code of ethics.
✔ Fulfill continuing education requirements, including patient safety techniques.
✔ Are partners with patients in cosmetic and reconstructive plastic surgery.
Please credit the American Society of Plastic Surgeons when citing statistical data or using graphics.
2012 Plastic Surgery Statistics Report
4
ASPS Public RelationsPhone: 847-228-9900Fax: 847-981-5482Email: [email protected] Website: www.plasticsurgery.org
2012 Plastic Surgery StatisticsMethodology and Validity
Methodology
Since 1992, the American Society of Plastic Surgeons® (ASPS®) has been the source of cosmetic and reconstructive plastic surgery statistical trends in the U.S., and this series represents two decades of procedural data. ASPS has partnered with Data Harbor Solutions, a health care industry data management and technology development company, to ensure objectivity in the gathering, analysis and publication of its procedural statistics.
Since 2000, the report represents a universal and comprehensive estimate of cosmetic and reconstructive plastic surgery procedures performed by ASPS Member Surgeons as well as other physicians most likely to perform plastic surgery procedures. These physicians are all certified by American Board of Medical Specialties (ABMS) recognized boards.
ABMS is the umbrella organization for the 24 approved medical specialty boards in the United States. Established in 1933, ABMS serves to provide information concerning issues involving specialization and certification in medicine. The American Board of Plastic Surgery® (ABPS®) represents physicians who are certified by ABPS®, the only ABMS member board that certifies surgeons in plastic surgery of the face and entire body.
ASPS offers the most comprehensive, reliable statistics on plastic surgery procedures collected through the first online national database for plastic surgery procedures, Tracking Operations and Outcomes for Plastic SurgeonsSM (TOPSSM). This data is combined with the annual survey sent to ABMS board-certified physicians. All responses are aggregated and extrapolated to the entire population of more than 24,000 physicians most likely to perform cosmetic and reconstructive plastic surgery procedures, resulting in the most accurate census available.
Validity
Results of the survey are based on a 95 percent confidence level with a ±3.36 percent margin of error.
Please credit the American Society of Plastic Surgeons when citing statistical data or using graphics.
2012 Plastic Surgery Statistics Report
5
ASPS Public RelationsPhone: 847-228-9900Fax: 847-981-5482Email: [email protected] Website: www.plasticsurgery.org
ASPS procedural statistics represent procedures performed by ASPS Member Surgeons certified by The American Board of Plastic Surgery® as well as other physicians certified by American Board of Medical Specialties-recognized boards. ©ASPS, 2013
2012 Quick FactsCosmetic and Reconstructive Plastic Surgery Trends
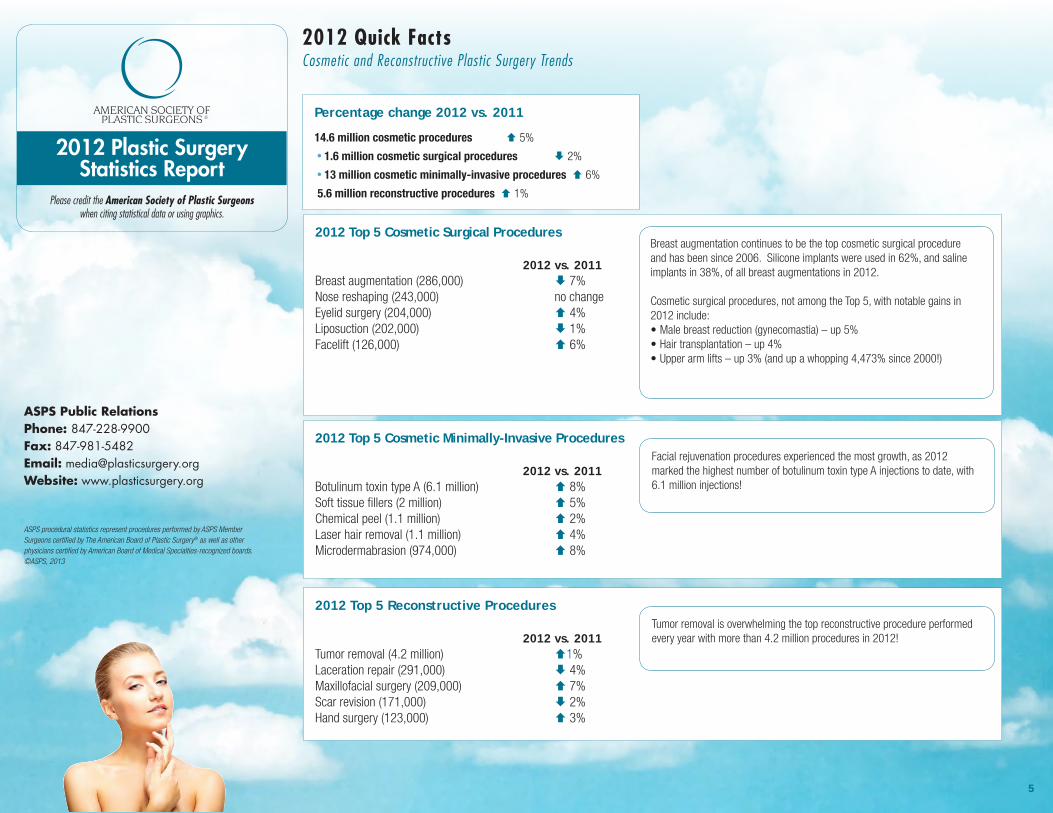
2012 Top 5 Cosmetic Surgical Procedures 2012 vs. 2011Breast augmentation (286,000) 7% Nose reshaping (243,000) no change Eyelid surgery (204,000) 4%Liposuction (202,000) 1% Facelift (126,000) 6%
Percentage change 2012 vs. 2011
14.6 million cosmetic procedures 5%
• 1.6 million cosmetic surgical procedures 2%
• 13 million cosmetic minimally-invasive procedures 6%
5.6 million reconstructive procedures 1%
2012 Top 5 Cosmetic Minimally-Invasive Procedures
2012 vs. 2011Botulinum toxin type A (6.1 million) 8% Soft tissue fillers (2 million) 5% Chemical peel (1.1 million) 2% Laser hair removal (1.1 million) 4% Microdermabrasion (974,000) 8%
2012 Top 5 Reconstructive Procedures
2012 vs. 2011Tumor removal (4.2 million) 1% Laceration repair (291,000) 4% Maxillofacial surgery (209,000) 7%Scar revision (171,000) 2% Hand surgery (123,000) 3%
Breast augmentation continues to be the top cosmetic surgical procedureand has been since 2006. Silicone implants were used in 62%, and saline implants in 38%, of all breast augmentations in 2012.
Cosmetic surgical procedures, not among the Top 5, with notable gains in 2012 include: •Malebreastreduction(gynecomastia)–up5%•Hairtransplantation–up4%•Upperarmlifts–up3%(andupawhopping4,473%since2000!)
Facial rejuvenation procedures experienced the most growth, as 2012 marked the highest number of botulinum toxin type A injections to date, with 6.1millioninjections!
Tumor removal is overwhelming the top reconstructive procedure performed everyyearwithmorethan4.2millionproceduresin2012!
Please credit the American Society of Plastic Surgeons when citing statistical data or using graphics.
2012 Plastic Surgery Statistics Report
6
ASPS Public RelationsPhone: 847-228-9900Fax: 847-981-5482Email: [email protected] Website: www.plasticsurgery.org
ASPS procedural statistics represent procedures performed by ASPS Member Surgeons certified by The American Board of Plastic Surgery® as well as other physicians certified by American Board of Medical Specialties-recognized boards. ©ASPS, 2013
2012 Quick FactsCosmetic Plastic Surgery Demographic Trends
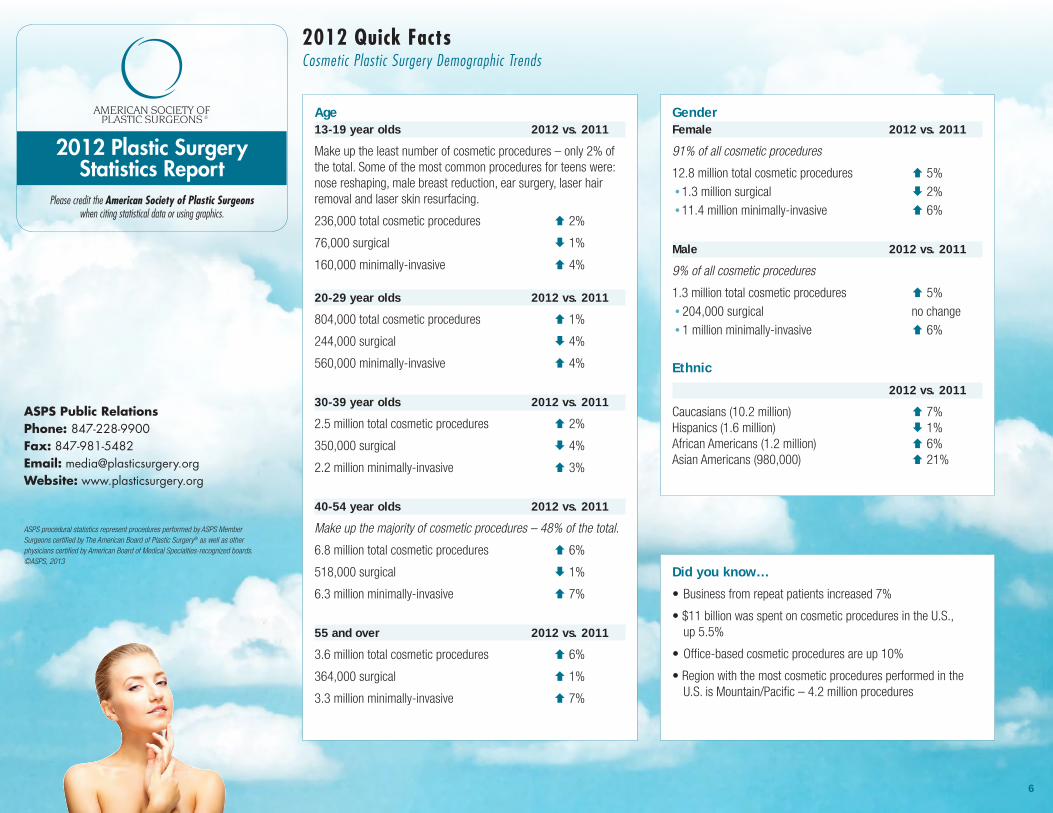
Age13-19 year olds 2012 vs. 2011
Make up the least number of cosmetic procedures – only 2% of the total. Some of the most common procedures for teens were: nose reshaping, male breast reduction, ear surgery, laser hair removal and laser skin resurfacing.
236,000 total cosmetic procedures 2%
76,000 surgical 1%
160,000 minimally-invasive 4%
20-29 year olds 2012 vs. 2011
804,000 total cosmetic procedures 1%
244,000 surgical 4%
560,000 minimally-invasive ↑ 4%
30-39 year olds 2012 vs. 2011
2.5 million total cosmetic procedures 2%
350,000 surgical 4%
2.2 million minimally-invasive 3%
40-54 year olds 2012 vs. 2011
Make up the majority of cosmetic procedures – 48% of the total.
6.8 million total cosmetic procedures 6%
518,000 surgical ↑ 1%
6.3 million minimally-invasive 7%
55 and over 2012 vs. 2011
3.6 million total cosmetic procedures ↑ 6%
364,000 surgical 1%
3.3 million minimally-invasive 7%
Gender Female 2012 vs. 2011
91% of all cosmetic procedures
12.8 million total cosmetic procedures 5% • 1.3 million surgical 2% • 11.4 million minimally-invasive 6%
Male 2012 vs. 2011
9% of all cosmetic procedures
1.3 million total cosmetic procedures 5% • 204,000 surgical no change • 1 million minimally-invasive 6%
Ethnic
2012 vs. 2011
Caucasians (10.2 million) 7% Hispanics (1.6 million) 1% African Americans (1.2 million) 6% Asian Americans (980,000) 21%
Did you know…
•Businessfromrepeatpatientsincreased7%
•$11billionwasspentoncosmeticproceduresintheU.S., up 5.5%
•Office-basedcosmeticproceduresareup10%
•Regionwiththemostcosmeticproceduresperformedinthe U.S. is Mountain/Pacific – 4.2 million procedures
Please credit the American Society of Plastic Surgeons when citing statistical data or using graphics.
2012 Plastic Surgery Statistics Report
7
ASPS Public RelationsPhone: 847-228-9900Fax: 847-981-5482Email: [email protected] Website: www.plasticsurgery.org
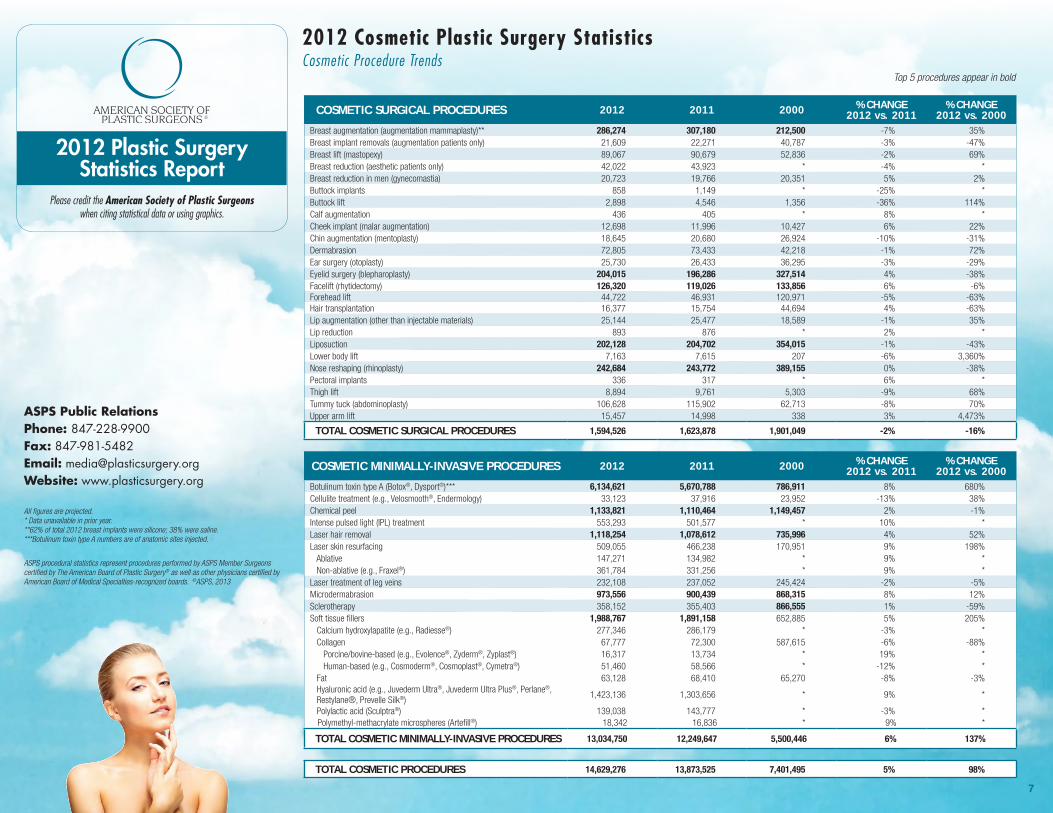
All figures are projected.* Data unavailable in prior year.**62% of total 2012 breast implants were silicone; 38% were saline.***Botulinum toxin type A numbers are of anatomic sites injected.
ASPS procedural statistics represent procedures performed by ASPS Member Surgeons certified by The American Board of Plastic Surgery® as well as other physicians certified by American Board of Medical Specialties-recognized boards. ©ASPS, 2013
2012 Cosmetic Plastic Surgery StatisticsCosmetic Procedure Trends
COSMETIC SURGICAL PROCEDURES 2012 2011 2000 % CHANGE2012 vs. 2011
% CHANGE2012 vs. 2000
Breast augmentation (augmentation mammaplasty)** 286,274 307,180 212,500 -7% 35%Breast implant removals (augmentation patients only) 21,609 22,271 40,787 -3% -47%Breast lift (mastopexy) 89,067 90,679 52,836 -2% 69%Breast reduction (aesthetic patients only) 42,022 43,923 * -4% *Breast reduction in men (gynecomastia) 20,723 19,766 20,351 5% 2%Buttock implants 858 1,149 * -25% *Buttock lift 2,898 4,546 1,356 -36% 114%Calf augmentation 436 405 * 8% *Cheek implant (malar augmentation) 12,698 11,996 10,427 6% 22%Chin augmentation (mentoplasty) 18,645 20,680 26,924 -10% -31%Dermabrasion 72,805 73,433 42,218 -1% 72%Ear surgery (otoplasty) 25,730 26,433 36,295 -3% -29%Eyelid surgery (blepharoplasty) 204,015 196,286 327,514 4% -38%Facelift (rhytidectomy) 126,320 119,026 133,856 6% -6%Forehead lift 44,722 46,931 120,971 -5% -63%Hair transplantation 16,377 15,754 44,694 4% -63%Lip augmentation (other than injectable materials) 25,144 25,477 18,589 -1% 35%Lip reduction 893 876 * 2% *Liposuction 202,128 204,702 354,015 -1% -43%Lower body lift 7,163 7,615 207 -6% 3,360%Nose reshaping (rhinoplasty) 242,684 243,772 389,155 0% -38%Pectoral implants 336 317 * 6% *Thigh lift 8,894 9,761 5,303 -9% 68%Tummy tuck (abdominoplasty) 106,628 115,902 62,713 -8% 70%Upper arm lift 15,457 14,998 338 3% 4,473%
TOTAL COSMETIC SURGICAL PROCEDURES 1,594,526 1,623,878 1,901,049 -2% -16%
COSMETIC MINIMALLY-INVASIVE PROCEDURES 2012 2011 2000 % CHANGE2012 vs. 2011
% CHANGE2012 vs. 2000
Botulinum toxin type A (Botox®, Dysport®)*** 6,134,621 5,670,788 786,911 8% 680%Cellulite treatment (e.g., Velosmooth®, Endermology) 33,123 37,916 23,952 -13% 38%Chemical peel 1,133,821 1,110,464 1,149,457 2% -1%Intense pulsed light (IPL) treatment 553,293 501,577 * 10% *Laser hair removal 1,118,254 1,078,612 735,996 4% 52%Laser skin resurfacing 509,055 466,238 170,951 9% 198% Ablative 147,271 134,982 * 9% * Non-ablative (e.g., Fraxel®) 361,784 331,256 * 9% *Laser treatment of leg veins 232,108 237,052 245,424 -2% -5%Microdermabrasion 973,556 900,439 868,315 8% 12%Sclerotherapy 358,152 355,403 866,555 1% -59%Soft tissue fillers 1,988,767 1,891,158 652,885 5% 205% Calcium hydroxylapatite (e.g., Radiesse®) 277,346 286,179 * -3% * Collagen 67,777 72,300 587,615 -6% -88% Porcine/bovine-based (e.g., Evolence®, Zyderm®, Zyplast®) 16,317 13,734 * 19% * Human-based (e.g., Cosmoderm®, Cosmoplast®, Cymetra®) 51,460 58,566 * -12% * Fat 63,128 68,410 65,270 -8% -3% Hyaluronic acid (e.g., Juvederm Ultra®, Juvederm Ultra Plus®, Perlane®,
Restylane®, Prevelle Silk®)1,423,136 1,303,656 * 9% *
Polylactic acid (Sculptra®) 139,038 143,777 * -3% * Polymethyl-methacrylate microspheres (Artefill®) 18,342 16,836 * 9% *
TOTAL COSMETIC MINIMALLY-INVASIVE PROCEDURES 13,034,750 12,249,647 5,500,446 6% 137%
TOTAL COSMETIC PROCEDURES 14,629,276 13,873,525 7,401,495 5% 98%
Top 5 procedures appear in bold
Please credit the American Society of Plastic Surgeons when citing statistical data or using graphics.
2012 Plastic Surgery Statistics Report
8
ASPS Public RelationsPhone: 847-228-9900Fax: 847-981-5482Email: [email protected] Website: www.plasticsurgery.org
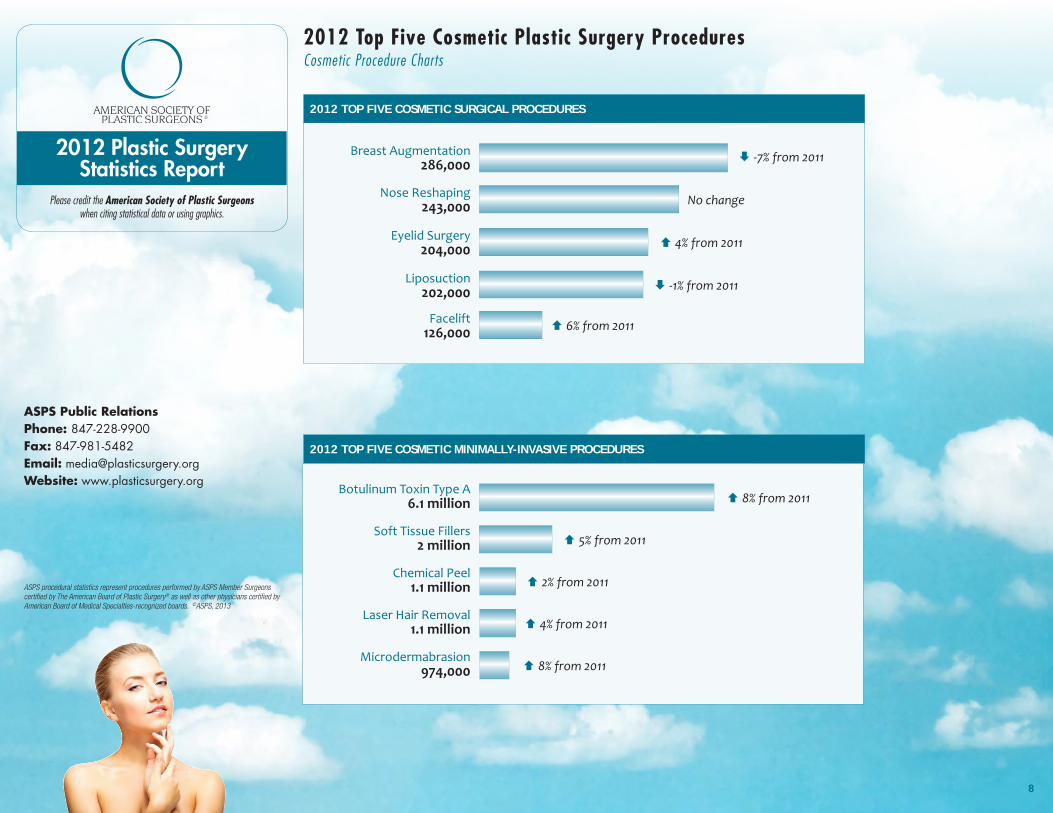
2012 Top Five Cosmetic Plastic Surgery ProceduresCosmetic Procedure Charts
ASPS procedural statistics represent procedures performed by ASPS Member Surgeons certified by The American Board of Plastic Surgery® as well as other physicians certified by American Board of Medical Specialties-recognized boards. ©ASPS, 2013
Botulinum Toxin Type A 6.1 million
Soft Tissue Fillers2 million
Chemical Peel1.1 million
Laser Hair Removal1.1 million
Microdermabrasion974,000
© 8% from 2011
© 5% from 2011
© 4% from 2011
2012 TOP FIVE COSMETIC MINIMALLY-INVASIVE PROCEDURES
Breast Augmentation286,000
Nose Reshaping243,000
© -7% from 2011
Liposuction202,000 © -1% from 2011
Facelift126,000 © 6% from 2011
2012 TOP FIVE COSMETIC SURGICAL PROCEDURES
Eyelid Surgery204,000 © 4% from 2011
© 2% from 2011
© 8% from 2011
No change
Please credit the American Society of Plastic Surgeons when citing statistical data or using graphics.
2012 Plastic Surgery Statistics Report
9
ASPS Public RelationsPhone: 847-228-9900Fax: 847-981-5482Email: [email protected] Website: www.plasticsurgery.org
****Counts of procedures performed by ASPS member surgeons only.^In 2000 figure included all animal bites.^^In 2000 figure includes facial laceration repair.^^^In 2000 figure did not include facial laceration repair.
ASPS procedural statistics represent procedures performed by ASPS Member Surgeons certified by The American Board of Plastic Surgery® as well as other physicians certified by American Board of Medical Specialties-recognized boards. ©ASPS, 2013
2012 Reconstructive Plastic Surgery StatisticsReconstructive Procedure Trends
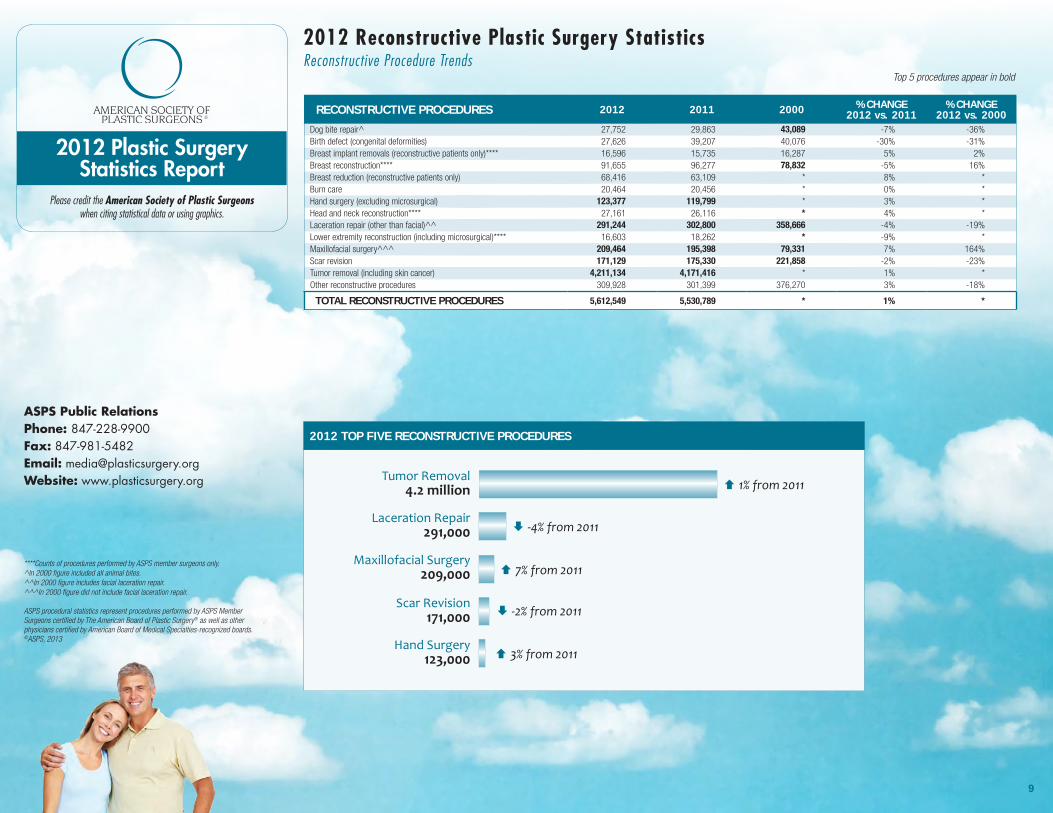
RECONSTRUCTIVE PROCEDURES 2012 2011 2000 % CHANGE2012 vs. 2011
% CHANGE2012 vs. 2000
Dog bite repair^ 27,752 29,863 43,089 -7% -36%Birth defect (congenital deformities) 27,626 39,207 40,076 -30% -31%Breast implant removals (reconstructive patients only)**** 16,596 15,735 16,287 5% 2%Breast reconstruction**** 91,655 96,277 78,832 -5% 16%Breast reduction (reconstructive patients only) 68,416 63,109 * 8% *Burn care 20,464 20,456 * 0% *Hand surgery (excluding microsurgical) 123,377 119,799 * 3% *Head and neck reconstruction**** 27,161 26,116 * 4% *Laceration repair (other than facial)^^ 291,244 302,800 358,666 -4% -19%Lower extremity reconstruction (including microsurgical)**** 16,603 18,262 * -9% *Maxillofacial surgery^^^ 209,464 195,398 79,331 7% 164%Scar revision 171,129 175,330 221,858 -2% -23%Tumor removal (including skin cancer) 4,211,134 4,171,416 * 1% *Other reconstructive procedures 309,928 301,399 376,270 3% -18%
TOTAL RECONSTRUCTIVE PROCEDURES 5,612,549 5,530,789 * 1% *
Tumor Removal 4.2 million
Laceration Repair291,000
© 1% from 2011
Maxillofacial Surgery209,000 © 7% from 2011
2012 TOP FIVE RECONSTRUCTIVE PROCEDURES
Top 5 procedures appear in bold
Scar Revision171,000 © -2% from 2011
© -4% from 2011
Hand Surgery123,000 © 3% from 2011
Please credit the American Society of Plastic Surgeons when citing statistical data or using graphics.
2012 Plastic Surgery Statistics Report
10
ASPS Public RelationsPhone: 847-228-9900Fax: 847-981-5482Email: [email protected] Website: www.plasticsurgery.org
All figures are projected.* Data unavailable in prior year.** 62% of total 2012 breast implants were silicone; 38% were saline.***Botulinum toxin type A numbers are of anatomic sites injected.
ASPS procedural statistics represent procedures performed by ASPS Member Surgeons certified by The American Board of Plastic Surgery® as well as other physicians certified by American Board of Medical Specialties-recognized boards. ©ASPS, 2013
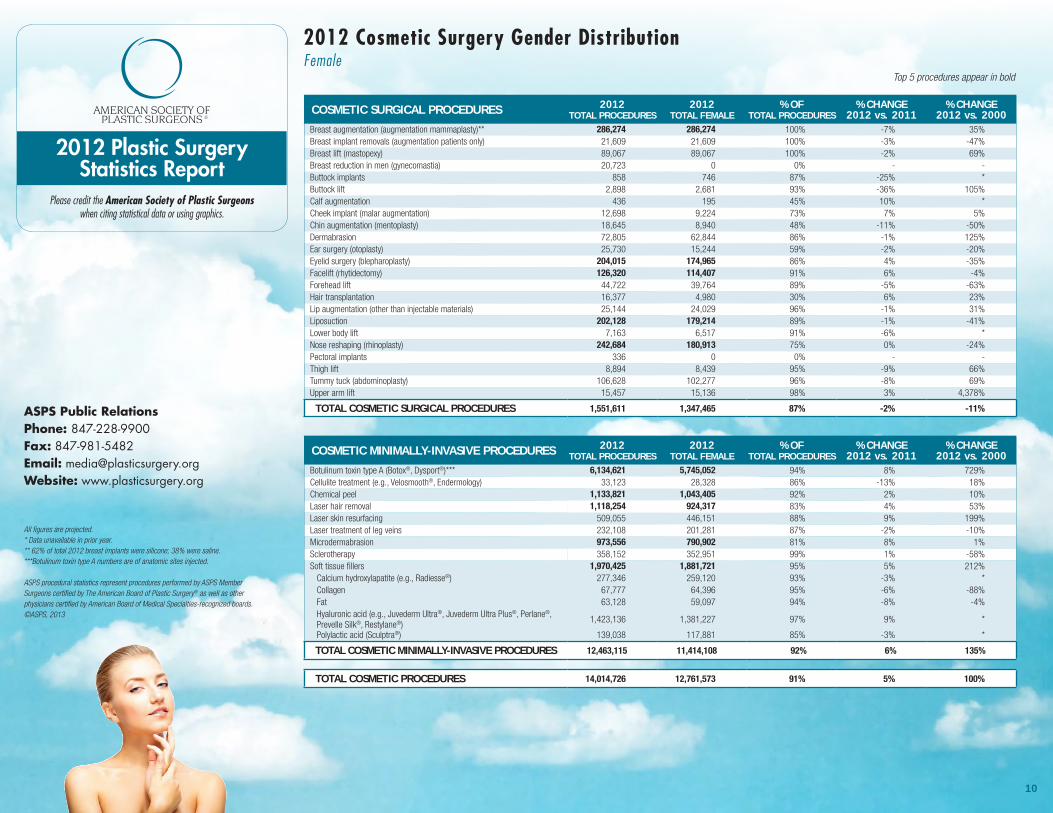
COSMETIC SURGICAL PROCEDURES 2012TOTAL PROCEDURES
2012TOTAL FEMALE
% OFTOTAL PROCEDURES
% CHANGE2012 vs. 2011
% CHANGE2012 vs. 2000
Breast augmentation (augmentation mammaplasty)** 286,274 286,274 100% -7% 35%Breast implant removals (augmentation patients only) 21,609 21,609 100% -3% -47%Breast lift (mastopexy) 89,067 89,067 100% -2% 69%Breast reduction in men (gynecomastia) 20,723 0 0% - -Buttock implants 858 746 87% -25% *Buttock lift 2,898 2,681 93% -36% 105%Calf augmentation 436 195 45% 10% *Cheek implant (malar augmentation) 12,698 9,224 73% 7% 5%Chin augmentation (mentoplasty) 18,645 8,940 48% -11% -50%Dermabrasion 72,805 62,844 86% -1% 125%Ear surgery (otoplasty) 25,730 15,244 59% -2% -20%Eyelid surgery (blepharoplasty) 204,015 174,965 86% 4% -35%Facelift (rhytidectomy) 126,320 114,407 91% 6% -4%Forehead lift 44,722 39,764 89% -5% -63%Hair transplantation 16,377 4,980 30% 6% 23%Lip augmentation (other than injectable materials) 25,144 24,029 96% -1% 31%Liposuction 202,128 179,214 89% -1% -41%Lower body lift 7,163 6,517 91% -6% *Nose reshaping (rhinoplasty) 242,684 180,913 75% 0% -24%Pectoral implants 336 0 0% - -Thigh lift 8,894 8,439 95% -9% 66%Tummy tuck (abdominoplasty) 106,628 102,277 96% -8% 69%Upper arm lift 15,457 15,136 98% 3% 4,378%
TOTAL COSMETIC SURGICAL PROCEDURES 1,551,611 1,347,465 87% -2% -11%
COSMETIC MINIMALLY-INVASIVE PROCEDURES 2012TOTAL PROCEDURES
2012TOTAL FEMALE
% OFTOTAL PROCEDURES
% CHANGE2012 vs. 2011
% CHANGE2012 vs. 2000
Botulinum toxin type A (Botox®, Dysport®)*** 6,134,621 5,745,052 94% 8% 729%Cellulite treatment (e.g., Velosmooth®, Endermology) 33,123 28,328 86% -13% 18%Chemical peel 1,133,821 1,043,405 92% 2% 10%Laser hair removal 1,118,254 924,317 83% 4% 53%Laser skin resurfacing 509,055 446,151 88% 9% 199%Laser treatment of leg veins 232,108 201,281 87% -2% -10%Microdermabrasion 973,556 790,902 81% 8% 1%Sclerotherapy 358,152 352,951 99% 1% -58%Soft tissue fillers 1,970,425 1,881,721 95% 5% 212% Calcium hydroxylapatite (e.g., Radiesse®) 277,346 259,120 93% -3% * Collagen 67,777 64,396 95% -6% -88% Fat 63,128 59,097 94% -8% -4% Hyaluronic acid (e.g., Juvederm Ultra®, Juvederm Ultra Plus®, Perlane®, Prevelle Silk®, Restylane®)
1,423,136 1,381,227 97% 9% *
Polylactic acid (Sculptra®) 139,038 117,881 85% -3% *
TOTAL COSMETIC MINIMALLY-INVASIVE PROCEDURES 12,463,115 11,414,108 92% 6% 135%
TOTAL COSMETIC PROCEDURES 14,014,726 12,761,573 91% 5% 100%
2012 Cosmetic Surgery Gender DistributionFemale
Top 5 procedures appear in bold
Please credit the American Society of Plastic Surgeons when citing statistical data or using graphics.
2012 Plastic Surgery Statistics Report
11
ASPS Public RelationsPhone: 847-228-9900Fax: 847-981-5482Email: [email protected] Website: www.plasticsurgery.org
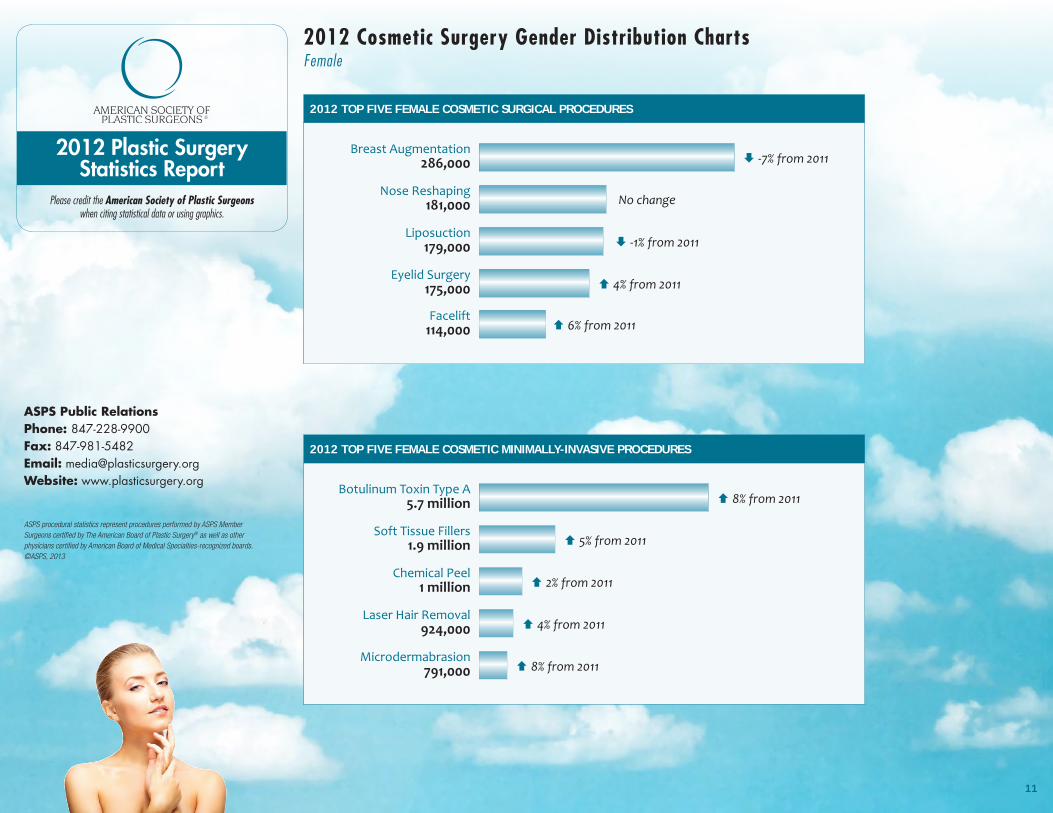
2012 Cosmetic Surgery Gender Distribution ChartsFemale
Botulinum Toxin Type A 5.4 million
Soft Tissue Fillers1.8 million
Chemical Peel1.1 million
Laser Hair Removal938,000
Microdermabrasion825,000
2012 TOP FIVE FEMALE COSMETIC MINIMALLY-INVASIVE PROCEDURES
Breast Augmentation296,203
Nose Reshaping252,261
Eyelid Surgery208,764
Liposuction203,106
Tummy Tuck116,352
2012 TOP FIVE FEMALE COSMETIC SURGICAL PROCEDURES
ASPS procedural statistics represent procedures performed by ASPS Member Surgeons certified by The American Board of Plastic Surgery® as well as other physicians certified by American Board of Medical Specialties-recognized boards. ©ASPS, 2013
Botulinum Toxin Type A 5.7 million
Soft Tissue Fillers1.9 million
Chemical Peel1 million
Laser Hair Removal924,000
Microdermabrasion791,000
Facelift114,000
Eyelid Surgery175,000
Liposuction179,000
Nose Reshaping181,000
Breast Augmentation286,000 -7% from 2011
-1% from 2011
6% from 2011
No change
8% from 2011
5% from 2011
2% from 2011
4% from 2011
8% from 2011
4% from 2011
Please credit the American Society of Plastic Surgeons when citing statistical data or using graphics.
2012 Plastic Surgery Statistics Report
12
ASPS Public RelationsPhone: 847-228-9900Fax: 847-981-5482Email: [email protected] Website: www.plasticsurgery.org
All figures are projected.* Data unavailable in prior year.***Botulinum toxin type A numbers are of anatomic sites injected.
ASPS procedural statistics represent procedures performed by ASPS Member Surgeons certified by The American Board of Plastic Surgery® as well as other physicians certified by American Board of Medical Specialties-recognized boards. ©ASPS, 2013
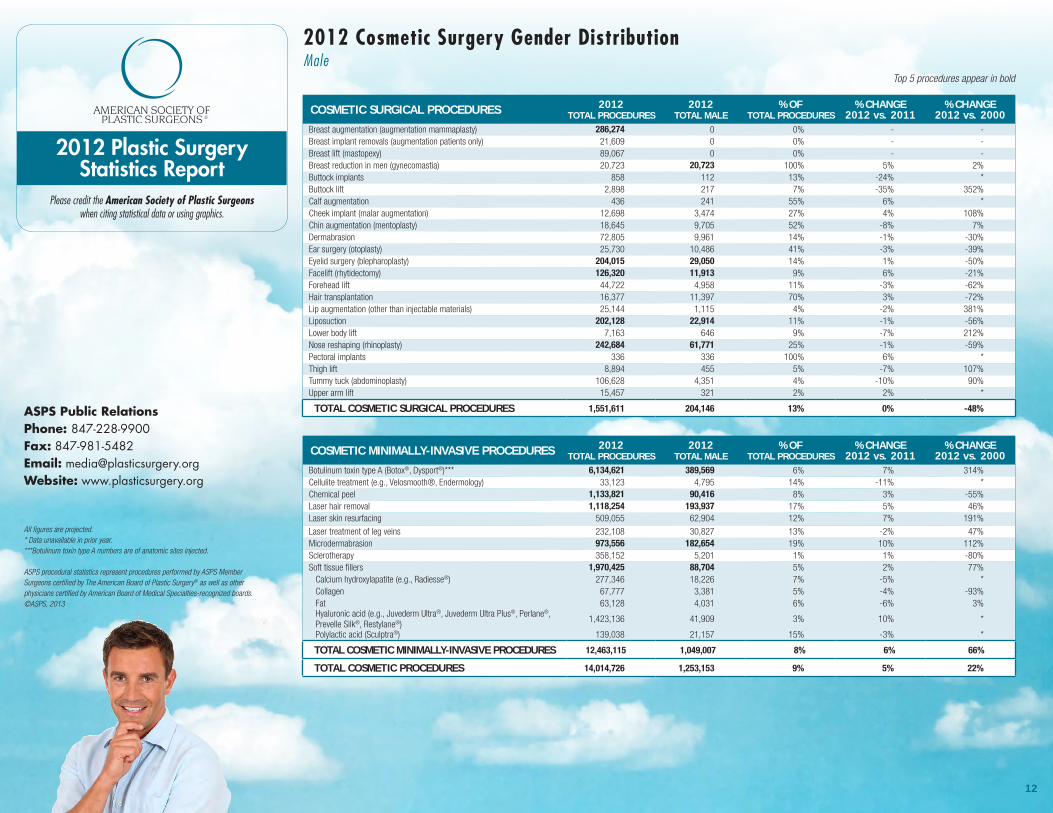
2012 Cosmetic Surgery Gender DistributionMale
COSMETIC SURGICAL PROCEDURES 2012TOTAL PROCEDURES
2012TOTAL MALE
% OFTOTAL PROCEDURES
% CHANGE2012 vs. 2011
% CHANGE2012 vs. 2000
Breast augmentation (augmentation mammaplasty) 286,274 0 0% - -Breast implant removals (augmentation patients only) 21,609 0 0% - -Breast lift (mastopexy) 89,067 0 0% - -Breast reduction in men (gynecomastia) 20,723 20,723 100% 5% 2%Buttock implants 858 112 13% -24% *Buttock lift 2,898 217 7% -35% 352%Calf augmentation 436 241 55% 6% *Cheek implant (malar augmentation) 12,698 3,474 27% 4% 108%Chin augmentation (mentoplasty) 18,645 9,705 52% -8% 7%Dermabrasion 72,805 9,961 14% -1% -30%Ear surgery (otoplasty) 25,730 10,486 41% -3% -39%Eyelid surgery (blepharoplasty) 204,015 29,050 14% 1% -50%Facelift (rhytidectomy) 126,320 11,913 9% 6% -21%Forehead lift 44,722 4,958 11% -3% -62%Hair transplantation 16,377 11,397 70% 3% -72%Lip augmentation (other than injectable materials) 25,144 1,115 4% -2% 381%Liposuction 202,128 22,914 11% -1% -56%Lower body lift 7,163 646 9% -7% 212%Nose reshaping (rhinoplasty) 242,684 61,771 25% -1% -59%Pectoral implants 336 336 100% 6% *Thigh lift 8,894 455 5% -7% 107%Tummy tuck (abdominoplasty) 106,628 4,351 4% -10% 90%Upper arm lift 15,457 321 2% 2% *
TOTAL COSMETIC SURGICAL PROCEDURES 1,551,611 204,146 13% 0% -48%
COSMETIC MINIMALLY-INVASIVE PROCEDURES 2012TOTAL PROCEDURES
2012TOTAL MALE
% OFTOTAL PROCEDURES
% CHANGE2012 vs. 2011
% CHANGE2012 vs. 2000
Botulinum toxin type A (Botox®, Dysport®)*** 6,134,621 389,569 6% 7% 314%Cellulite treatment (e.g., Velosmooth®, Endermology) 33,123 4,795 14% -11% *Chemical peel 1,133,821 90,416 8% 3% -55%Laser hair removal 1,118,254 193,937 17% 5% 46%Laser skin resurfacing 509,055 62,904 12% 7% 191%
Laser treatment of leg veins 232,108 30,827 13% -2% 47%Microdermabrasion 973,556 182,654 19% 10% 112%Sclerotherapy 358,152 5,201 1% 1% -80%Soft tissue fillers 1,970,425 88,704 5% 2% 77% Calcium hydroxylapatite (e.g., Radiesse®) 277,346 18,226 7% -5% * Collagen 67,777 3,381 5% -4% -93% Fat 63,128 4,031 6% -6% 3% Hyaluronic acid (e.g., Juvederm Ultra®, Juvederm Ultra Plus®, Perlane®, Prevelle Silk®, Restylane®)
1,423,136 41,909 3% 10% *
Polylactic acid (Sculptra®) 139,038 21,157 15% -3% *
TOTAL COSMETIC MINIMALLY-INVASIVE PROCEDURES 12,463,115 1,049,007 8% 6% 66%
TOTAL COSMETIC PROCEDURES 14,014,726 1,253,153 9% 5% 22%
Top 5 procedures appear in bold
Please credit the American Society of Plastic Surgeons when citing statistical data or using graphics.
2012 Plastic Surgery Statistics Report
13
ASPS Public RelationsPhone: 847-228-9900Fax: 847-981-5482Email: [email protected] Website: www.plasticsurgery.org
ASPS procedural statistics represent procedures performed by ASPS Member Surgeons certified by The American Board of Plastic Surgery® as well as other physicians certified by American Board of Medical Specialties-recognized boards. ©ASPS, 2013
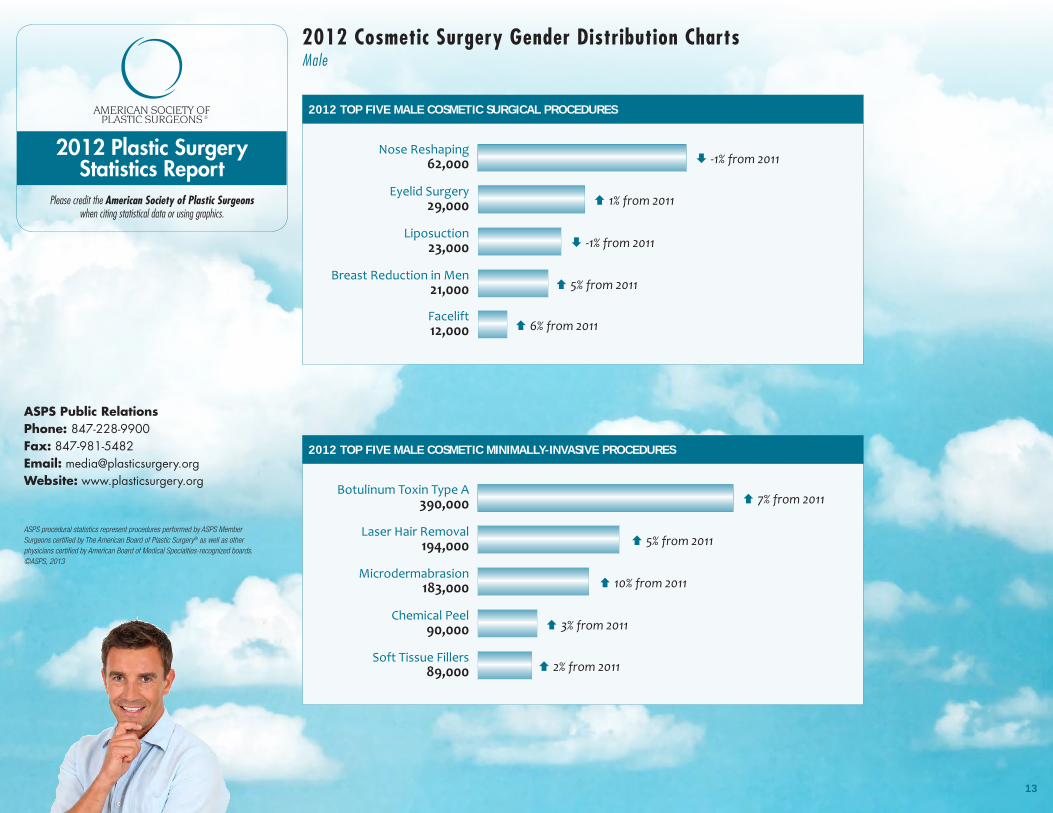
2012 Cosmetic Surgery Gender Distribution ChartsMale
2012 TOP FIVE MALE COSMETIC SURGICAL PROCEDURES
Botulinum Toxin Type A 390,000
Laser Hair Removal194,000
Microdermabrasion183,000
Chemical Peel90,000
Soft Tissue Fillers89,000
2012 TOP FIVE MALE COSMETIC MINIMALLY-INVASIVE PROCEDURES
Facelift12,000
Liposuction23,000
Eyelid Surgery29,000
Nose Reshaping62,000
Breast Reduction in Men21,000
-1% from 2011
1% from 2011
-1% from 2011
5% from 2011
6% from 2011
7% from 2011
10% from 2011
5% from 2011
3% from 2011
2% from 2011

Please credit the American Society of Plastic Surgeons when citing statistical data or using graphics.
2012 Plastic Surgery Statistics Report
14
ASPS Public RelationsPhone: 847-228-9900Fax: 847-981-5482Email: [email protected] Website: www.plasticsurgery.org
All values are projected.^ Total represents only 18 and 19 year olds.***Botulinum toxin type A numbers are of anatomic sites injected. ASPS procedural statistics represent procedures performed by ASPS Member Surgeons certified by The American Board of Plastic Surgery® as well as other physicians certified by American Board of Medical Specialties-recognized boards. ©ASPS, 2013
COSMETIC SURGICAL PROCEDURES AGE 13-192012 TOTAL
AGE 13-19% OF TOTAL PROCEDURES
AGE 13-19% CHANGE 2012 vs 2011
Breast augmentation (augmentation mammaplasty)^ 8,204 3% -8%Breast implant removals (augmentation patients only)^ 76 0% -1%Breast lift (mastopexy) 1,591 2% -3%Breast reduction in men (gynecomastia) 15,142 73% 5%Chin augmentation (mentoplasty) 1,592 9% -12%Dermabrasion 3,176 4% -1%Ear surgery (otoplasty) 7,406 29% -1%Eyelid surgery (blepharoplasty) 1,926 1% 2%Lip augmentation (other than injectable materials) 243 1% -2%Liposuction 3,191 2% -2%Nose reshaping (rhinoplasty) 33,673 14% -1%
TOTAL COSMETIC SURGICAL PROCEDURES 76,220 5% -1%
COSMETIC MINIMALLY-INVASIVE PROCEDURES AGE 13-192012 TOTAL
AGE 13-19% OF TOTAL PROCEDURES
AGE 13-19% CHANGE 2012 vs 2011
Botulinum toxin type A (Botox®, Dysport®)*** 17,447 0% 8%Chemical peel 6,024 1% 4%Laser hair removal 72,778 7% 5%Laser skin resurfacing 25,241 5% 7%Laser treatment of leg veins 20,954 9% -4%Microdermabrasion 9,576 1% 7%Sclerotherapy 1,961 1% 2%Soft tissue fillers 6,155 0% 0% Calcium hydroxylapatite (e.g., Radiesse®) 926 0% -2% Collagen 228 0% -6% Fat 560 1% -6%
Hyaluronic acid (e.g., Juvederm Ultra®, Juvederm Ultra Plus®, Perlane®, Prevelle Silk®, Restylane®)
2,535 0% 7%
Polylactic acid (Sculptra®) 1,906 1% -5%
TOTAL COSMETIC MINIMALLY-INVASIVE PROCEDURES 160,136 1% 4%
TOTAL COSMETIC PROCEDURES 236,356 2% 2%
2012 Cosmetic Surgery Age DistributionAge 13-19
Top 5 procedures appear in bold
Please credit the American Society of Plastic Surgeons when citing statistical data or using graphics.
2012 Plastic Surgery Statistics Report
15
ASPS Public RelationsPhone: 847-228-9900Fax: 847-981-5482Email: [email protected] Website: www.plasticsurgery.org
All values are projected.***Botulinum toxin type A numbers are of anatomic sites injected. ASPS procedural statistics represent procedures performed by ASPS Member Surgeons certified by The American Board of Plastic Surgery® as well as other physicians certified by American Board of Medical Specialties-recognized boards. ©ASPS, 2013
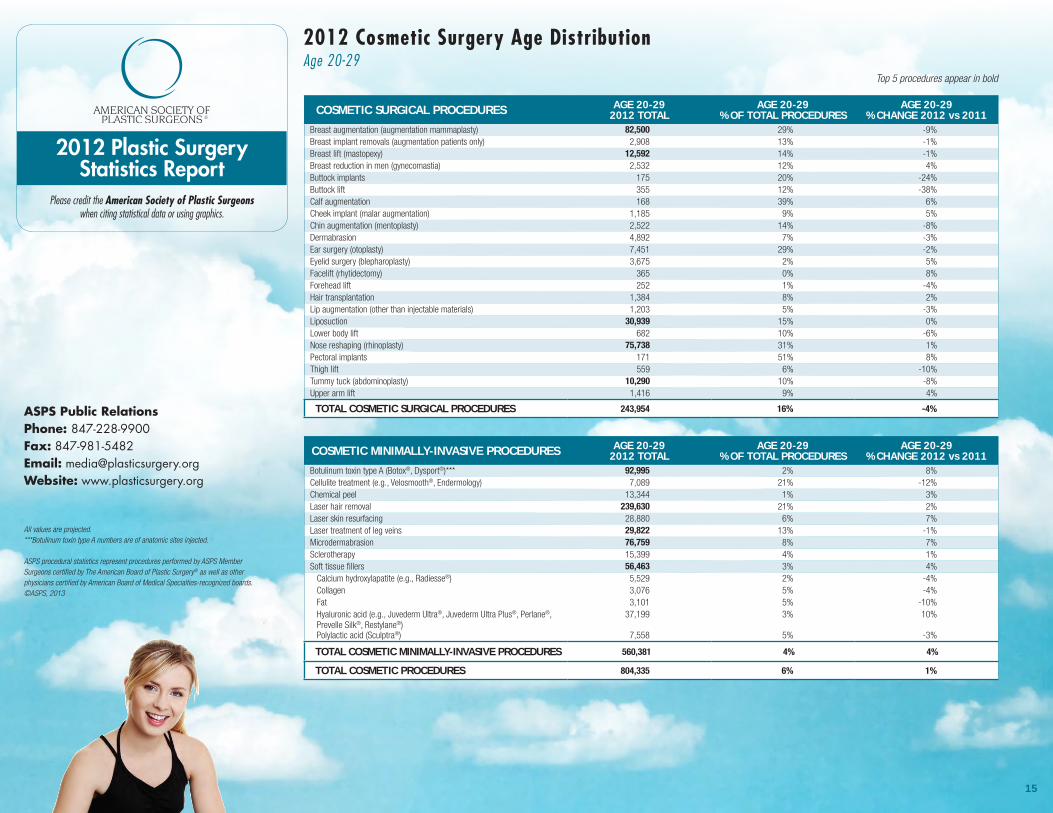
2012 Cosmetic Surgery Age DistributionAge 20-29
COSMETIC SURGICAL PROCEDURES AGE 20-292012 TOTAL
AGE 20-29% OF TOTAL PROCEDURES
AGE 20-29% CHANGE 2012 vs 2011
Breast augmentation (augmentation mammaplasty) 82,500 29% -9%Breast implant removals (augmentation patients only) 2,908 13% -1%Breast lift (mastopexy) 12,592 14% -1%Breast reduction in men (gynecomastia) 2,532 12% 4%Buttock implants 175 20% -24%Buttock lift 355 12% -38%Calf augmentation 168 39% 6%Cheek implant (malar augmentation) 1,185 9% 5%Chin augmentation (mentoplasty) 2,522 14% -8%Dermabrasion 4,892 7% -3%Ear surgery (otoplasty) 7,451 29% -2%Eyelid surgery (blepharoplasty) 3,675 2% 5%Facelift (rhytidectomy) 365 0% 8%Forehead lift 252 1% -4%Hair transplantation 1,384 8% 2%Lip augmentation (other than injectable materials) 1,203 5% -3%Liposuction 30,939 15% 0%Lower body lift 682 10% -6%Nose reshaping (rhinoplasty) 75,738 31% 1%Pectoral implants 171 51% 8%Thigh lift 559 6% -10%Tummy tuck (abdominoplasty) 10,290 10% -8%Upper arm lift 1,416 9% 4%
TOTAL COSMETIC SURGICAL PROCEDURES 243,954 16% -4%
COSMETIC MINIMALLY-INVASIVE PROCEDURES AGE 20-292012 TOTAL
AGE 20-29% OF TOTAL PROCEDURES
AGE 20-29% CHANGE 2012 vs 2011
Botulinum toxin type A (Botox®, Dysport®)*** 92,995 2% 8%Cellulite treatment (e.g., Velosmooth®, Endermology) 7,089 21% -12%Chemical peel 13,344 1% 3%Laser hair removal 239,630 21% 2%Laser skin resurfacing 28,880 6% 7%Laser treatment of leg veins 29,822 13% -1%Microdermabrasion 76,759 8% 7%Sclerotherapy 15,399 4% 1%Soft tissue fillers 56,463 3% 4% Calcium hydroxylapatite (e.g., Radiesse®) 5,529 2% -4% Collagen 3,076 5% -4% Fat 3,101 5% -10% Hyaluronic acid (e.g., Juvederm Ultra®, Juvederm Ultra Plus®, Perlane®, Prevelle Silk®, Restylane®)
37,199 3% 10%
Polylactic acid (Sculptra®) 7,558 5% -3%
TOTAL COSMETIC MINIMALLY-INVASIVE PROCEDURES 560,381 4% 4%
TOTAL COSMETIC PROCEDURES 804,335 6% 1%
Top 5 procedures appear in bold
Please credit the American Society of Plastic Surgeons when citing statistical data or using graphics.
2012 Plastic Surgery Statistics Report
16
ASPS Public RelationsPhone: 847-228-9900Fax: 847-981-5482Email: [email protected] Website: www.plasticsurgery.org
All values are projected.***Botulinum toxin type A numbers are of anatomic sites injected. ASPS procedural statistics represent procedures performed by ASPS Member Surgeons certified by The American Board of Plastic Surgery® as well as other physicians certified by American Board of Medical Specialties-recognized boards. ©ASPS, 2013
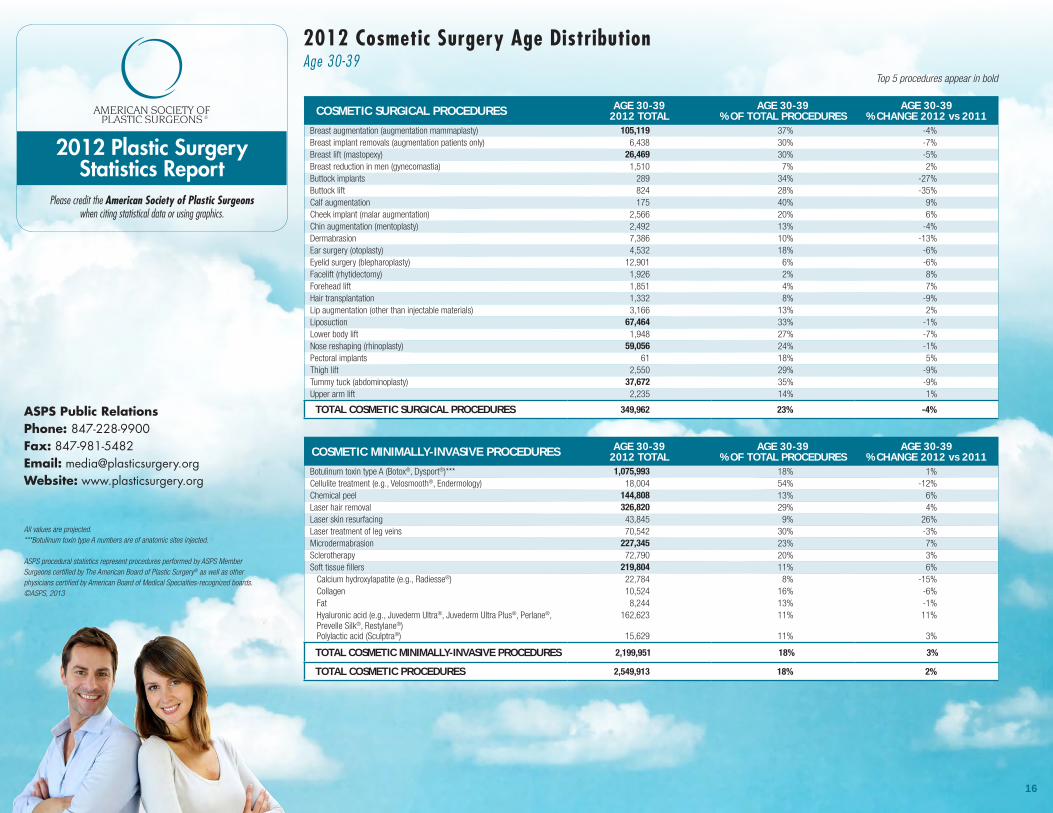
2012 Cosmetic Surgery Age DistributionAge 30-39
COSMETIC SURGICAL PROCEDURES AGE 30-392012 TOTAL
AGE 30-39% OF TOTAL PROCEDURES
AGE 30-39% CHANGE 2012 vs 2011
Breast augmentation (augmentation mammaplasty) 105,119 37% -4%Breast implant removals (augmentation patients only) 6,438 30% -7%Breast lift (mastopexy) 26,469 30% -5%Breast reduction in men (gynecomastia) 1,510 7% 2%Buttock implants 289 34% -27%Buttock lift 824 28% -35%Calf augmentation 175 40% 9%Cheek implant (malar augmentation) 2,566 20% 6%Chin augmentation (mentoplasty) 2,492 13% -4%Dermabrasion 7,386 10% -13%Ear surgery (otoplasty) 4,532 18% -6%Eyelid surgery (blepharoplasty) 12,901 6% -6%Facelift (rhytidectomy) 1,926 2% 8%Forehead lift 1,851 4% 7%Hair transplantation 1,332 8% -9%Lip augmentation (other than injectable materials) 3,166 13% 2%Liposuction 67,464 33% -1%Lower body lift 1,948 27% -7%Nose reshaping (rhinoplasty) 59,056 24% -1%Pectoral implants 61 18% 5%Thigh lift 2,550 29% -9%Tummy tuck (abdominoplasty) 37,672 35% -9%Upper arm lift 2,235 14% 1%
TOTAL COSMETIC SURGICAL PROCEDURES 349,962 23% -4%
COSMETIC MINIMALLY-INVASIVE PROCEDURES AGE 30-392012 TOTAL
AGE 30-39% OF TOTAL PROCEDURES
AGE 30-39% CHANGE 2012 vs 2011
Botulinum toxin type A (Botox®, Dysport®)*** 1,075,993 18% 1%Cellulite treatment (e.g., Velosmooth®, Endermology) 18,004 54% -12%Chemical peel 144,808 13% 6%Laser hair removal 326,820 29% 4%Laser skin resurfacing 43,845 9% 26%Laser treatment of leg veins 70,542 30% -3%Microdermabrasion 227,345 23% 7%Sclerotherapy 72,790 20% 3%Soft tissue fillers 219,804 11% 6% Calcium hydroxylapatite (e.g., Radiesse®) 22,784 8% -15% Collagen 10,524 16% -6% Fat 8,244 13% -1% Hyaluronic acid (e.g., Juvederm Ultra®, Juvederm Ultra Plus®, Perlane®, Prevelle Silk®, Restylane®)
162,623 11% 11%
Polylactic acid (Sculptra®) 15,629 11% 3%
TOTAL COSMETIC MINIMALLY-INVASIVE PROCEDURES 2,199,951 18% 3%
TOTAL COSMETIC PROCEDURES 2,549,913 18% 2%
Top 5 procedures appear in bold
Please credit the American Society of Plastic Surgeons when citing statistical data or using graphics.
2012 Plastic Surgery Statistics Report
17
ASPS Public RelationsPhone: 847-228-9900Fax: 847-981-5482Email: [email protected] Website: www.plasticsurgery.org
All values are projected.***Botulinum toxin type A numbers are of anatomic sites injected. ASPS procedural statistics represent procedures performed by ASPS Member Surgeons certified by The American Board of Plastic Surgery® as well as other physicians certified by American Board of Medical Specialties-recognized boards. ©ASPS, 2013
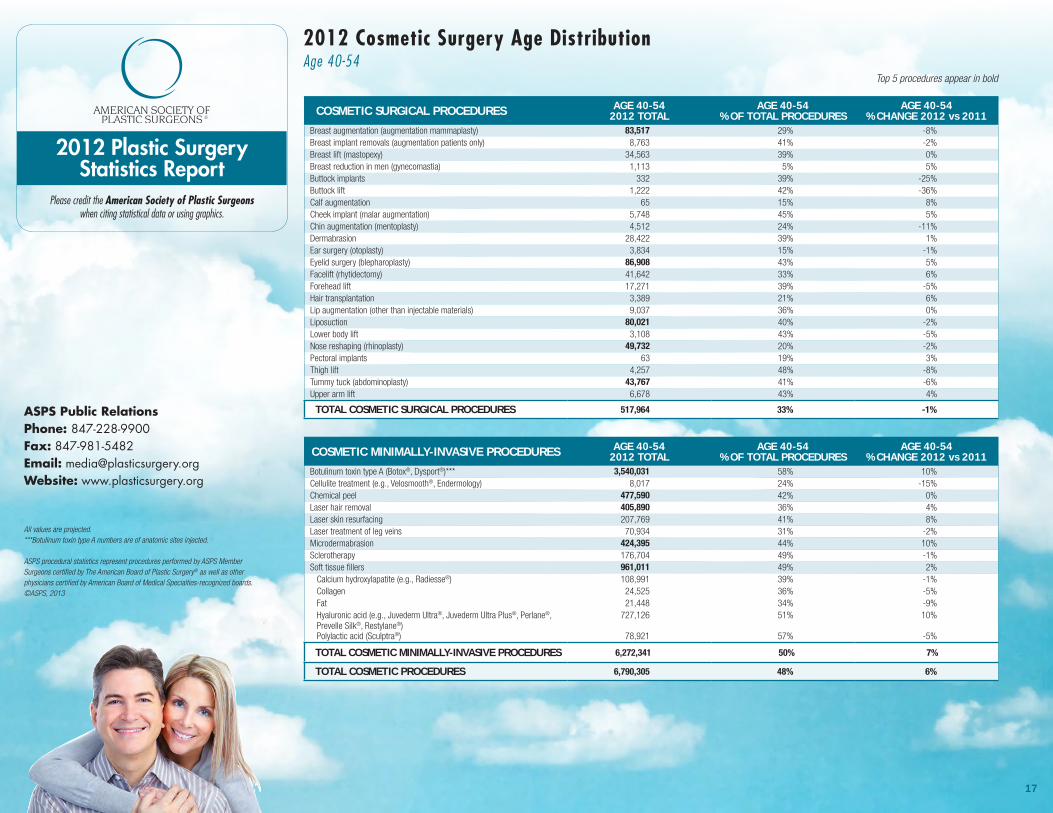
2012 Cosmetic Surgery Age DistributionAge 40-54
COSMETIC SURGICAL PROCEDURES AGE 40-542012 TOTAL
AGE 40-54% OF TOTAL PROCEDURES
AGE 40-54% CHANGE 2012 vs 2011
Breast augmentation (augmentation mammaplasty) 83,517 29% -8%Breast implant removals (augmentation patients only) 8,763 41% -2%Breast lift (mastopexy) 34,563 39% 0%Breast reduction in men (gynecomastia) 1,113 5% 5%Buttock implants 332 39% -25%Buttock lift 1,222 42% -36%Calf augmentation 65 15% 8%Cheek implant (malar augmentation) 5,748 45% 5%Chin augmentation (mentoplasty) 4,512 24% -11%Dermabrasion 28,422 39% 1%Ear surgery (otoplasty) 3,834 15% -1%Eyelid surgery (blepharoplasty) 86,908 43% 5%Facelift (rhytidectomy) 41,642 33% 6%Forehead lift 17,271 39% -5%Hair transplantation 3,389 21% 6%Lip augmentation (other than injectable materials) 9,037 36% 0%Liposuction 80,021 40% -2%Lower body lift 3,108 43% -5%Nose reshaping (rhinoplasty) 49,732 20% -2%Pectoral implants 63 19% 3%Thigh lift 4,257 48% -8%Tummy tuck (abdominoplasty) 43,767 41% -6%Upper arm lift 6,678 43% 4%
TOTAL COSMETIC SURGICAL PROCEDURES 517,964 33% -1%
COSMETIC MINIMALLY-INVASIVE PROCEDURES AGE 40-542012 TOTAL
AGE 40-54% OF TOTAL PROCEDURES
AGE 40-54% CHANGE 2012 vs 2011
Botulinum toxin type A (Botox®, Dysport®)*** 3,540,031 58% 10%Cellulite treatment (e.g., Velosmooth®, Endermology) 8,017 24% -15%Chemical peel 477,590 42% 0%Laser hair removal 405,890 36% 4%Laser skin resurfacing 207,769 41% 8%Laser treatment of leg veins 70,934 31% -2%Microdermabrasion 424,395 44% 10%Sclerotherapy 176,704 49% -1%Soft tissue fillers 961,011 49% 2% Calcium hydroxylapatite (e.g., Radiesse®) 108,991 39% -1% Collagen 24,525 36% -5% Fat 21,448 34% -9% Hyaluronic acid (e.g., Juvederm Ultra®, Juvederm Ultra Plus®, Perlane®, Prevelle Silk®, Restylane®)
727,126 51% 10%
Polylactic acid (Sculptra®) 78,921 57% -5%
TOTAL COSMETIC MINIMALLY-INVASIVE PROCEDURES 6,272,341 50% 7%
TOTAL COSMETIC PROCEDURES 6,790,305 48% 6%
Top 5 procedures appear in bold
Please credit the American Society of Plastic Surgeons when citing statistical data or using graphics.
2012 Plastic Surgery Statistics Report
18
ASPS Public RelationsPhone: 847-228-9900Fax: 847-981-5482Email: [email protected] Website: www.plasticsurgery.org
All values are projected.***Botulinum toxin type A numbers are of anatomic sites injected. ASPS procedural statistics represent procedures performed by ASPS Member Surgeons certified by The American Board of Plastic Surgery® as well as other physicians certified by American Board of Medical Specialties-recognized boards. ©ASPS, 2013
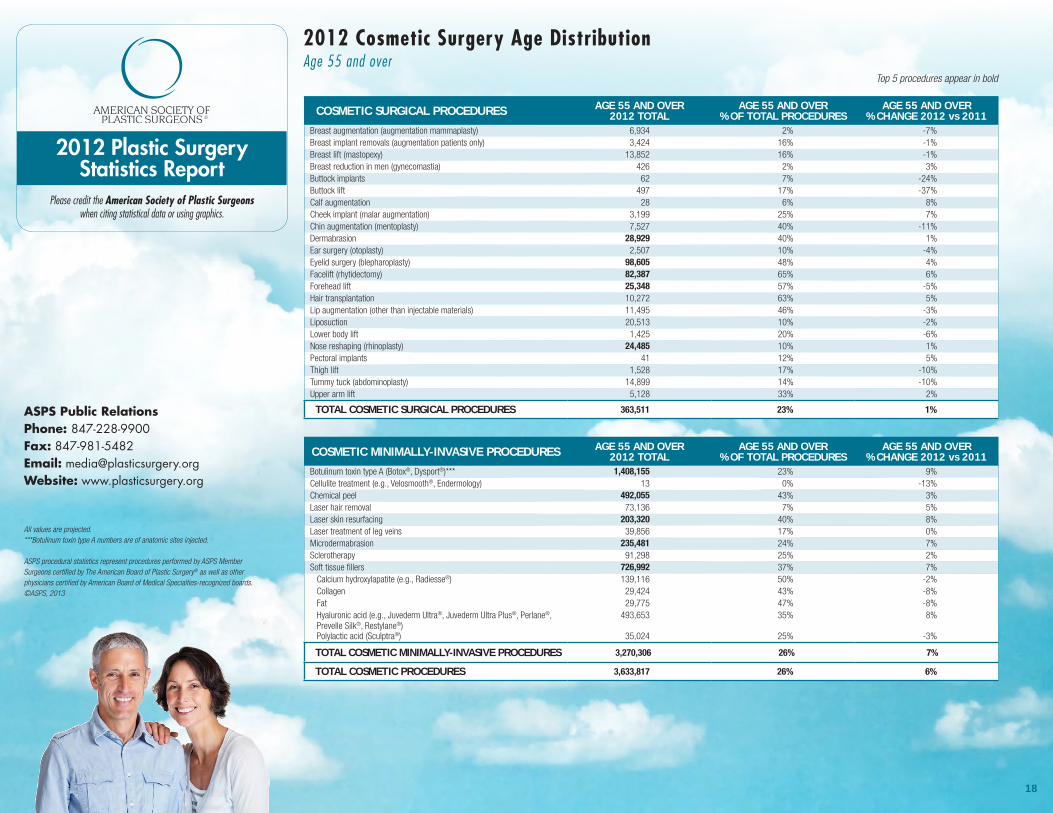
2012 Cosmetic Surgery Age DistributionAge 55 and over
COSMETIC SURGICAL PROCEDURES AGE 55 AND OVER2012 TOTAL
AGE 55 AND OVER% OF TOTAL PROCEDURES
AGE 55 AND OVER% CHANGE 2012 vs 2011
Breast augmentation (augmentation mammaplasty) 6,934 2% -7%Breast implant removals (augmentation patients only) 3,424 16% -1%Breast lift (mastopexy) 13,852 16% -1%Breast reduction in men (gynecomastia) 426 2% 3%Buttock implants 62 7% -24%Buttock lift 497 17% -37%Calf augmentation 28 6% 8%Cheek implant (malar augmentation) 3,199 25% 7%Chin augmentation (mentoplasty) 7,527 40% -11%Dermabrasion 28,929 40% 1%Ear surgery (otoplasty) 2,507 10% -4%Eyelid surgery (blepharoplasty) 98,605 48% 4%Facelift (rhytidectomy) 82,387 65% 6%Forehead lift 25,348 57% -5%Hair transplantation 10,272 63% 5%Lip augmentation (other than injectable materials) 11,495 46% -3%Liposuction 20,513 10% -2%Lower body lift 1,425 20% -6%Nose reshaping (rhinoplasty) 24,485 10% 1%Pectoral implants 41 12% 5%Thigh lift 1,528 17% -10%Tummy tuck (abdominoplasty) 14,899 14% -10%Upper arm lift 5,128 33% 2%
TOTAL COSMETIC SURGICAL PROCEDURES 363,511 23% 1%
COSMETIC MINIMALLY-INVASIVE PROCEDURES AGE 55 AND OVER2012 TOTAL
AGE 55 AND OVER% OF TOTAL PROCEDURES
AGE 55 AND OVER% CHANGE 2012 vs 2011
Botulinum toxin type A (Botox®, Dysport®)*** 1,408,155 23% 9%Cellulite treatment (e.g., Velosmooth®, Endermology) 13 0% -13%Chemical peel 492,055 43% 3%Laser hair removal 73,136 7% 5%Laser skin resurfacing 203,320 40% 8%Laser treatment of leg veins 39,856 17% 0%Microdermabrasion 235,481 24% 7%Sclerotherapy 91,298 25% 2%Soft tissue fillers 726,992 37% 7% Calcium hydroxylapatite (e.g., Radiesse®) 139,116 50% -2% Collagen 29,424 43% -8% Fat 29,775 47% -8% Hyaluronic acid (e.g., Juvederm Ultra®, Juvederm Ultra Plus®, Perlane®, Prevelle Silk®, Restylane®)
493,653 35% 8%
Polylactic acid (Sculptra®) 35,024 25% -3%
TOTAL COSMETIC MINIMALLY-INVASIVE PROCEDURES 3,270,306 26% 7%
TOTAL COSMETIC PROCEDURES 3,633,817 26% 6%
Top 5 procedures appear in bold
Please credit the American Society of Plastic Surgeons when citing statistical data or using graphics.
2012 Plastic Surgery Statistics Report
19
All values are projected.***Botulinum toxin type A numbers are of anatomic sites injected.
ASPS procedural statistics represent procedures performed by ASPS Member Surgeons certified by The American Board of Plastic Surgery® as well as other physicians certified by American Board of Medical Specialties-recognized boards. ©ASPS, 2013
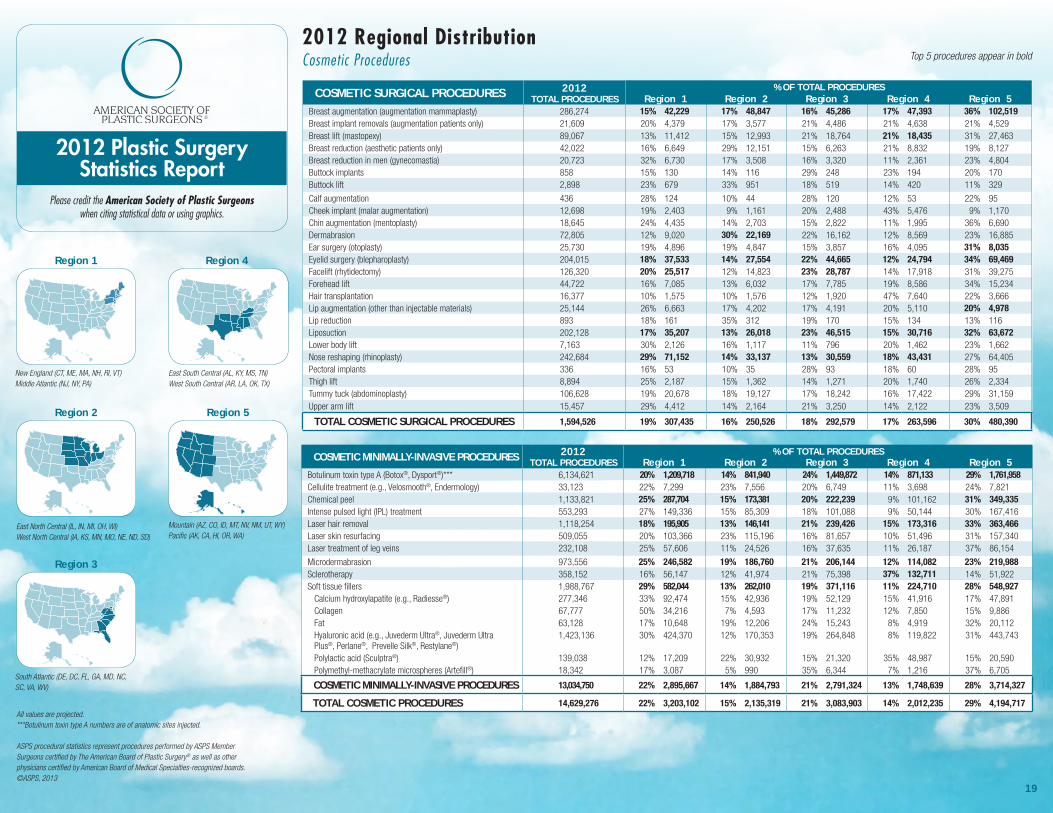
2012 Regional DistributionCosmetic Procedures
Region 1
Region 2 Region 5
Region 3
Region 4
New England (CT, ME, MA, NH, RI, VT)Middle Atlantic (NJ, NY, PA)
East North Central (IL, IN, MI, OH, WI)West North Central (IA, KS, MN, MO, NE, ND, SD)
Mountain (AZ, CO, ID, MT, NV, NM, UT, WY) Pacific (AK, CA, HI, OR, WA)
South Atlantic (DE, DC, FL, GA, MD, NC, SC, VA, WV)
East South Central (AL, KY, MS, TN)West South Central (AR, LA, OK, TX)
COSMETIC SURGICAL PROCEDURES 2012TOTAL PROCEDURES Region 1 Region 2 Region 3 Region 4 Region 5
Breast augmentation (augmentation mammaplasty) 286,274 15% 42,229 17% 48,847 16% 45,286 17% 47,393 36% 102,519Breast implant removals (augmentation patients only) 21,609 20% 4,379 17% 3,577 21% 4,486 21% 4,638 21% 4,529Breast lift (mastopexy) 89,067 13% 11,412 15% 12,993 21% 18,764 21% 18,435 31% 27,463Breast reduction (aesthetic patients only) 42,022 16% 6,649 29% 12,151 15% 6,263 21% 8,832 19% 8,127Breast reduction in men (gynecomastia) 20,723 32% 6,730 17% 3,508 16% 3,320 11% 2,361 23% 4,804Buttock implants 858 15% 130 14% 116 29% 248 23% 194 20% 170Buttock lift 2,898 23% 679 33% 951 18% 519 14% 420 11% 329
Calf augmentation 436 28% 124 10% 44 28% 120 12% 53 22% 95Cheek implant (malar augmentation) 12,698 19% 2,403 9% 1,161 20% 2,488 43% 5,476 9% 1,170Chin augmentation (mentoplasty) 18,645 24% 4,435 14% 2,703 15% 2,822 11% 1,995 36% 6,690Dermabrasion 72,805 12% 9,020 30% 22,169 22% 16,162 12% 8,569 23% 16,885Ear surgery (otoplasty) 25,730 19% 4,896 19% 4,847 15% 3,857 16% 4,095 31% 8,035Eyelid surgery (blepharoplasty) 204,015 18% 37,533 14% 27,554 22% 44,665 12% 24,794 34% 69,469Facelift (rhytidectomy) 126,320 20% 25,517 12% 14,823 23% 28,787 14% 17,918 31% 39,275Forehead lift 44,722 16% 7,085 13% 6,032 17% 7,785 19% 8,586 34% 15,234Hair transplantation 16,377 10% 1,575 10% 1,576 12% 1,920 47% 7,640 22% 3,666Lip augmentation (other than injectable materials) 25,144 26% 6,663 17% 4,202 17% 4,191 20% 5,110 20% 4,978Lip reduction 893 18% 161 35% 312 19% 170 15% 134 13% 116Liposuction 202,128 17% 35,207 13% 26,018 23% 46,515 15% 30,716 32% 63,672Lower body lift 7,163 30% 2,126 16% 1,117 11% 796 20% 1,462 23% 1,662Nose reshaping (rhinoplasty) 242,684 29% 71,152 14% 33,137 13% 30,559 18% 43,431 27% 64,405Pectoral implants 336 16% 53 10% 35 28% 93 18% 60 28% 95Thigh lift 8,894 25% 2,187 15% 1,362 14% 1,271 20% 1,740 26% 2,334Tummy tuck (abdominoplasty) 106,628 19% 20,678 18% 19,127 17% 18,242 16% 17,422 29% 31,159Upper arm lift 15,457 29% 4,412 14% 2,164 21% 3,250 14% 2,122 23% 3,509
TOTAL COSMETIC SURGICAL PROCEDURES 1,594,526 19% 307,435 16% 250,526 18% 292,579 17% 263,596 30% 480,390
COSMETIC MINIMALLY-INVASIVE PROCEDURES 2012TOTAL PROCEDURES Region 1 Region 2 Region 3 Region 4 Region 5
Botulinum toxin type A (Botox®, Dysport®)*** 6,134,621 20% 1,209,718 14% 841,940 24% 1,449,872 14% 871,133 29% 1,761,958Cellulite treatment (e.g., Velosmooth®, Endermology) 33,123 22% 7,299 23% 7,556 20% 6,749 11% 3,698 24% 7,821Chemical peel 1,133,821 25% 287,704 15% 173,381 20% 222,239 9% 101,162 31% 349,335Intense pulsed light (IPL) treatment 553,293 27% 149,336 15% 85,309 18% 101,088 9% 50,144 30% 167,416Laser hair removal 1,118,254 18% 195,905 13% 146,141 21% 239,426 15% 173,316 33% 363,466Laser skin resurfacing 509,055 20% 103,366 23% 115,196 16% 81,657 10% 51,496 31% 157,340Laser treatment of leg veins 232,108 25% 57,606 11% 24,526 16% 37,635 11% 26,187 37% 86,154
Microdermabrasion 973,556 25% 246,582 19% 186,760 21% 206,144 12% 114,082 23% 219,988Sclerotherapy 358,152 16% 56,147 12% 41,974 21% 75,398 37% 132,711 14% 51,922Soft tissue fillers 1,988,767 29% 582,044 13% 262,010 19% 371,116 11% 224,710 28% 548,927 Calcium hydroxylapatite (e.g., Radiesse®) 277,346 33% 92,474 15% 42,936 19% 52,129 15% 41,916 17% 47,891 Collagen 67,777 50% 34,216 7% 4,593 17% 11,232 12% 7,850 15% 9,886 Fat 63,128 17% 10,648 19% 12,206 24% 15,243 8% 4,919 32% 20,112 Hyaluronic acid (e.g., Juvederm Ultra®, Juvederm Ultra Plus®, Perlane®, Prevelle Silk®, Restylane®)
1,423,136 30% 424,370 12% 170,353 19% 264,848 8% 119,822 31% 443,743
Polylactic acid (Sculptra®) 139,038 12% 17,209 22% 30,932 15% 21,320 35% 48,987 15% 20,590 Polymethyl-methacrylate microspheres (Artefill®) 18,342 17% 3,087 5% 990 35% 6,344 7% 1,216 37% 6,705
COSMETIC MINIMALLY-INVASIVE PROCEDURES 13,034,750 22% 2,895,667 14% 1,884,793 21% 2,791,324 13% 1,748,639 28% 3,714,327
TOTAL COSMETIC PROCEDURES 14,629,276 22% 3,203,102 15% 2,135,319 21% 3,083,903 14% 2,012,235 29% 4,194,717
% OF TOTAL PROCEDURES
% OF TOTAL PROCEDURES
Top 5 procedures appear in bold
Please credit the American Society of Plastic Surgeons when citing statistical data or using graphics.
2012 Plastic Surgery Statistics Report
20
ASPS Public RelationsPhone: 847-228-9900Fax: 847-981-5482Email: [email protected] Website: www.plasticsurgery.org
All values are projected.* Data unavailable in prior year.Fees generally vary according to region of country and patient needs.These fees are averages only. Fees do not include anesthesia, operating room facilities or other related expenses.
ASPS procedural statistics represent procedures performed by ASPS Member Surgeons certified by The American Board of Plastic Surgery® as well as other physicians certified by American Board of Medical Specialties-recognized boards. ©ASPS, 2013
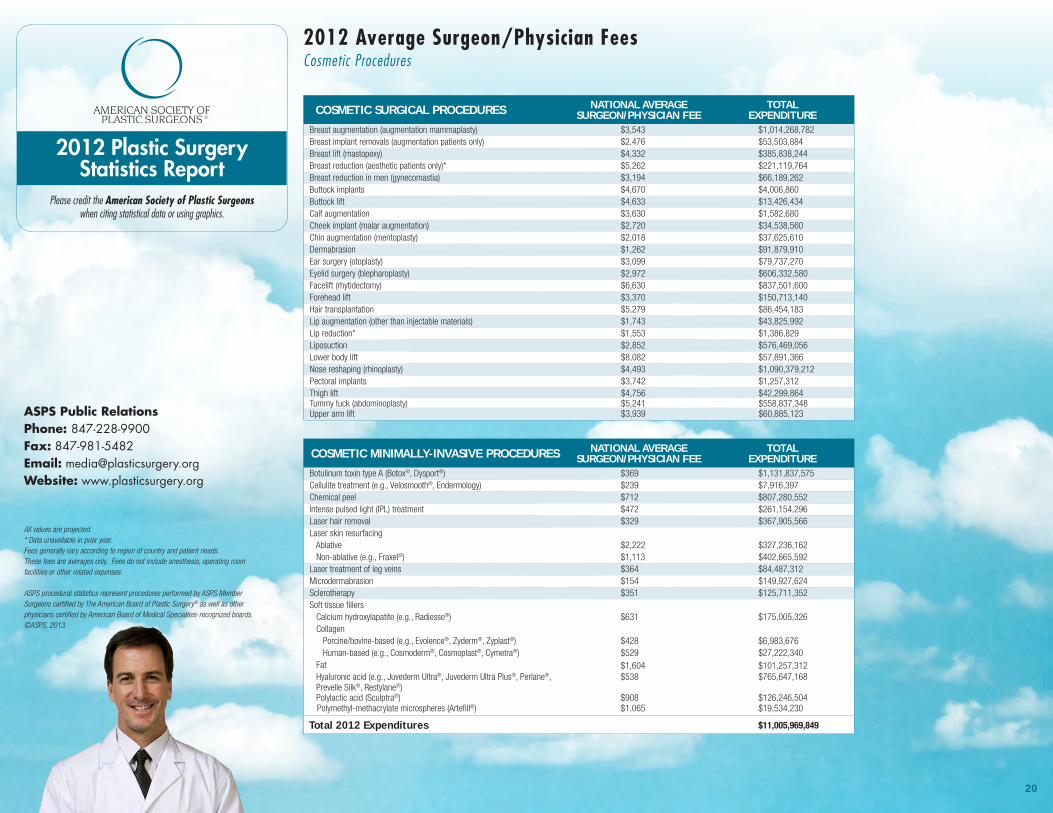
2012 Average Surgeon/Physician FeesCosmetic Procedures
COSMETIC SURGICAL PROCEDURES NATIONAL AVERAGESURGEON/PHYSICIAN FEE
TOTALEXPENDITURE
Breast augmentation (augmentation mammaplasty) $3,543 $1,014,268,782Breast implant removals (augmentation patients only) $2,476 $53,503,884Breast lift (mastopexy) $4,332 $385,838,244Breast reduction (aesthetic patients only)* $5,262 $221,119,764Breast reduction in men (gynecomastia) $3,194 $66,189,262Buttock implants $4,670 $4,006,860Buttock lift $4,633 $13,426,434Calf augmentation $3,630 $1,582,680Cheek implant (malar augmentation) $2,720 $34,538,560Chin augmentation (mentoplasty) $2,018 $37,625,610Dermabrasion $1,262 $91,879,910Ear surgery (otoplasty) $3,099 $79,737,270Eyelid surgery (blepharoplasty) $2,972 $606,332,580Facelift (rhytidectomy) $6,630 $837,501,600Forehead lift $3,370 $150,713,140Hair transplantation $5,279 $86,454,183Lip augmentation (other than injectable materials) $1,743 $43,825,992Lip reduction* $1,553 $1,386,829Liposuction $2,852 $576,469,056Lower body lift $8,082 $57,891,366Nose reshaping (rhinoplasty) $4,493 $1,090,379,212Pectoral implants $3,742 $1,257,312Thigh lift $4,756 $42,299,864Tummy tuck (abdominoplasty) $5,241 $558,837,348Upper arm lift $3,939 $60,885,123
COSMETIC MINIMALLY-INVASIVE PROCEDURES NATIONAL AVERAGESURGEON/PHYSICIAN FEE
TOTALEXPENDITURE
Botulinum toxin type A (Botox®, Dysport®) $369 $1,131,837,575Cellulite treatment (e.g., Velosmooth®, Endermology) $239 $7,916,397Chemical peel $712 $807,280,552Intense pulsed light (IPL) treatment $472 $261,154,296Laser hair removal $329 $367,905,566Laser skin resurfacing Ablative $2,222 $327,236,162 Non-ablative (e.g., Fraxel®) $1,113 $402,665,592Laser treatment of leg veins $364 $84,487,312Microdermabrasion $154 $149,927,624Sclerotherapy $351 $125,711,352Soft tissue fillers Calcium hydroxylapatite (e.g., Radiesse®) $631 $175,005,326 Collagen Porcine/bovine-based (e.g., Evolence®, Zyderm®, Zyplast®) $428 $6,983,676 Human-based (e.g., Cosmoderm®, Cosmoplast®, Cymetra®) $529 $27,222,340 Fat $1,604 $101,257,312 Hyaluronic acid (e.g., Juvederm Ultra®, Juvederm Ultra Plus®, Perlane®,
Prevelle Silk®, Restylane®)$538 $765,647,168
Polylactic acid (Sculptra®) $908 $126,246,504 Polymethyl-methacrylate microspheres (Artefill®) $1,065 $19,534,230
Total 2012 Expenditures $11,005,969,849
Please credit the American Society of Plastic Surgeons when citing statistical data or using graphics.
2012 Plastic Surgery Statistics Report
21
ASPS Public RelationsPhone: 847-228-9900Fax: 847-981-5482Email: [email protected] Website: www.plasticsurgery.org
All values are projected. ASPS procedural statistics represent procedures performed by ASPS Member Surgeons certified by The American Board of Plastic Surgery® as well as other physicians certified by American Board of Medical Specialties-recognized boards. ©ASPS, 2013
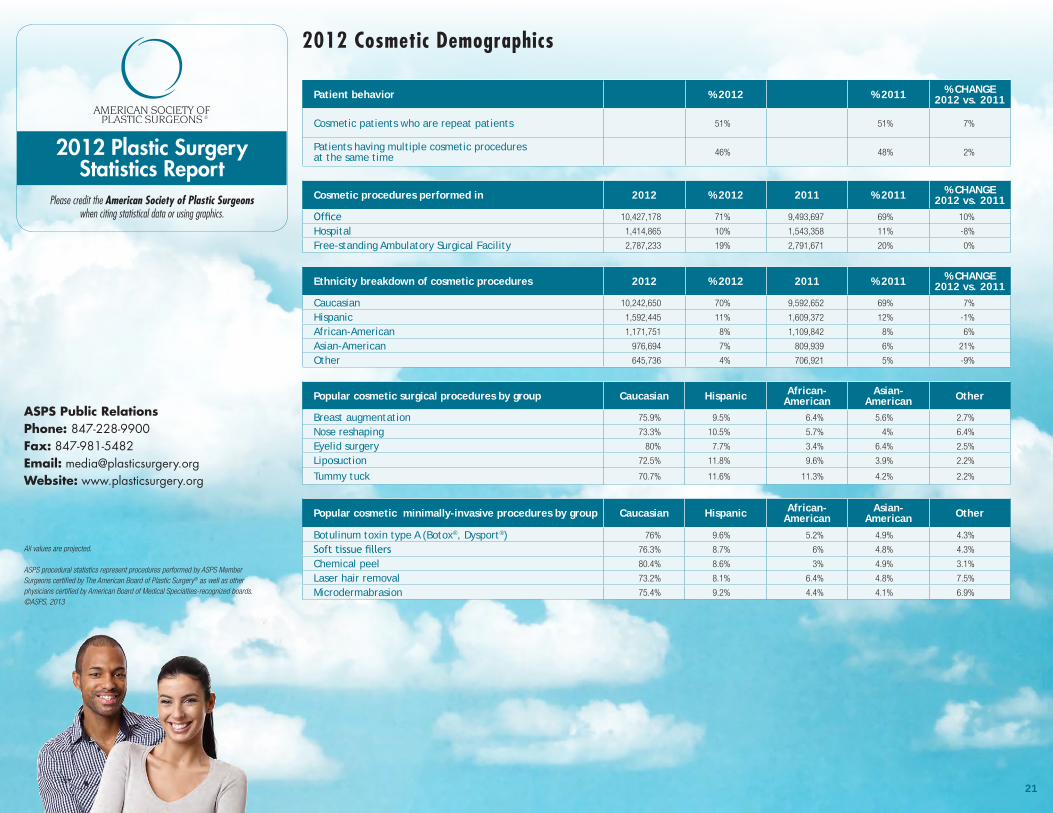
2012 Cosmetic Demographics
Patient behavior % 2012 % 2011 % CHANGE2012 vs. 2011
Cosmetic patients who are repeat patients 51% 51% 7%
Patients having multiple cosmetic proceduresat the same time 46% 48% 2%
Cosmetic procedures performed in 2012 % 2012 2011 % 2011 % CHANGE2012 vs. 2011
Office 10,427,178 71% 9,493,697 69% 10%
Hospital 1,414,865 10% 1,543,358 11% -8%
Free-standing Ambulatory Surgical Facility 2,787,233 19% 2,791,671 20% 0%
Ethnicity breakdown of cosmetic procedures 2012 % 2012 2011 % 2011 % CHANGE2012 vs. 2011
Caucasian 10,242,650 70% 9,592,652 69% 7%
Hispanic 1,592,445 11% 1,609,372 12% -1%
African-American 1,171,751 8% 1,109,842 8% 6%
Asian-American 976,694 7% 809,939 6% 21%
Other 645,736 4% 706,921 5% -9%
Popular cosmetic surgical procedures by group Caucasian Hispanic African- American
Asian- American Other
Breast augmentation 75.9% 9.5% 6.4% 5.6% 2.7%
Nose reshaping 73.3% 10.5% 5.7% 4% 6.4%
Eyelid surgery 80% 7.7% 3.4% 6.4% 2.5%
Liposuction 72.5% 11.8% 9.6% 3.9% 2.2%
Tummy tuck 70.7% 11.6% 11.3% 4.2% 2.2%
Popular cosmetic minimally-invasive procedures by group Caucasian Hispanic African- American
Asian- American Other
Botulinum toxin type A (Botox®, Dysport®) 76% 9.6% 5.2% 4.9% 4.3%
Soft tissue fillers 76.3% 8.7% 6% 4.8% 4.3%
Chemical peel 80.4% 8.6% 3% 4.9% 3.1%
Laser hair removal 73.2% 8.1% 6.4% 4.8% 7.5%
Microdermabrasion 75.4% 9.2% 4.4% 4.1% 6.9%
Please credit the American Society of Plastic Surgeons when citing statistical data or using graphics.
2012 Plastic Surgery Statistics Report
22
ASPS Public RelationsPhone: 847-228-9900Fax: 847-981-5482Email: [email protected] Website: www.plasticsurgery.org
All values are projected. ASPS procedural statistics represent procedures performed by ASPS Member Surgeons certified by The American Board of Plastic Surgery® as well as other physicians certified by American Board of Medical Specialties-recognized boards. ©ASPS, 2013
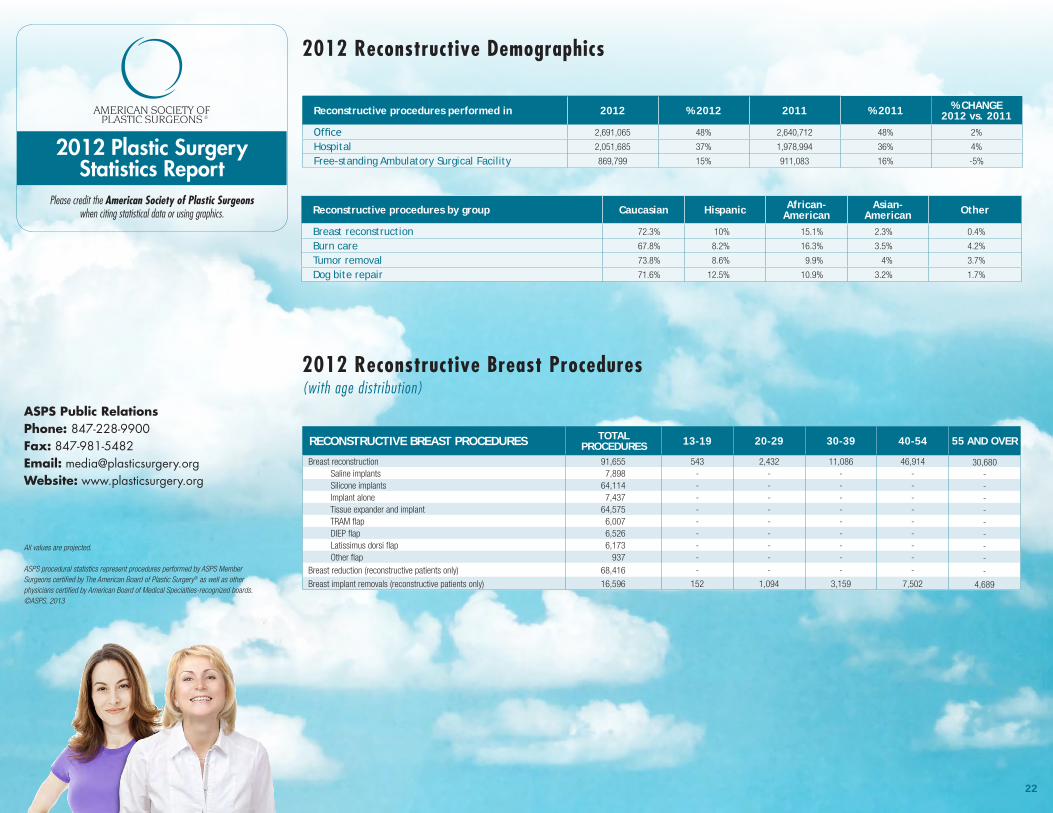
2012 Reconstructive Breast Procedures (with age distribution)
2012 Reconstructive Demographics
Reconstructive procedures performed in 2012 % 2012 2011 % 2011 % CHANGE2012 vs. 2011
Office 2,691,065 48% 2,640,712 48% 2%
Hospital 2,051,685 37% 1,978,994 36% 4%
Free-standing Ambulatory Surgical Facility 869,799 15% 911,083 16% -5%
RECONSTRUCTIVE BREAST PROCEDURES TOTAL PROCEDURES 13-19 20-29 30-39 40-54 55 AND OVER
Breast reconstruction 91,655 543 2,432 11,086 46,914 30,680 Saline implants 7,898 - - - - - Silicone implants 64,114 - - - - - Implant alone 7,437 - - - - - Tissue expander and implant 64,575 - - - - - TRAM flap 6,007 - - - - - DIEP flap 6,526 - - - - - Latissimus dorsi flap 6,173 - - - - - Other flap 937 - - - - -Breast reduction (reconstructive patients only) 68,416 - - - - -Breast implant removals (reconstructive patients only) 16,596 152 1,094 3,159 7,502 4,689
Reconstructive procedures by group Caucasian Hispanic African- American
Asian- American Other
Breast reconstruction 72.3% 10% 15.1% 2.3% 0.4%
Burn care 67.8% 8.2% 16.3% 3.5% 4.2%
Tumor removal 73.8% 8.6% 9.9% 4% 3.7%
Dog bite repair 71.6% 12.5% 10.9% 3.2% 1.7%
Please credit the American Society of Plastic Surgeons when citing statistical data or using graphics.
2012 Plastic Surgery Statistics Report
23
ASPS Public RelationsPhone: 847-228-9900Fax: 847-981-5482Email: [email protected] Website: www.plasticsurgery.org
All figures are projected.
ASPS procedural statistics represent procedures performed by ASPS Member Surgeons certified by The American Board of Plastic Surgery® as well as other physicians certified by American Board of Medical Specialties-recognized boards. ©ASPS, 2013
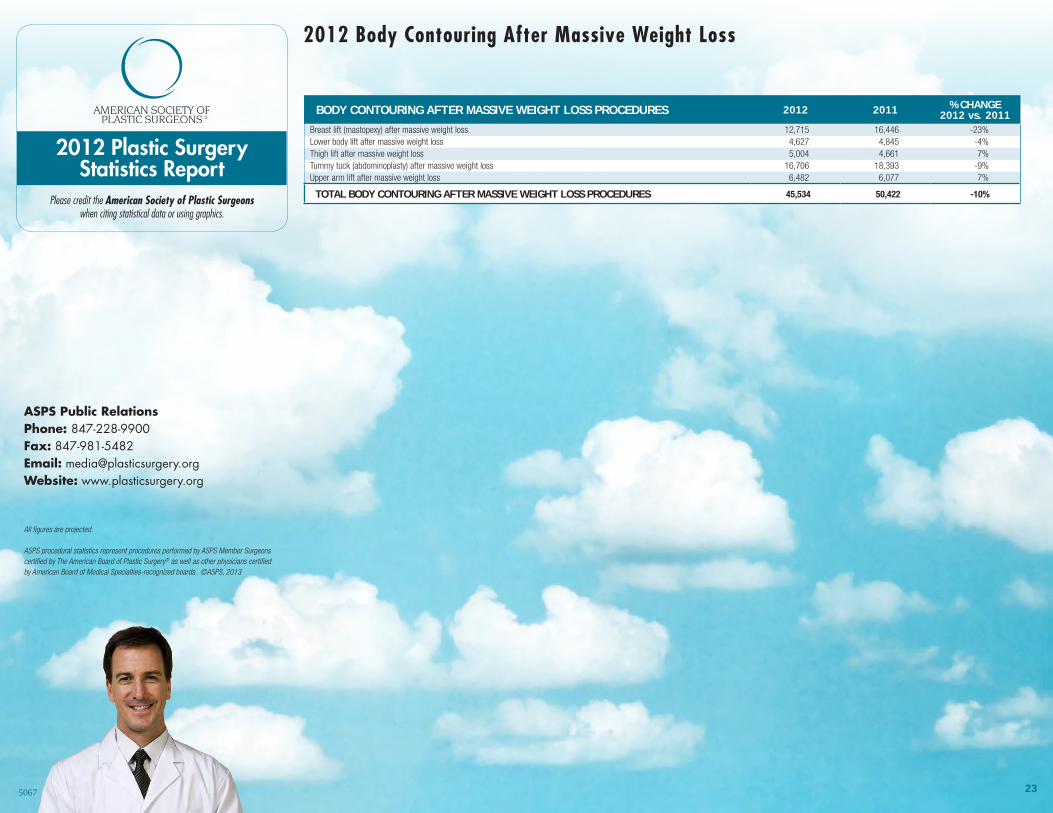
BODY CONTOURING AFTER MASSIVE WEIGHT LOSS PROCEDURES 2012 2011 % CHANGE2012 vs. 2011
Breast lift (mastopexy) after massive weight loss 12,715 16,446 -23%Lower body lift after massive weight loss 4,627 4,845 -4%Thigh lift after massive weight loss 5,004 4,661 7%Tummy tuck (abdominoplasty) after massive weight loss 16,706 18,393 -9%Upper arm lift after massive weight loss 6,482 6,077 7%
TOTAL BODY CONTOURING AFTER MASSIVE WEIGHT LOSS PROCEDURES 45,534 50,422 -10%
2012 Body Contouring After Massive Weight Loss
5067