2012 Global Cities Index and Emerging Cities Outlook · 2012 Global Cities Index and Emerging...
12
2012 Global Cities Index and Emerging Cities Outlook New York, London, Paris, and Tokyo remain today’s leading cities, but an analysis of key trends in emerging cities suggests that Beijing and Shanghai may rival them in 10 to 20 years.
Transcript of 2012 Global Cities Index and Emerging Cities Outlook · 2012 Global Cities Index and Emerging...
12012 Global Cities Index and Emerging Cities Outlook
2012 Global Cities Index and Emerging Cities OutlookNew York, London, Paris, and Tokyo remain today’s leading cities, but an analysis of key trends in emerging cities suggests that Beijing and Shanghai may rival them in 10 to 20 years.
22012 Global Cities Index and Emerging Cities Outlook
Macro forces continue to have an impact on the global influence of cities. Political power is rotating back from West to East, and with economic drivers having shifted from agrarian to industrial to information-based, more people live in cities than in rural areas. While New York, London, Paris, and Tokyo still rank among today’s top cities, it appears that Beijing and Shanghai may become significant rivals in the next 10 to 20 years.
These are among the highlights of the 2012 Global Cities Index (GCI), a joint study performed by A.T. Kearney and The Chicago Council on Global Affairs. In addition, a panel of academic and corporate executive advisors informed and challenged the study results. We've expanded this year's study; in addition to classifying the current global influence of 66 cities, we have also developed an Emerging Cities Outlook (ECO) to project which emerging-market cities may eventually rival the established global leaders for dominance.
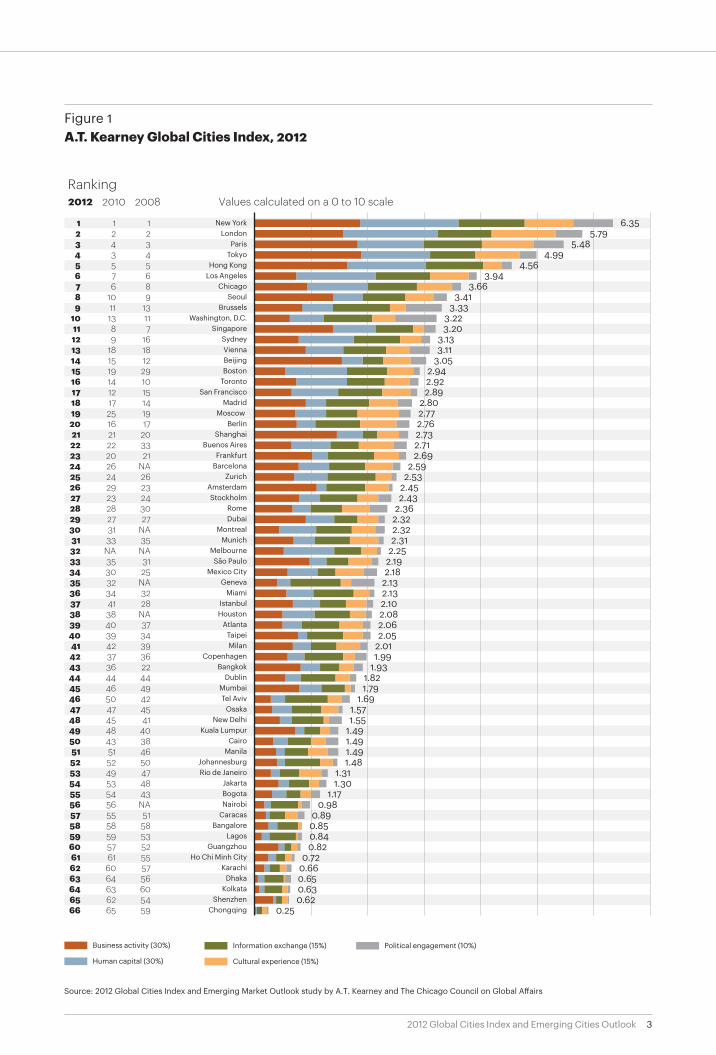
Figure 1 on page 3 summarizes the 2012 results, along with the rankings from our 2008 and 2010 findings of major world metropolitan areas. (The censorship metric added in 2010 affected the positions of several emerging-market cities.) In the first section of this report, we explore the results and implications of the 2012 GCI rankings. The second section summarizes the results of our Emerging Cities Outlook, which analyzes the strengths and weaknesses of cities in devel-oping markets by examining the rates of change and key factors that will affect their ability to capitalize on future globalization trends (see Appendix: About the Study on page 10).
Insights from the Global Cities IndexThe Global Cities Index, first released in 2008 and again in 2010, is unique in that it measures global engagement of cities across five dimensions: business activity, human capital, information exchange, cultural experience, and political engagement. The GCI ranking is a much more comprehensive measurement of a city’s global influence versus other rankings that usually focus only on business. Analyzing the results of this year’s study, and comparing them to previous years, offers the following insights:
Stable at the top, volatile in the middle. Despite the financial turmoil of the past few years, New York and London have consistently led the rankings in all three editions of the Global Cities Index. Paris and Tokyo, although they alternate positions this year, are always far above the rest of the top 10, while changes in ranking among cities in the middle section of the GCI are more volatile—primarily because of the proximity of these cities’ scores. This year, for example, we see Boston (15) rising four places and San Francisco (17) falling five places, although the changes in their absolute scores are not as dramatic. Likewise, although Brussels and
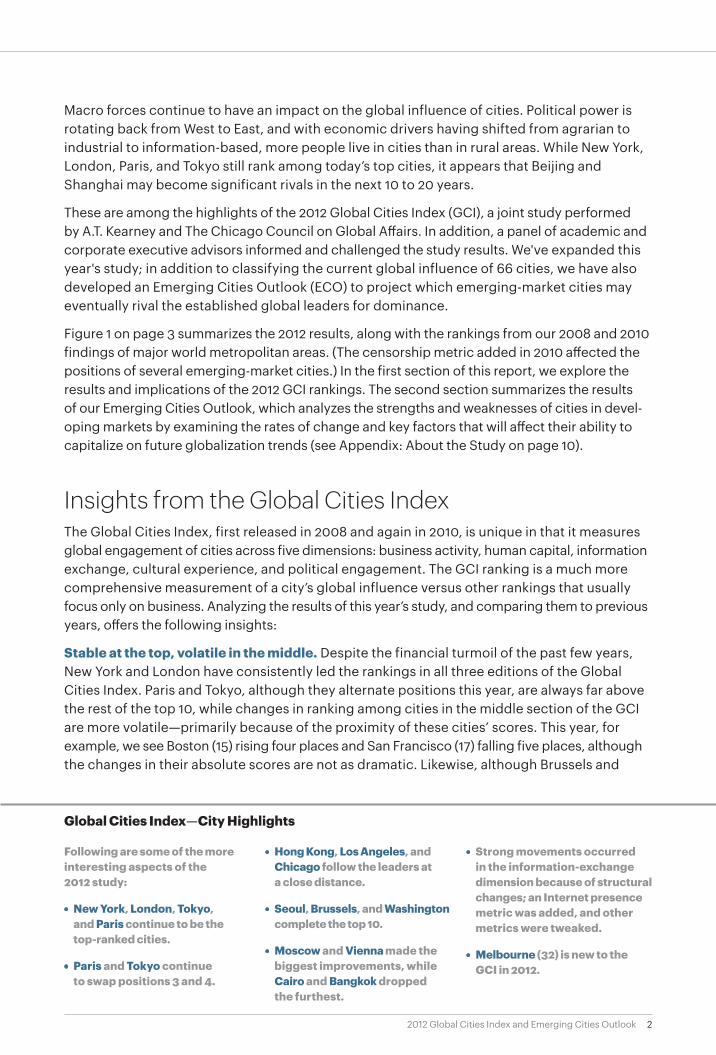
Global Cities Index—City Highlights
Following are some of the more interesting aspects of the 2012 study:
• New York, London, Tokyo, and Paris continue to be the top-ranked cities.
• Paris and Tokyo continue to swap positions 3 and 4.
• Hong Kong, Los Angeles, and Chicago follow the leaders at a close distance.
• Seoul, Brussels, and Washington complete the top 10.
• Moscow and Vienna made the biggest improvements, while Cairo and Bangkok dropped the furthest.
• Strong movements occurred in the information-exchange dimension because of structural changes; an Internet presence metric was added, and other metrics were tweaked.
• Melbourne (32) is new to the GCI in 2012.
32012 Global Cities Index and Emerging Cities Outlook
New YorkLondon
ParisTokyo
Hong KongLos Angeles
ChicagoSeoul
BrusselsWashington, D.C.
SingaporeSydneyViennaBeijingBoston
TorontoSan Francisco
MadridMoscow
BerlinShanghai
Buenos AiresFrankfurt
BarcelonaZurich
AmsterdamStockholm
RomeDubai
MontrealMunich
MelbourneSão Paulo
Mexico CityGeneva
MiamiIstanbulHouston
AtlantaTaipeiMilan
CopenhagenBangkok
DublinMumbaiTel Aviv
OsakaNew Delhi
Kuala LumpurCairo
ManilaJohannesburgRio de Janeiro
JakartaBogotaNairobi
CaracasBangalore
LagosGuangzhou
Ho Chi Minh CityKarachi
DhakaKolkata
ShenzhenChongqing
Values calculated on a 0 to 10 scale
Business activity (30%)
Human capital (30%)
Information exchange (15%) Political engagement (10%)
Cultural experience (15%)
Source: 2012 Global Cities Index and Emerging Market Outlook study by A.T. Kearney and The Chicago Council on Global A�airs
Ranking
NA
NA
NA
NA
NA
NA
NA
2010 2008
0.65
42012 Global Cities Index and Emerging Cities Outlook
Washington replace Sydney and Singapore as top 10 cities, their absolute scores remain quite close as shown in figure 1.
Asia is here to stay. All editions of the Global Cities Index have featured at least three Asian cities in the top 10, demonstrating the stability of Asia’s relevance on the world stage. In addition to Tokyo, other Asian cities, including Hong Kong, Seoul, Singapore, Beijing, and Shanghai, represent up-and-coming metroplexes that will further accentuate the ascendance of Asian cities.
Germany: distributed leadership. As a country, Germany is a strong economic performer and the only European country with three cities ranking in the top half of the Index. On the other hand, no German city has ever been ranked among the top 10 global cities. One of the linchpins of the Global Cities Index has been the notion that globalization represents a transfer of power from national states to a network of global cities. The world today is more about cities than countries, and a place like Seoul has more in common with Singapore and Hong Kong than it does with smaller Korean cities (see sidebar: Relational City Thinking). In this model, Germany is an exception, in that Berlin (20), Frankfurt (23), and Munich (31) represent a network that should drive continued national success.
Relational City Thinking by Peter Taylor
After measuring the impor- tance of global cities, the next objective is to consider their interrelationships. A city’s very raison d’être is its link to the world economy, particularly in making connections with other global cities. We see this when NYLON (New York-London) is used to evoke the strong eco- nomic relationships between the world’s two leading cities. And although we’ve yet to see references to PARFRANK (Paris-Frankfort), LATOK (Los Angeles-Tokyo), or HONGSING (Hong Kong-Singapore), we cannot wait for language to catch up before we take relational city thinking forward.
An example will help illustrate the vital contributions cities make to the world economy. In this regard, we move on from city dyads to strategic city triads. The development of contemporary globalization has been based on the creation of two city triads relating global cities to leading states. The initial impetus toward
economic globalization was built on a New York-Washington-London triad, with each city having a distinct role. New York was the leading financial center, Washington the leading political center (including governance of political finance via the International Monetary Fund and World Bank), and London the global platform outside U.S. jurisdiction. The latter allowed for certain processes that could not take place within the leading state, notably the creation of a euro-dollar market in London as among the first steps toward globalization.
The latest impetus in the contin-uing rise of globalization is based on a very similar strategic Shanghai-Beijing-Hong Kong triad. Shanghai is the fastest growing financial center, and Beijing is the fastest growing political center, including governance of political finance (in this case, the state banks). Both cities are within the juris-diction of the fastest growing
major state. Hong Kong remains outside China’s direct jurisdiction and has the role of being the fastest growing global platform. Again, the location allows for certain processes that cannot occur within the state, which is the reason for China’s “one country, two systems” policy and why Hong Kong has continued to prosper since 1997.
This city triad may well signify a possible new China stage in reproducing globalization. Whatever the future holds, the parallel between these two city triads suggests a necessary underlying structure that could only be recognized using relational city thinking.
Peter Taylor is the director of globalization and a World Cities professor at Northumbria University and professor emeritus at Loughborough University.
52012 Global Cities Index and Emerging Cities Outlook
BRIC means business. Cities in the BRIC countries—Brazil, Russia, India, and China—are working their way to the top of the rankings at varying paces. However, when only business activity is considered, the top BRIC cities are clearly on the rise. For example, Beijing (6) and Shanghai (7) both rank among the top 10 for business activity, while Mumbai (19) shows the greatest business activity improvement among the top 35 cities, jumping 11 positions. This rise is neither sudden nor surprising as BRIC cities also performed well in the business activity category in previous studies. Rather, it demonstrates a compelling trend: BRIC cities are on the rise because of their strength in business activity rather than other dimensions that make for a well-rounded global city, such as culture, human capital, and political activity. It’s not hard to imagine that this strong performance in business activity will motivate future development in the other dimensions.
The world today is more about cities than countries, and a place like Seoul has more in common with Singapore and Hong Kong than with smaller Korean cities. Information is flat, politics concentrated. Of all the dimensions that drive differences among cities, there is less variance in information exchange and more in political activity. The gap between top cities and average ones in information exchange is relatively small as access to broadband and TV news, the presence of news bureaus, and lack of censorship are distributed fairly evenly around many global cities. The often heard statement that technology makes the world flat appears to be true. (The Appendix on page 10 indicates how we updated this metric for 2012.) On the other hand, the biggest gap between top and average cities comes in the political activity dimension, where just a few cities, chiefly—and not surprisingly— Washington, New York, and Brussels corral the majority of world action in international organizations, embassies, think tanks, and conferences.
The Emerging Cities OutlookAs global economies and societies become increasingly integrated, emerging cities have an unprecedented opportunity to rise in power and influence. Some up-and-coming cities are likely to take advantage of developments in communications and technology, and the increasing mobility of people and capital, to move quickly toward the top. Others may struggle.
Which ones will head in which direction? To seek answers, in this year’s study we developed a new analysis for emerging cities. The Emerging Cities Outlook gauges each city’s rate of change by measuring factors that will affect the future of two dimensions in our rankings: business activity and human capital. We focus on these two dimensions because we believe they will drive a city’s capacity to attract, retain, and generate the global flow of ideas, capital, and people. We look at the rate of change because it can be an indicator of future movement rather than current status. And we capture that change using factors that reflect both strengths and vulnerabilities.
62012 Global Cities Index and Emerging Cities Outlook
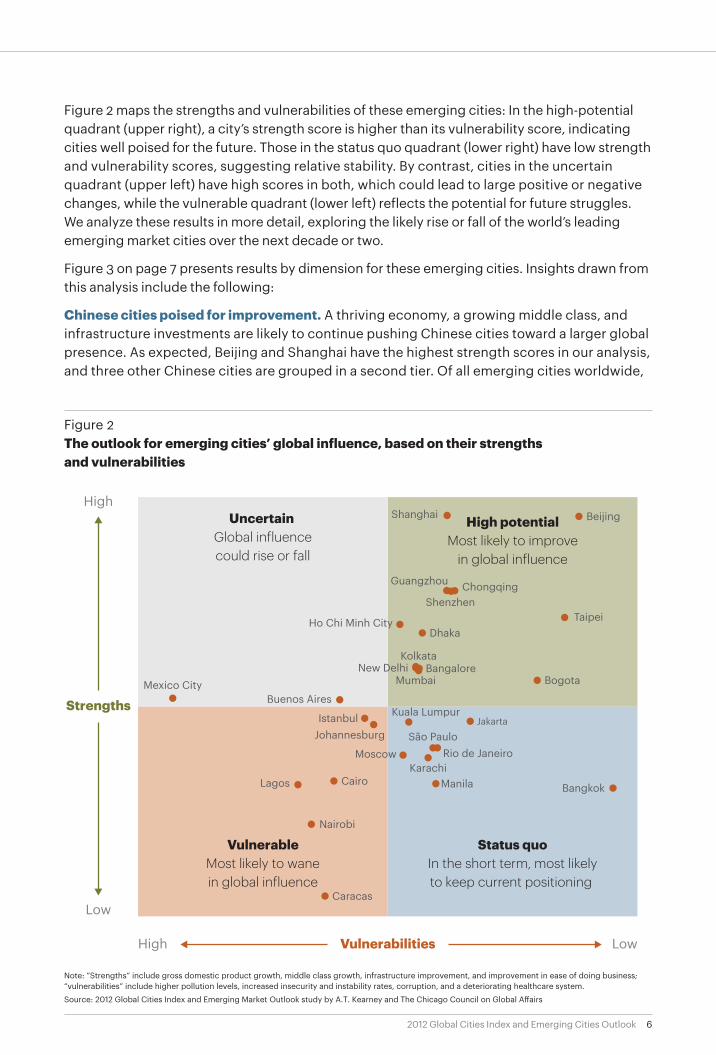
Figure 2 maps the strengths and vulnerabilities of these emerging cities: In the high-potential quadrant (upper right), a city’s strength score is higher than its vulnerability score, indicating cities well poised for the future. Those in the status quo quadrant (lower right) have low strength and vulnerability scores, suggesting relative stability. By contrast, cities in the uncertain quadrant (upper left) have high scores in both, which could lead to large positive or negative changes, while the vulnerable quadrant (lower left) reflects the potential for future struggles. We analyze these results in more detail, exploring the likely rise or fall of the world’s leading emerging market cities over the next decade or two.
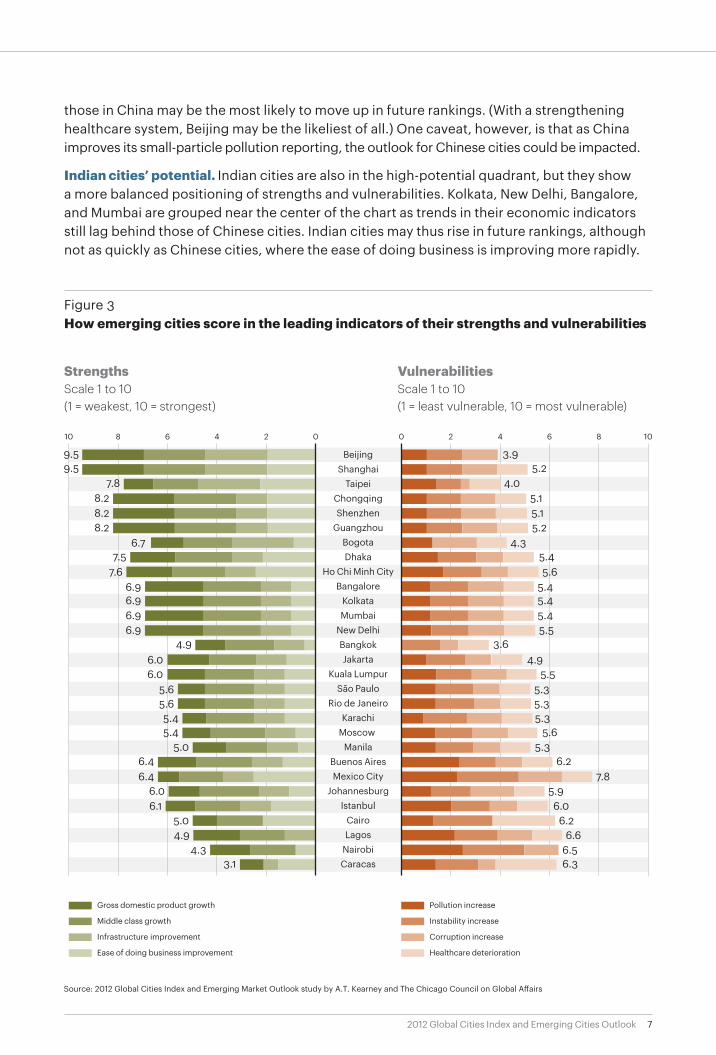
Figure 3 on page 7 presents results by dimension for these emerging cities. Insights drawn from this analysis include the following:
Chinese cities poised for improvement. A thriving economy, a growing middle class, and infrastructure investments are likely to continue pushing Chinese cities toward a larger global presence. As expected, Beijing and Shanghai have the highest strength scores in our analysis, and three other Chinese cities are grouped in a second tier. Of all emerging cities worldwide,
Note: “Strengths” include gross domestic product growth, middle class growth, infrastructure improvement, and improvement in ease of doing business; “vulnerabilities” include higher pollution levels, increased insecurity and instability rates, corruption, and a deteriorating healthcare system.
Source: 2012 Global Cities Index and Emerging Market Outlook study by A.T. Kearney and The Chicago Council on Global A�airs
and vulnerabilities
High potentialMost likely to improve
in global influence
Status quoIn the short term, most likelyto keep current positioning
VulnerableMost likely to wanein global influence
Strengths
Vulnerabilities
High
Low
High Low
Uncertain Global influencecould rise or fall
Mexico City
Shanghai Beijing
Taipei
ChongqingShenzhen
Guangzhou
Ho Chi Minh CityDhaka
JakartaKuala Lumpur
Bogota
BangkokManila
Rio de JaneiroSão Paulo
Karachi
KolkataNew Delhi Bangalore
Mumbai
Cairo
Moscow
Buenos Aires
IstanbulJohannesburg
Nairobi
Lagos
Caracas
72012 Global Cities Index and Emerging Cities Outlook
How emerging cities score in the leading indicators of their strengths and vulnerabilities
BeijingShanghai
TaipeiChongqingShenzhen
GuangzhouBogotaDhaka
Ho Chi Minh CityBangalore
KolkataMumbai
New DelhiBangkokJakarta
Kuala LumpurSão Paulo
Rio de JaneiroKarachi
Moscow Manila
Buenos AiresMexico City
JohannesburgIstanbul
CairoLagos
NairobiCaracas
1086420
Gross domestic product growth
Middle class growth
Infrastructure improvement
Ease of doing business improvement
Source: 2012 Global Cities Index and Emerging Market Outlook study by A.T. Kearney and The Chicago Council on Global A�airs
Pollution increase
Instability increase
Corruption increase
Healthcare deterioration
Strengths Scale 1 to 10(1 = weakest, 10 = strongest)
Vulnerabilities Scale 1 to 10(1 = least vulnerable, 10 = most vulnerable)
10 8 6 4 2 0
those in China may be the most likely to move up in future rankings. (With a strengthening healthcare system, Beijing may be the likeliest of all.) One caveat, however, is that as China improves its small-particle pollution reporting, the outlook for Chinese cities could be impacted.
Indian cities’ potential. Indian cities are also in the high-potential quadrant, but they show a more balanced positioning of strengths and vulnerabilities. Kolkata, New Delhi, Bangalore, and Mumbai are grouped near the center of the chart as trends in their economic indicators still lag behind those of Chinese cities. Indian cities may thus rise in future rankings, although not as quickly as Chinese cities, where the ease of doing business is improving more rapidly.
82012 Global Cities Index and Emerging Cities Outlook
Beyond State-to-State Geopolitics: Urban Vectors Dominate By Saskia Sassen
What has become clear over the past few decades with the rise of global cities is that our geo- political future is not going to be determined by the G2 combo of the United States and China.1 It will be determined in good part through 20 or so strategic worldwide urban networks.
This future is partly shaped by the firm-to-firm aspects of our global economy that thrives on the specialized differences of global cities.2 In other words, there is no perfect global city because different companies prefer different networks of cities. It also explains why there are so many more global cities today.
A second trend is the emergence of geopolitical urban vectors that are becoming a sort of infrastructure for the global economy, which is increasingly not about state-to-state trans-actions, but rather about urban axes that bring together key cities. This holds even in the case of U.S.-China relations that are dominated by hard politics. While some of these urban vectors are mostly economic, the major networks—those shaping the next phase—are also geopolitical. Much of global politics is increasingly also economic, and much of the global economy runs through cities.
The following will be the most significant urban vectors in the next decade:
• Washington, New York, and Chicago. These cities are becoming more important geopolitically than the United States is as a country.
•Beijing, Hong Kong, and Shanghai. Beijing is the center of power, but Hong Kong’s geo- political role is critical; Shanghai is above all the leading national industrial and financial center.
• Berlin and Frankfurt. As an axis, Berlin and Frankfurt time and again emerge as the bulwark for the European Union. If not for the EU, these cities would not be as significant geopolitically.
• Istanbul and Ankara. Istanbul has long been described as the hinge between West and East, with a rich imperial culture and deep knowledge about how to govern such intersections. In combination with Ankara, it is rapidly becoming a major global policy nexus.
• São Paulo, Rio de Janeiro, and Brasilia. These cities form the new politico-economic heavy-weight axis next to now-estab-lished China. Brazil’s devel-opment bank is richer than the World Bank, and its economic power is large and ascendant.
• Cairo and Beirut. These cities rearticulate what the Middle East means as a region. Beirut has long and well established politico-economic networks worldwide; Cairo has the multitudes and a history of empire.
• Geneva, Vienna, and Nairobi. Finally, a step into what has not yet happened but might arrive sooner than we expect: a global environmental and social agenda rising from the current economic paralysis and financial excess. These cities have the critical mass and mix of institutions long devoted to social questions and justice for the powerless, with Nairobi’s habitat increasingly important in a rapidly urbanizing world and a powerful new leadership. All three cities—long over-shadowed by global finance and mega-militaries—could emerge as crucial actors in making a global commons, which will be important for the global economy.
Saskia Sassen, Columbia Univer- sity, is the author of Cities in a World Economy and The Global City. In addition, she was named among Foreign Policy’s top global thinkers of 2011.
1 The Group of Two (G2) is a proposed informal geopolitical union between the United States and China.2 Saskia Sassen, Cities in a World Economy, 4th ed.: Sage Publications, 2012.
92012 Global Cities Index and Emerging Cities Outlook
African cities will struggle to gain global presence. Weak economic development and significant vulnerabilities are likely impediments to African cities that seek relevance on the global stage. Nairobi and Lagos are among the most vulnerable cities in our analysis. A growing middle class gives Johannesburg a comparatively better position, placing it closer to the center of the quadrants in figure 2.
Latin America: cities in all quadrants. Thanks to improvements in infrastructure and reductions in instability and corruption, Bogota, Colombia, is the one non-Asian city in the high-potential quadrant. However, other Latin American cities seem likely to exhibit different future behaviors. For example, Brazil’s São Paulo and Rio de Janeiro appear poised to maintain their global positioning, with balanced opportunities and risks. Caracas, Venezuela, with its economic problems, increasing instability and corruption, and deteriorating healthcare system, occupies a more vulnerable position.
In general, these analyses reflect broad social and demographic trends, as people migrate from rural to urban settings and from agrarian to industrial and information-based economies. The results further reflect the extent to which these trends are accelerating outside Europe and North America, where they began decades ago.
In the sidebar on page 8, Beyond State-to-State Geopolitics: Urban Vectors Dominate, author Saskia Sassen outlines which cities—urban vectors—will shape our discussions in the next 10 to 20 years.
Opportunities and Risks AboundGlobalization presents new opportunities and risks to cities and businesses everywhere. As the third iteration of our Global Cities Index reveals, the opportunities and risks are not static. Globalization affected how the world has developed in the past decade or two, and our Emerging Cities Outlook analysis indicates that these forces will continue to have an impact well into the future with implications for a range of international business development opportunities.
Indeed, members of a panel of corporate executives who helped in the development of the Index and the Outlook mentioned ways both could be used to inform their decision making, including (1) determining locations for regional headquarters and (2) finding and retaining the best talent by locating operations in the top global cities. One panel member noted how well the combination of the Index and the Outlook matched his company’s global expansion plans. Clearly, successful cities will be those that stay on top of changes in the many dimensions that constitute global leadership.
Authors
Mike Hales, partner, Chicago [email protected]
Andres Mendoza Pena, principal, Chicago [email protected]
102012 Global Cities Index and Emerging Cities Outlook
Appendix: About the StudyFollowing are the methodologies used for the 2012 Global Cities Index (GCI) and the Emerging Cities Outlook.
Global Cities Index
A.T. Kearney’s Global Cities Index ranks metropolitan areas according to 25 metrics across five dimensions:
• Business activity is measured by headquarters of major global corporations, locations of top business services firms, the value of a city’s capital markets, the number of international conferences, and the flow of goods through ports and airports (weighting: 30 percent).
• Human capital evaluates a city’s ability to attract talent based on the following measures: size of foreign-born population, quality of universities, number of international schools, international student population, and number of residents with university degrees (weighting: 30 percent).
• Information exchange examines how well news and information circulate within and outside the city. This dimension has been reconfigured this year to include two new metrics: accessi-bility to major TV news channels (replacing international coverage in major local newspapers) and Internet presence (capturing the robustness of results when searching for the city name in major languages). A third metric, number of international news bureaus, has been broadened to include 10 major TV networks. The final two metrics— level of censorship and broadband subscriber rate—are unchanged (weighting: 15 percent).
• Cultural experience measures diverse attractions, including number of major sporting events a city hosts; number of museums, performing-arts venues, and diverse culinary establishments; number of international travelers; and number of sister-city relationships (weighting: 15 percent).
• Political engagement reviews how a city influences global policy dialogue as measured by number of embassies and consulates, major think tanks, international organizations and local institutions with international reach that reside in the city, and the number of political conferences a city hosts (weighting: 10 percent).
As a compendium of analyses published in 2011, the 2012 GCI may represent data as far back as 2010. Thus, today’s current events, such as instability in the European Union, can be expected to show up in our next set of rankings. A panel of academic experts and corporate executives informed and tested the global rankings.
Emerging Cities Outlook
The Emerging Cities Outlook measures a city’s rate of change determined by evaluating eight leading indicators grouped into strengths and vulnerabilities for cities in countries that the World Bank classifies as medium or low income. These indicators are most likely to influence a city’s capacity to attract, retain, and generate flows of ideas, capital, and people.
• Strengths are measured by trends in the first four indicators: infrastructure, the country’s ease of doing business, gross domestic product (GDP), and middle-class growth.
112012 Global Cities Index and Emerging Cities Outlook
• Vulnerabilities are determined by trends in the remaining four indicators: instability, the country’s healthcare systems, corruption, and pollution levels. Our source for the pollution trend determines the measure based on large particles (particulate matter smaller than about 10 micrometers, or PM10). As the Chinese government starts measuring smaller particles (smaller than 2.5 micrometers, or PM2.5), which most observers consider more relevant, such data will be incorporated into future analyses. Also, while the current Outlook is based on both city- and country-level data, over time we expect to refine our sources to focus primarily on city-level data.
A.T. Kearney is a global team of forward-thinking, collaborative partners that delivers immediate, meaningful results and long-term transformative advantage to clients. Since 1926, we have been trusted advisors on CEO-agenda issues to the world’s leading organizations across all major industries and sectors. A.T. Kearney’s offices are located in major business centers in 39 countries.
Americas
Europe
Asia Pacific
Middle East and Africa
AtlantaCalgary ChicagoDallas
DetroitHoustonMexico CityNew York
San FranciscoSão PauloTorontoWashington, D.C.
BangkokBeijingHong KongJakartaKuala Lumpur
MelbourneMumbaiNew DelhiSeoulShanghai
SingaporeSydneyTokyo
AmsterdamBerlinBrusselsBucharestBudapestCopenhagenDüsseldorfFrankfurtHelsinki
IstanbulKievLisbonLjubljanaLondonMadridMilanMoscowMunich
OsloParisPragueRomeStockholmStuttgartViennaWarsawZurich
Abu DhabiDubai
JohannesburgManama
Riyadh
A.T. Kearney Korea LLC is a separate and independent legal entity operating under the A.T. Kearney name in Korea.
© 2012, A.T. Kearney, Inc. All rights reserved.
The signature of our namesake and founder, Andrew Thomas Kearney, on the cover of this document represents our pledge to live the values he instilled in our firm and uphold his commitment to ensuring “essential rightness” in all that we do.
For more information, permission to reprint or translate this work, and all other correspondence, please email: [email protected].