2012 Georgia Diabetes Burden Report: An Overview
24
2012 Georgia Diabetes Burden Report: An Overview
-
Upload
duongthien -
Category
Documents
-
view
214 -
download
1
Transcript of 2012 Georgia Diabetes Burden Report: An Overview

DIABETES, Age, Race, Hyper-tension, Education, Income, Insurance, Disability, Costly, SERIOUS, Healthy, choices, food, risk, gestational, women, men, history, weight, family, insulin, sugar, mellitus, glucose, GEORGIA, EXERCISE
2012 Georgia Diabetes Burden Report:An Overview

Background
Diabetes and its complications are serious medical conditions disproportionately affecting vulnerable population groups including: aging (elderly) adults, medically underserved, pregnant women and persons of various ethnic backgrounds.1,2 In Georgia, diabetes impacts both sexes and crosses cultural, sociodemographic and geographic boundaries.

3
Diabetes Affects Georgians
In Georgia, diabetes impacts both sexes and crosses cultural and geographic boundaries.
Diabetes
Diabetes mellitus (also known as Diabetes) is a medical condition characterized by the presence of high blood glucose (blood sugar) levels in the body.1 It is one of the most common chronic diseases in Georgia and the United States.1
Prediabetes (also known as Borderline Diabetes)
Prediabetes is a medical condition whereby individuals have blood glucose levels higher than normal but not high enough to be classified as diabetes.1 Adults with prediabetes have an increased risk of developing Type 2 diabetes, heart disease, and stroke.1

4
Risk Factors for Diabetes
Genetic and lifestyle factors contribute to the development of diabetes. Risk factors for Type 2 Diabetes include1: • being 45 years of age or older• family history of diabetes • history of gestational diabetes mellitus (GDM) • history of pre-diabetes • overweight or obese status • physical inactivity• hypertension (blood pressure value of 140/90 or greater)• high or abnormal cholesterol (triglyceride level 250 or higher or high density lipoprotein (HDL) value of 35 or lower)• certain race/ethnic groups: Black, Non-Hispanic Hispanic Asian, Non-Hispanic
Native Hawaiian or other Pacific Islander, Non-Hispanic American Indian/Alaska Native, Non-Hispanic

5
Diabetes Prevalence in Georgia
In 2010, using the Behavioral Risk Factor Surveillance System survey, the prevalence of diabetes among Georgia adults was 9.7% (703,289 adults), which is similar to the national adult diabetes prevalence of 9.2%.3
Between 2000 and 2010, diabetes prevalence among Georgia adults increased significantly by 43 percent from 6.8% (395,808 adults) in 2000 to 9.7% (712,203 adults) in 2010(Figure 1).3
Figure 1. Prevalence of Diabetes among Georgia Adults by Year, 2000-2010Data Source: Behavioral Risk Factor Surveillance System (2000-2010)
Table 1. Prevalence of Diabetes among Georgia Adults, 2010
*Estimate is derived from the Centers for Disease Control and Prevention’s Diagnosed and Undiagnosed Diabetes prevalence for adults 20 years of age and older only. For more information, see http://www.cdc.gov/diabetes/pubs/pdf/ndfs_2011.pdf ~Estimate derived from 2010 Birth Certificate DataData Source: Behavioral Risk Factor Surveillance System (2010)
Diabetes Condition Prevalence Estimated Population
Diagnosed Diabetes 9.7% 703,289
Undiagnosed Diabetes* 6.5% 461,293
Prediabetes (Borderline Diabetes)
1.1% 79,720
Gestational Diabetes~ 3.0% 3,782
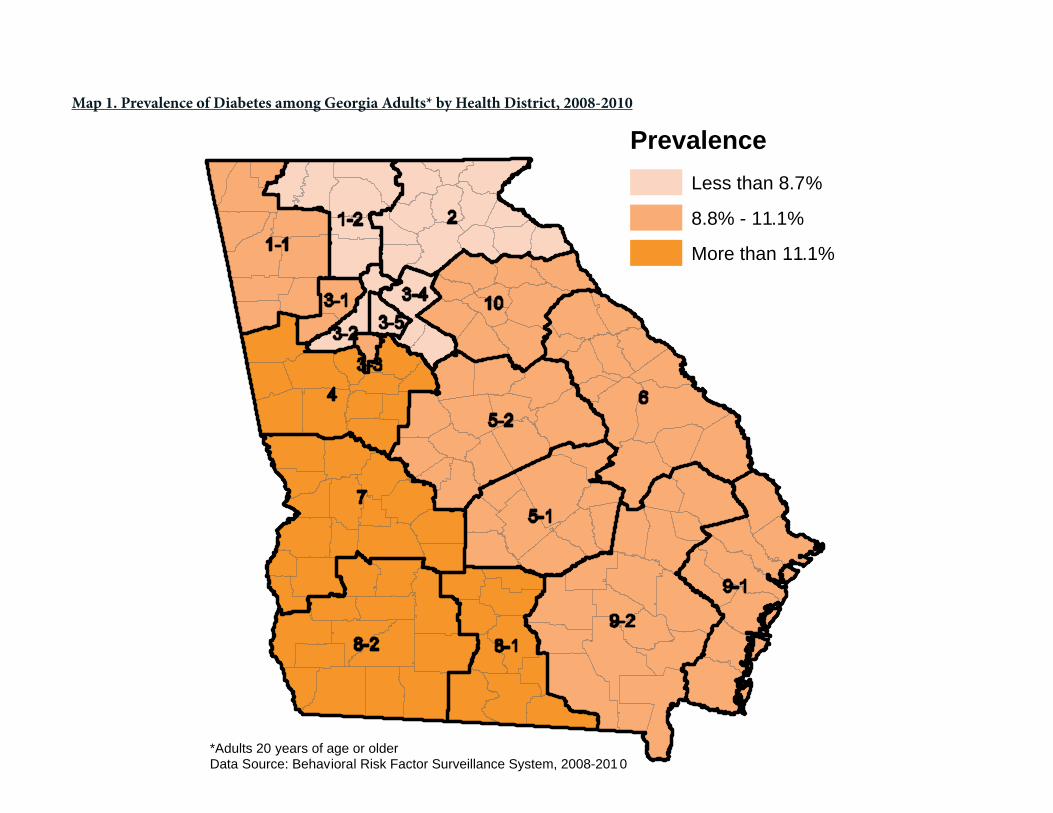
Map 1. Prevalence of Diabetes among Georgia Adults* by Health District, 2008-2010
*Adults 20 years of age or olderData Source: Behavioral Risk Factor Surveillance System, 2008-201 0
PrevalenceLess than 8.7%
8.8% - 11.1%
More than 11.1%

7
Georgia HighlightsDiabetes prevalence is not dispersed equally throughout Georgia. West Central (Columbus) and South (Valdosta) Public Health Districts have a significantly greater diabetes prevalence than the state at 12.9% (34,844 adults) and 13.4% (24,778 adults), respectively.
Table 2. Prevalence of Diabetes among Georgia Adults by Public Health District, 2008-2010
Data Source: Behavioral Risk Factor Surveillance System (2008-2010)*Estimated population will not sum to equal the overall estimated population .
Health DistrictPrevalence% (95% CI)
Estimated Population*
1-1 Northwest (Rome) 9.4 (7.8, 11.3) 43,405
1-2 North Georgia (Dalton) 8.6 (6.8, 10.8) 27,105
2 North (Gainesville) 8.5 (6.8, 10.6) 38,540
3-1 Cobb-Douglas 9.0 (7.0, 11.4) 54,900
3-2 Fulton 8.1 (6.0, 11.0) 60,761
3-3 Clayton (Jonesboro) 10.1 (7.9, 12.8) 19,220
3-4 East Metro (Lawrenceville) 7.5 (5.7, 9.7) 52,299
3-5 DeKalb 8.1 (6.3, 10.2) 44,778
4 LaGrange 12.2 (9.4, 15.6) 70,752
5-1 South Central (Dublin) 10.9 (8.5, 13.8) 12,346
5-2 North Central (Macon) 10.2 (8.1, 12.7) 39,473
6 East Central (Augusta) 8.7 (6.8, 10.9) 29,103
7 West Central (Columbus) 12.9 (10.3, 16.0) 34,844
8-1 South (Valdosta) 13.4 (11.0, 16.3) 24,778
8-2 Southwest (Albany) 12.6 (10.1, 15.5) 33,956
9-1 Coastal (Savannah) 9.4 (7.3, 12.0) 38,491
9-2 Southeast (Waycross) 10.7 (8.6, 13.2) 28,540
10 Northeast (Athens) 8.9 (7.1, 11.0) 31,212
Georgia 9.7 (9.2, 10.3) 703,289

8
In addition, diabetes prevalence by county can be accessed at: http://apps.nccd.cdc.gov/DDT_STRS2/CountyPrevalenceData.aspx?mode=DBT.
Nearly two-thirds of Georgia counties are estimated to have a diabetes prevalence among adults greater than 11.1%.
Map 2. Prevalence of Diabetes among Georgia Adults by County, 2008-2010
Diabetes affects both male and female Georgians of all ages and race/ ethnicities.
PrevalenceLess than 8.7%
8.8% - 11.1%
More than 11.1%
*Adults 20 years of age or older Data Source: Centers for Disease Control and Prevention, Division of Diabetes Translation (http://apps.nccd.cdc.gov/DDTSTRS/ default.aspx last accessed October 9, 2012)

9
Diabetes is a Serious Medical Condition in Georgia
Brief Overview: Demographic Characteristics among Adults with Diagnosed Diabetes in Georgia
Table 3. Prevalence of Diabetes among Georgia Adults by Sex and Race/Ethnicity, 2008-2010
*Other race includes Asian, Native Hawaiian/Pacific Islander, American Indian/Native Alaskan and multiracialData Source: Behavioral Risk Factor Surveillance System (2008-2010)
Prevalence % (95% CI)
Estimated Population
Sex
Male 9.8 (8.9, 10.8) 346,589
Female 9.6 (9.0, 10.2) 356,700
Race/Ethnicity
White, Non-Hispanic 8.4 (7.9, 9.0) 382,469
Black, Non-Hispanic 12.8 (11.4, 14.3) 236,570
Hispanic 9.0 (6.5, 12.4) 34,151
Other*, Non-Hispanic 9.8 (6.9, 13.8) 41,532
Race/Ethnicity-Sex
White, Non-Hispanic, Male 8.8 (7.9, 9.7) 194,079
Black, Non-Hispanic, Male 12.4 (10.0, 15.2) 102,429
White, Non-Hispanic, Female 8.1 (7.4, 8.8) 188,390
Black, Non-Hispanic, Female 13.2 (11.7, 14.8) 134,142
Georgia (overall) 9.7 (9.2, 10.3) 703,289

10
Gender
The prevalence of diabetes was similar among adult Georgia men and women at 9.8% (346,589 adults) and 9.6% (356,700 adults), respectively (Table 3).
Race/Ethnicity
The prevalence of diabetes among Georgia adults is significantly greater in Black, Non-Hispanics (12.8%; 236,570 adults) as compared to White, Non-Hispanics (8.4%; 382,469 adults).
More specifically, as compared to their White, Non-Hispanic counterparts, diabetes prevalence is significantly greater among Black, Non-Hispanic women and Black, Non-Hispanic men at 13.2% and 12.4%, respectively (Figure 2).
Figure 2. Prevalence of Diabetes among Georgia Adults by Race/Ethnicity-Sex, 2008-2010
Data Source: Behavioral Risk Factor Surveillance System (2008-2010)
Figure 2. Prevalence of Diabetes among Georgia Adults by Race/Ethnicity-Sex, 2008-2010
12.4
8.8
13.2
8.1
0
2
4
6
8
10
12
14
Black, Non-Hispanic
White, Non-Hispanic
Black, Non-Hispanic
White, Non-Hispanic
Prev
alen
ce (%
)
Race/Ethnicity-SexMale Female
Data Source: Behavioral Risk Factor Surveillance System (2008-2010)

1111
Table 4. Prevalence of Diabetes among Georgia Adults by Sociodemographic Status, 2008-2010
Data Source: Behavioral Risk Factor Surveillance System (2008-2010)
Demographic StatusPrevalence% (95% CI)
Estimated Population
Age
18-24 2.4 (0.7, 7.4) 13,378
25-34 3.0 (2.0, 4.3) 45,705
35-44 5.0 (4.0, 6.1) 84,577
45-54 9.9 (8.8, 11.2) 136,925
55-64 18.5 (16.9, 20.1) 184,818
65+ 23.0 (21.6, 24.5) 233,552
Employment Status
Employed 6.3 (5.6, 6.9) 279,622
Out of Work 5.9 (4.4, 7.9) 31,640
Unable to Work 28.9 (25.6, 32.4) 116,919
Education Level
Not High School Graduate 15.8 (14.0, 17.7) 117,479
High School Graduate 11.4 (10.2, 12.7) 225,024
Some College 9.8 (8.8, 11.0) 181,797
College Graduate 6.6 (5.8, 7.6) 175,418
Annual Household Income
Less than $15,000 17.5 (15.3, 20.0) 96,345
$15,000 - $24,999 14.0 (12.3, 16.0) 152,242
$25,000 – $34,999 11.6 (9.8, 13.7) 78,660
$35,000 - $49,999 9.7 (8.3, 11.3) 86,269
$50,000 - $74,999 8.5 (7.2, 10.0) 86,796
$75,000 or more 5.4 (4.6, 6.4) 119,007
Insurance Status
Any Health Care Coverage 7.6 (6.9, 8.3) 375,192
No Health Care Coverage 7.4 (6.1, 8.9) 88,584
Disability Status
Disabled 20.5 (19.0, 22.0) 290,781
Not Disabled 7.0 (6.4, 7.6) 403,474
12
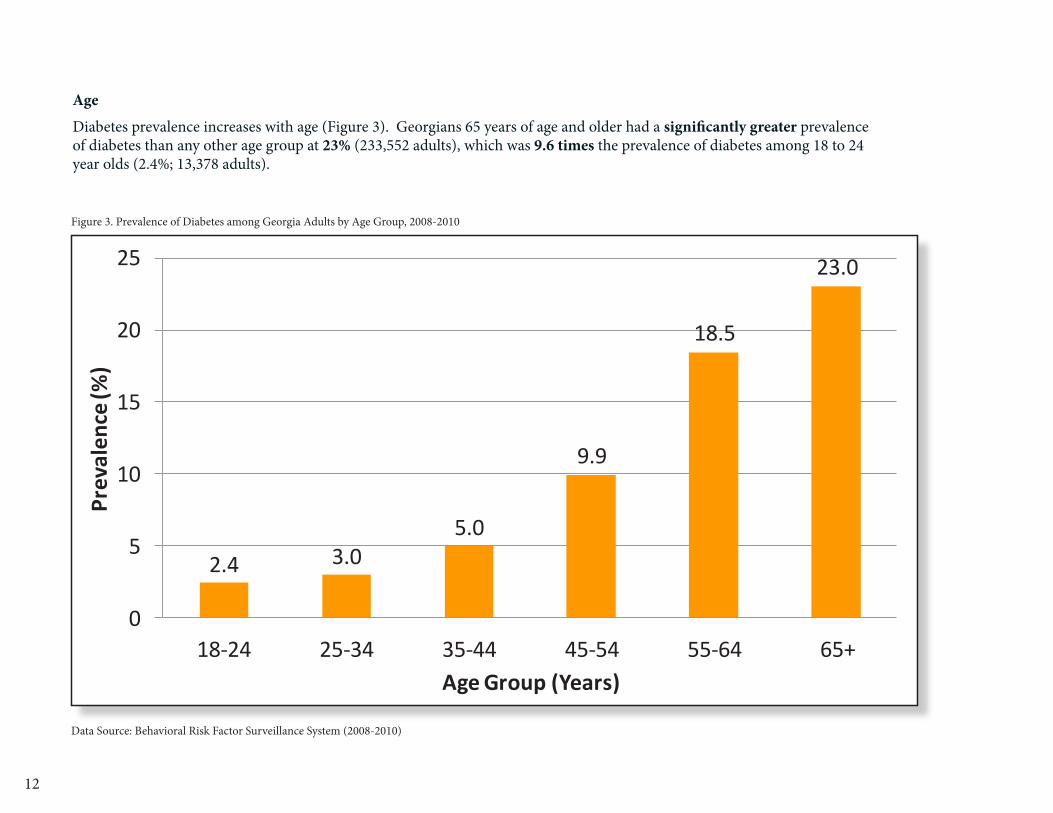
Age
Diabetes prevalence increases with age (Figure 3). Georgians 65 years of age and older had a significantly greater prevalence of diabetes than any other age group at 23% (233,552 adults), which was 9.6 times the prevalence of diabetes among 18 to 24 year olds (2.4%; 13,378 adults).
Figure 3. Prevalence of Diabetes among Georgia Adults by Age Group, 2008-2010
2.4 3.05.0
9.9
18.5
23.0
0
5
10
15
20
25
18-24 25-34 35-44 45-54 55-64 65+
Prev
alen
ce (%
)
Age Group (Years)
Data Source: Behavioral Risk Factor Surveillance System (2008-2010)
Figure 3. Prevalence of Diabetes among Georgia Adults by Age Group, 2008-2010
Data Source: Behavioral Risk Factor Surveillance System (2008-2010)

13
Level of Education
Diabetes affects Georgians of all levels of education (Figure 4). The prevalence of diabetes was significantly higher among Georgia adults who did not graduate from high school at 15.8% as compared to adults of higher education levels. The prevalence of diabetes among these adults who did not graduate from high school was 2.4 times higher than the diabetes prevalence among college graduates (6.6%).
Figure 4. Prevalence of Diabetes among Georgia Adults by Level of Education, 2008-2010
15.8
11.49.8
6.6
0
5
10
15
20
Not High School Graduate
High School Graduate
Some College College Graduate
Prev
alen
ce (%
)
Level of Education
Data Source: Behavioral Risk Factor Surveillance System (2008-2010)
Figure 4. Prevalence of Diabetes among Georgia Adults by Level of Education, 2008-2010
Data Source: Behavioral Risk Factor Surveillance System (2008-2010)

14
Household Income
Diabetes prevalence increases as household income decreases (Figure 5). With a diabetes prevalence of 17.5% (95,345 adults), households with an income of less than $15,000 had a significantly greater diabetes prevalence than households in income groups of $25,000 or more. As compared to the diabetes prevalence in households with incomes of $75,000 or more (5.4%; 119,007 adults), the diabetes prevalence was 3.4 times higher in households with incomes of less than $15,000.
Figure 5. Prevalence of Diabetes among Georgia Adults by Annual Household Income, 2008-2010
17.5
14
11.69.7
8.5
5.4
0
5
10
15
20
Less than $15,000
$15,000 -$24,999
$25,000 -$34,999
$35,000 -$49,999
$50,000 -$74,999
$75,000 or more
Prev
alen
ce (%
)
Annual Household Income
Data Source: Behavioral Risk Factor Surveillance System (2008-2010)
Figure 5. Prevalence of Diabetes among Georgia Adults by Annual Household Income, 2008-2010
Data Source: Behavioral Risk Factor Surveillance System (2008-2010)
15
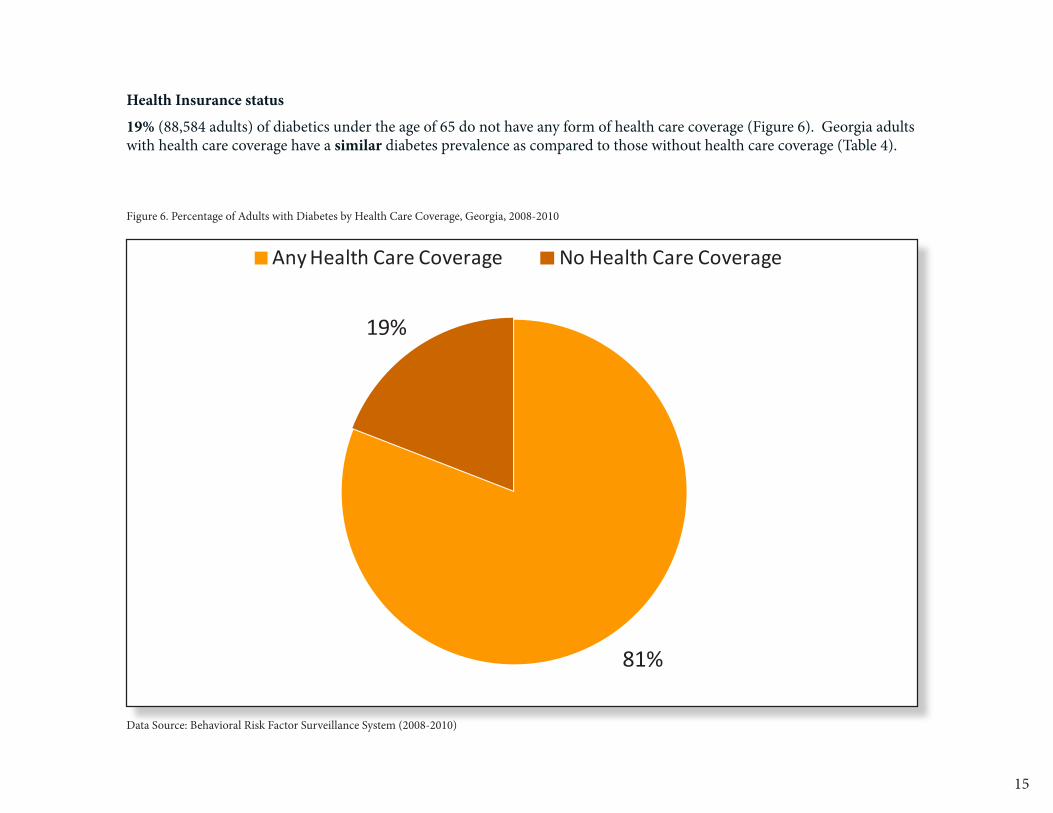
Health Insurance status
19% (88,584 adults) of diabetics under the age of 65 do not have any form of health care coverage (Figure 6). Georgia adults with health care coverage have a similar diabetes prevalence as compared to those without health care coverage (Table 4).Figure 6. Percentage of Adults with Diabetes by
Health Care Coverage, Georgia, 2008-2010
81%
19%
Any Health Care Coverage No Health Care Coverage
Data Source: Behavioral Risk Factor Surveillance System (2008-2010)
Figure 6. Percentage of Adults with Diabetes by Health Care Coverage, Georgia, 2008-2010
Data Source: Behavioral Risk Factor Surveillance System (2008-2010)

16
Disability
Disabled Georgia adults had a diabetes prevalence of 20.5% (290,781 adults), which was nearly 3 times greater than the diabetes prevalence of those who were not disabled (Table 4). The prevalence of diabetes was similar among disabled men and women (Table 5). Disabled Black, Non-Hispanics had a diabetes prevalence 53% greater than White, Non-Hispanics. Disabled adults who were unable to work had a significantly greater diabetes prevalence than employed disabled persons at 31.3% and 11.3%, respectively. Disabled veterans and disabled non-veterans have a similar prevalence of diabetes.
Table 5. Diabetes Prevalence among Disabled Georgia Adults by Demographic Characteristics, 2008-2010
*Other race includes Asian, Native Hawaiian/Pacific Islander, American Indian/Native Alaskan and multiracialData Source: Behavioral Risk Factor Surveillance System (2008-2010)
Demographic Characteristics
Prevalence (%, 95% CI)
Estimated Number of Adults
Sex
Male 19.8 (17.4, 22.3) 126,785
Female 21.1 (19.3, 23.0) 163,996
Race/Ethnicity
White, Non-Hispanic
17.8 (16.3, 19.5) 167,585
Black, Non-Hispanic
27.3 (23.8, 31.1) 97,122
Hispanic 22.9 (14.8, 33.7) 10,749
Other*, Non-Hispanic
19.0 (12.2, 28.5) 11,280
Age
18-44 9.3 (6.9, 12.4) 37,894
45-64 23.4 (21.2, 25.8) 144,333
65 and older 27.6 (25.3, 30.0) 107,344
Employment Status
Employed 11.3 (9.4, 13.6) 54,752
Out of Work 12.1 (7.6, 18.6) 13,114
Unable to work 31.3 (27.6, 35.2) 103,897
Veteran Status
Veteran 22.2 (19.0, 25.7) 57,449
Non-Veteran 20.2 (18.6, 21.9) 233,161
Total 20.5 (19.0, 22.0) 290,781

17
Brief Overview: Complications among Adults with Diagnosed Diabetes
Diabetes is a serious medical disease that, if left untreated, can lead to severe, costly and long-term complications such as: heart disease, kidney failure, stroke, peripheral vascular disease (PVD), lower extremity amputations (LEAs) and visual impairments.1, 4-10
Cardiovascular disease is the leading cause of death among individuals with diabetes. Adults with diabetes have heart disease death rates about 2 to 4 times higher than adults without diabetes.1 Diabetes is also the leading cause of kidney failure, accounting for 44% of all new cases of kidney failure nationally in 2008.1 Unmanaged diabetes can increase the risk of chronic kidney disease progressing to kidney failure or end-stage renal disease (ESRD).11 Kidney failure ultimately requires expensive medical interventions such as dialysis or kidney transplantation for patient survival.11
Circulatory problems caused by uncontrolled diabetes can lead to lower limb complications. Amputations of the leg, foot, or toe, as well as new cases of blindness, are much more likely to occur in individuals with diabetes.1 Nearly two-thirds of all lower extremity amputations in the United States were directly linked to diabetes.1
Table 6. Prevalence of Risk Factors for Diabetes Complications in Georgia Adult Diabetics, 2001 & 2009
Data Source: Behavioral Risk Factor Surveillance System (2001, 2009)
Figure 7. Prevalence of Risk Factors for Diabetes Complications in Georgia Adult Diabetics, 2001 & 2009
63
51
23
43
73
64
14
53
0
10
20
30
40
50
60
70
80
Hypertension High Cholesterol Current Smoker Obese
Prev
alen
ce (%
)
Risk Factor
2001 2009
Data Source: Behavioral Risk Factor Surveillance System (2001, 2009)
Figure 7. Prevalence of Risk Factors for Diabetes Complications in Georgia Adult Diabetics, 2001 & 2009
Data Source: Behavioral Risk Factor Surveillance System (2001, 2009)
Risk Factor 2001 Prevalence% (Number)
2009 Prevalence% (Number)
Percent Change(%)
Hypertension 63.3 (266,889) 72.8 (498,650) +15.6
High Cholesterol 50.5 (190,349) 63.9 (396,498) +26.5
Obese 43.3 (172,543) 52.6 (348,556) +21.4
Currently Smoking 23.3 (97,939) 14.0 (96,598) -39.9
Between 2001 and 2009, the prevalence of risk factors such as hypertension, high cholesterol, and obesity among diabetics increased. However, this increase was insignificant. In the same time period, the prevalence of currently smoking among diabetics experienced a significant decrease of 39.9% (Table 6).
Risk Factors for Diabetes Complications
In addition to improved levels of hemoglobin A1c (HbA1c) or blood glucose (blood sugar) among adults with diagnosed diabetes, blood pressure and cholesterol control reduce the risk for complications such as: heart disease, kidney failure, nerve damage, and vision loss.12
High blood pressure (hypertension), high cholesterol, smoking, and obesity are modifiable risk factors for diabetes complications. As of 2009, of Georgia adults with diabetes (Figure 7):
• 72.8% had hypertension (498,650 adults)• 63.9% had high cholesterol (396,498 adults)• 52.6% were obese (348,556 adults)• 14.0% were current smokers (96,598 adults)

18
19
Diabetes is Costly
The total cost of diabetes in Georgia is approximately $5.1 billion.13 This includes medical costs of $3.3 billion due to diabetes and $1.8 billion in lost productivity costs due to diabetes. In 2007, among all Medicaid beneficiaries in Georgia, approximately $3,200 was spent on each person with Diabetes, amounting to $372.6 million being spent on Georgia Medicaid recipients with Diabetes.14
Nationally, in 2008 diabetes and its related complications imposed a high cost on Medicare and its recipients:• non‐dialysis‐requiring chronic kidney disease (CKD), diabetes, and congestive heart failure accounted for almost
66% of Medicare costs • 4.2% of the Medicare population that had diabetes and CKD accounted for 13.4% of Medicare expenditures• each Medicare recipient with chronic kidney disease or renal failure who did not progress to dialysis was estimated
at $250,000 per recipient15
As compared to non-diabetics, diabetics utilize more medical resources, including hospital inpatient care, physician office visits, emergency room visits, nursing and home health, prescription drugs and medical supplies.16 Diabetics that control their blood glucose which may improve their quality of life and increase their job productivity by remaining employed longer and lowering absenteeism.17 Additionally, diabetics able to control their A1c may increase their life span and lower their medical costs.4,5

20
Diabetes is the 10th leading cause of death among Georgia adults, accounting for nearly 2,000 deaths in 2010. Diabetes is the 7th leading cause of death among Georgia men (988 deaths in 2010) and 10th leading cause of death among Georgia women (979 deaths in 2010).
2121
Diabetes is among the Leading Causes of Preventable Deaths

22

23
References 1 Centers for Disease Control and Prevention, Division of Diabetes Translation, “National Diabetes Fact Sheet, 2011”
(Available at: http://www.cdc.gov/diabetes/pubs/pdf/ndfs_2011.pdf)
2 Fraze, T., Jiang J. Burgess, J. Statistical Brief #93. Hospital Stays for Patients with Diabetes, 2008. Rockville, MD: Agency for Healthcare Research and Quality. August 2010 (Available at: http://www.hcup-us.ahrq.gov/reports/statbriefs/sb93.pdf )
3Behavioral Risk Factor Surveillance System (BRFSS), 2000-2010.
4 The Diabetes Control and Complications Trial Research Group. “The Effect of Intensive Treatment of Diabetes on the Development and Progression of Long-Term Complications in Insulin-Dependent Diabetes Mellitus.” New England Journal of Medicine, Vol. 329. September 30, 1993. No. #14. http://www.nejm.org/doi/pdf/10.1056/NEJM199309303291401
5Gilmer T, O’Connor P, et al: The Cost to Health Plans of Poor Glycemic Control. Diabetes Care 1997;20(12):1847-1853.
6Menzin J, Langley-Hawthorne C, et al: Potential Short-Term Economic Benefits of Improved Glycemic Control. Diabetes Care 2001; 24(1):51-55.
7National Committee for Health Care Quality Assurance. “The State of Health Care Quality”: 2007.
8National Committee for Health Care Quality Assurance. “The State of Health Care Quality: Reform, the Quality Agenda and Resource Use”: 2010.
9 Shetty S, Secnik K, et al: Relationship of Glycemic Control to Total Diabetes-Related Costs for Managed Care Health Plan Members With Type 2 Diabetes. J Manag Care Pharm 2005;11(7):559-64.
10Wagner EH, Sandhu N, Newton KM, et al: Effect of Improved Glycemic Control on Health Care Costs and Utilization. JAMA 2001;285(2):182-189.
11United States Renal Data System (USRDS) Annual Data Report. 2012. (Available at: http://www.usrds.org/2012/pdf/v1_ch7_12.pdf )
12Centers for Disease Control and Prevention, Division of Diabetes Translation (Data available at: http://apps.nccd.cdc.gov/ddtstrs/default.aspx )
13 American Diabetes Association. Economic Costs of Diabetes in the United States in 2007. Diabetes Care 31: 596-615, June 2008. (Available at: http://www.diabetesarchive.net/advocacy-and-legalresources/cost-of-diabetes-results.jsp?state=Georgia&district=0&DistName=Georgia+%28Entire+State%29 )
14Centers for Disease Control and Prevention, Chronic Disease Cost Calculator (Available at: www.cdc.gov/chronicdisease/resources/calculator/index.htm )
15 National Institute of Diabetes and Digestive and Kidney Diseases (NIDDK). “Chronic Kidney Disease and Kidney Failure: Fact Sheet”. National Institutes of Health (NIH). October 2010. (Available at: http://report.nih.gov/nihfactsheets/pdfs/chronickidneydiseaseandkidneyfailure(niddk).pdf )
16Dall T, Mann S, et al: Economic Costs of Diabetes in the U.S. in 2007. Diabetes Care 2008:31(3):596-615.
17 Testa, MA, and Simonson, DC. Health economic benefits and quality of life during improved glycemic control in patients with type 2 diabetes mellitus: A randomized, controlled, double-blind trial. JAMA 280:1490-96, 1998.
For more diabetes surveillance data, please visit the Georgia Diabetes Prevention and Control Program website: http://health.state.ga.us/programs/diabetes/index.asp