2012 CRP Customer Satisfaction Survey...
42
2012 CRP Customer Satisfaction Survey Results
Transcript of 2012 CRP Customer Satisfaction Survey...

2012 CRP Customer Satisfaction Survey Results

Outline of Slides
• Survey Background
• Service CRPs and Product CRPs
– Overall Satisfaction with NISH
– Satisfaction with Functional Areas
– Attributes Assessed
– Kano Framework
– Summary of Results
Slide 2
Survey Background
Survey Objectives
• Measure changes in CRP customer satisfaction since the 2010 Survey.
– Board uses Total Customer Capture (TCC)*
• Successful 1% (1 percentage point increase over
previous year)
• Exceeds Expectations 2%
• Exceptional 3%
• Identify strengths, areas of improvement and areas for continuous improvement
Slide 4*See Appendix for explanation of Total Customer
Capture (TCC)

Survey Instrument Changes
• Satisfaction data by Department/Functional areas
– Departments within National Office
– Functional Areas within Products and Regional
Offices
• Satisfaction for CRPs doing business in more than one Region
• Separated “importance” and “satisfaction” questions
Slide 5

Measures of Customer Satisfaction
• Top 2-box
– (5) Very satisfied
– (4) Satisfied
– (3) Neither satisfied nor dissatisfied
– (2) Dissatisfied
– (1) Very dissatisfied
• Total Customer Capture (TCC)*
Top 2-Box
Slide 6*See Appendix for explanation of Total Customer
Capture (TCC)

Service CRPs

Slide 8
Response Rate – Service CRPs
• Deployed to 448 Services CRPs on 10/16/2012 and closed on
11/28/2012
– Response Rate of 53% with MOE +/-4.4 percentage points
2008 2009 2010 2012
C P R% M% C P R% M% C P R% M% C P R% M%
228 457 50 4.6 161 443 36 6.2 250 442 57 4.1 237 448 53 4.4
C=Completes; P=Population; R=Response Rate; M=Margin of Error

Overall Satisfaction with NISH(Service CRPs)
2008
(n = 228)
2009
(n = 161)
2010
(n =250)
2012
(n=237)
Rating 5 NA 34% 38% 36%
Rating 4 NA 54% 46% 52%
Rating 3 NA 8% 11% 9%
Rating 2 NA 2% 4% 3%
Rating 1 NA 2% 2% -
TCC NA 79% 79% 80%
Top 2-Box NA 88% 84% 88%
TCC = Total Customer Capture

Top 2-box Satisfaction by Functional Area – Service CRPs
Functional Area Top 2-Box
Training 92%
Support from the Region 88%
Regional Quality & Technical Support 84%
Regional Contract Management 84%
Government Affairs 80%
Finance 79%
Regulatory 79%
Marketing 76%
National Operations 70%
Strategic Business Development 67%
Regional Business Development 67%
Institute 61%
Total Facilities Management 53%
Slide 10
Attributes Assessed – Service CRPs(Top 2-Box Satisfaction)

Attribute Categories
• Business Development (4 questions)
• Pricing (2 questions)
• Contract Support (3 questions)
• Communication (4 questions)
• Problem Resolution (2 questions)
Slide 12

Business Development (Top 2-box)
Slide 13

Pricing (Top 2-box)
Slide 14
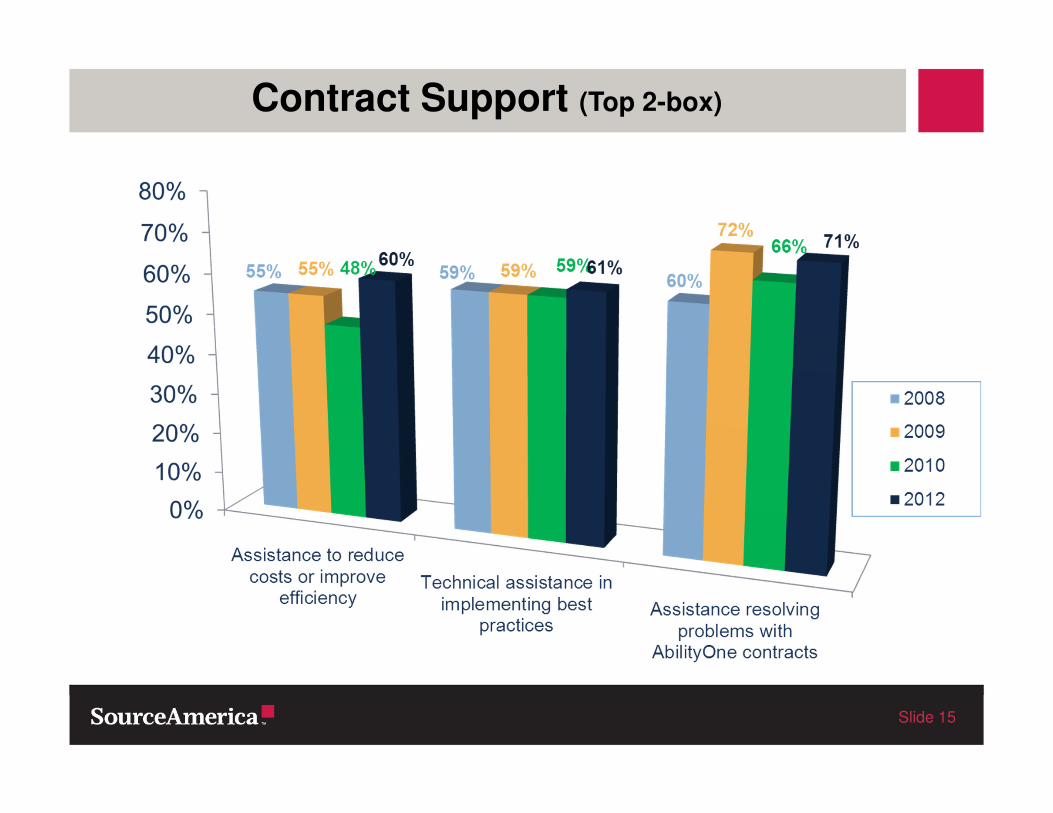
Contract Support (Top 2-box)
Slide 15

Communication (Top 2-box)
Slide 16
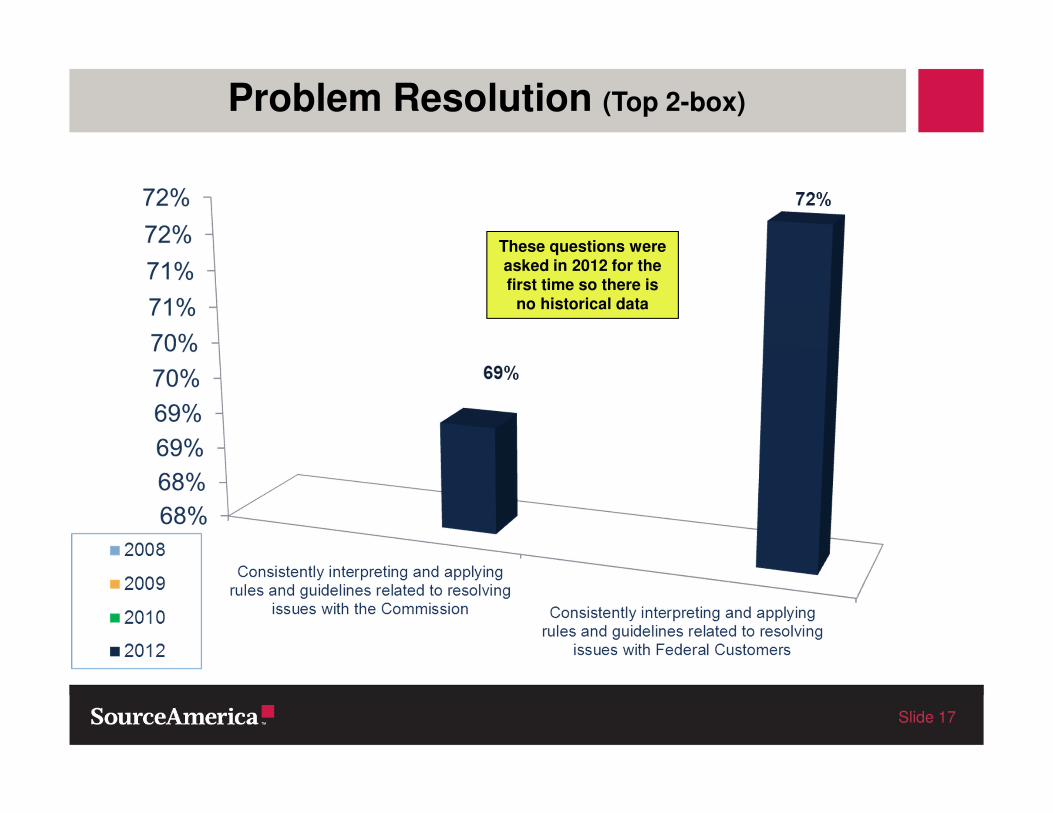
Problem Resolution (Top 2-box)
Slide 17
These questions were asked in 2012 for the
first time so there is no historical data

Kano Framework Service CRPs

Kano Levels
Expected (E) Key Driver (K) Delighter (D)
Customer expects minimum
level of performance on
these attributes; if not met,
customer is dissatisfied
If basic minimum
requirement is met, no need
to improve performance;
attention can be shifted to
other attributes
These attributes have a
relatively greater
influence on Overall
Satisfaction
Key Drivers should be
primary focus of attention
in effort to increase
satisfaction
These attributes go
beyond the customer’s
expectations
Attributes in this quadrant
are considered areas of
opportunity because
improvements will lead to
customer delight
Slide 19

Survey Questions by Kano Level
Slide 20
Expected/Must-Do's Key Drivers Delighters
Q8B. Informing Me Of AbilityOne
Processes That Relate To PL Projects
Q8D. Timely Communication Of Project
Manager POC Changes
Q9A. Consistently Interpreting And Applying
Rule/Guidelines Related To Resolving
Issues With The Federal Customers
Q8A. Including My CRP In Discussions
With The Federal Customer
Q6B. Negotiating Fair & Reasonable Prices
Agreeable To Both Parties
Q7A. Assistance To Reduce Costs Or
Improve Efficiency
Q8C. Responding To My Agency In A
Timely Manner
Q5C. Consistent Rules/Guidelines For Proj.
Dev, Distrib. & Transparency Process
Q6A. Assistance In Developing Prices
On AbilityOne Contracts
Q7C. Assistance Resolving Problems With
AbilityOne Contracts
Q5A. Identifying AbilityOne Contracts
That Meet My Business Needs
Q9B. Consistent Rules/Guidelines For
Issues With AbilityOne Commission
Q5B. Info On New Opp’s Thru Proj. Dev,
Distrib. & Transparency Process
Q7B. Technical Assistance In Implementing
Best Practices
Note: Green = Above the Mean for Top-Box Satisfaction; Red = Below the
Mean; Blue = At the Mean.

Summary – Service CRPs
Strengths Areas of Improvement Areas for Continuous Improvement
• NISH Staff Overall
• NISH Training
• Support from
• Regional Contract
Management Staff
• Regional Quality &
Technical Support
• Government
Affairs
• South Region
Performance
• Overall Satisfaction
with NISH
• Business Development
Attributes
• Contract Opportunities
• Commercial
• Non-DoD
• Project Distribution
Process
• Communication
Slide 21

Product CRPs

Slide 23
Response Rate – Product CRPs
• Deployed to 132 Product CRPs on 10/16/2012 and closed on
11/28/2012
– Response Rate of 60% with MOE +/-7.0 percentage points
2008 2009 2010 2012
C P R% M% C P R% M% C P R% M% C P R% M%
60 128 47 9.3 47 124 38 11.3 103 133 77 4.6 79 132 60 7.0
C=Completes; P=Population; R=Response Rate; M=Margin of Error

Overall Satisfaction with NISH(Product CRPs)
2008
(n = 60)
2009
(n = 47)
2010
(n=103)
2012
(n = 79)
Rating 5 8% 30% 30% 35%
Rating 4 70% 53% 51% 54%
Rating 3 20% 17% 13% 5%
Rating 2 2% - 6% 4%
Rating 1 - - 1% 3%
TCC 71% 78% 76% 79%
Top 2-Box 78% 83% 81% 88%
TCC = Total Customer Capture
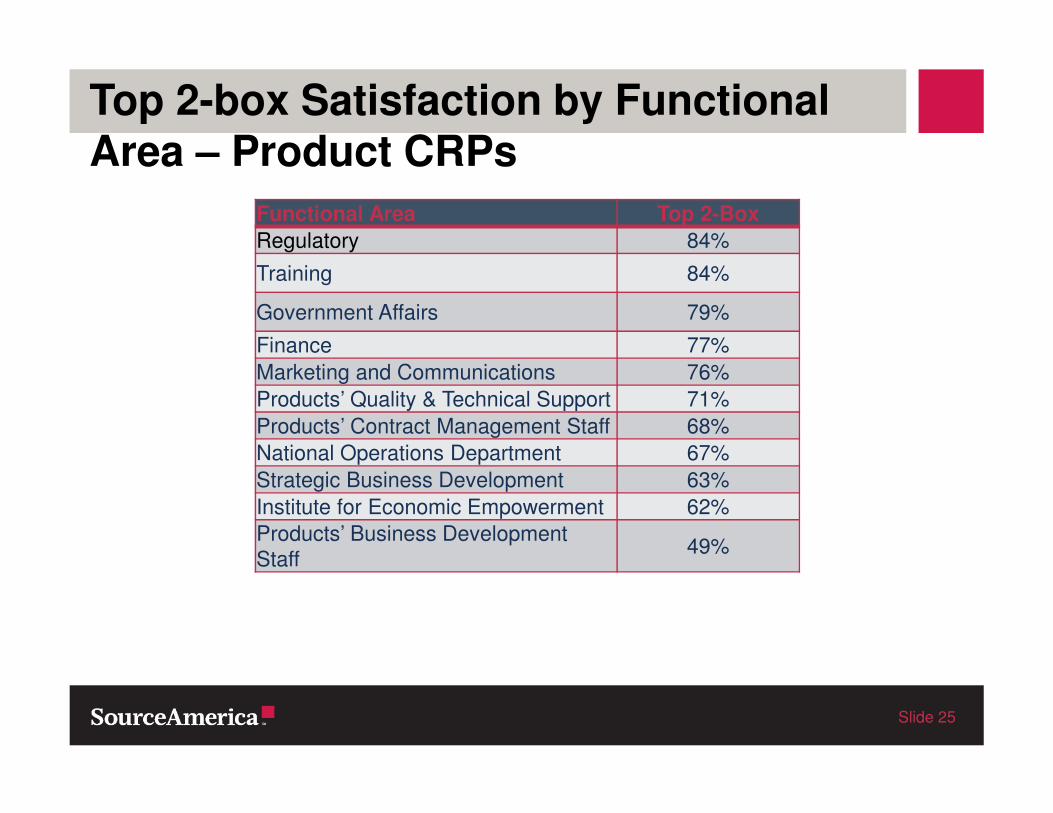
Top 2-box Satisfaction by Functional Area – Product CRPs
Functional Area Top 2-Box
Regulatory 84%
Training 84%
Government Affairs 79%
Finance 77%
Marketing and Communications 76%
Products’ Quality & Technical Support 71%
Products’ Contract Management Staff 68%
National Operations Department 67%
Strategic Business Development 63%
Institute for Economic Empowerment 62%
Products’ Business Development
Staff49%
Slide 25

Attributes Assessed – Product CRPs(Top 2-Box Satisfaction)

Attribute Categories
• Business Development (4 questions)
• Pricing (2 questions)
• Contract Support (3 questions)
• Communication (4 questions)
• Problem Resolution (2 questions)
Slide 27

Business Development (Top 2-box)
Slide 28

Pricing (Top 2-box)
Slide 29

Contract Support (Top 2-box)
Slide 30

Communication (Top 2-box)
Slide 31
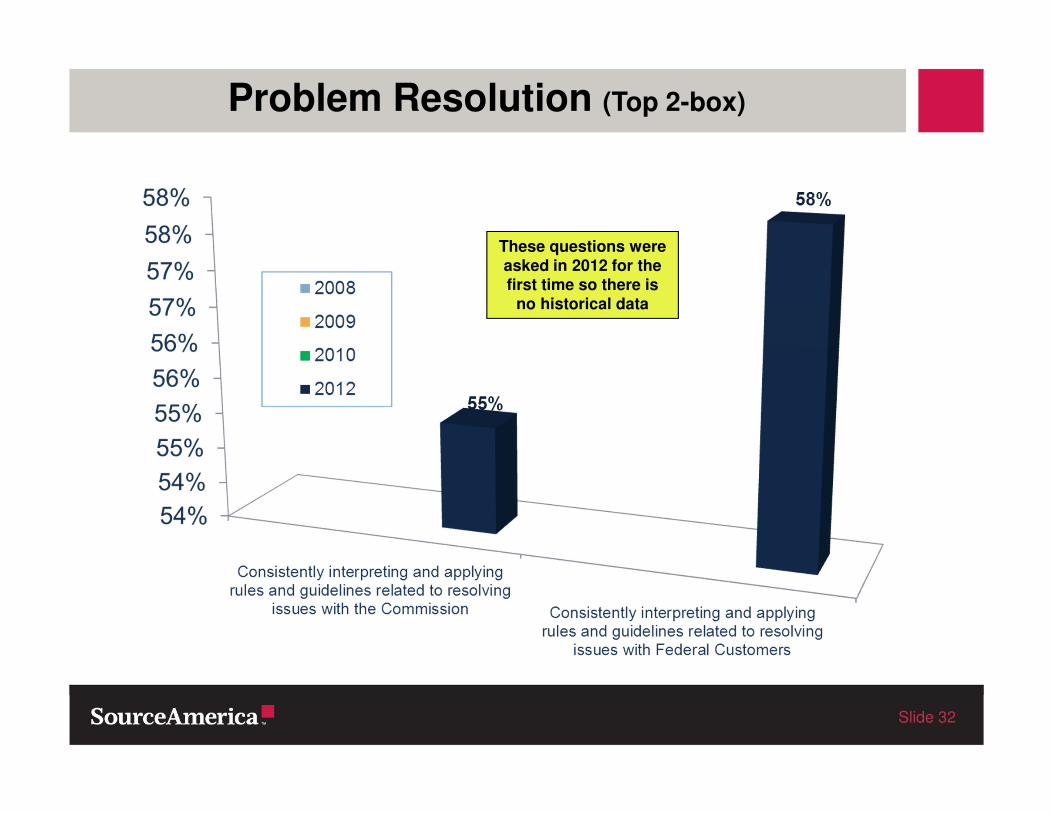
Problem Resolution (Top 2-box)
Slide 32
These questions were asked in 2012 for the
first time so there is no historical data

Kano Framework Product CRPs

Survey Questions by Kano Level
Slide 34
Expected/Must-Do's Key Drivers Delighters
Q7C. Assistance Resolving Problems
With AbilityOne Contracts
Q8C. Responding To My Agency In A
Timely Manner
Q9B. Consistent Rules/Guidelines For
Issues With AbilityOne Commission
Q8B. Informing Me Of AbilityOne
Processes That Relate To PL Projects
Q6A. Assistance In Developing Prices On
AbilityOne Contracts
Q5C. Consistent Rules/Guidelines For
Proj. Dev, Distrib. & Transparency
Process
Q8D. Timely Communication Of Project
Manager POC Changes
Q8A. Including My CRP In Discussions
With The Federal Customer
Q6B. Negotiating Fair & Reasonable
Prices Agreeable To Both Parties
Q5A. Identifying AbilityOne Contracts
That Meet My Business Needs
Q5B. Info On New Opp’s Thru Proj. Dev,
Distrib. & Transparency Process
Note: Green = Above the Mean for Top-Box Satisfaction; Red = Below the
Mean; Blue = At the Mean.

Summary – Product CRPs
Strengths Areas of Improvement Areas for Continuous Improvement
• Communication
• Project Manager
POC Changes
• Responding to
CRPs
• Overall
Satisfaction with
support from NISH
• Communication
• Including CRP in
discussions with
Federal Customer
• Informing CRP of
AbilityOne
processes related
to PL projects
• Business Development
• Contract Support
• Problem
Resolution on
contracts
Slide 35

Appendix A
Total Customer Capture (TCC) Explained

Total Customer Capture (TCC)
• The goal is to increase customer satisfaction. There are two ways to do this:
– Reduce the # of 1s, 2s, and 3s and
– Increase the # of 4s and 5s.
• To maximize satisfaction, we need to raise each rater’s rating over time, not just focus on 4s and 5s. Ignoring 1s, 2s, & 3s is a half court strategy.
Slide 37

Total Customer Capture (TCC) – cont’d
• Total Customer Capture (TCC):
– Reports the current level of ratings
– Shows the movement of all ratings over time
– Provides easy analysis of changes in ratings
• An increase in TCC indicates increased satisfaction and decreased dissatisfaction
– Movement from 4s and 5s
– Movement among 1s-2s, 2s-3s, and 3s-4s.
Slide 38
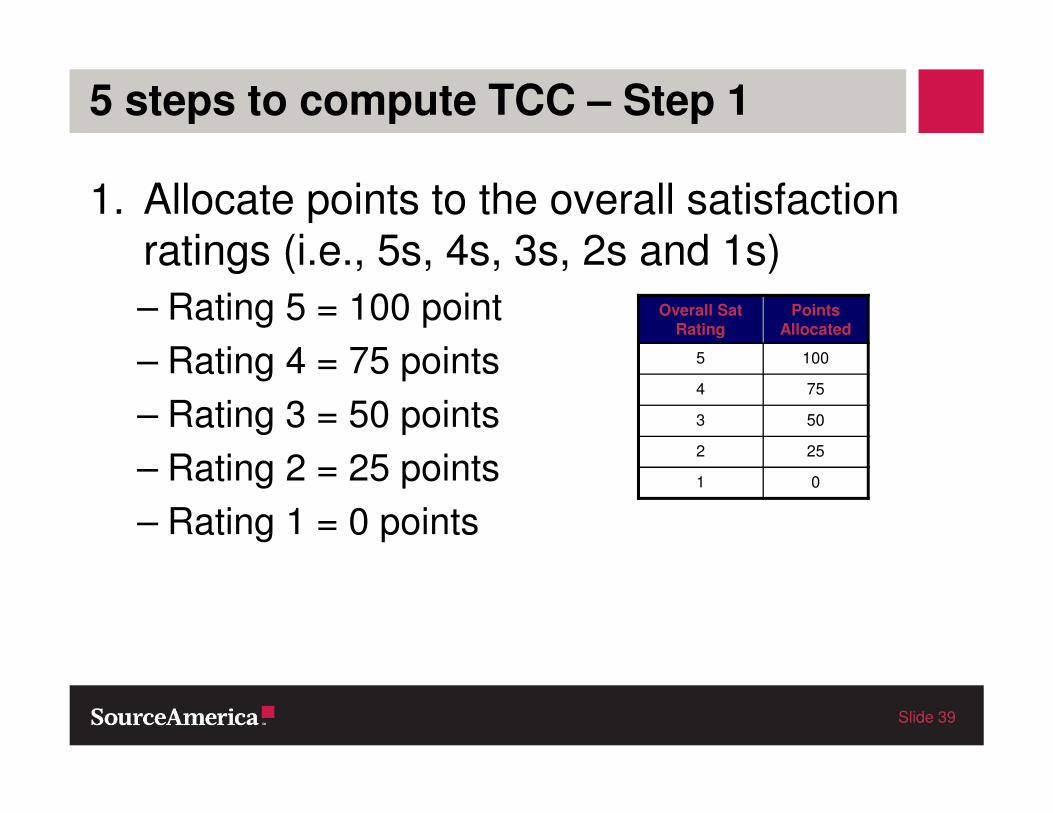
5 steps to compute TCC – Step 1
1. Allocate points to the overall satisfaction ratings (i.e., 5s, 4s, 3s, 2s and 1s)
– Rating 5 = 100 point
– Rating 4 = 75 points
– Rating 3 = 50 points
– Rating 2 = 25 points
– Rating 1 = 0 points
Slide 39
Overall Sat Rating
Points Allocated
5 100
4 75
3 50
2 25
1 0

5 Steps to compute TCC – Step 2
2. Multiply the number of respondents that gave a particular rating by the points assigned to that rating. See table below which is data from the 2012 Services CRP survey:
Slide 40
(A)
Rating
(B)
Points
(C)
# of Respondents
(D) = (B) x (C)
5 100 84 8400
4 75 122 9150
3 50 20 1000
2 25 6 150
1 0 1 0
Total 233 18,700
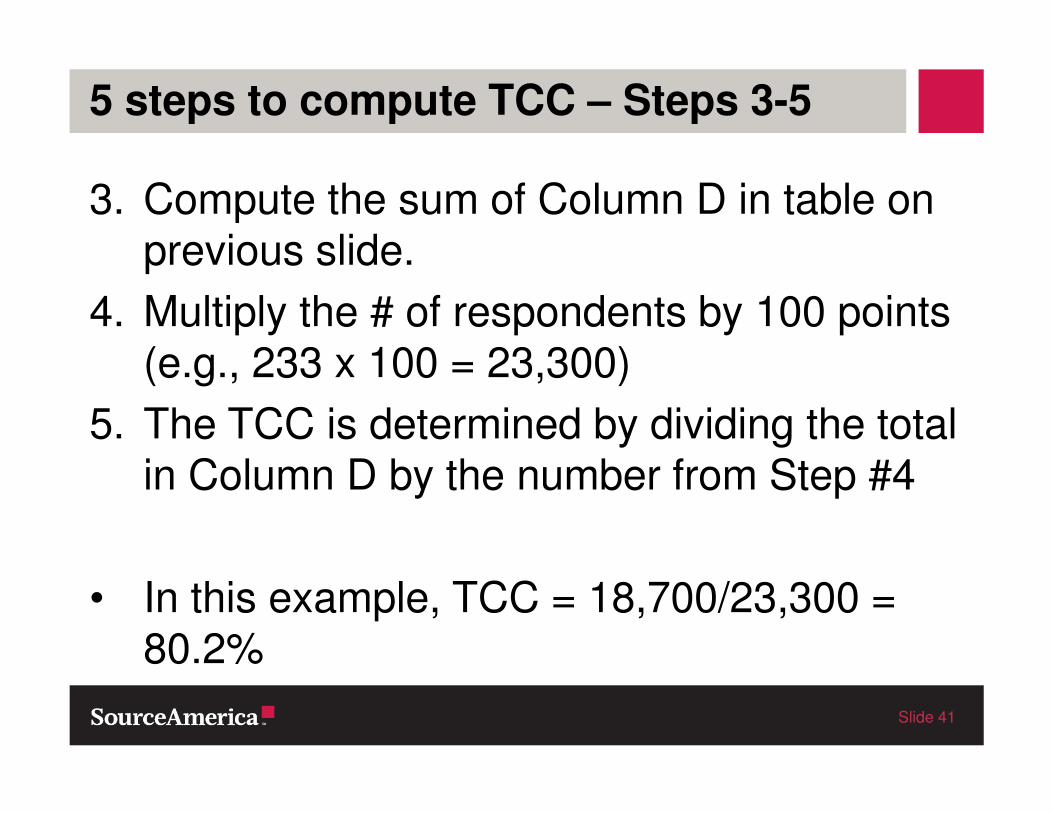
3. Compute the sum of Column D in table on previous slide.
4. Multiply the # of respondents by 100 points (e.g., 233 x 100 = 23,300)
5. The TCC is determined by dividing the total in Column D by the number from Step #4
• In this example, TCC = 18,700/23,300 = 80.2%
Slide 41
5 steps to compute TCC – Steps 3-5

2012 CRP Customer Survey Results
• For questions, please contact
Leejay Acham
National Office Quality
703-584-3964
Slide 42