
2012 Community Health Needs...
262
2012 Community Health Needs Assessment
Transcript of 2012 Community Health Needs...

2012
Community Health Needs Assessment
2
Table of Contents
Executive Summary ……………………………………………………………………………………...…3
Overview of Key Findings………………………………………………………………………………….4
Conclusion……………………………………………………………………………………………….…..6
Introduction …………………………………………………………………………………………………...7
1a. A Definition of the Community Served by the Hos pital Facility …………………………….…..8
1b. Demographics of the Community ……………………………………………………………….…..13
1c. Existing Health Care Facilities and Resources ……………………………………………….…..14
1d. How Data was Obtained ………………………………………………………………………….…...15
1e. The Health Needs of the Community …………………………………………………………….…17
1f. Primary and Chronic Diseases of Minority Groups ………………………………………….…...25
1g.The Process for Identifying and Prioritizing Hea lth Needs …………………………….……….29
1h. Persons Representing the Community’s Interests ……………………………………………....31
1i. Information Gaps …………………………………………………………………………….………….34
1j. Other ……………………………………………………………………………………………………....35
Appendix A: Detailed list of Facility Services………..…….………………….…………………….…...37
Appendix B: Health Indicator Data…………………..……..…………………………………….……...49
Appendix C: The U.S. Preventive Services Task Force Grades/Recommendations…..…………..258
Appendix D: Key Stakeholder Questionnaire…………………………………………..…….………...260
3
Executive Summary
The Community Health Needs Assessment (CHNA) was prepared by the Health Council of East Central Florida, Inc. for Parrish Medical Center (PMC) in response to changes to Internal Revenue Service (IRS) forms and systems. This reflects additional requirements for charitable hospitals enacted under Section 9007 of the Patient Protection and Affordable Care Act of 2010. The assessment serves as the foundation for developing a strategic implementation plan that includes engagement with community organizations to address health needs. Participation in the development and execution of a community-driven process has the potential to enhance program effectiveness, leverage limited financial resources, and strengthen the public health system. Collaboration among community partners can lead to improved health for all residents.
The data for the Community Health Needs Assessment was gathered using the Healthy Measures for East Central Florida online Healthy Community Network (HCN). This customizable web-based community dashboard, designed by Healthy Communities Institute (HCI), delivers access to high-quality data and decision support. The HCN provides health indicator tracking, best practice sharing and community development to help improve the health and environmental sustainability of communities in East Central Florida. The CHNA includes: a definition of the community served by Parrish Medical Center with an examination of demographic, economic, education, public safety, environmental, and transportation data; existing health care resources and services; the process for
obtaining the data; identified health needs of the community including primary and chronic disease
needs for uninsured, low-income, and minority populations; the process for identifying and
prioritizing health needs; a summary of the information collected from key stakeholders representing
the interests of the community; and the information gaps that limited the hospital facility’s ability to
assess all needs of the community.
The Florida Department of Health State Health Improvement Plan (2012-2015) and the National Prevention Council’s 2012 National Prevention Strategy were used as a guide for health indicator selection. To accomplish the task of prioritizing health needs, the Assessment Protocol for Excellence in Public Health (APEXPH) modified Hanlon Method was used to categorize and rank health indicators to identify key needs in the community. This method considered three criteria: the magnitude of the problem, as measured in terms of the percent of the population with the health problem; the severity of the problem in terms of mortality, morbidity, hospitalizations, economic loss
or community impact; and the predicted effectiveness of the intervention in preventing the health
problem. When applicable, health indicator rates were compared to the national benchmark targets established by Healthy People 2020.
The CHNA provides a comprehensive analysis of widely-accepted health indicators that identify key community needs for each county served by PMC. The objectives of the CHNA are to increase the understanding of the community’s health problems, build capacity through partnership development and collaboration, and strengthen the role of the hospital as they work within the county to

4
address community health needs. The overarching goal of the health care system is to provide all residents with the opportunity to attain optimal health outcomes.
Overview of Key Findings
Community Profile
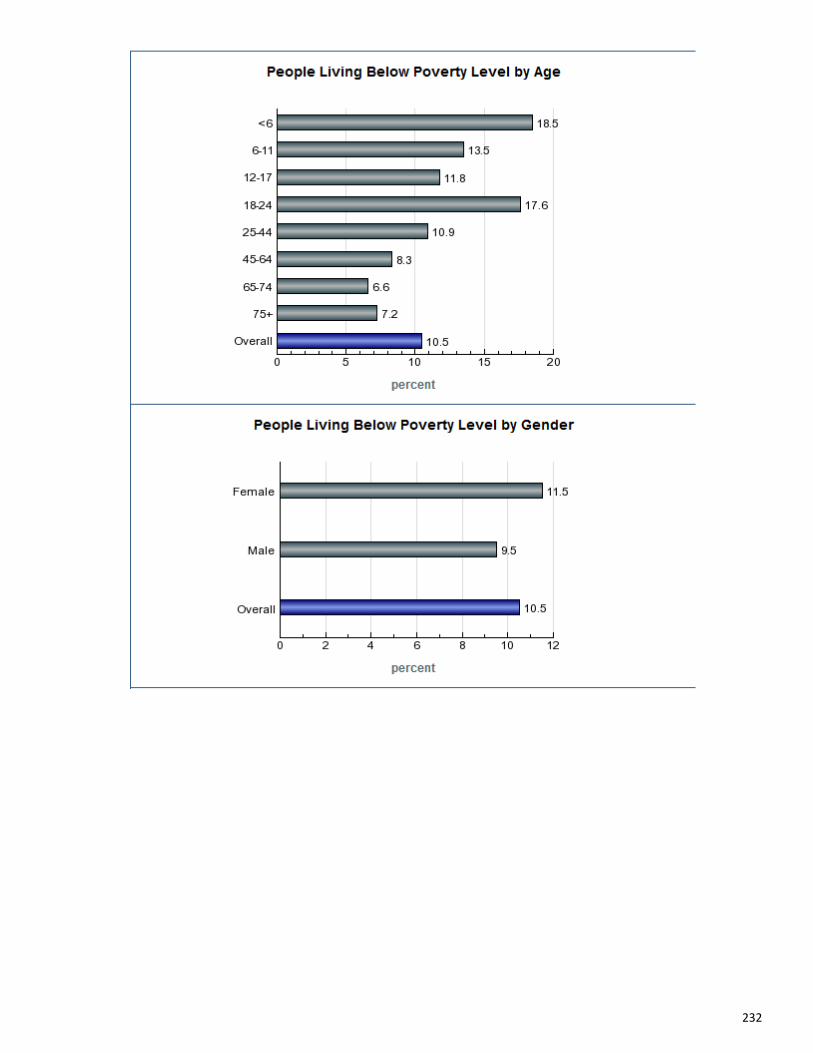
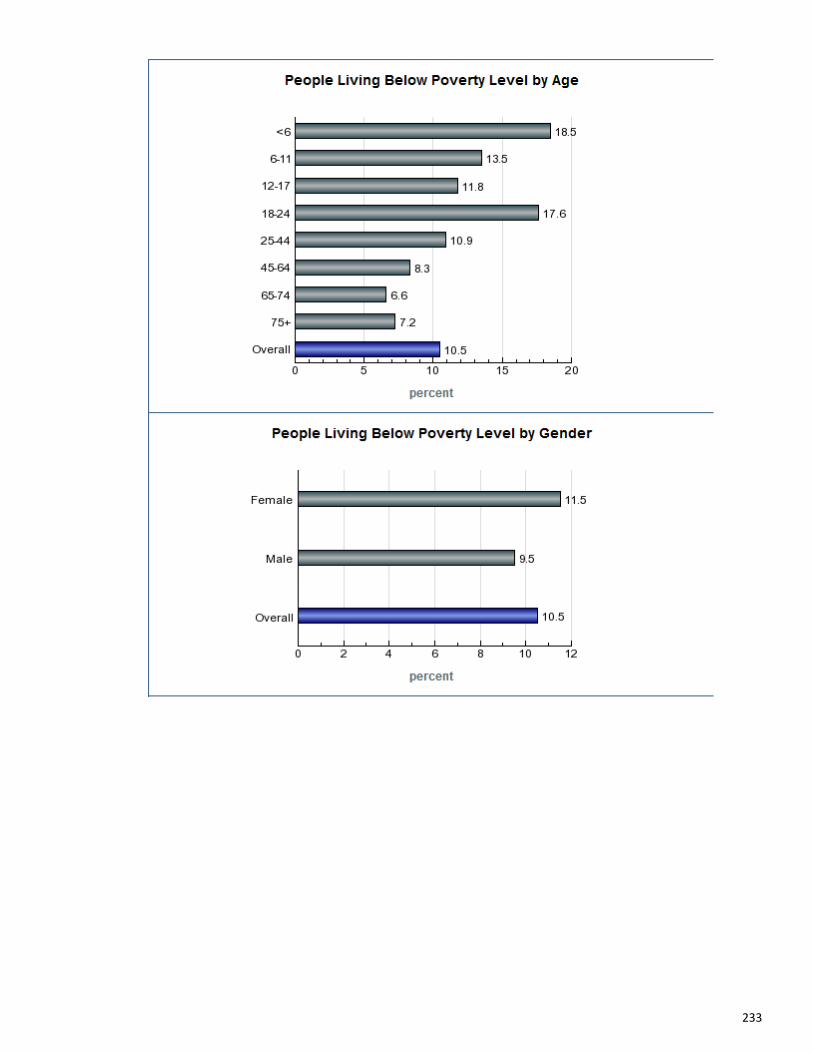
In 2012, the population of Brevard was estimated at 552,037 residents. Of these, 82.4 percent were White, 10.4 percent Black, and 8.7 percent Hispanic. One in five residents is 65 years or older.
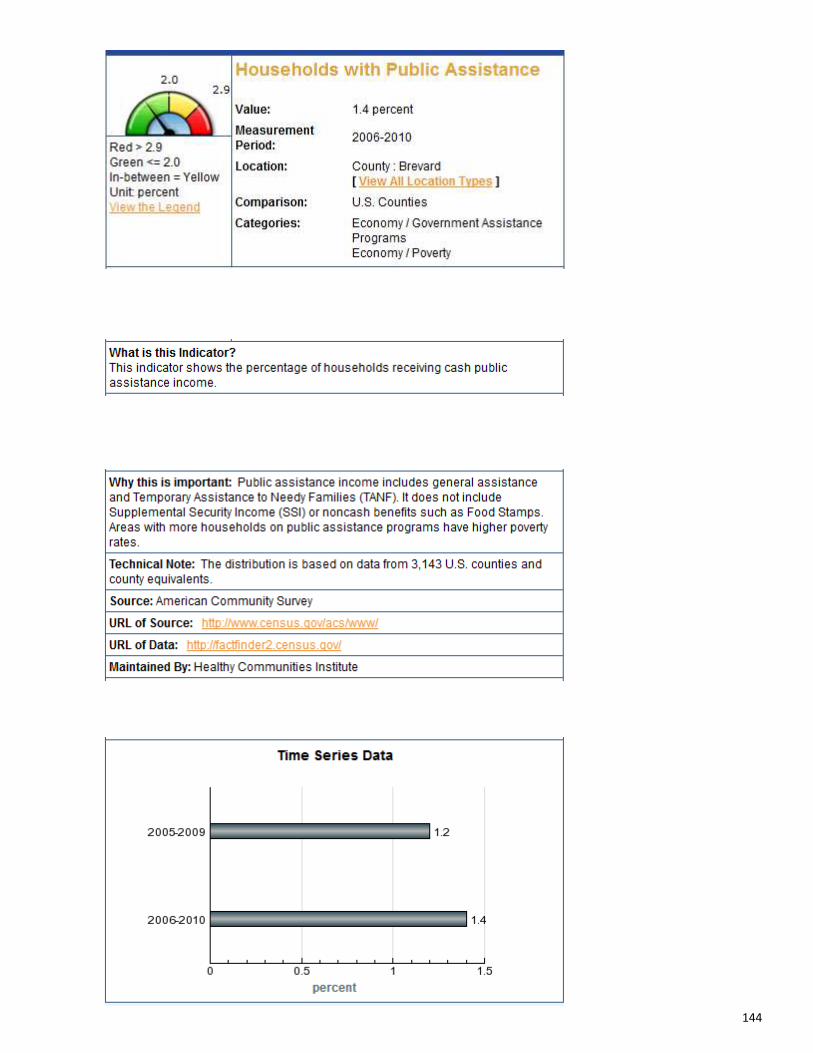
The unemployment rate in Brevard, at ten percent of the civilian population, is higher than that of the nation. This places a strain on the social support systems as more persons qualify for benefits. Housing affordability remains a challenge for more than fifty percent of residents. The poverty rates among the Black population were three times that of Whites; for Hispanics, the rates were twice
those observed in the White population. The median household income and poverty rate for the county fell within the top 50th percentile when compared to other U.S. counties.
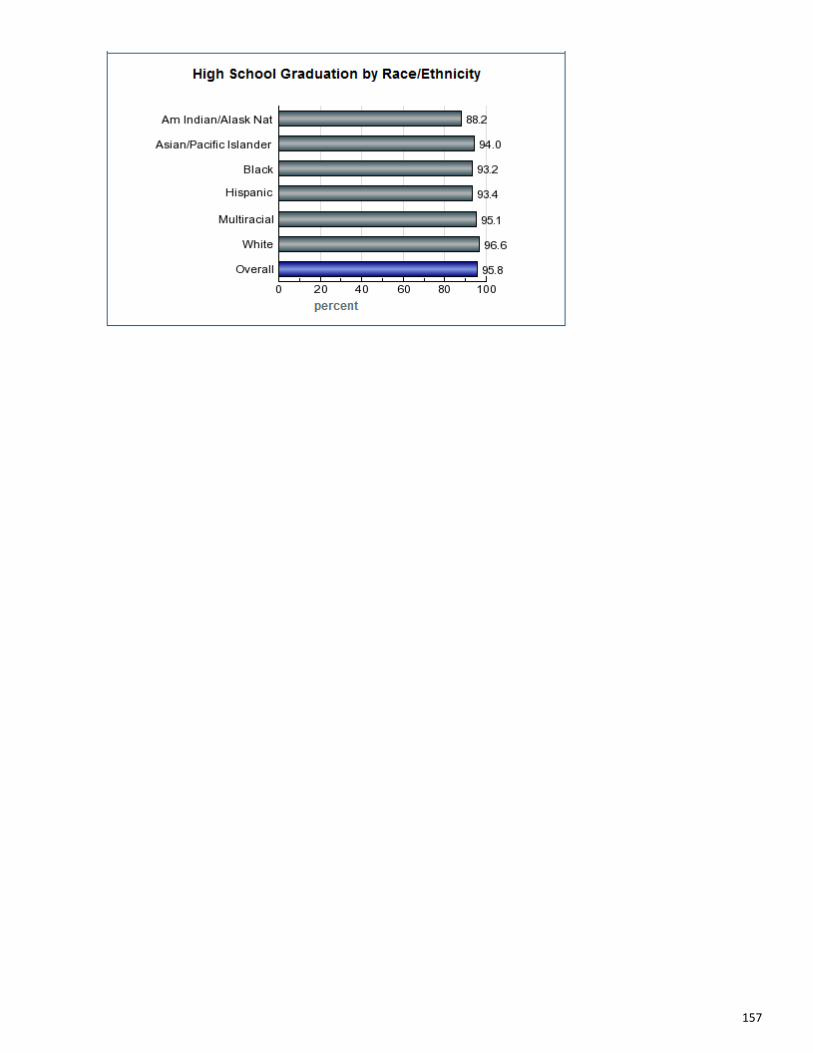
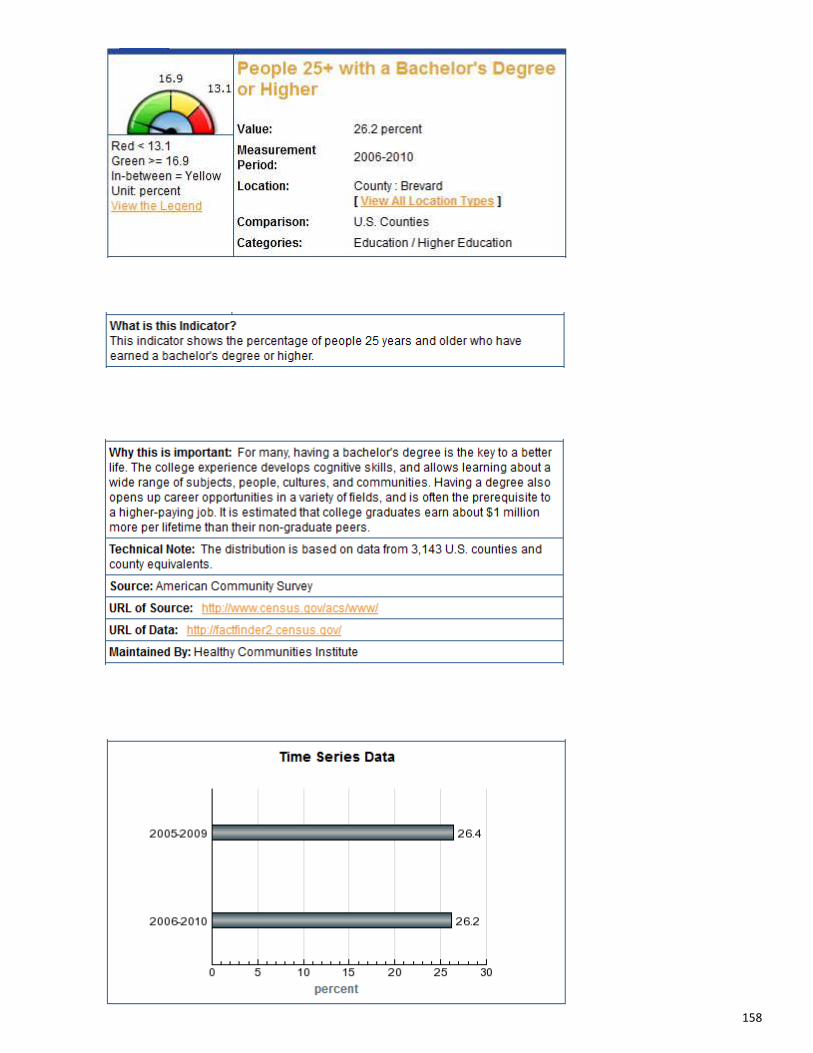
Over 95 percent of high school students graduated within four years of high school enrollment. Slightly more than 26 percent of Brevard residents have earned a Bachelor’s degree. Rates for graduation and Bachelor’s degree attainment among the Black and Hispanic populations were lower than that of the White population.
Although the violent crime rate in Brevard has been decreasing, it is still above the national average. Deaths due to motor vehicle collisions are above the Healthy People 2020 target.
Air quality improved over the past three years with the annual ozone level at 2 or Grade B. Like many counties in the nation, Brevard has too many fast food restaurants and too few grocery stores. The number of recreation and fitness facilities is in the top 50th percentile when compared to other counties in the U.S. Child abuse rates decreased slightly from 2009 to 2010. Over 30 percent of children live in single-parent households.
The long geographic length of the county presents transportation challenges for Brevard residents. Public transportation and carpooling are not widely used to reduce traffic congestion.
Mortality
Cancer and coronary heart disease are the leading causes of death for all population groups. Breast and lung cancer are responsible for the majority of all cancer deaths. Diabetes is the fifth leading cause of death among Blacks. Stroke is the fifth leading cause of death among Hispanics.
Years Potential Life Lost
The leading cause of premature death is major cardiovascular disease. This is followed by motor
5
vehicle collisions, suicide, diabetes, and breast cancer. Among Blacks and Hispanics, the Human immunodeficiency virus (HIV) is one of the top five causes for early death.
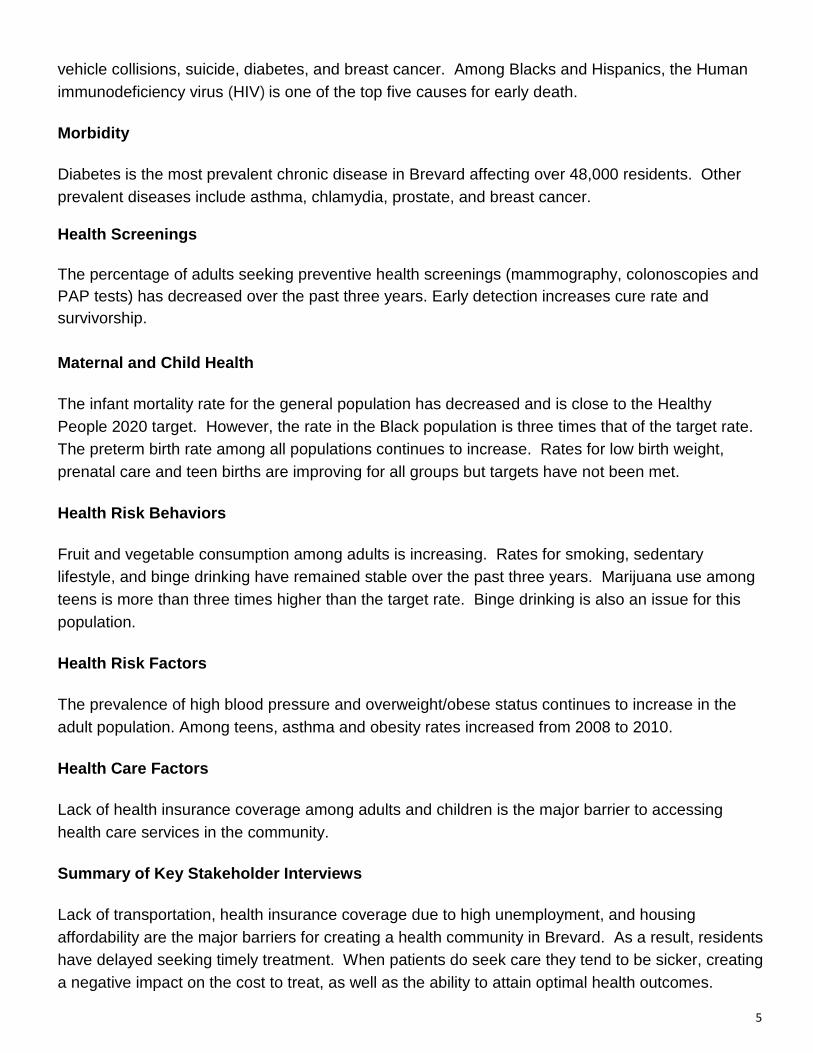
Morbidity
Diabetes is the most prevalent chronic disease in Brevard affecting over 48,000 residents. Other prevalent diseases include asthma, chlamydia, prostate, and breast cancer.
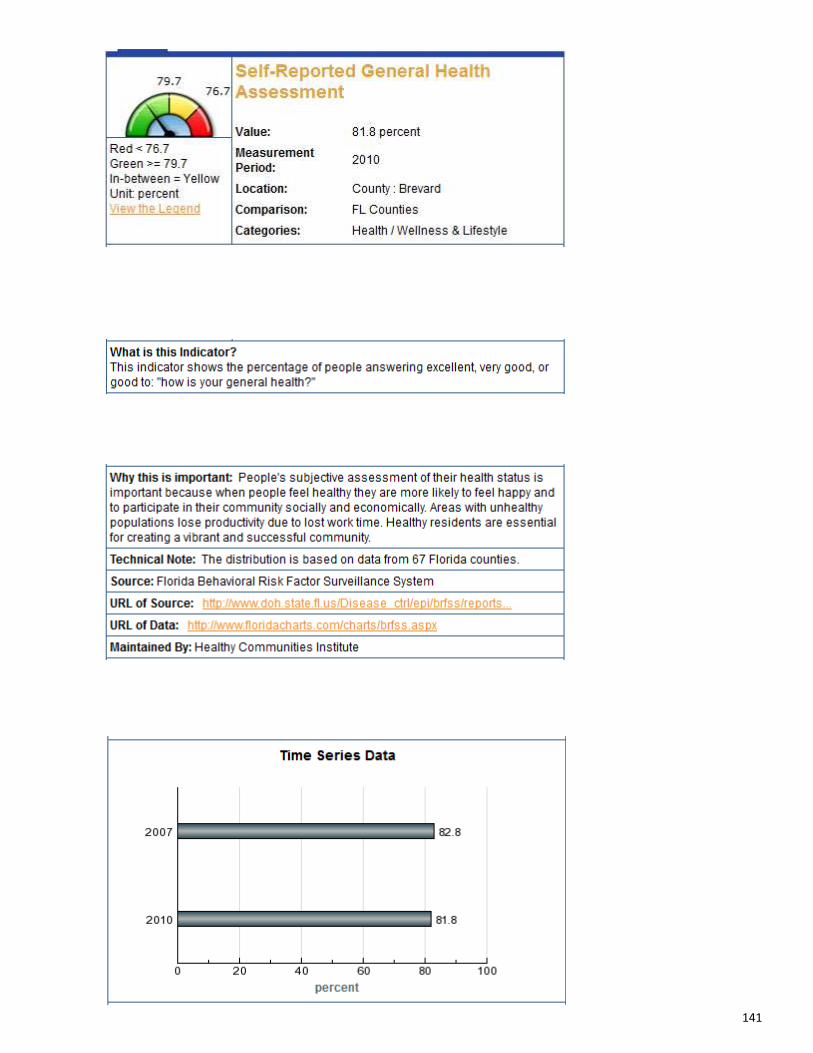
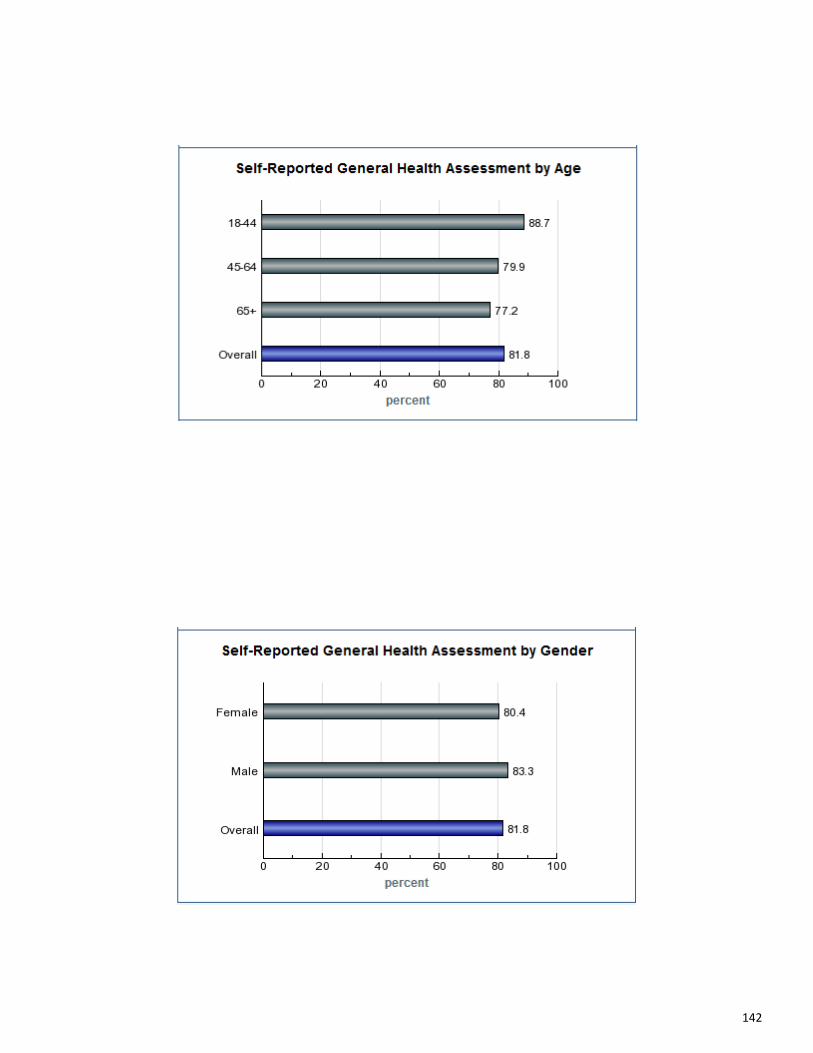
Health Screenings
The percentage of adults seeking preventive health screenings (mammography, colonoscopies and PAP tests) has decreased over the past three years. Early detection increases cure rate and survivorship.
Maternal and Child Health
The infant mortality rate for the general population has decreased and is close to the Healthy People 2020 target. However, the rate in the Black population is three times that of the target rate. The preterm birth rate among all populations continues to increase. Rates for low birth weight, prenatal care and teen births are improving for all groups but targets have not been met.
Health Risk Behaviors
Fruit and vegetable consumption among adults is increasing. Rates for smoking, sedentary lifestyle, and binge drinking have remained stable over the past three years. Marijuana use among teens is more than three times higher than the target rate. Binge drinking is also an issue for this population.
Health Risk Factors
The prevalence of high blood pressure and overweight/obese status continues to increase in the adult population. Among teens, asthma and obesity rates increased from 2008 to 2010.
Health Care Factors
Lack of health insurance coverage among adults and children is the major barrier to accessing health care services in the community.
Summary of Key Stakeholder Interviews
Lack of transportation, health insurance coverage due to high unemployment, and housing affordability are the major barriers for creating a health community in Brevard. As a result, residents have delayed seeking timely treatment. When patients do seek care they tend to be sicker, creating a negative impact on the cost to treat, as well as the ability to attain optimal health outcomes.

6
Options for mental health, substance abuse, and dental care services are limited throughout the County. The growing demand for these services has far outpaced availability. Coordinated medical case management and education are needed to improve health literacy, provide appropriate and timely treatment, and attain good health outcomes.
Organizations promoting good health in Brevard include: Parrish Medical Center, Brevard County Health Department, YMCA, parks and recreation departments, senior centers and programs, and the Greater Titusville Renaissance.
Organizations impeding the promotion of good health include: Fast food establishments, small retail grocers who do not offer fresh fruits and vegetables, and lack of wellness programs among large employers.
Conclusion
Reduced mortality and morbidity rates can be attained in all population groups by increasing participation in health screenings for early cancer detection and modifying risk behaviors that directly affect the health factors responsible for the growing prevalence of chronic diseases. Coordinated community planning is needed to ensure all residents have access to appropriate services when care is needed. Building strategic partnerships will leverage limited financial resources, improve program effectiveness, and strengthen the role of the hospital as they work within the county to address community health needs. A strengthened public health system can provide all residents with the opportunity to attain optimal health outcomes.

7
Introduction This Community Health Needs Assessment (CHNA) was prepared by the Health Council of East Central Florida, Inc. for Parish Medical Center (PMC), in response to the new Internal Revenue Service (IRS) requirement under The Patient Protect and Affordable Care Act, Public Law 111-148. Hospital organizations that are (or seek to be) recognized as described in section 501(c)(3) are required to conduct a CHNA at least once every three years and adopt an implementation strategy to meet the identified health needs. The CHNA must take into account input from persons who represent the broad interests of the community served by the hospital facility, including those with special knowledge of or expertise in public health. Additionally, the CHNA must be made widely available to the public.
The CHNA, as prepared in accordance with Schedule H (Form 990) Part V, Section B, provides a comprehensive analysis of widely-accepted health indicators that identify key community needs for each county served by PMC. The objectives of the CHNA are to increase the understanding of the community’s health problems, build capacity through partnership development and collaboration, and strengthen the role of the hospital as they work within the county to address community health needs. The overarching goal of the health care system is to provide all residents with the opportunity to attain optimal health outcomes.
8
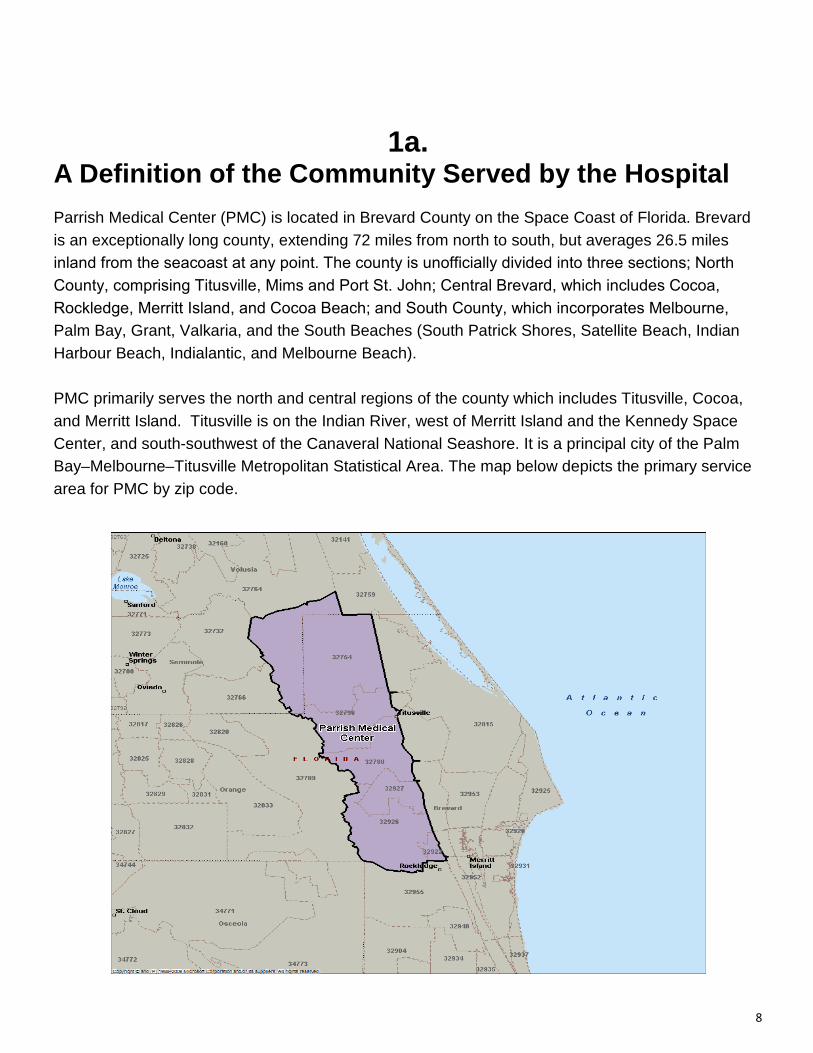
1a. A Definition of the Community Served by the Hospita l
Parrish Medical Center (PMC) is located in Brevard County on the Space Coast of Florida. Brevard is an exceptionally long county, extending 72 miles from north to south, but averages 26.5 miles inland from the seacoast at any point. The county is unofficially divided into three sections; North
County, comprising Titusville, Mims and Port St. John; Central Brevard, which includes Cocoa,
Rockledge, Merritt Island, and Cocoa Beach; and South County, which incorporates Melbourne,
Palm Bay, Grant, Valkaria, and the South Beaches (South Patrick Shores, Satellite Beach, Indian Harbour Beach, Indialantic, and Melbourne Beach). PMC primarily serves the north and central regions of the county which includes Titusville, Cocoa, and Merritt Island. Titusville is on the Indian River, west of Merritt Island and the Kennedy Space Center, and south-southwest of the Canaveral National Seashore. It is a principal city of the Palm Bay–Melbourne–Titusville Metropolitan Statistical Area. The map below depicts the primary service area for PMC by zip code.
9
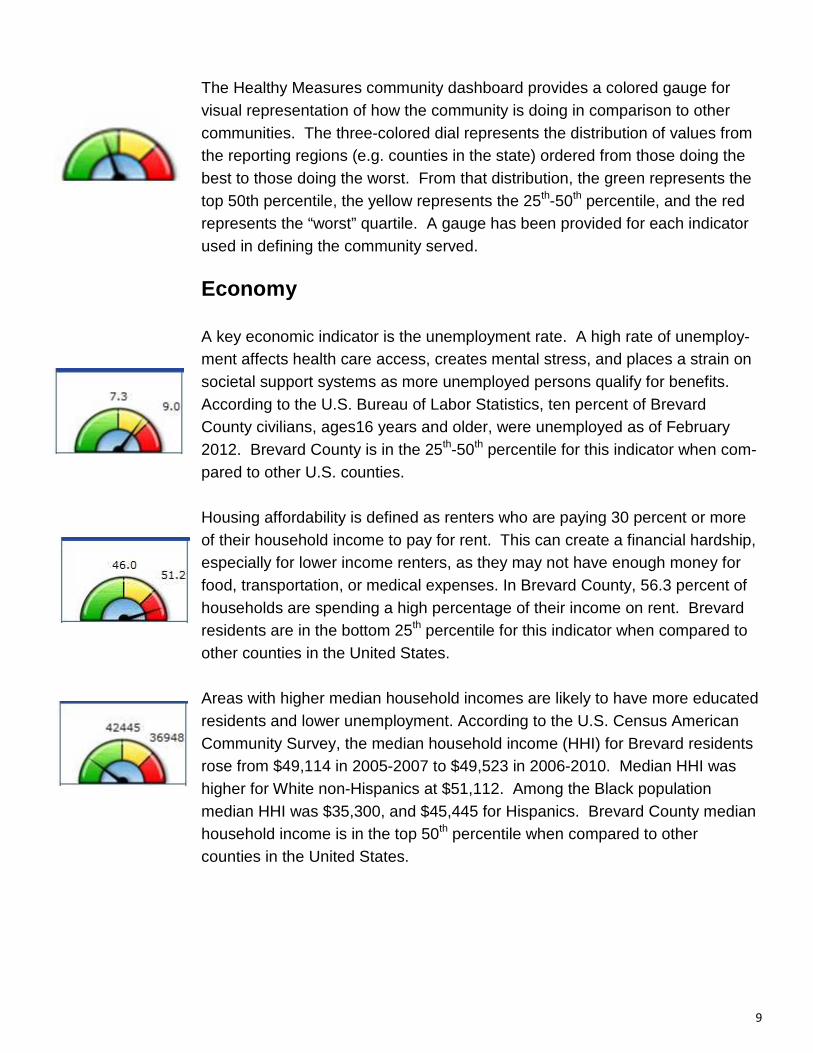
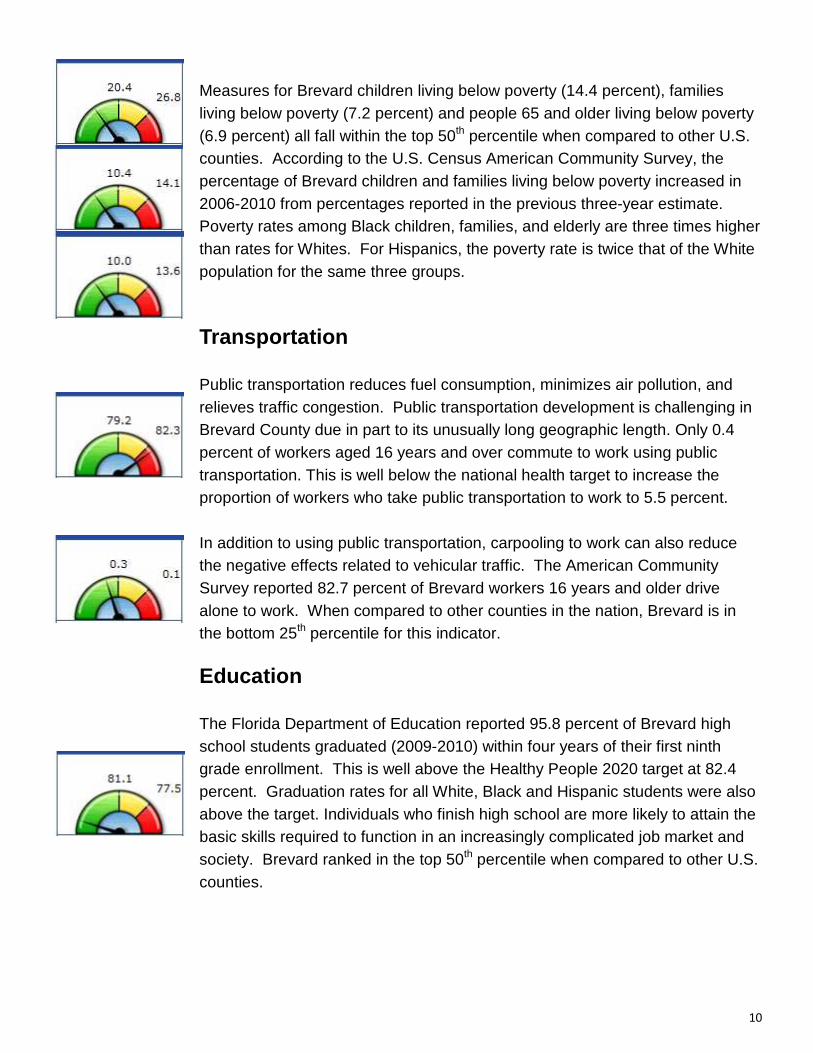
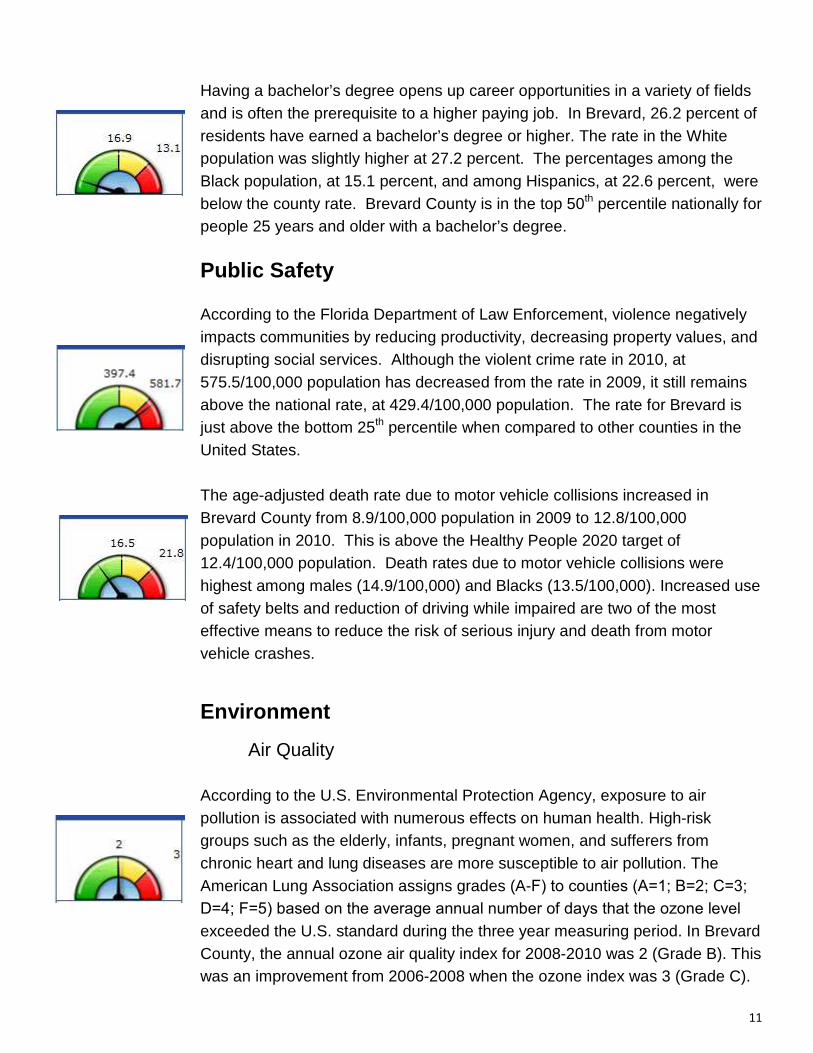
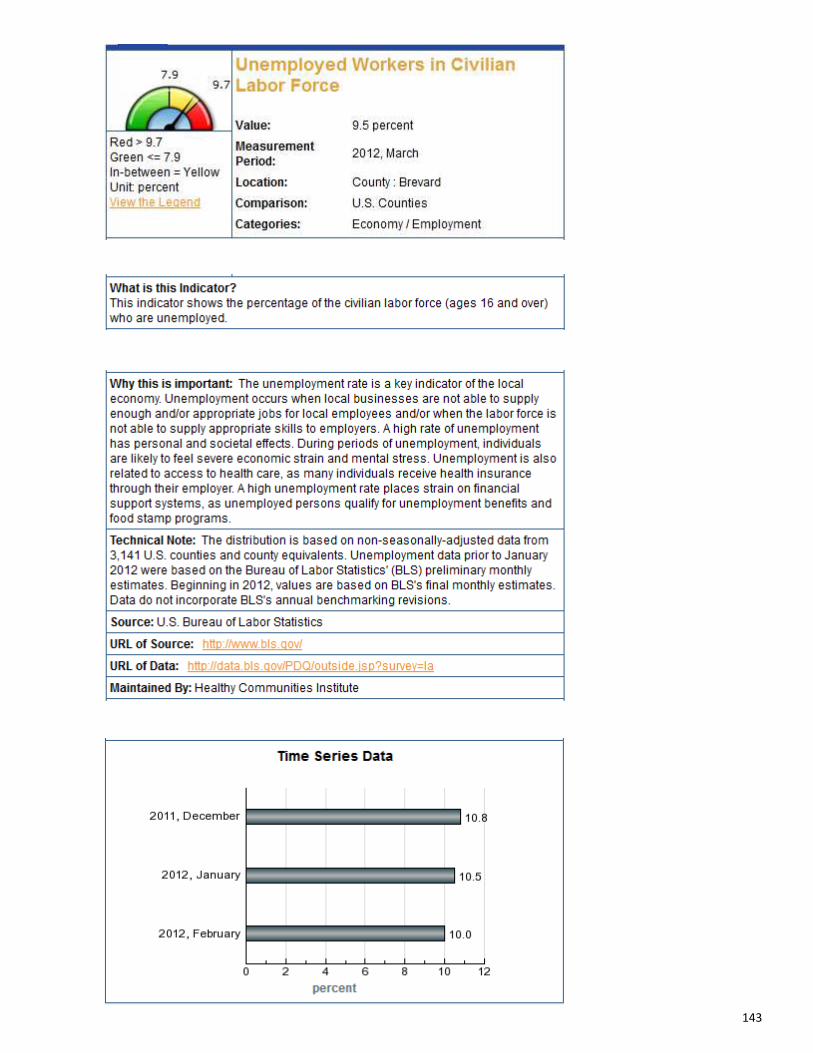
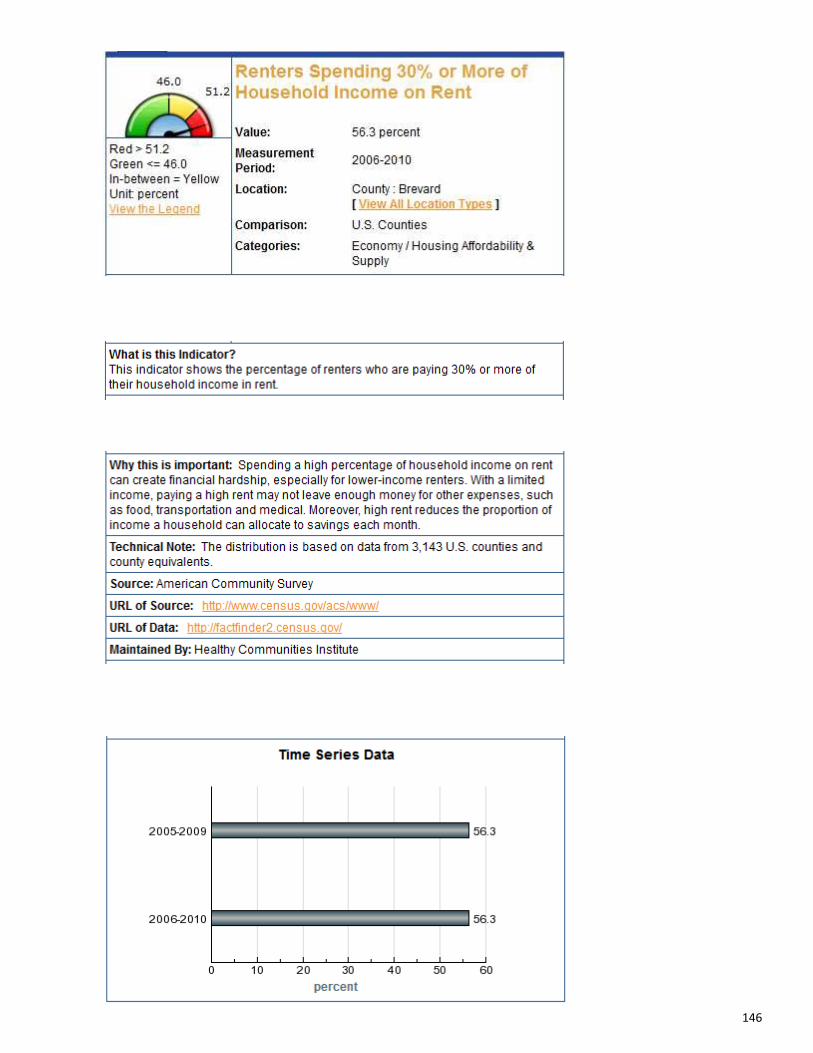
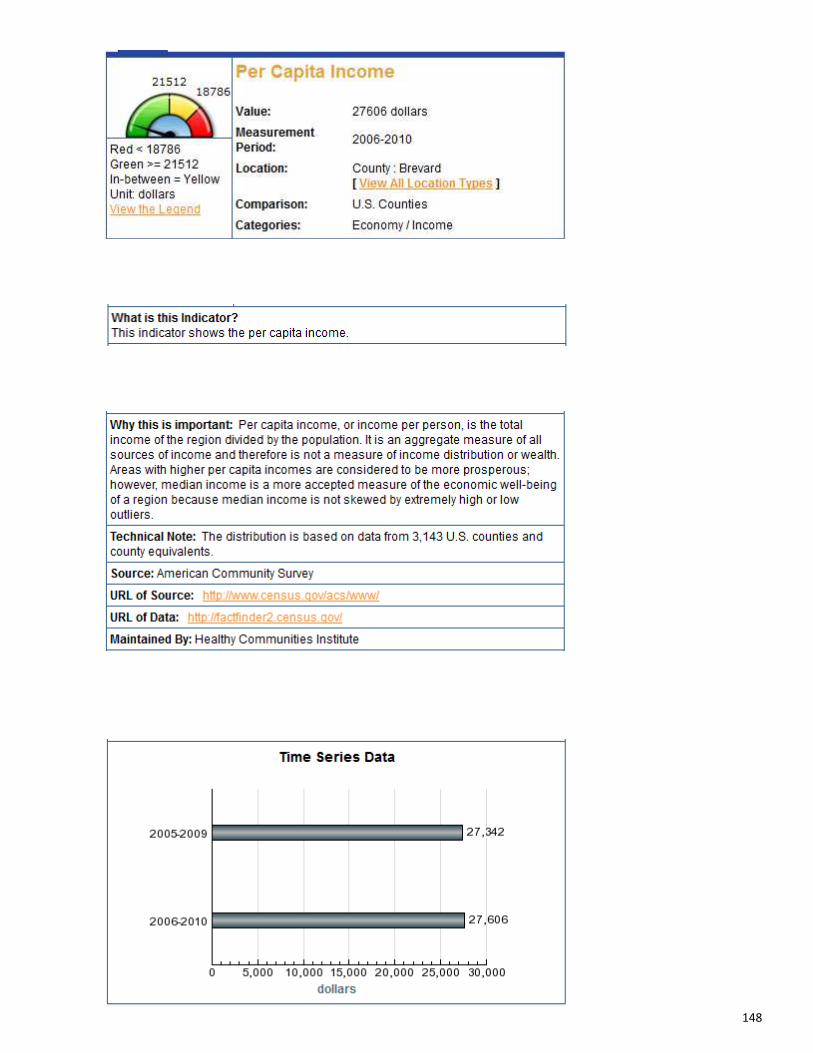
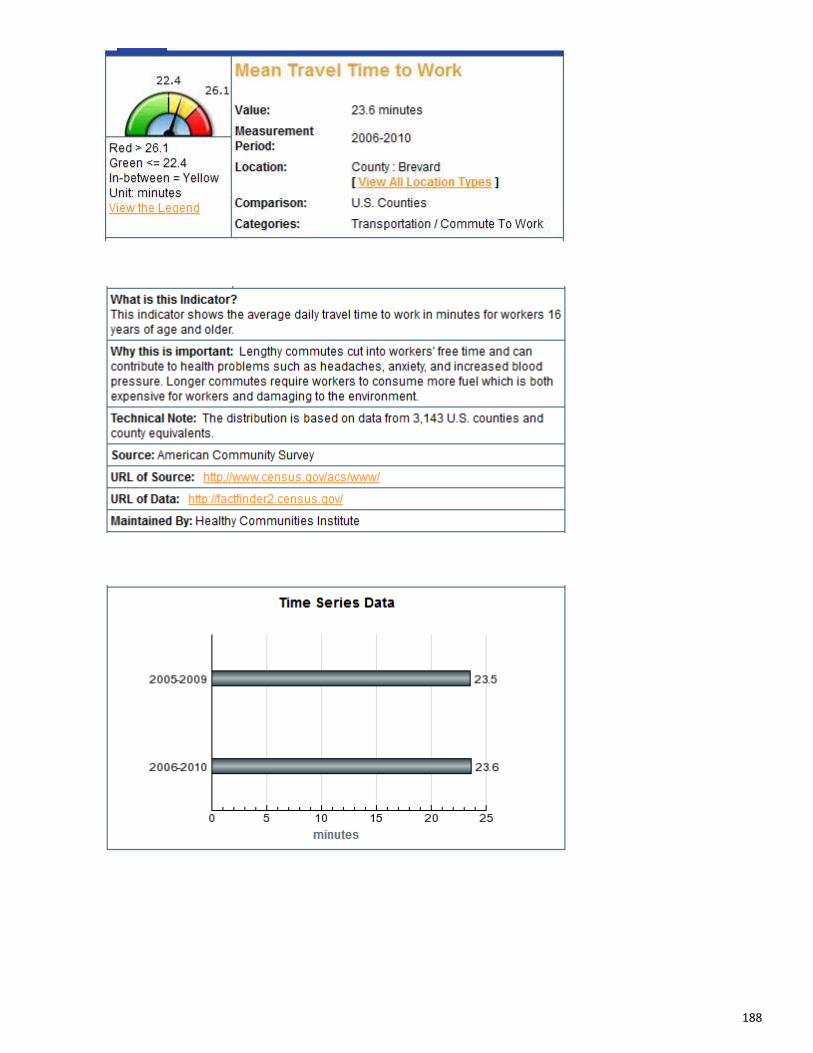
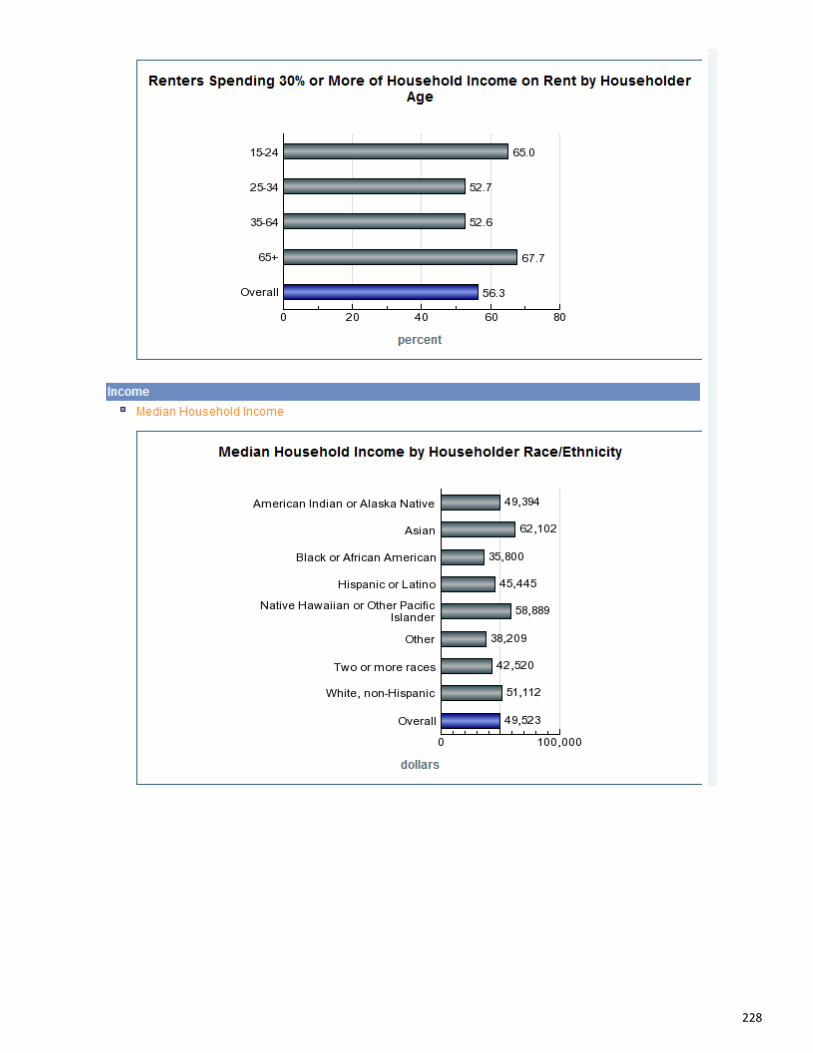
The Healthy Measures community dashboard provides a colored gauge for visual representation of how the community is doing in comparison to other communities. The three-colored dial represents the distribution of values from the reporting regions (e.g. counties in the state) ordered from those doing the best to those doing the worst. From that distribution, the green represents the top 50th percentile, the yellow represents the 25th-50th percentile, and the red represents the “worst” quartile. A gauge has been provided for each indicator used in defining the community served. Economy A key economic indicator is the unemployment rate. A high rate of unemploy-ment affects health care access, creates mental stress, and places a strain on societal support systems as more unemployed persons qualify for benefits. According to the U.S. Bureau of Labor Statistics, ten percent of Brevard County civilians, ages16 years and older, were unemployed as of February 2012. Brevard County is in the 25th-50th percentile for this indicator when com-pared to other U.S. counties. Housing affordability is defined as renters who are paying 30 percent or more of their household income to pay for rent. This can create a financial hardship, especially for lower income renters, as they may not have enough money for food, transportation, or medical expenses. In Brevard County, 56.3 percent of households are spending a high percentage of their income on rent. Brevard residents are in the bottom 25th percentile for this indicator when compared to other counties in the United States. Areas with higher median household incomes are likely to have more educated residents and lower unemployment. According to the U.S. Census American Community Survey, the median household income (HHI) for Brevard residents rose from $49,114 in 2005-2007 to $49,523 in 2006-2010. Median HHI was higher for White non-Hispanics at $51,112. Among the Black population median HHI was $35,300, and $45,445 for Hispanics. Brevard County median household income is in the top 50th percentile when compared to other counties in the United States.
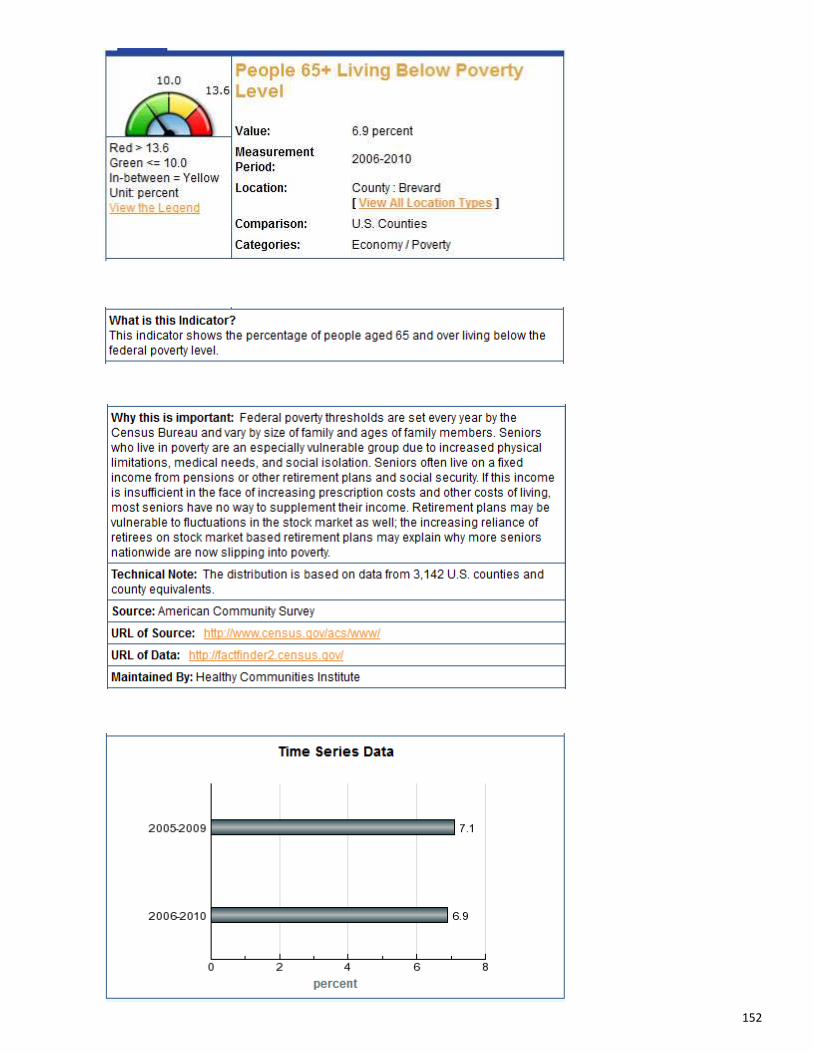
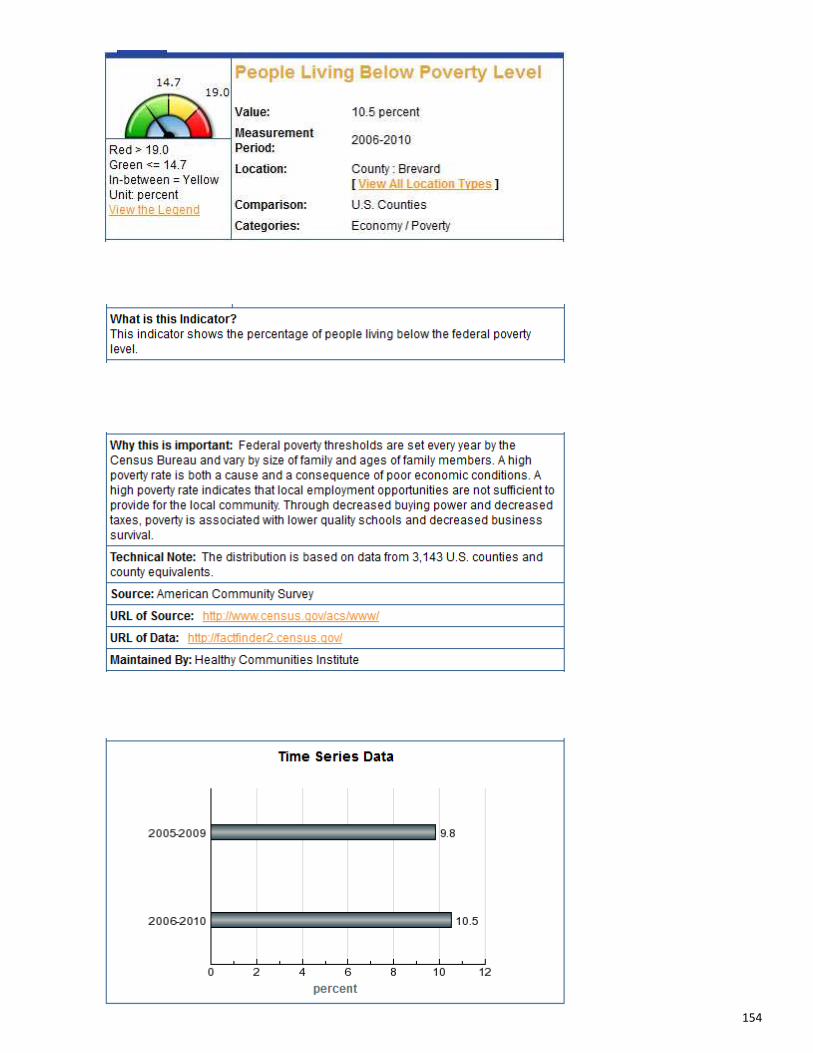
10
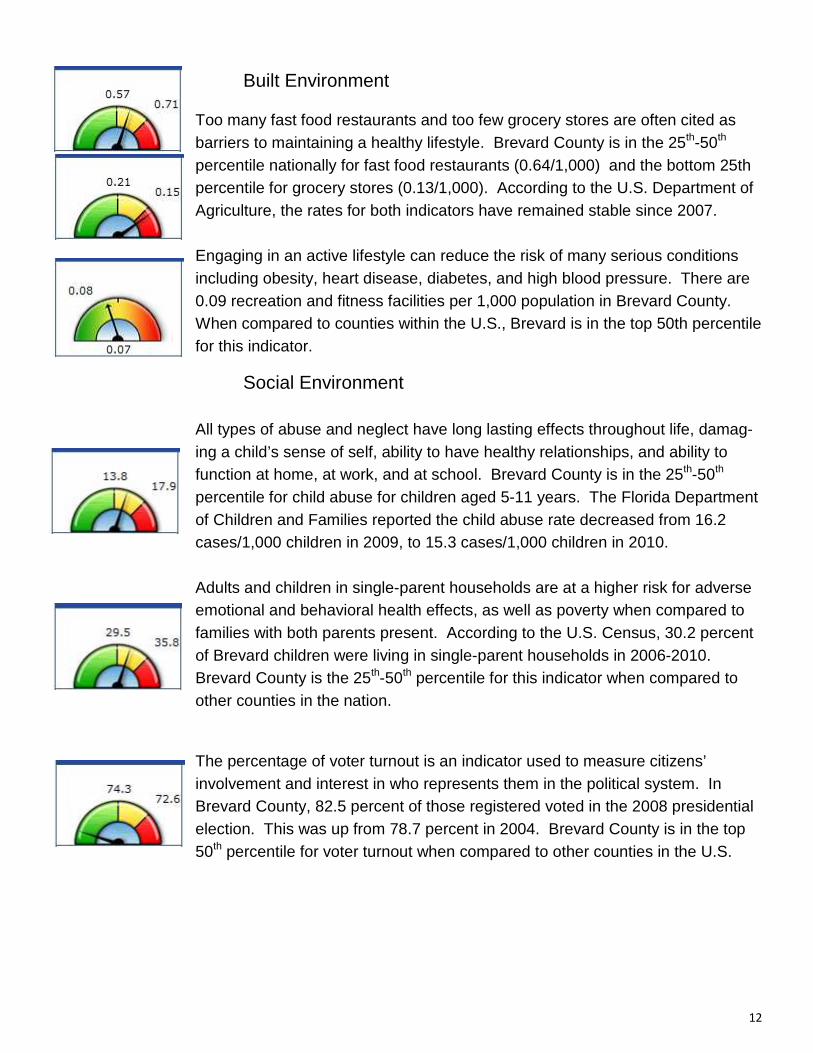
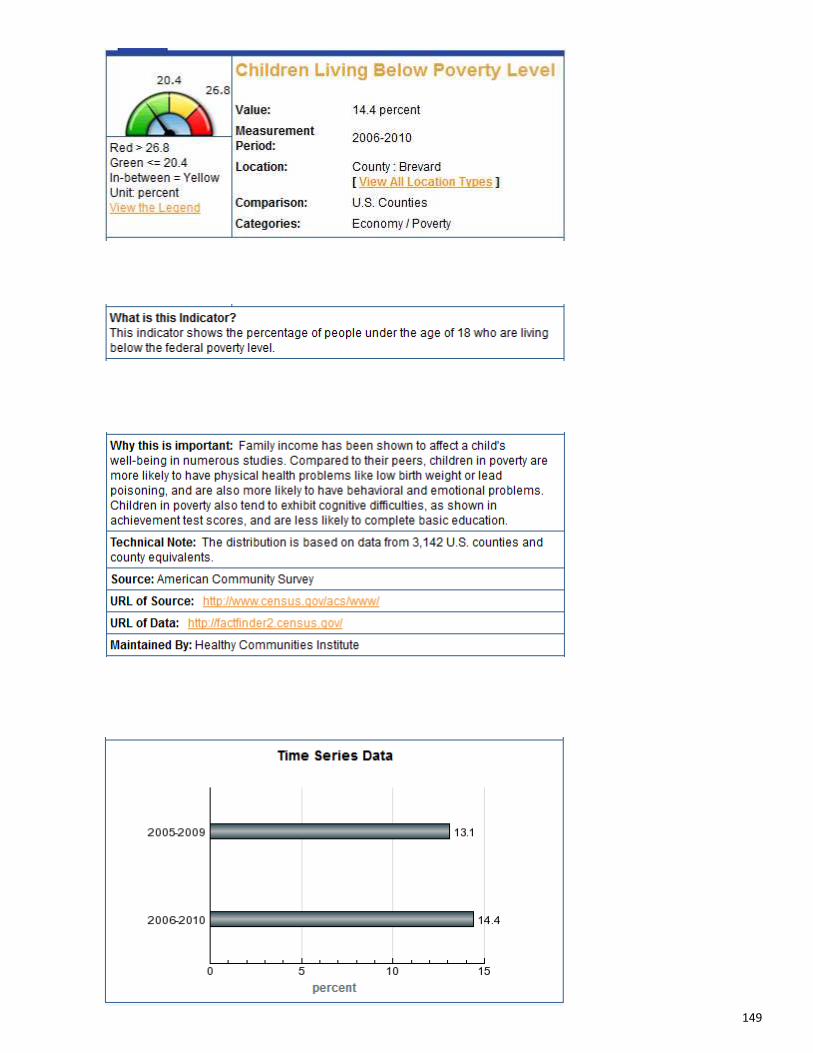
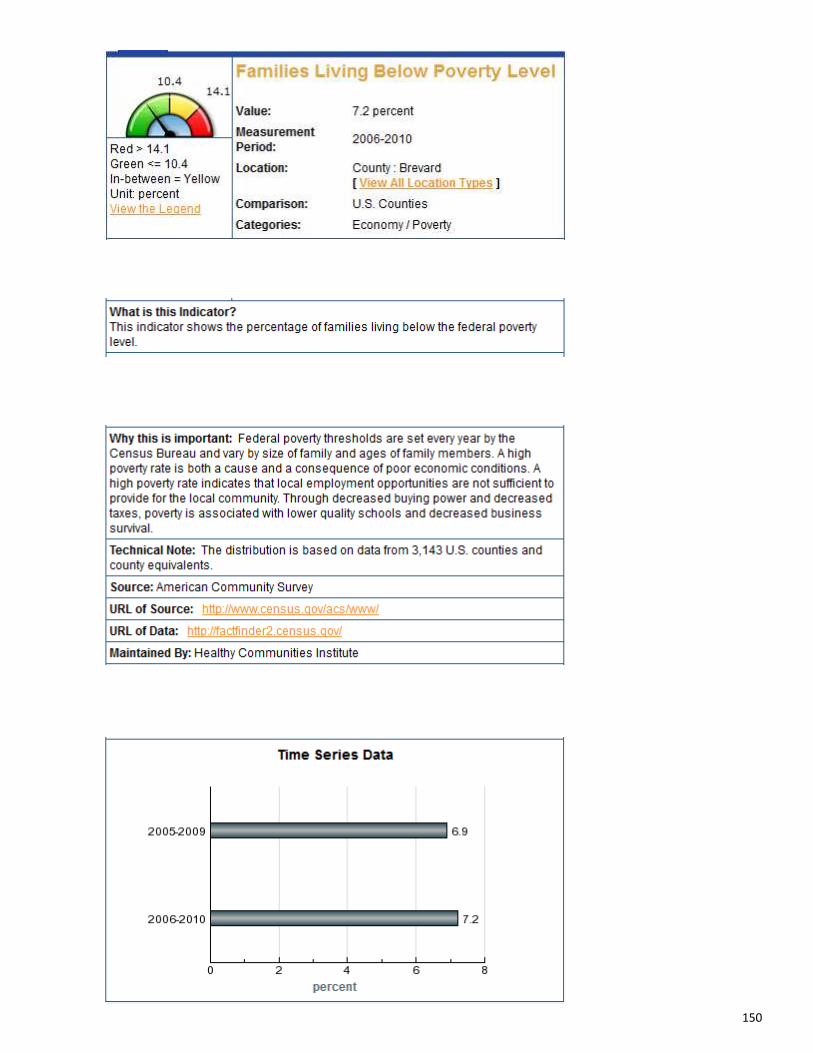
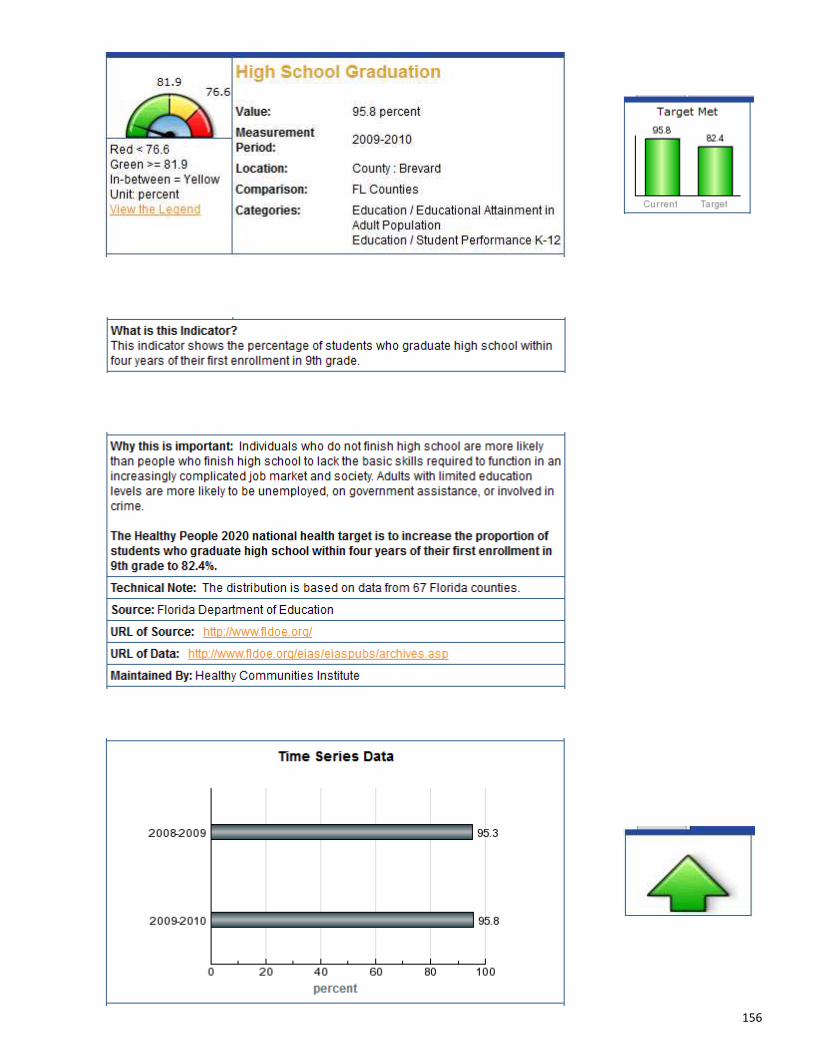
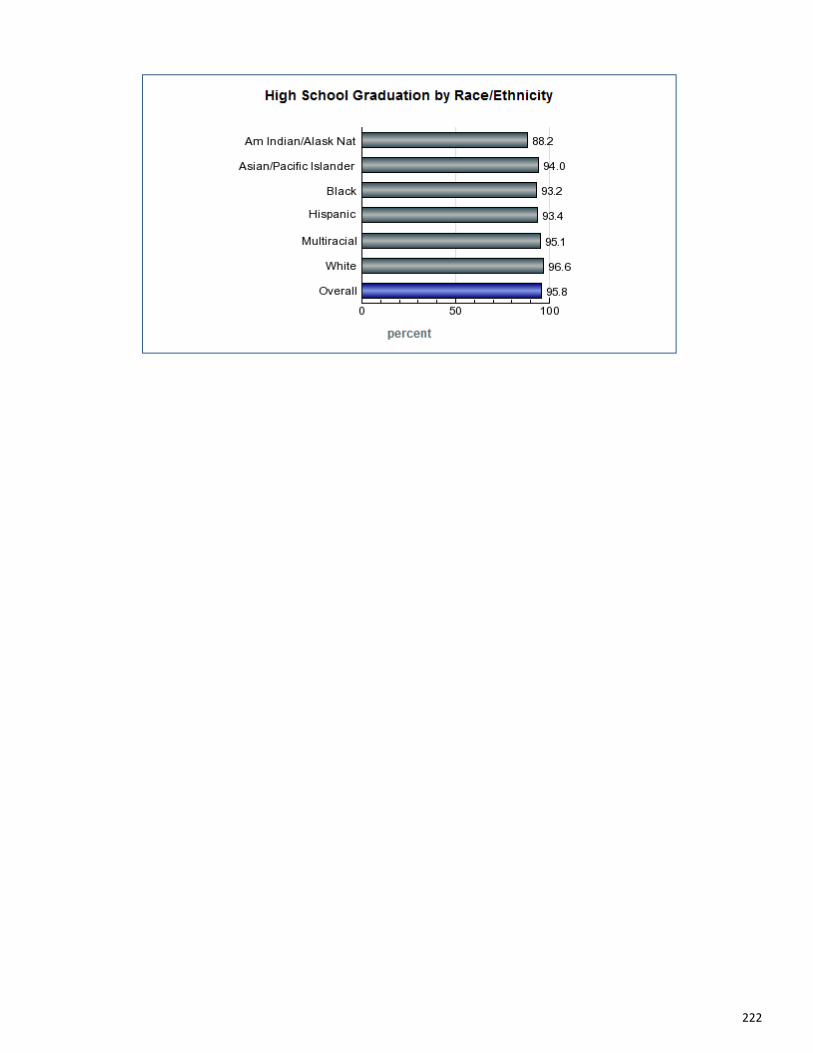
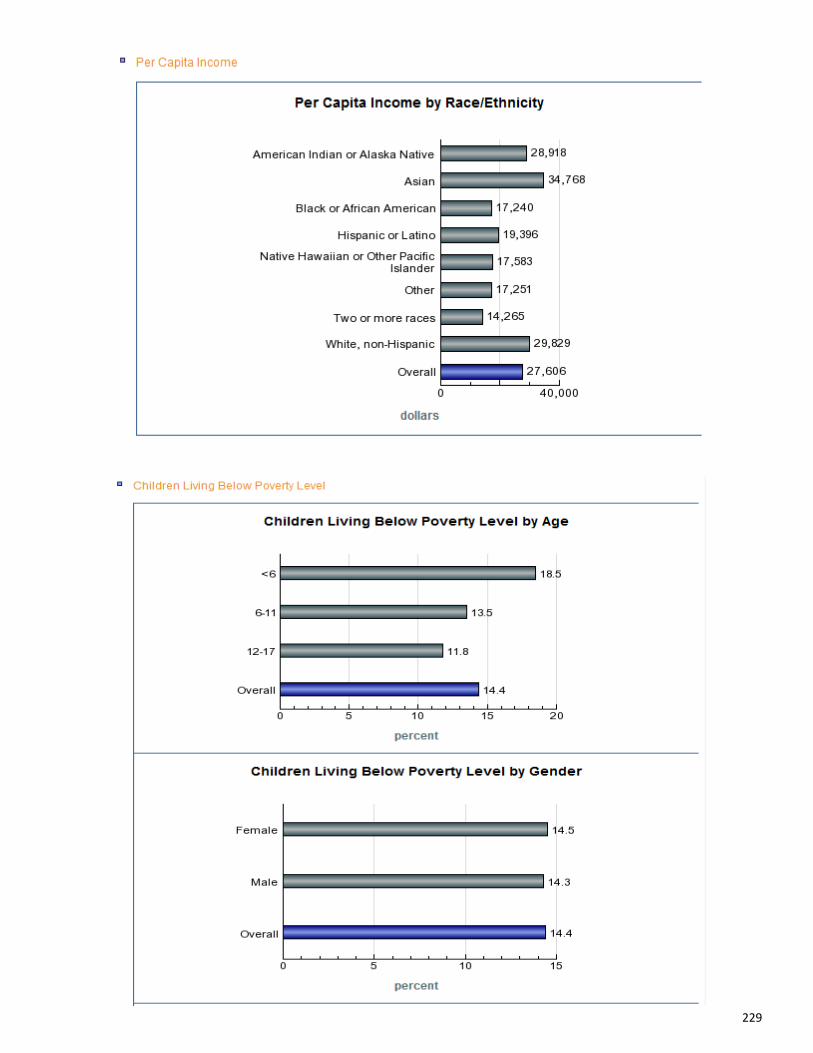
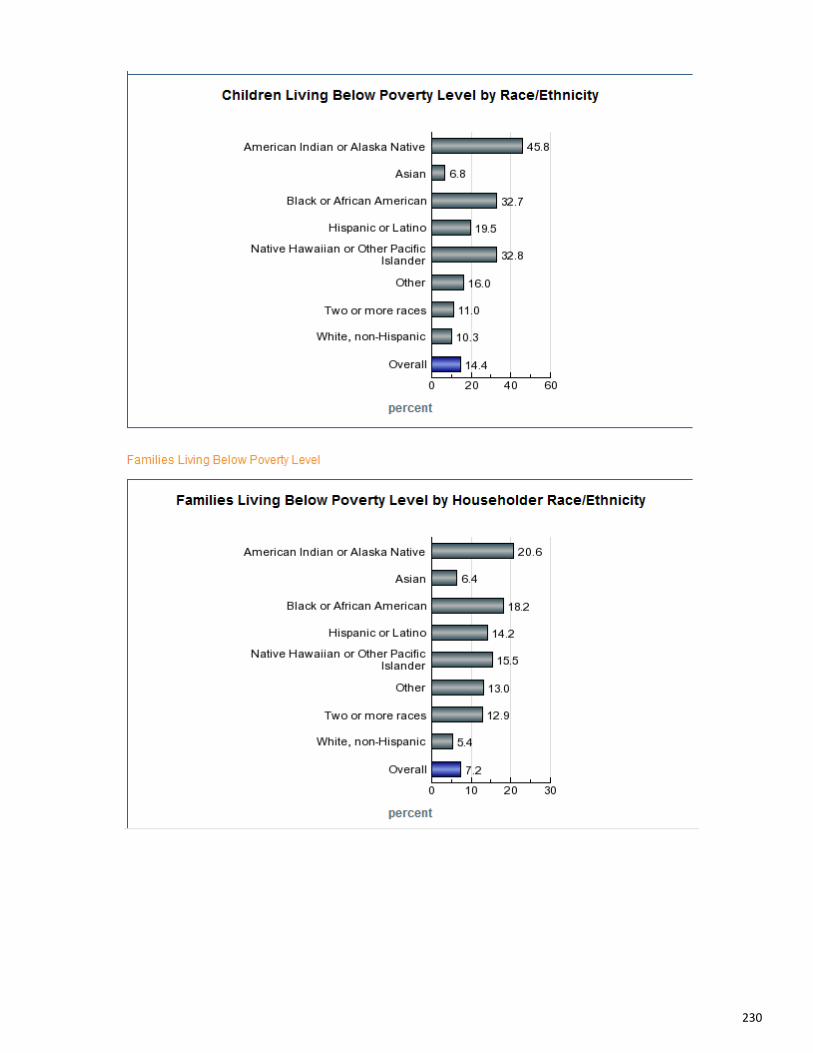
Measures for Brevard children living below poverty (14.4 percent), families living below poverty (7.2 percent) and people 65 and older living below poverty (6.9 percent) all fall within the top 50th percentile when compared to other U.S. counties. According to the U.S. Census American Community Survey, the percentage of Brevard children and families living below poverty increased in 2006-2010 from percentages reported in the previous three-year estimate. Poverty rates among Black children, families, and elderly are three times higher than rates for Whites. For Hispanics, the poverty rate is twice that of the White population for the same three groups. Transportation Public transportation reduces fuel consumption, minimizes air pollution, and relieves traffic congestion. Public transportation development is challenging in Brevard County due in part to its unusually long geographic length. Only 0.4 percent of workers aged 16 years and over commute to work using public transportation. This is well below the national health target to increase the proportion of workers who take public transportation to work to 5.5 percent. In addition to using public transportation, carpooling to work can also reduce the negative effects related to vehicular traffic. The American Community Survey reported 82.7 percent of Brevard workers 16 years and older drive alone to work. When compared to other counties in the nation, Brevard is in the bottom 25th percentile for this indicator. Education The Florida Department of Education reported 95.8 percent of Brevard high school students graduated (2009-2010) within four years of their first ninth grade enrollment. This is well above the Healthy People 2020 target at 82.4 percent. Graduation rates for all White, Black and Hispanic students were also above the target. Individuals who finish high school are more likely to attain the basic skills required to function in an increasingly complicated job market and society. Brevard ranked in the top 50th percentile when compared to other U.S. counties.
11
Having a bachelor’s degree opens up career opportunities in a variety of fields and is often the prerequisite to a higher paying job. In Brevard, 26.2 percent of residents have earned a bachelor’s degree or higher. The rate in the White population was slightly higher at 27.2 percent. The percentages among the Black population, at 15.1 percent, and among Hispanics, at 22.6 percent, were below the county rate. Brevard County is in the top 50th percentile nationally for people 25 years and older with a bachelor’s degree.
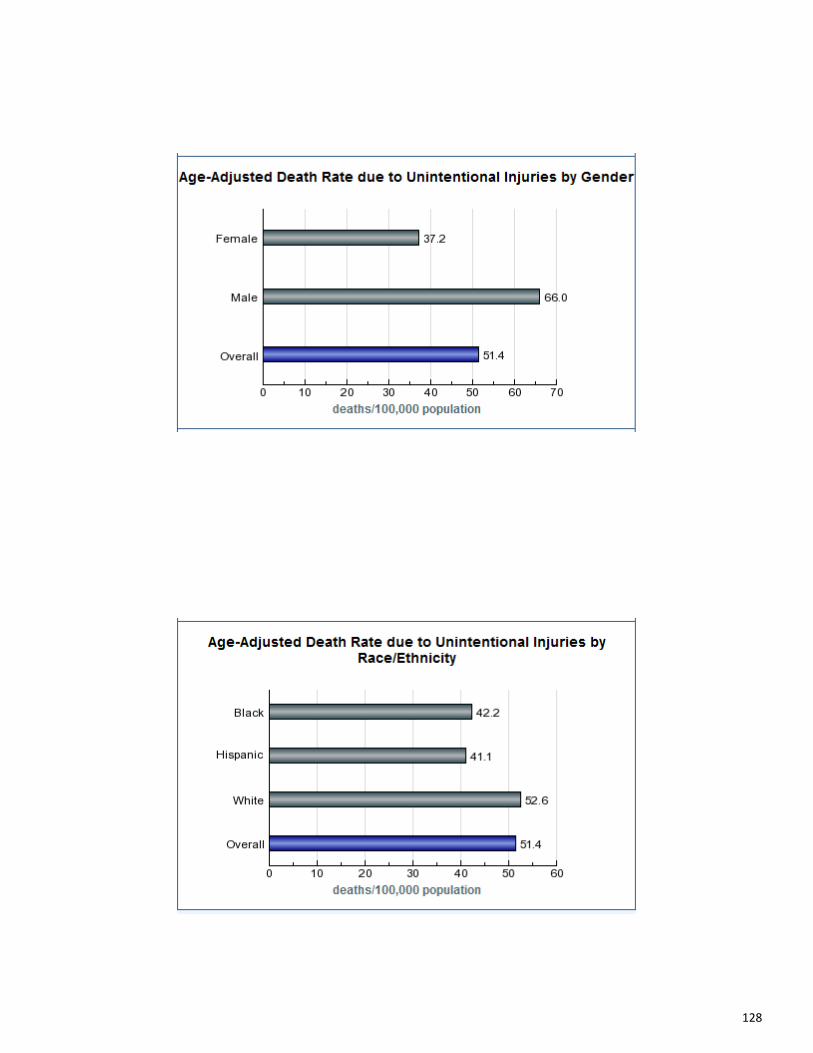
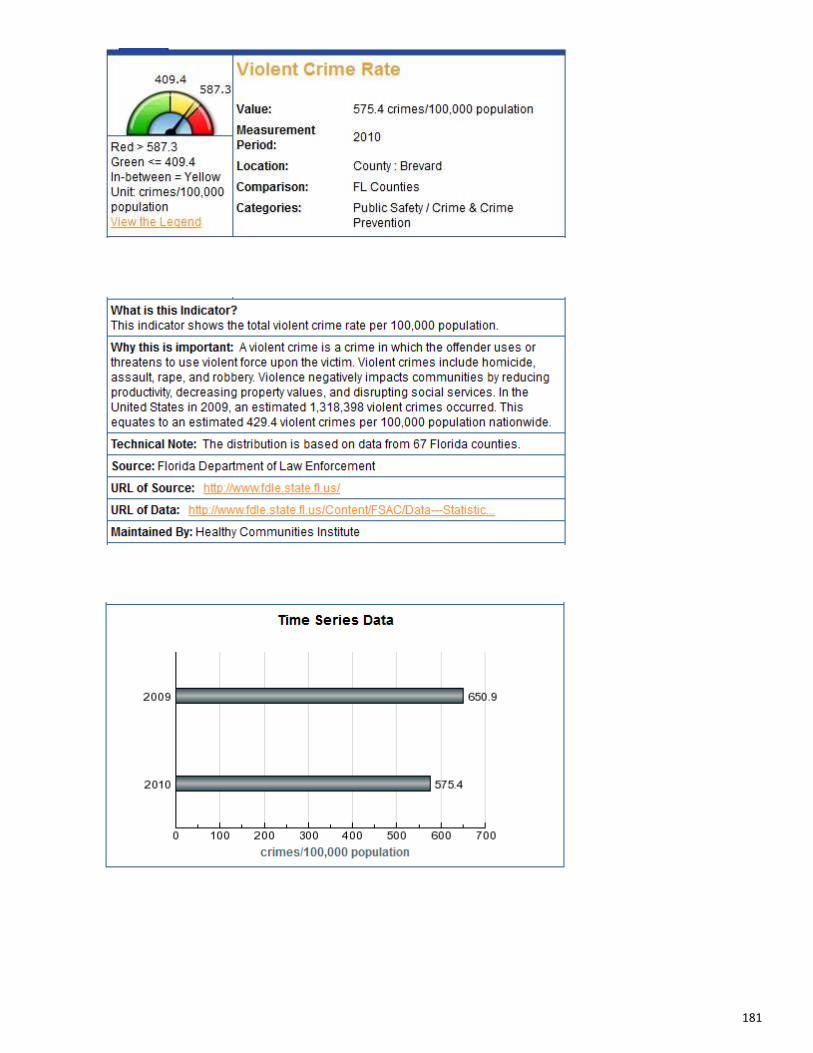
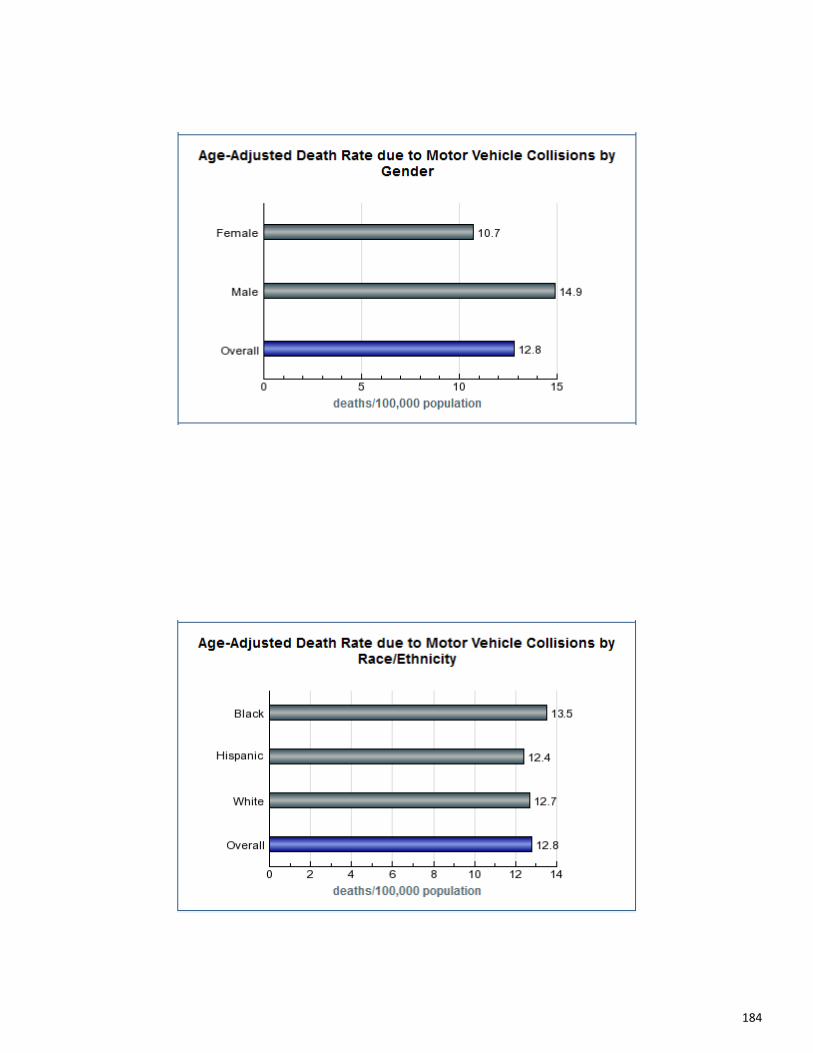
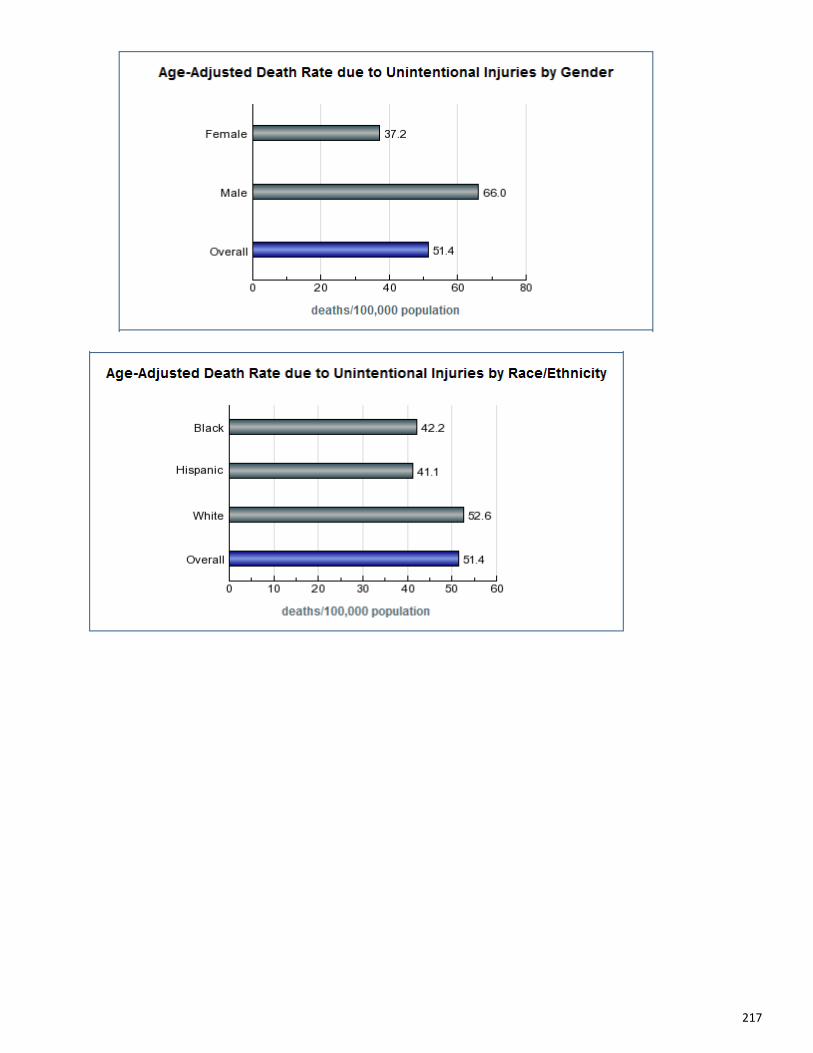
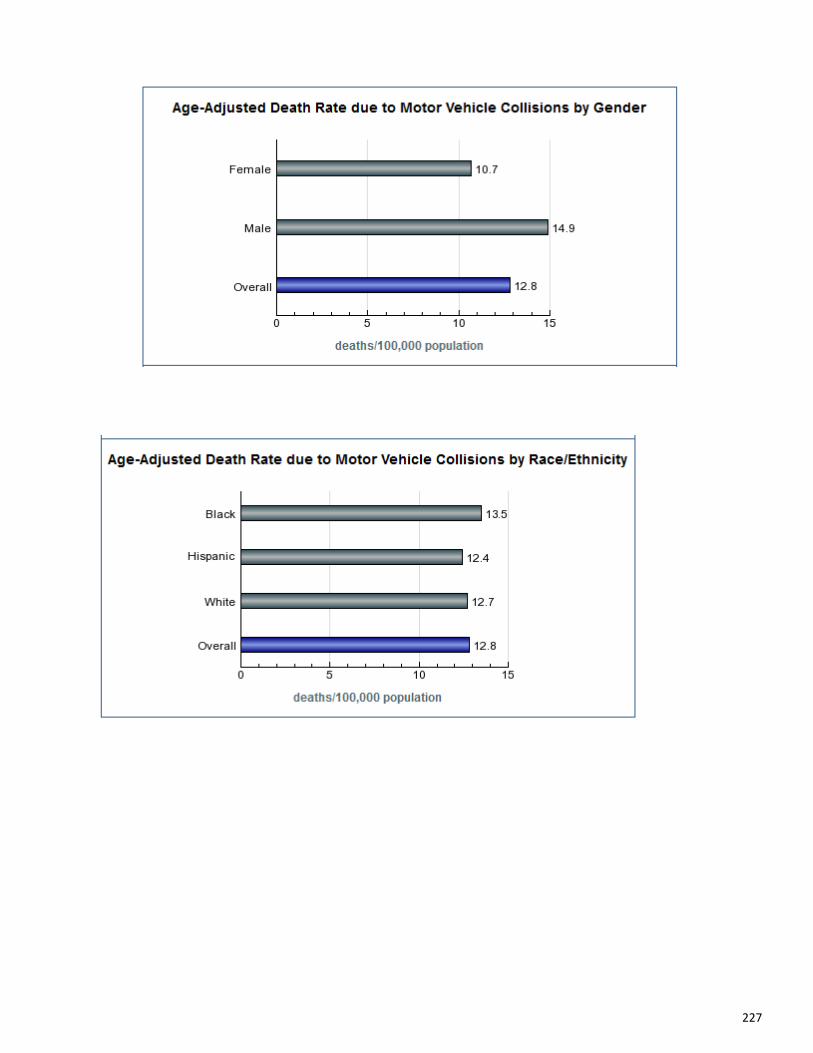
Public Safety According to the Florida Department of Law Enforcement, violence negatively impacts communities by reducing productivity, decreasing property values, and disrupting social services. Although the violent crime rate in 2010, at 575.5/100,000 population has decreased from the rate in 2009, it still remains above the national rate, at 429.4/100,000 population. The rate for Brevard is just above the bottom 25th percentile when compared to other counties in the United States. The age-adjusted death rate due to motor vehicle collisions increased in Brevard County from 8.9/100,000 population in 2009 to 12.8/100,000 population in 2010. This is above the Healthy People 2020 target of 12.4/100,000 population. Death rates due to motor vehicle collisions were highest among males (14.9/100,000) and Blacks (13.5/100,000). Increased use of safety belts and reduction of driving while impaired are two of the most effective means to reduce the risk of serious injury and death from motor vehicle crashes.
Environment
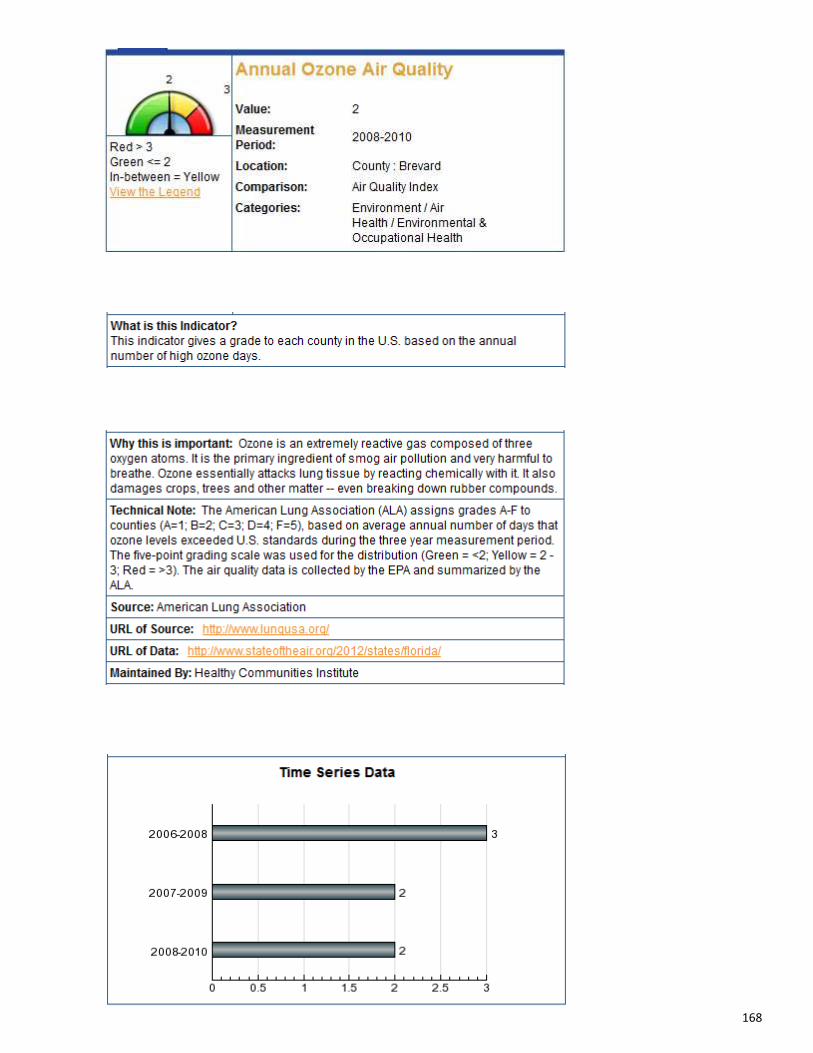
Air Quality
According to the U.S. Environmental Protection Agency, exposure to air pollution is associated with numerous effects on human health. High-risk groups such as the elderly, infants, pregnant women, and sufferers from chronic heart and lung diseases are more susceptible to air pollution. The American Lung Association assigns grades (A-F) to counties (A=1; B=2; C=3;
D=4; F=5) based on the average annual number of days that the ozone level
exceeded the U.S. standard during the three year measuring period. In Brevard County, the annual ozone air quality index for 2008-2010 was 2 (Grade B). This was an improvement from 2006-2008 when the ozone index was 3 (Grade C).
12
Built Environment
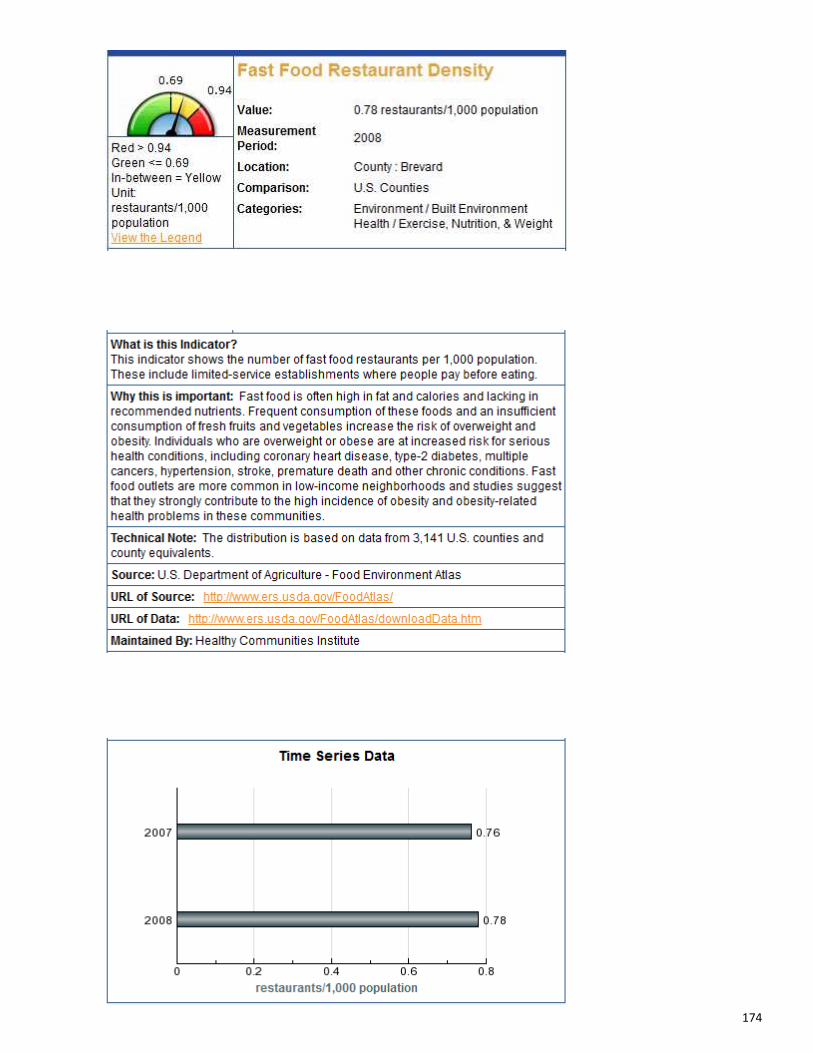
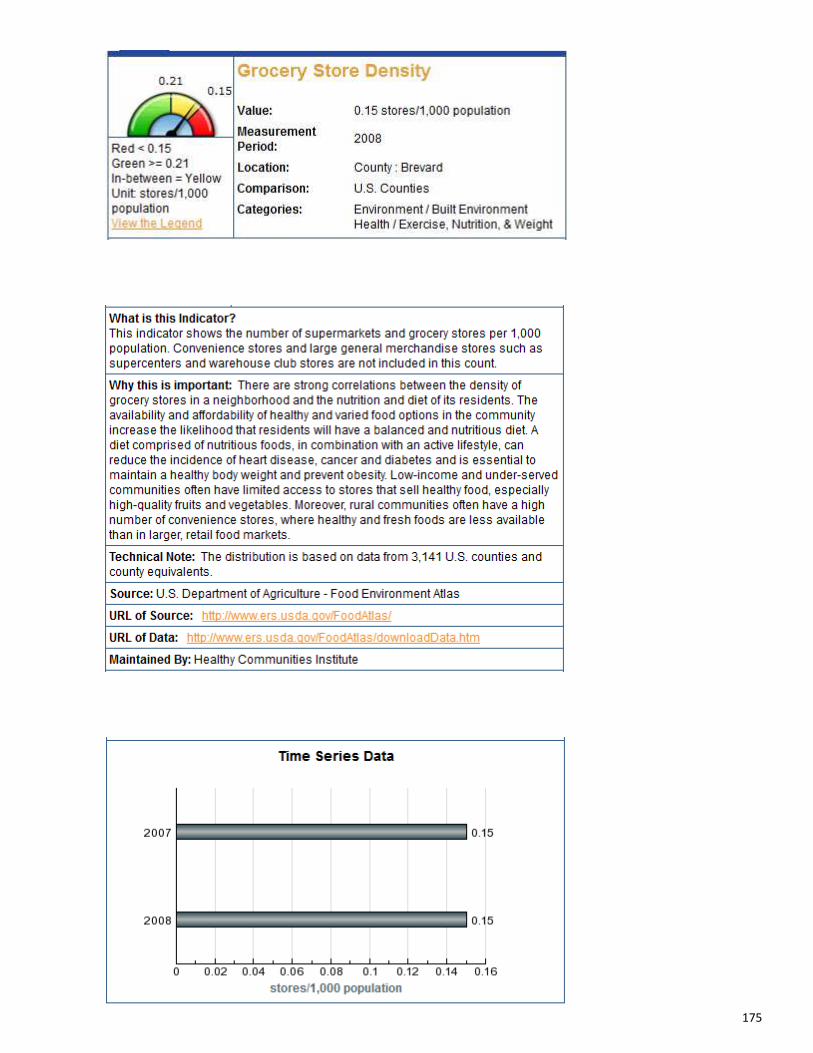
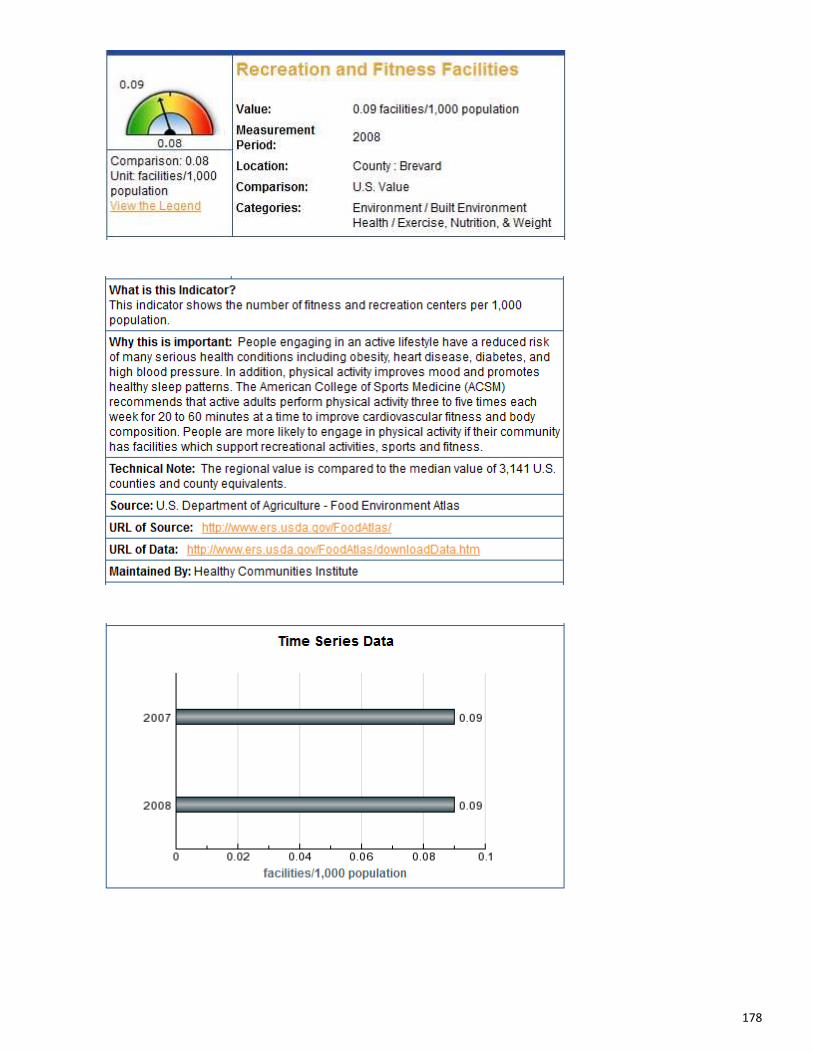
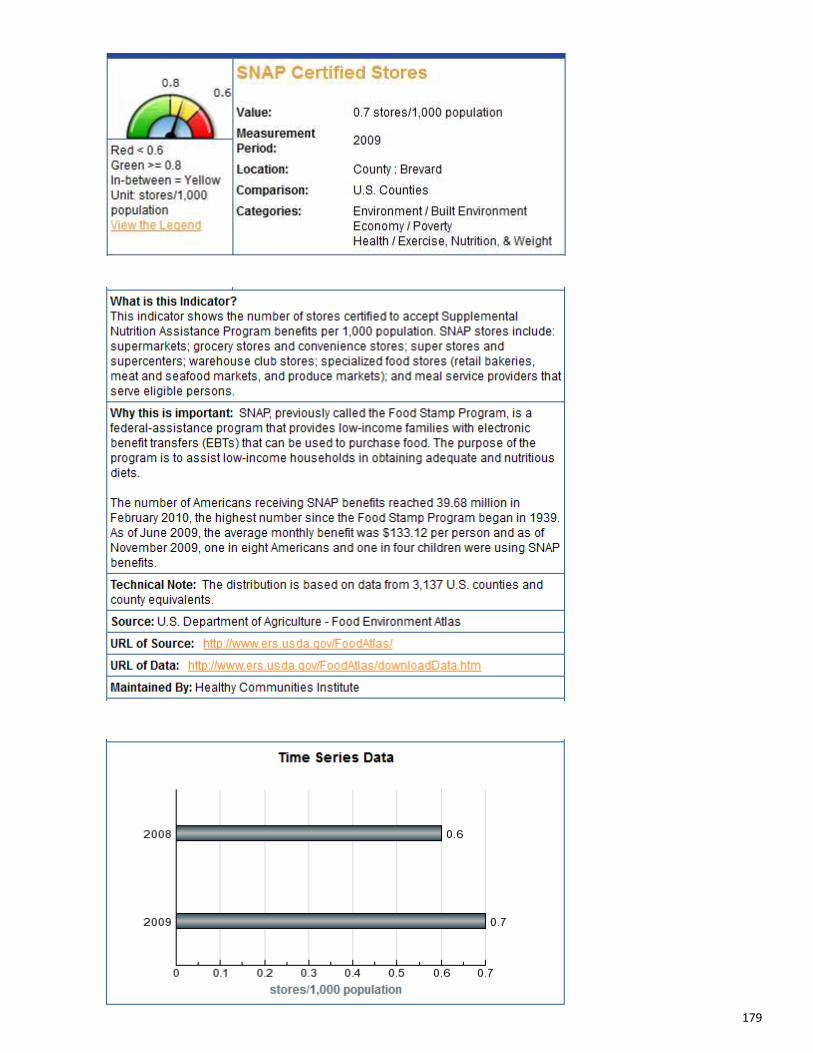
Too many fast food restaurants and too few grocery stores are often cited as barriers to maintaining a healthy lifestyle. Brevard County is in the 25th-50th percentile nationally for fast food restaurants (0.64/1,000) and the bottom 25th percentile for grocery stores (0.13/1,000). According to the U.S. Department of Agriculture, the rates for both indicators have remained stable since 2007. Engaging in an active lifestyle can reduce the risk of many serious conditions including obesity, heart disease, diabetes, and high blood pressure. There are 0.09 recreation and fitness facilities per 1,000 population in Brevard County. When compared to counties within the U.S., Brevard is in the top 50th percentile for this indicator.
Social Environment
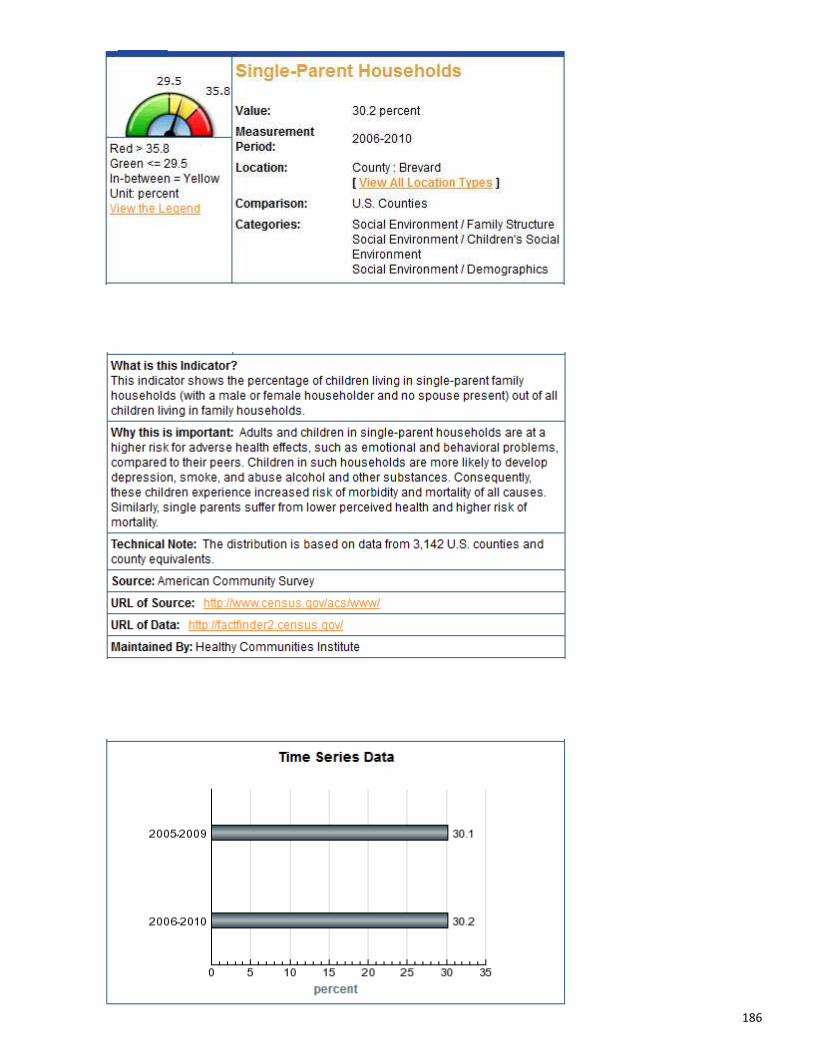
All types of abuse and neglect have long lasting effects throughout life, damag-ing a child’s sense of self, ability to have healthy relationships, and ability to function at home, at work, and at school. Brevard County is in the 25th-50th percentile for child abuse for children aged 5-11 years. The Florida Department of Children and Families reported the child abuse rate decreased from 16.2 cases/1,000 children in 2009, to 15.3 cases/1,000 children in 2010. Adults and children in single-parent households are at a higher risk for adverse emotional and behavioral health effects, as well as poverty when compared to families with both parents present. According to the U.S. Census, 30.2 percent of Brevard children were living in single-parent households in 2006-2010. Brevard County is the 25th-50th percentile for this indicator when compared to other counties in the nation.
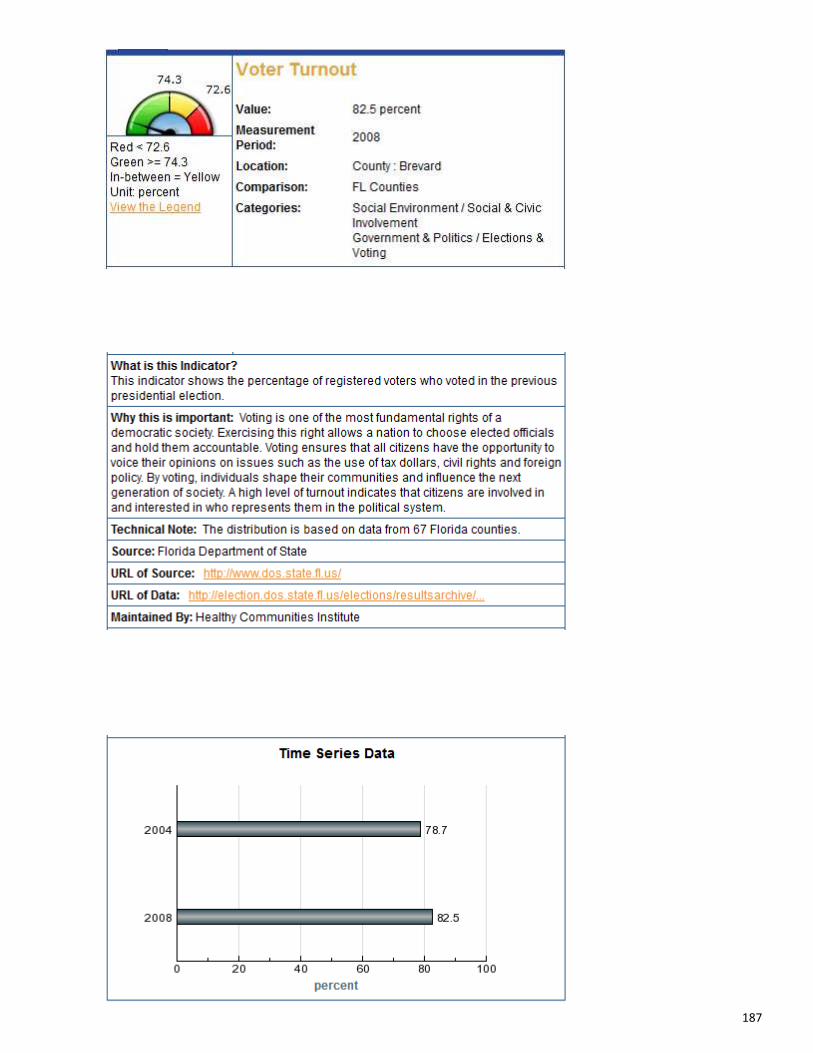
The percentage of voter turnout is an indicator used to measure citizens’ involvement and interest in who represents them in the political system. In Brevard County, 82.5 percent of those registered voted in the 2008 presidential election. This was up from 78.7 percent in 2004. Brevard County is in the top 50th percentile for voter turnout when compared to other counties in the U.S.
13
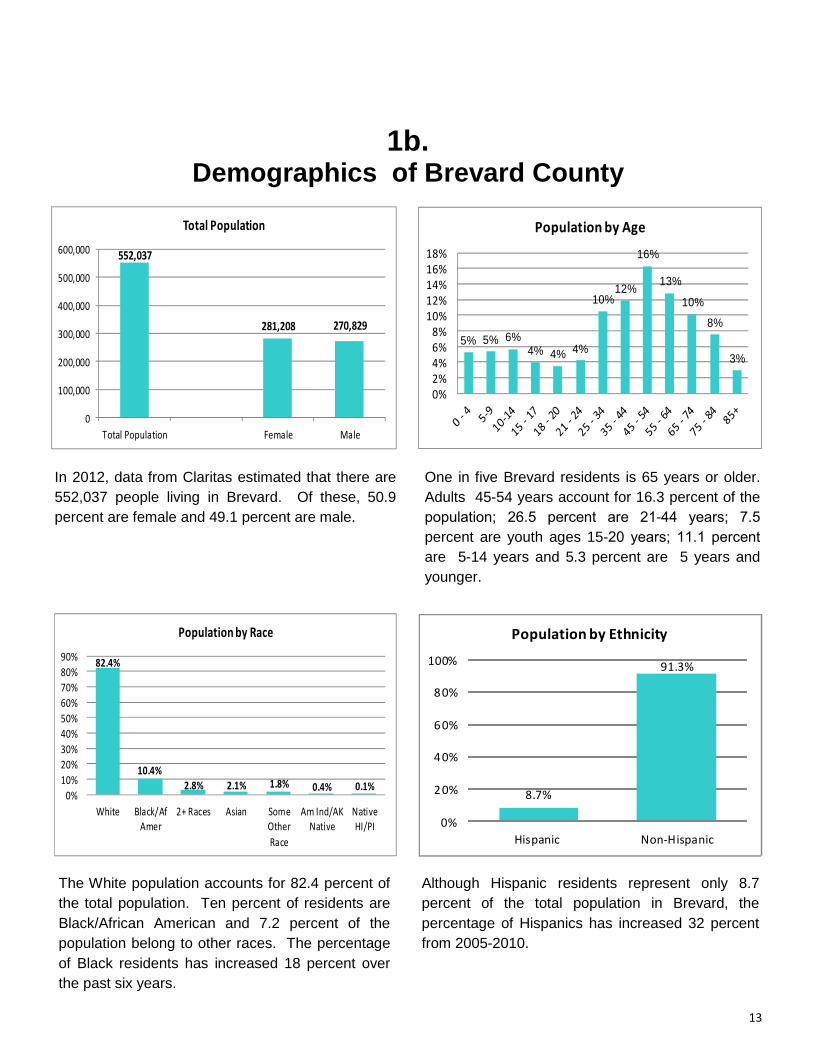
1b. Demographics of Brevard County
In 2012, data from Claritas estimated that there are 552,037 people living in Brevard. Of these, 50.9 percent are female and 49.1 percent are male.
One in five Brevard residents is 65 years or older. Adults 45-54 years account for 16.3 percent of the population; 26.5 percent are 21-44 years; 7.5
percent are youth ages 15-20 years; 11.1 percent
are 5-14 years and 5.3 percent are 5 years and younger.
The White population accounts for 82.4 percent of the total population. Ten percent of residents are Black/African American and 7.2 percent of the population belong to other races. The percentage of Black residents has increased 18 percent over the past six years.
Although Hispanic residents represent only 8.7 percent of the total population in Brevard, the percentage of Hispanics has increased 32 percent from 2005-2010.
82.4%
10.4%
2.8% 2.1% 1.8% 0.4% 0.1%0%
10%
20%
30%
40%
50%
60%
70%
80%
90%
White Black/Af
Amer
2+ Races Asian Some
Other
Race
Am Ind/AK
Native
Native
HI/PI
Population by Race
8.7%
91.3%
0%
20%
40%
60%
80%
100%
Hispanic Non-Hispanic
Population by Ethnicity
552,037
281,208 270,829
0
100,000
200,000
300,000
400,000
500,000
600,000
Total Population Female Male
Total Population
5% 5% 6%4% 4% 4%
10%12%
16%
13%
10%
8%
3%
0%
2%
4%
6%
8%
10%
12%
14%
16%
18%
Population by Age
14
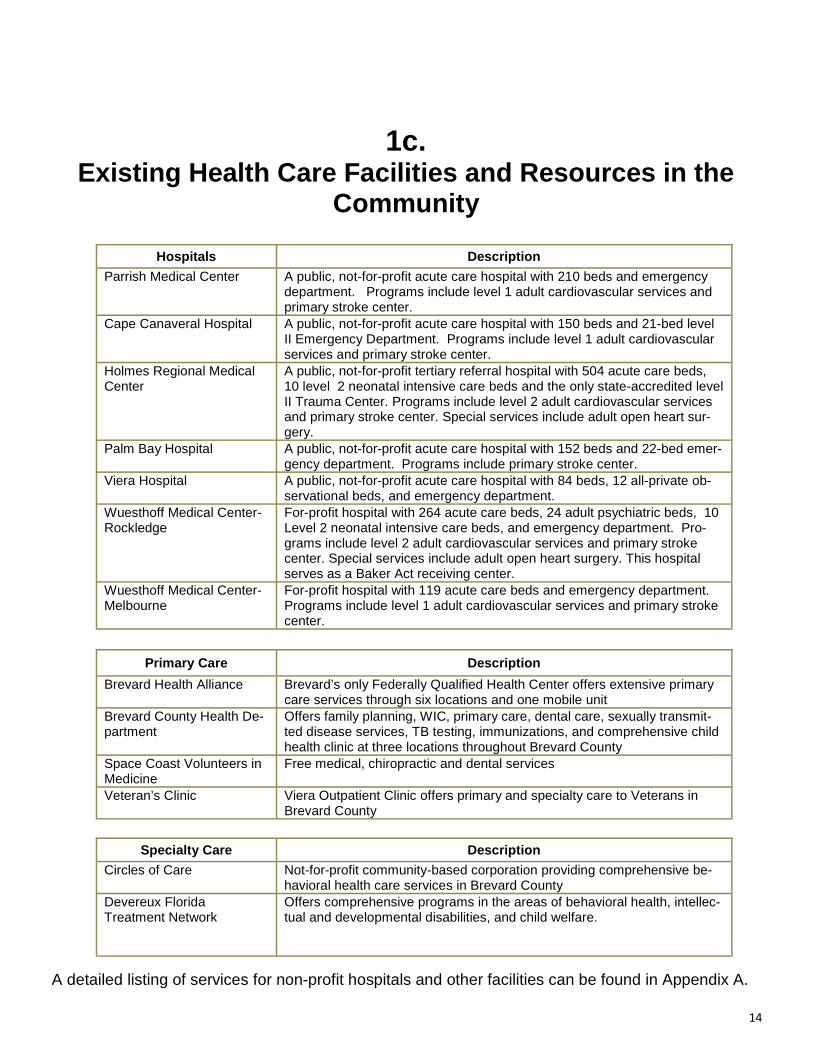
1c. Existing Health Care Facilities and Resources in th e
Community
Hospitals Description
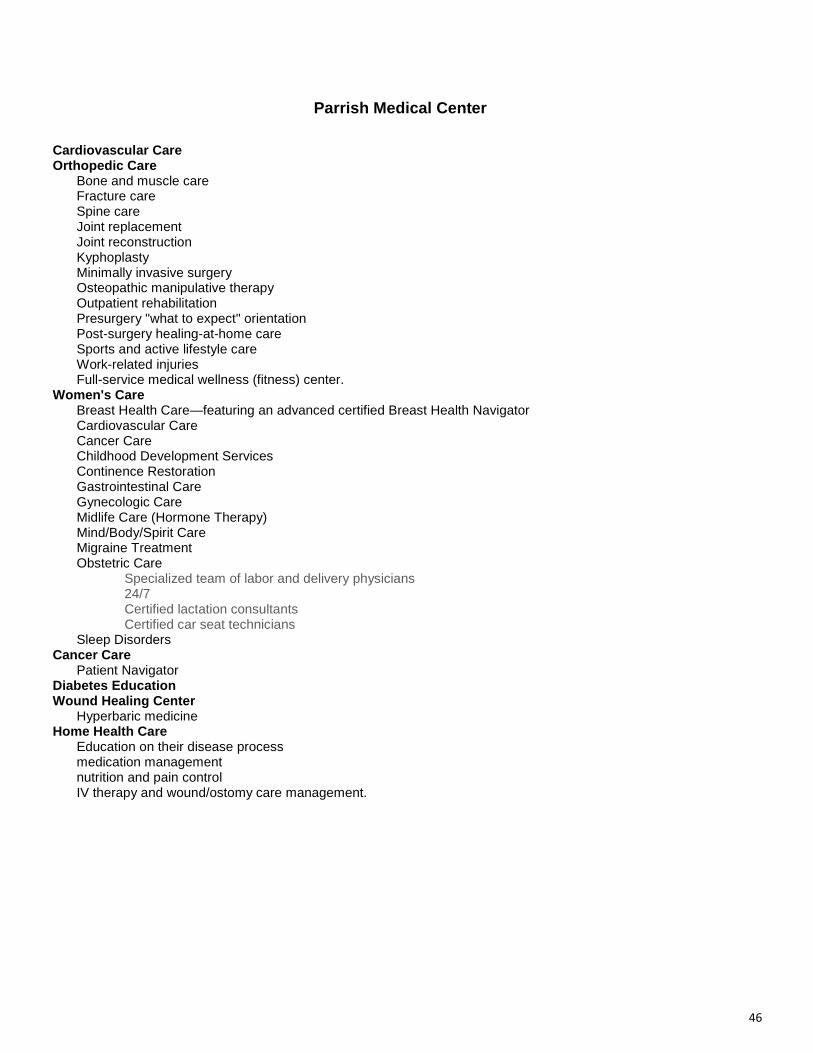
Parrish Medical Center A public, not-for-profit acute care hospital with 210 beds and emergency department. Programs include level 1 adult cardiovascular services and primary stroke center.
Cape Canaveral Hospital A public, not-for-profit acute care hospital with 150 beds and 21-bed level II Emergency Department. Programs include level 1 adult cardiovascular services and primary stroke center.
Holmes Regional Medical Center
A public, not-for-profit tertiary referral hospital with 504 acute care beds, 10 level 2 neonatal intensive care beds and the only state-accredited level II Trauma Center. Programs include level 2 adult cardiovascular services and primary stroke center. Special services include adult open heart sur-gery.
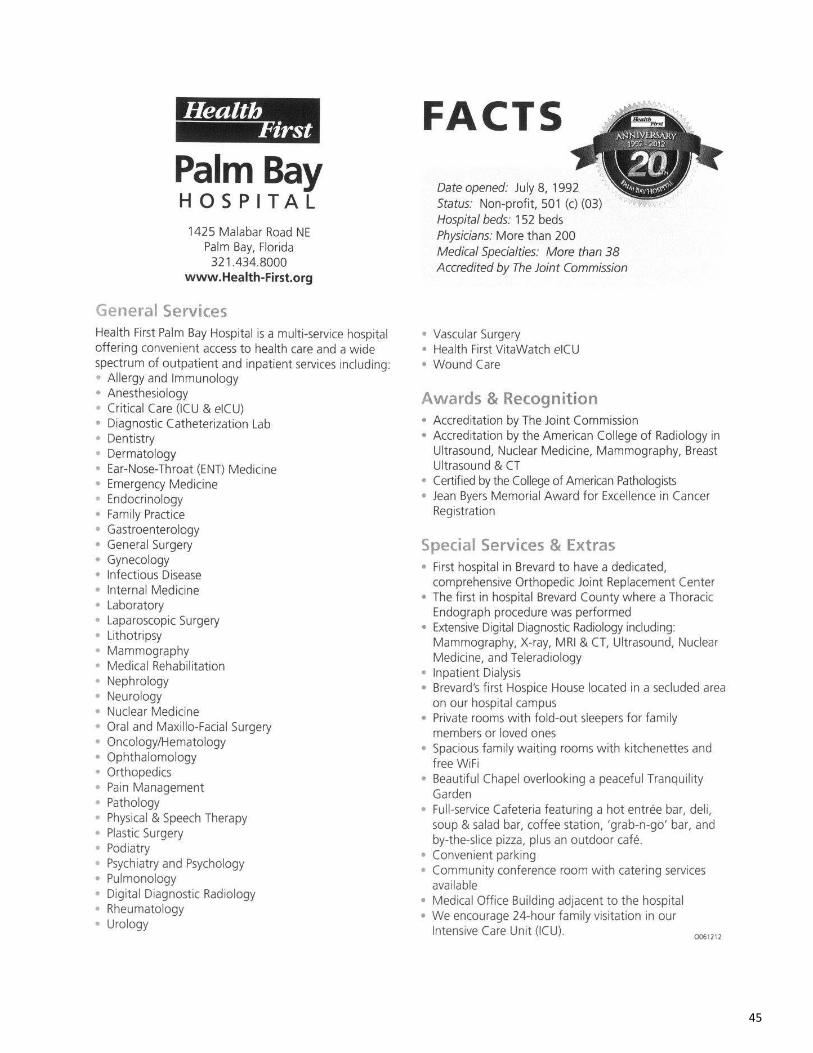
Palm Bay Hospital A public, not-for-profit acute care hospital with 152 beds and 22-bed emer-gency department. Programs include primary stroke center.
Viera Hospital A public, not-for-profit acute care hospital with 84 beds, 12 all-private ob-servational beds, and emergency department.
Wuesthoff Medical Center-Rockledge
For-profit hospital with 264 acute care beds, 24 adult psychiatric beds, 10 Level 2 neonatal intensive care beds, and emergency department. Pro-grams include level 2 adult cardiovascular services and primary stroke center. Special services include adult open heart surgery. This hospital serves as a Baker Act receiving center.
Wuesthoff Medical Center-Melbourne
For-profit hospital with 119 acute care beds and emergency department. Programs include level 1 adult cardiovascular services and primary stroke center.
Primary Care Description
Brevard Health Alliance Brevard’s only Federally Qualified Health Center offers extensive primary care services through six locations and one mobile unit
Brevard County Health De-partment
Offers family planning, WIC, primary care, dental care, sexually transmit-ted disease services, TB testing, immunizations, and comprehensive child health clinic at three locations throughout Brevard County
Space Coast Volunteers in Medicine
Free medical, chiropractic and dental services
Veteran’s Clinic Viera Outpatient Clinic offers primary and specialty care to Veterans in Brevard County
Specialty Care Description
Circles of Care Not-for-profit community-based corporation providing comprehensive be-havioral health care services in Brevard County
Devereux Florida Treatment Network
Offers comprehensive programs in the areas of behavioral health, intellec-tual and developmental disabilities, and child welfare.
A detailed listing of services for non-profit hospitals and other facilities can be found in Appendix A.
15
1d. How the Health Data was Obtained
The data for the Community Health Needs Assessment was gathered using the Healthy Measures for East Central Florida online Health Community Network (HCN). This customizable web-based community dashboard, designed by Healthy Communities Institute (HCI), delivers access to high-quality data and decision support. The HCN provides health indicator tracking, best practice sharing and community development to help improve the health and environmental sustainability of communities in East Central Florida. Using Healthy Measures the Health Council collected secondary data by county to define the demographic composition of the community and determine the overall health status of residents living in East Central Florida. Data from the U.S. 2010 Census was used to create a demographic profile for each county. The health assessment included county-level indicators for mortality, morbidity, years potential life lost, access to care issues, behavioral risk factors, health screenings, immunizations, maternal and child health, and health conditions. Over 100 indicators were collected and analyzed for each hospital report. Data were provided by race/ethnicity and age when available. Zip code level data was provided for preterm and low birth weight infants. The health indicators traditionally used to assess community health status present some limitations when applied to assessing the health of children and adolescents. Survey data can be added to provide a more comprehensive assessment. Additional data was collected from Florida Community Health Assessment Resource Tool Set (CHARTS) and the Florida Youth Substance Abuse Survey to supplement health status data on East Central Florida youth. Indicators for the social determinants of health were also gathered from Healthy Measures. These define the community conditions in which people are born, live, work and play. A review of these indicators can help identify inequities that can affect health status. The data sources used for the CHNA included: Florida Risk Factor Surveillance System (BRFSS);
U.S. Census Bureau, U.S. Census American Community Survey; Florida Department of Health,
Office of Planning, Evaluation & Data Analysis; County Health Rankings; Florida Department of
Health, Bureau of Vital Statistics; University of Miami (FL) Medical School; Florida Cancer Data
System, Bureau of Epidemiology; Florida Youth Tobacco Survey; Florida Youth Substance Abuse
Survey; U.S. Bureau of Labor Statistics; U.S. Department of Agriculture – Food Environment Atlas;
Florida Department of Education; National Center for Educational Statistics; American Lung
Association; AIRNow; U.S. Environmental Protection Agency; Florida Department of Law

16
Enforcement; Florida Department of Children and Families; Florida Department Of Health,
Bureau of STD Prevention and Control; Florida Department of Highway Safety and Motor
Vehicles; Florida Department of Juvenile Justice; Claritas; and Healthy People 2020.
17
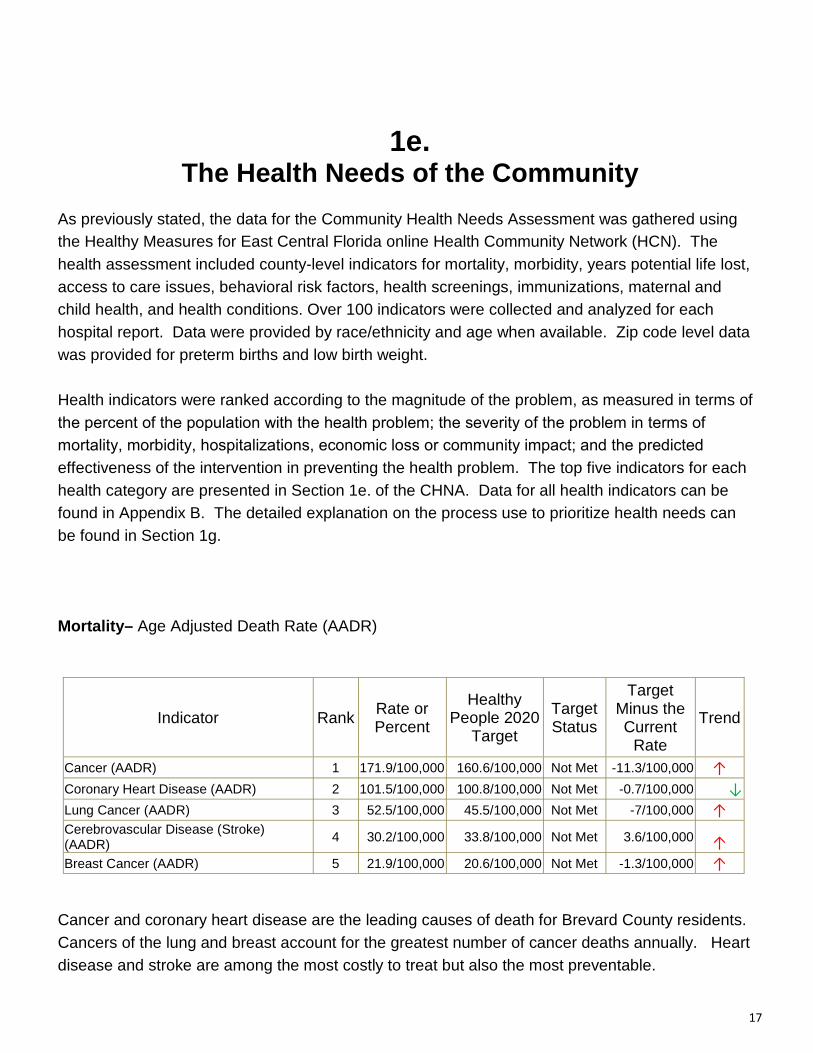
1e. The Health Needs of the Community
As previously stated, the data for the Community Health Needs Assessment was gathered using the Healthy Measures for East Central Florida online Health Community Network (HCN). The health assessment included county-level indicators for mortality, morbidity, years potential life lost, access to care issues, behavioral risk factors, health screenings, immunizations, maternal and child health, and health conditions. Over 100 indicators were collected and analyzed for each hospital report. Data were provided by race/ethnicity and age when available. Zip code level data was provided for preterm births and low birth weight. Health indicators were ranked according to the magnitude of the problem, as measured in terms of the percent of the population with the health problem; the severity of the problem in terms of
mortality, morbidity, hospitalizations, economic loss or community impact; and the predicted
effectiveness of the intervention in preventing the health problem. The top five indicators for each health category are presented in Section 1e. of the CHNA. Data for all health indicators can be found in Appendix B. The detailed explanation on the process use to prioritize health needs can be found in Section 1g. Mortality– Age Adjusted Death Rate (AADR)
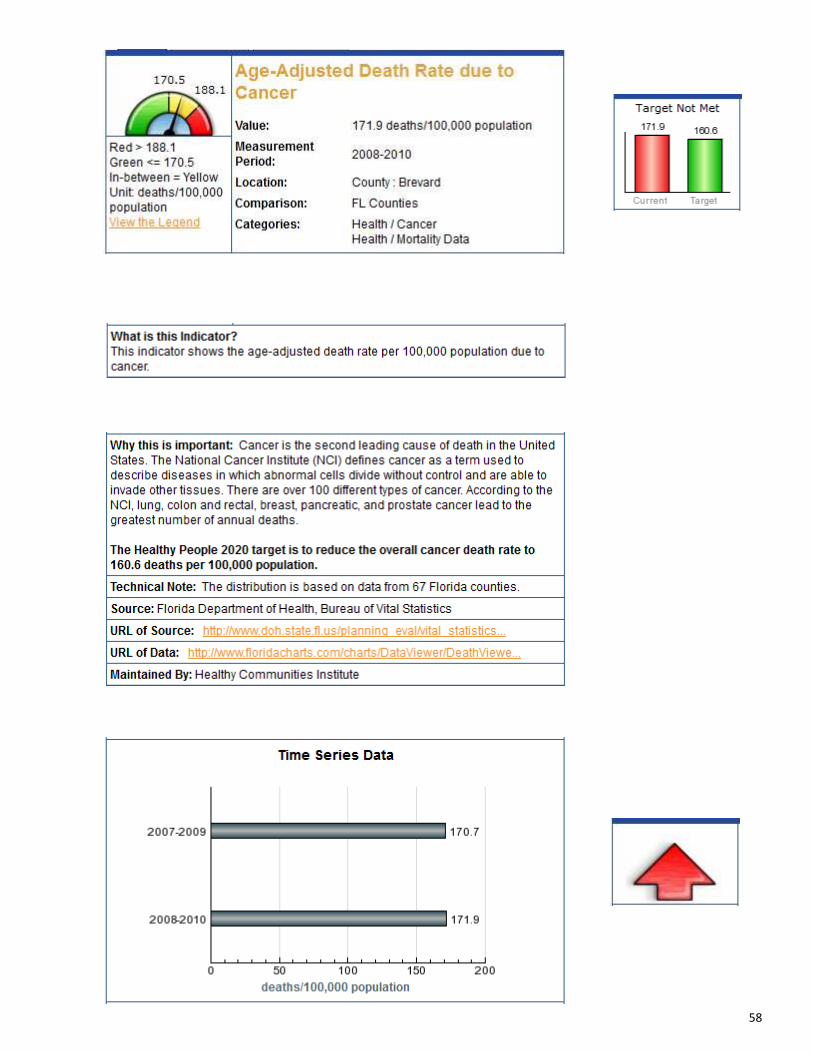
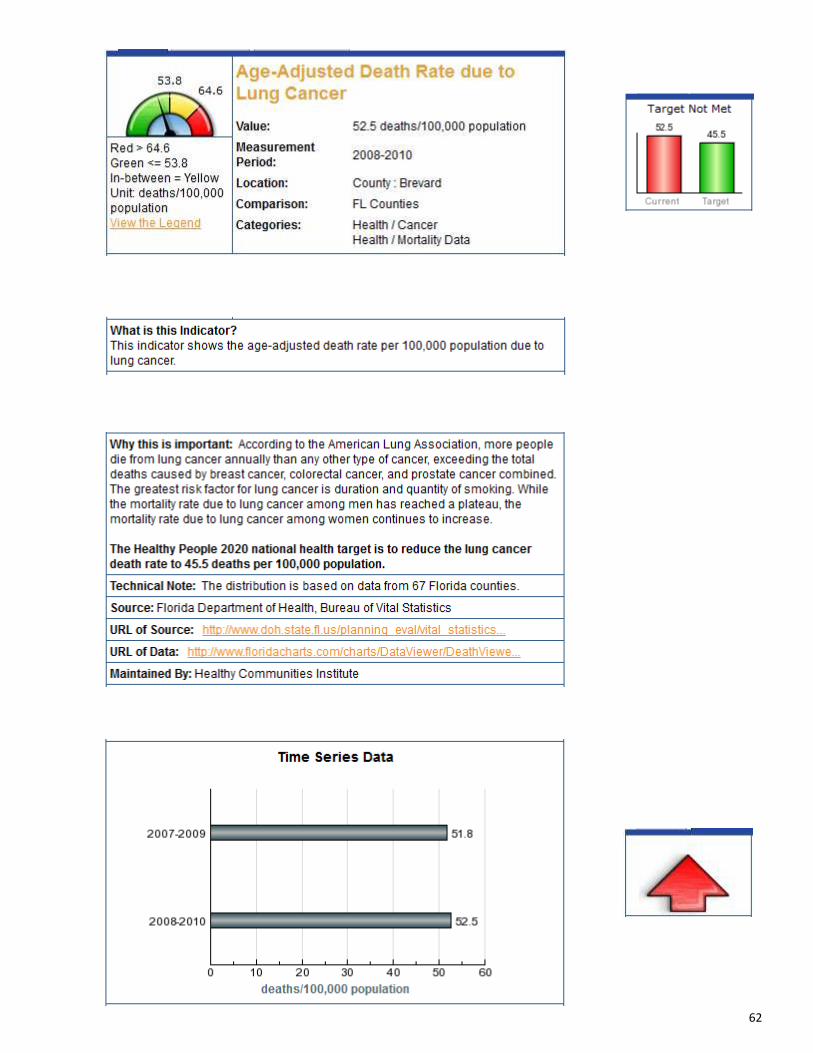
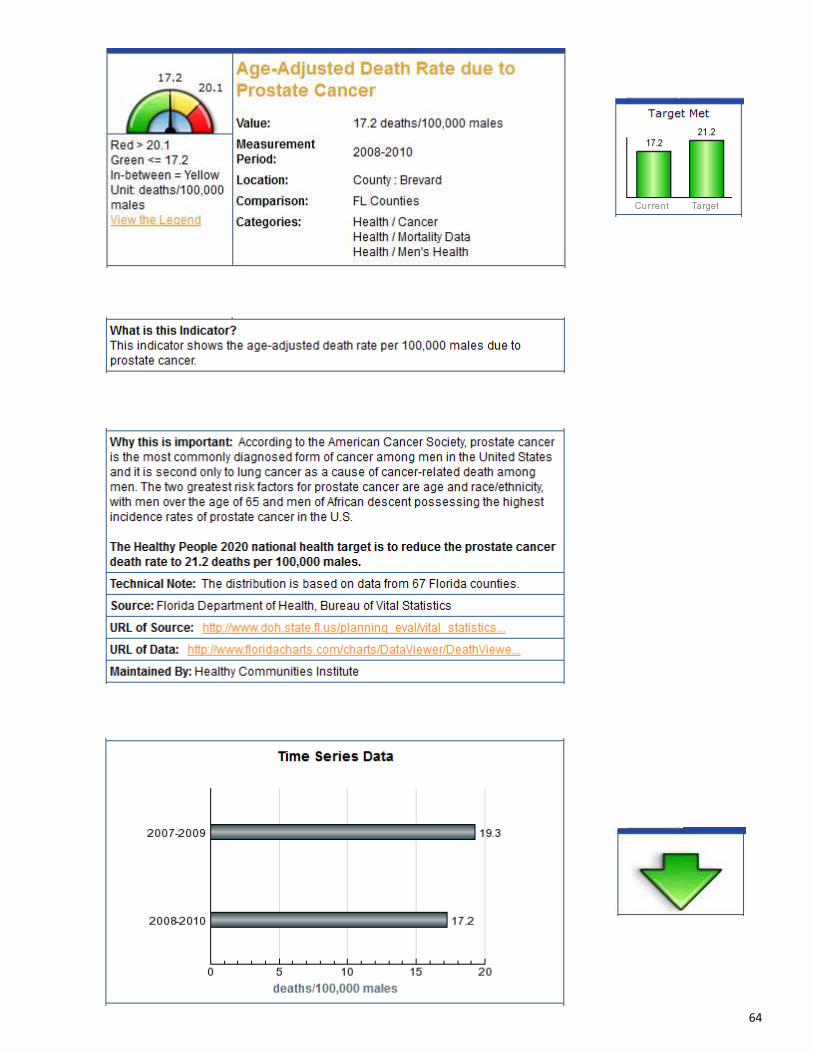
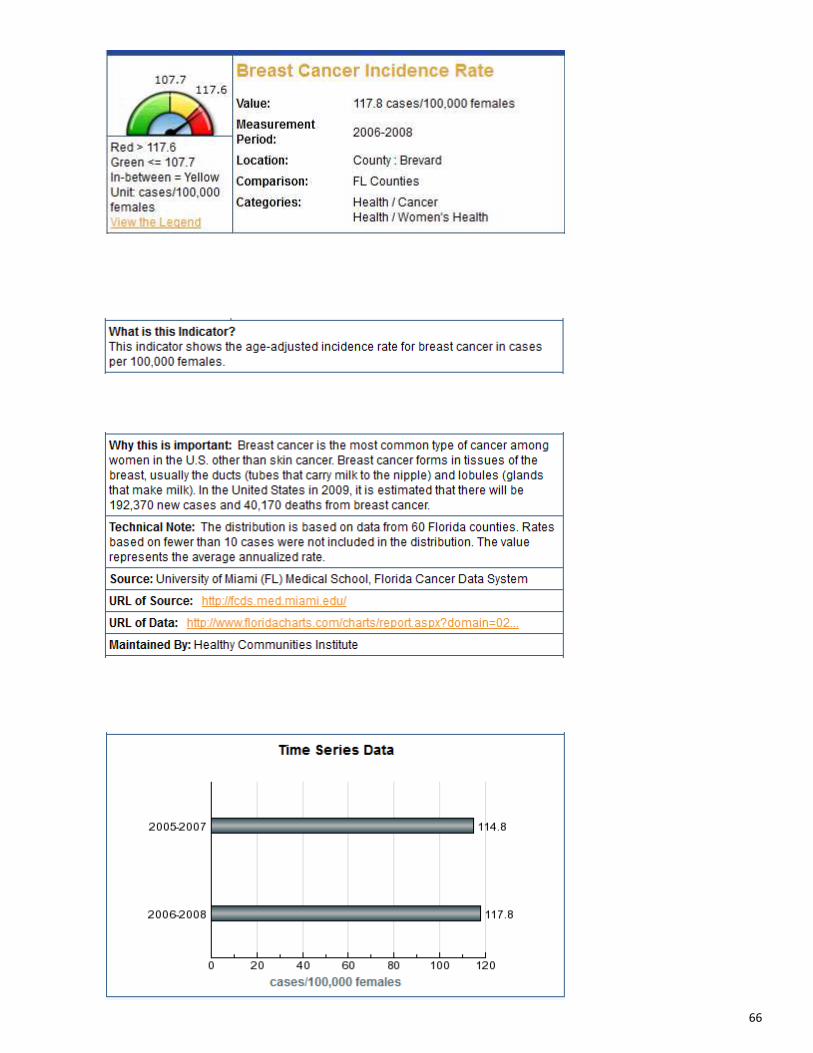
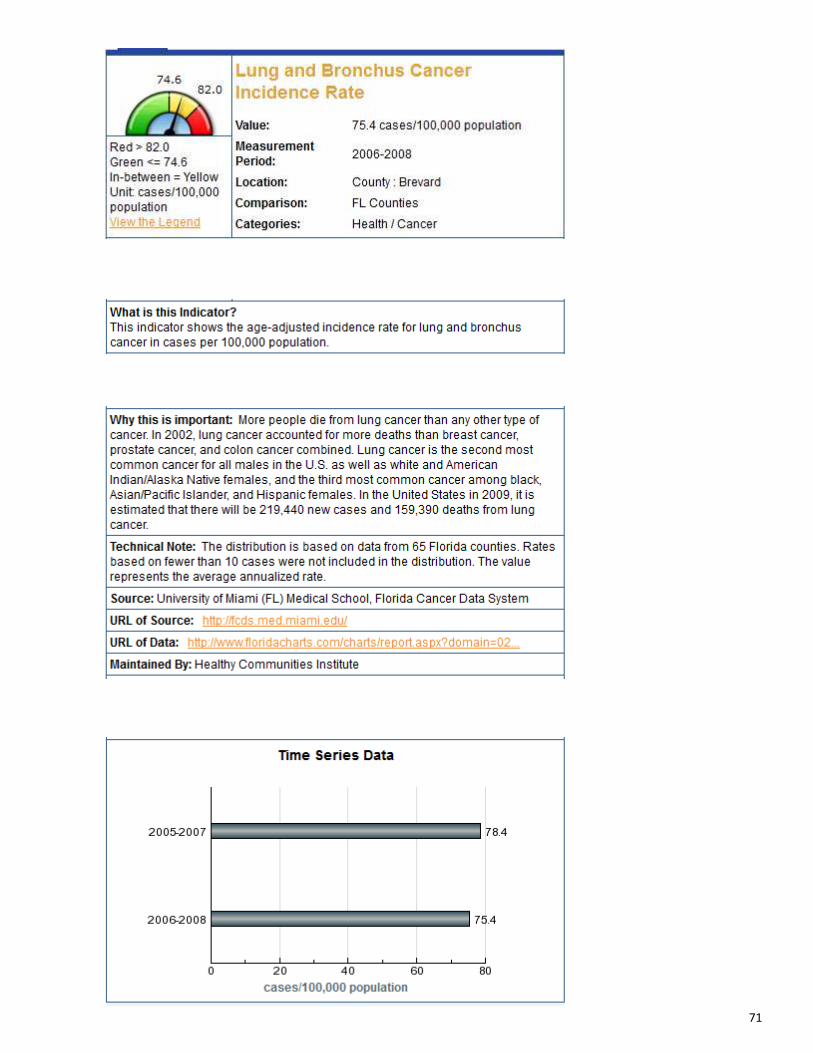
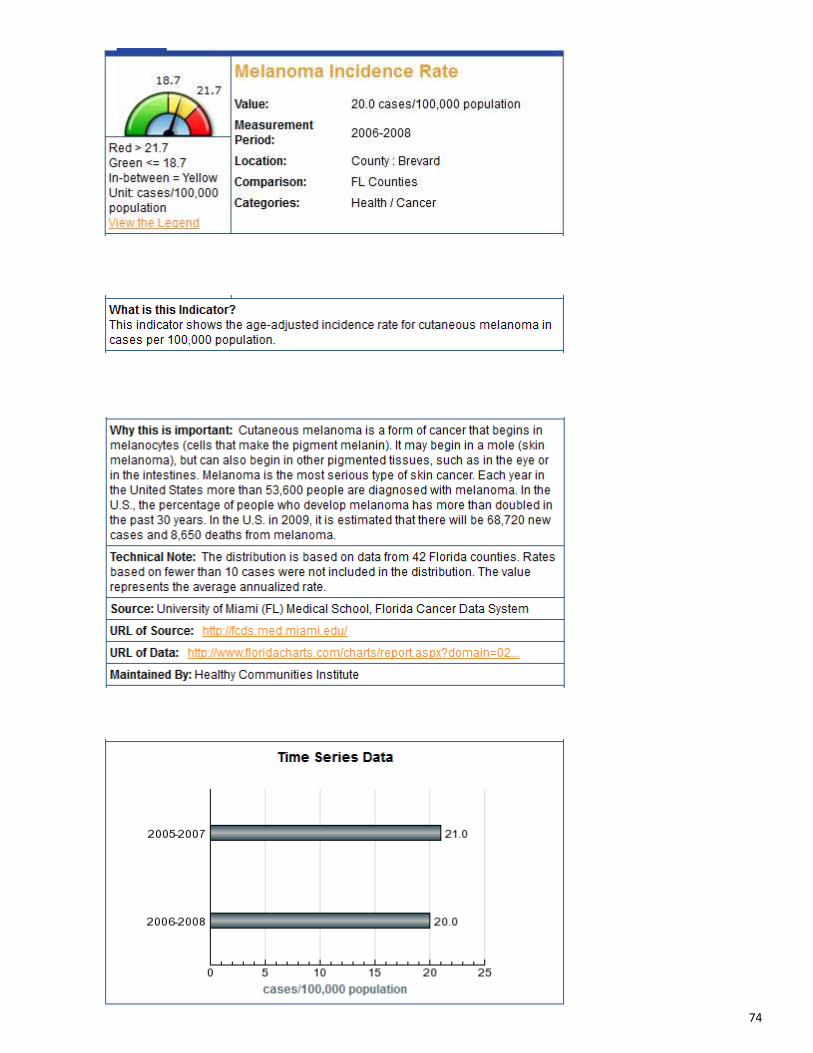
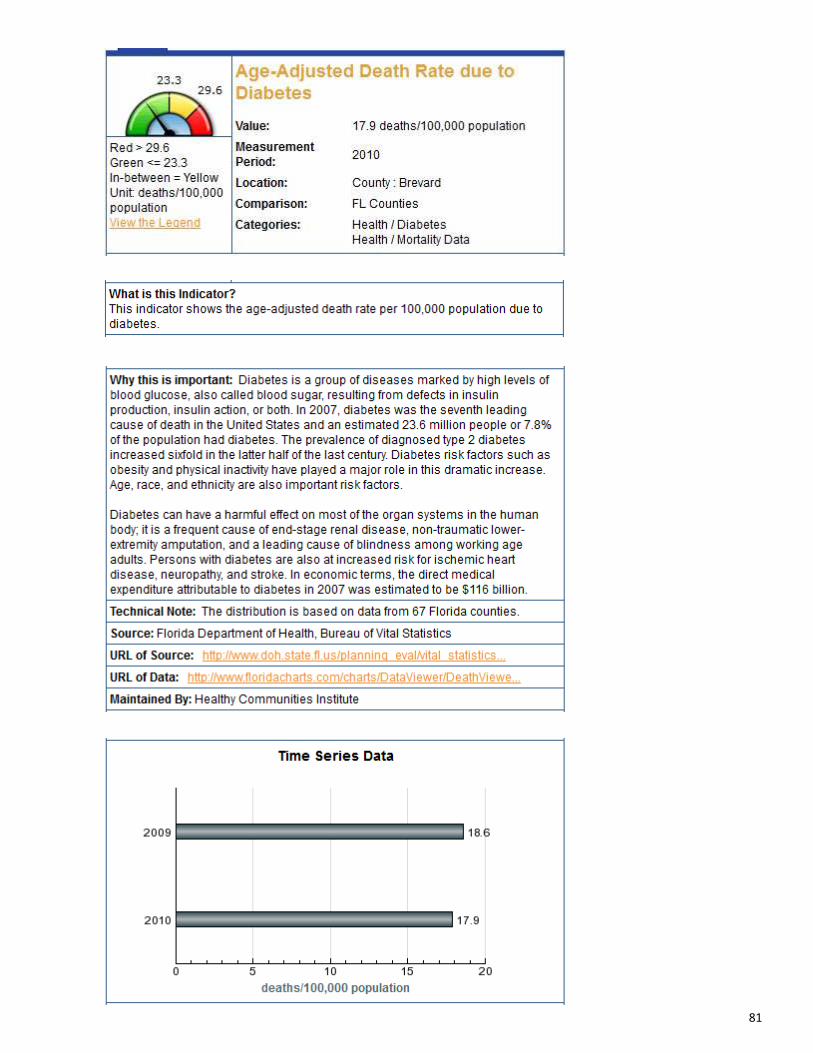
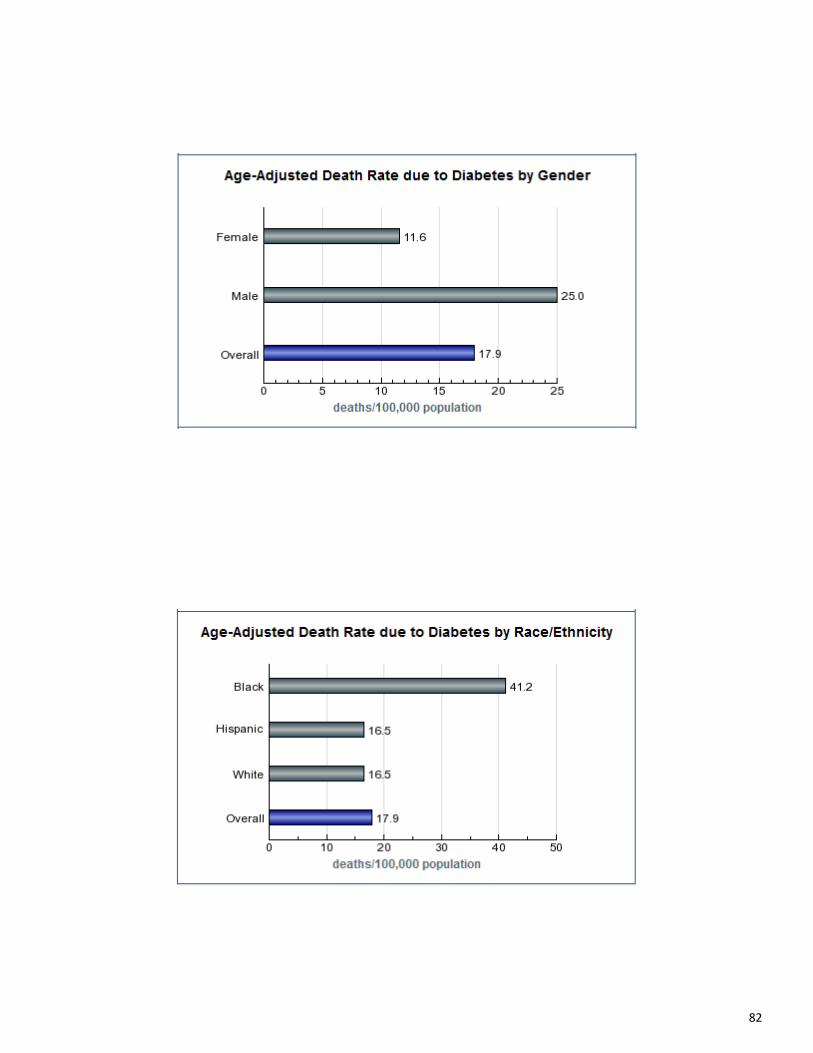
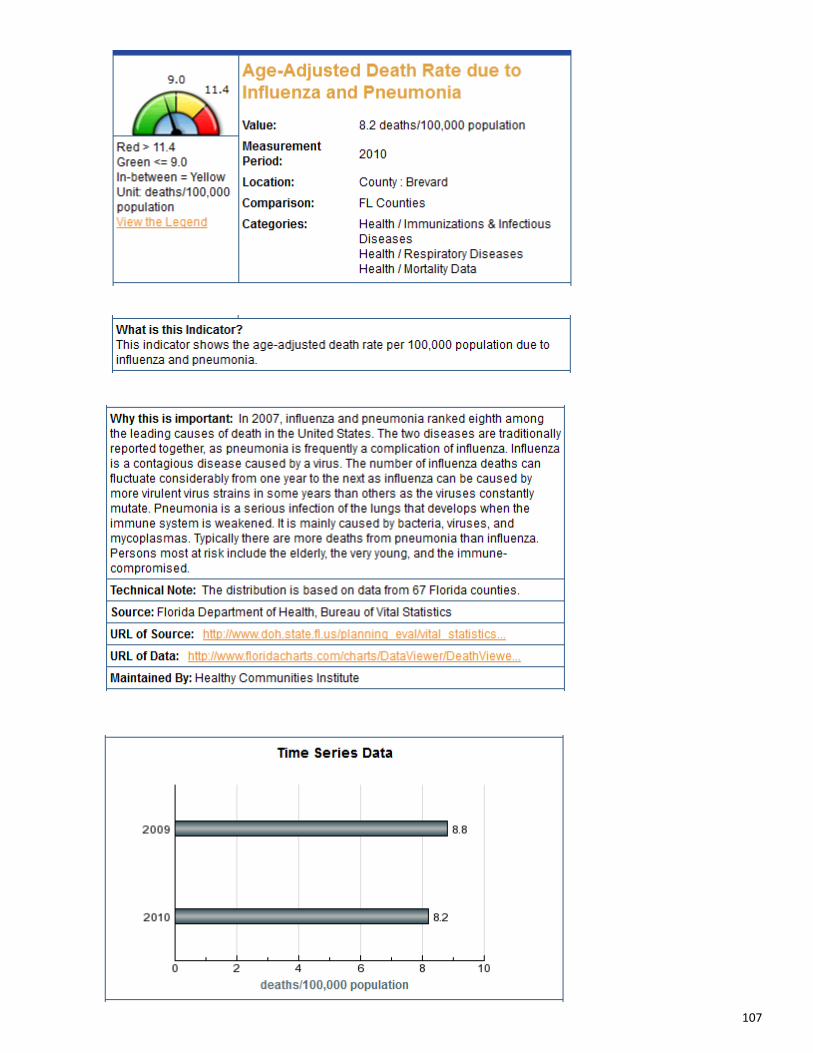
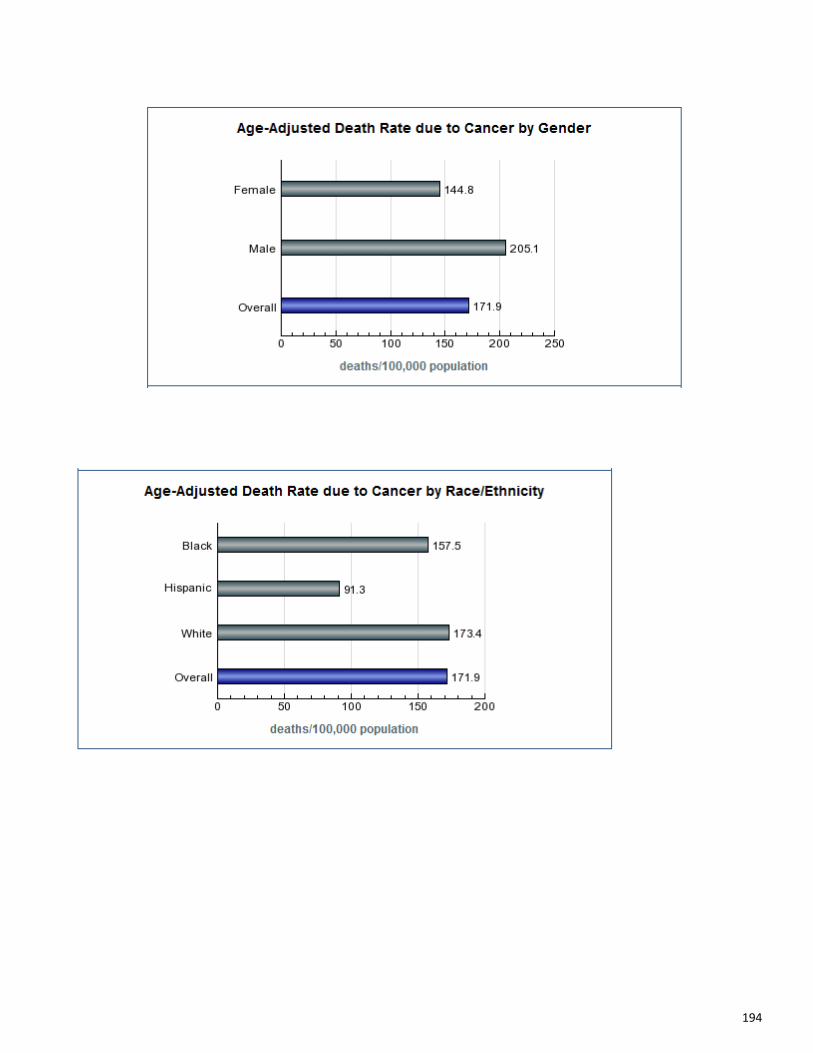
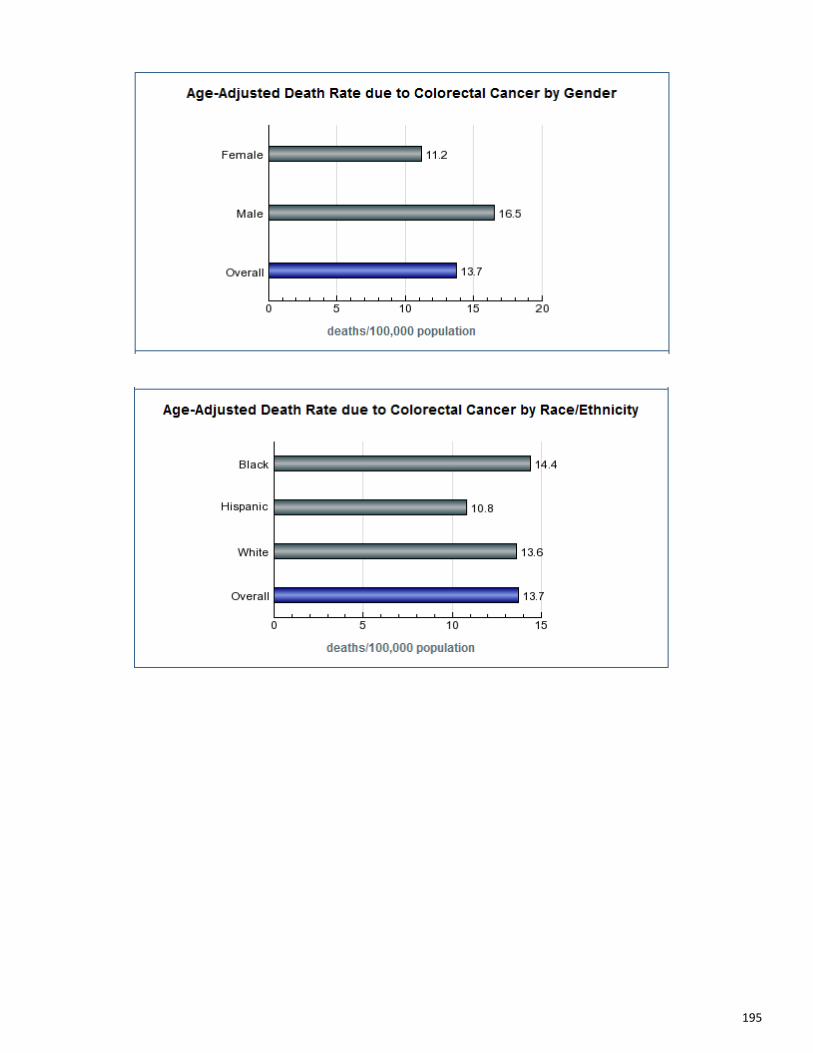
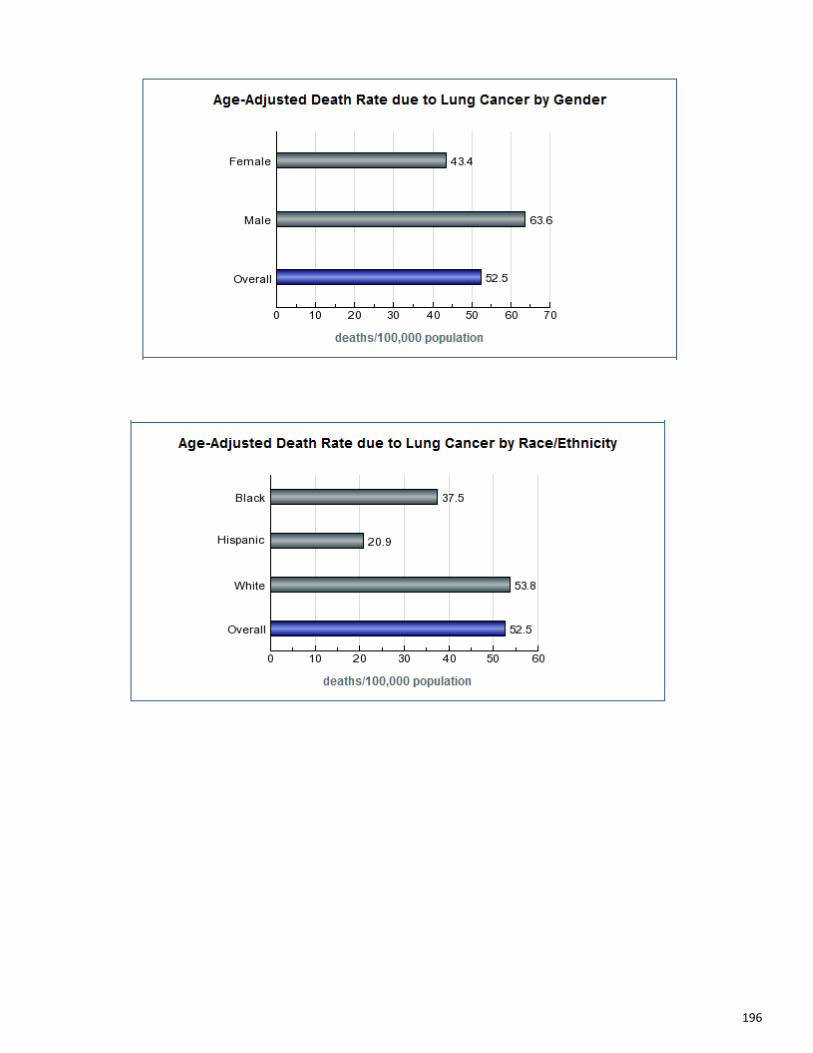
Cancer and coronary heart disease are the leading causes of death for Brevard County residents. Cancers of the lung and breast account for the greatest number of cancer deaths annually. Heart disease and stroke are among the most costly to treat but also the most preventable.
Indicator Rank Rate or Percent
Healthy People 2020
Target
Target Status
Target Minus the Current
Rate
Trend
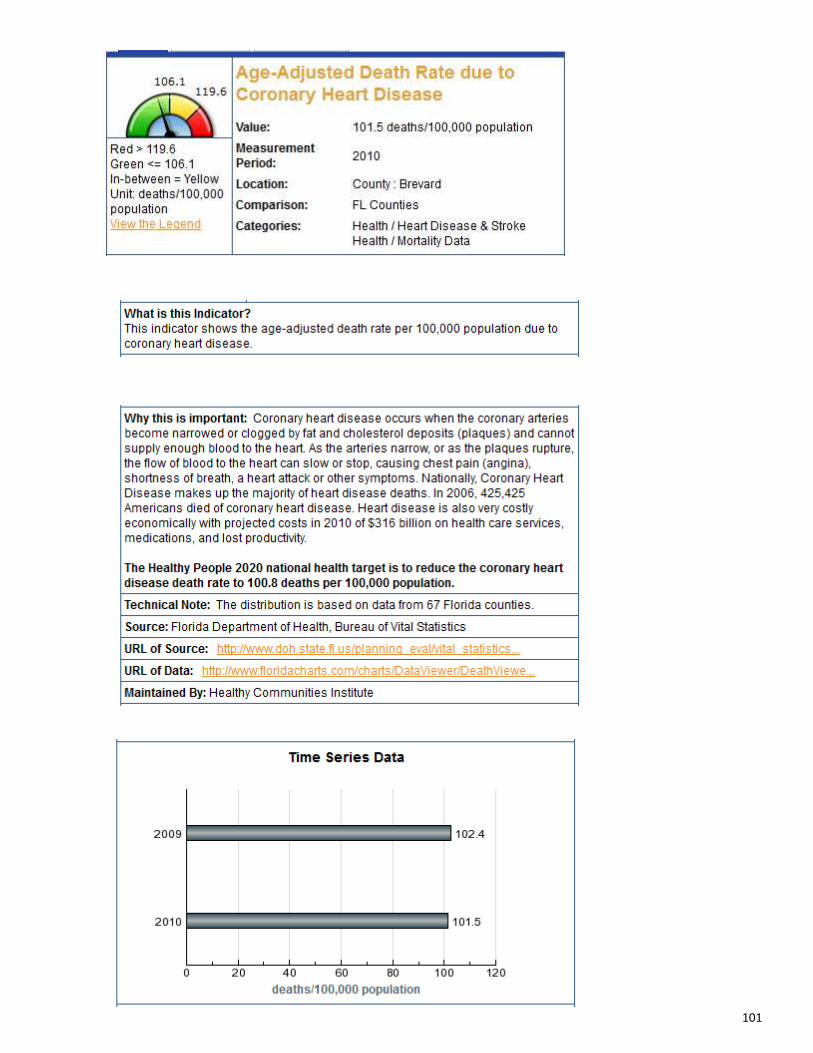
Cancer (AADR) 1 171.9/100,000 160.6/100,000 Not Met -11.3/100,000 ↑
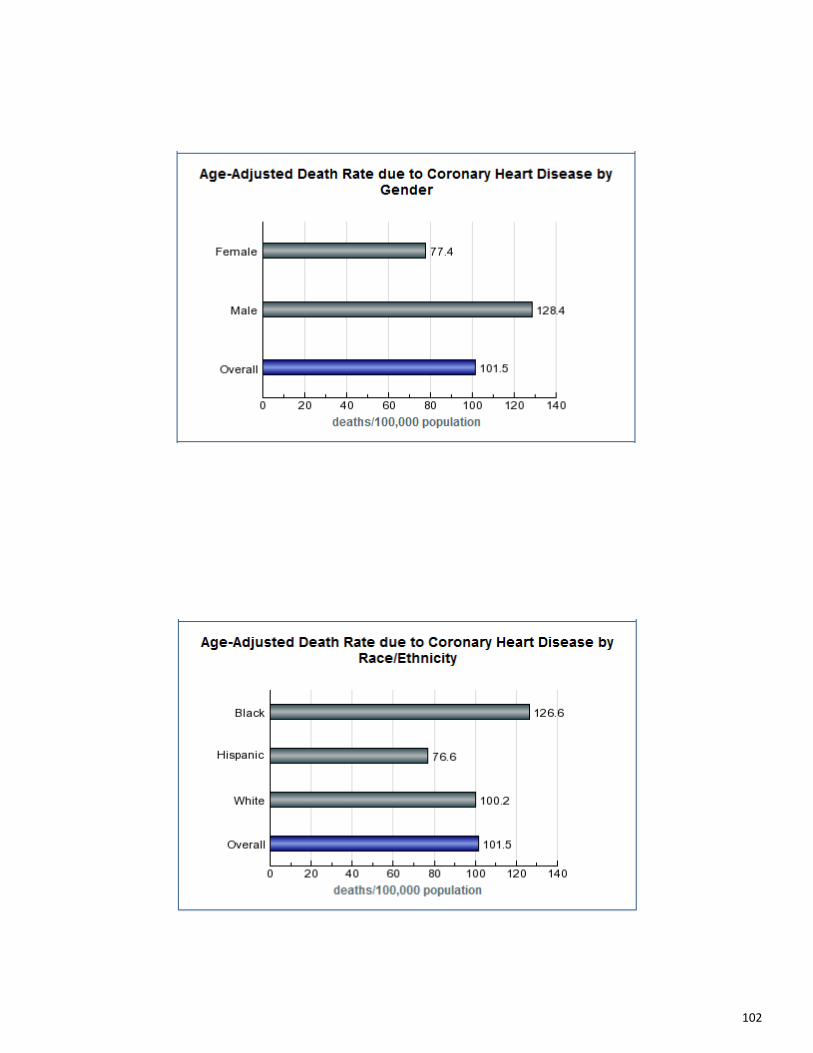
Coronary Heart Disease (AADR) 2 101.5/100,000 100.8/100,000 Not Met -0.7/100,000 ↓
Lung Cancer (AADR) 3 52.5/100,000 45.5/100,000 Not Met -7/100,000 ↑
Cerebrovascular Disease (Stroke) (AADR)
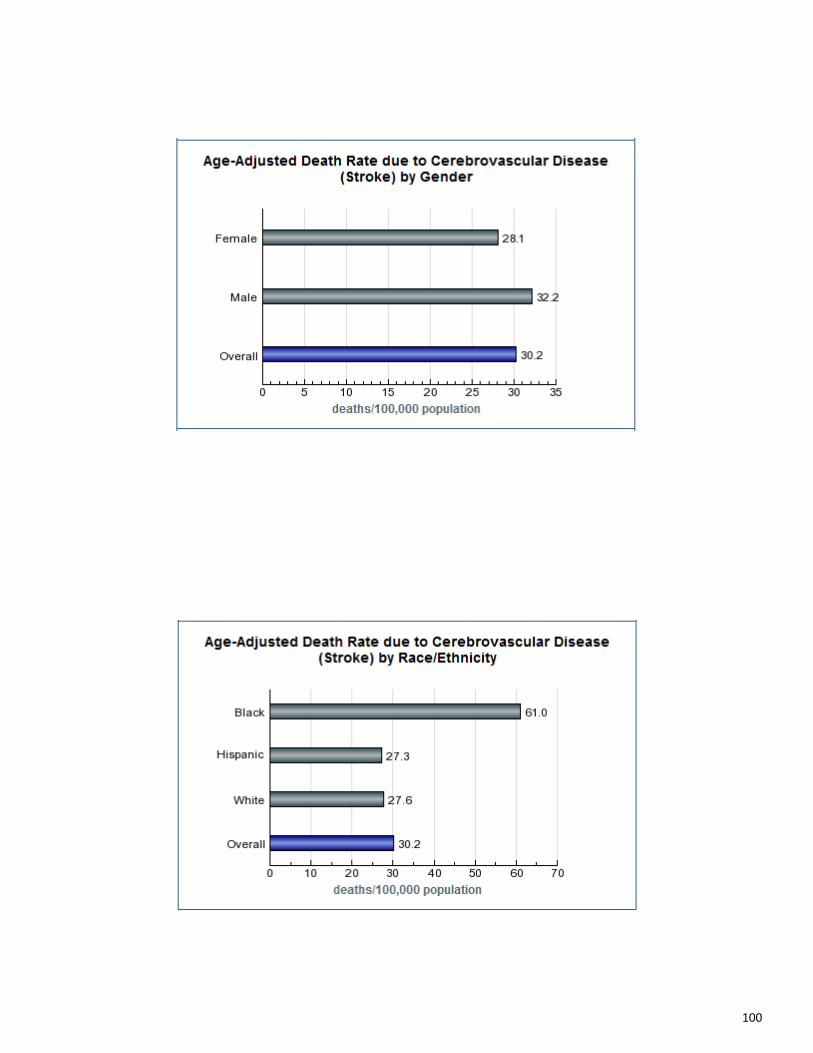
4 30.2/100,000 33.8/100,000 Not Met 3.6/100,000 ↑
Breast Cancer (AADR) 5 21.9/100,000 20.6/100,000 Not Met -1.3/100,000 ↑
18
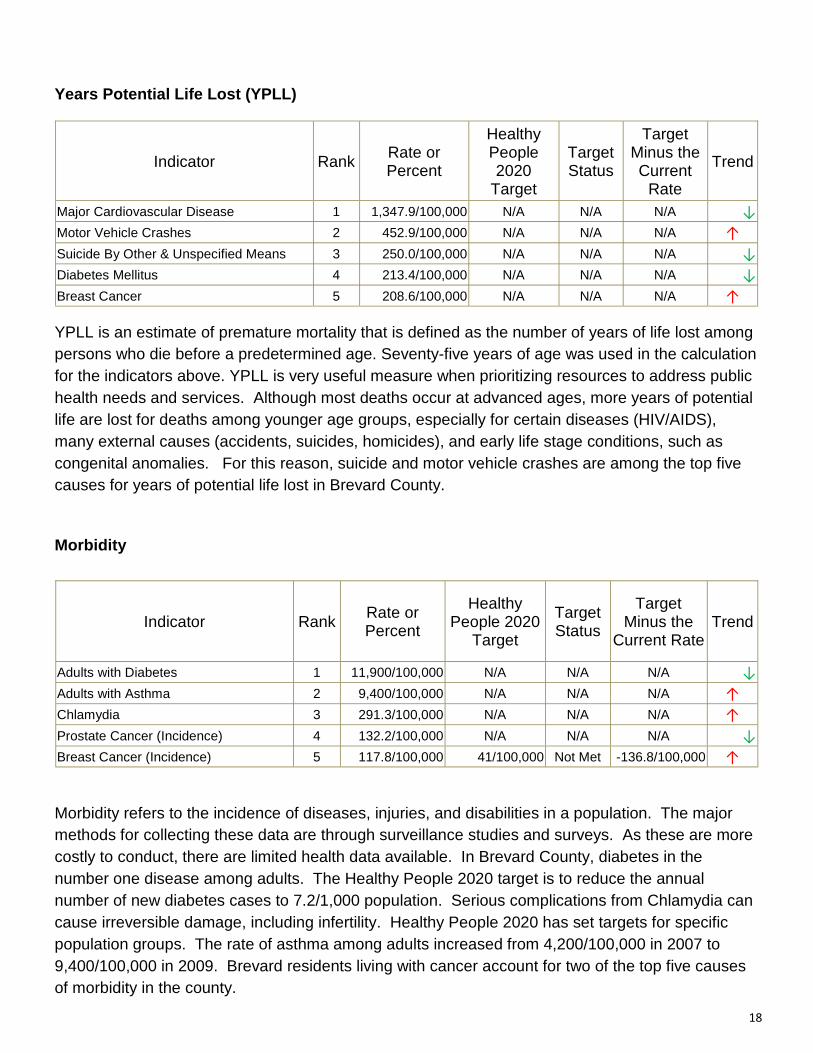
Years Potential Life Lost (YPLL)
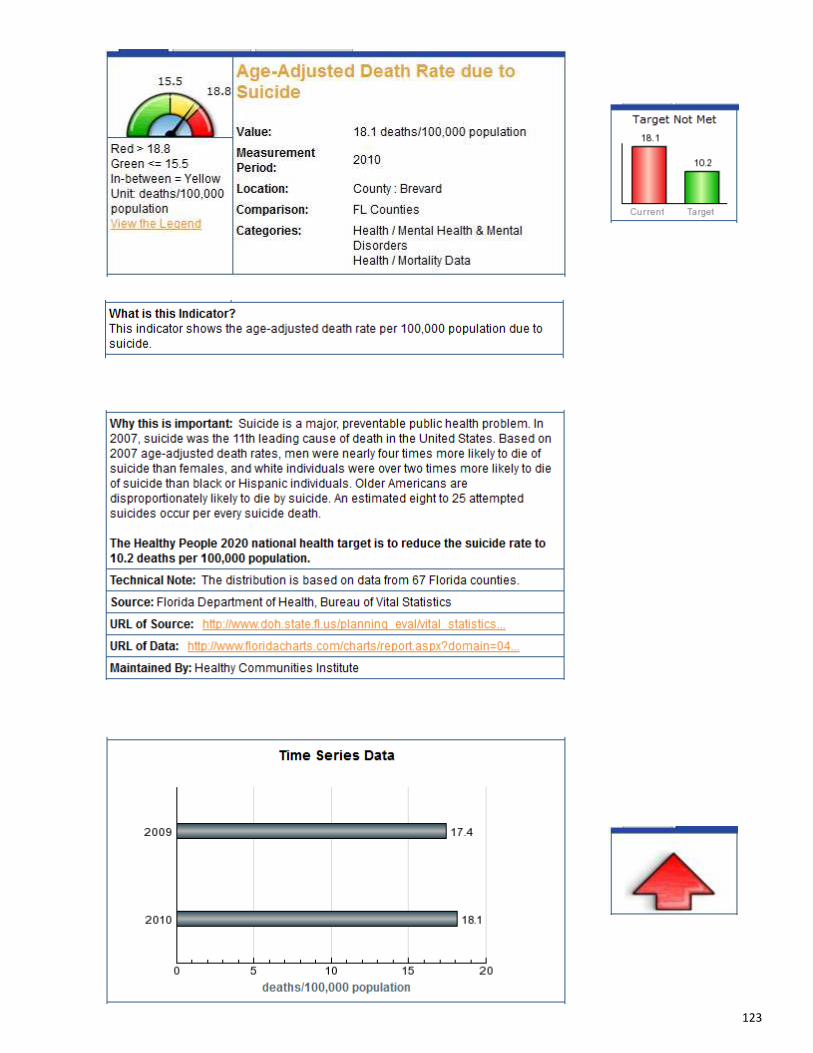
YPLL is an estimate of premature mortality that is defined as the number of years of life lost among persons who die before a predetermined age. Seventy-five years of age was used in the calculation for the indicators above. YPLL is very useful measure when prioritizing resources to address public health needs and services. Although most deaths occur at advanced ages, more years of potential life are lost for deaths among younger age groups, especially for certain diseases (HIV/AIDS), many external causes (accidents, suicides, homicides), and early life stage conditions, such as congenital anomalies. For this reason, suicide and motor vehicle crashes are among the top five causes for years of potential life lost in Brevard County.
Morbidity
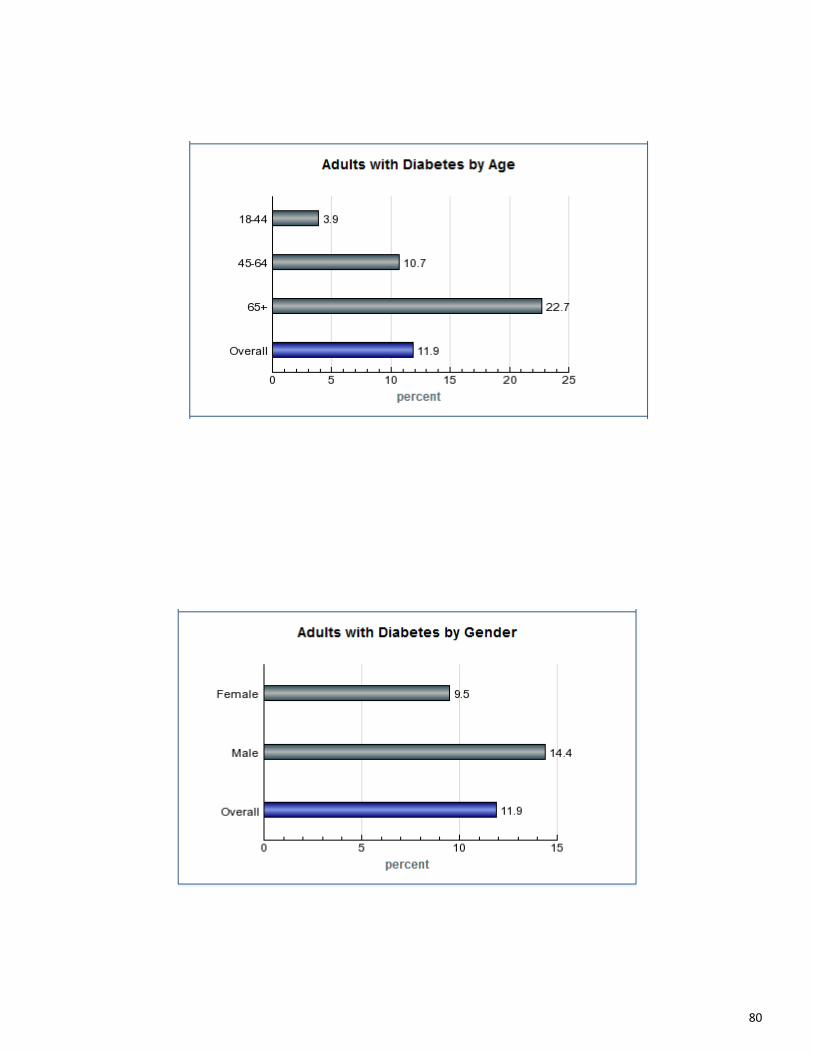
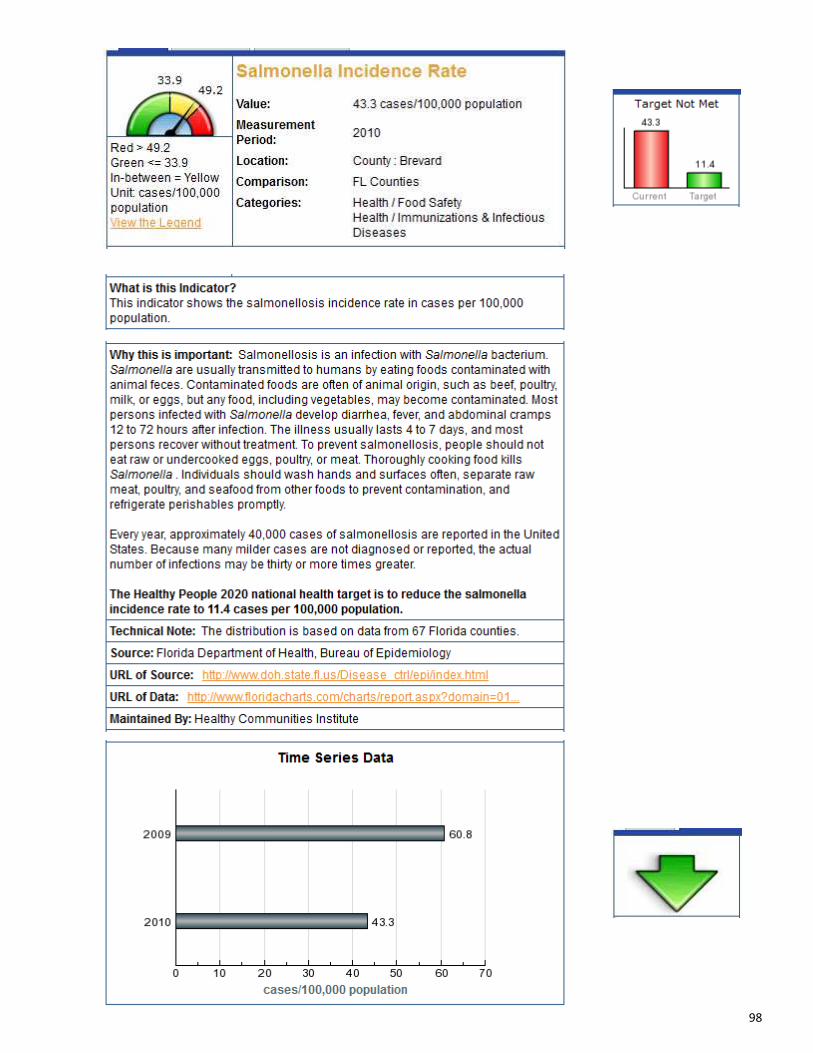
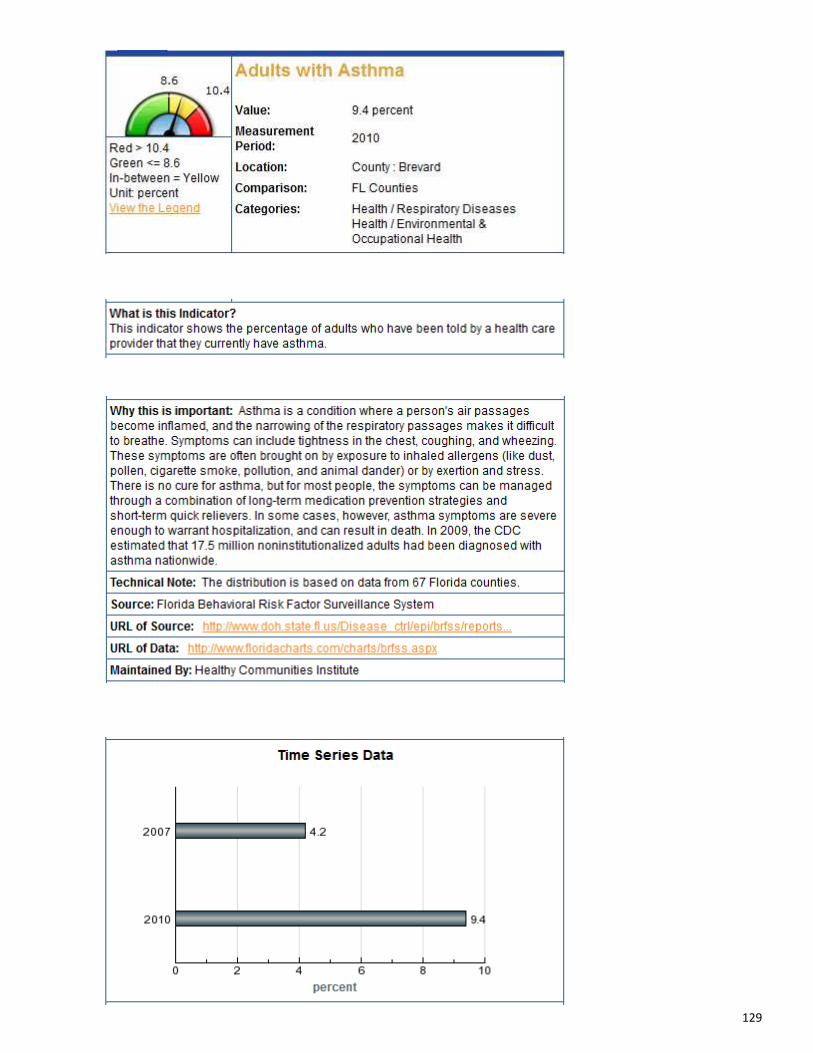
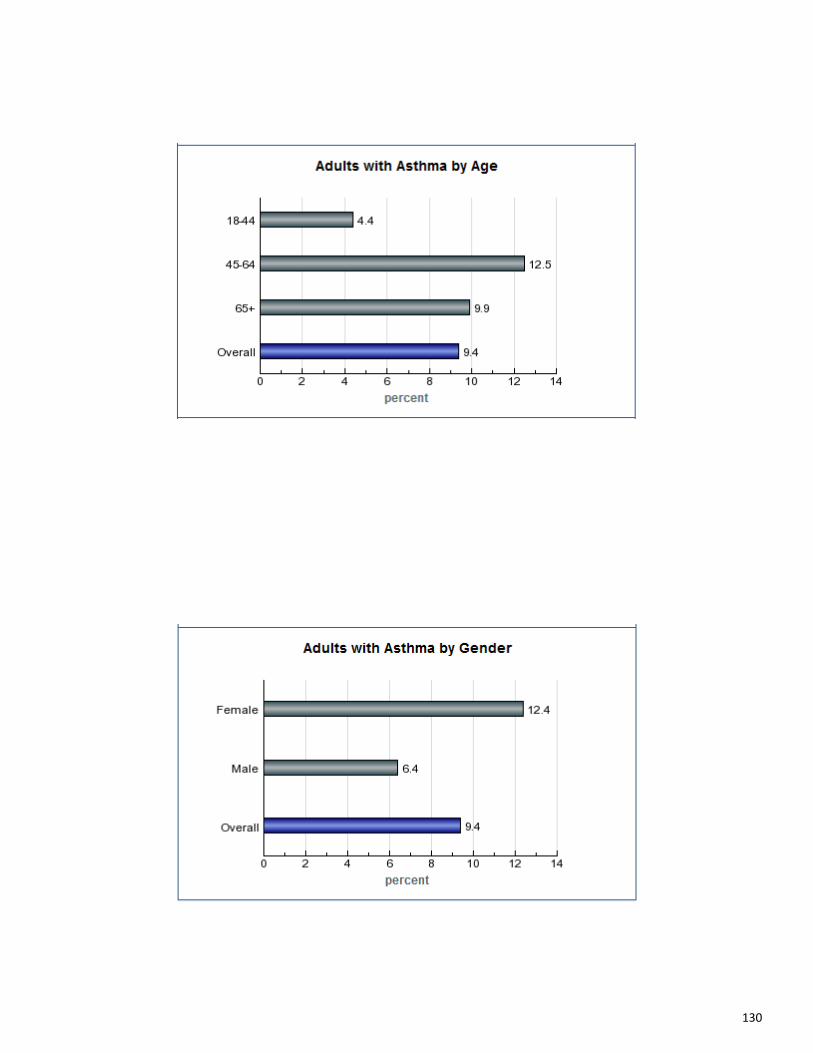
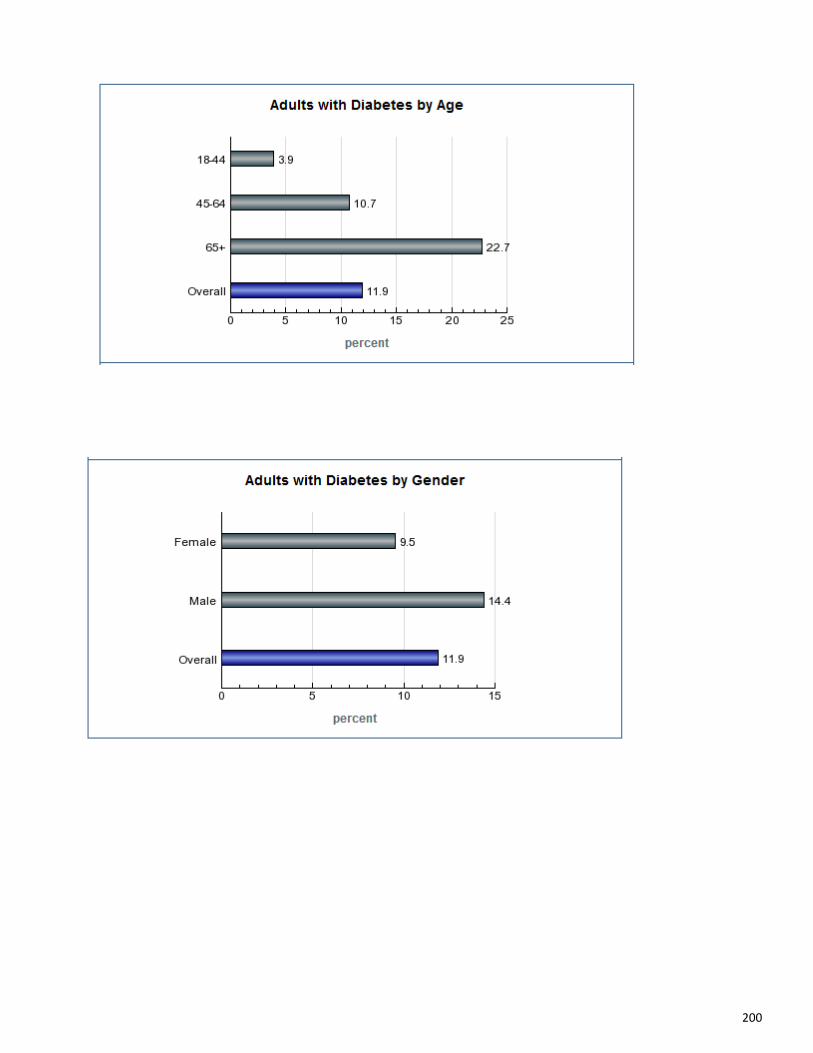
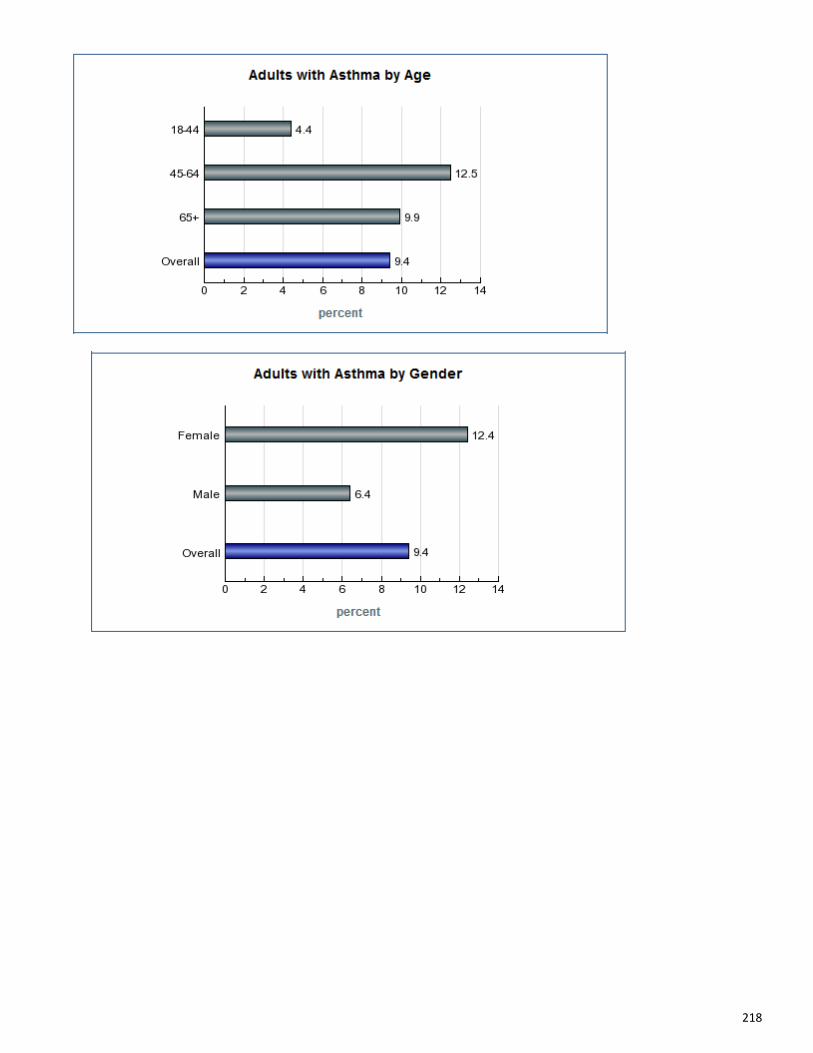
Morbidity refers to the incidence of diseases, injuries, and disabilities in a population. The major methods for collecting these data are through surveillance studies and surveys. As these are more costly to conduct, there are limited health data available. In Brevard County, diabetes in the number one disease among adults. The Healthy People 2020 target is to reduce the annual number of new diabetes cases to 7.2/1,000 population. Serious complications from Chlamydia can cause irreversible damage, including infertility. Healthy People 2020 has set targets for specific population groups. The rate of asthma among adults increased from 4,200/100,000 in 2007 to 9,400/100,000 in 2009. Brevard residents living with cancer account for two of the top five causes of morbidity in the county.
Indicator Rank Rate or Percent
Healthy People 2020
Target
Target Status
Target Minus the Current
Rate
Trend
Major Cardiovascular Disease 1 1,347.9/100,000 N/A N/A N/A ↓
Motor Vehicle Crashes 2 452.9/100,000 N/A N/A N/A ↑
Suicide By Other & Unspecified Means 3 250.0/100,000 N/A N/A N/A ↓
Diabetes Mellitus 4 213.4/100,000 N/A N/A N/A ↓
Breast Cancer 5 208.6/100,000 N/A N/A N/A ↑
Indicator Rank Rate or Percent
Healthy People 2020
Target
Target Status
Target Minus the
Current Rate Trend
Adults with Diabetes 1 11,900/100,000 N/A N/A N/A ↓
Adults with Asthma 2 9,400/100,000 N/A N/A N/A ↑
Chlamydia 3 291.3/100,000 N/A N/A N/A ↑
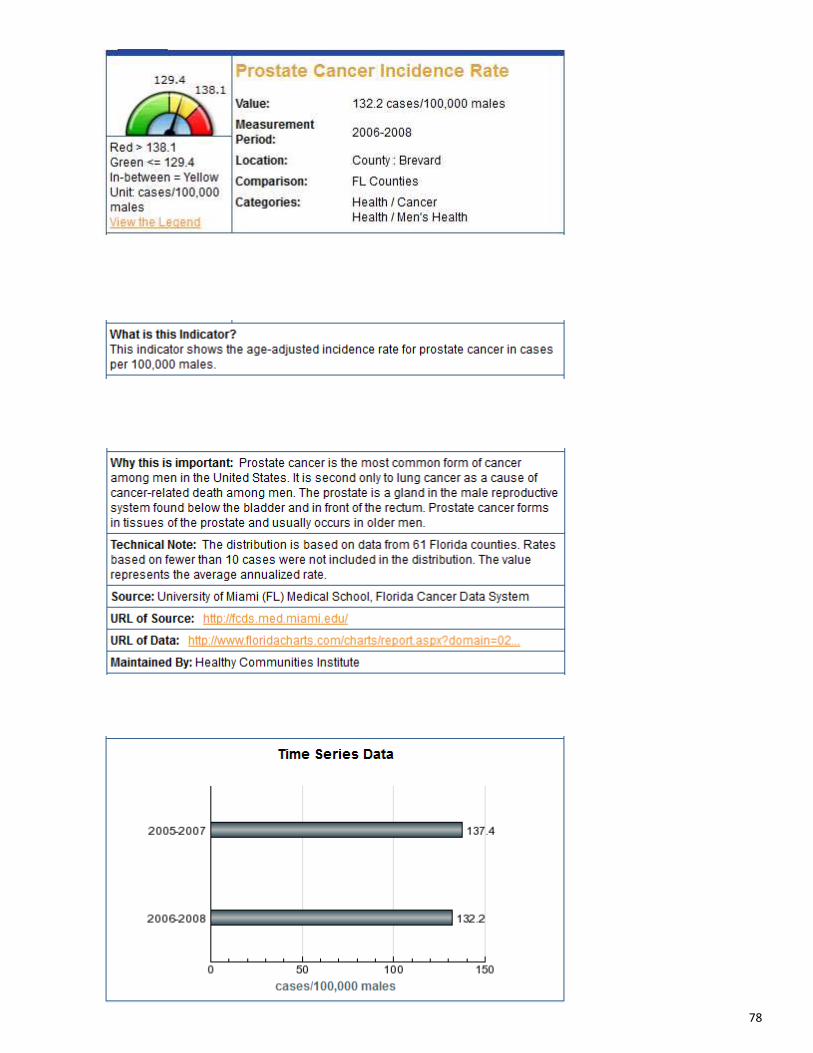
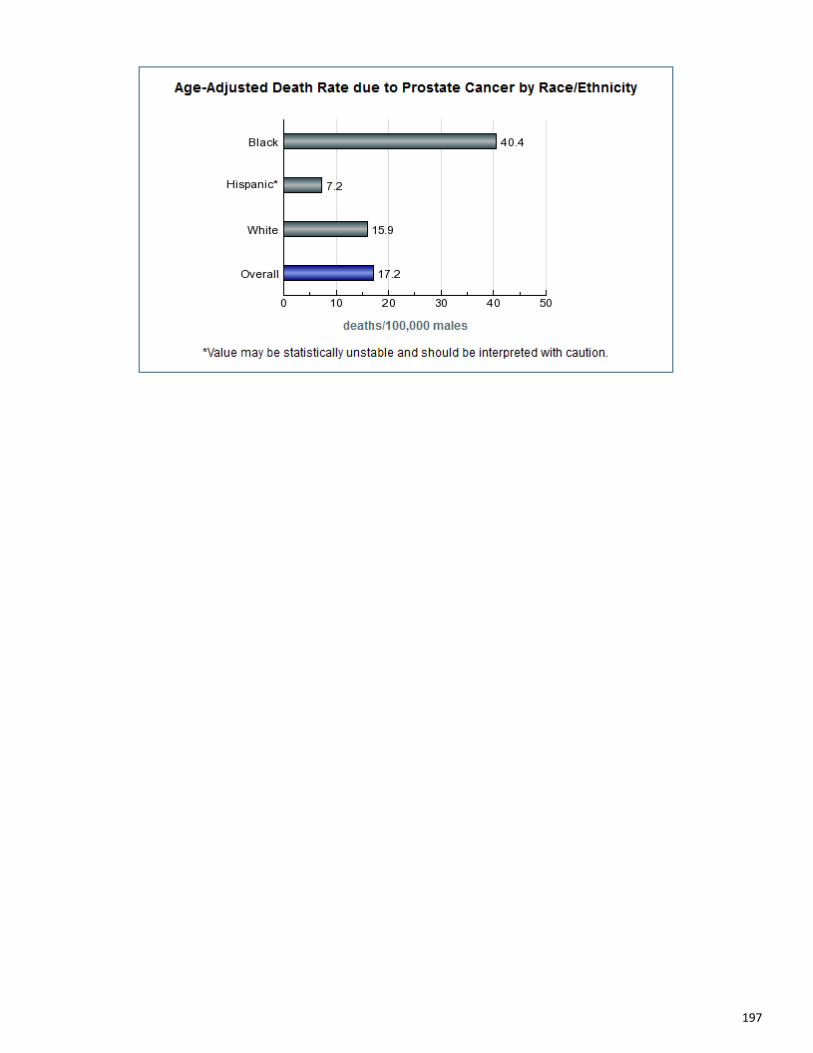
Prostate Cancer (Incidence) 4 132.2/100,000 N/A N/A N/A ↓
Breast Cancer (Incidence) 5 117.8/100,000 41/100,000 Not Met -136.8/100,000 ↑
19
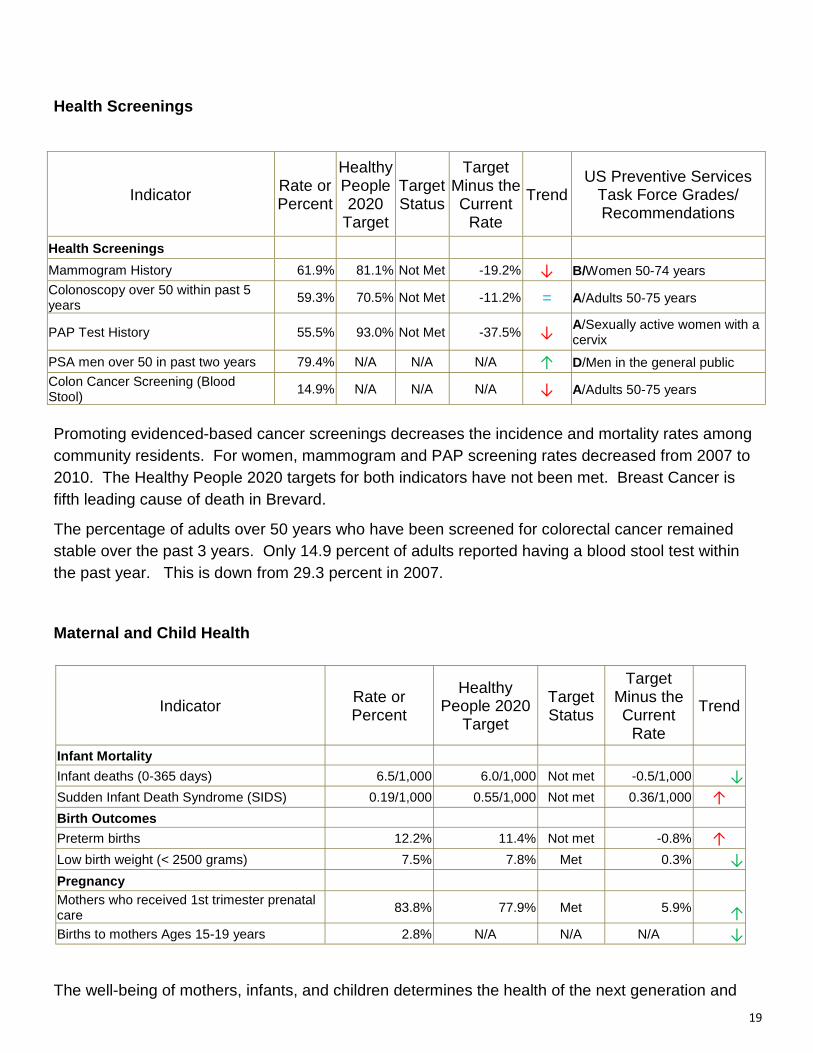
Health Screenings
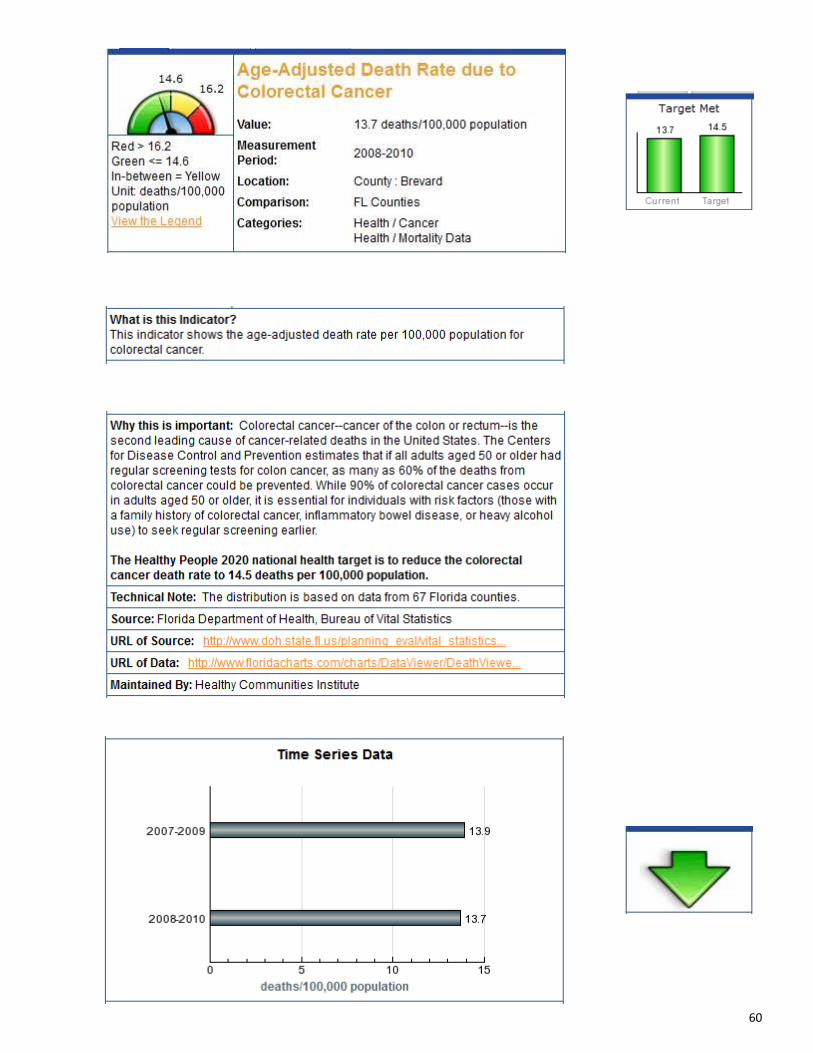
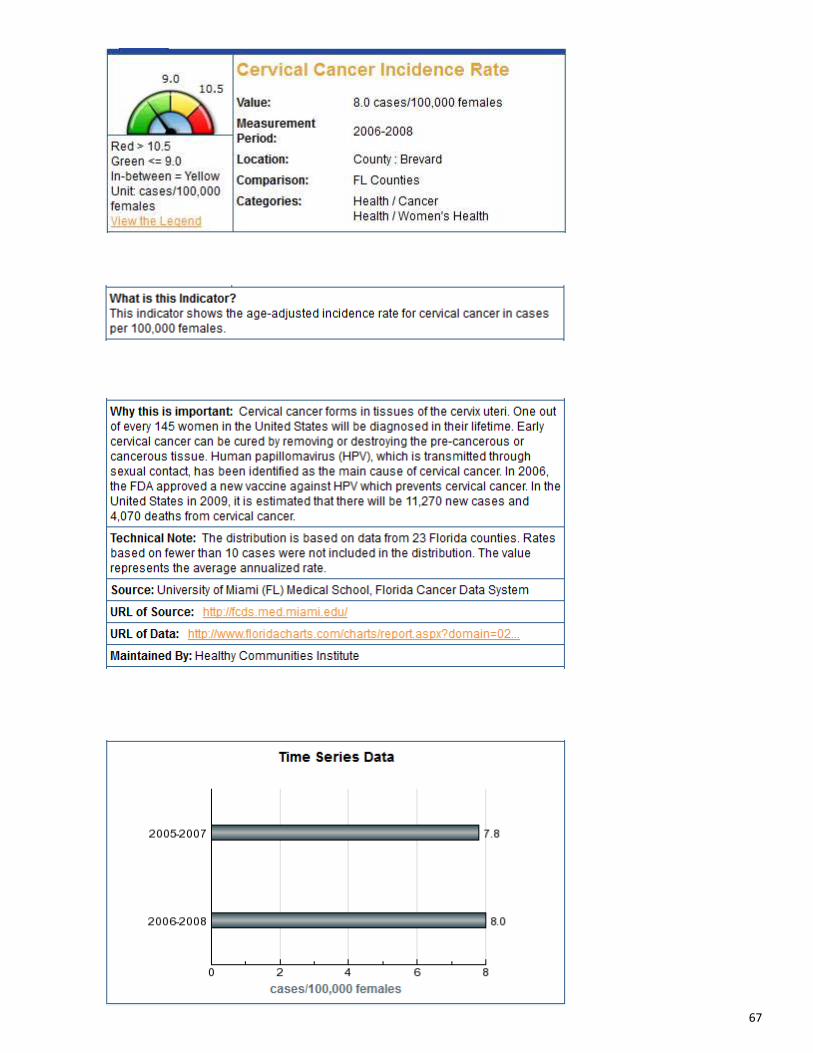
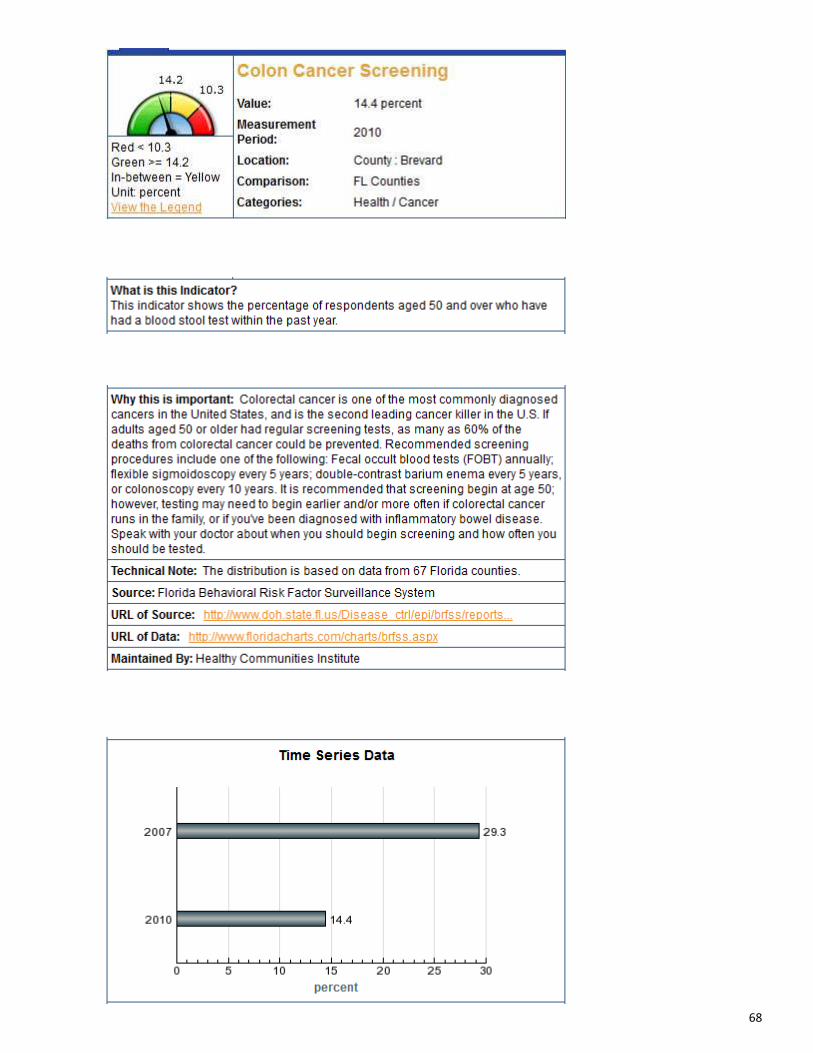
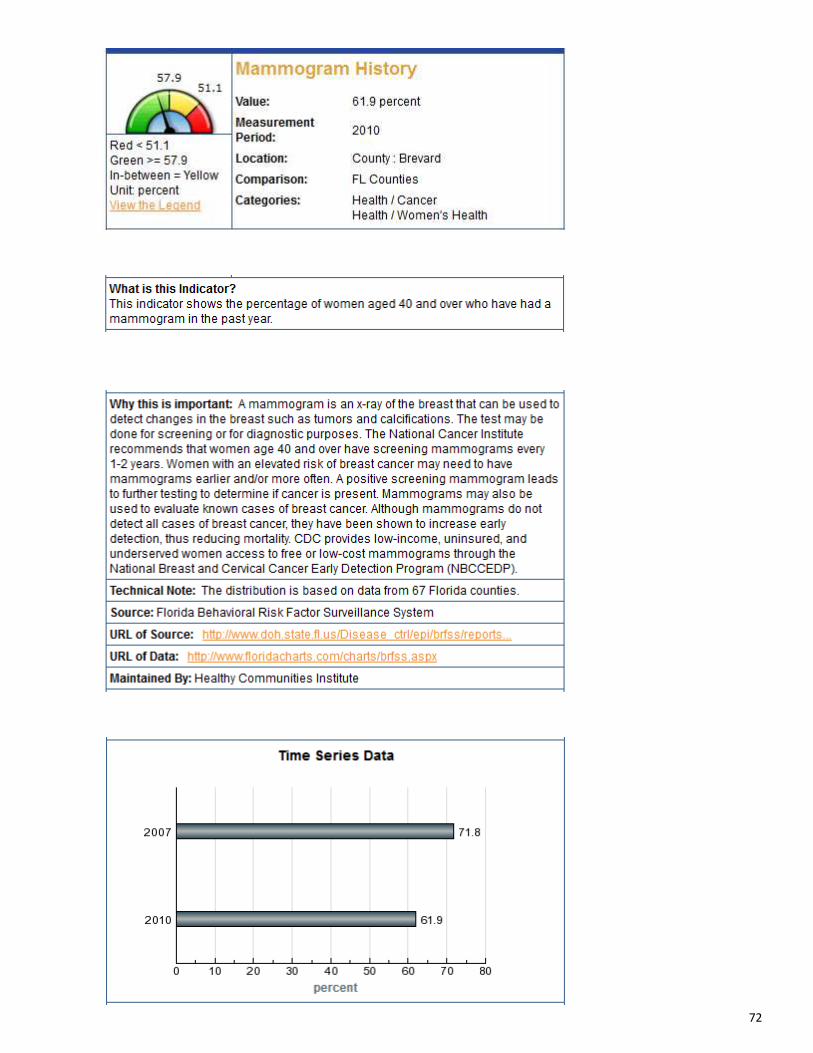
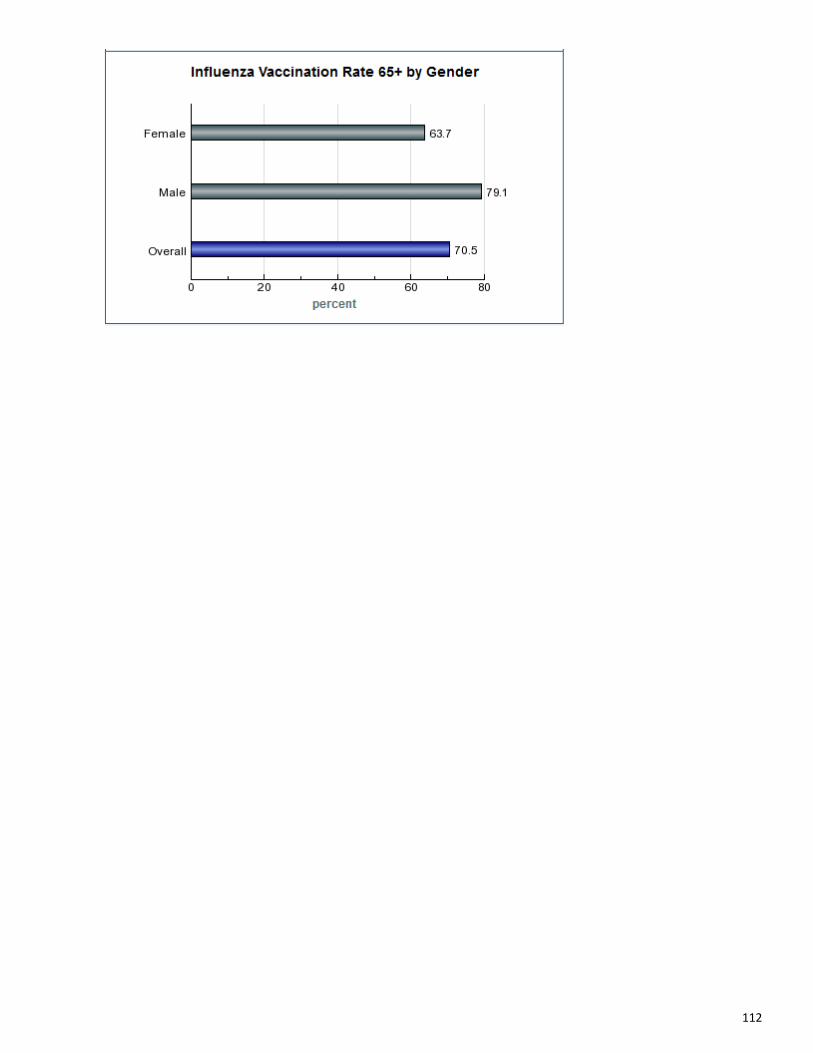
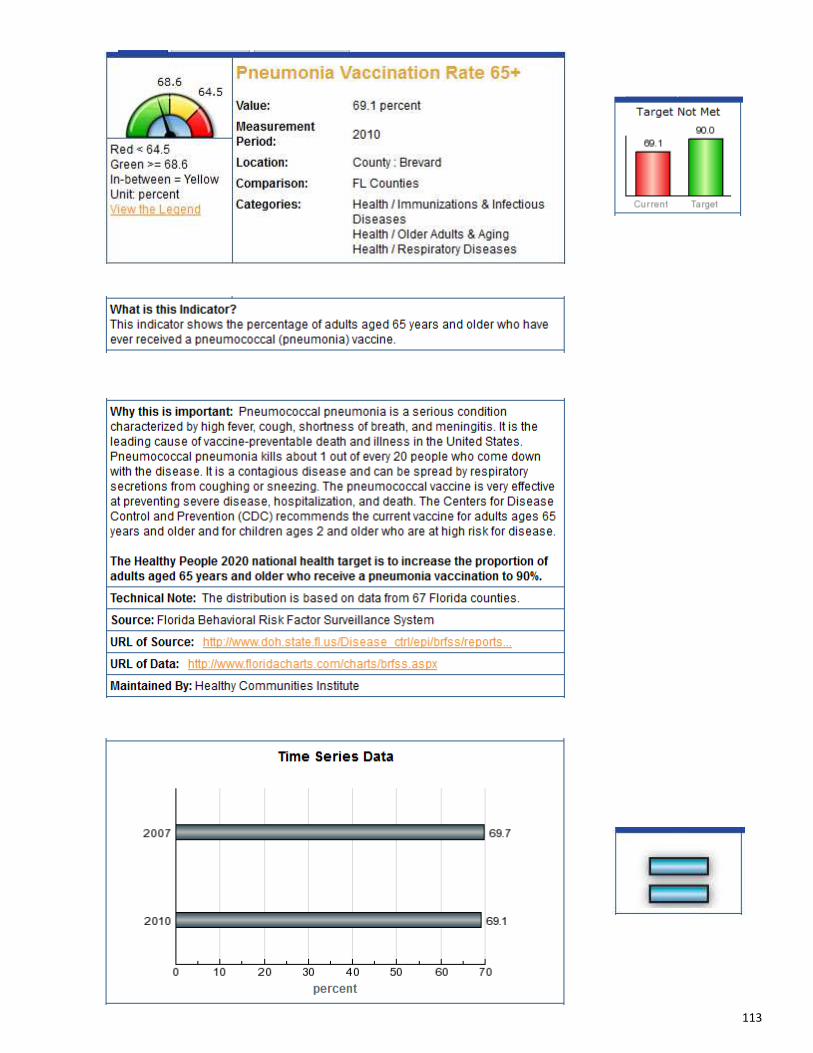
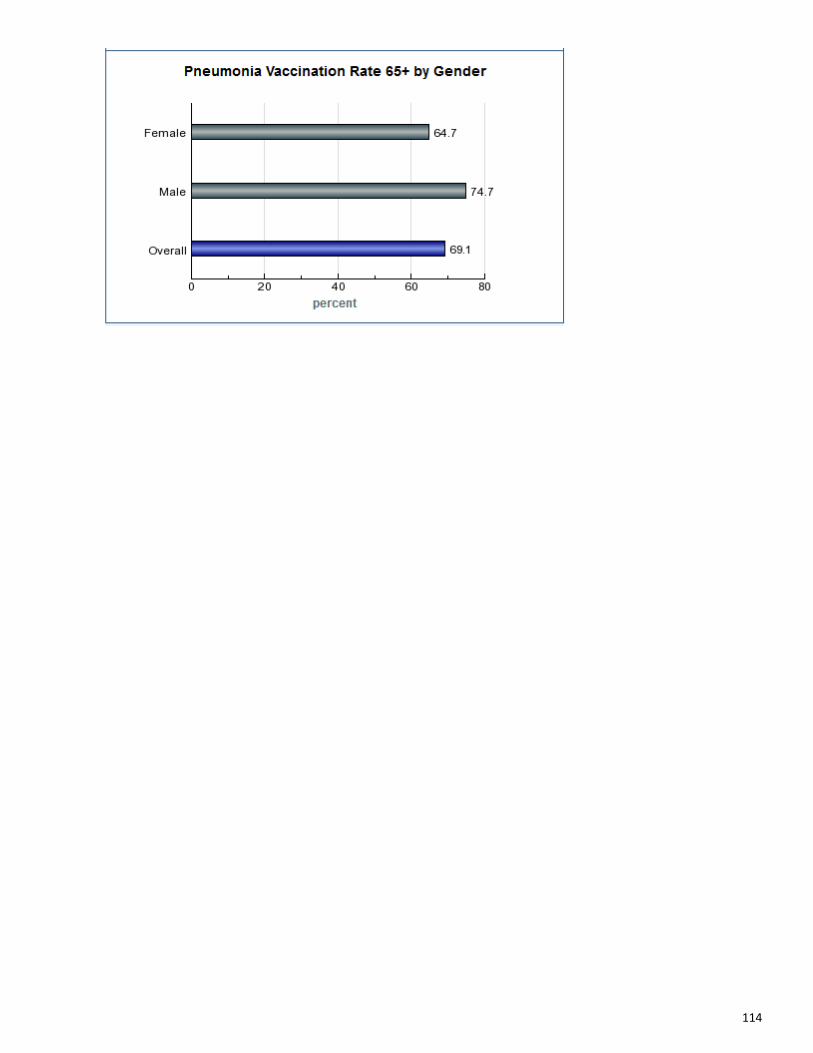
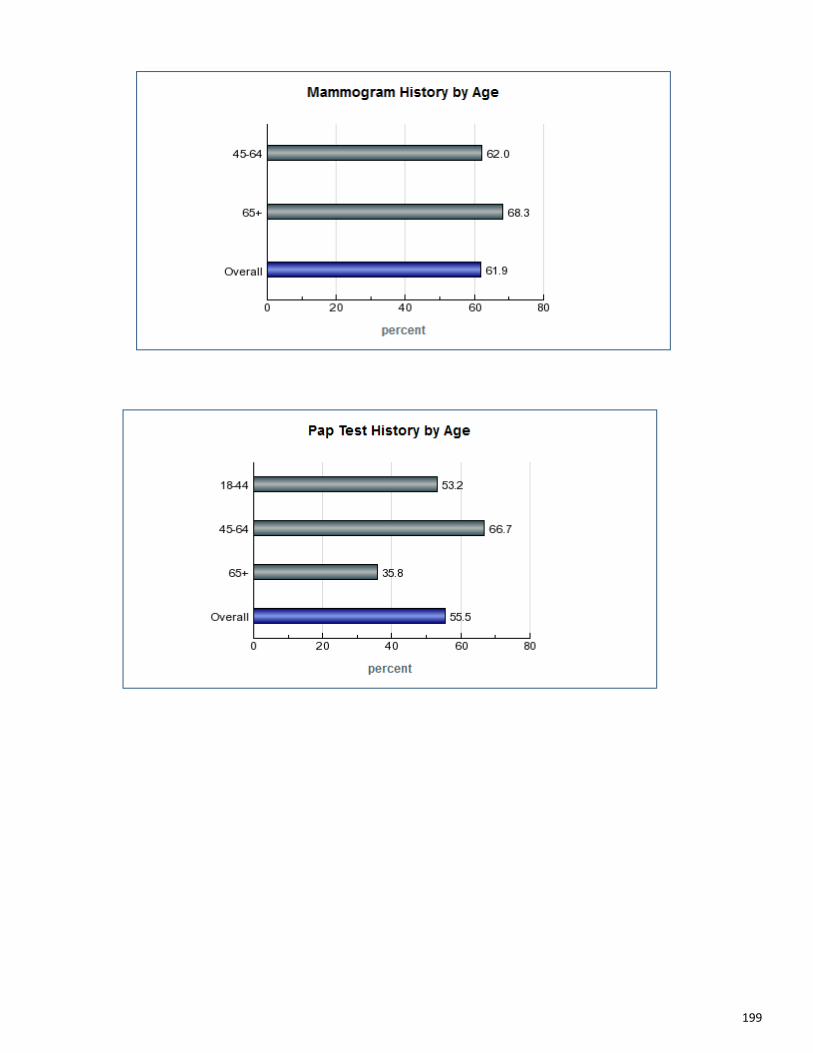
Promoting evidenced-based cancer screenings decreases the incidence and mortality rates among community residents. For women, mammogram and PAP screening rates decreased from 2007 to 2010. The Healthy People 2020 targets for both indicators have not been met. Breast Cancer is fifth leading cause of death in Brevard.
The percentage of adults over 50 years who have been screened for colorectal cancer remained stable over the past 3 years. Only 14.9 percent of adults reported having a blood stool test within the past year. This is down from 29.3 percent in 2007.
Maternal and Child Health
The well-being of mothers, infants, and children determines the health of the next generation and
Indicator Rate or Percent
Healthy People 2020
Target
Target Status
Target Minus the Current
Rate
Trend US Preventive Services
Task Force Grades/Recommendations
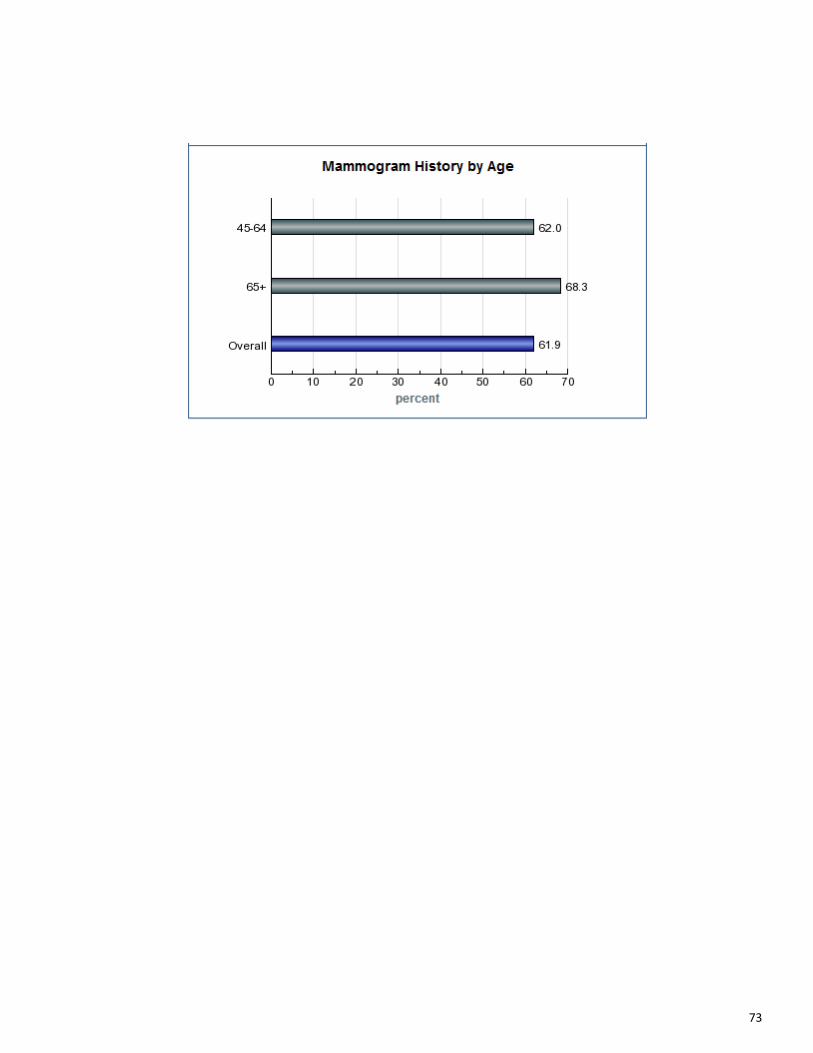
Health Screenings Mammogram History 61.9% 81.1% Not Met -19.2% ↓ B/Women 50-74 years
Colonoscopy over 50 within past 5 years
59.3% 70.5% Not Met -11.2% = A/Adults 50-75 years
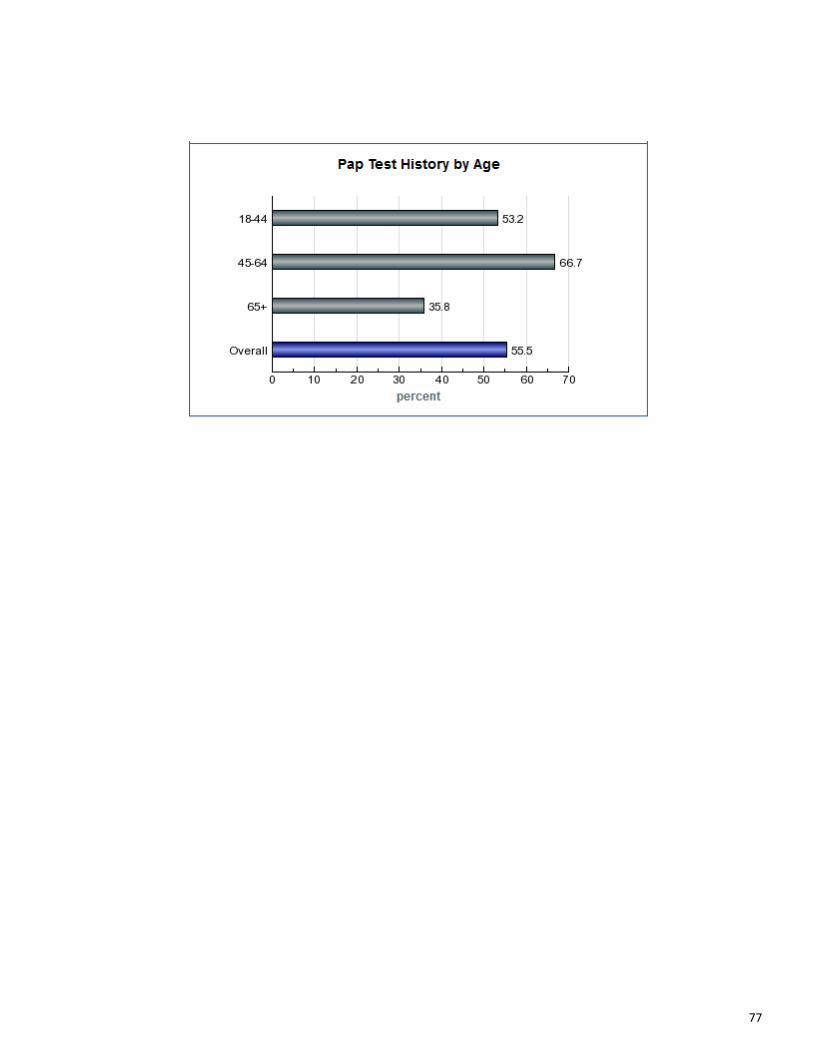
PAP Test History 55.5% 93.0% Not Met -37.5% ↓ A/Sexually active women with a cervix
PSA men over 50 in past two years 79.4% N/A N/A N/A ↑ D/Men in the general public Colon Cancer Screening (Blood Stool)
14.9% N/A N/A N/A ↓ A/Adults 50-75 years
Indicator Rate or Percent
Healthy People 2020
Target
Target Status
Target Minus the Current
Rate
Trend
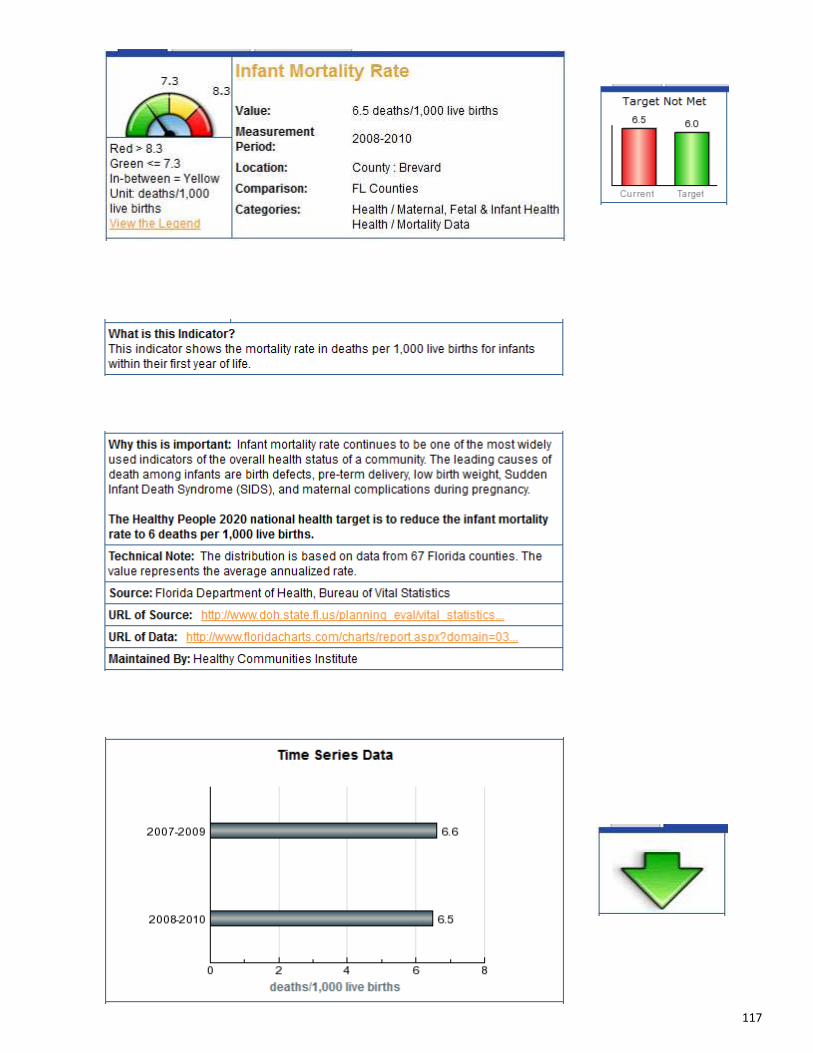
Infant Mortality Infant deaths (0-365 days) 6.5/1,000 6.0/1,000 Not met -0.5/1,000 ↓
Sudden Infant Death Syndrome (SIDS) 0.19/1,000 0.55/1,000 Not met 0.36/1,000 ↑
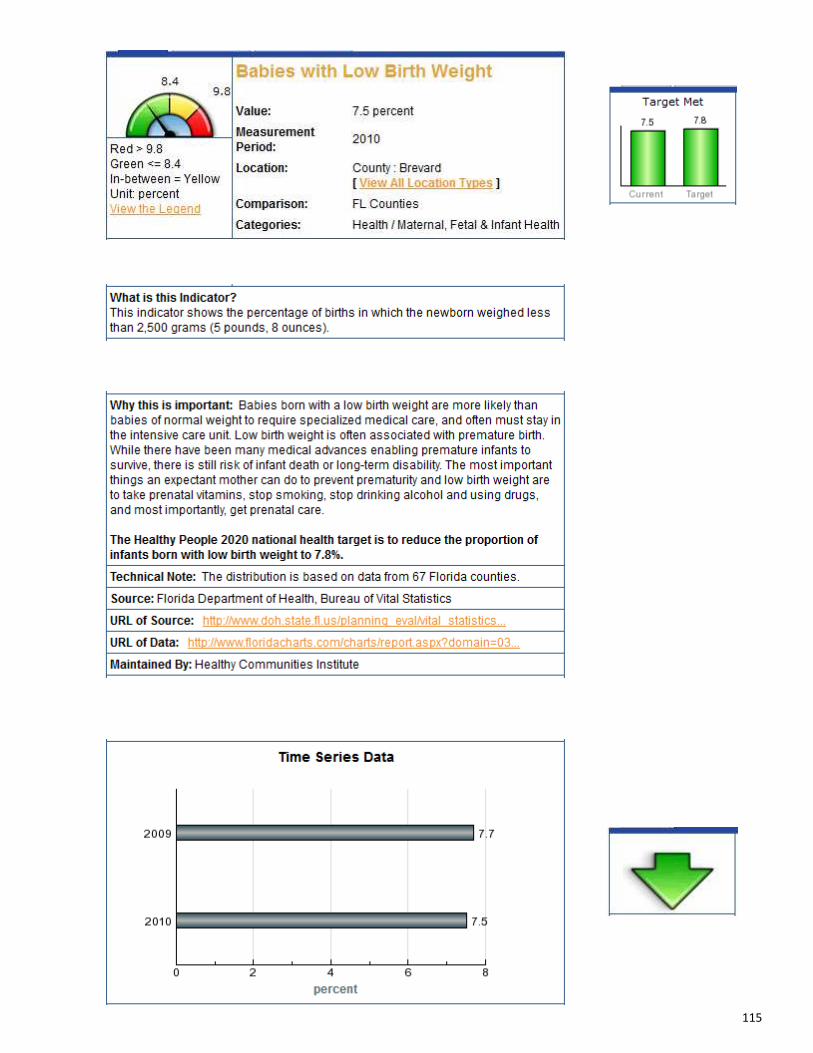
Birth Outcomes Preterm births 12.2% 11.4% Not met -0.8% ↑
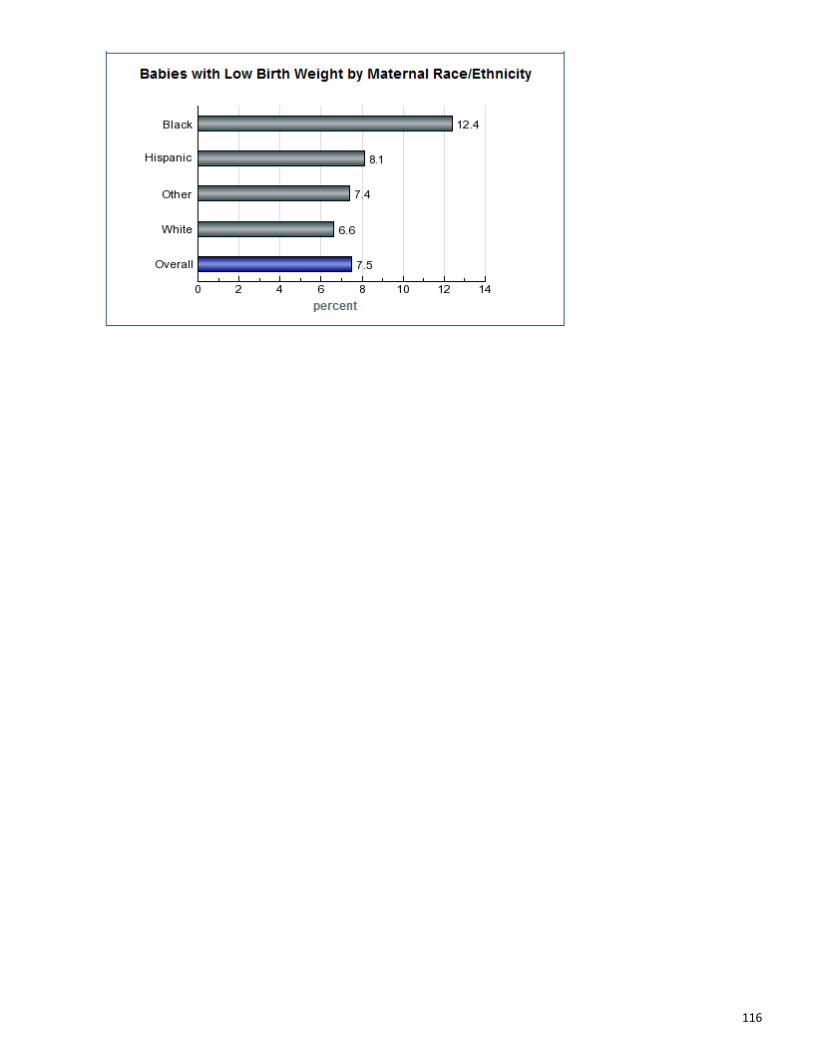
Low birth weight (< 2500 grams) 7.5% 7.8% Met 0.3% ↓
Pregnancy
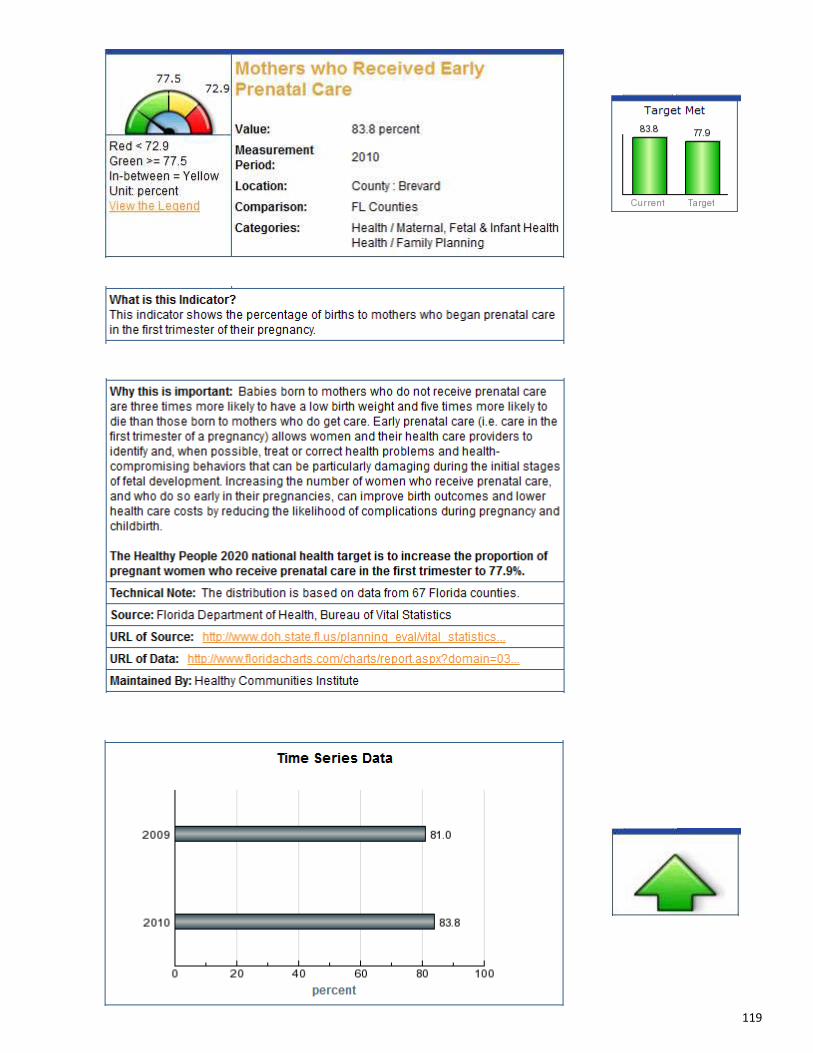
Mothers who received 1st trimester prenatal care
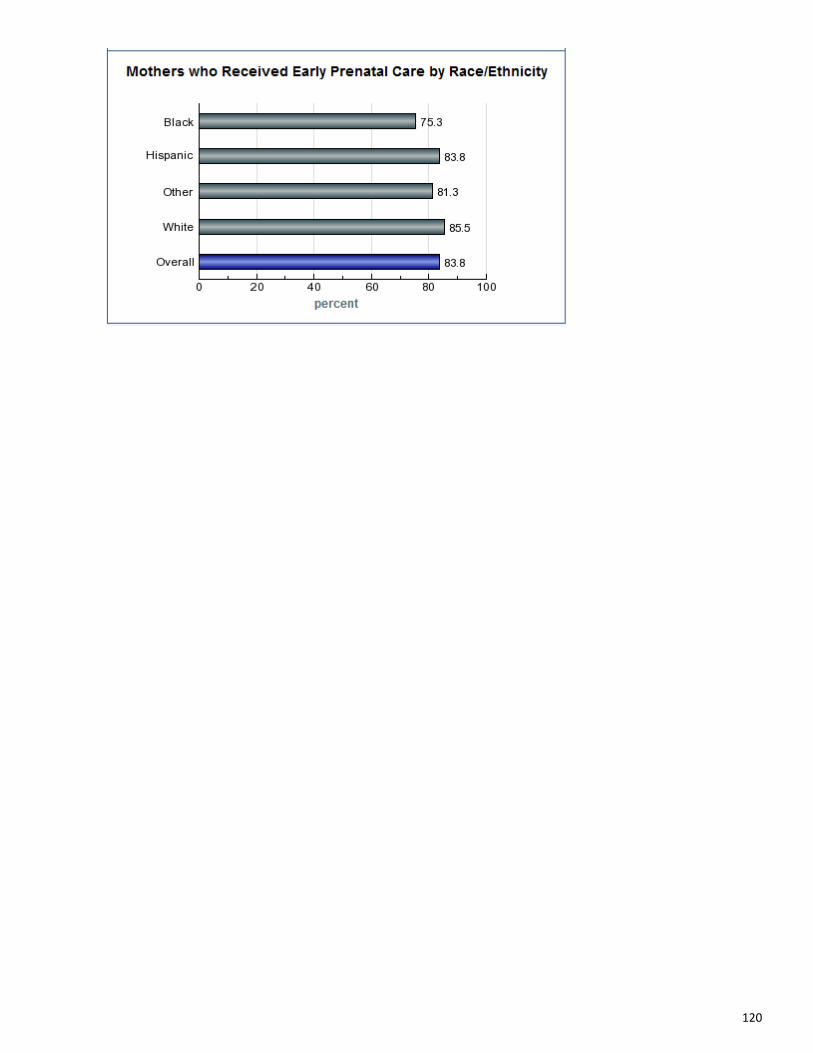
83.8% 77.9% Met 5.9% ↑
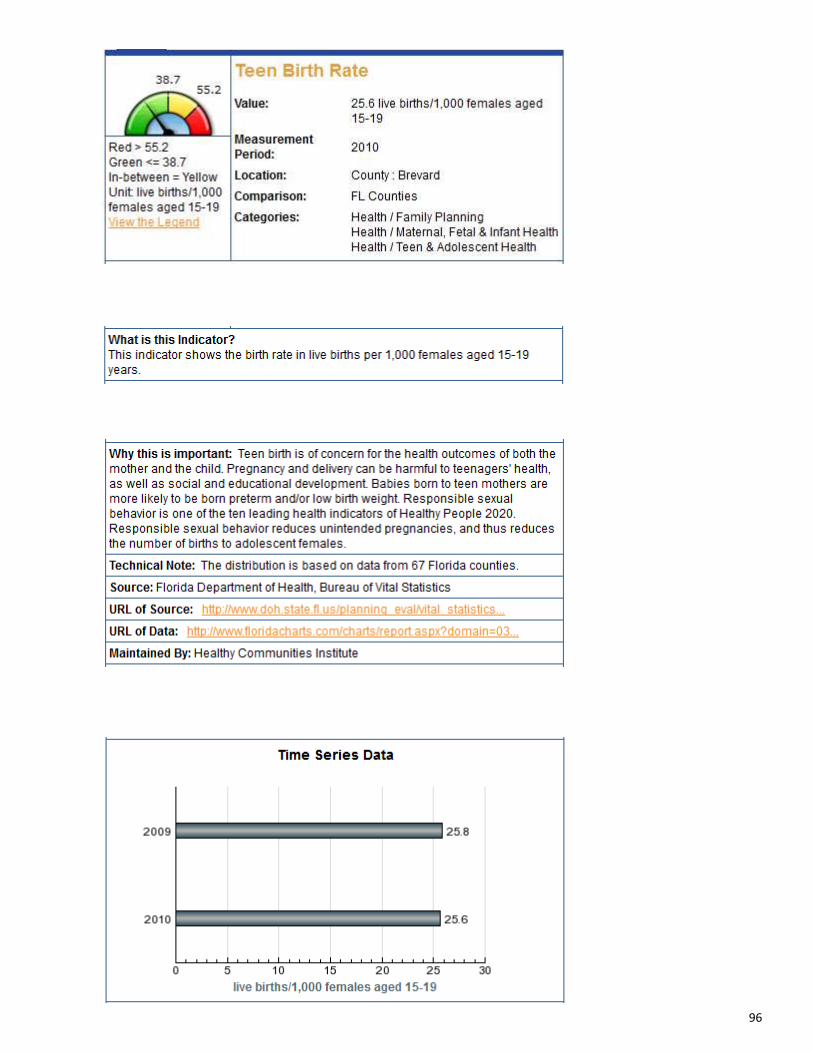
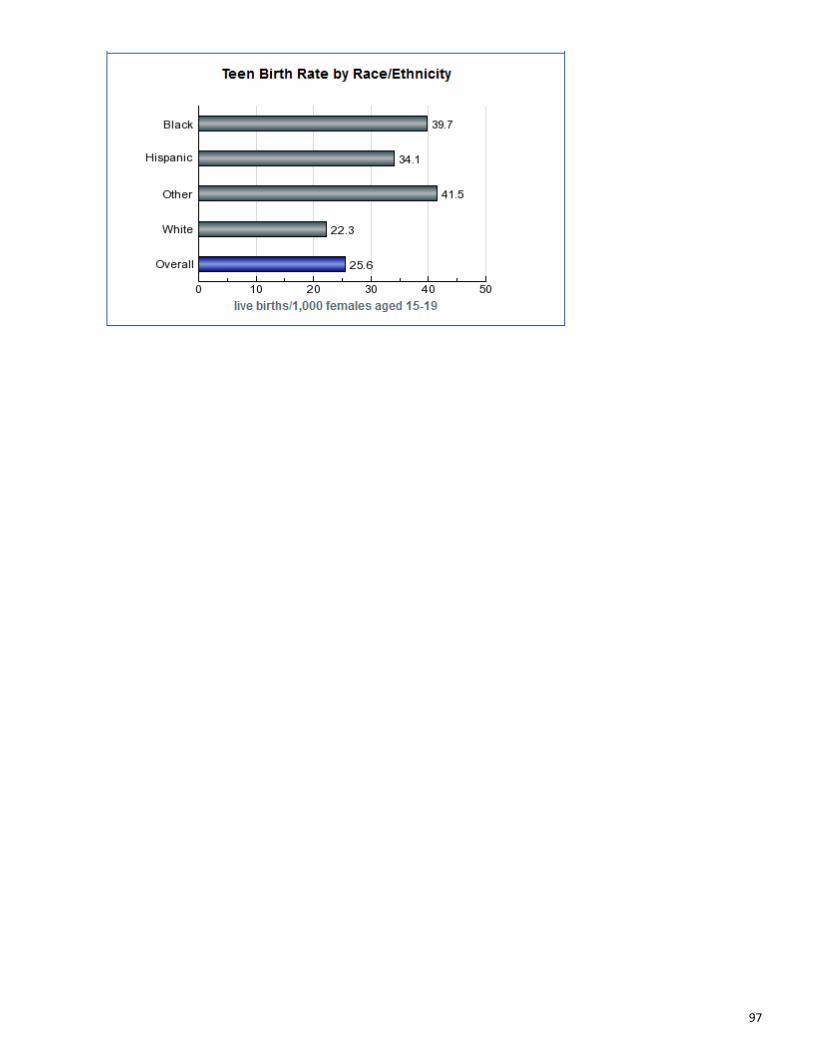
Births to mothers Ages 15-19 years 2.8% N/A N/A N/A ↓
20
can help predict future public health issues for families, communities, and the health care system. The infant mortality rate in Brevard is close to the Healthy People 2020 target and moving in the right direction. Deaths due to SIDS should be interpreted with caution as the actual number of deaths is very small. In 2008-2010 there were 3 SIDS deaths in the county.
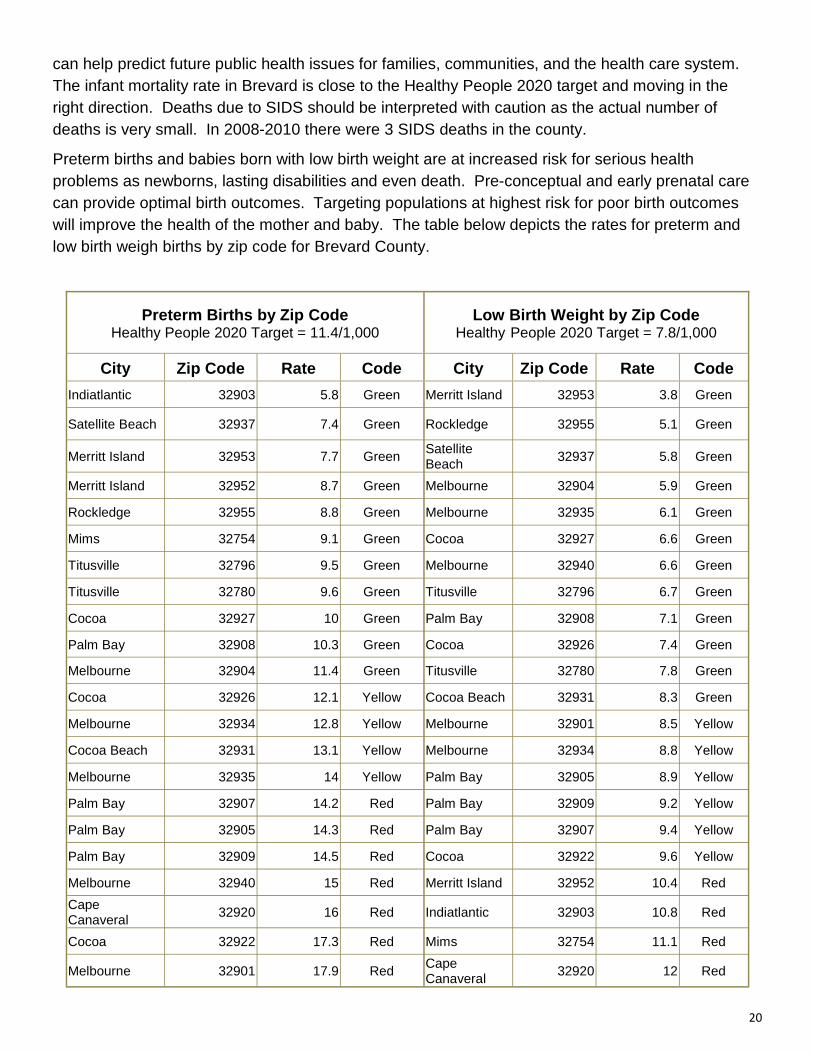
Preterm births and babies born with low birth weight are at increased risk for serious health problems as newborns, lasting disabilities and even death. Pre-conceptual and early prenatal care can provide optimal birth outcomes. Targeting populations at highest risk for poor birth outcomes will improve the health of the mother and baby. The table below depicts the rates for preterm and low birth weigh births by zip code for Brevard County.
Preterm Births by Zip Code Healthy People 2020 Target = 11.4/1,000
Low Birth Weight by Zip Code Healthy People 2020 Target = 7.8/1,000
City Zip Code Rate Code City Zip Code Rate Code
Indiatlantic 32903 5.8 Green Merritt Island 32953 3.8 Green
Satellite Beach 32937 7.4 Green Rockledge 32955 5.1 Green
Merritt Island 32953 7.7 Green Satellite Beach
32937 5.8 Green
Merritt Island 32952 8.7 Green Melbourne 32904 5.9 Green
Rockledge 32955 8.8 Green Melbourne 32935 6.1 Green
Mims 32754 9.1 Green Cocoa 32927 6.6 Green
Titusville 32796 9.5 Green Melbourne 32940 6.6 Green
Titusville 32780 9.6 Green Titusville 32796 6.7 Green
Cocoa 32927 10 Green Palm Bay 32908 7.1 Green
Palm Bay 32908 10.3 Green Cocoa 32926 7.4 Green
Melbourne 32904 11.4 Green Titusville 32780 7.8 Green
Cocoa 32926 12.1 Yellow Cocoa Beach 32931 8.3 Green
Melbourne 32934 12.8 Yellow Melbourne 32901 8.5 Yellow
Cocoa Beach 32931 13.1 Yellow Melbourne 32934 8.8 Yellow
Melbourne 32935 14 Yellow Palm Bay 32905 8.9 Yellow
Palm Bay 32907 14.2 Red Palm Bay 32909 9.2 Yellow
Palm Bay 32905 14.3 Red Palm Bay 32907 9.4 Yellow
Palm Bay 32909 14.5 Red Cocoa 32922 9.6 Yellow
Melbourne 32940 15 Red Merritt Island 32952 10.4 Red
Cape Canaveral
32920 16 Red Indiatlantic 32903 10.8 Red
Cocoa 32922 17.3 Red Mims 32754 11.1 Red
Melbourne 32901 17.9 Red Cape Canaveral
32920 12 Red

21
Preterm and low birth weight rates were mapped to provide additional information for targeting specific populations with interventions to improve birth outcomes. The zip codes in the red zone indicate higher rates for both indicators.
22
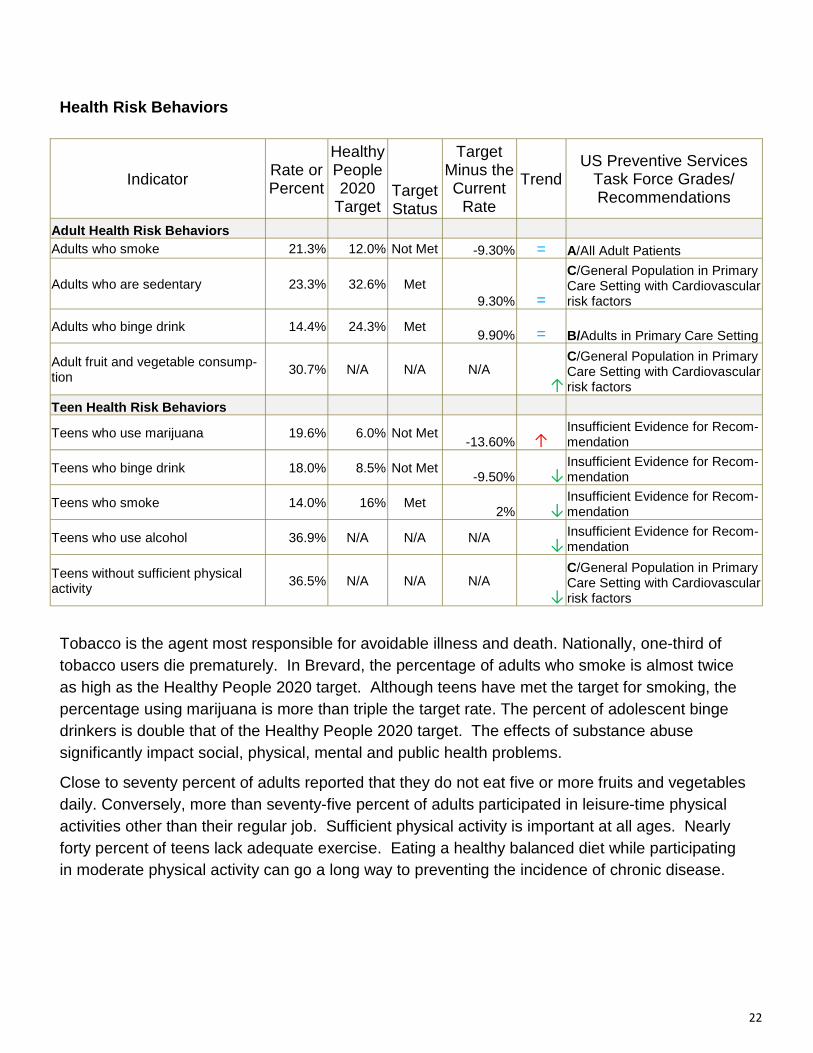
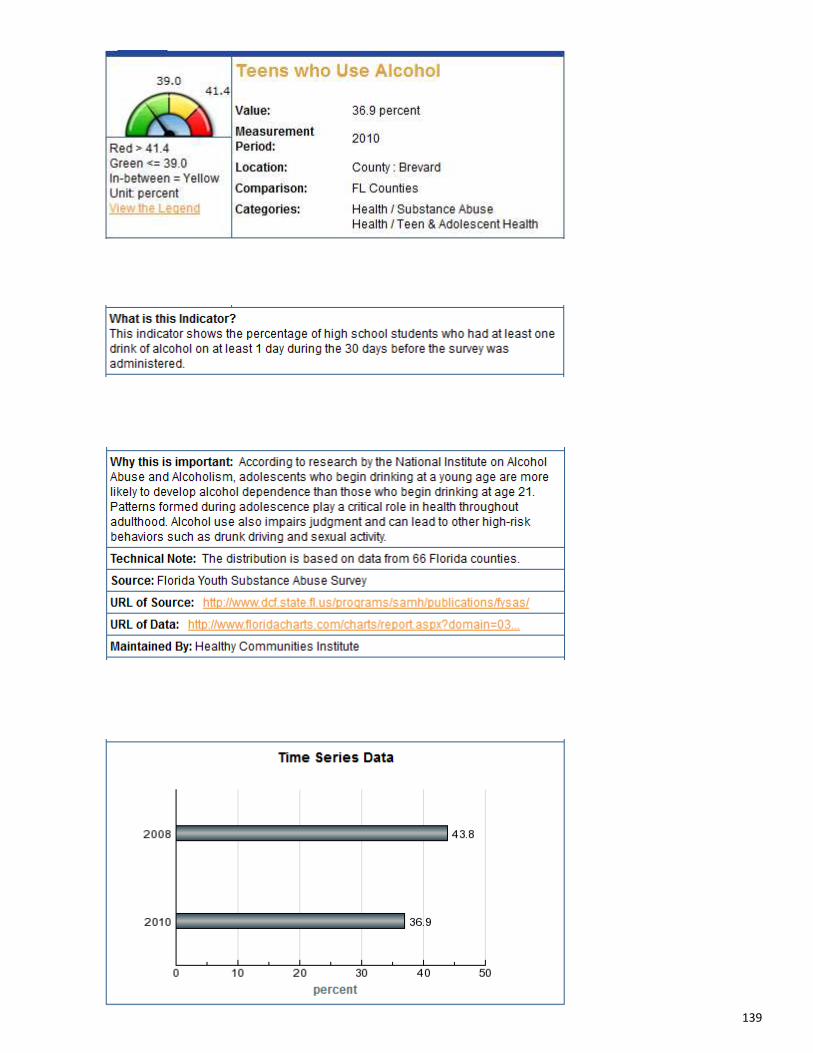
Health Risk Behaviors
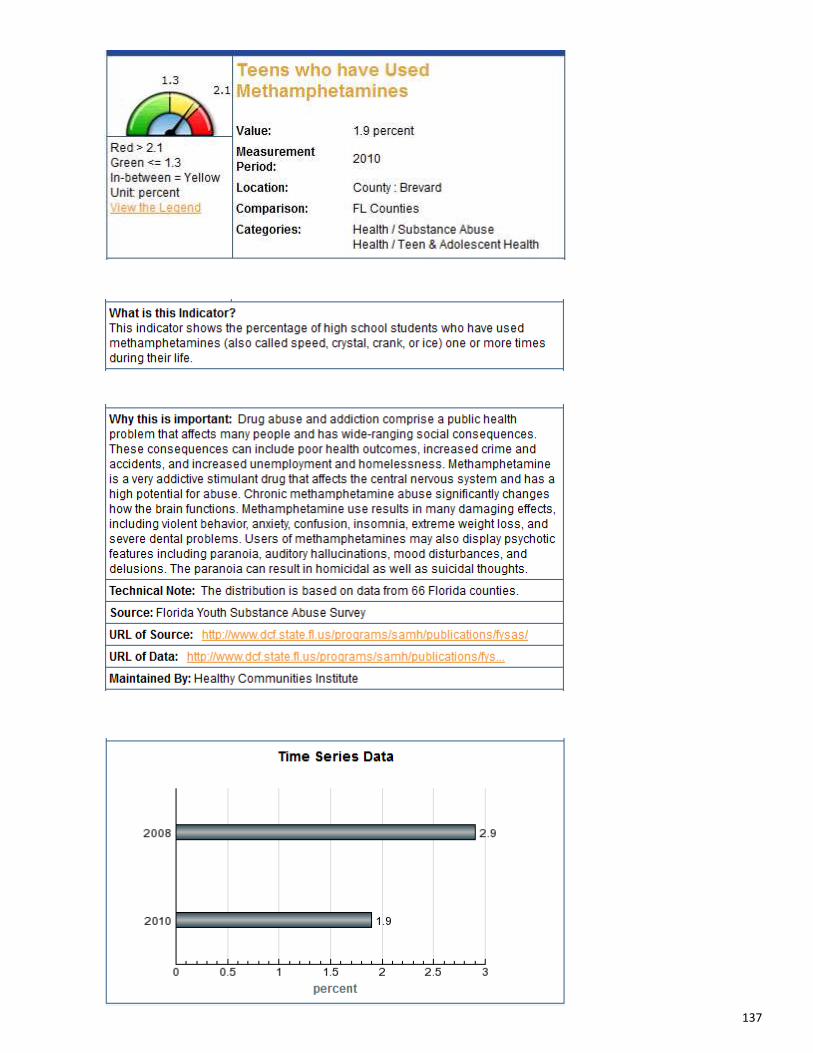
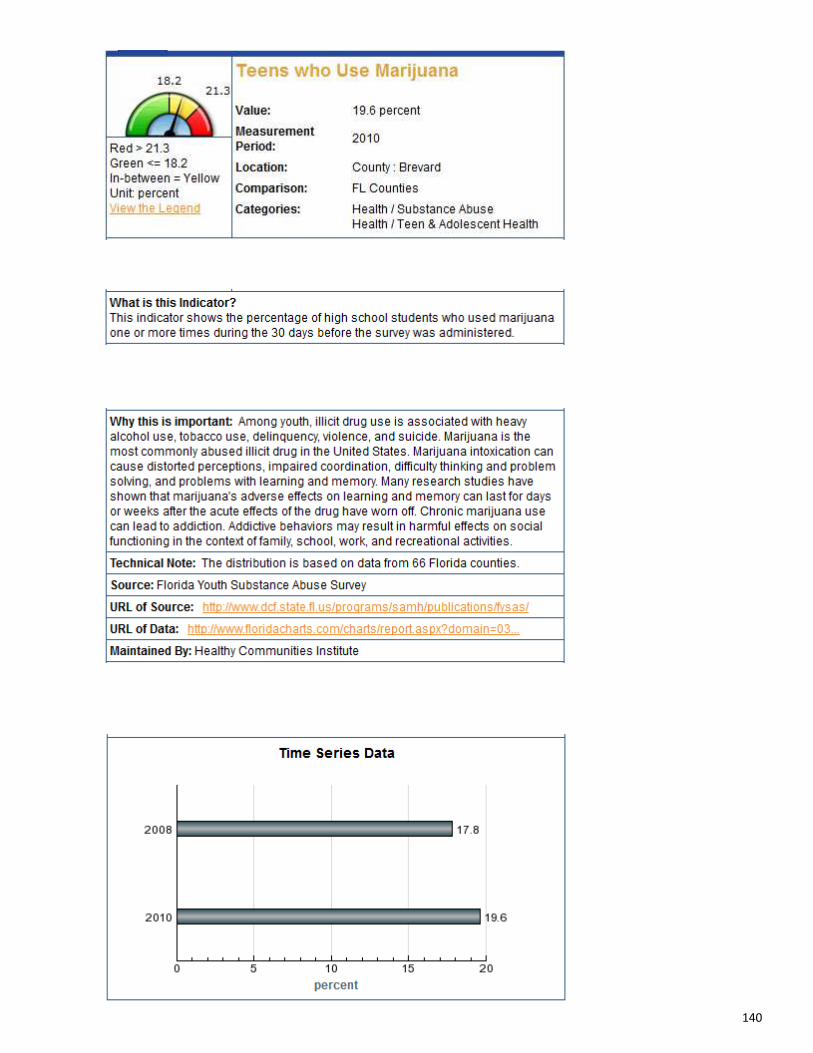
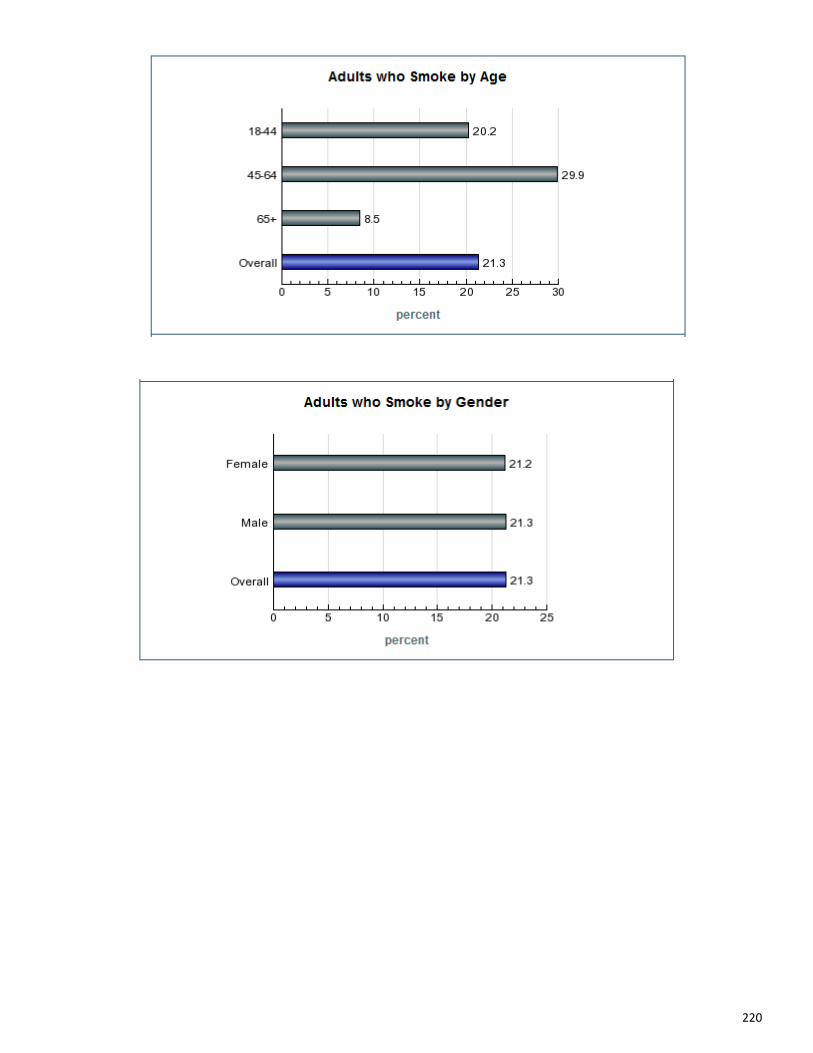
Tobacco is the agent most responsible for avoidable illness and death. Nationally, one-third of tobacco users die prematurely. In Brevard, the percentage of adults who smoke is almost twice as high as the Healthy People 2020 target. Although teens have met the target for smoking, the percentage using marijuana is more than triple the target rate. The percent of adolescent binge drinkers is double that of the Healthy People 2020 target. The effects of substance abuse significantly impact social, physical, mental and public health problems.
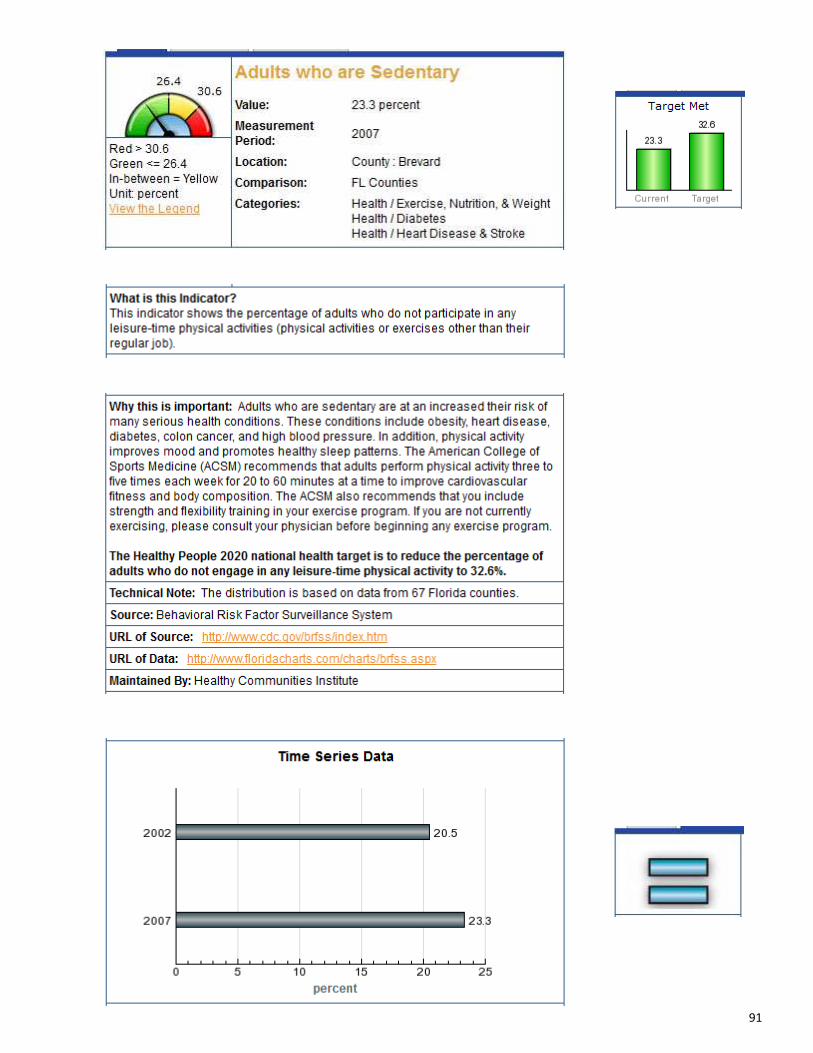
Close to seventy percent of adults reported that they do not eat five or more fruits and vegetables daily. Conversely, more than seventy-five percent of adults participated in leisure-time physical activities other than their regular job. Sufficient physical activity is important at all ages. Nearly forty percent of teens lack adequate exercise. Eating a healthy balanced diet while participating in moderate physical activity can go a long way to preventing the incidence of chronic disease.
Indicator Rate or Percent
Healthy People 2020
Target Target Status
Target Minus the Current
Rate
Trend US Preventive Services
Task Force Grades/Recommendations
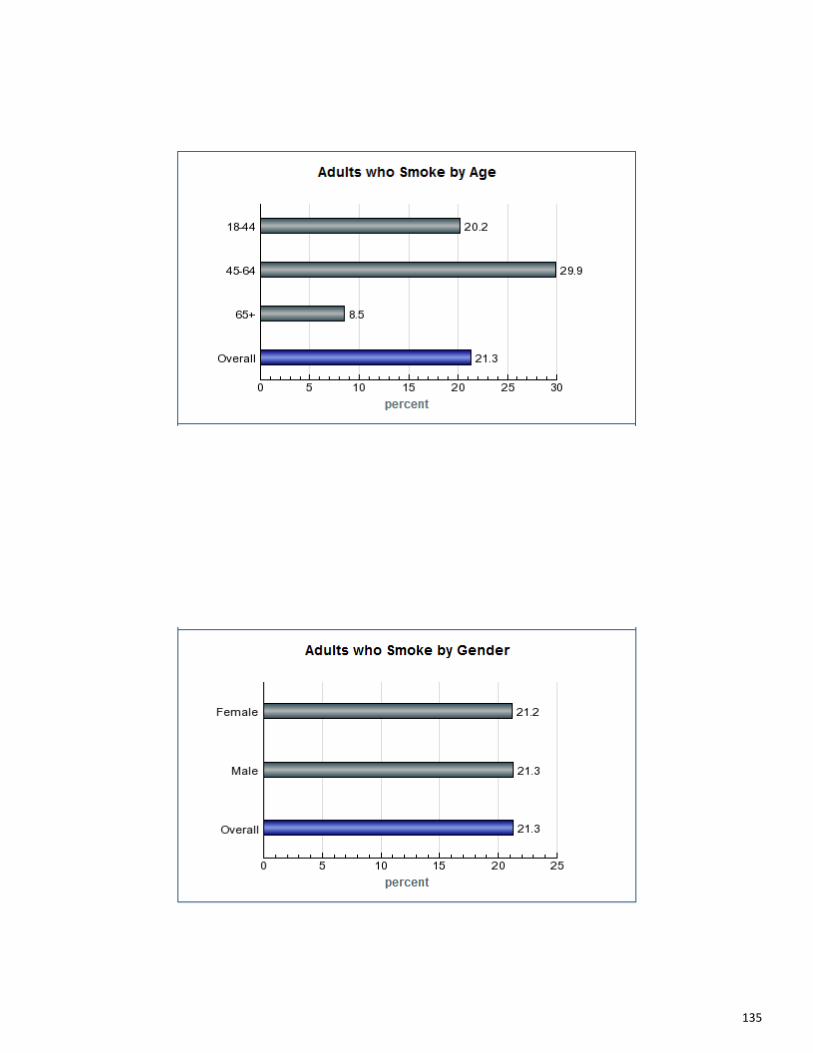
Adult Health Risk Behaviors Adults who smoke 21.3% 12.0% Not Met -9.30% = A/All Adult Patients
Adults who are sedentary 23.3% 32.6% Met 9.30% =
C/General Population in Primary Care Setting with Cardiovascular risk factors
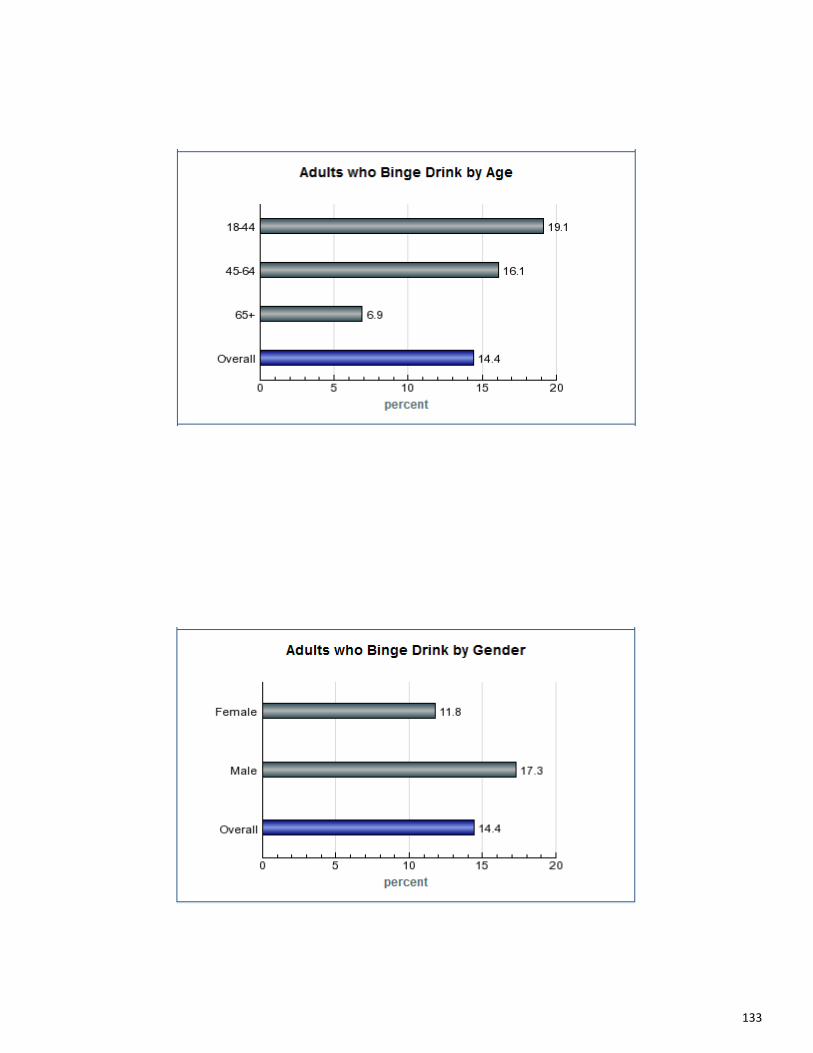
Adults who binge drink 14.4% 24.3% Met 9.90% = B/Adults in Primary Care Setting
Adult fruit and vegetable consump-tion
30.7% N/A N/A N/A ↑
C/General Population in Primary Care Setting with Cardiovascular risk factors
Teen Health Risk Behaviors
Teens who use marijuana 19.6% 6.0% Not Met -13.60% ↑
Insufficient Evidence for Recom-mendation
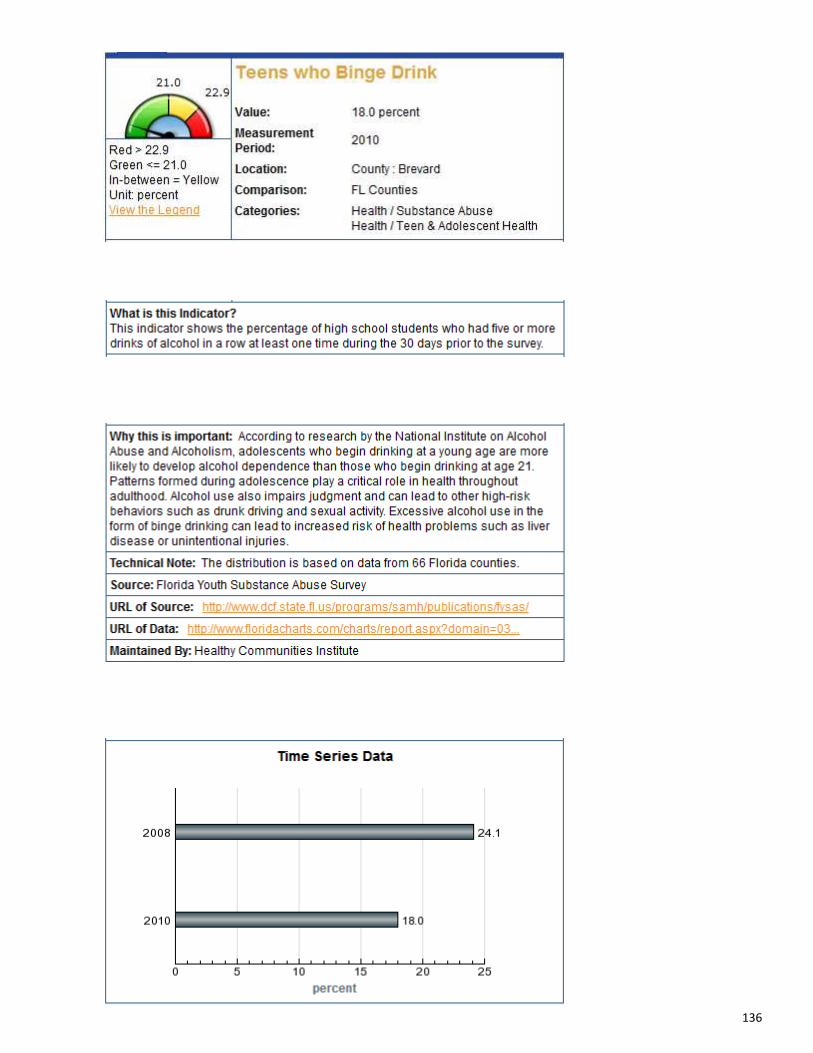
Teens who binge drink 18.0% 8.5% Not Met -9.50% ↓
Insufficient Evidence for Recom-mendation
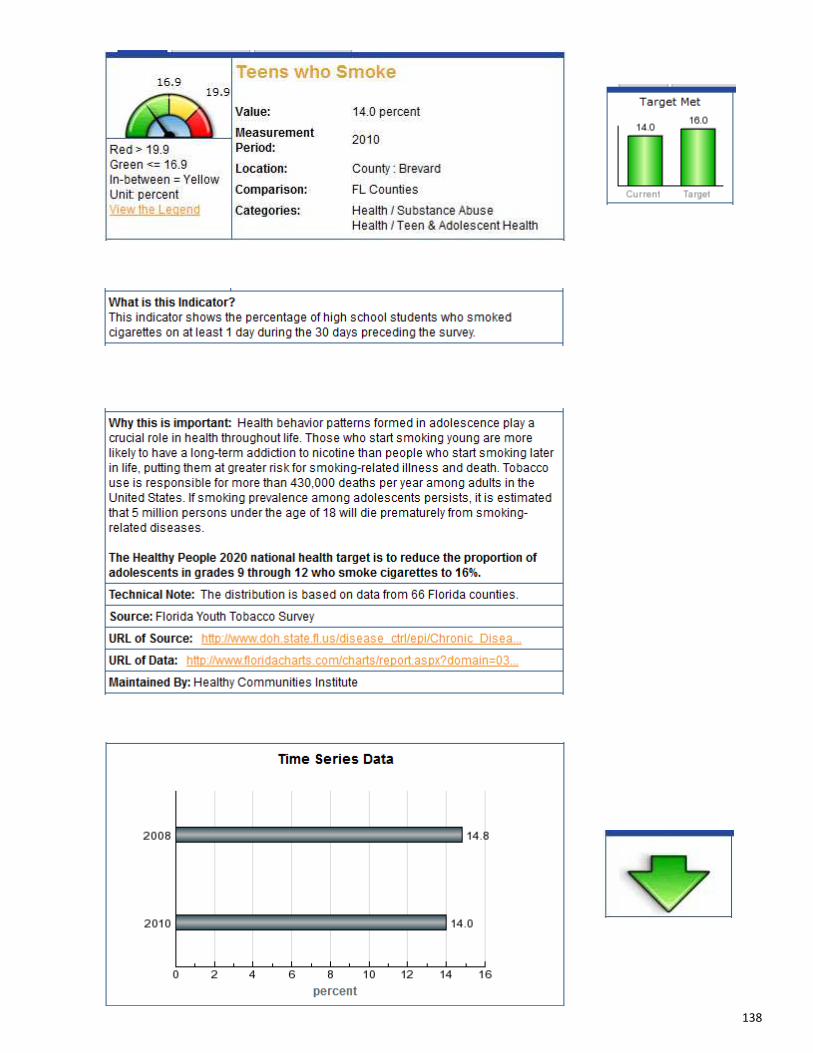
Teens who smoke 14.0% 16% Met 2% ↓
Insufficient Evidence for Recom-mendation
Teens who use alcohol 36.9% N/A N/A N/A ↓
Insufficient Evidence for Recom-mendation
Teens without sufficient physical activity 36.5% N/A N/A N/A
↓
C/General Population in Primary Care Setting with Cardiovascular risk factors
23
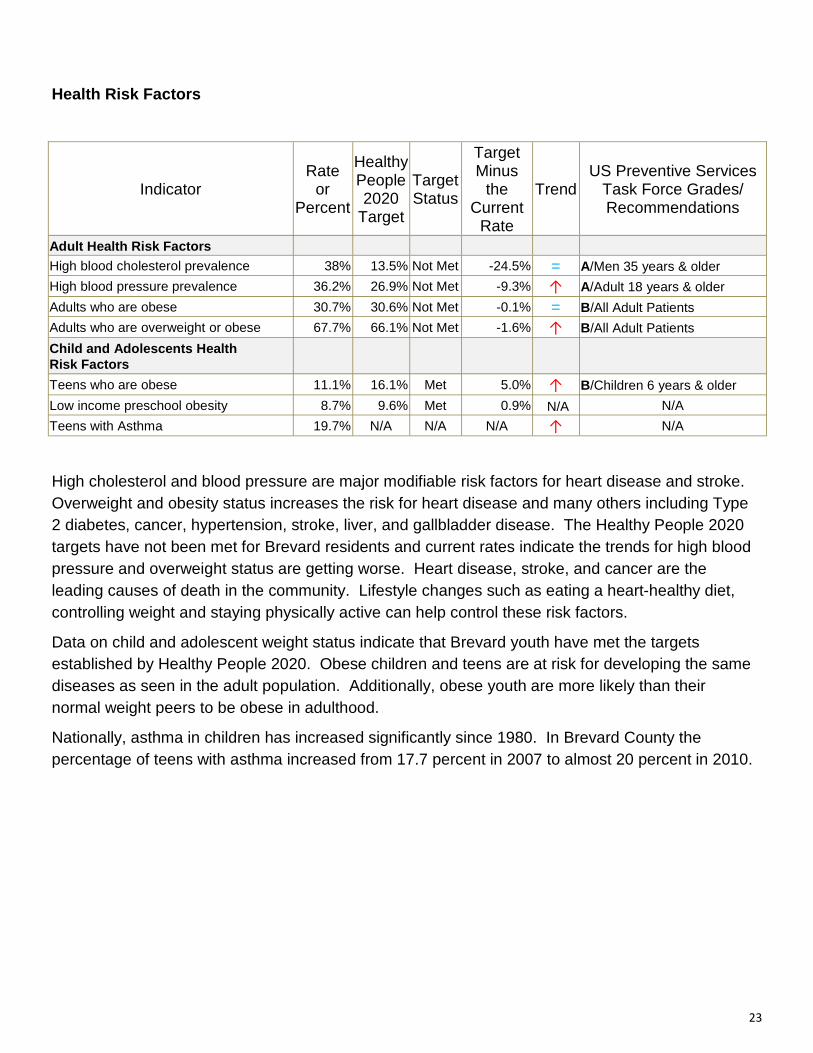
Health Risk Factors
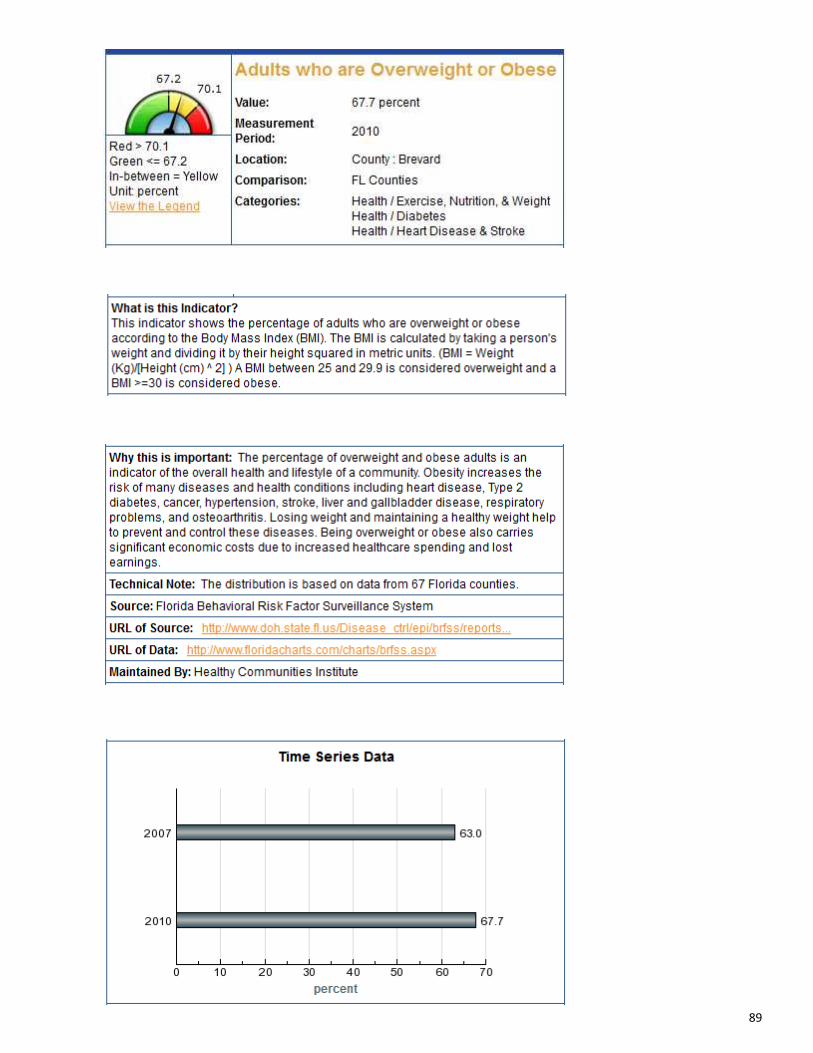
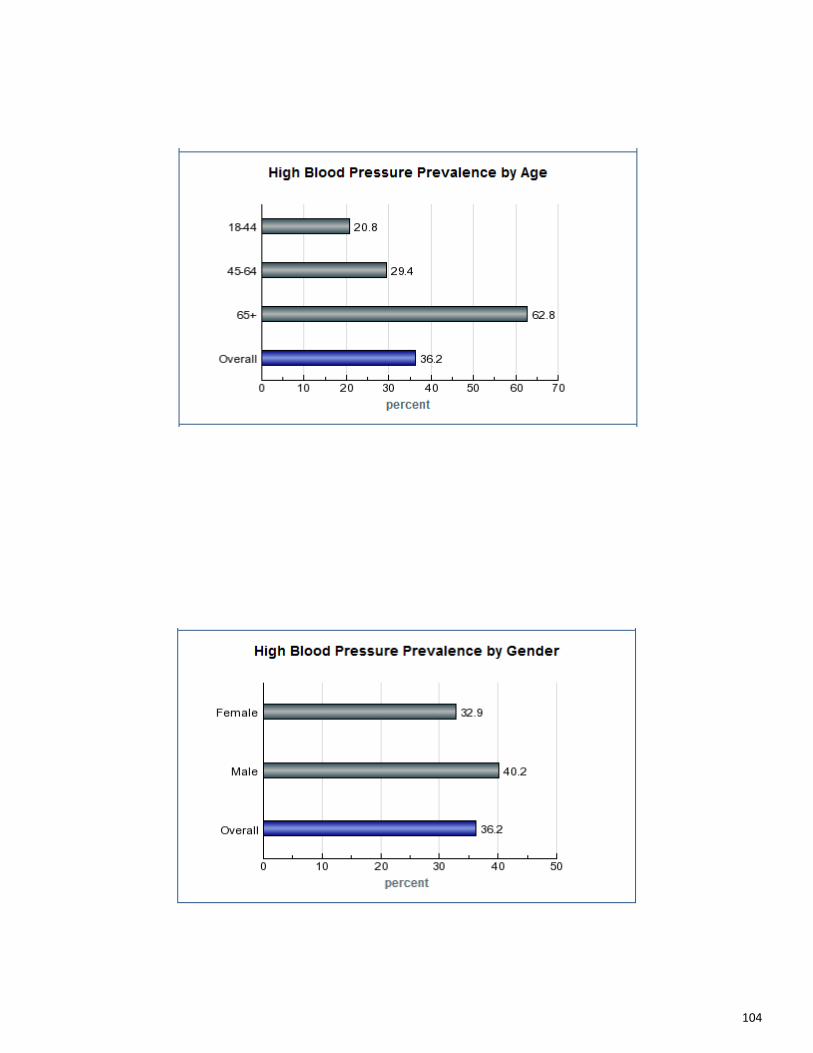
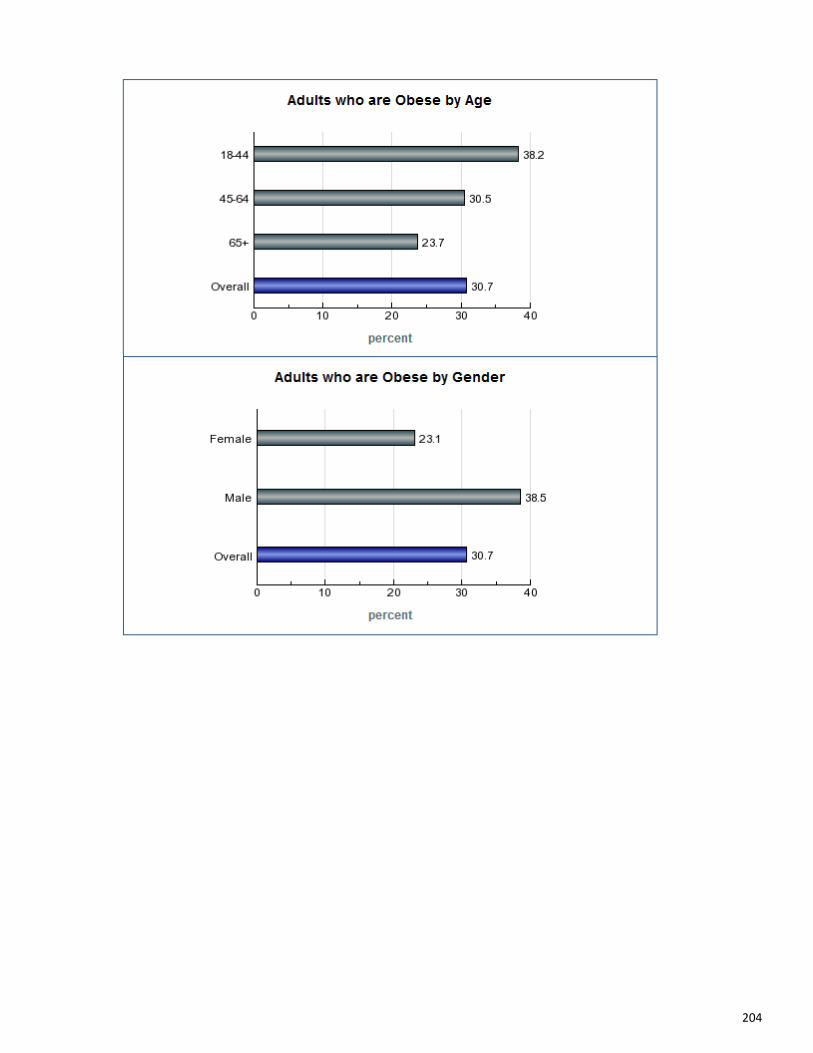
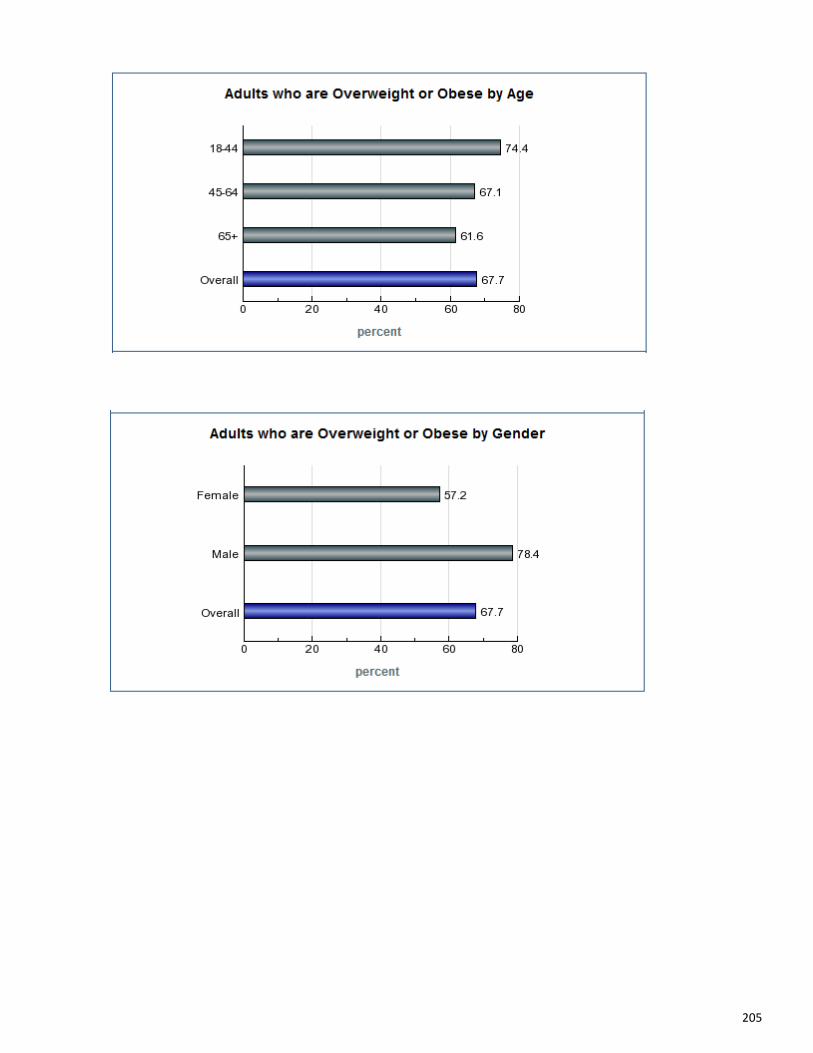
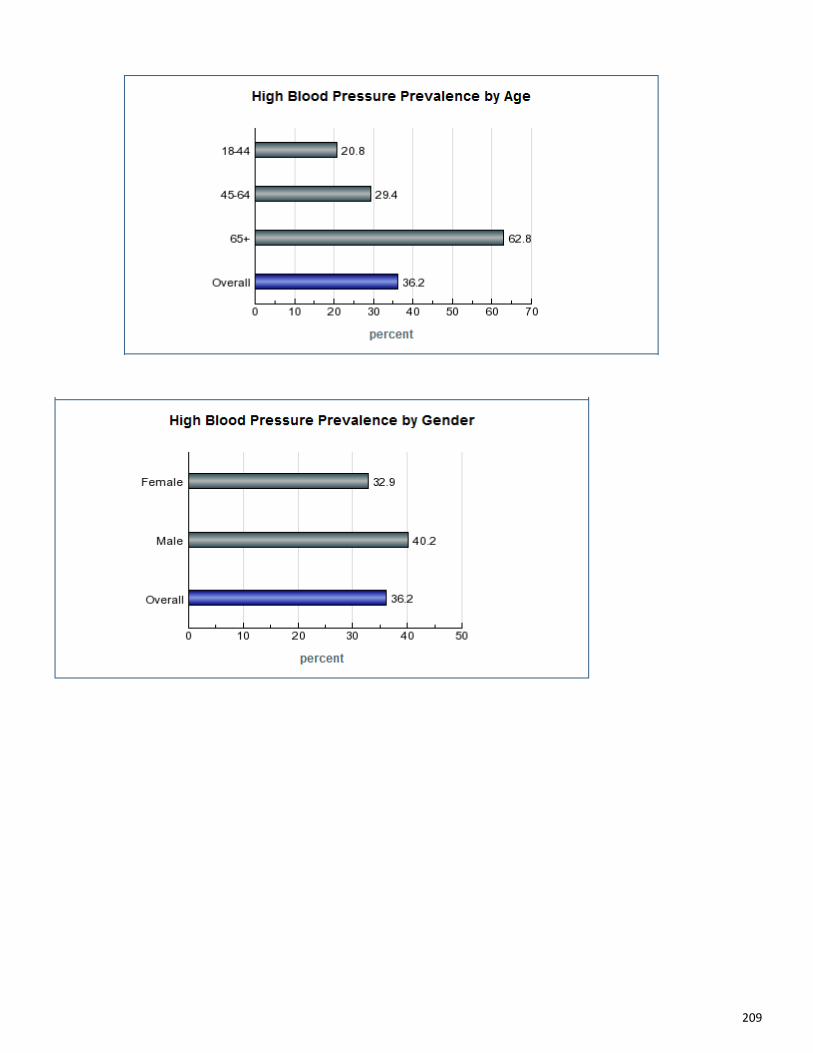
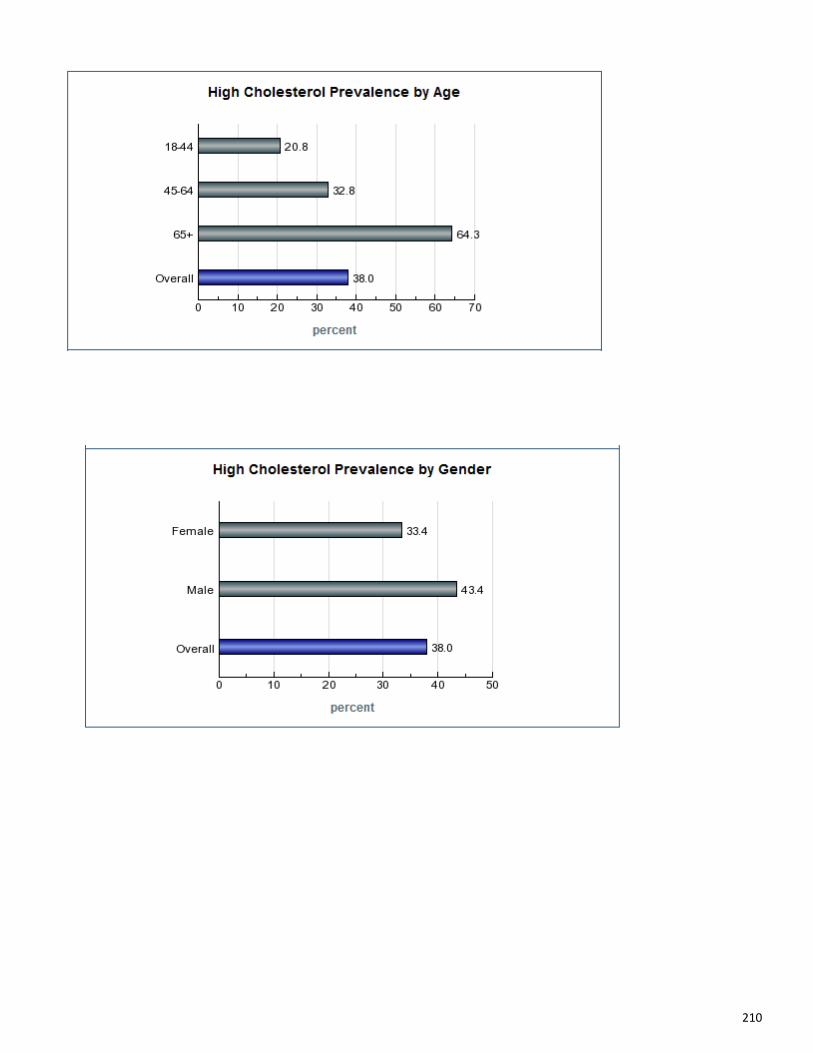
High cholesterol and blood pressure are major modifiable risk factors for heart disease and stroke. Overweight and obesity status increases the risk for heart disease and many others including Type 2 diabetes, cancer, hypertension, stroke, liver, and gallbladder disease. The Healthy People 2020 targets have not been met for Brevard residents and current rates indicate the trends for high blood pressure and overweight status are getting worse. Heart disease, stroke, and cancer are the leading causes of death in the community. Lifestyle changes such as eating a heart-healthy diet, controlling weight and staying physically active can help control these risk factors.
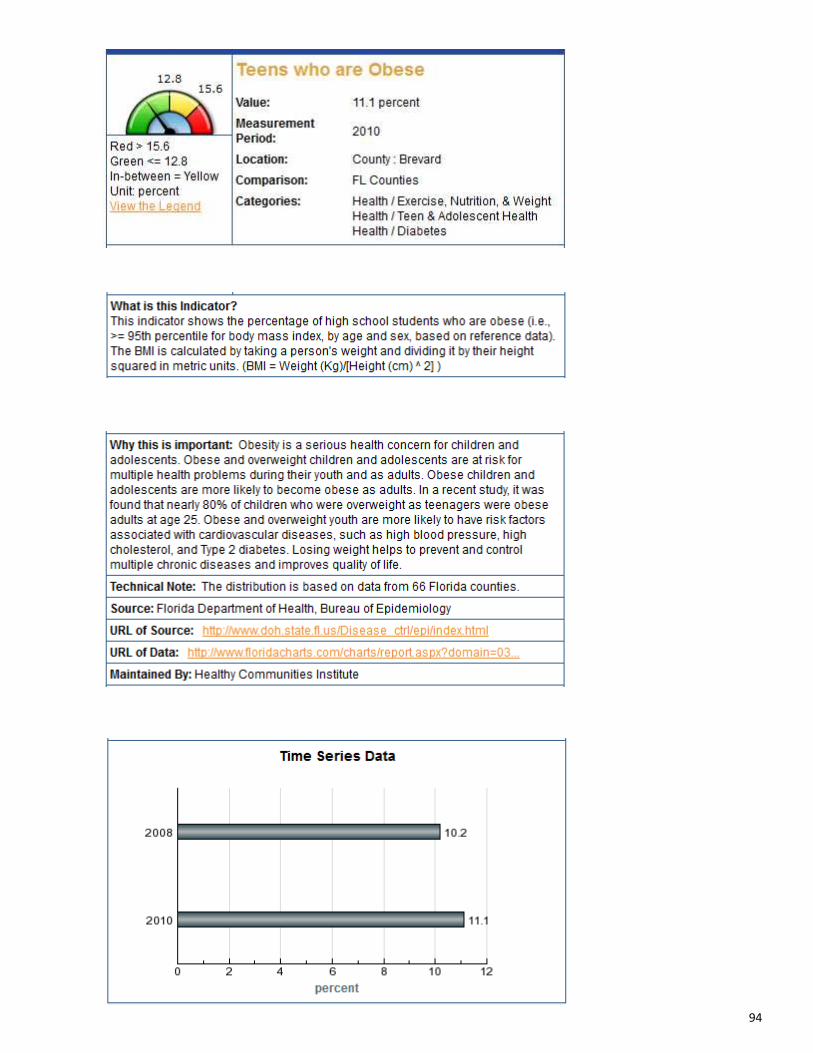
Data on child and adolescent weight status indicate that Brevard youth have met the targets established by Healthy People 2020. Obese children and teens are at risk for developing the same diseases as seen in the adult population. Additionally, obese youth are more likely than their normal weight peers to be obese in adulthood.
Nationally, asthma in children has increased significantly since 1980. In Brevard County the percentage of teens with asthma increased from 17.7 percent in 2007 to almost 20 percent in 2010.
Indicator Rate
or Percent
Healthy People 2020
Target
Target Status
Target Minus
the Current
Rate
Trend US Preventive Services
Task Force Grades/Recommendations
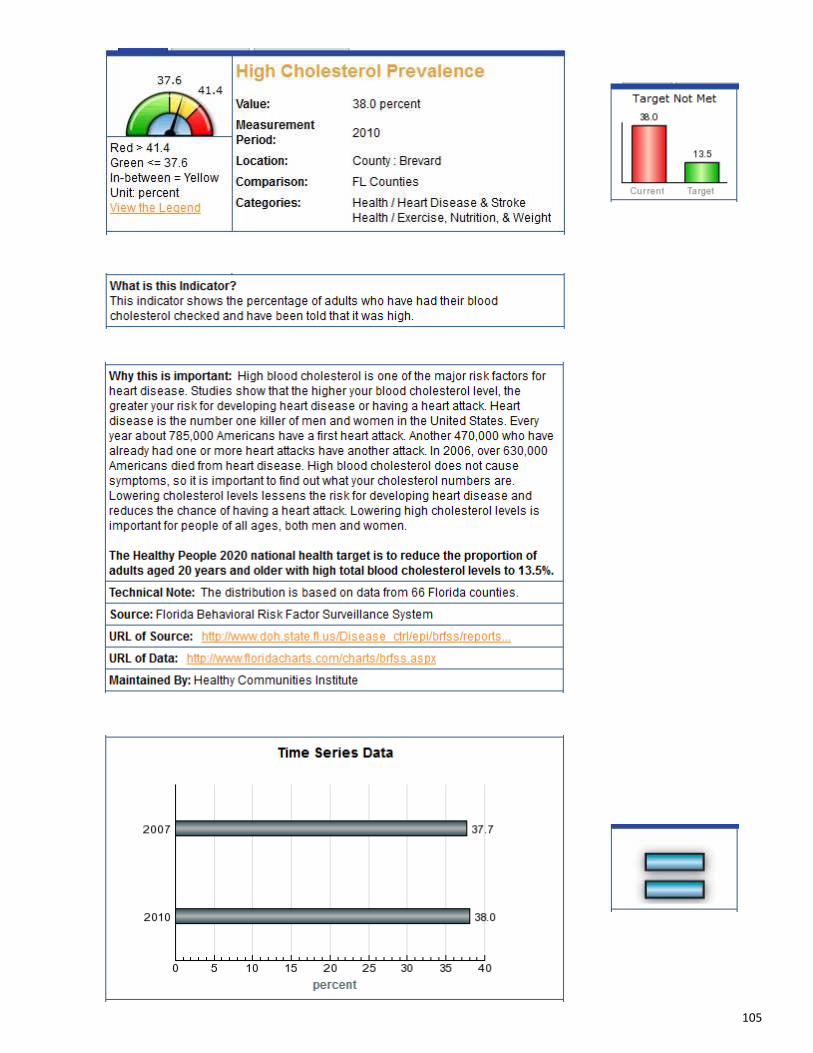
Adult Health Risk Factors High blood cholesterol prevalence 38% 13.5% Not Met -24.5% = A/Men 35 years & older
High blood pressure prevalence 36.2% 26.9% Not Met -9.3% ↑ A/Adult 18 years & older
Adults who are obese 30.7% 30.6% Not Met -0.1% = B/All Adult Patients
Adults who are overweight or obese 67.7% 66.1% Not Met -1.6% ↑ B/All Adult Patients
Child and Adolescents Health Risk Factors
Teens who are obese 11.1% 16.1% Met 5.0% ↑ B/Children 6 years & older
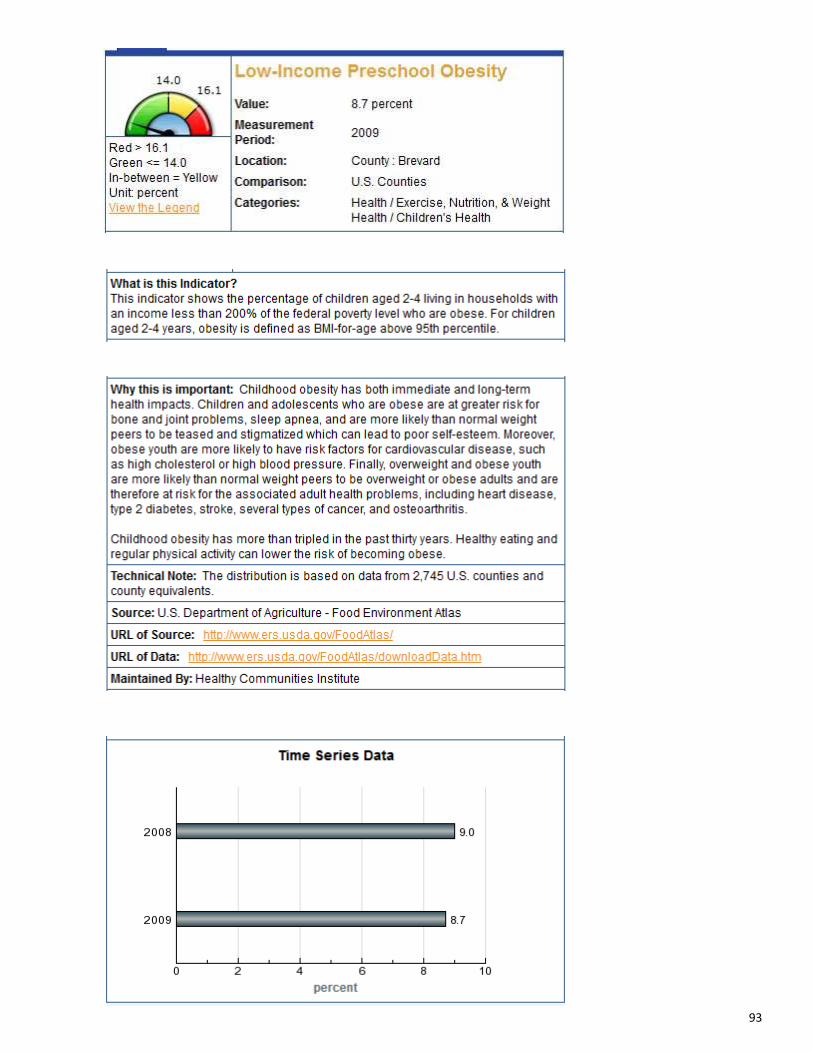
Low income preschool obesity 8.7% 9.6% Met 0.9% N/A N/A
Teens with Asthma 19.7% N/A N/A N/A ↑ N/A
24
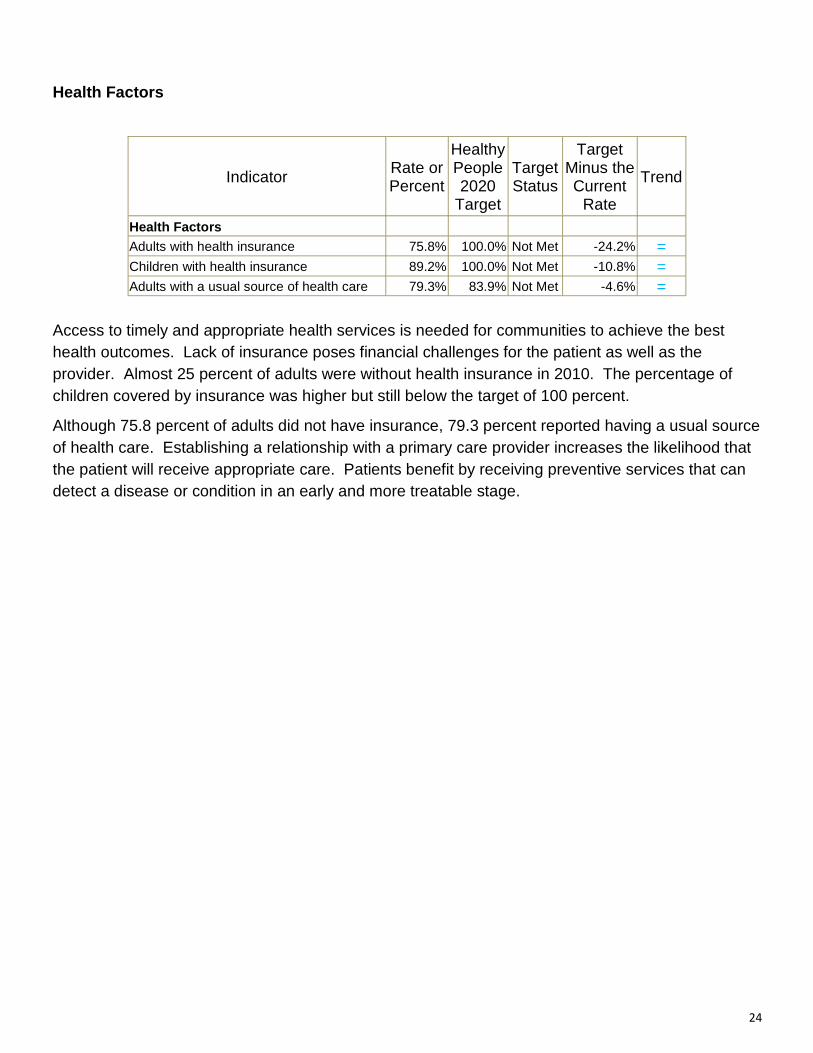
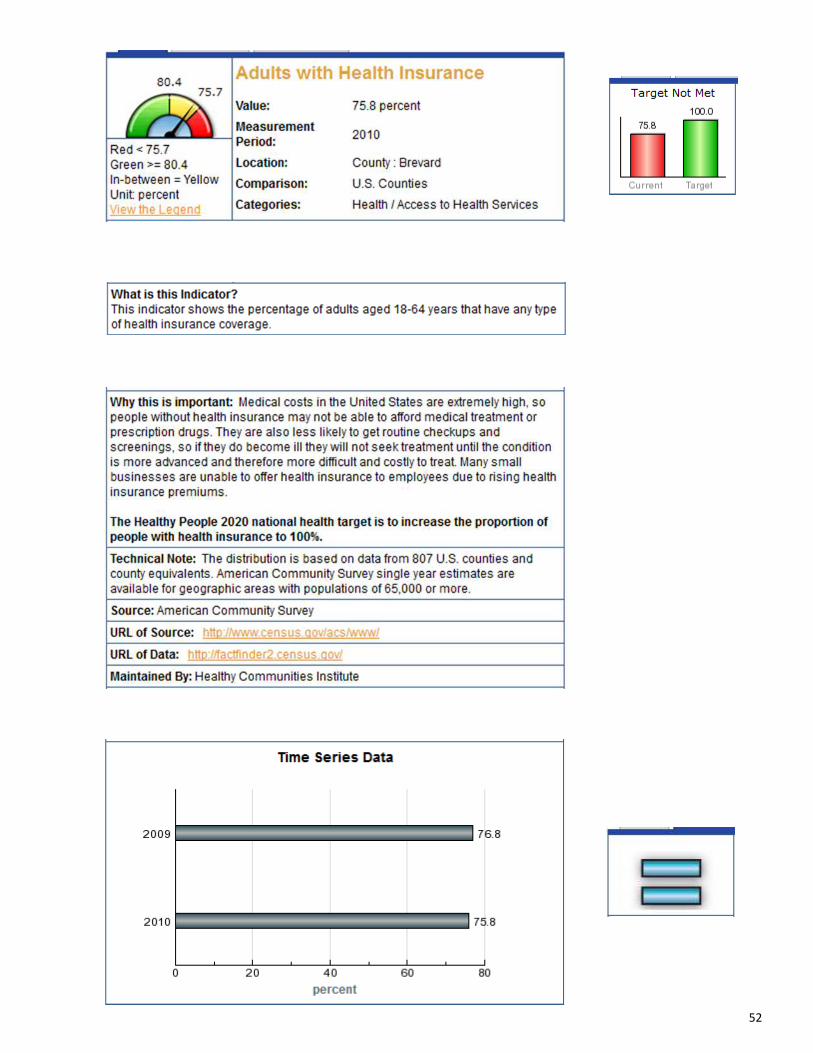
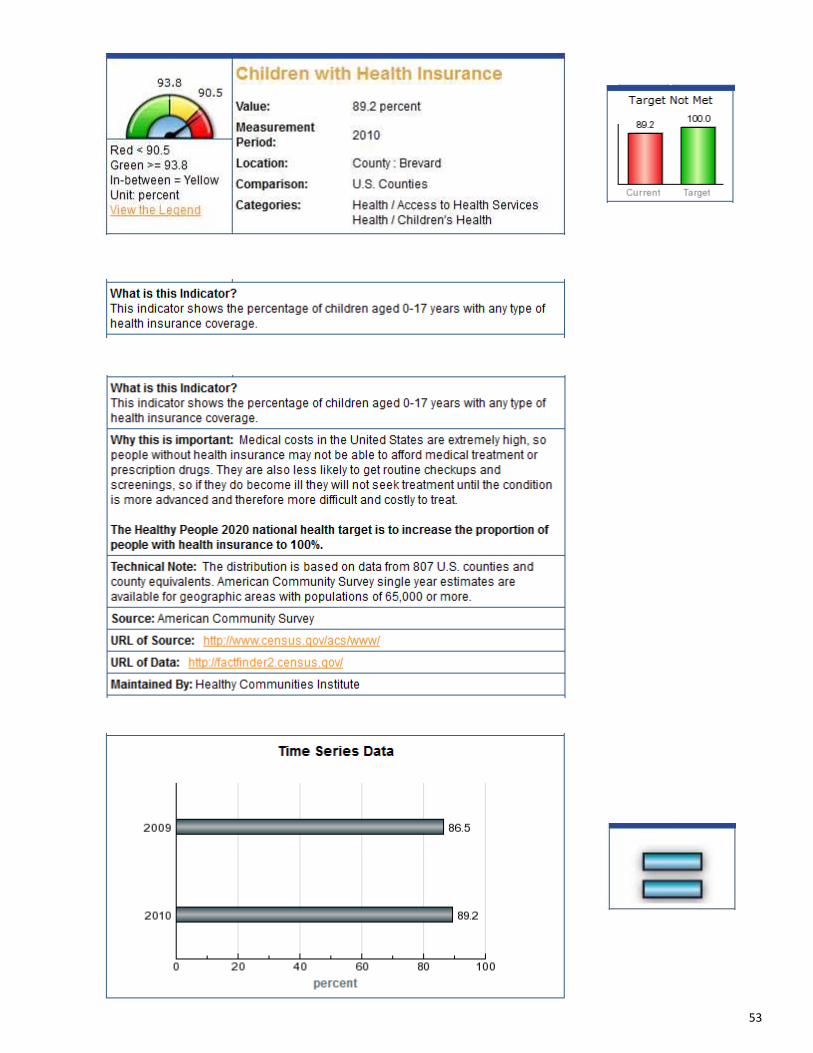
Health Factors
Access to timely and appropriate health services is needed for communities to achieve the best health outcomes. Lack of insurance poses financial challenges for the patient as well as the provider. Almost 25 percent of adults were without health insurance in 2010. The percentage of children covered by insurance was higher but still below the target of 100 percent.
Although 75.8 percent of adults did not have insurance, 79.3 percent reported having a usual source of health care. Establishing a relationship with a primary care provider increases the likelihood that the patient will receive appropriate care. Patients benefit by receiving preventive services that can detect a disease or condition in an early and more treatable stage.
Indicator Rate or Percent
Healthy People 2020
Target
Target Status
Target Minus the Current
Rate
Trend
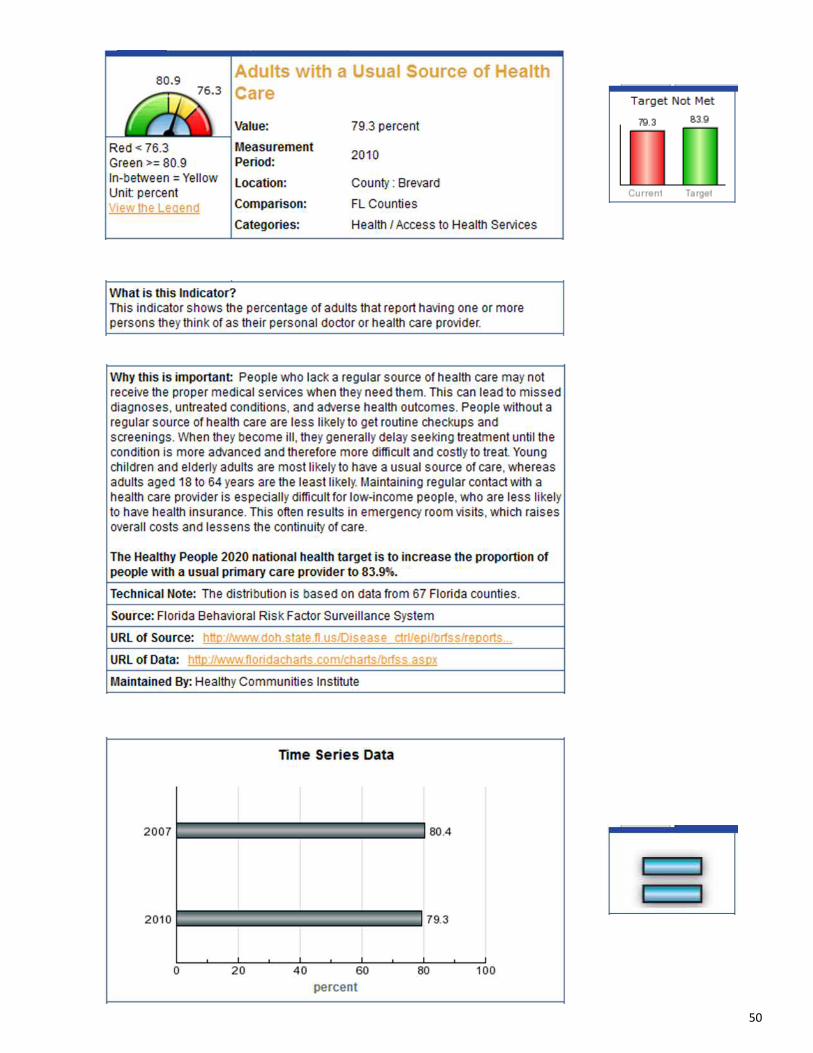
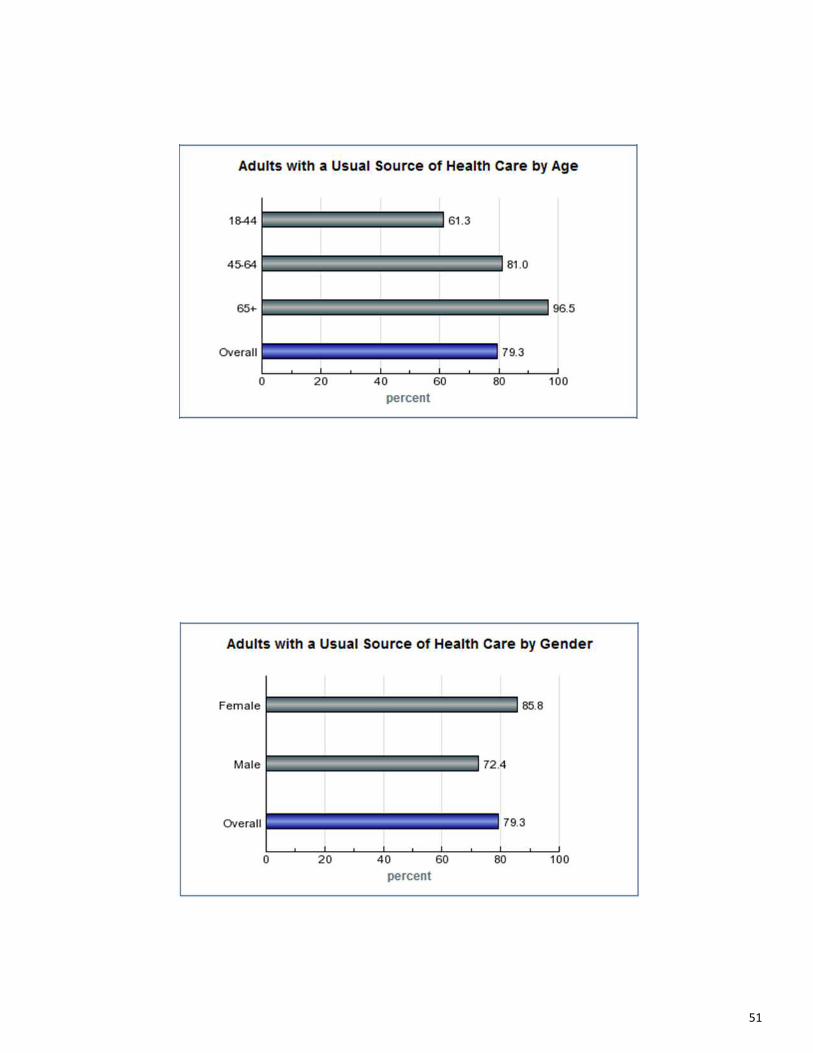
Health Factors Adults with health insurance 75.8% 100.0% Not Met -24.2% = Children with health insurance 89.2% 100.0% Not Met -10.8% = Adults with a usual source of health care 79.3% 83.9% Not Met -4.6% =
25
1f. Primary and Chronic Disease Needs and Other Health
Issues of Uninsured, Low-income, and Minority Populations
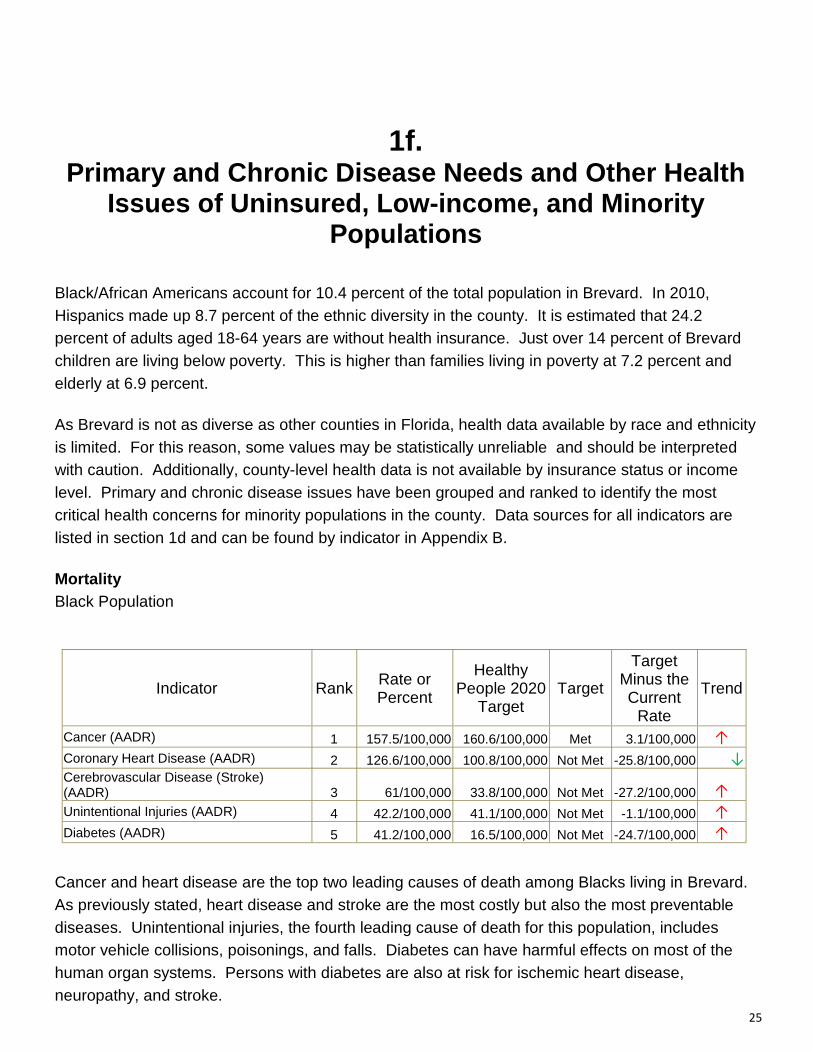
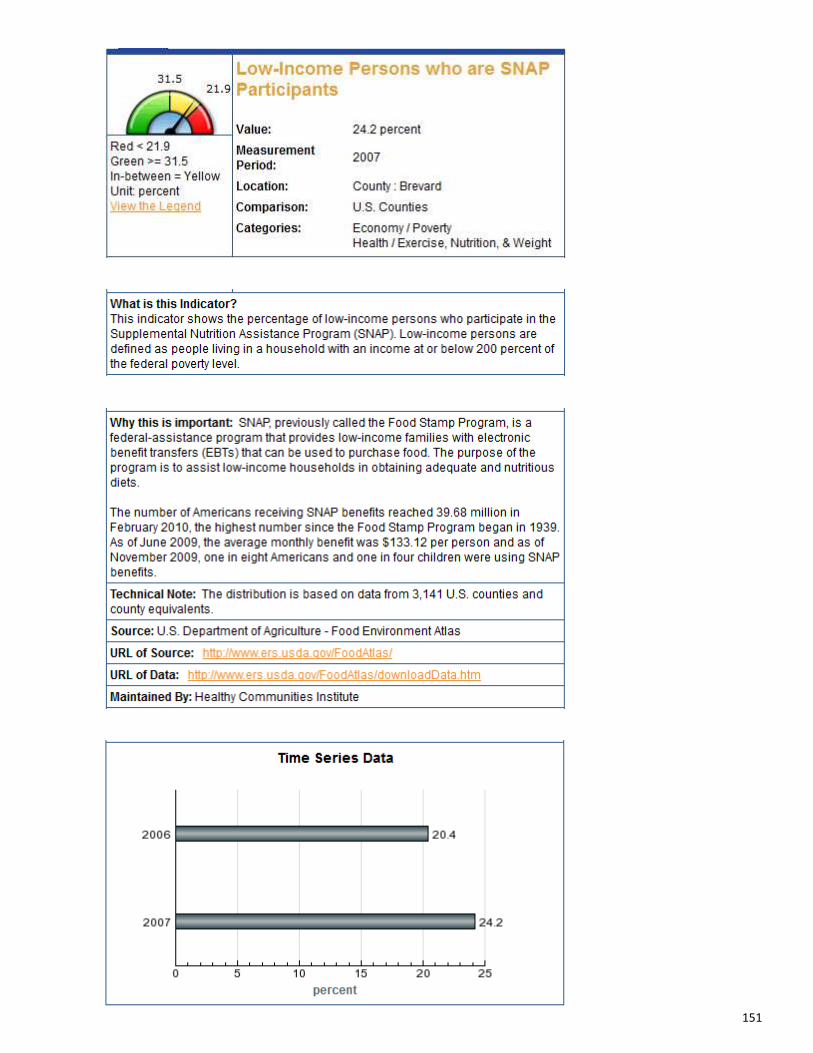
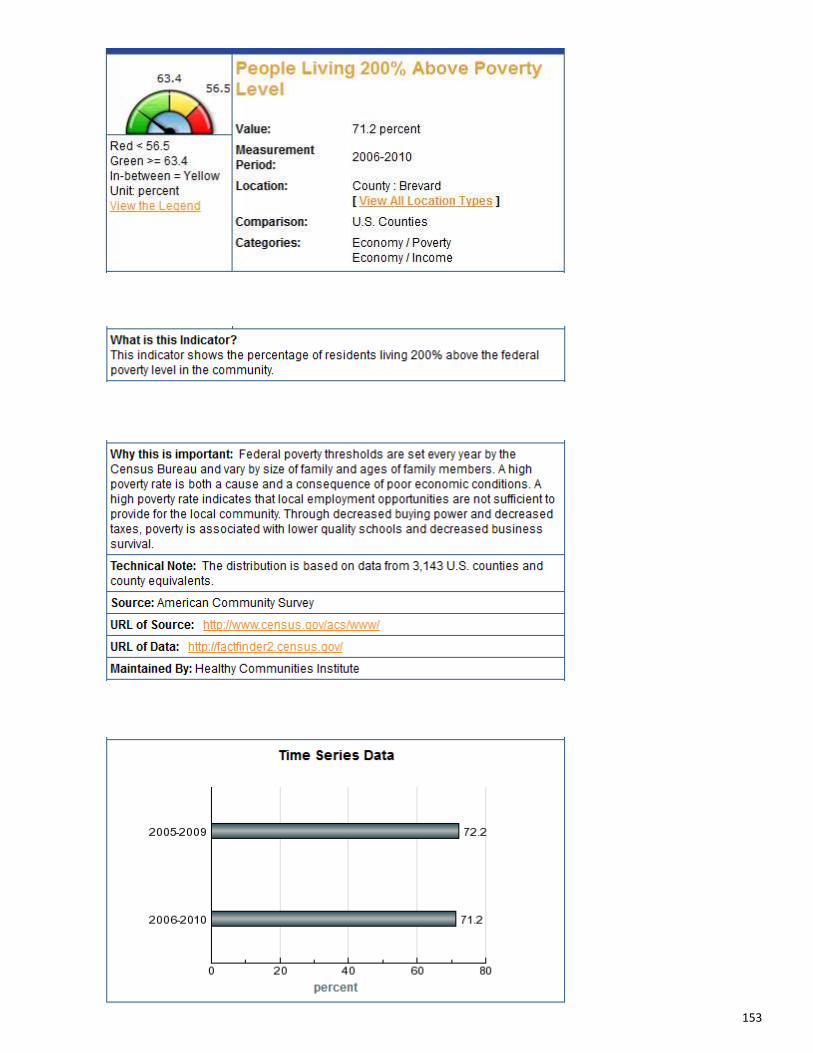
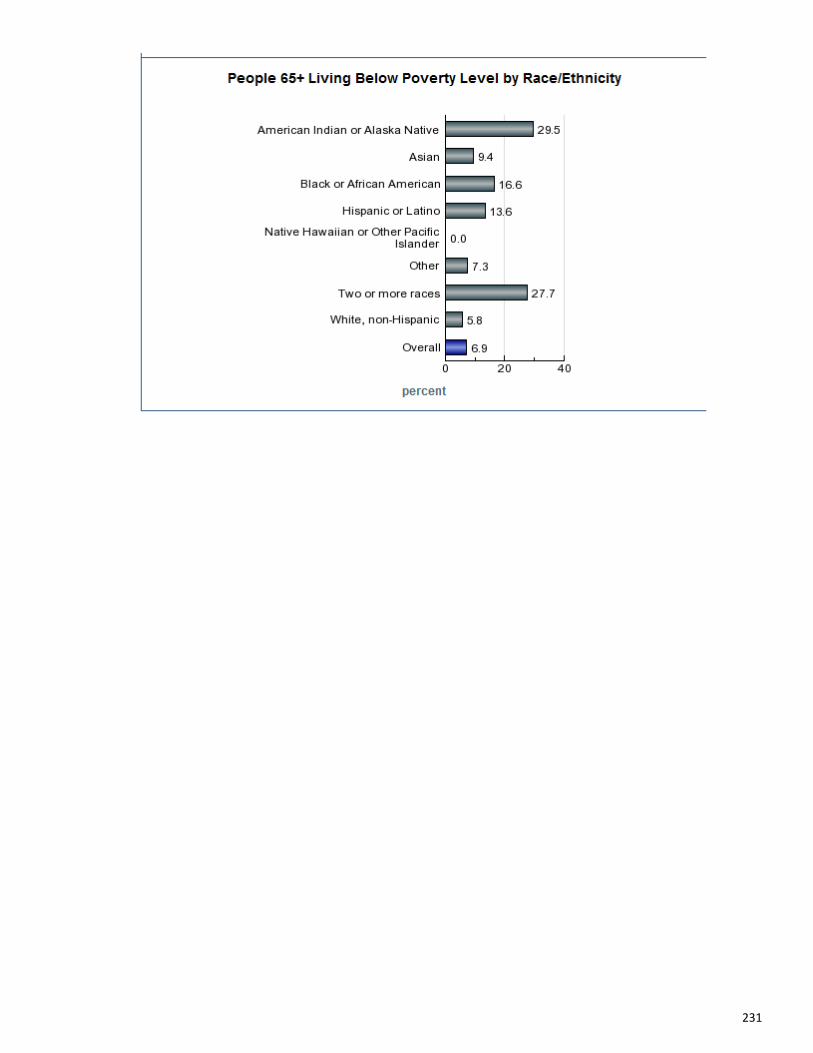
Black/African Americans account for 10.4 percent of the total population in Brevard. In 2010, Hispanics made up 8.7 percent of the ethnic diversity in the county. It is estimated that 24.2 percent of adults aged 18-64 years are without health insurance. Just over 14 percent of Brevard children are living below poverty. This is higher than families living in poverty at 7.2 percent and elderly at 6.9 percent.
As Brevard is not as diverse as other counties in Florida, health data available by race and ethnicity is limited. For this reason, some values may be statistically unreliable and should be interpreted with caution. Additionally, county-level health data is not available by insurance status or income level. Primary and chronic disease issues have been grouped and ranked to identify the most critical health concerns for minority populations in the county. Data sources for all indicators are listed in section 1d and can be found by indicator in Appendix B.
Mortality Black Population
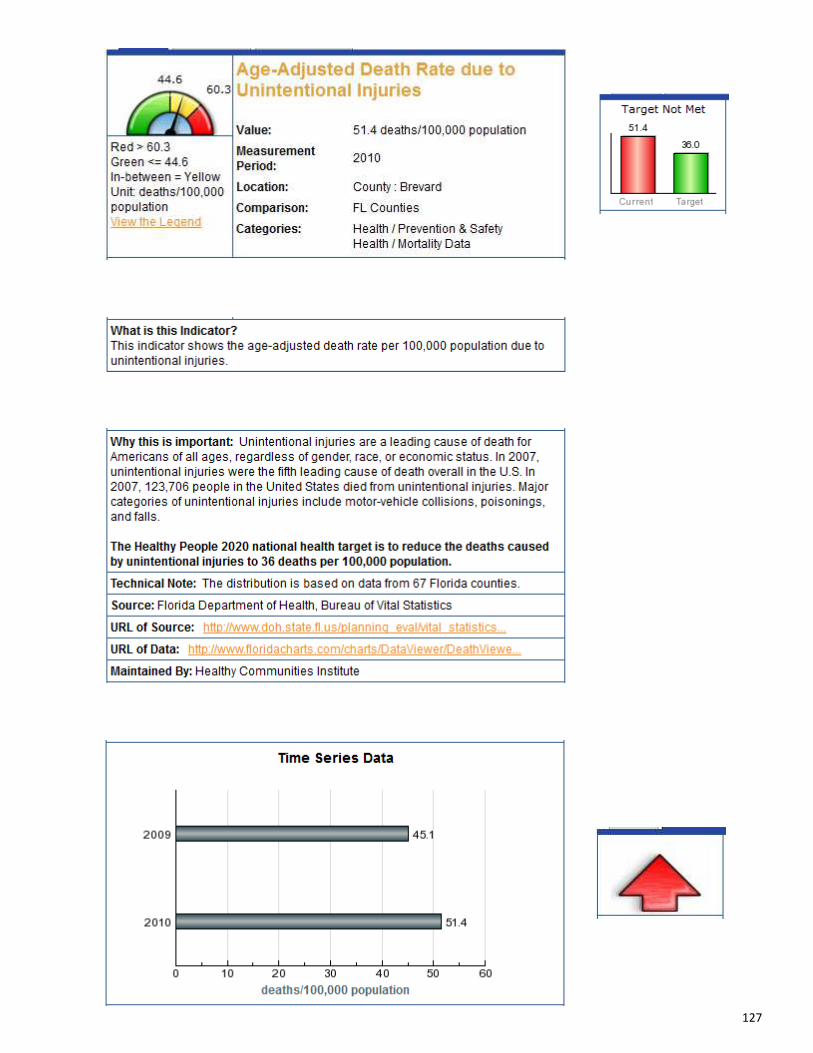
Cancer and heart disease are the top two leading causes of death among Blacks living in Brevard. As previously stated, heart disease and stroke are the most costly but also the most preventable diseases. Unintentional injuries, the fourth leading cause of death for this population, includes motor vehicle collisions, poisonings, and falls. Diabetes can have harmful effects on most of the human organ systems. Persons with diabetes are also at risk for ischemic heart disease, neuropathy, and stroke.
Indicator Rank Rate or Percent
Healthy People 2020
Target Target
Target Minus the Current
Rate
Trend
Cancer (AADR) 1 157.5/100,000 160.6/100,000 Met 3.1/100,000 ↑
Coronary Heart Disease (AADR) 2 126.6/100,000 100.8/100,000 Not Met -25.8/100,000 ↓
Cerebrovascular Disease (Stroke) (AADR) 3 61/100,000 33.8/100,000 Not Met -27.2/100,000 ↑
Unintentional Injuries (AADR) 4 42.2/100,000 41.1/100,000 Not Met -1.1/100,000 ↑
Diabetes (AADR) 5 41.2/100,000 16.5/100,000 Not Met -24.7/100,000 ↑
26
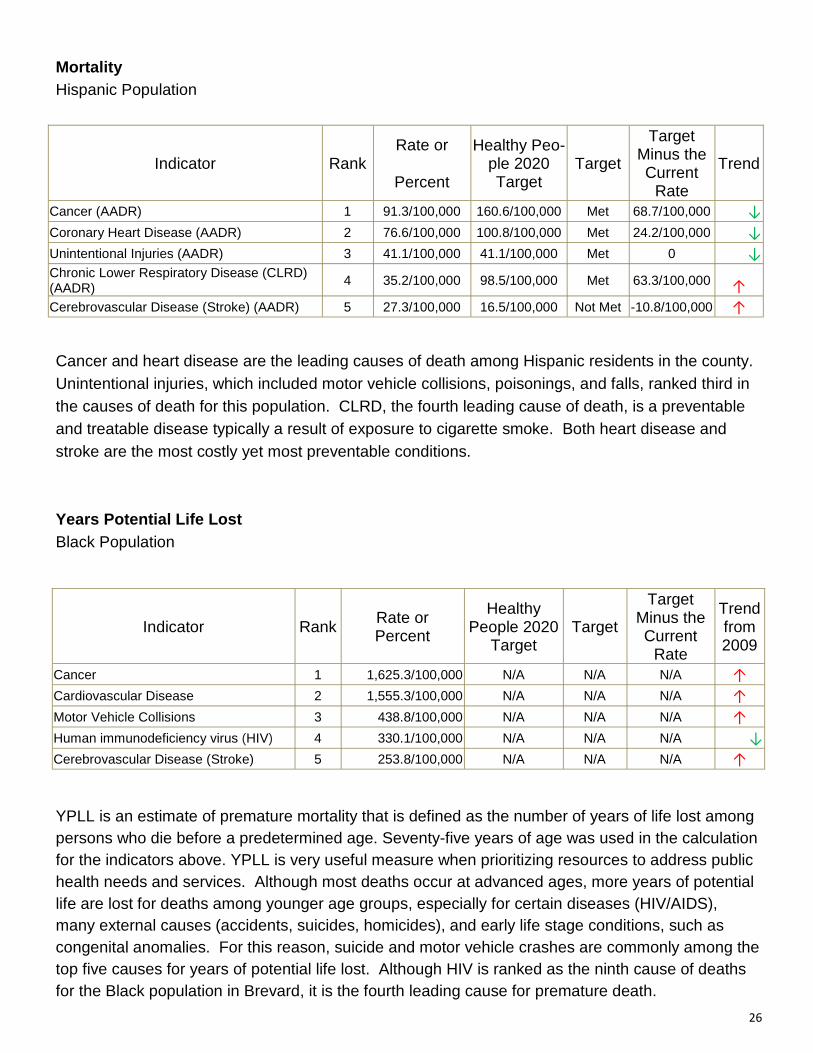
Mortality Hispanic Population
Cancer and heart disease are the leading causes of death among Hispanic residents in the county. Unintentional injuries, which included motor vehicle collisions, poisonings, and falls, ranked third in the causes of death for this population. CLRD, the fourth leading cause of death, is a preventable and treatable disease typically a result of exposure to cigarette smoke. Both heart disease and stroke are the most costly yet most preventable conditions. Years Potential Life Lost Black Population
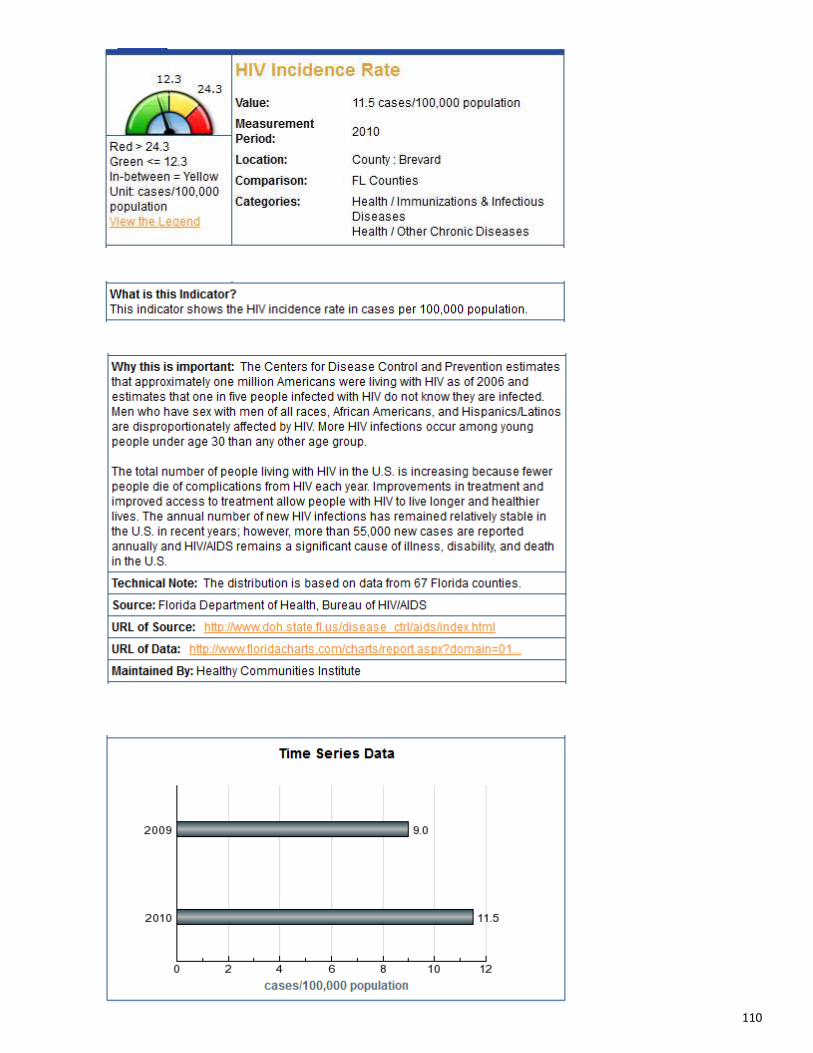
YPLL is an estimate of premature mortality that is defined as the number of years of life lost among persons who die before a predetermined age. Seventy-five years of age was used in the calculation for the indicators above. YPLL is very useful measure when prioritizing resources to address public health needs and services. Although most deaths occur at advanced ages, more years of potential life are lost for deaths among younger age groups, especially for certain diseases (HIV/AIDS), many external causes (accidents, suicides, homicides), and early life stage conditions, such as congenital anomalies. For this reason, suicide and motor vehicle crashes are commonly among the top five causes for years of potential life lost. Although HIV is ranked as the ninth cause of deaths for the Black population in Brevard, it is the fourth leading cause for premature death.
Indicator Rank Rate or
Percent
Healthy Peo-ple 2020 Target
Target
Target Minus the Current
Rate
Trend
Cancer (AADR) 1 91.3/100,000 160.6/100,000 Met 68.7/100,000 ↓
Coronary Heart Disease (AADR) 2 76.6/100,000 100.8/100,000 Met 24.2/100,000 ↓
Unintentional Injuries (AADR) 3 41.1/100,000 41.1/100,000 Met 0 ↓
Chronic Lower Respiratory Disease (CLRD)(AADR)
4 35.2/100,000 98.5/100,000 Met 63.3/100,000 ↑
Cerebrovascular Disease (Stroke) (AADR) 5 27.3/100,000 16.5/100,000 Not Met -10.8/100,000 ↑
Indicator Rank Rate or Percent
Healthy People 2020
Target Target
Target Minus the Current
Rate
Trend from 2009
Cancer 1 1,625.3/100,000 N/A N/A N/A ↑
Cardiovascular Disease 2 1,555.3/100,000 N/A N/A N/A ↑
Motor Vehicle Collisions 3 438.8/100,000 N/A N/A N/A ↑
Human immunodeficiency virus (HIV) 4 330.1/100,000 N/A N/A N/A ↓
Cerebrovascular Disease (Stroke) 5 253.8/100,000 N/A N/A N/A ↑
27
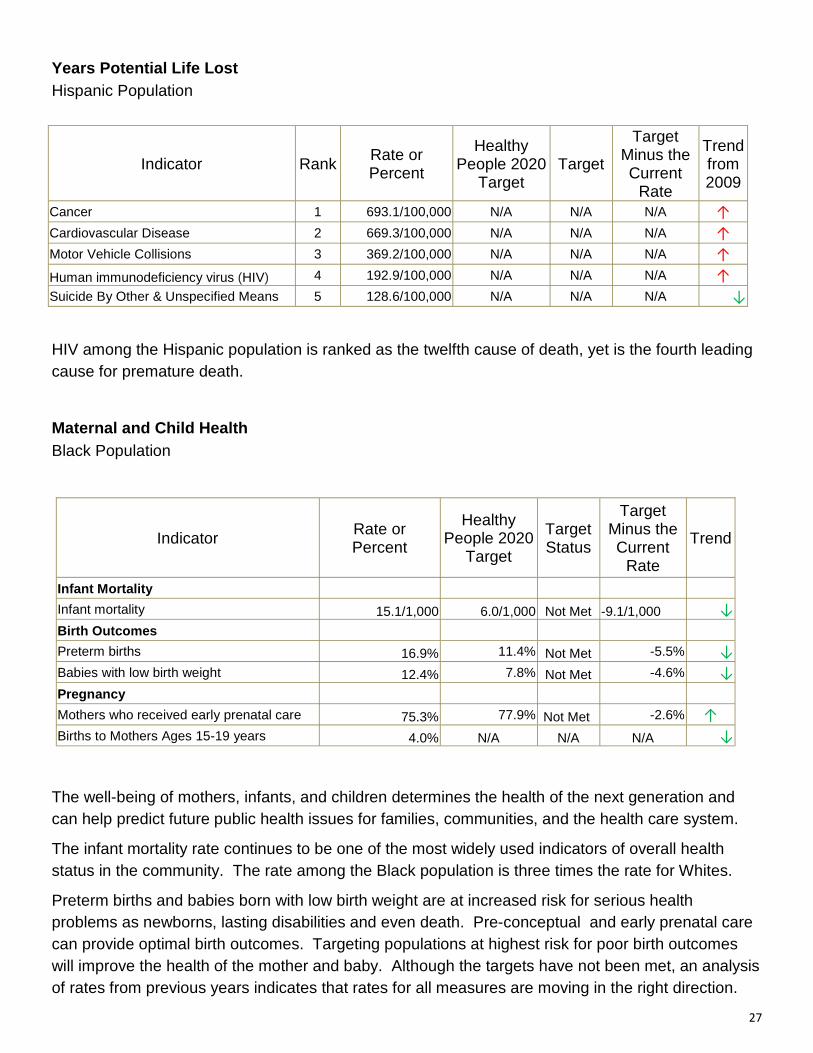
Years Potential Life Lost Hispanic Population
HIV among the Hispanic population is ranked as the twelfth cause of death, yet is the fourth leading cause for premature death.
Maternal and Child Health Black Population
The well-being of mothers, infants, and children determines the health of the next generation and can help predict future public health issues for families, communities, and the health care system.
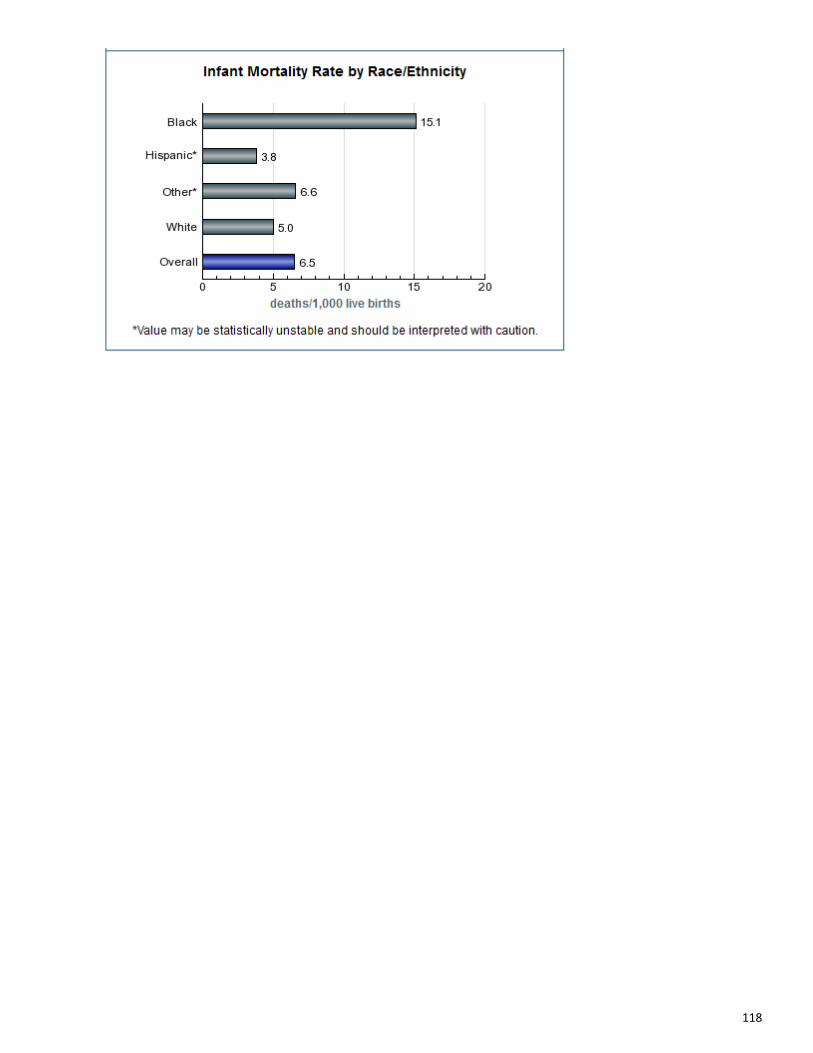
The infant mortality rate continues to be one of the most widely used indicators of overall health status in the community. The rate among the Black population is three times the rate for Whites.
Preterm births and babies born with low birth weight are at increased risk for serious health problems as newborns, lasting disabilities and even death. Pre-conceptual and early prenatal care can provide optimal birth outcomes. Targeting populations at highest risk for poor birth outcomes will improve the health of the mother and baby. Although the targets have not been met, an analysis of rates from previous years indicates that rates for all measures are moving in the right direction.
Indicator Rank Rate or Percent
Healthy People 2020
Target Target
Target Minus the Current
Rate
Trend from 2009
Cancer 1 693.1/100,000 N/A N/A N/A ↑
Cardiovascular Disease 2 669.3/100,000 N/A N/A N/A ↑
Motor Vehicle Collisions 3 369.2/100,000 N/A N/A N/A ↑
Human immunodeficiency virus (HIV) 4 192.9/100,000 N/A N/A N/A ↑
Suicide By Other & Unspecified Means 5 128.6/100,000 N/A N/A N/A ↓
Indicator Rate or Percent
Healthy People 2020
Target
Target Status
Target Minus the Current
Rate
Trend
Infant Mortality Infant mortality 15.1/1,000 6.0/1,000 Not Met -9.1/1,000 ↓
Birth Outcomes Preterm births 16.9% 11.4% Not Met -5.5% ↓
Babies with low birth weight 12.4% 7.8% Not Met -4.6% ↓
Pregnancy
Mothers who received early prenatal care 75.3% 77.9% Not Met -2.6% ↑
Births to Mothers Ages 15-19 years 4.0% N/A N/A N/A ↓

28
Maternal and Child Health Hispanic Population
Rates and percentages for maternal and child health indicators among the Hispanic population are very similar to those of the general population. The small values may be statistically unstable and should be interpreted with caution. Interventions focused on reducing babies born preterm or with low birth weight will improve overall outcomes. Health Risk Behaviors Black Population
The health indicators in the table above were gathered from the Behavioral Risk Factor Surveillance Study. Limited data is available for minority populations in Brevard due to the small sample size of survey respondents. Eating a healthy, balanced diet while participating in moderate physical activity can go a long way to preventing the incidence of chronic disease. People who have the least access to preventive services and dental treatment have greater rates of oral diseases.
Indicator Rate or Percent
Healthy People
2020 Target
Target Status
Target Minus the Current
Rate
Trend
Infant Mortality Infant mortality 3.8/1,000 6.0/1,000 Met 2.2/1,000 ↓
Birth Outcomes Preterm births 14.4% 11.4% Not Met -3.0% ↓
Babies with low birth weight 8.1% 7.8% Not Met 0.3% = Pregnancy
Mothers who received early prenatal care 83.8% 77.9% Met 5.9% ↑
Births to Mothers Ages 15-19 years 3.4% N/A N/A N/A ↓
Indicator Rate or Percent
Healthy People 2020
Target
Target Status
Target Minus the Current
Rate
Trend US Preventive Services
Task Force Grades/Recommendations
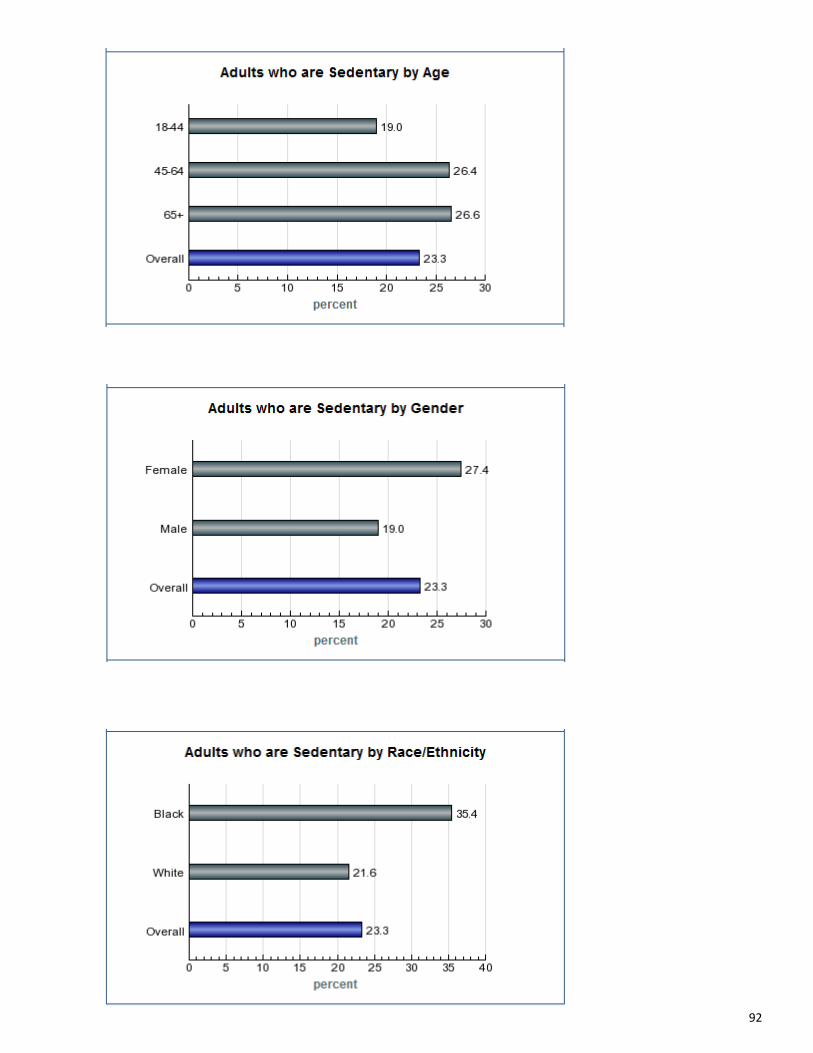
Adults who are sedentary 35.4% 32.6% Not Met -2.8% N/A C/General Population in Primary Care Setting with Cardiovascular risk factors
Adult fruit and vegetable consumption
36.5% N/A N/A N/A N/A C/General Population in Primary Care Setting with Cardiovascular risk factors
Adults who did not visit a dentist due to cost 38.7% N/A N/A N/A N/A
No new evidence regarding the role of the primary care clinician in counseling for dental services

29
1g. The Process of Identifying and Prioritizing Communi ty
Health Needs A comprehensive analysis of health indicators provides an increased understanding of the community’s health problems. Prioritizing health issues ensures that resources allocated to address community health needs are used effectively and efficiently in an effort to achieve optimal outcomes. To accomplish the task of prioritizing health needs, the Assessment Protocol for Excellence in Public Health (APEXPH) modified Hanlon Method was used to categorize and rank health indicators to identify key needs in the community. This method considered three criteria: the magnitude of the problem, as measured in terms of the percent of the population with the health problem; the severity
of the problem in terms of mortality, morbidity, hospitalizations, economic loss or community impact;
and the predicted effectiveness of the intervention in preventing the health problem.
In addition to the above mentioned criteria, health indicator rates were compared to national benchmark targets (where available) to define the gap between the current and potential health of the community. Indicator rates were also trended to highlight improvement or decline from the previous time measurement. The five-step process used for prioritizing health indicators is described as follows:
Step 1: Rates/percentages for over 50 health indicators were collected from the Healthy Measures HCN to develop a comprehensive community health profile for each county served by the hospital facility.
Step 2: The health indicators were grouped into the following categories: mortality, years potential life lost, morbidity, maternal and child health, screening/immunizations, health behaviors, health conditions, and health factors. Health indicators for each group were ranked according to the size of the health problem, in terms of the rate/percent of the population with the health problem. The top five ranked health problems were identified for each category.
Step 3: The top ranked health indicator rates were compared to the Healthy People 2020 target goal (when available) to determine the status of goal attainment (met or not met). The difference between the current rate and the target rate was calculated to identify indicators furthest from meeting the nationally established goal.
Step 4: Trending of health indicators was included to identify emerging needs as well as highlight areas where the community is becoming healthier. A red arrow (↑) was used to indicate a trend going in the wrong direction, while a green arrow (↓) was used to indicate trends going the right direction. The direction of trending arrows should be interpreted in the context of the health indicator. For example, mammography history, if there was a decrease in the

30
percentage of women having a mammogram, a red arrow pointing down (↓) was used. Conversely, if the same indicator showed the percentage increasing, a green
arrow pointing up (↑) was used.
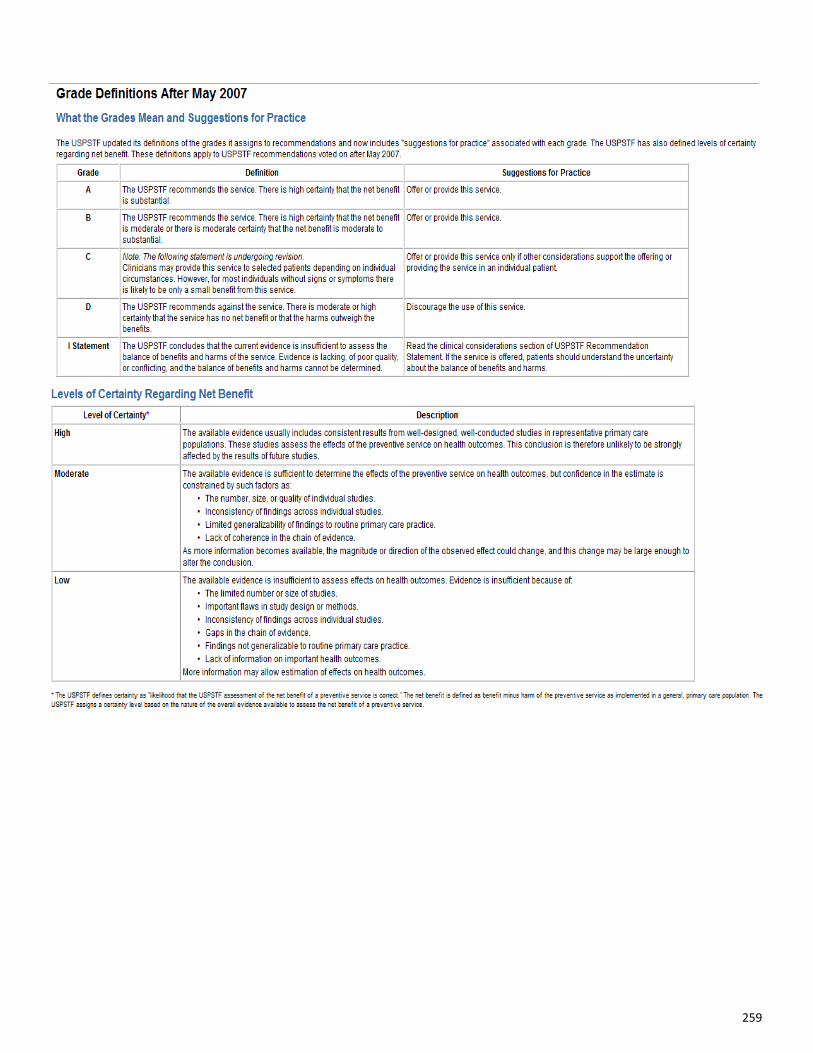
Step 5: Grades and recommendations from the U.S. Preventive Services Task Force (USPSTF) to assess the merits of preventive measures, including screening tests, counseling, immunizations, and preventive medications were included where appropriate. Grades and recommendations are defined in Appendix C.

31
1h. The Process for Consulting with Persons Representin g
the Community’s Interests Conducting interviews is a powerful method for collecting community data. Interviews facilitated by an unbiased entity can uncover information that people may be reluctant to share in a more public setting. These data reveal the thoughts and perceptions of key stakeholders and provide a clear understanding of the pressing issues facing the community.
The Montana State Library Community Stakeholder template was used as a guide to identify key informants by county. The Health Council worked with hospital staff to ensure the stakeholder list was inclusive and representative of the community. A minimum of twenty interviews were conducted in the county in which the hospital is located. Phone interviews were the primary method for obtaining the opinions of key stakeholders with a limited number of interviews conducted in a small group setting. The basic elements of community health, as defined by the Prevention Institute, were used to develop the foundation for the interview questionnaire.
Equitable Opportunities : racial justice, jobs, and education Place : parks and open space, transportation, housing, air, water, and safety People : social networks, and willingness to act for the common good Health Care Services : preventive, treatment, access, cultural competency, and emergency response
The members of the North Brevard Community Health Board were interviewed to share their views on community health as it pertains to various groups within the population, describe existing services in place to address health needs, and identify gaps and opportunities where services could be offered to improve the current system of care. The overall findings mirrored the health needs identified by the data. The report that follows is a summary of the comments received on the prevalent issues and trends as they relate to community health. The key stakeholder questionnaire can be found in Appendix E.
32
1. Considering the overall look at what it takes to have a healthy community, what do you view as the major issues facing us?
• Transportation and access to the Space Coast Area Transit (SCAT) • Individuals without health insurance due to job loss • Foreclosures and short sales - affordable homes are available, but not at the local
wage level
2. Looking only at health care services (preventive , treatment, access, cultural competency, emergency response), what do you view a s the major issues facing us?
• Aging population • Residents with multiple chronic conditions/obesity • Growing economically disadvantaged population • Delayed treatment • Lack of preventive services—medical, dental, mental and behavioral health • High level of drug and alcohol abuse • Lack medical management of mental issues • People lack awareness of where to access services • Health literacy is low • Availability and affordability of drugs
3. Who in our community does a good job of promoti ng health?
• Parrish Medical Center • Brevard County Health Department immunizations and WIC • YMCA • Parks and recreation department • Community senior centers with meals and speakers • Church senior programs (Prime Timers) • Greater Titusville Renaissance
4. Who in our community does not promote good heal th?
• Presence of a lot of fast food restaurants • Small retail groceries do not offer fresh produce • Few employers offering wellness programs • No early dental services in the schools • Not enough proactive school nutrition improvement efforts
33
5. Are there gaps where you would like to see serv ices offered in your communities?
• Pediatric and adult oncology • Limited mental health support • Many residents lack personal responsibility for health • Community ranks as a primary care medically underserved area • Education doesn't promote physical fitness • Lack of sidewalks and crossing guards
6. If you were in charge of improving health in ou r community, what would you do first?
• Encourage the opening of good healthy restaurants • Offer after-school team sports with student transportation to home • Better Internet access • Downtown markets with fresh food and restaurants in towns that take this fresh
produce and add it to their menu • Central care coordination (PCMH)
Organization Affiliation of Key Stakeholders
211 Brevard Publix
Aging Matters in Brevard (Formerly the Community Services Council)
ROCK - Reduce Obesity in Central Florida Kids
American Heart Association Second Harvest Food Bank
Boeing Corporation Space Coast Economic Development Council
Brevard Health Alliance Space Coast Health Foundation
Brevard Workforce The City of Titusville
Brevard Parks and Recreation The Happenings - Port St. John Newspaper
Brevard Department of Health The Salvation Army
Florida Institute of Technology Titusville Economic Development Council
Indian River City United Methodist Church
Titusville Chamber of Commerce
North Brevard Coalition - Representing 104 agencies
Titusville community representatives - Interested individuals
North Brevard Charities United Way - Funding and representing 43 agencies
North Brevard Medical Support Upper Mohawk Inc. - (A private company)
Port St. John Advisory Committee - 10 representatives of the Port St. John Community
VITAS Hospice

34
1h. Information Gaps that Limited the Facility’s Abilit y to
Assess all of the Community’s Health Needs
Limitations and inconsistencies in available data can make it challenging to provide a comprehensive community assessment. In local counties there are sometimes gaps in data that do not provide answers to every question. The health indicators traditionally used to assess community health status presented some limitations when assessing the health of the low income and uninsured population. Currently, county-level health data is not available by income level or insurance status. Additionally, available health data for children and adolescents was also limited. The Community Health Needs Assessment prepared for Parrish Medical Center provides a comprehensive analysis of the health needs in Brevard County, Florida. The assessment includes county-level indicators for mortality, morbidity, years potential life lost, access to care issues, behavioral risk factors, health screenings, immunizations, maternal and child health, and health conditions. The social determinants of health presented in Section 1a describe the community in terms of economics, education, environment, public safety, and transportation. Key stakeholders were interviewed to share their perceptions and insights regarding the pressing health issues facing Brevard residents. Data were provided by race/ethnicity and age when available. Zip code level data was provided for preterm and low birth weight infants. The completed CHNA contains all the information necessary for Parrish Medical Center to begin development of their implementation strategy to address community health needs as defined in this document.

35
1j. Other
Described in Part VI of Schedule H Form 990.
36
The Community Health Needs Assessment was prepared by the Health Council of East Central Florida, Inc. We are a private, non-profit healthcare planning agency providing research, evaluation and program support to improve healthcare delivery and outcomes. The East Central Florida District VII encompasses the four counties of Brevard, Orange, Osceola and Seminole.
2461 West SR 426, Suite 2041 Oviedo, Florida 32708
www.hcecf.org
Contact:
Therry Feroldi, MSHSA 407-977-1610

37
Appendix A
Detailed list of services for hospitals and other facilities
38
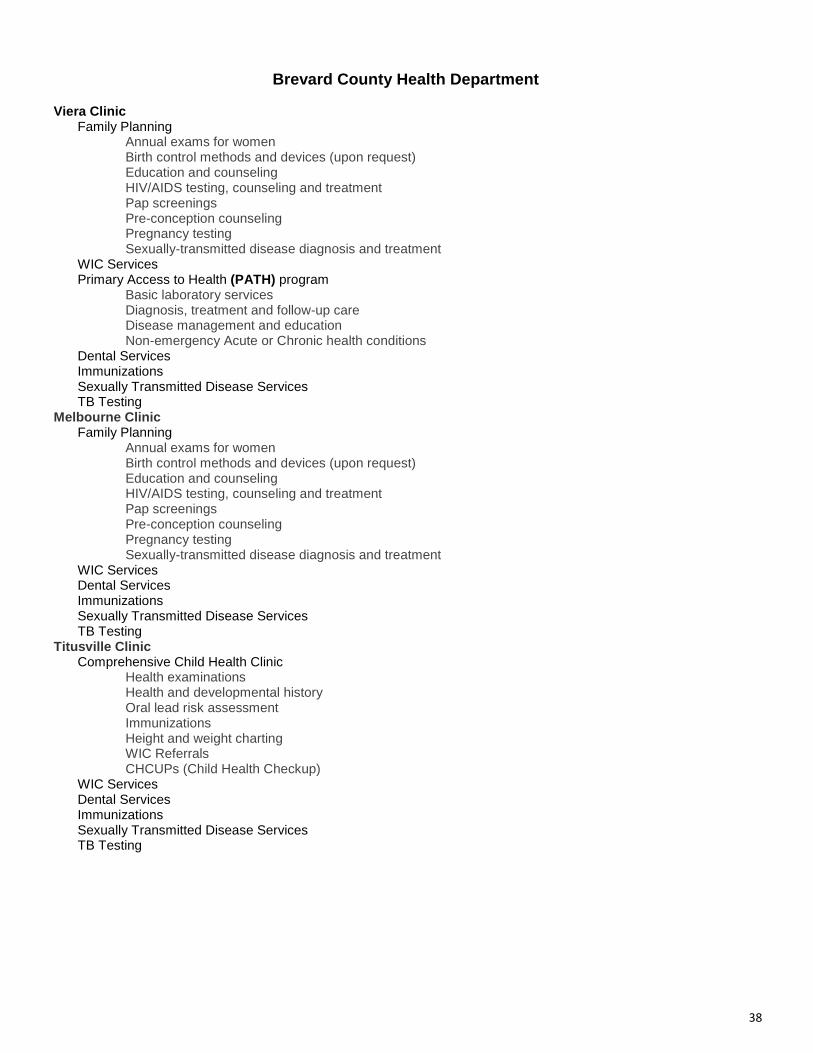
Brevard County Health Department
Viera Clinic
Family Planning Annual exams for women Birth control methods and devices (upon request) Education and counseling HIV/AIDS testing, counseling and treatment Pap screenings Pre-conception counseling Pregnancy testing Sexually-transmitted disease diagnosis and treatment
WIC Services Primary Access to Health (PATH) program
Basic laboratory services Diagnosis, treatment and follow-up care Disease management and education Non-emergency Acute or Chronic health conditions
Dental Services Immunizations Sexually Transmitted Disease Services TB Testing
Melbourne Clinic
Family Planning Annual exams for women Birth control methods and devices (upon request) Education and counseling HIV/AIDS testing, counseling and treatment Pap screenings Pre-conception counseling Pregnancy testing Sexually-transmitted disease diagnosis and treatment
WIC Services Dental Services Immunizations Sexually Transmitted Disease Services TB Testing
Titusville Clinic
Comprehensive Child Health Clinic Health examinations Health and developmental history Oral lead risk assessment Immunizations Height and weight charting WIC Referrals CHCUPs (Child Health Checkup)
WIC Services Dental Services Immunizations Sexually Transmitted Disease Services TB Testing
39
Brevard Health Alliance
The Brevard Health Alliance, Inc. is Brevard County’s only Federally Qualified Health Center. This organization pro-vides extensive primary health care services to Brevard County residents regardless of their ability to pay for those services. By offering services on a sliding fee scale, BHA has provided primary care service, limited dental services, diagnostic services, case management services, medication assistance, and specialty referrals to Brevard County’s economically disadvantaged resident since March 2005. Melbourne Clinic
Family Practice Palm Bay Clinic
Family Practice Barton Commons Clinic
Family Practice Pediatrics Dental
Malabar Pediatric Clinic
Pediatrics Mobile Unit
Family Services Palm Bay Pediatric Clinic
Pediatric Services Titusville Clinic
Family Practice

40
41

42
Circles of Care
North Area Outpatient
Outpatient Counseling for adults and children Outpatient Psychiatric Evaluations for adults and children Outpatient Medication Management for adults and children
Central Area Outpatient Outpatient Counseling for adults and children
Individual Group Family Short- and long-term problems
Outpatient Psychiatric Evaluations for adults, children and adolescents Outpatient Medication Management for adults, children and adolescents Therapeutic Services
South Area Outpatient Outpatient Counseling
Individual Group Family counseling
Pharmacy Psychiatric and psychological evaluation for adults and children Medication Management for adults and children
Community Support Programs Intensive daily specialized support program Residential Services
Cedar Village Intensive support programs for severe and persistent mental illness
Intake Services - Melbourne Crisis counseling, information, and referral services 24/7 Screening and hospital admissions evaluation
D'Albora Children's Crisis Stabilization Unit (CCSU ) Psychiatric emergencies for children and adolescents Detoxification and stabilization services for substance abuse crisis affecting children and adolescents
Harbor Pines Inpatient Crisis stabilization for indigent clients Cornerstone of the emergency mental health system
Sheridan Oaks Inpatient psychiatric facility
Twin Rivers Treatment Center Comprehensive detoxification for adults Intensive treatment for chemical dependency for adults Medical Services Individual, group and family therapy Education
Outreach Services Outreach services to meet behavioral needs of children and their families In-home and on-site counseling Case Management Individual, group and family counseling Comprehensive wrap-around behavioral services

43
44
45
46
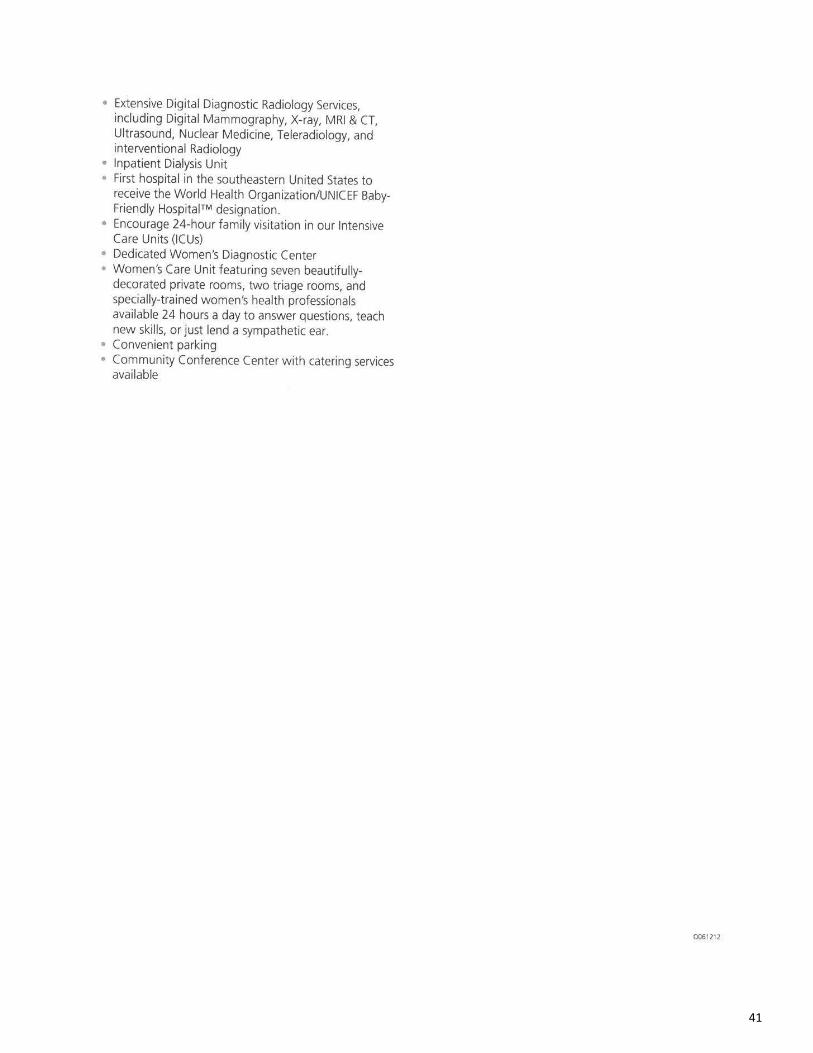
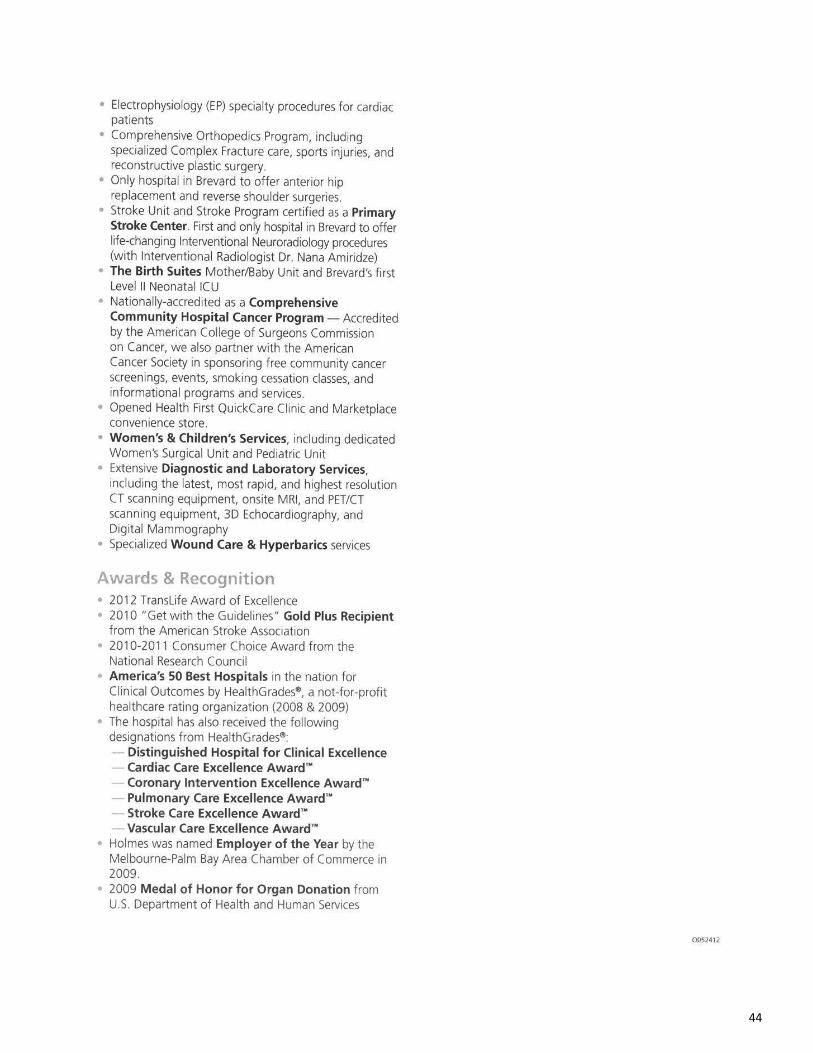
Parrish Medical Center
Cardiovascular Care Orthopedic Care
Bone and muscle care Fracture care Spine care Joint replacement Joint reconstruction Kyphoplasty Minimally invasive surgery Osteopathic manipulative therapy Outpatient rehabilitation Presurgery "what to expect" orientation Post-surgery healing-at-home care Sports and active lifestyle care Work-related injuries Full-service medical wellness (fitness) center.
Women's Care Breast Health Care—featuring an advanced certified Breast Health Navigator Cardiovascular Care Cancer Care Childhood Development Services Continence Restoration Gastrointestinal Care Gynecologic Care Midlife Care (Hormone Therapy) Mind/Body/Spirit Care Migraine Treatment Obstetric Care
Specialized team of labor and delivery physicians 24/7 Certified lactation consultants Certified car seat technicians
Sleep Disorders Cancer Care
Patient Navigator Diabetes Education Wound Healing Center
Hyperbaric medicine Home Health Care
Education on their disease process medication management nutrition and pain control IV therapy and wound/ostomy care management.

47

48

49
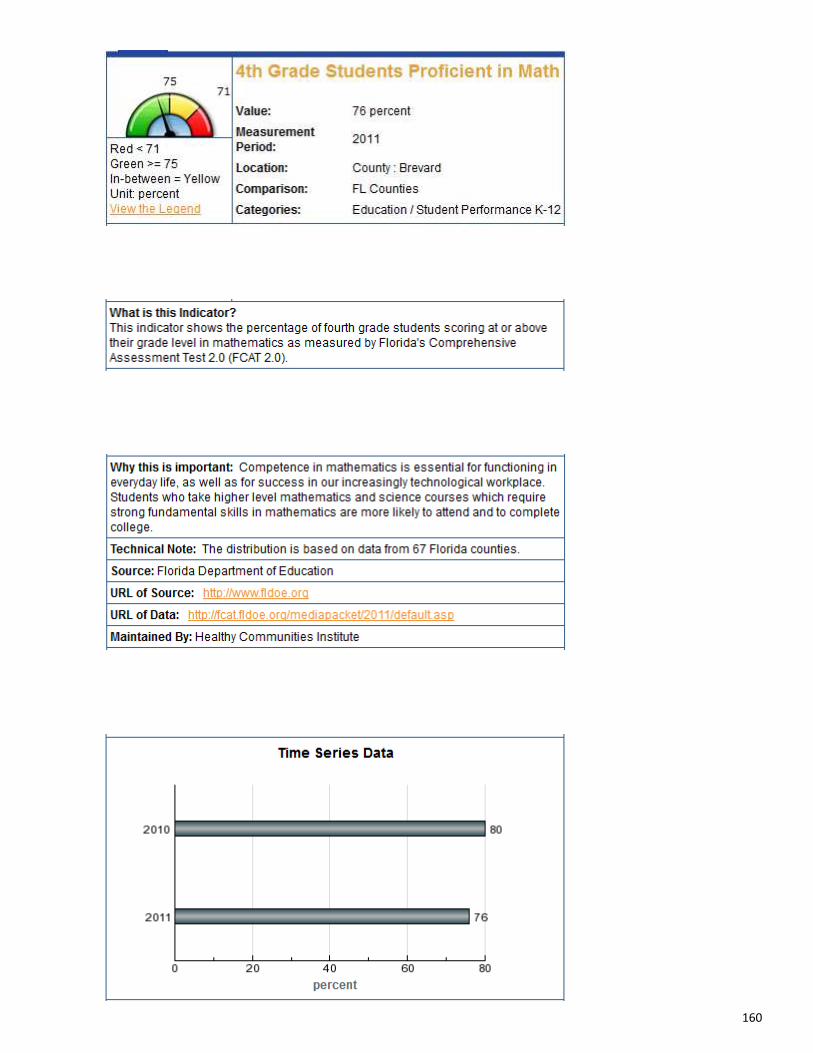
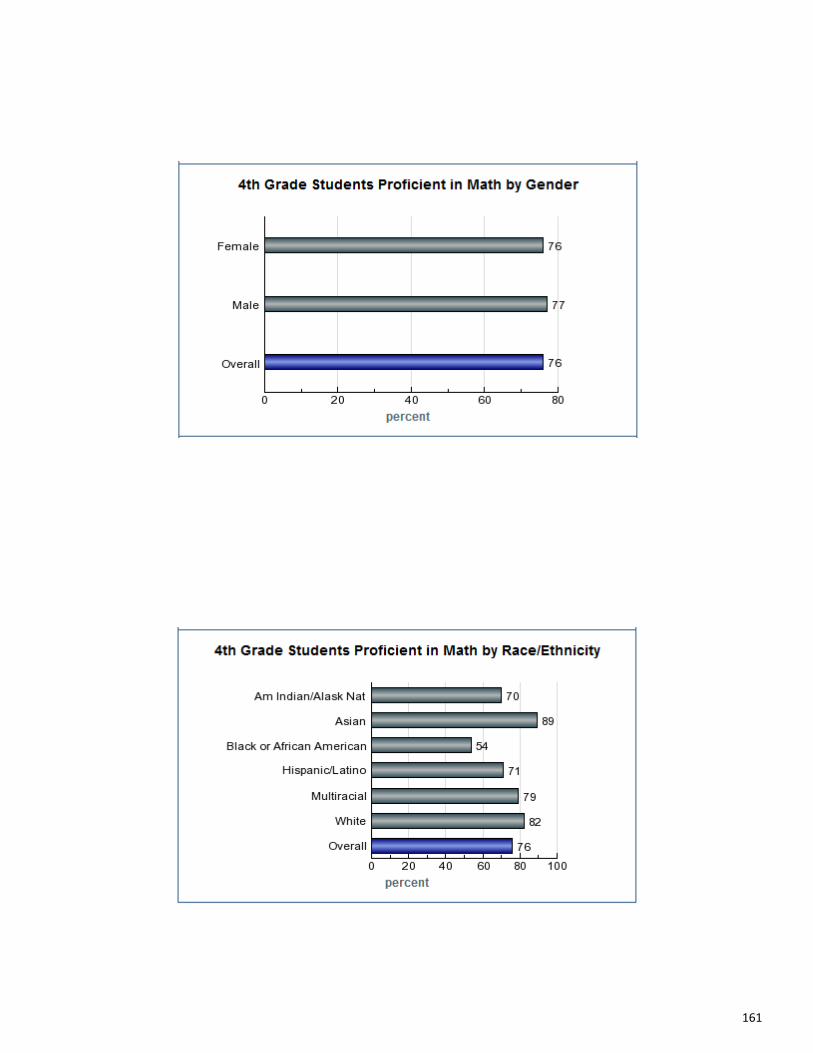
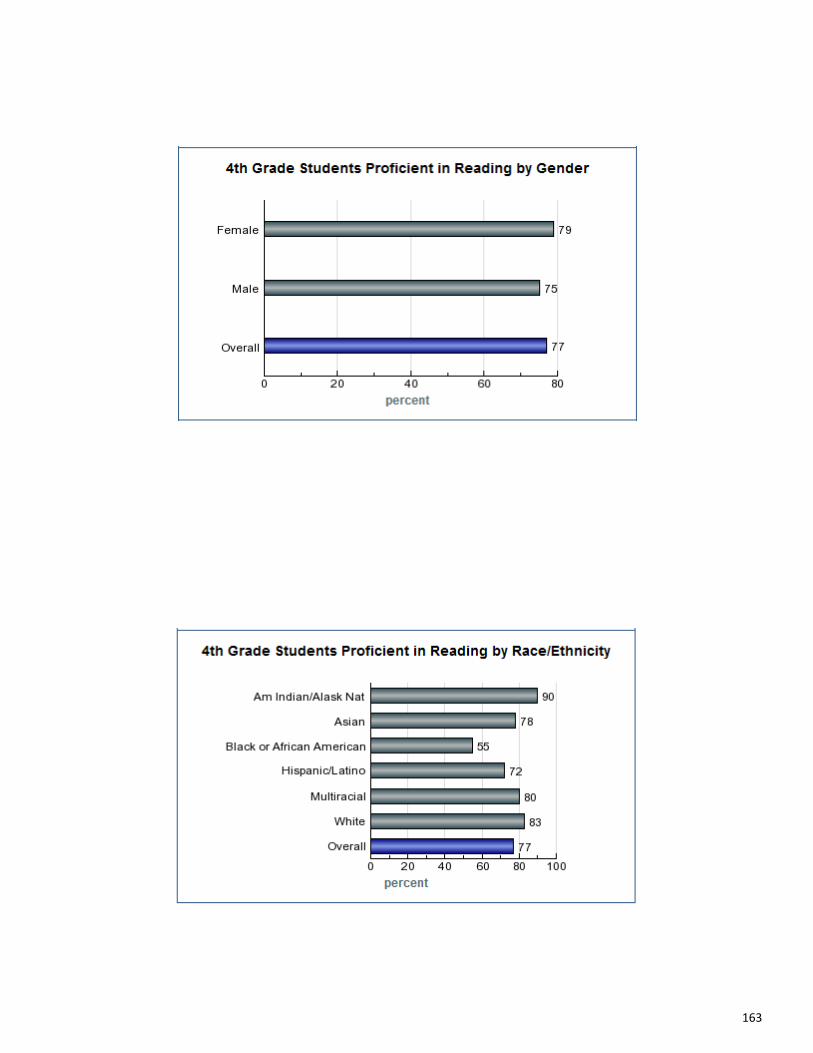
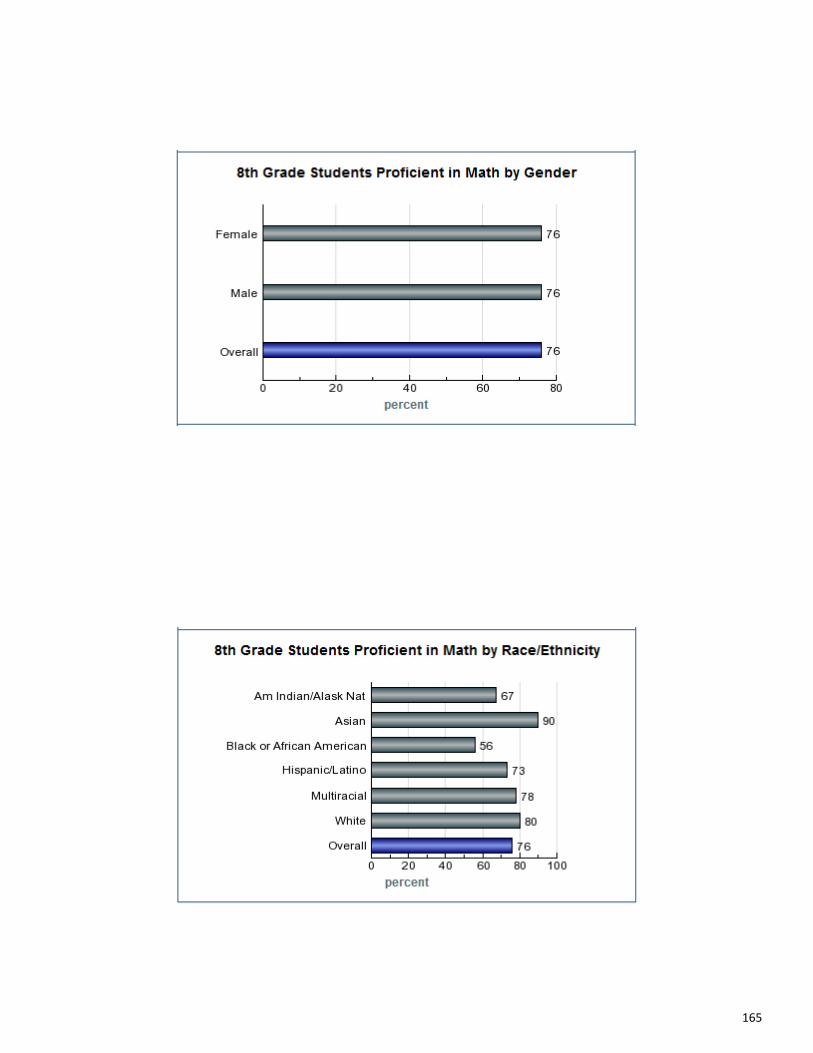
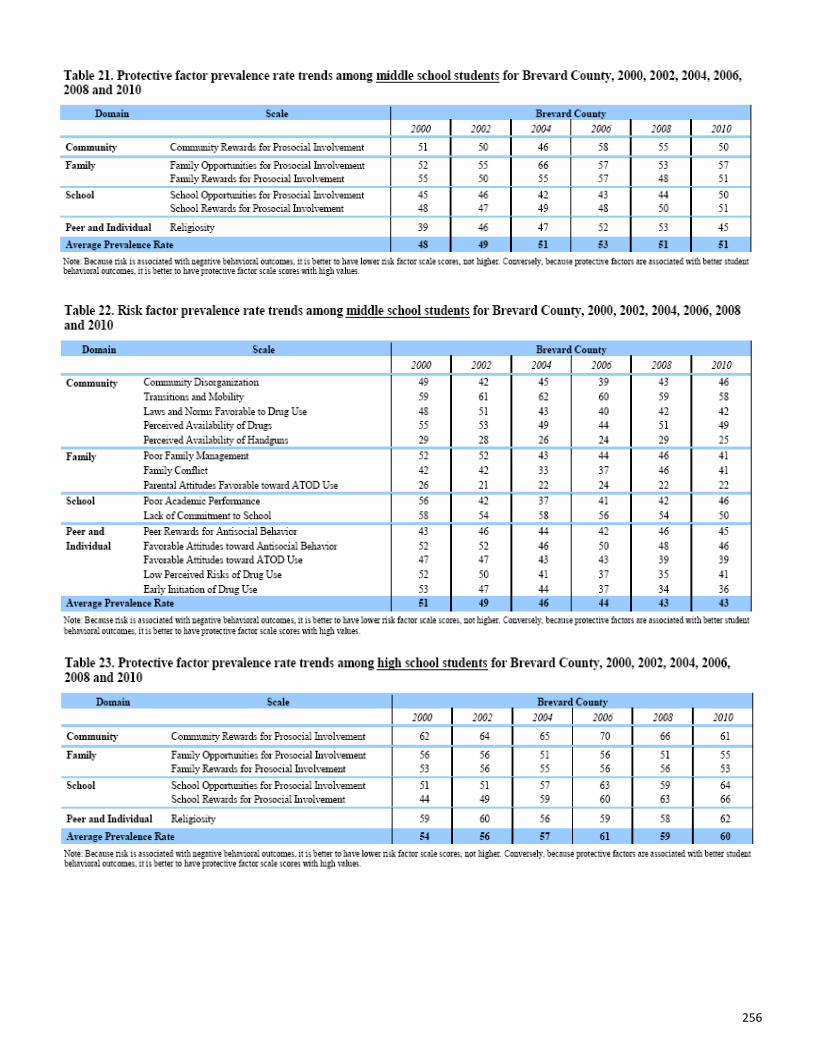
Appendix B
HCN Health Indicators
http://www.cflhealthymeasures.org.
50
51
52
53
54
55

56

57
58
59
60

61
62

63
64
65
66
67
68
69

70
71
72
73
74

75

76
77
78

79
80
81
82
83
84
85

86
87
88
89

90
91
92
93
94

95
96
97
98

99
100
101
102

103
104
105

106
107
108

109
110

111
112
113
114
115
116
117
118
119
120

121

122
123
124

125

126
127
128
129
130

131

132
133

134
135
136
137
138
139
140
141
142
143
144
145
146

147
148
149
150
151
152
153
154
155
156
157
158
159
160
161

162
163

164
165
166

167
168
169

170
171

172

173
174
175

176
177
178
179
180
181
182

183
184

185
186
187
188

189

190

191
Disparity Indicators

192
193
194
195
196
197

198
199
200

201

202
203
204
205

206

207

208
209
210

211
212
213

214
215
216
217
218

219
220
221
222

223
224
225
226
227
228
229
230
231
232
233

234

235
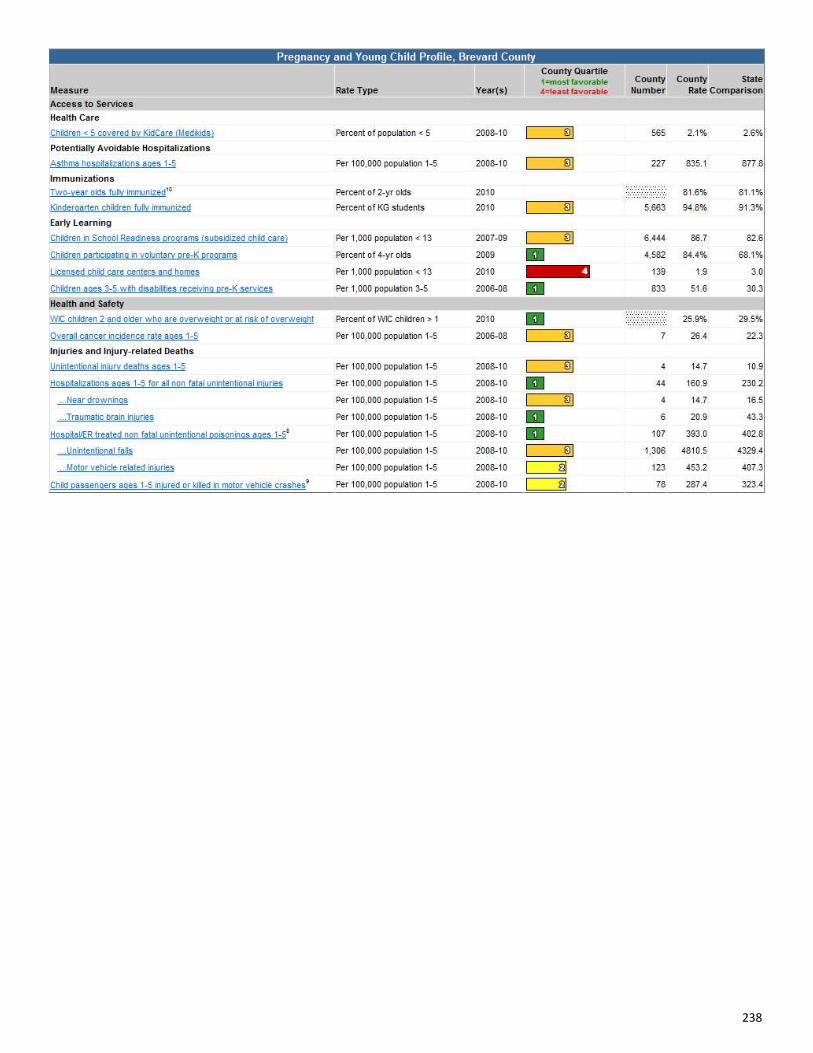
Pregnancy and Child Profile
http://www.floridacharts.com/charts/MICProfile.aspx?county=5&profileyear=2010

236

237
238

239
240
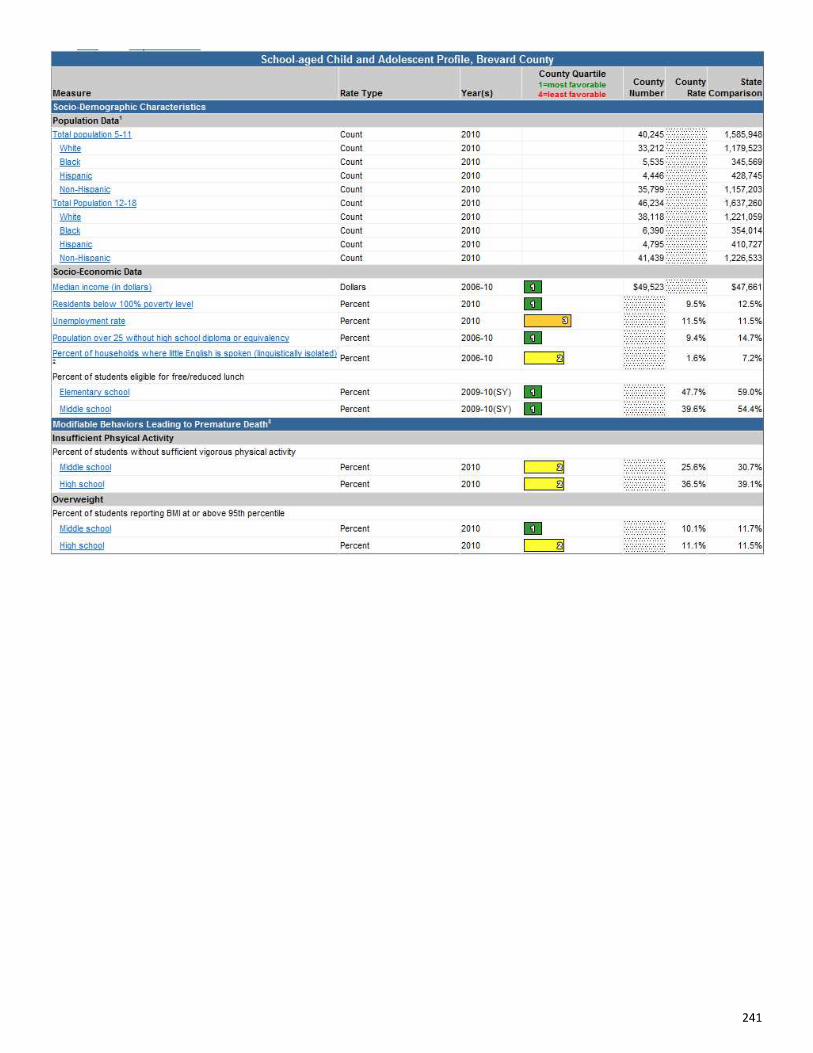
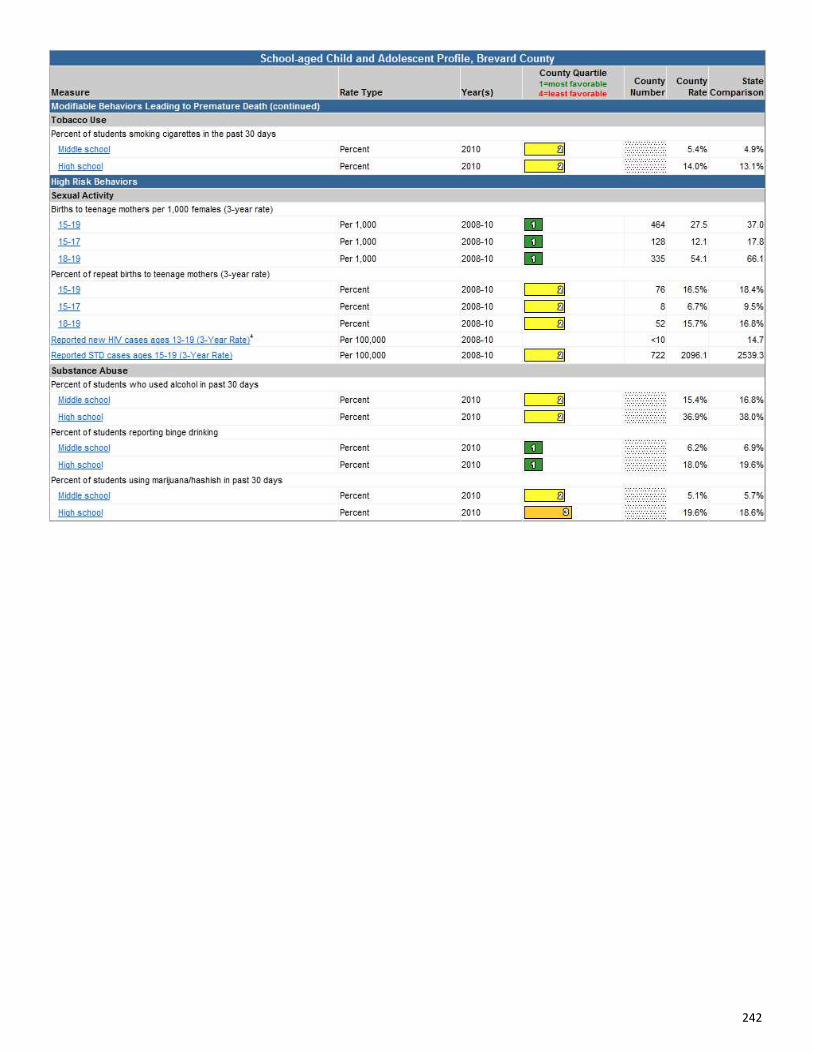
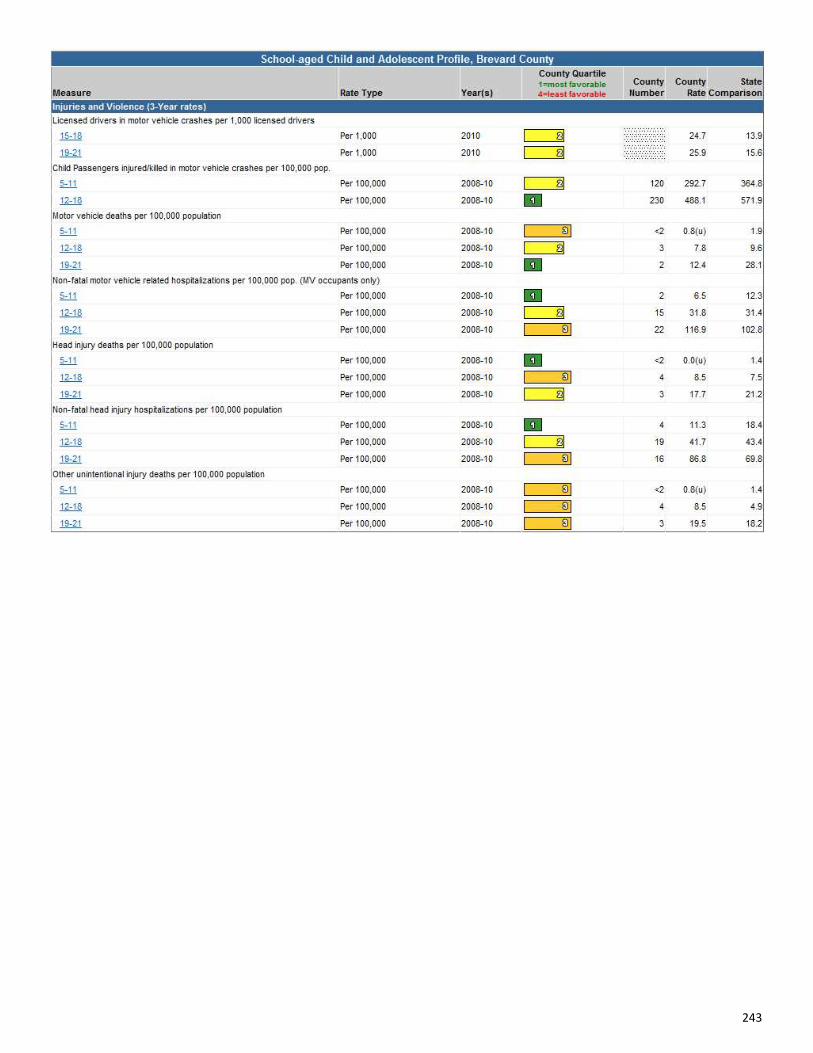
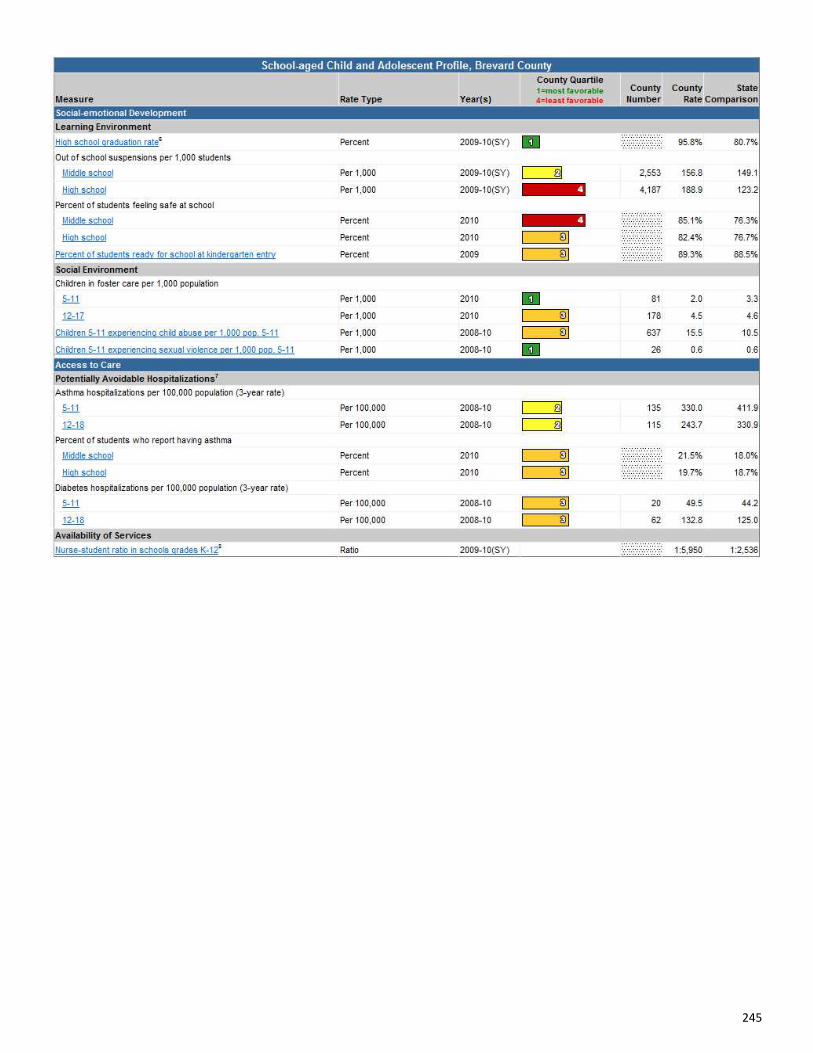
School-aged Child and Adolescent Health Profile
http://www.floridacharts.com/charts/AdolProfile.aspx?county=5&profileyear=2010
241
242
243

244
245

246

247
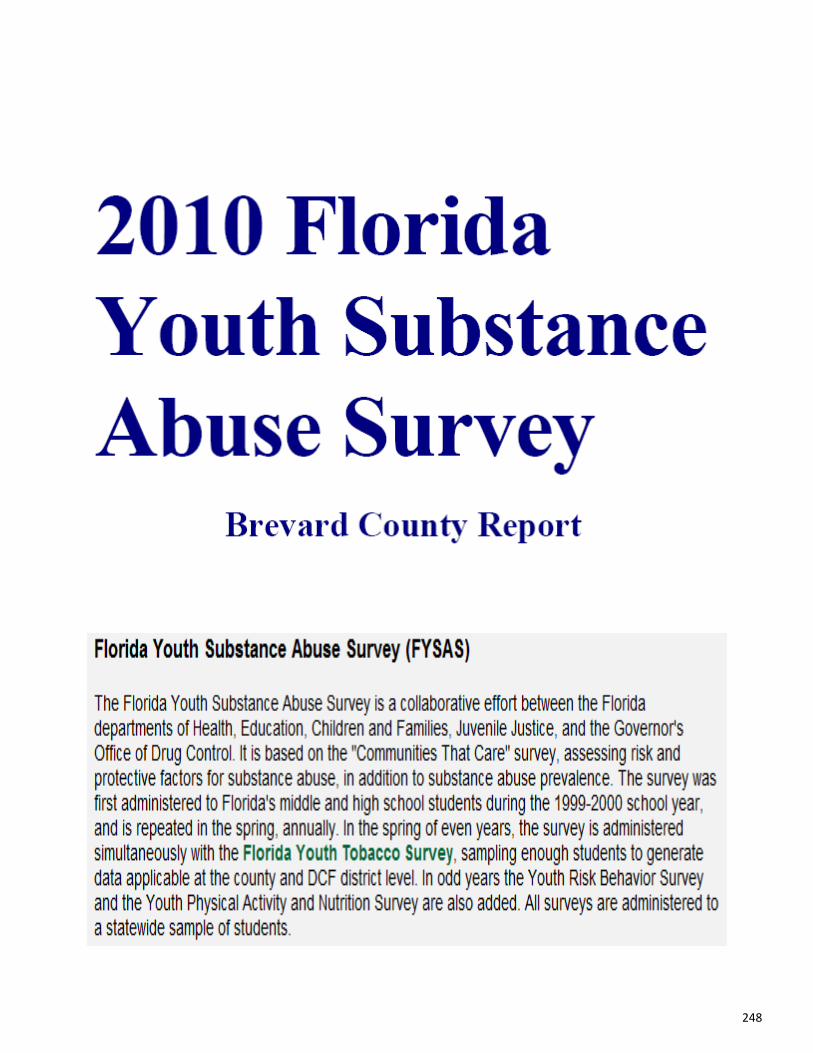
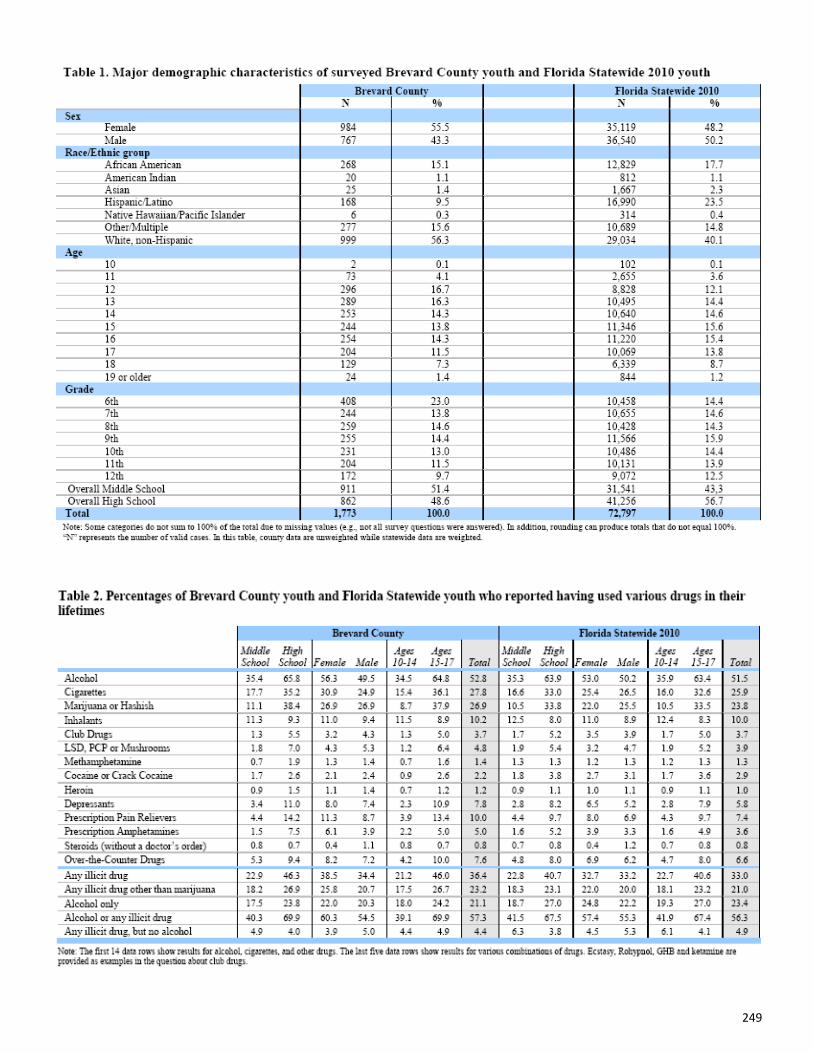
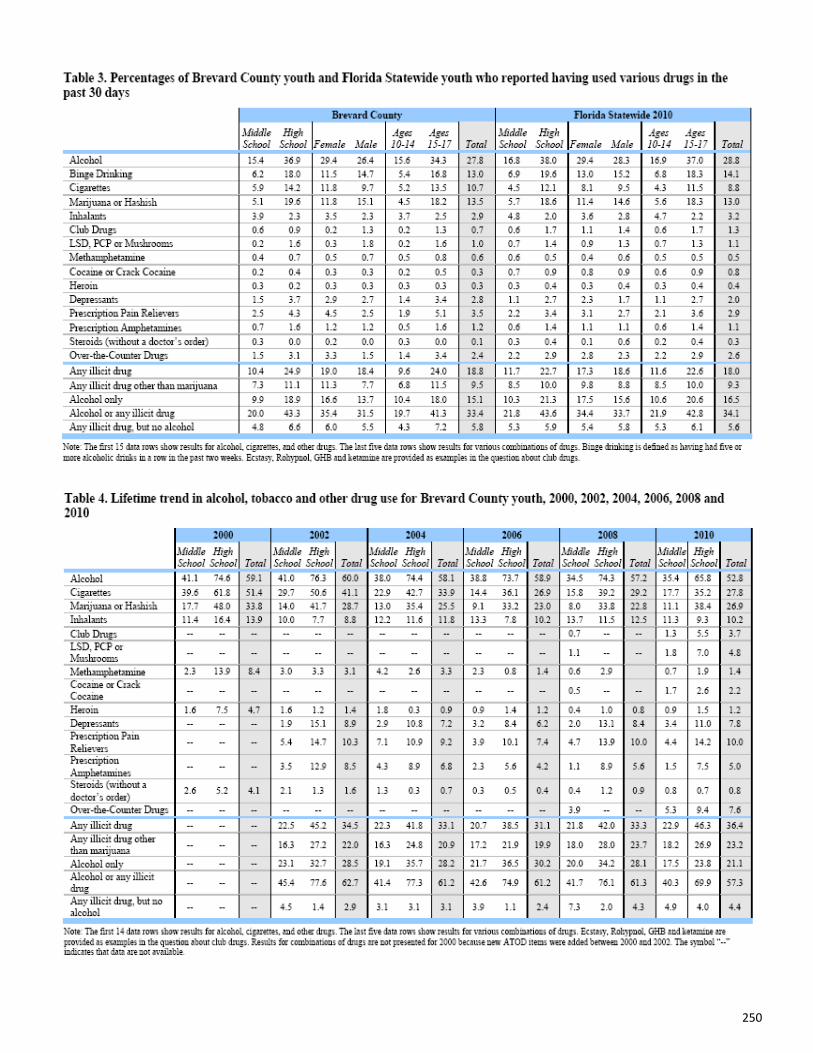
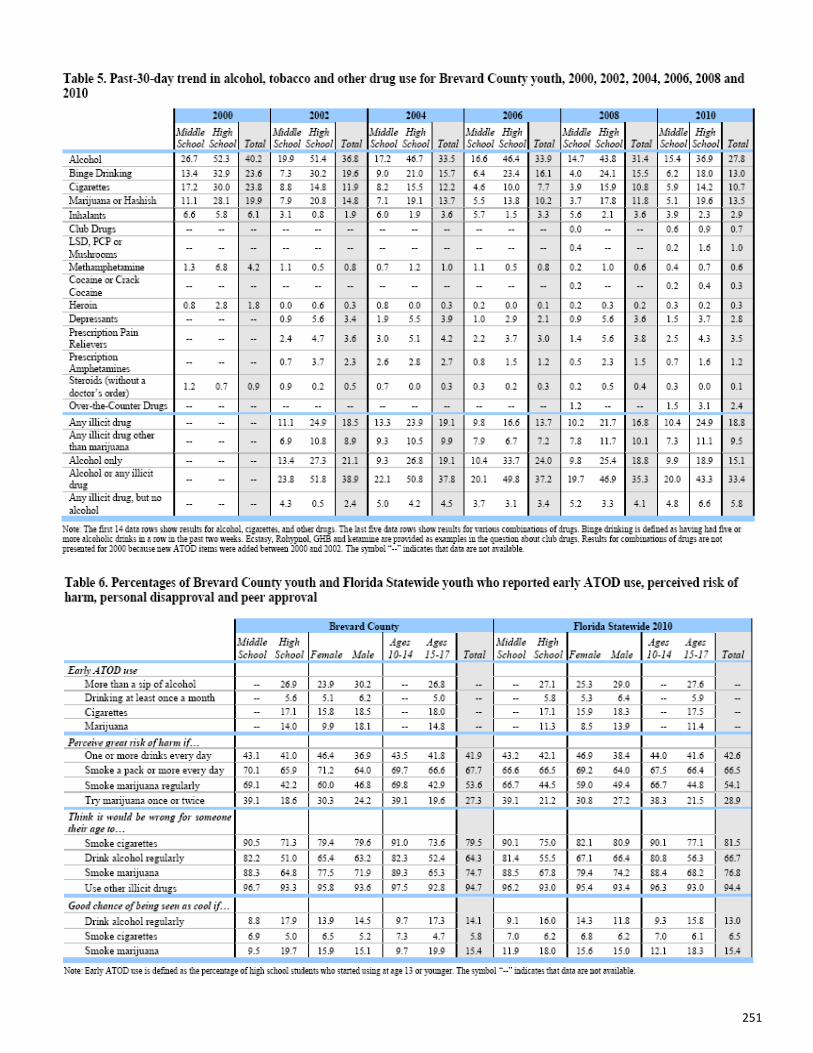
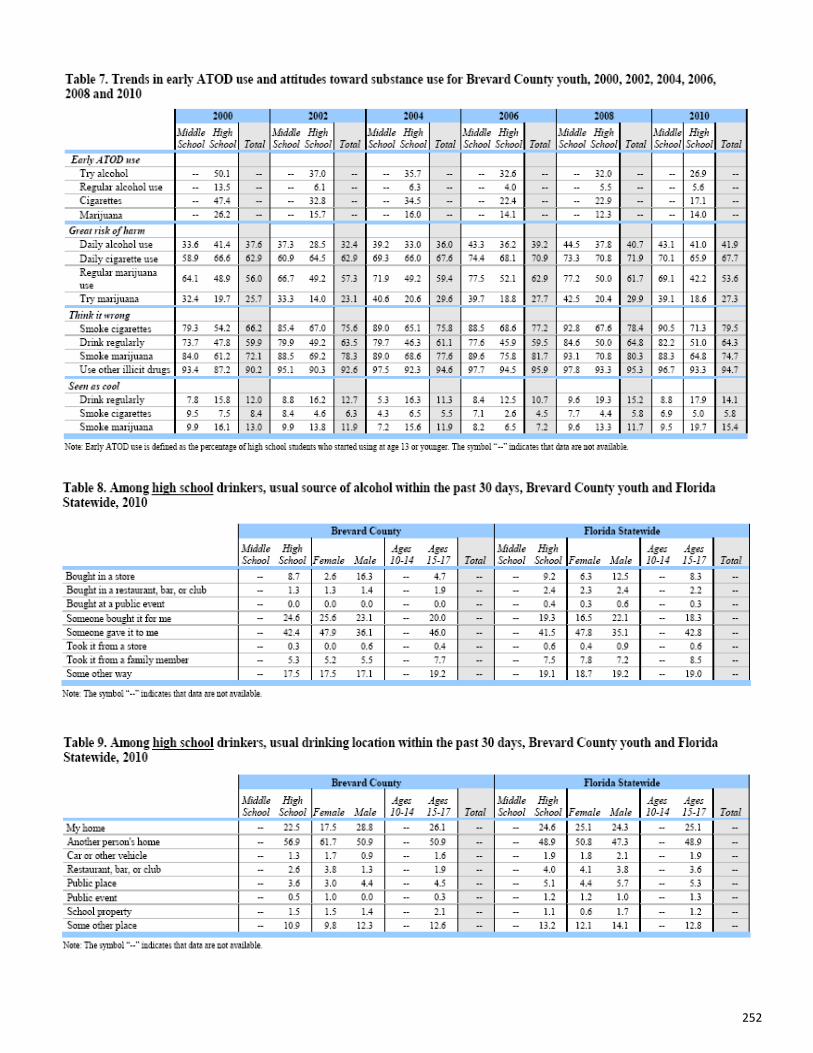
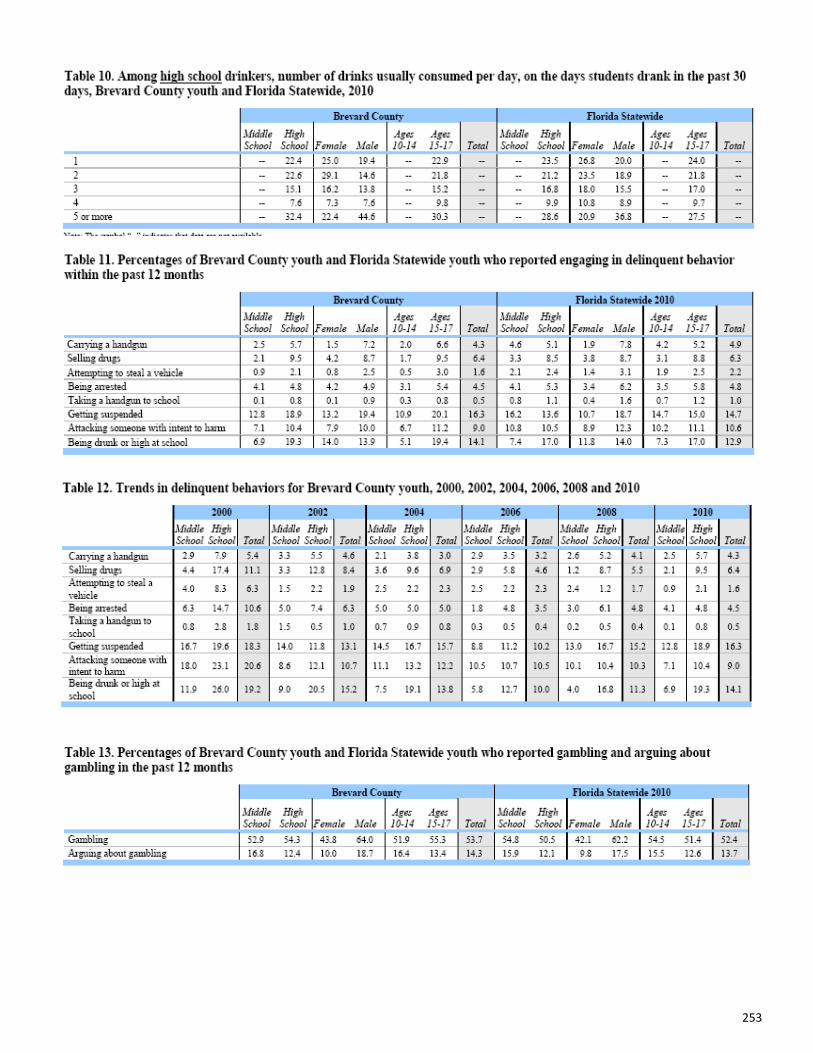
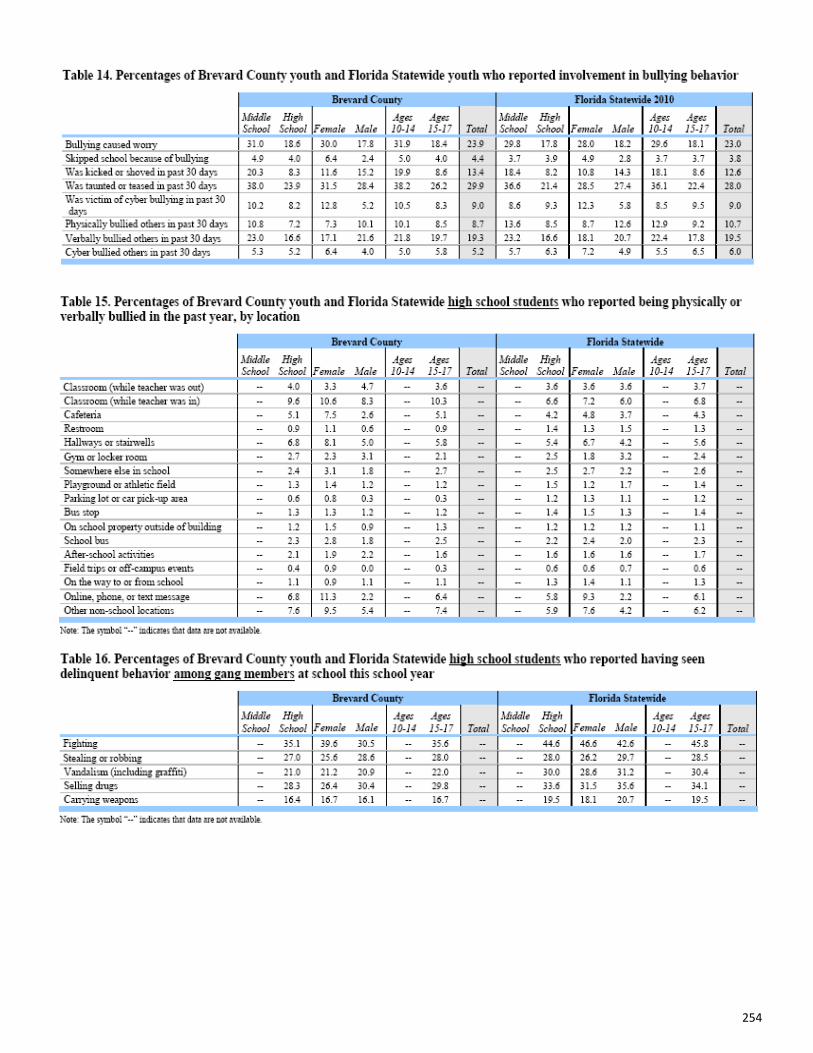
2010 Florida Youth Substance Abuse Survey
http://www.dcf.state.fl.us/programs/samh/publications/fysas/
248
249
250
251
252
253
254

255
256

257

258
Appendix C
The U.S. Preventive Services Task Force (USPSTF) Gr ades/Recommendations
http://www.uspreventiveservicestaskforce.org/uspstf/grades.htm
259

260
Appendix D
Key Stakeholder Questionnaire

261
Name: ____________________________________ Date:______________ Time: ______________
Agency: ______________________________________
Title: __________________________________
Mailing Address: ____________________________________________________________________
_______________________________________________________________________
Phone: _____________________________ Email: ___________________________________
Prevention Institute defines four basic elements of community health:
Equitable opportunity: including racial justice, jobs and education,
Place: including parks and open space, transportation, housing, air, water and safety,
People : including social networks and willingness to act for the common good, and
Health Care Services: including preventive services, treatment services, access, cultural
competency, and emergency response.
1. Considering this overall look at what it takes t o have a healthy community, what do you view as the major issues facing us:
2. Now looking only at health care services (preven tive, treatment, access, cultural compe-tency, emergency response), what do you view as the major issues when it comes to us:
3. Who in our community is doing a good job of prom oting health?
4. Who in our community does not promote good healt h?
5. Are there gaps where you would like to see servi ces offered in your community?
6. If you were in charge of improving health in our community, what would you do first?

262