2012 Annual Performance Presentation · 126 Clearwater Shale 2520 20.0 ... Artificial Lift • All...
87
2012 Annual Performance Presentation McKay River Thermal Project
-
Upload
hoangkhanh -
Category
Documents
-
view
217 -
download
1
Transcript of 2012 Annual Performance Presentation · 126 Clearwater Shale 2520 20.0 ... Artificial Lift • All...

2012 Annual Performance PresentationMcKay River Thermal Project
Outline
Introductions
3.1.1 Subsurface Overview Related to Resource Evaluation and Recovery
3.1.2 Surface Operations, Compliance, and Issues Not Related to Resource Evaluation and Recovery
2
Subsurface Summary Table of Contents
1. Project Background2. Geology/Geoscience3. Heave Monitoring and Caprock4. Drilling and Completions5. Artificial Lift6. Instrumentation in Wells7. 4D Seismic8. Scheme Performance9. Future Plans
3

PROJECT BACKGROUND
4
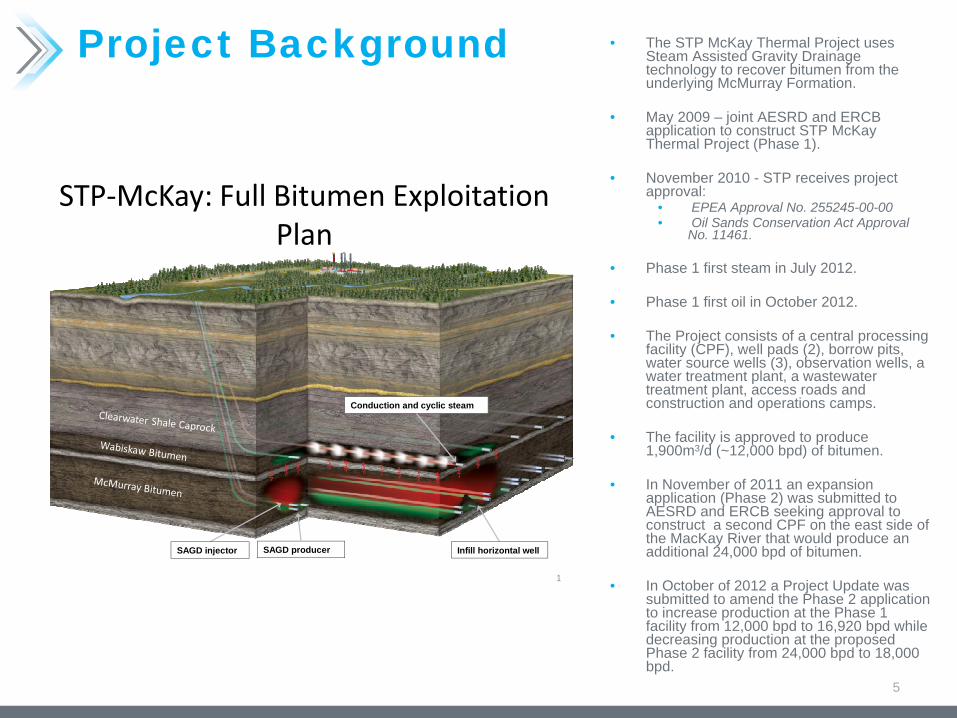
Project Background • The STP McKay Thermal Project uses Steam Assisted Gravity Drainage technology to recover bitumen from the underlying McMurray Formation.
• May 2009 – joint AESRD and ERCB application to construct STP McKay Thermal Project (Phase 1).
• November 2010 - STP receives project approval:
• EPEA Approval No. 255245-00-00• Oil Sands Conservation Act Approval
No. 11461.
• Phase 1 first steam in July 2012.
• Phase 1 first oil in October 2012.
• The Project consists of a central processing facility (CPF), well pads (2), borrow pits, water source wells (3), observation wells, a water treatment plant, a wastewater treatment plant, access roads and construction and operations camps.
• The facility is approved to produce 1,900m3/d (~12,000 bpd) of bitumen.
• In November of 2011 an expansion application (Phase 2) was submitted to AESRD and ERCB seeking approval to construct a second CPF on the east side of the MacKay River that would produce an additional 24,000 bpd of bitumen.
• In October of 2012 a Project Update was submitted to amend the Phase 2 application to increase production at the Phase 1 facility from 12,000 bpd to 16,920 bpd while decreasing production at the proposed Phase 2 facility from 24,000 bpd to 18,000 bpd.
5
STP‐McKay: Full Bitumen Exploitation Plan
1
Conduction and cyclic steam
SAGD injector Infill horizontal wellSAGD producer
Project Background
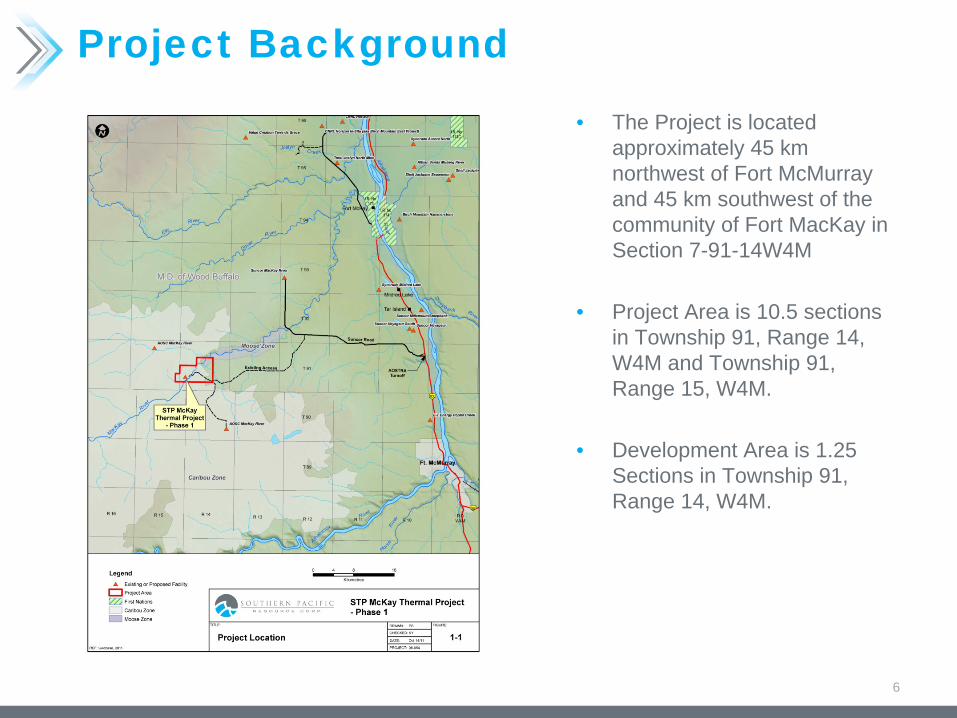
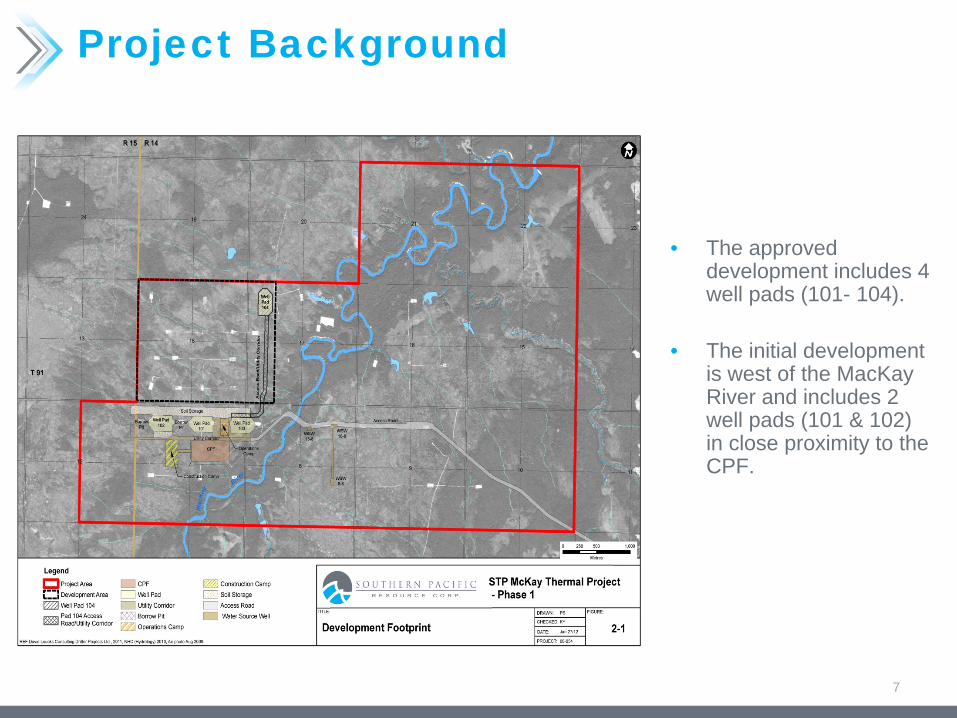
• The Project is located approximately 45 km northwest of Fort McMurray and 45 km southwest of the community of Fort MacKay in Section 7-91-14W4M
• Project Area is 10.5 sections in Township 91, Range 14, W4M and Township 91, Range 15, W4M.
• Development Area is 1.25 Sections in Township 91, Range 14, W4M.
6
Project Background
• The approved development includes 4 well pads (101- 104).
• The initial development is west of the MacKay River and includes 2 well pads (101 & 102) in close proximity to the CPF.
7

GEOLOGY/GEOSCIENCE
8

Geology Overview Regional Geology – McMurray
Source: Mike Ranger’s Regional Study, 2011
9
STP McKay (T91- 14w4)McMurray Net Pay
McKay OBIP by Volumetrics
• Approval Area OBIP• 88,820 E3m3
• Approval Area Reservoir Properties:• Porosity: 30-33%, Oil Saturation: 65-75%, Height: 10-27m
• Initial Operating Area (Pads 101,102) OBIP• 6,131 E3m3
• Operating Pads Average Reservoir Properties:• Porosity: 32%, Oil Saturation: 74%, Height: 17-27m
10
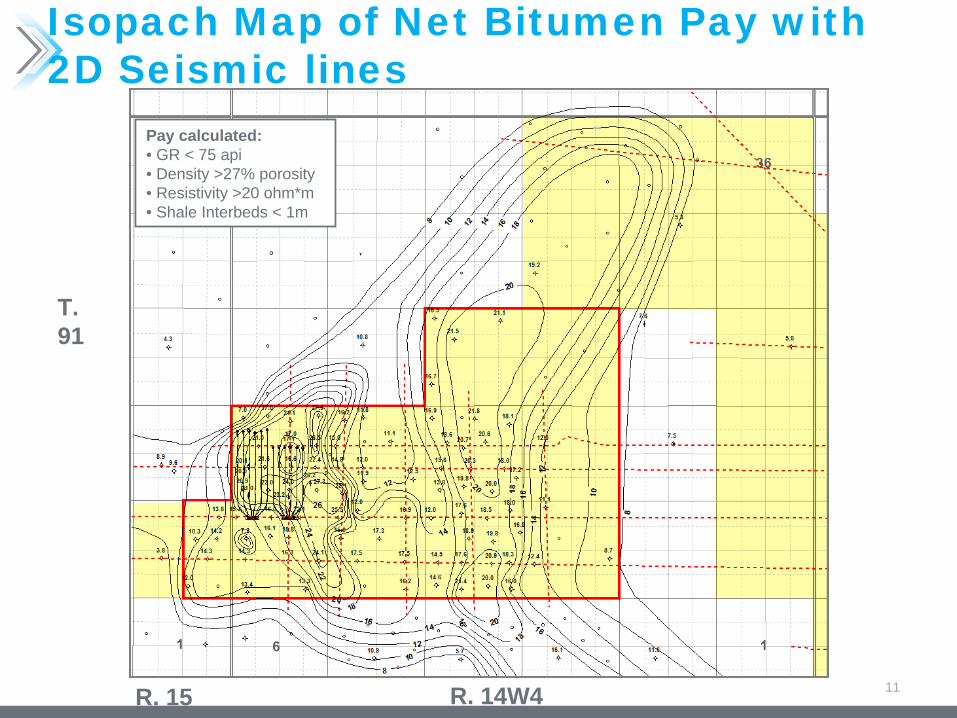
Isopach Map of Net Bitumen Pay with 2D Seismic lines
T. 91
R. 14W4R. 15
Pay calculated:• GR < 75 api• Density >27% porosity• Resistivity >20 ohm*m• Shale Interbeds < 1m
11
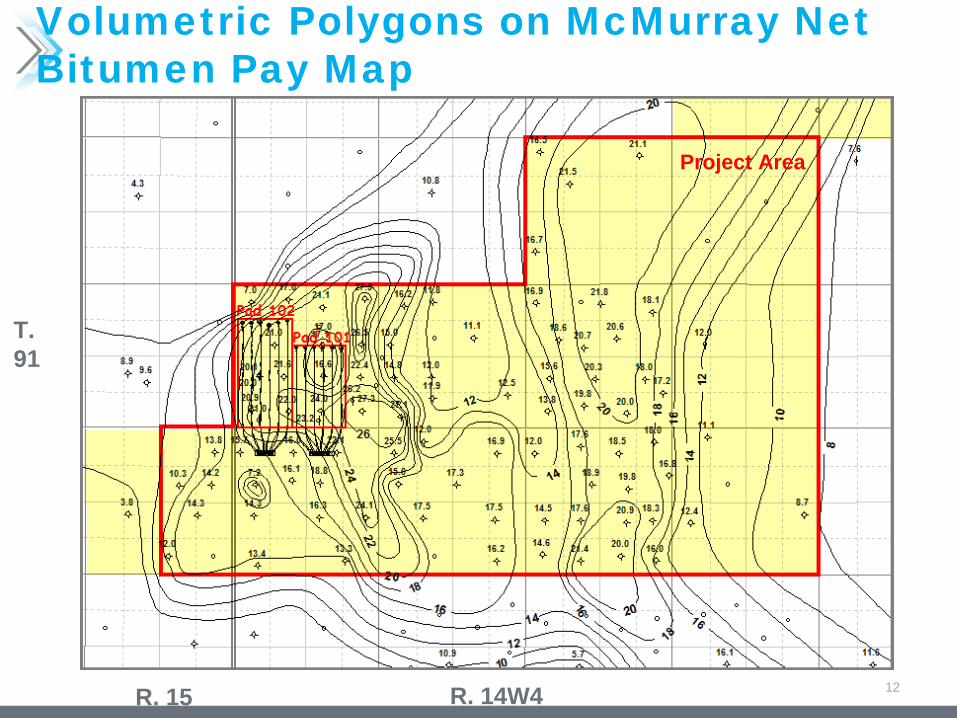
Volumetric Polygons on McMurray Net Bitumen Pay Map
Project Area
12R. 15 R. 14W4
T. 91
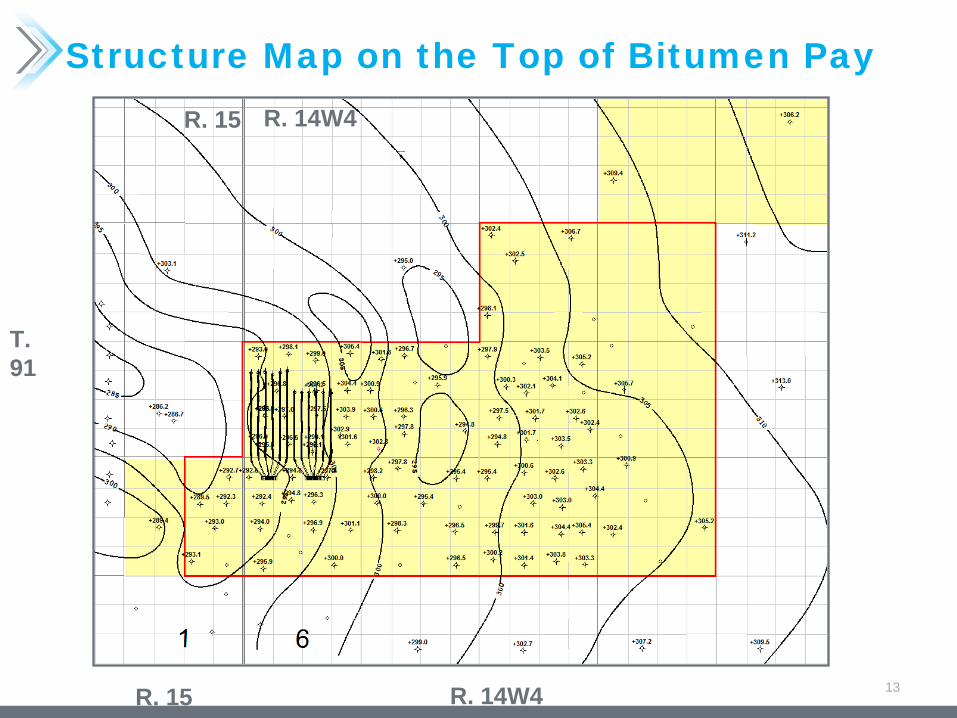
Structure Map on the Top of Bitumen Pay
T. 91
R. 14W4R. 15
13R. 15 R. 14W4

Structure Map on the Base of Bitumen Pay
T. 91
R. 15 R. 14W4
14R. 15 R. 14W4
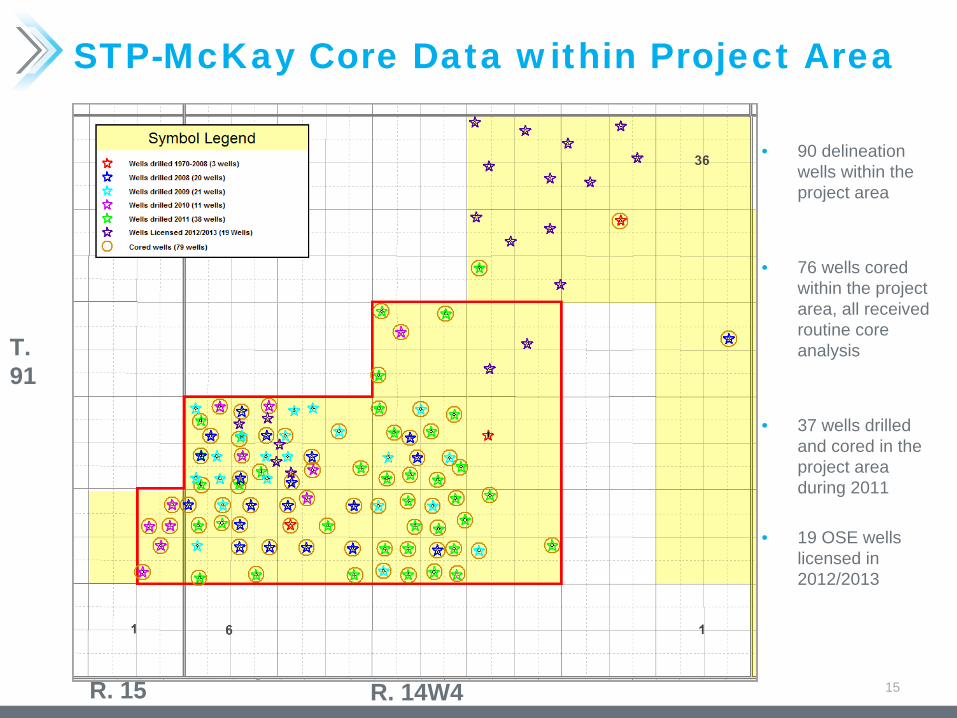
STP-McKay Core Data within Project Area
• 90 delineation wells within the project area
• 76 wells cored within the project area, all received routine core analysis
• 37 wells drilled and cored in the project area during 2011
• 19 OSE wells licensed in 2012/2013
15
T. 91
R. 15 R. 14W4
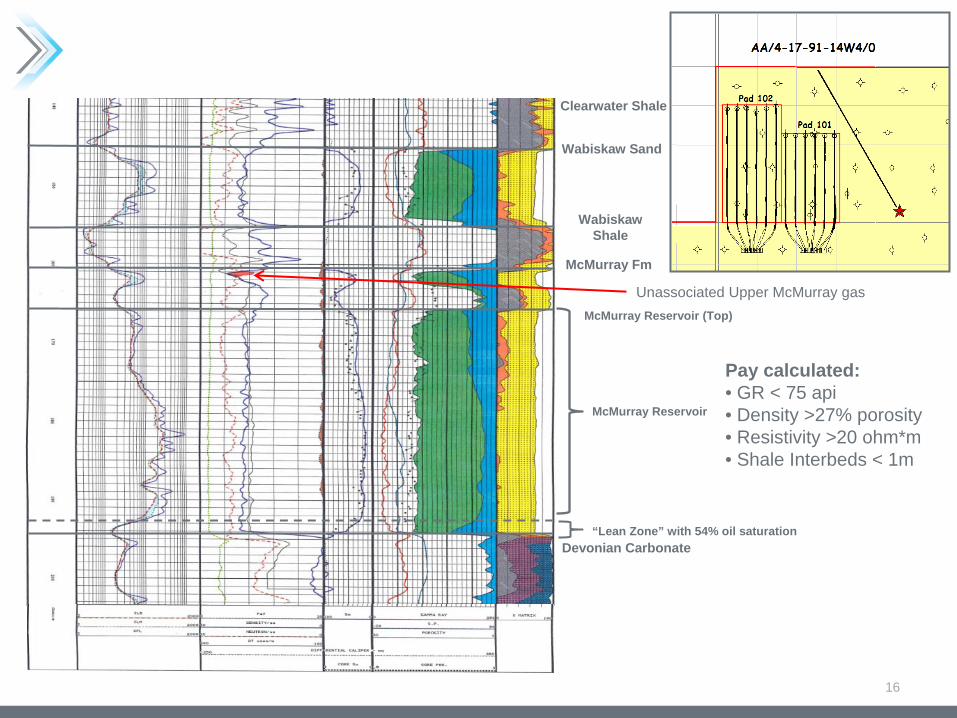
Wabiskaw Sand
McMurray Fm
McMurray Reservoir
Wabiskaw Shale
Devonian Carbonate“Lean Zone” with 54% oil saturation
Pay calculated:• GR < 75 api• Density >27% porosity• Resistivity >20 ohm*m• Shale Interbeds < 1m
Clearwater Shale
Unassociated Upper McMurray gasMcMurray Reservoir (Top)
16
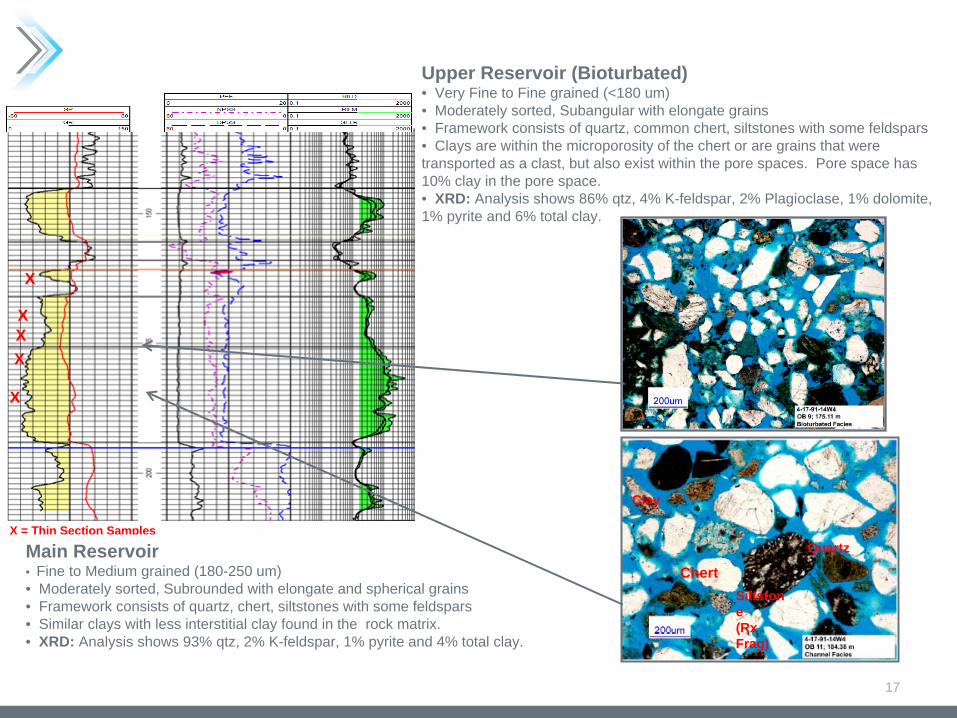
X
X
X
X = Thin Section Samples
X
Main Reservoir• Fine to Medium grained (180-250 um)• Moderately sorted, Subrounded with elongate and spherical grains• Framework consists of quartz, chert, siltstones with some feldspars• Similar clays with less interstitial clay found in the rock matrix.• XRD: Analysis shows 93% qtz, 2% K-feldspar, 1% pyrite and 4% total clay.
Siltston e(Rx Frag)
Quartz
Chert
Clay
Upper Reservoir (Bioturbated)• Very Fine to Fine grained (<180 um)• Moderately sorted, Subangular with elongate grains• Framework consists of quartz, common chert, siltstones with some feldspars• Clays are within the microporosity of the chert or are grains that were transported as a clast, but also exist within the pore spaces. Pore space has 10% clay in the pore space. • XRD: Analysis shows 86% qtz, 4% K-feldspar, 2% Plagioclase, 1% dolomite, 1% pyrite and 6% total clay.
X
17
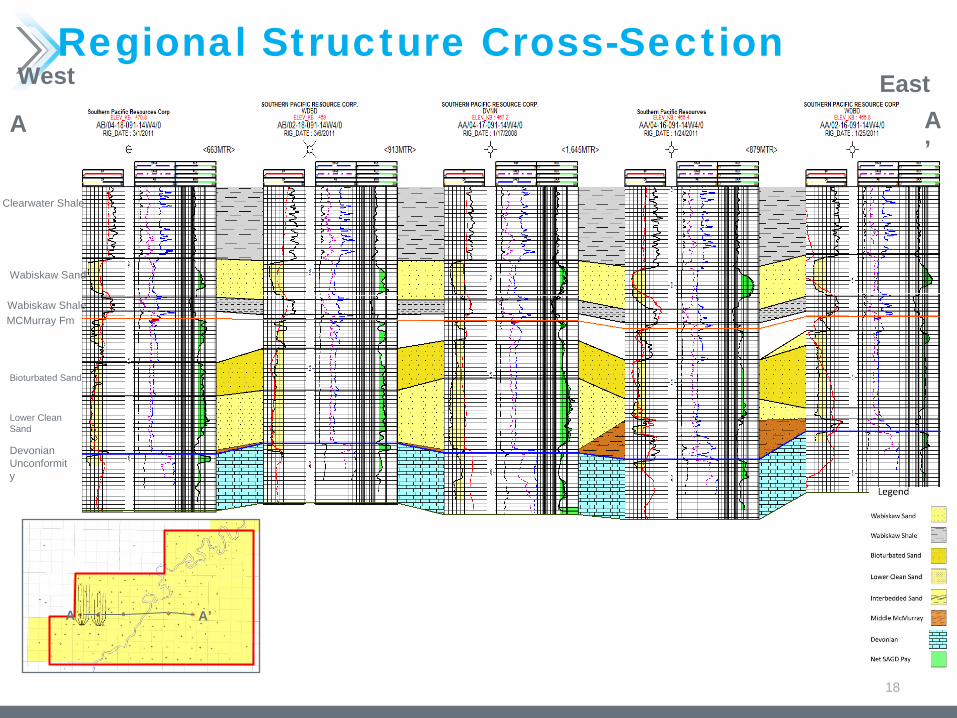
Regional Structure Cross-Section
A’
A A ’
West East
Clearwater Shale
Wabiskaw Shale
Wabiskaw Sand
MCMurray Fm
Bioturbated Sand
Lower Clean Sand
Devonian Unconformit y
A
18
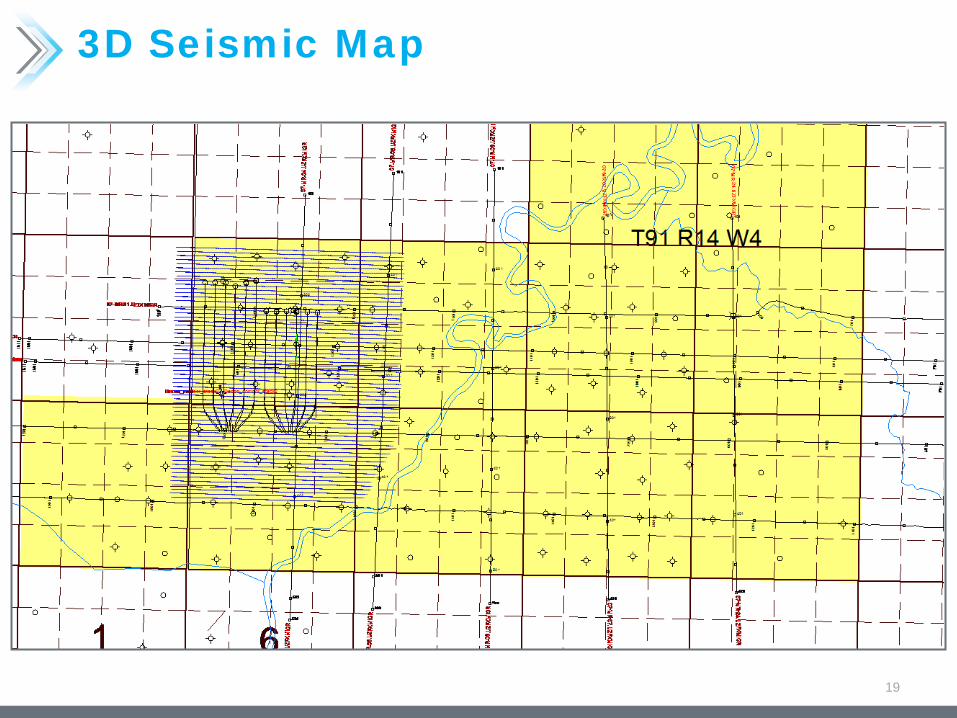
3D Seismic Map
19
HEAVE MONITORINGAND CAPROCK
20
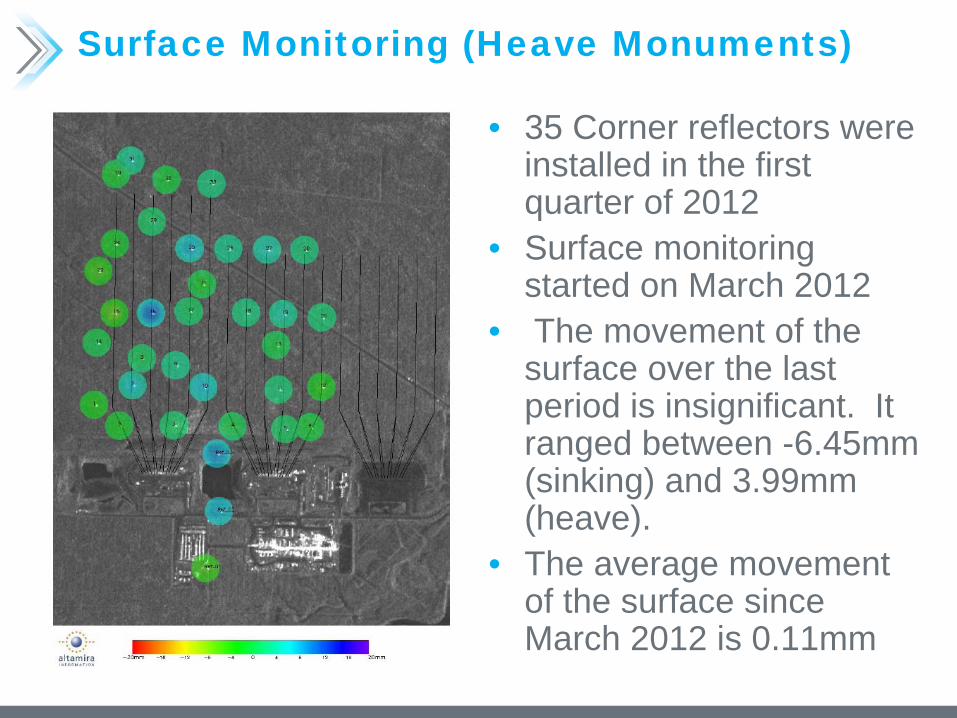
Surface Monitoring (Heave Monuments)
• 35 Corner reflectors were installed in the first quarter of 2012
• Surface monitoring started on March 2012
• The movement of the surface over the last period is insignificant. It ranged between -6.45mm (sinking) and 3.99mm (heave).
• The average movement of the surface since March 2012 is 0.11mm
Caprock Integrity
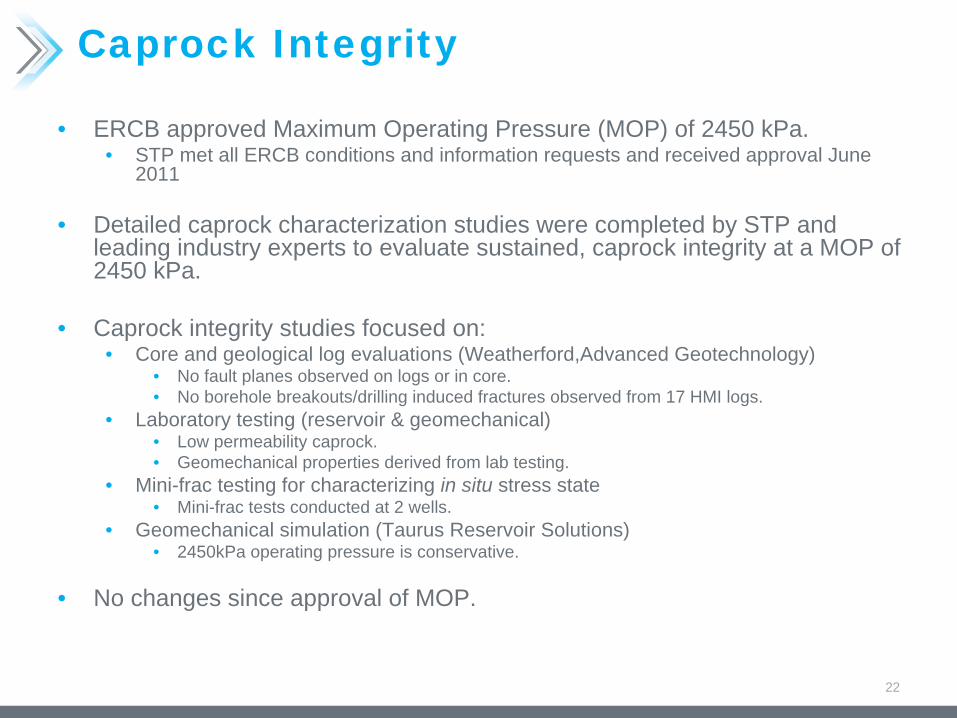
• ERCB approved Maximum Operating Pressure (MOP) of 2450 kPa.• STP met all ERCB conditions and information requests and received approval June
2011
• Detailed caprock characterization studies were completed by STP and leading industry experts to evaluate sustained, caprock integrity at a MOP of 2450 kPa.
• Caprock integrity studies focused on:• Core and geological log evaluations (Weatherford,Advanced Geotechnology)
• No fault planes observed on logs or in core.• No borehole breakouts/drilling induced fractures observed from 17 HMI logs.
• Laboratory testing (reservoir & geomechanical)• Low permeability caprock.• Geomechanical properties derived from lab testing.
• Mini-frac testing for characterizing in situ stress state• Mini-frac tests conducted at 2 wells.
• Geomechanical simulation (Taurus Reservoir Solutions)• 2450kPa operating pressure is conservative.
• No changes since approval of MOP.
22
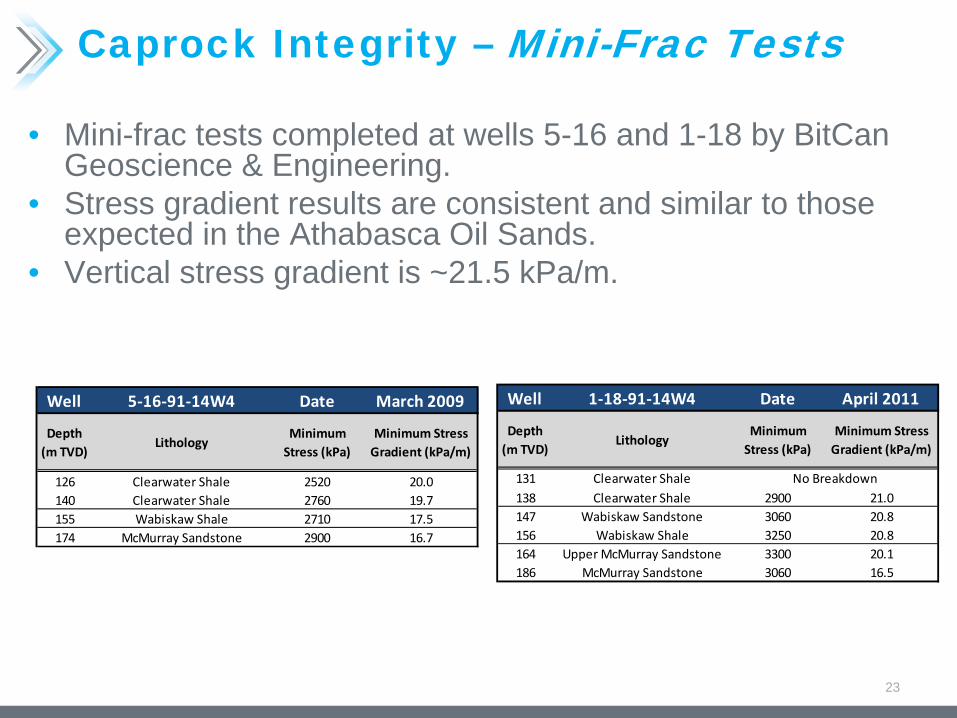
Caprock Integrity – Mini-Frac Tests
• Mini-frac tests completed at wells 5-16 and 1-18 by BitCan Geoscience & Engineering.
• Stress gradient results are consistent and similar to those expected in the Athabasca Oil Sands.
• Vertical stress gradient is ~21.5 kPa/m.
23
126 Clearwater Shale 2520 20.0140 Clearwater Shale 2760 19.7155 Wabiskaw Shale 2710 17.5174 McMurray Sandstone 2900 16.7
Well 5‐16‐91‐14W4 Date March 2009
Depth (m TVD)
LithologyMinimum Stress (kPa)
Minimum Stress Gradient (kPa/m)
131 Clearwater Shale138 Clearwater Shale 2900 21.0147 Wabiskaw Sandstone 3060 20.8156 Wabiskaw Shale 3250 20.8164 Upper McMurray Sandstone 3300 20.1186 McMurray Sandstone 3060 16.5
Date April 2011
No Breakdown
Depth (m TVD)
LithologyMinimum Stress (kPa)
Minimum Stress Gradient (kPa/m)
Well 1‐18‐91‐14W4
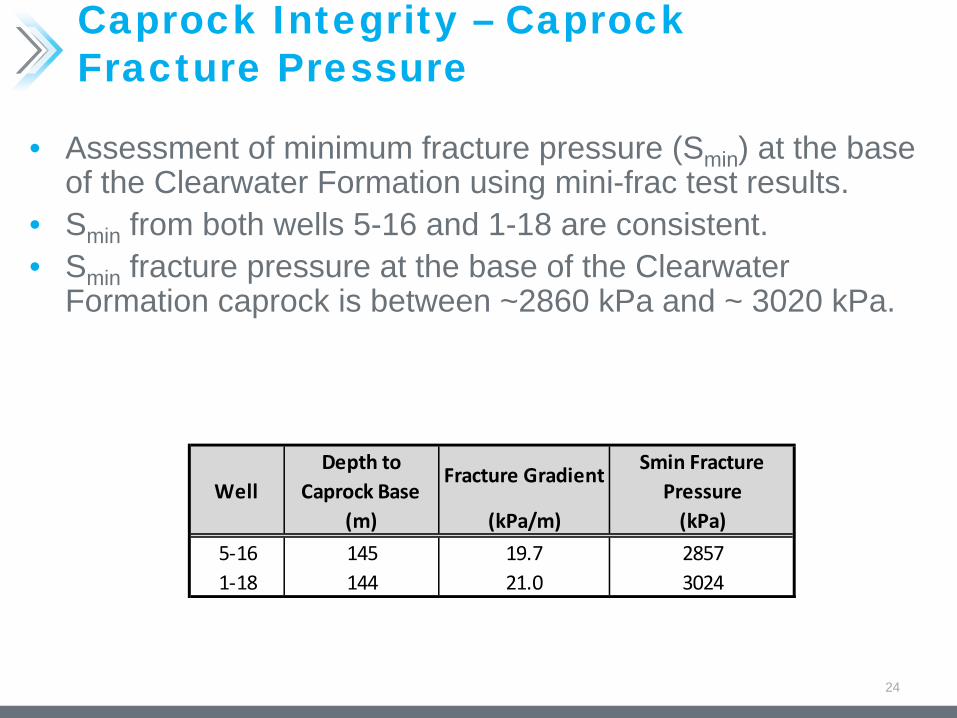
Caprock Integrity – Caprock Fracture Pressure
• Assessment of minimum fracture pressure (Smin ) at the base of the Clearwater Formation using mini-frac test results.
• Smin from both wells 5-16 and 1-18 are consistent.• Smin fracture pressure at the base of the Clearwater
Formation caprock is between ~2860 kPa and ~ 3020 kPa.
24
(m) (kPa/m) (kPa)
5‐16 145 19.7 28571‐18 144 21.0 3024
Depth to Caprock Base
Fracture GradientSmin Fracture
PressureWell
Caprock Integrity – Monitoring
• Clearwater Formation:• 6 vertical, nested observation wells measuring pressure and
temperature.
• Wabiskaw Member:• 1 horizontal well measuring temperature.
• Surface heave monitoring program.• 4D seismic is planned.• Blanket Gas system to monitor bottomhole injection
pressures.
25
DRILLING/COMPLETIONS
26
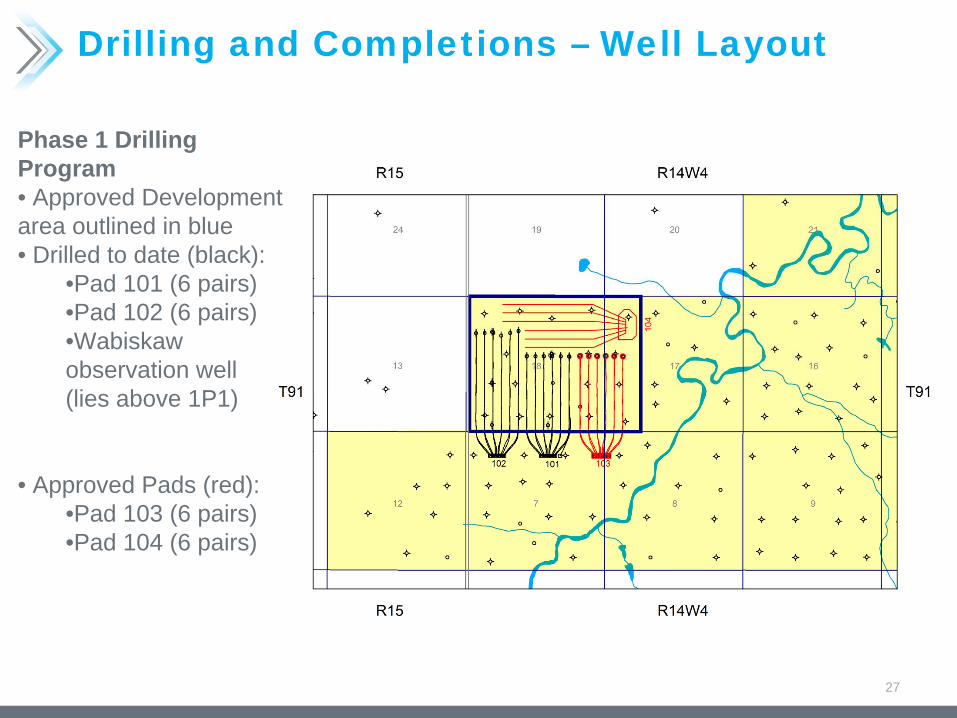
Drilling and Completions – Well Layout
27
Phase 1 Drilling Program• Approved Development area outlined in blue• Drilled to date (black):
•Pad 101 (6 pairs)•Pad 102 (6 pairs)•Wabiskaw observation well (lies above 1P1)
• Approved Pads (red):•Pad 103 (6 pairs)•Pad 104 (6 pairs)
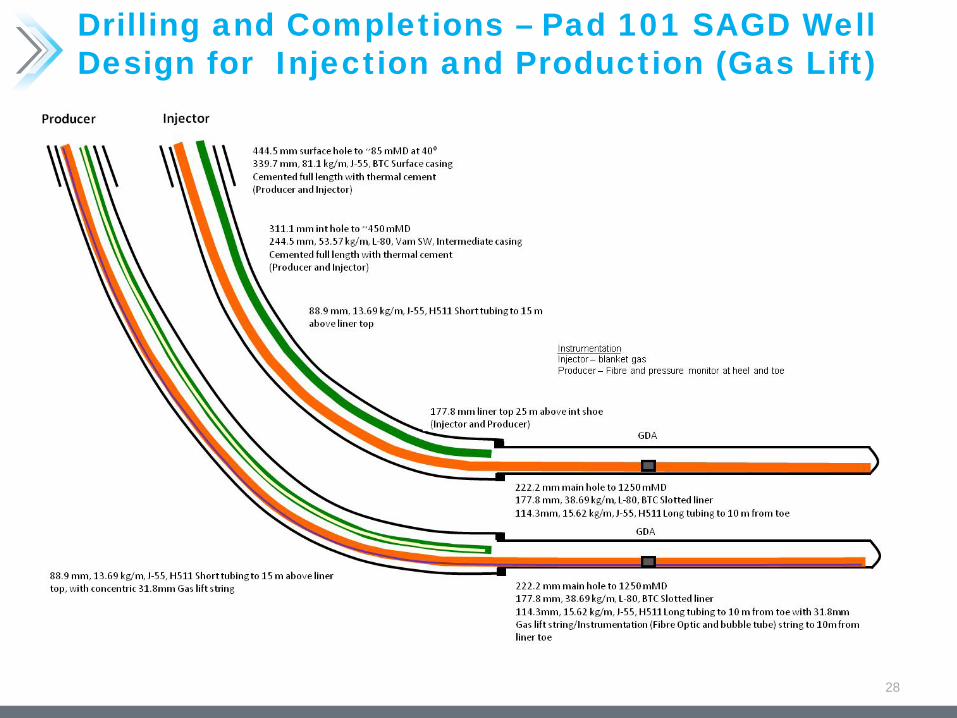
Drilling and Completions – Pad 101 SAGD Well Design for Injection and Production (Gas Lift)
28
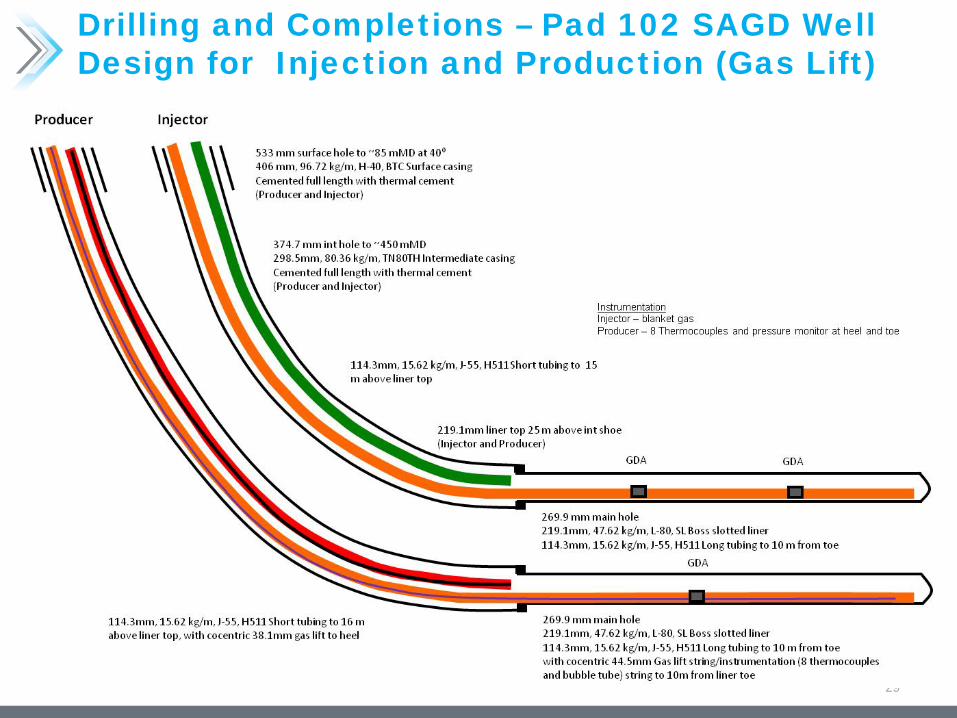
Drilling and Completions – Pad 102 SAGD Well Design for Injection and Production (Gas Lift)
29
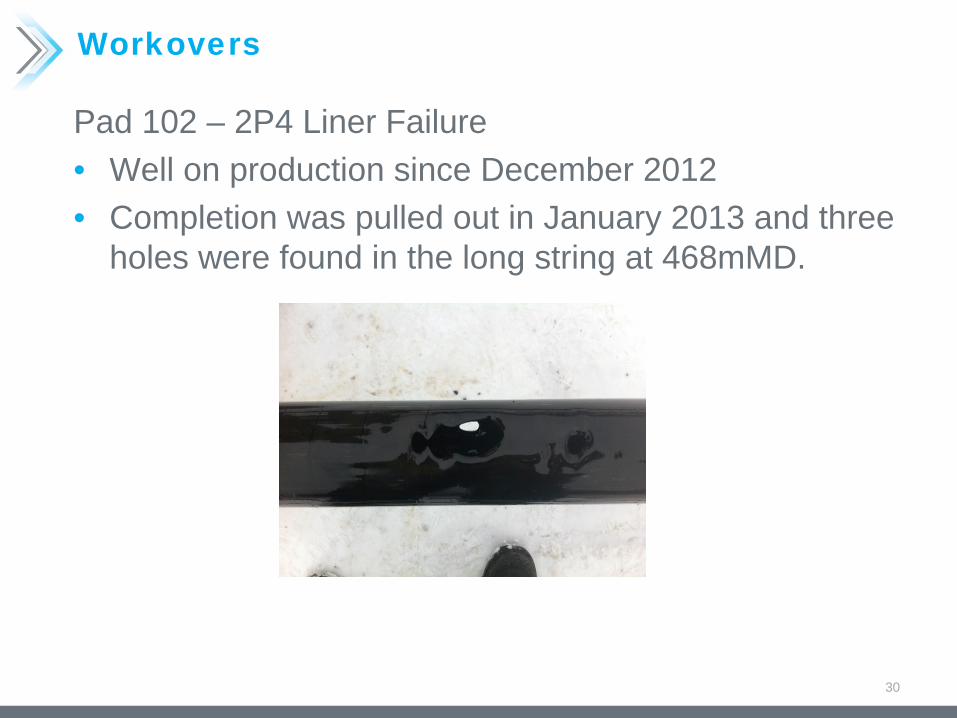
Workovers
Pad 102 – 2P4 Liner Failure• Well on production since December 2012• Completion was pulled out in January 2013 and three
holes were found in the long string at 468mMD.
30
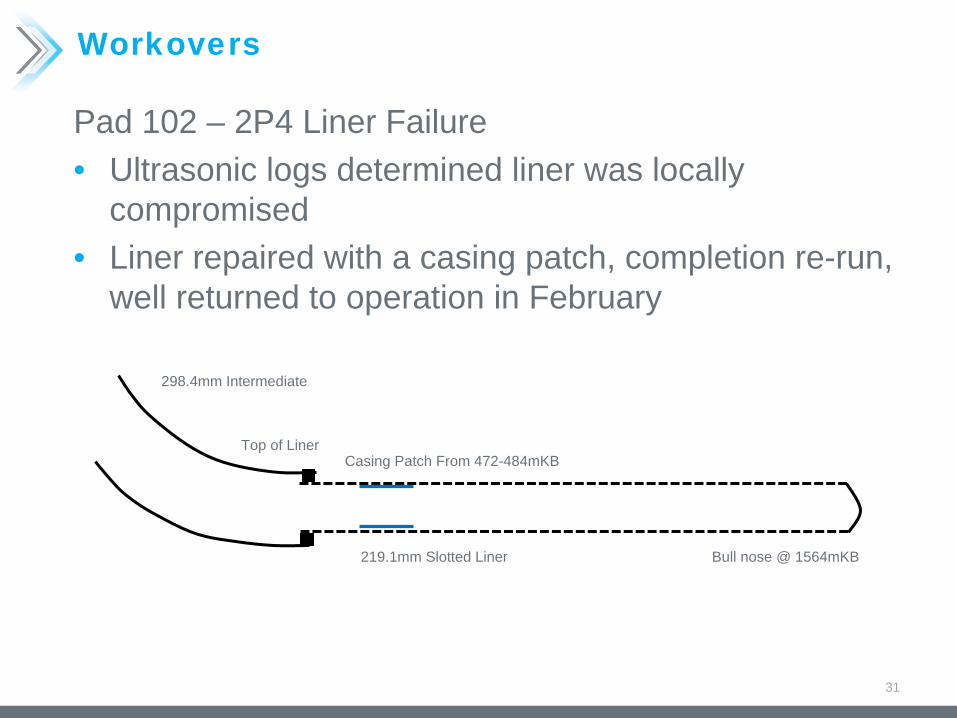
Workovers
Pad 102 – 2P4 Liner Failure• Ultrasonic logs determined liner was locally
compromised• Liner repaired with a casing patch, completion re-run,
well returned to operation in February
31
Top of Liner
219.1mm Slotted Liner
Casing Patch From 472-484mKB
Bull nose @ 1564mKB
298.4mm Intermediate
Artificial Lift
• All production wells are equipped for gas lift
• Amount of lift gas required is dependent on operating pressure/temperature of the well.• Using 3.5 to 7.2 E3m3/d lift gas volume and well
operating range has varied from 1500kPa to 2250kPa.
• Maintaining low group pressures is beneficial
32
INSTRUMENTATION
33
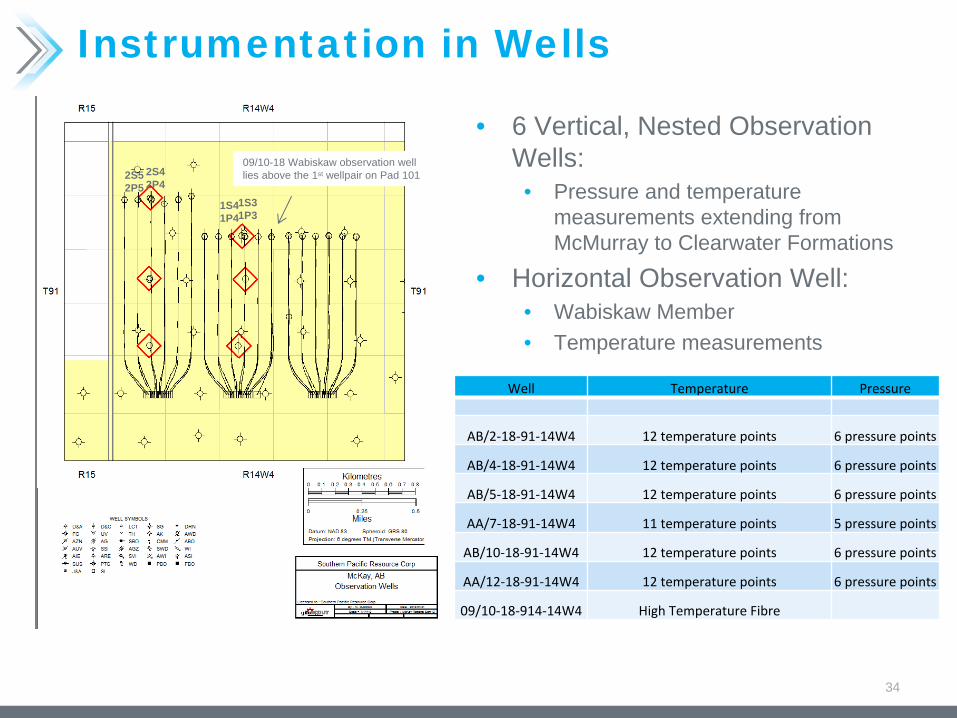
Instrumentation in Wells
• 6 Vertical, Nested Observation Wells:
• Pressure and temperature measurements extending from McMurray to Clearwater Formations
• Horizontal Observation Well:• Wabiskaw Member• Temperature measurements
34
Well Temperature Pressure
AB/2‐18‐91‐14W4 12 temperature points 6 pressure points
AB/4‐18‐91‐14W4 12 temperature points 6 pressure points
AB/5‐18‐91‐14W4 12 temperature points 6 pressure points
AA/7‐18‐91‐14W4 11 temperature points 5 pressure points
AB/10‐18‐91‐14W4 12 temperature points 6 pressure points
AA/12‐18‐91‐14W4 12 temperature points 6 pressure points
09/10‐18‐914‐14W4 High Temperature Fibre
09/10-18 Wabiskaw observation well lies above the 1st wellpair on Pad 1012S5
2P52S42P4
1S31P3
1S41P4
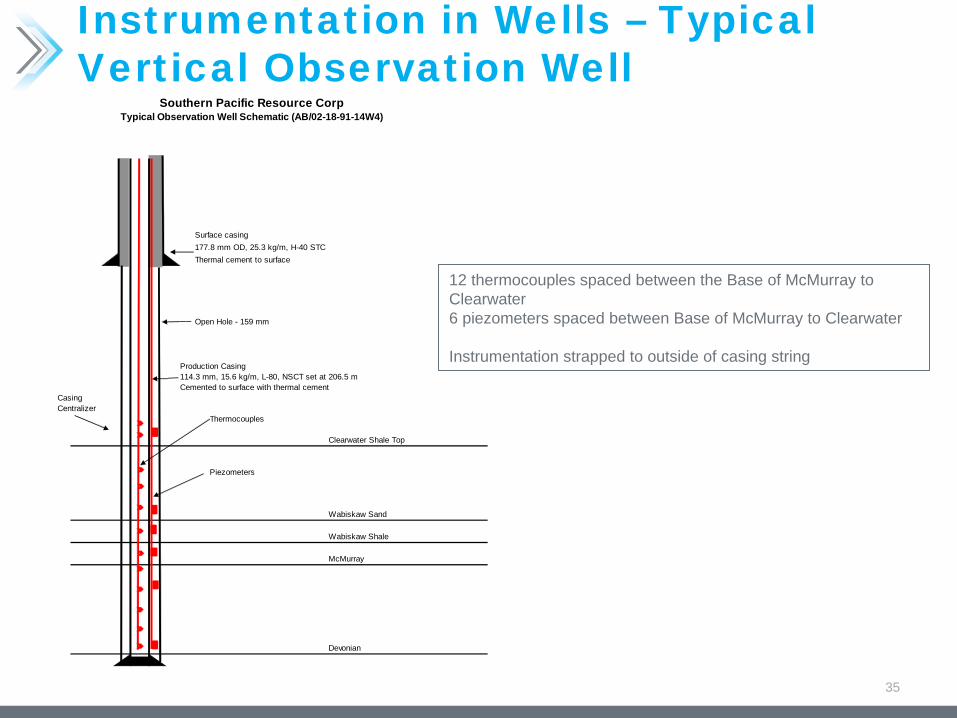
Instrumentation in Wells – Typical Vertical Observation Well
35
12 thermocouples spaced between the Base of McMurray to Clearwater6 piezometers spaced between Base of McMurray to Clearwater
Instrumentation strapped to outside of casing string
Surface casing177.8 mm OD, 25.3 kg/m, H-40 STCThermal cement to surface
Open Hole - 159 mm
Production Casing114.3 mm, 15.6 kg/m, L-80, NSCT set at 206.5 mCemented to surface with thermal cement
CasingCentralizer
Thermocouples
Clearwater Shale Top
Piezometers
Wabiskaw Sand
Wabiskaw Shale
McMurray
Devonian
Southern Pacific Resource CorpTypical Observation Well Schematic (AB/02-18-91-14W4)
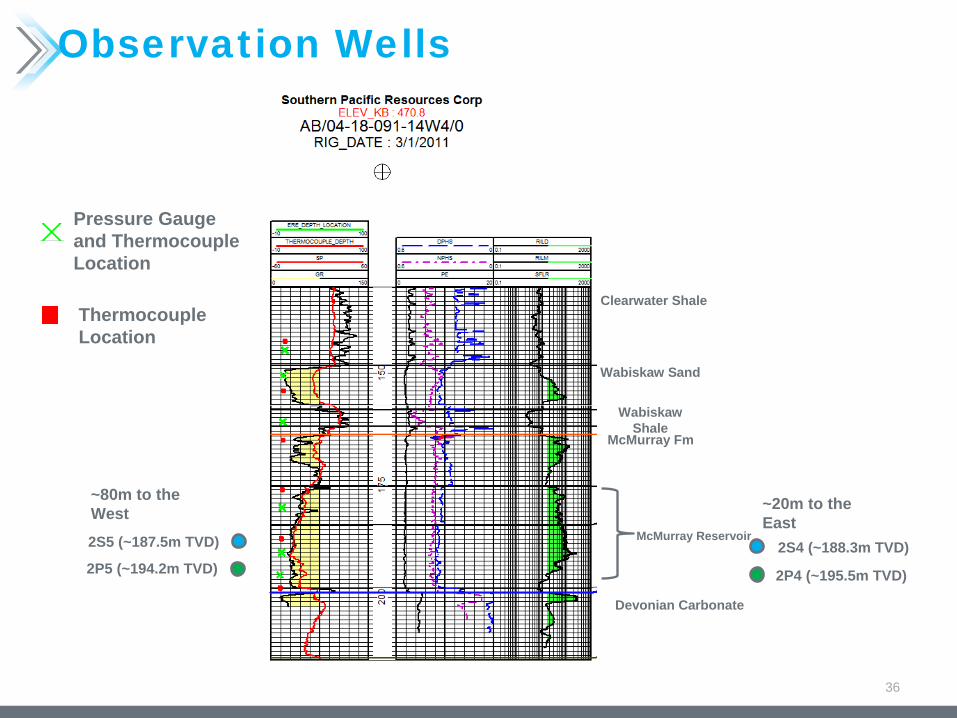
Wabiskaw Sand
McMurray Fm
McMurray Reservoir
Wabiskaw Shale
Devonian Carbonate
Clearwater Shale
2P4 (~195.5m TVD)
2S4 (~188.3m TVD)
~20m to the East
2P5 (~194.2m TVD)
2S5 (~187.5m TVD)
~80m to the West
Pressure Gauge and Thermocouple Location
ThermocoupleLocation
36
Observation Wells
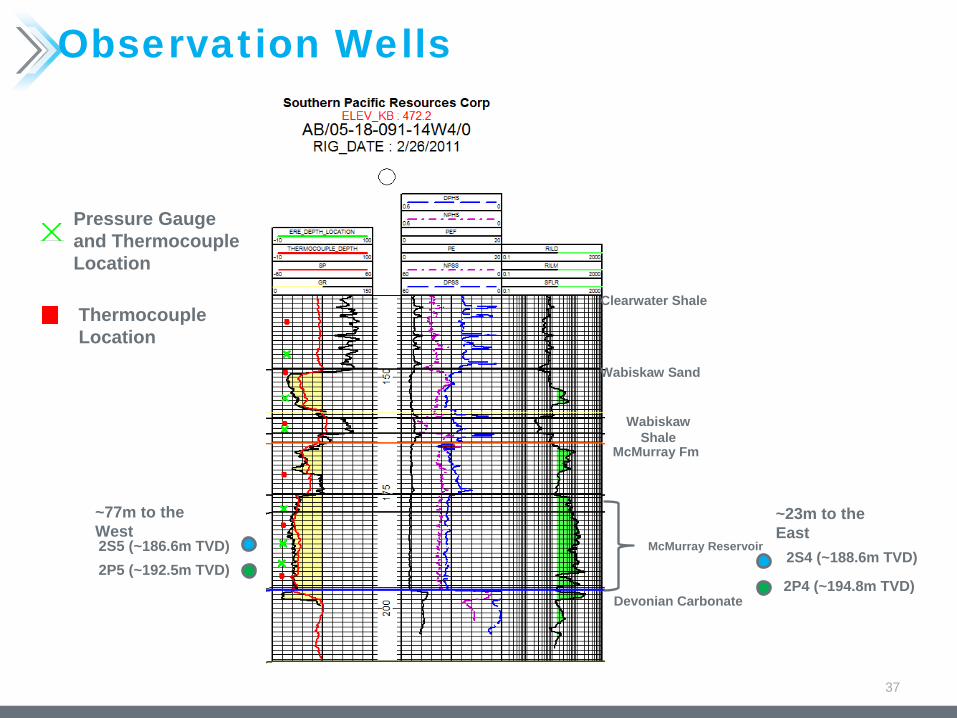
McMurray Reservoir
2P4 (~194.8m TVD)
2S4 (~188.6m TVD)
~23m to the East
2P5 (~192.5m TVD) 2S5 (~186.6m TVD)
~77m to the West
Wabiskaw Sand
McMurray Fm
Wabiskaw Shale
Devonian Carbonate
Clearwater Shale
Pressure Gauge and Thermocouple Location
ThermocoupleLocation
37
Observation Wells
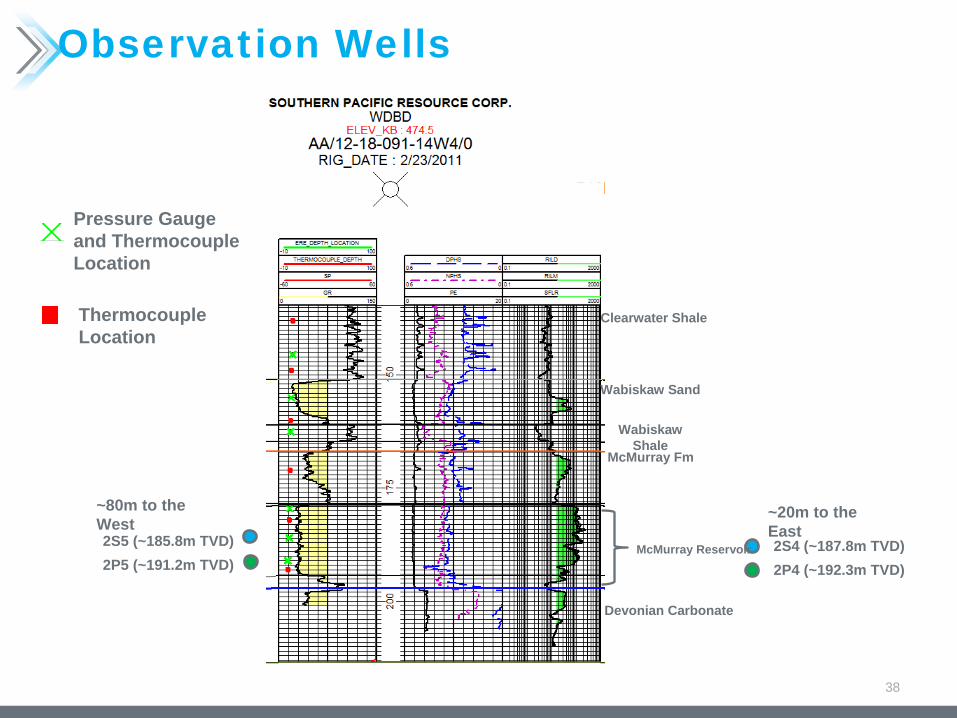
2P4 (~192.3m TVD) 2S4 (~187.8m TVD)
~20m to the East
2P5 (~191.2m TVD) 2S5 (~185.8m TVD)
~80m to the West
Wabiskaw Sand
McMurray Fm
McMurray Reservoir
Wabiskaw Shale
Devonian Carbonate
Clearwater Shale
Pressure Gauge and Thermocouple Location
ThermocoupleLocation
38
Observation Wells
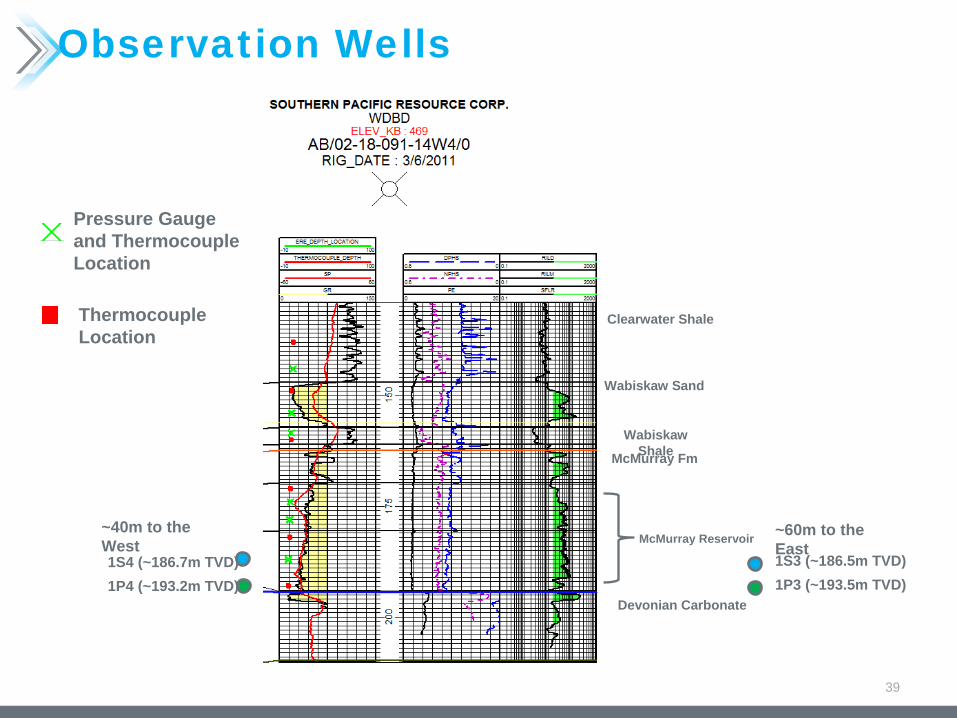
1P3 (~193.5m TVD) 1S3 (~186.5m TVD)
~60m to the East
1P4 (~193.2m TVD) 1S4 (~186.7m TVD)
~40m to the West
Wabiskaw Sand
McMurray Fm
McMurray Reservoir
Wabiskaw Shale
Devonian Carbonate
Clearwater Shale
Pressure Gauge and Thermocouple Location
ThermocoupleLocation
39
Observation Wells

1P3 (~190.8m TVD) 1S3 (~184.6m TVD)
~7 m to the East
1P4 (~189.1m TVD) 1S4 (~183.5m TVD)
~93m to the West
Wabiskaw Sand
McMurray Fm
McMurray Reservoir
Wabiskaw Shale
Devonian Carbonate
Clearwater Shale
Pressure Gauge and Thermocouple Location
ThermocoupleLocation
40
Observation Wells
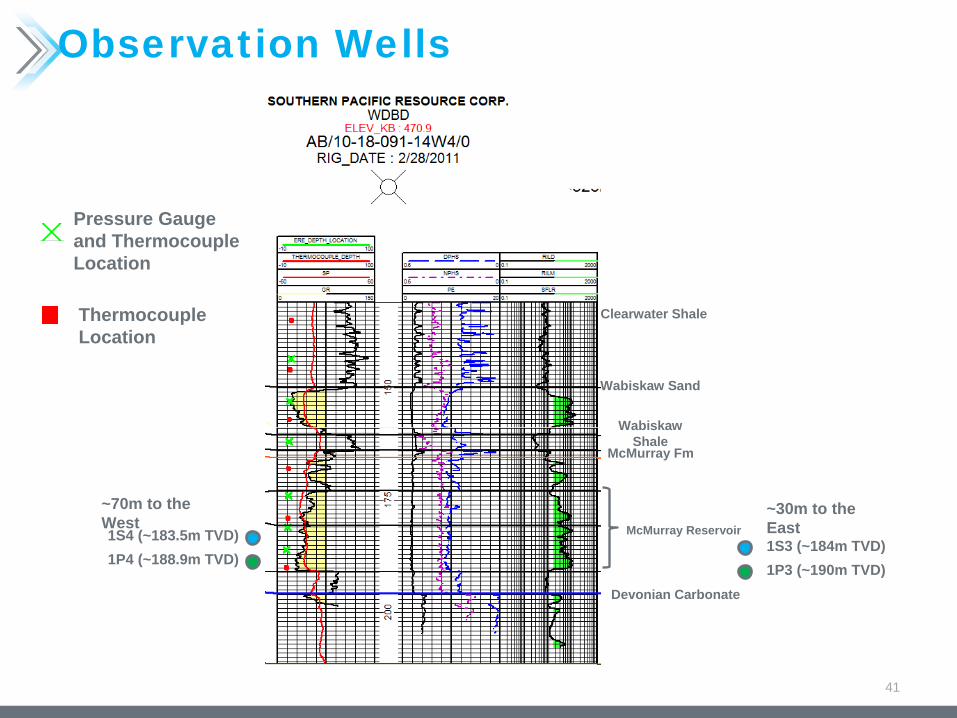
1P3 (~190m TVD) 1S3 (~184m TVD)
~30m to the East
1P4 (~188.9m TVD) 1S4 (~183.5m TVD)
~70m to the West
Wabiskaw Sand
McMurray Fm
McMurray Reservoir
Wabiskaw Shale
Devonian Carbonate
Clearwater Shale
Pressure Gauge and Thermocouple Location
ThermocoupleLocation
41
Observation Wells

Drilling and Completions – Pad 101 Wabiskaw Observation Well Design
42
TVD ~156mKB
High Temp Fibre run in coil string
Instrumentation in Wells
• Early time data & instrumentation issues. Surface issues resolved by September.
• Continuing to resolve instrumentation issues in the observation wells (non-reliable data points have been filtered).
• No appreciable temperature response in McMurray observation wells as of yet. Hottest temps ~20 Deg C.
• As expected Wabiskaw well has seen no temperature response
43
4D Seismic
• Will likely be utilized in the future.
• Acquired high quality 3D data in 2011 prior to start of steaming operations
• Timing of a 4D program is currently anticipated to be in Q1 2014
44

Scheme Performance
45
Scheme Performance
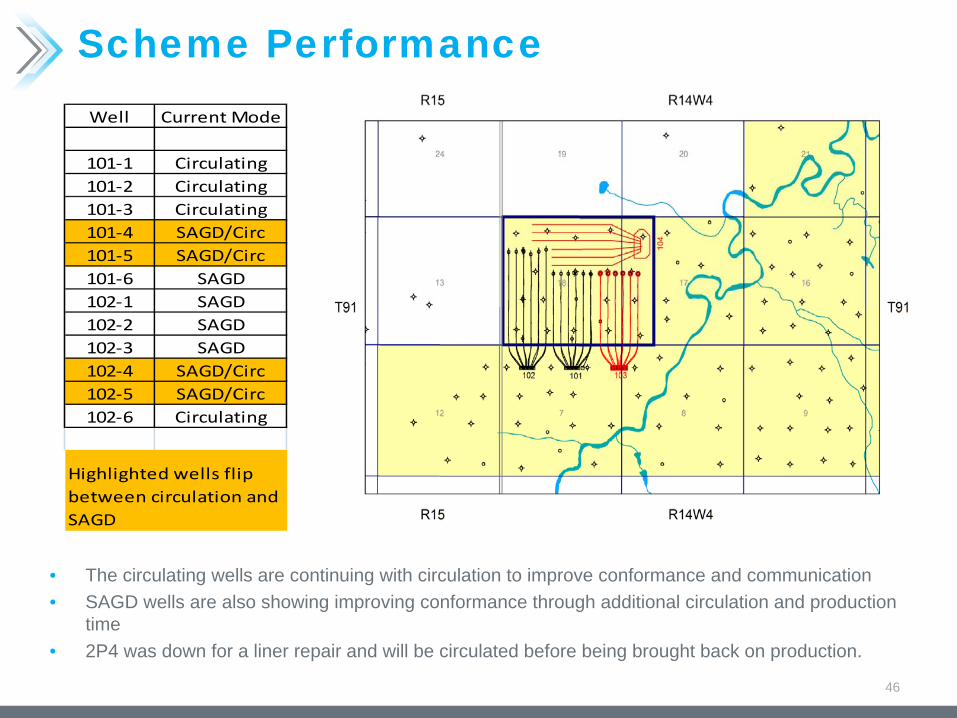
• The circulating wells are continuing with circulation to improve conformance and communication• SAGD wells are also showing improving conformance through additional circulation and production
time• 2P4 was down for a liner repair and will be circulated before being brought back on production.
46
Well Current Mode
101‐1 Circulating101‐2 Circulating101‐3 Circulating101‐4 SAGD/Circ101‐5 SAGD/Circ101‐6 SAGD102‐1 SAGD102‐2 SAGD102‐3 SAGD102‐4 SAGD/Circ102‐5 SAGD/Circ102‐6 Circulating
Highlighted wells flip between circulation and SAGD
Scheme Performance
47
0
5
10
15
20
25
30
35
40
45
50
0
500
1,000
1,500
2,000
2,500
Jul 12 Aug 12 Sep 12 Oct 12 Nov 12 Dec 12 Jan 13
SOR
Fluid Rate (m
3/d)
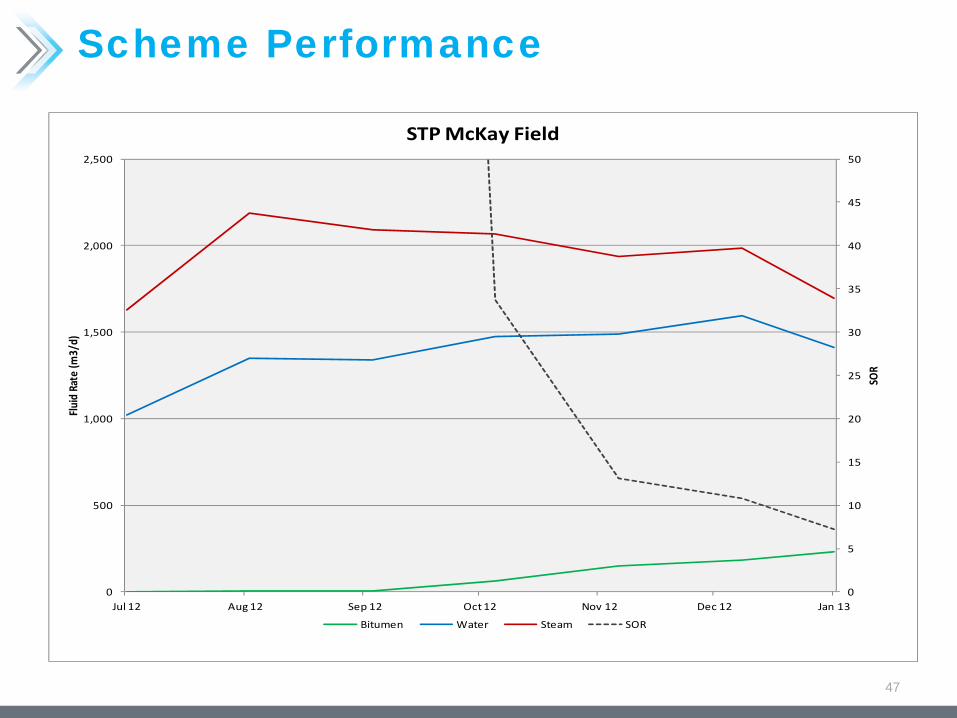
STP McKay Field
Bitumen Water Steam SOR
Scheme Performance
48
0
5
10
15
20
25
30
35
40
45
50
0
100
200
300
400
500
600
700
800
900
1000
Jul 12 Aug 12 Sep 12 Oct 12 Nov 12 Dec 12 Jan 13
SOR (%
)
Fluid Rate (m
3/d)
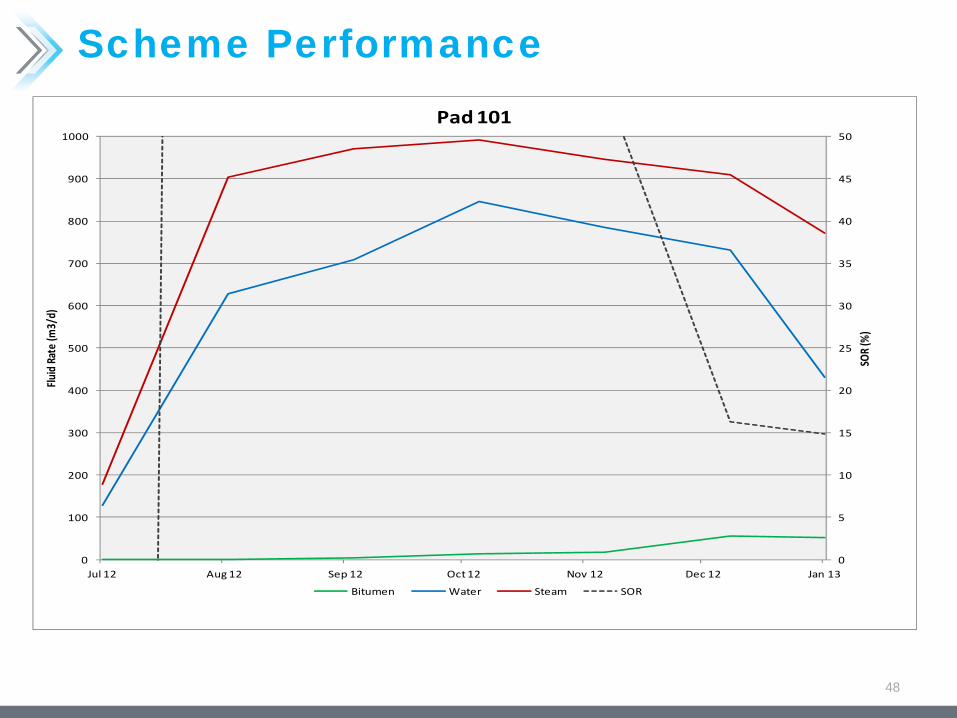
Pad 101
Bitumen Water Steam SOR
Scheme Performance
49
0
5
10
15
20
25
30
35
40
45
50
0
200
400
600
800
1,000
1,200
1,400
Jul 12 Aug 12 Sep 12 Oct 12 Nov 12 Dec 12 Jan 13
SOR
Fluid Rate m3/d
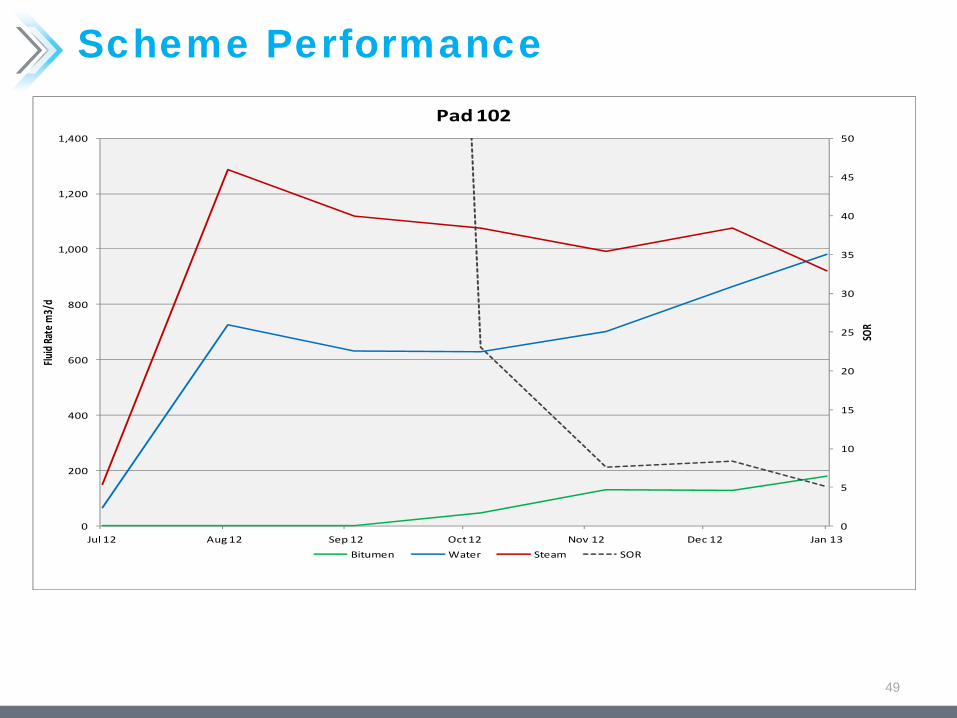
Pad 102
Bitumen Water Steam SOR
Scheme Performance
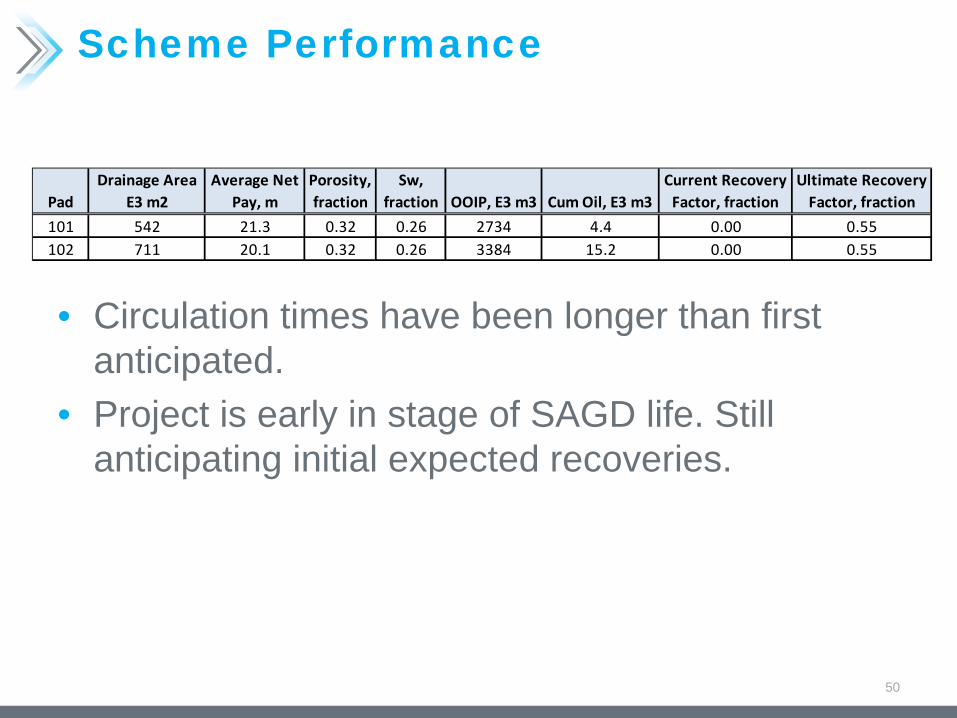
• Circulation times have been longer than first anticipated.
• Project is early in stage of SAGD life. Still anticipating initial expected recoveries.
50
PadDrainage Area
E3 m2Average Net
Pay, mPorosity, fraction
Sw, fraction OOIP, E3 m3 Cum Oil, E3 m3
Current Recovery Factor, fraction
Ultimate Recovery Factor, fraction
101 542 21.3 0.32 0.26 2734 4.4 0.00 0.55102 711 20.1 0.32 0.26 3384 15.2 0.00 0.55
Scheme Performance Pattern Examples Based on Recovery to Date
• Oil forecasting is based on theoretical flow equations for growing steam chambers (Butler)
• All examples below are based on cumulative recovery to date and not necessarily expected ultimate recovery.
51
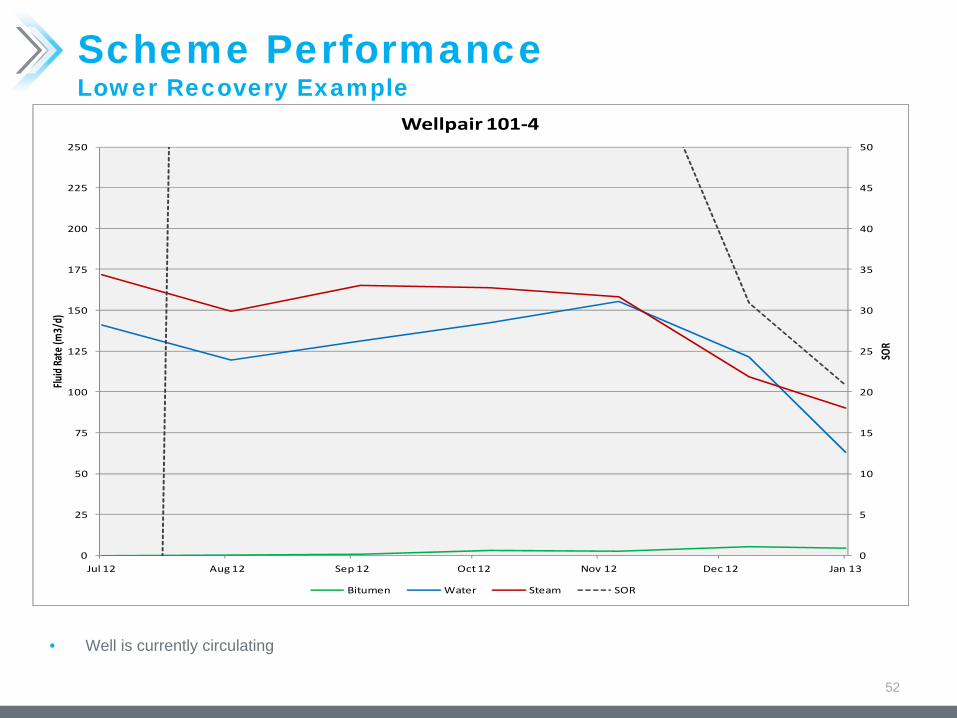
Scheme Performance Lower Recovery Example
• Well is currently circulating
52
0
5
10
15
20
25
30
35
40
45
50
0
25
50
75
100
125
150
175
200
225
250
Jul 12 Aug 12 Sep 12 Oct 12 Nov 12 Dec 12 Jan 13
SOR
Fluid Rate (m
3/d)
Wellpair 101‐4
Bitumen Water Steam SOR
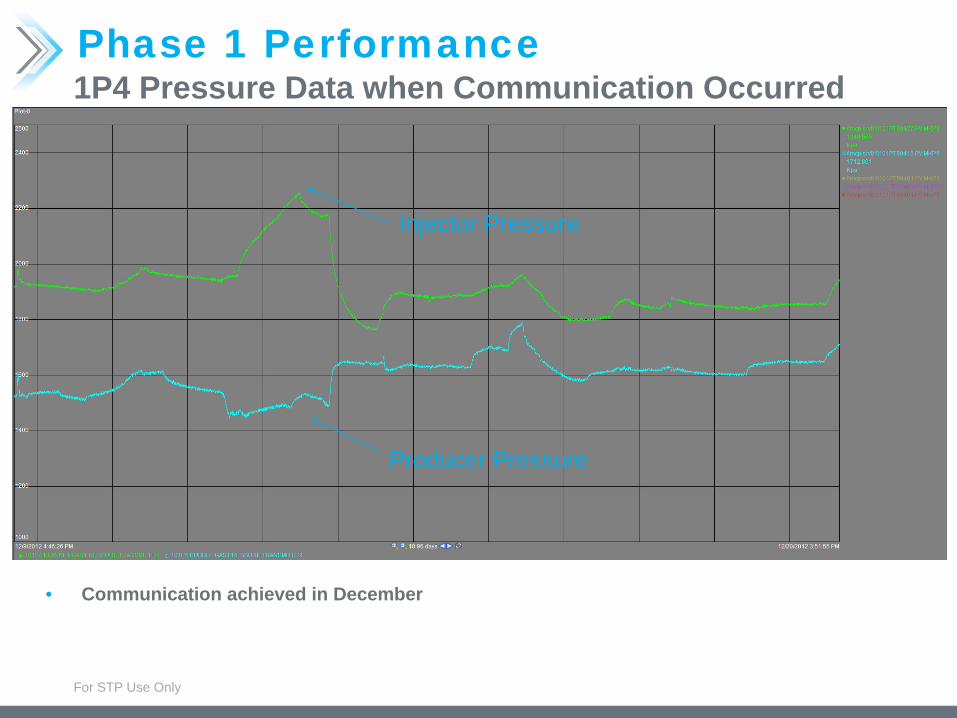
Phase 1 Performance1P4 Pressure Data when Communication Occurred
• Communication achieved in December
Injector Pressure
Producer Pressure
For STP Use Only
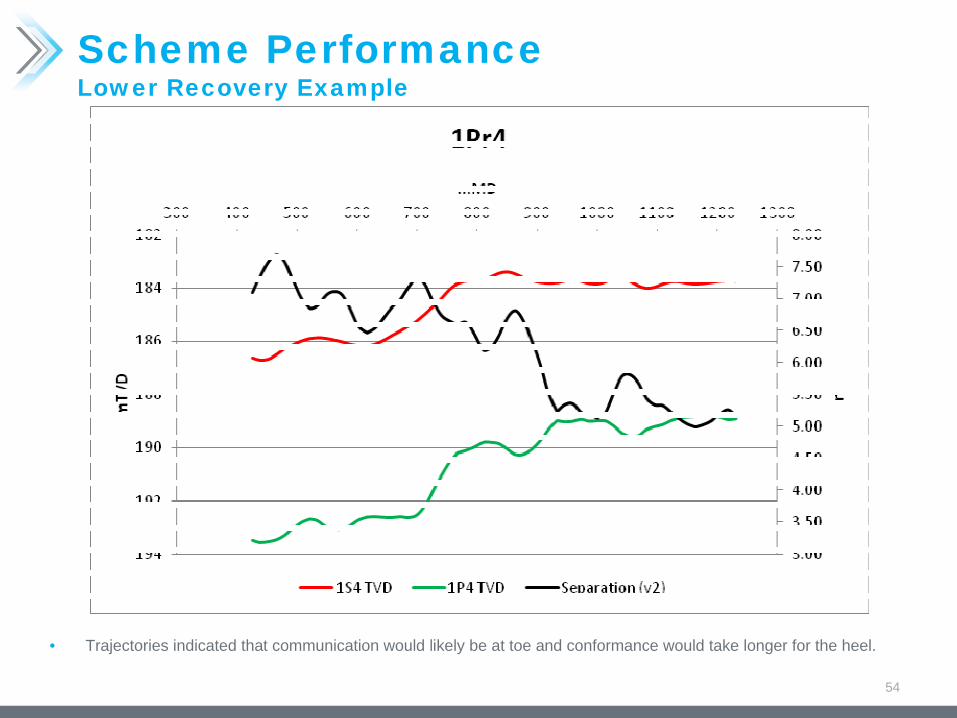
Scheme Performance Lower Recovery Example
• Trajectories indicated that communication would likely be at toe and conformance would take longer for the heel.
54
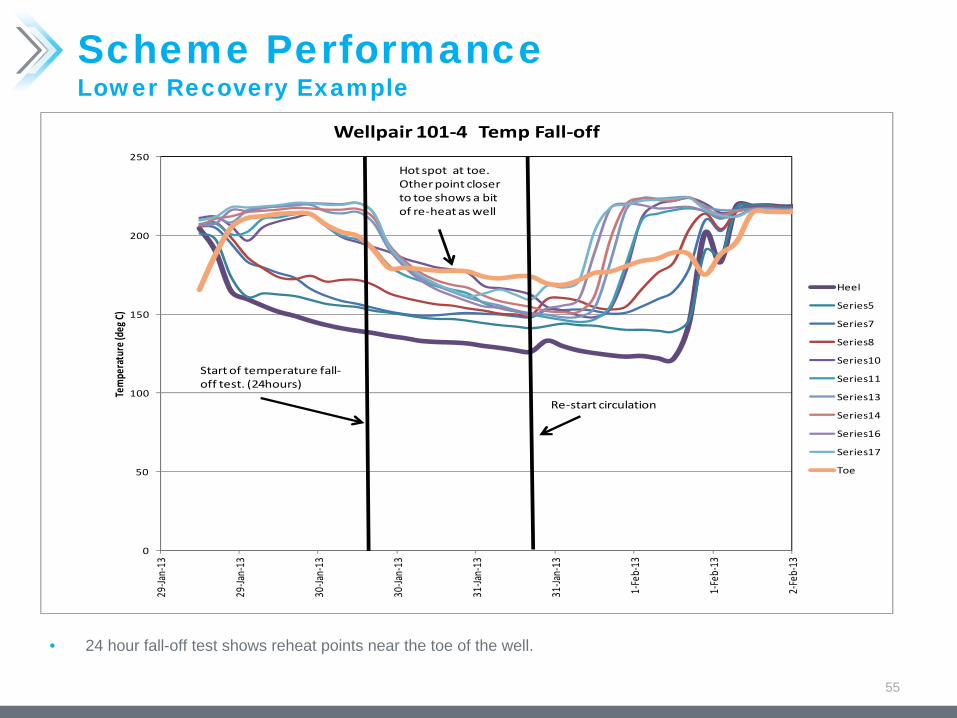
Scheme Performance Lower Recovery Example
• 24 hour fall-off test shows reheat points near the toe of the well.
55
0
50
100
150
200
25029
‐Jan‐13
29‐Ja
n‐13
30‐Ja
n‐13
30‐Ja
n‐13
31‐Ja
n‐13
31‐Ja
n‐13
1‐Feb‐13
1‐Feb‐13
2‐Feb‐13
Tempe
rature (deg
C)
Wellpair 101‐4 Temp Fall‐off
Heel
Series5
Series7
Series8
Series10
Series11
Series13
Series14
Series16
Series17
Toe
Start of temperature fall‐off test. (24hours)
Re‐start circulation
Hot spot at toe. Other point closer to toe shows a bit of re‐heatas well
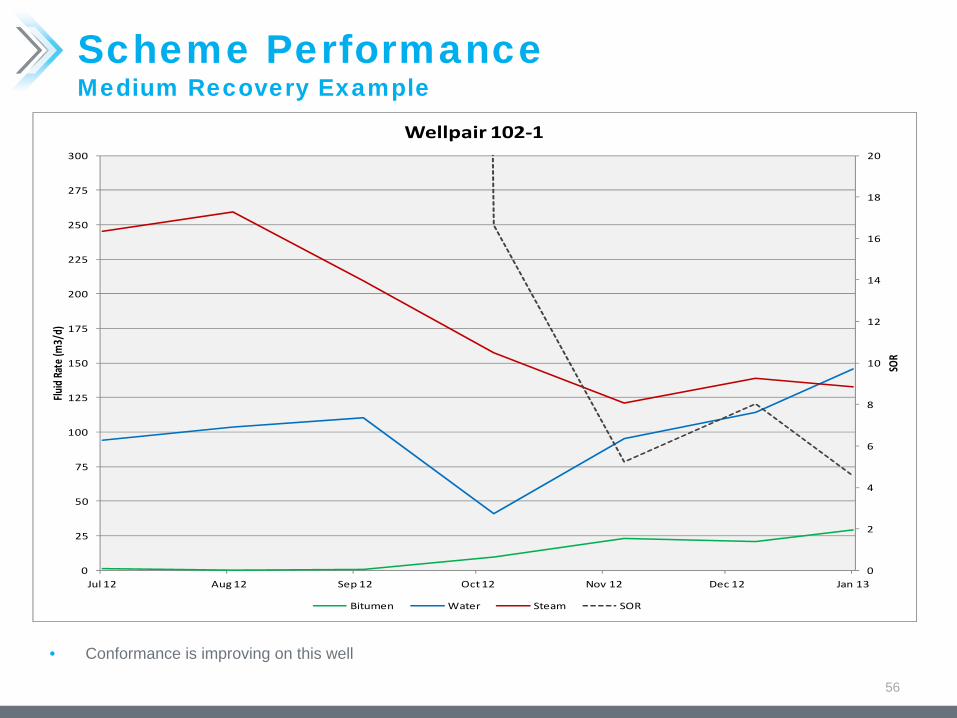
Scheme Performance Medium Recovery Example
• Conformance is improving on this well
56
0
2
4
6
8
10
12
14
16
18
20
0
25
50
75
100
125
150
175
200
225
250
275
300
Jul 12 Aug 12 Sep 12 Oct 12 Nov 12 Dec 12 Jan 13
SOR
Fluid Rate (m
3/d)
Wellpair 102‐1
Bitumen Water Steam SOR
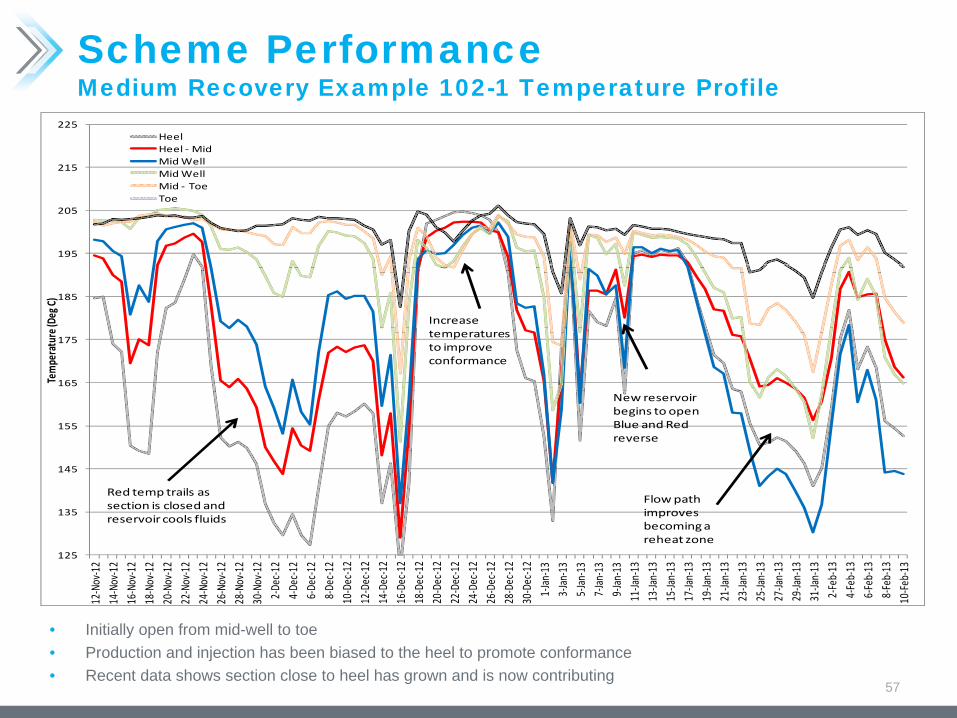
Scheme Performance Medium Recovery Example 102-1 Temperature Profile
• Initially open from mid-well to toe• Production and injection has been biased to the heel to promote conformance• Recent data shows section close to heel has grown and is now contributing
57
125
135
145
155
165
175
185
195
205
215
225
12‐Nov
‐12
14‐Nov
‐12
16‐Nov
‐12
18‐Nov
‐12
20‐Nov
‐12
22‐Nov
‐12
24‐Nov
‐12
26‐Nov
‐12
28‐Nov
‐12
30‐Nov
‐12
2‐De
c‐12
4‐De
c‐12
6‐De
c‐12
8‐De
c‐12
10‐Dec
‐12
12‐Dec
‐12
14‐Dec
‐12
16‐Dec
‐12
18‐Dec
‐12
20‐Dec
‐12
22‐De c‐12
24‐Dec
‐12
26‐Dec
‐12
28‐Dec
‐12
30‐Dec
‐12
1‐Jan‐13
3‐Jan‐13
5‐Jan‐13
7‐Jan‐13
9‐Jan‐13
11‐Ja
n‐13
13‐Ja
n‐13
15‐Ja
n‐13
17‐Ja
n‐13
19‐Ja
n‐13
21‐Ja
n‐13
23‐Ja
n‐13
25‐Ja
n‐13
27‐Ja
n‐13
29‐Ja
n‐13
31‐Ja
n‐13
2‐Feb‐13
4‐Feb‐13
6‐Feb‐13
8‐Feb‐13
10‐Feb
‐13
Tempe
rature (D
eg C)
Heel Heel ‐MidMid WellMid WellMid ‐ ToeToe
Red temp trails as section is closed and reservoir cools fluids
Increasetemperatures to improve conformance
New reservoirbegins to open Blue and Red reverse
Flow path improves becominga reheat zone
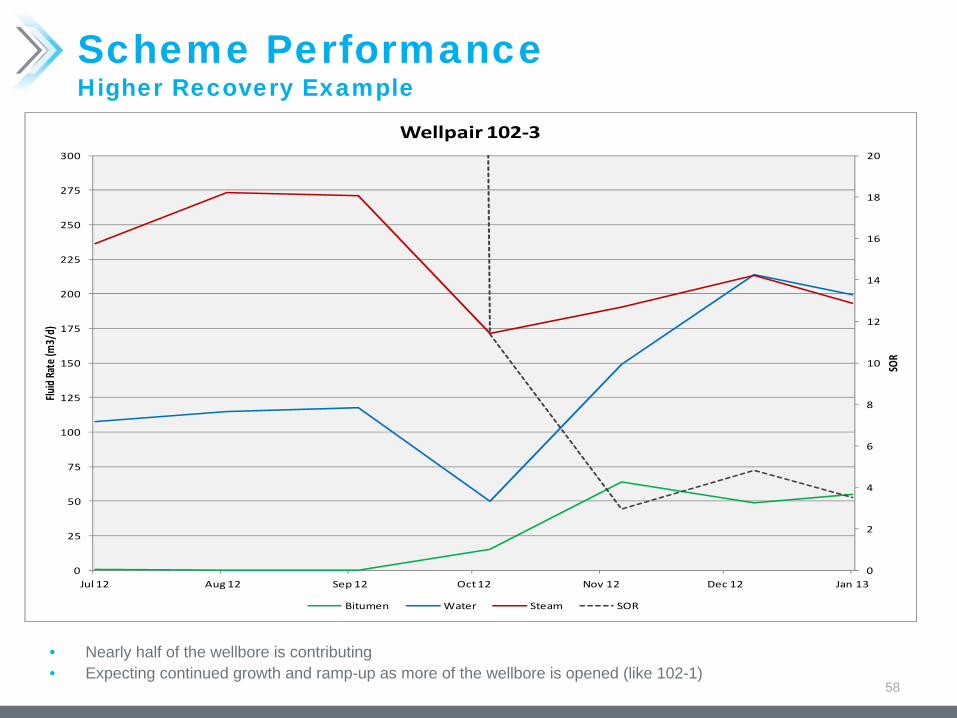
Scheme Performance Higher Recovery Example
• Nearly half of the wellbore is contributing• Expecting continued growth and ramp-up as more of the wellbore is opened (like 102-1)
58
0
2
4
6
8
10
12
14
16
18
20
0
25
50
75
100
125
150
175
200
225
250
275
300
Jul 12 Aug 12 Sep 12 Oct 12 Nov 12 Dec 12 Jan 13
SOR
Fluid Rate (m
3/d)
Wellpair 102‐3
Bitumen Water Steam SOR
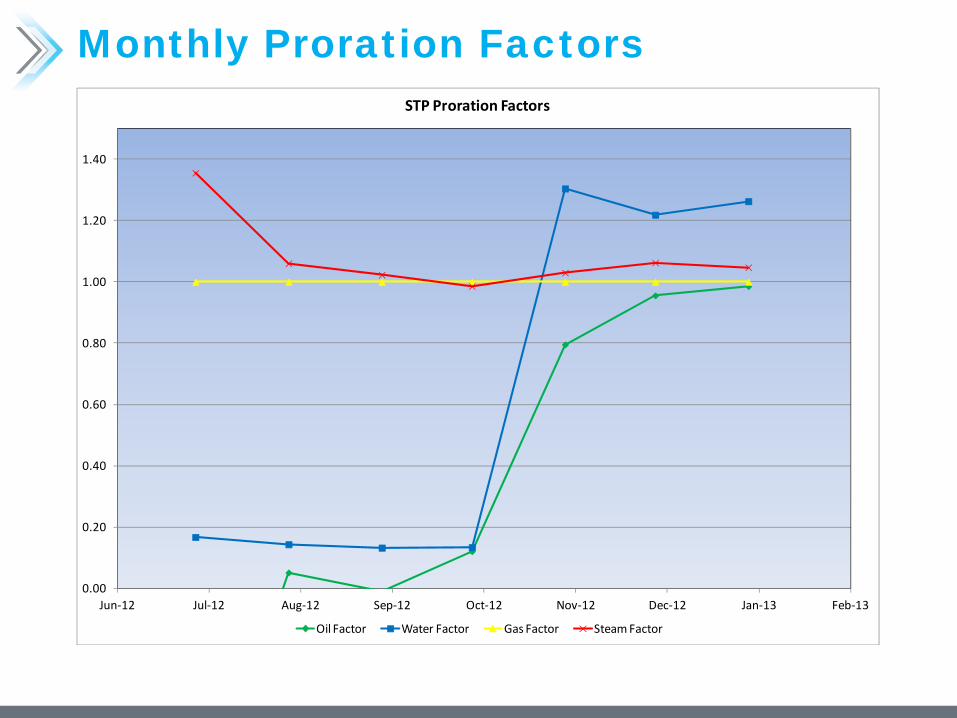
Monthly Proration Factors
0.00
0.20
0.40
0.60
0.80
1.00
1.20
1.40
Jun‐12 Jul‐12 Aug‐12 Sep‐12 Oct‐12 Nov‐12 Dec‐12 Jan‐13 Feb‐13
STP Proration Factors
Oil Factor Water Factor Gas Factor Steam Factor
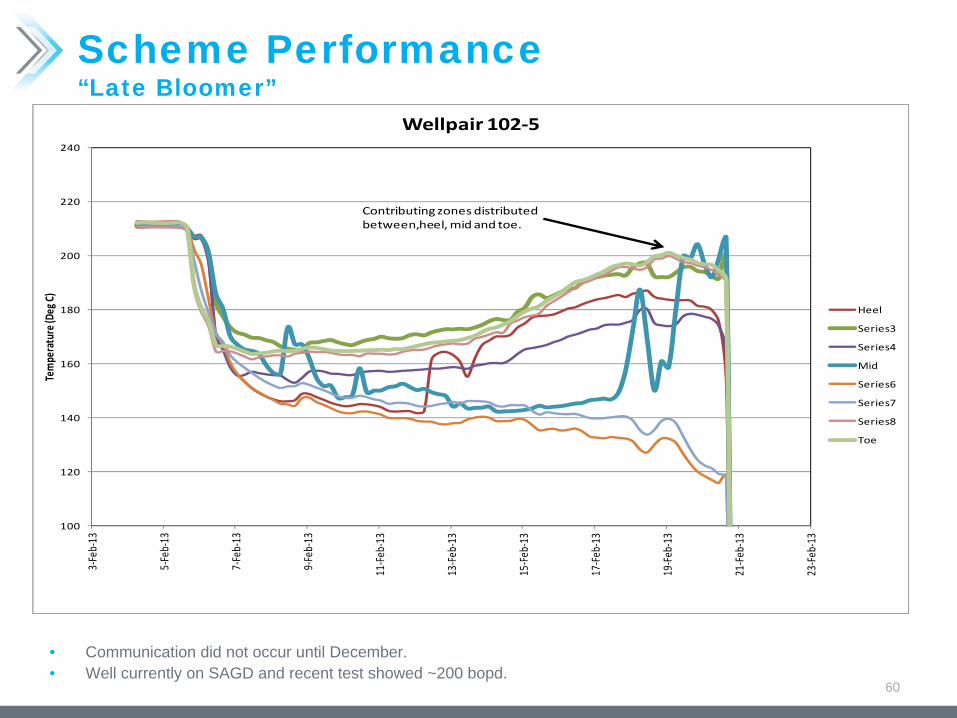
Scheme Performance “Late Bloomer”
• Communication did not occur until December.• Well currently on SAGD and recent test showed ~200 bopd.
60
100
120
140
160
180
200
220
240
3‐Feb‐13
5‐Feb‐13
7‐Feb‐13
9‐Feb‐13
11‐Feb
‐13
13‐Feb
‐13
15‐Feb
‐13
17‐Feb
‐13
19‐Feb
‐13
21‐Feb
‐13
23‐Feb
‐13
Tempe
rature (D
eg C)
Wellpair 102‐5
Heel
Series3
Series4
Mid
Series6
Series7
Series8
Toe
Contributing zones distributed between,heel, mid and toe.
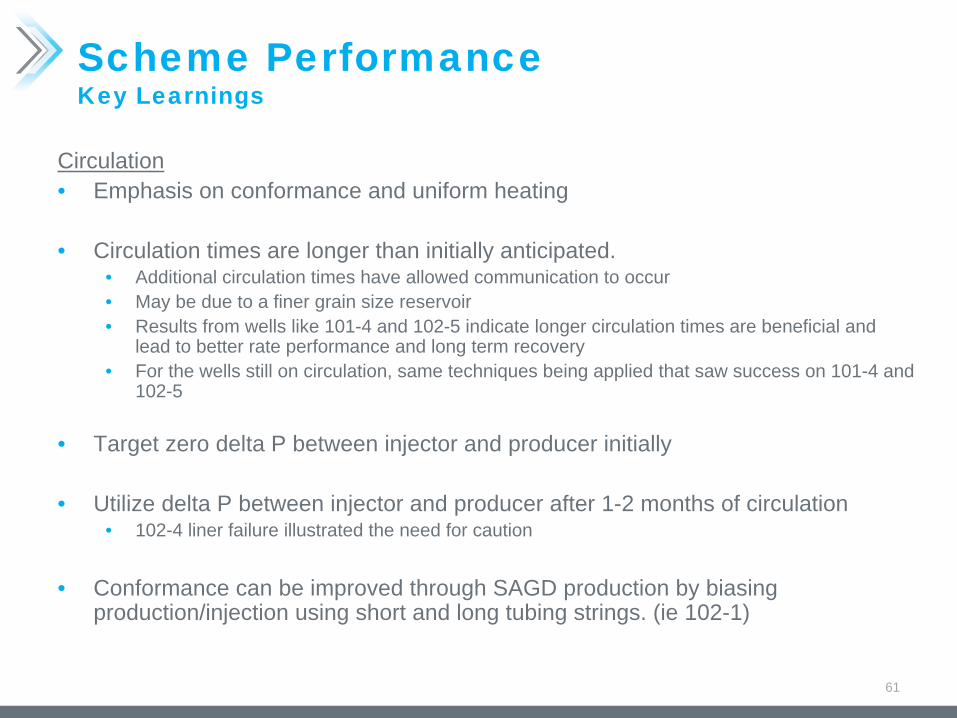
Scheme Performance Key Learnings
Circulation• Emphasis on conformance and uniform heating
• Circulation times are longer than initially anticipated.• Additional circulation times have allowed communication to occur• May be due to a finer grain size reservoir• Results from wells like 101-4 and 102-5 indicate longer circulation times are beneficial and
lead to better rate performance and long term recovery• For the wells still on circulation, same techniques being applied that saw success on 101-4 and
102-5
• Target zero delta P between injector and producer initially
• Utilize delta P between injector and producer after 1-2 months of circulation• 102-4 liner failure illustrated the need for caution
• Conformance can be improved through SAGD production by biasing production/injection using short and long tubing strings. (ie 102-1)
61
Subsurface Future Plans
• Drilling 6 well pairs from Pad 103 and 6 well pairs from Pad 104.
• Finishing 2013 delineation well program. Delineation wells also planned for 2014.
• Future 4D seismic program.
• Continued development plan for Phase 1, Phase 1 Expansion and Phase 2.
• Monitor Wabiskaw temperatures for optimal development timeframe.
62
Surface Facilities & Environmental Table of Contents
1. Facilities2. Measurement Accounting & Reporting Plan3. Water Sources & Uses4. Water Treatment5. Environmental Summary6. Compliance Statement7. 2012 Regulatory Summary8. Future Plans
63
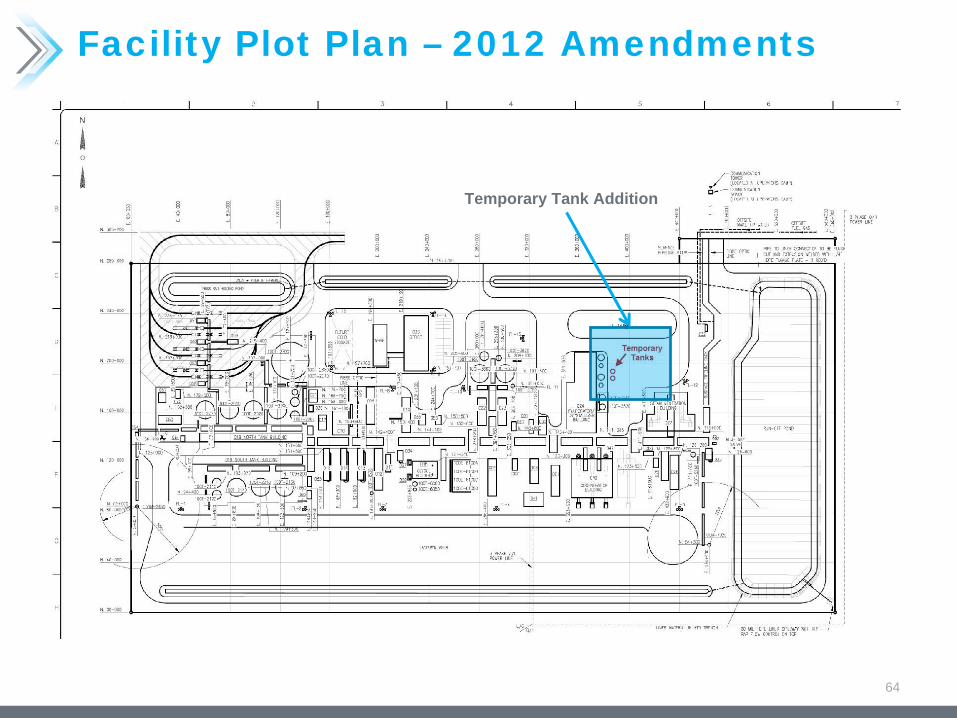
Facility Plot Plan – 2012 Amendments
64
Temporary Tank Addition

Facilities – Simplified Volumetric Block Flow Diagram
65
Facilities - Amendments Discussion
66
• 40,000 bbl tank addition (approved) – Increase storage capacity to improve operational flexibility associated with sales oil & diluent trucking operation.
• Addition of two 400 bbl temporary tanks (in place) required to manage waste volumes generated during maintenance and cleaning of the evaporators.
Measurement/Reporting
67
General• Annual MARP Update submitted March 1, 2012 (2013 update to be submitted by end of
February with minimal changes).• Review of Controls for EPAP Declaration completed, declaration submitted February 21st. Work
to date indicates that the majority of measurement related controls are adequate and functioning as intended. 2013 Remediation Plan developed for areas of concern identified.
• Accurate produced gas measurement at high lift gas use (>60:1 Sm3 gas / Sm3 emulsion) and high facility turndown during startup (low rates & GOR) has been a challenge. Expect gas measurement concerns to alleviate as rates ramp.
Well Production / Injection Volumes• Well production is prorated from bulk scheme production using intermittent test data via
dedicated test separators on Pads 101 and 102. (6 pairs per separator)• Wells will meet or exceed the current minimum well test requirements per Directive 17 (1 test
hour per 20 operating hours). With six producers per pad, 11 testing hours every three days is targeted for each operating producer (12 hour test duration – 1 hour flush, 11 hours test data).
• Manual samples are taken to determine bitumen, water, solids and chloride content and have proven reliable and repeatable.
• Inline BS&W currently used as backup, however is sensitive to produced water salinity and is difficult to keep meter properly calibrated due to salinity swings while the wells are in start-up mode.
Measurement/Reporting
68
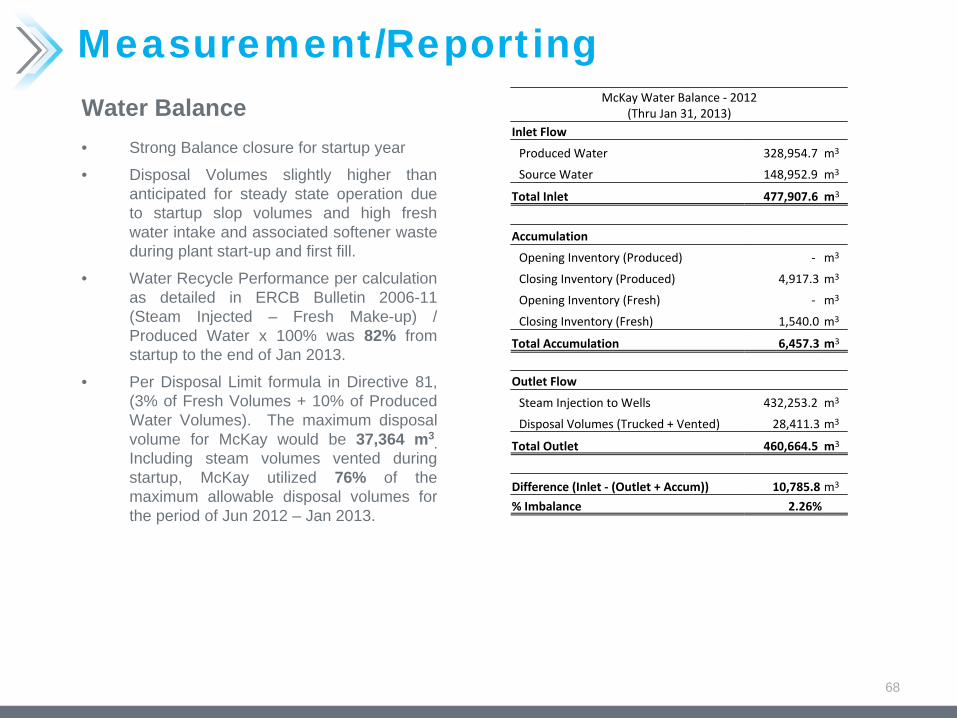
Water Balance• Strong Balance closure for startup year
• Disposal Volumes slightly higher than anticipated for steady state operation due to startup slop volumes and high fresh water intake and associated softener waste during plant start-up and first fill.
• Water Recycle Performance per calculation as detailed in ERCB Bulletin 2006-11 (Steam Injected – Fresh Make-up) / Produced Water x 100% was 82% from startup to the end of Jan 2013.
• Per Disposal Limit formula in Directive 81, (3% of Fresh Volumes + 10% of Produced Water Volumes). The maximum disposal volume for McKay would be 37,364 m3
. Including steam volumes vented during startup, McKay utilized 76% of the maximum allowable disposal volumes for the period of Jun 2012 – Jan 2013.
McKay Water Balance ‐
2012
(Thru Jan 31, 2013)Inlet Flow
Produced Water 328,954.7 m3
Source Water 148,952.9 m3
Total Inlet 477,907.6 m3
Accumulation
Opening Inventory (Produced) ‐ m3
Closing Inventory (Produced) 4,917.3 m3
Opening Inventory (Fresh) ‐ m3
Closing Inventory (Fresh) 1,540.0 m3
Total Accumulation 6,457.3 m3
Outlet Flow
Steam Injection to Wells 432,253.2 m3
Disposal Volumes (Trucked + Vented) 28,411.3 m3
Total Outlet 460,664.5 m3
Difference (Inlet ‐
(Outlet + Accum)) 10,785.8 m3
% Imbalance 2.26%
Steam Generation
69
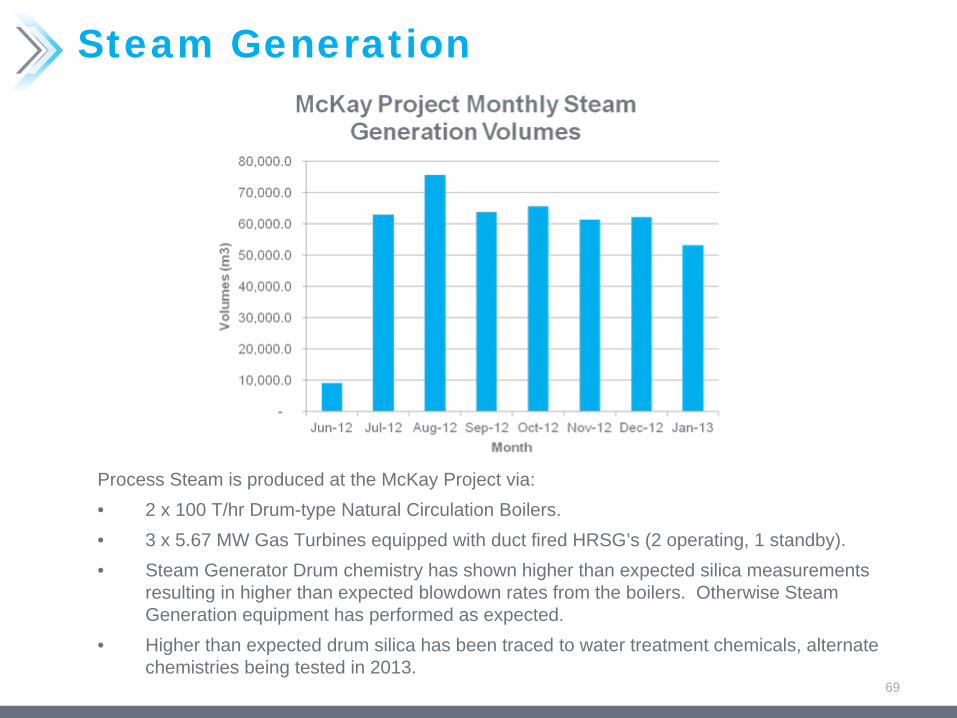
Process Steam is produced at the McKay Project via:• 2 x 100 T/hr Drum-type Natural Circulation Boilers.• 3 x 5.67 MW Gas Turbines equipped with duct fired HRSG’s (2 operating, 1 standby).• Steam Generator Drum chemistry has shown higher than expected silica measurements
resulting in higher than expected blowdown rates from the boilers. Otherwise Steam Generation equipment has performed as expected.
• Higher than expected drum silica has been traced to water treatment chemicals, alternate chemistries being tested in 2013.
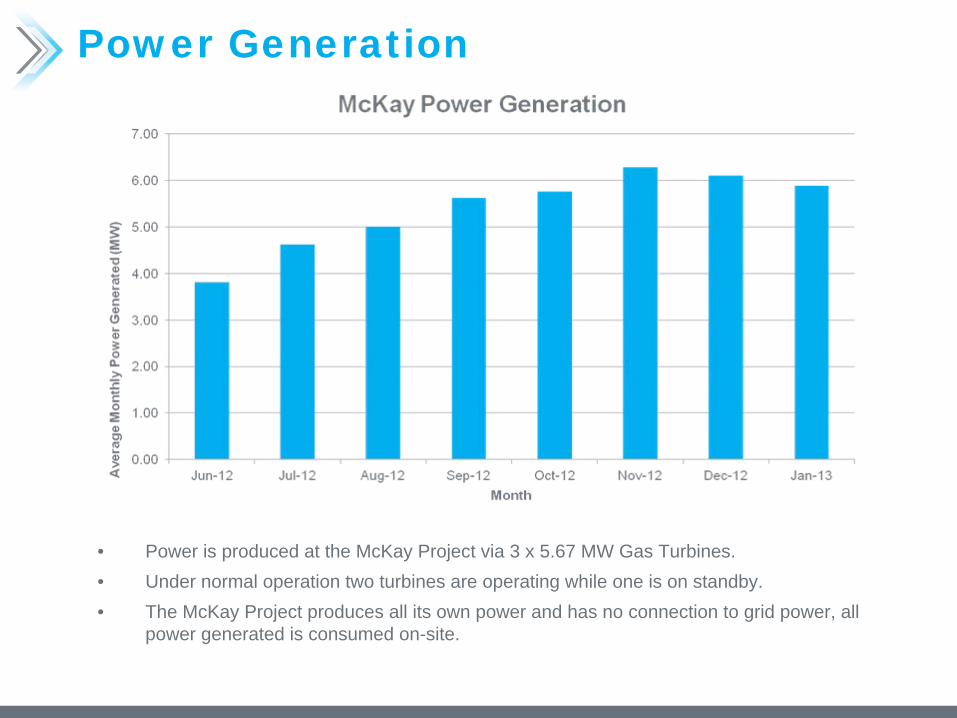
Power Generation
• Power is produced at the McKay Project via 3 x 5.67 MW Gas Turbines.• Under normal operation two turbines are operating while one is on standby.• The McKay Project produces all its own power and has no connection to grid power, all
power generated is consumed on-site.
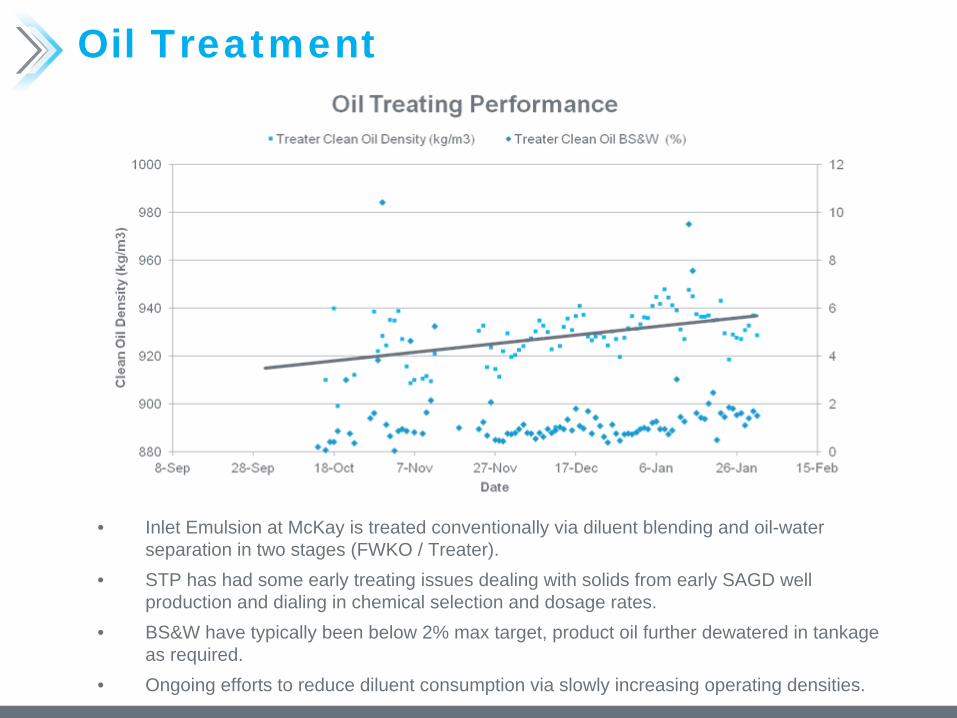
Oil Treatment
• Inlet Emulsion at McKay is treated conventionally via diluent blending and oil-water separation in two stages (FWKO / Treater).
• STP has had some early treating issues dealing with solids from early SAGD well production and dialing in chemical selection and dosage rates.
• BS&W have typically been below 2% max target, product oil further dewatered in tankage as required.
• Ongoing efforts to reduce diluent consumption via slowly increasing operating densities.
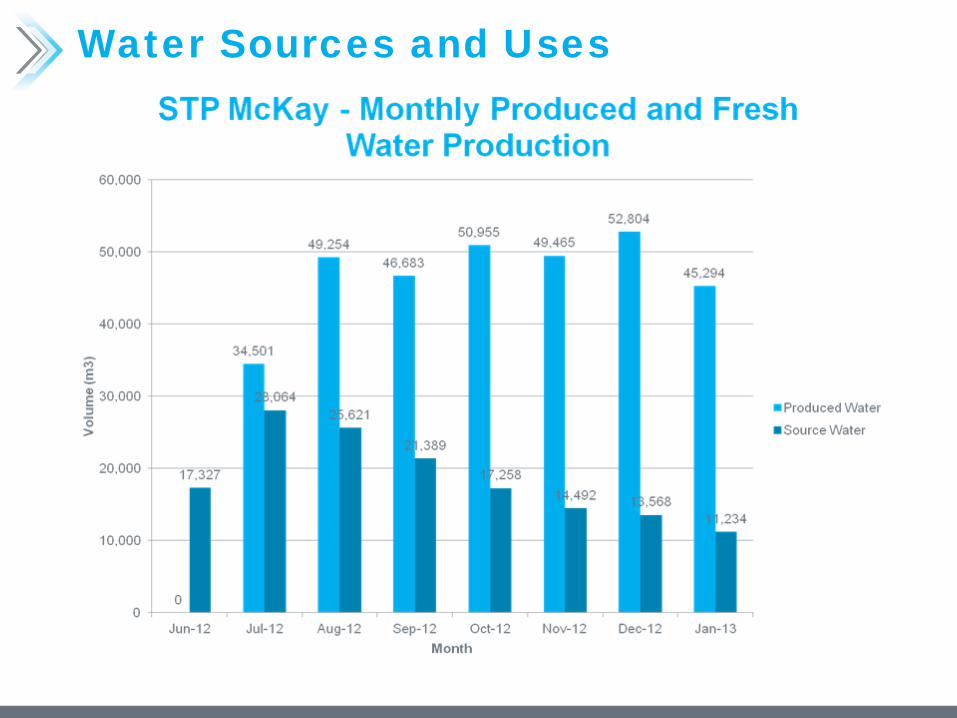
Water Sources & Uses
72
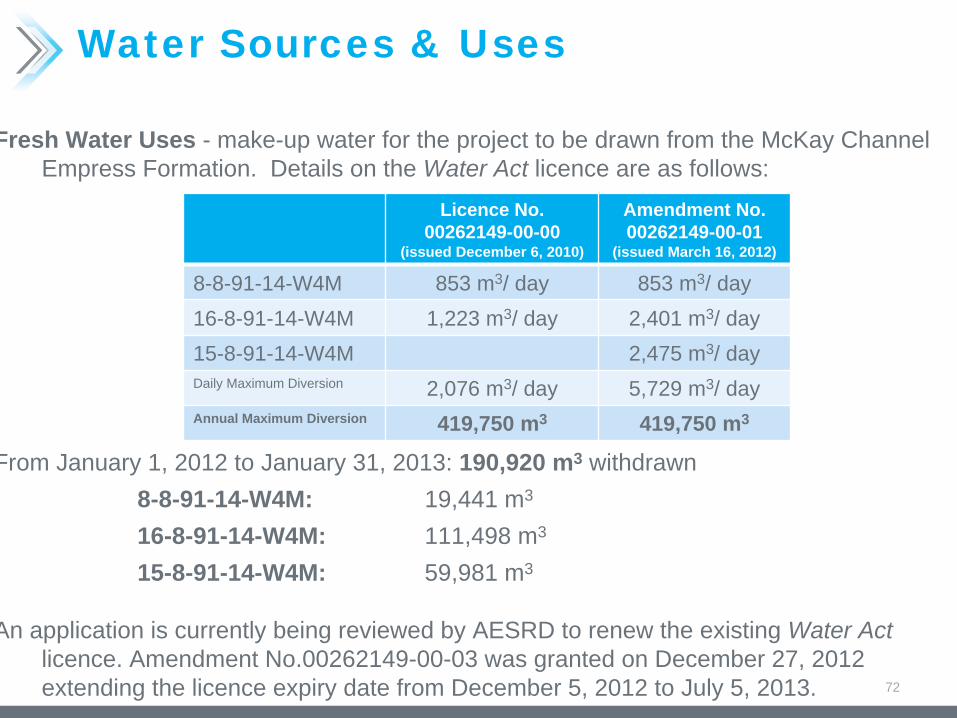
Fresh Water Uses - make-up water for the project to be drawn from the McKay Channel Empress Formation. Details on the Water Act licence are as follows:
From January 1, 2012 to January 31, 2013: 190,920 m3 withdrawn8-8-91-14-W4M: 19,441 m3
16-8-91-14-W4M: 111,498 m3
15-8-91-14-W4M: 59,981 m3
An application is currently being reviewed by AESRD to renew the existing Water Act licence. Amendment No.00262149-00-03 was granted on December 27, 2012 extending the licence expiry date from December 5, 2012 to July 5, 2013.
Licence No.00262149-00-00
(issued December 6, 2010)
Amendment No.00262149-00-01
(issued March 16, 2012)
8-8-91-14-W4M 853 m3/ day 853 m3/ day16-8-91-14-W4M 1,223 m3/ day 2,401 m3/ day15-8-91-14-W4M 2,475 m3/ dayDaily Maximum Diversion 2,076 m3/ day 5,729 m3/ dayAnnual Maximum Diversion 419,750 m3 419,750 m3
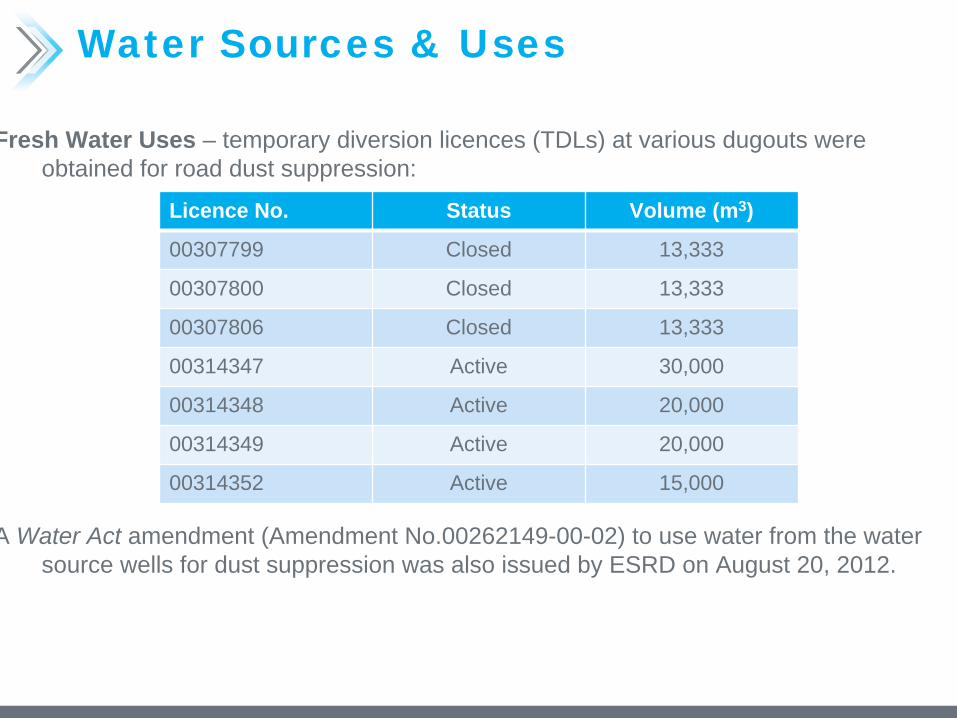
Water Sources & Uses
Fresh Water Uses – temporary diversion licences (TDLs) at various dugouts were obtained for road dust suppression:
A Water Act amendment (Amendment No.00262149-00-02) to use water from the water source wells for dust suppression was also issued by ESRD on August 20, 2012.
Licence No. Status Volume (m3)
00307799 Closed 13,333
00307800 Closed 13,333
00307806 Closed 13,333
00314347 Active 30,000
00314348 Active 20,000
00314349 Active 20,000
00314352 Active 15,000
Water Sources and Uses
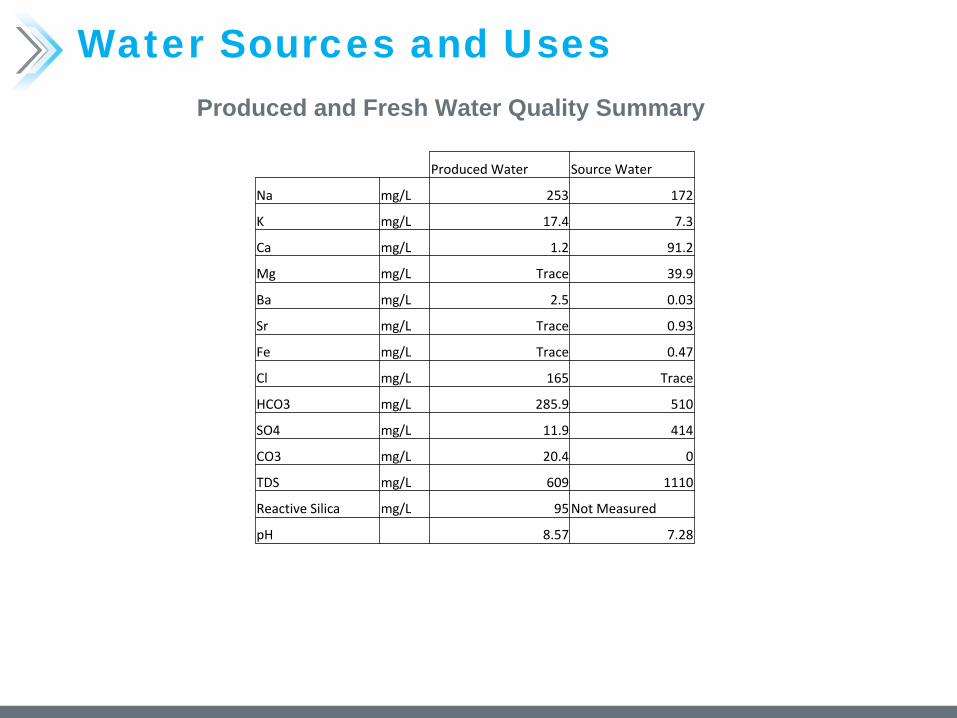
Water Sources and UsesProduced and Fresh Water Quality Summary
Produced Water Source Water
Na mg/L 253 172
K mg/L 17.4 7.3
Ca mg/L 1.2 91.2
Mg mg/L Trace 39.9
Ba mg/L 2.5 0.03
Sr mg/L Trace 0.93
Fe mg/L Trace 0.47
Cl mg/L 165 Trace
HCO3 mg/L 285.9 510
SO4 mg/L 11.9 414
CO3 mg/L 20.4 0
TDS mg/L 609 1110
Reactive Silica mg/L 95Not Measured
pH 8.57 7.28
Water Treatment
76
Water Treatment Technology•Mechanical Vapour Recompression (MVR) Evaporator technology is utilized for produced water treatment and production of boiler feedwater.•Feed to MVR System is pretreated with MgO to facilitate silica removal. Early performance is encouraging.•Make-up Water is treated using conventional cation exchange softening.•Evaporator concentrate is directed to a steam-driven crystallizer unit for further concentration and distillate recovery.
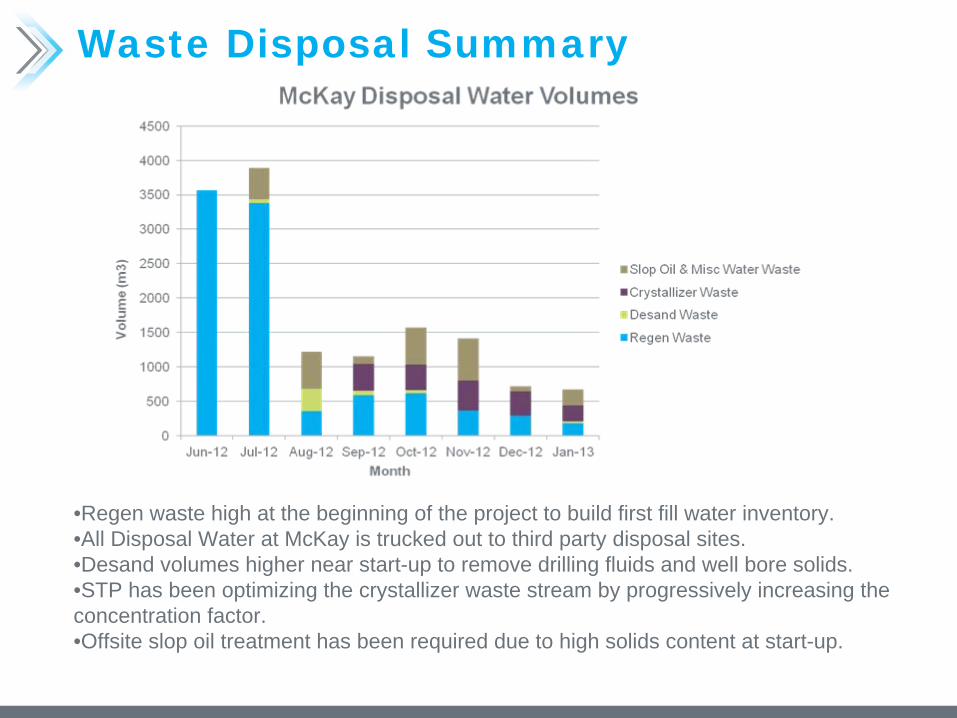
Waste Disposal Summary
•Regen waste high at the beginning of the project to build first fill water inventory.•All Disposal Water at McKay is trucked out to third party disposal sites.•Desand volumes higher near start-up to remove drilling fluids and well bore solids.•STP has been optimizing the crystallizer waste stream by progressively increasing the concentration factor.•Offsite slop oil treatment has been required due to high solids content at start-up.
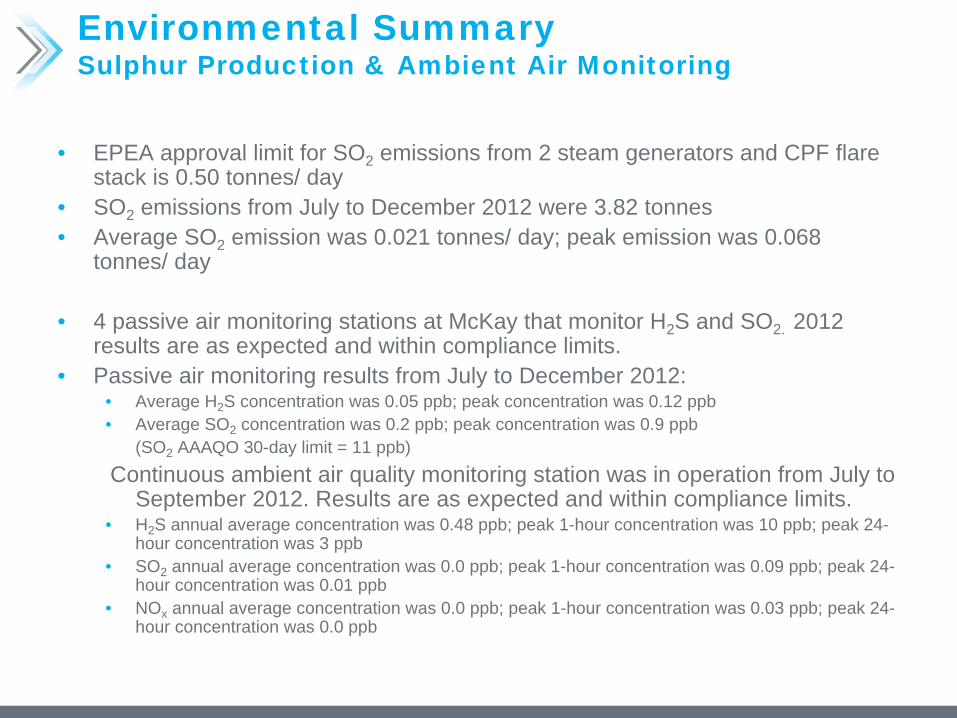
Environmental Summary Sulphur Production & Ambient Air Monitoring
• EPEA approval limit for SO2 emissions from 2 steam generators and CPF flare stack is 0.50 tonnes/ day
• SO2 emissions from July to December 2012 were 3.82 tonnes• Average SO2 emission was 0.021 tonnes/ day; peak emission was 0.068
tonnes/ day
• 4 passive air monitoring stations at McKay that monitor H2 S and SO2. 2012 results are as expected and within compliance limits.
• Passive air monitoring results from July to December 2012:• Average H2 S concentration was 0.05 ppb; peak concentration was 0.12 ppb• Average SO2 concentration was 0.2 ppb; peak concentration was 0.9 ppb
(SO2 AAAQO 30-day limit = 11 ppb)
Continuous ambient air quality monitoring station was in operation from July to September 2012. Results are as expected and within compliance limits.
• H2 S annual average concentration was 0.48 ppb; peak 1-hour concentration was 10 ppb; peak 24- hour concentration was 3 ppb
• SO2 annual average concentration was 0.0 ppb; peak 1-hour concentration was 0.09 ppb; peak 24- hour concentration was 0.01 ppb
• NOx annual average concentration was 0.0 ppb; peak 1-hour concentration was 0.03 ppb; peak 24- hour concentration was 0.0 ppb
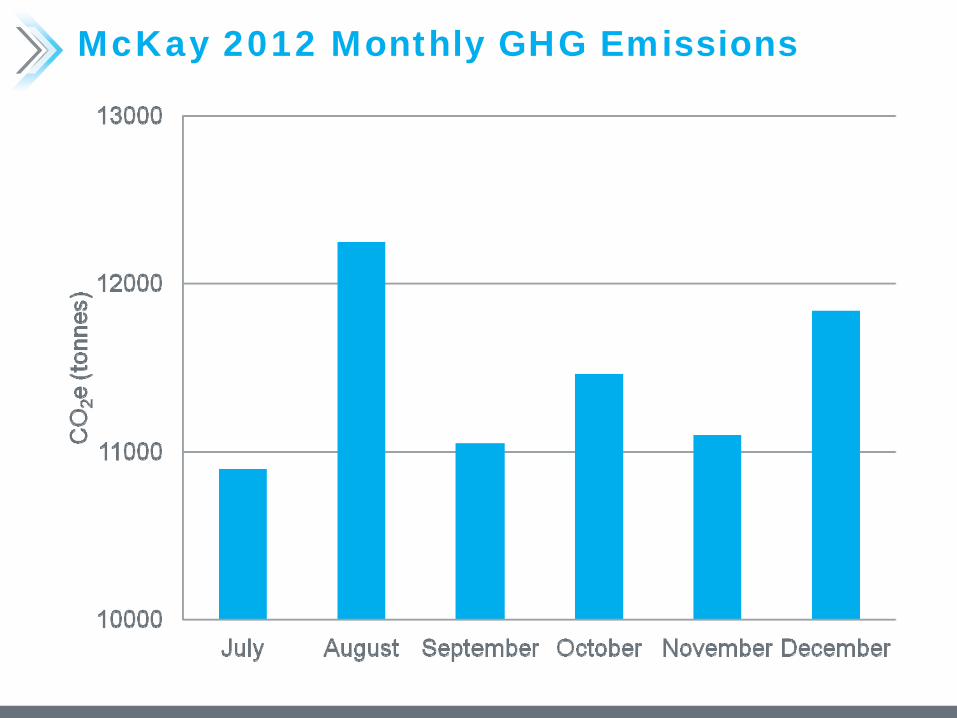
McKay 2012 Monthly GHG Emissions
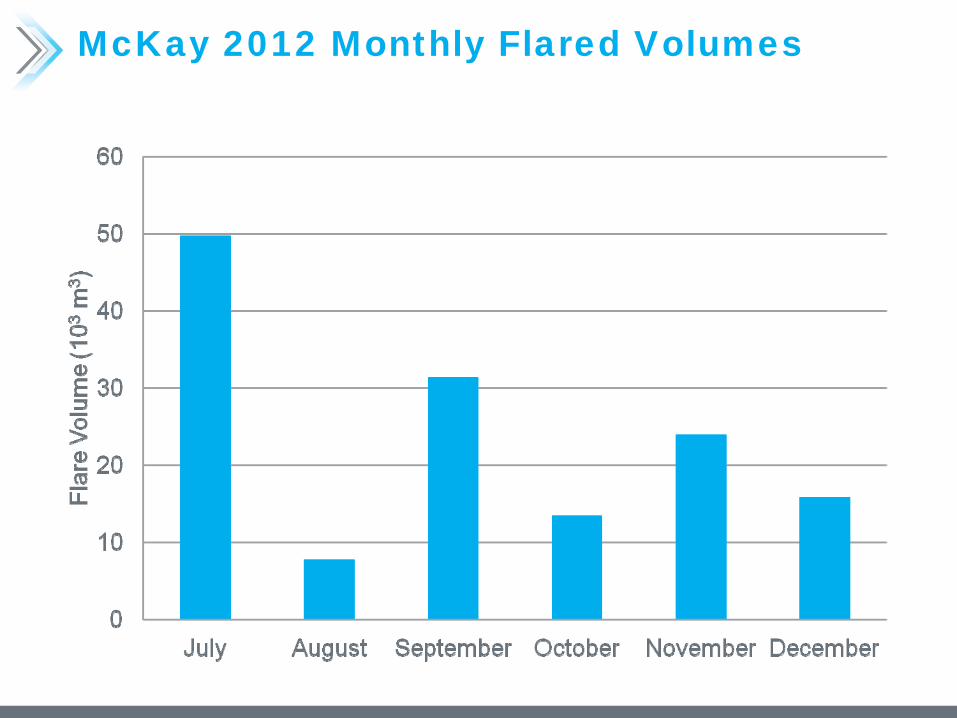
McKay 2012 Monthly Flared Volumes
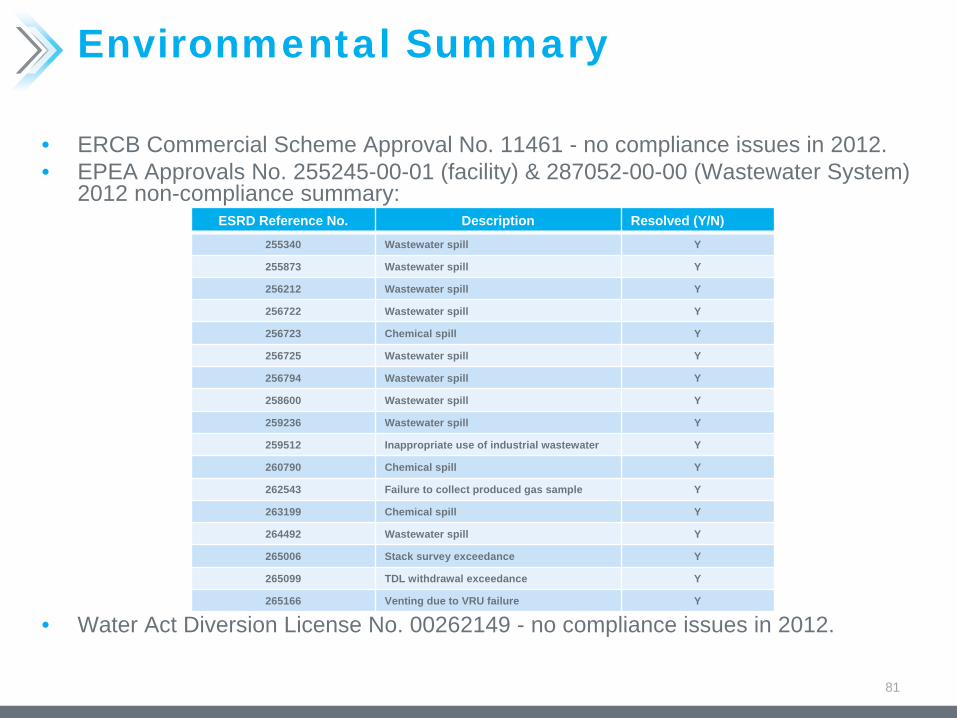
Environmental Summary
• ERCB Commercial Scheme Approval No. 11461 - no compliance issues in 2012.• EPEA Approvals No. 255245-00-01 (facility) & 287052-00-00 (Wastewater System)
2012 non-compliance summary:
• Water Act Diversion License No. 00262149 - no compliance issues in 2012.
81
ESRD Reference No. Description Resolved (Y/N)255340 Wastewater spill Y
255873 Wastewater spill Y
256212 Wastewater spill Y
256722 Wastewater spill Y
256723 Chemical spill Y
256725 Wastewater spill Y
256794 Wastewater spill Y
258600 Wastewater spill Y
259236 Wastewater spill Y
259512 Inappropriate use of industrial wastewater Y
260790 Chemical spill Y
262543 Failure to collect produced gas sample Y
263199 Chemical spill Y
264492 Wastewater spill Y
265006 Stack survey exceedance Y
265099 TDL withdrawal exceedance Y
265166 Venting due to VRU failure Y
Environmental Summary
Corporate Initiatives• Active member of the Oil Sands Developers Group (OSDG)• Active Member of Canadian Association of Petroleum Producers (CAPP)• Active member of the CAPP Joint Oil Sands Monitoring Initiative Committee (JOSM)• Funding member of the Alberta Biodiversity Monitoring Institute (ABMI) & Ecological
Monitoring Committee for the Lower Athabasca (EMCLA)• Chair of the Highway 63 / AOSTRA Road Traffic Impact Assessment Working Group• Active member of the Fort McKay Industry Relations Corporation (IRC)
82
Compliance Statement
83
Southern Pacific Resource Corp. is currently in compliance with all conditions of it’s OSCA and EPEA Approvals, the company is also aware of and meeting all of it’s regulatory requirements.
2012 Regulatory Summary• ERCB Pipeline Audit (License #P-53380) initiated on March 8, 2012 – no non-compliance issues
identified.• ESRD on-site approval audit conducted on December 11, 2012 – no non-compliance issues
identified.Key ERCB Filings• Directive 78, Category 2 Amendment Application - Addition of Pad 104 to the Commercial Scheme
Approval.Submitted on Oct. 21, 2011; Approved on Mar. 28, 2012
• Directive 78, Category 2 Amendment Application – Addition of 40,000 bbl tank to CPF.Submitted on Jan. 13, 2012; Approved on Mar. 28, 2012
• Directive 78, Category 3 Amendment Application – Addition of production from the Wabiskaw formation to the Commercial Scheme Approval.
Submitted on June. 22, 2012; Approval Pending
• Directive 78, Category 1 Amendment Application - Addition of two 400 bbl Temporary Tanks to CPF.
Submitted on Aug. 17, 2012; Approved on Dec. 11, 2012
Key ESRD Filings• Ambient Air Quality Monitoring Program
Submitted on Feb. 15, 2012; Approved on Apr. 19, 2012
• Wildlife Mitigation and Monitoring ProgramSubmitted on Feb. 28, 2012; Approved on July. 25, 2012
• Fugitive Emissions Leak Detection and Correction ProgramSubmitted on Nov. 29, 2012; Approved on Dec. 21, 2012
84
Future Plans
• Phase 1• Continue to pursue optimization opportunities in the plant and well pads.
• Phase 2 Expansion• Continue to advance the regulatory process.• Continue engineering design and development.• Continued stakeholder engagement.
85

QUESTIONS?
86

87Contact Information
Southern Pacific Resource Corp. Suite 1700, 205 - 5th Ave. SW
Calgary, AB T2P 2V7Phone: 403-269-5243
Fax: 403-269-5273Email: [email protected]
www.shpacific.com TSX:STP
For more information:Byron Lutes, President & CEO
[email protected] Clarke, COO
[email protected] Bolinger, CFO