
2012-13 Second Interim
19
Western Placer Unified School District Board of Trustees March 19, 2013
-
Upload
philip-joyce -
Category
Documents
-
view
33 -
download
0
description
2012-13 Second Interim. Western Placer Unified School District Board of Trustees March 19, 2013. Second Interim - Certification. - PowerPoint PPT Presentation
Transcript of 2012-13 Second Interim

Western Placer Unified School District
Board of TrusteesMarch 19, 2013

Second Interim - CertificationThe district’s Board of Trustees shall certify in writing whether
or not the district is able to meet its financial obligations for the remainder of the fiscal year and, based on current forecasts, for the two subsequent fiscal years.
The certification shall be classified as positive, qualified, or negative, pursuant to standards and criteria adopted by the State Board of Education (EC §33127).
The District is certifying Positive at Second Interim

National and State Economic Conditions
UCLA forecast (March 2013) reporting foundation for growth may have finally been poured – nationally.
California forecast – January revenues exceed forecast by $5.1 billion (51%), February revenues below forecasts by $322 million (-8.1%) , but year-to-date revenues remain strong
Voters (48%) are feeling State is moving in the right direction.Governor Brown ‘s job approval rating at a high of 57%Personal income in California expected to increase 1.4% in 2013 and 3.6%
in 2014California unemployment rate expected to fall to 8.4% in 2014, one
percentage point higher than the forecast for the U.S. rate.

$Combined Combined Variance
RevenueRevenue Limit Sources 33,669,430 33,453,358 (216,072) 1 Federal Revenue 2,104,401 2,707,982 603,581 2 State Revenue 5,582,228 5,839,163 256,935 3 Local Revenue 3,521,877 3,414,272 (107,605) 4 Total Revenue 44,877,936 45,414,775 536,839 ExpendituresCertificated Salaries 23,027,808 22,912,539 (115,269) 5 Classified Salaries 6,277,614 6,294,299 16,685 6 Benefits 10,173,642 10,120,674 (52,968) 7 Books and Supplies 3,248,731 3,861,724 612,993 8 Other Services & Oper. Exp 4,105,366 4,288,283 182,917 9 Capital Outlay 13,515 34,958 21,443 10 Other Outgo 7xxx 1,797,360 1,797,360 - Transfer of Indirect 73xx (102,386) (102,386) - Unidentified Budget Cuts - - Total Expenditures 48,541,650 49,207,451 665,801 Deficit/Surplus (3,663,714) (3,792,676) (128,962) Transfers In 17,400 17,400 - Transfers out (23,360) (23,360) - Contributions to Restricted - - -
Net increase (decrease) in Fund Balance (3,669,674) (3,798,636) (128,962) Beginning Balance 9,376,689 9,376,689 - Ending Fund Balance 5,707,015 5,578,053 (128,962) less: Deferred Maintenance Reserve (2,000,000) (1,963,000) 37,000 Gen Fund Ending Bal w/out Reserves 3,707,015 3,615,053 (91,962)
7.64% 7.35%Components of Ending Fund BalanceRevolving Fund 2,000 2,000 Prepaid Expenditures - - Unrestricted Designations - - Restricted Designations 112,370 139,255 Economic Uncertainty @ 3% 1,456,950 1,476,924 Economic Uncertainty surplus/ (shortfall) 2,135,695 1,996,874 Deferred Maintenance Reserve 2,000,000 1,963,000 Basic Aid Reserve - -
Total Ending Fund Balance 5,707,015 5,578,053
Second Interim
2012-13
First Interim
2012-13
2012-13 1st Interim vs. 2nd Interim

Major Revenue Changes to Fund Balance Since First Interim Budget
($3,670,000)
Revenues
Revenue Limit - Increase in in-lieu transfer to charter schools (216,000) 1
Federal Revenue
Increased Title I allocation 525,000
Increased AB602 revenues 17,000
Increased Title III allocation 4,000
Increased Medi-Cal billing revenues 57,000
Total Federal Revenue changes 603,000 2
State Revenue
Increased EIA allocation 257,000 3 Local Revenue
MAA revenues received in 11-12; paid back to State (88,000)
Actual 11-12 Charter school oversight funds less than accrued (52,000)
Increased AB602 revenues 15,000
After School Program fees (budgeted when received) 12,000
Miscellaneous 6,000
Total Local Revenue changes (107,000) 4
Total Change in Revenues $537,000
Budgeted Deficit Spending at First Interim

Major Expenditure Changes to Fund Balance Since First Interim Budget
Continued on next slide
Expenditures
Certificated Salaries
Transfer of coaching stipends to classified (29,000)
Reduce nurse budget; transfer to NPA budget (38,000)
Updated postion control staffing (28,000)
Decrease in projected substitute needs due to long-term leaves (20,000)
Total Certificated (115,000) 5
Classified Salaries
Confidential position vacant for 6 months (23,000)
Transfer of coaching stipends from certificated 29,000
Net increase in substitute costs 4,000
Title I ISP 7,000
Total Classified 17,000 6
Benefit changes - From staffing changes and PERS reduction restoration (53,000) 7

Major Expenditure Changes to Fund Balance Since First Interim Budget
Books and Supplies
Increased Title I and EIA revenues 676,000
After School Program fees (budgeted when revenues received) 12,000
Increase in Medi-Cal billing budget 12,000
Increase in restricted Mental Health supply budget 9,000
Reduction for unspent budgets (51,000)
Reduction in MAA budgets due to amount owed to State (45,000)
Total Books & Supplies 613,000 8
Services & Other Operating Expenditures
Deferred maintenance expenditures 37,000
Increase in legal fees 20,000
Nonpublic agencies/schools 100,000
Increased Title I and EIA revenues 11,000
Medi-Cal Billing expenditures 12,000
Utilities 35,000
Reduction for unspent budgets (32,000)
Total Services and Other Operating Costs 183,000 9
Capital Outlay - Purchase of scissor lift 21,000 10
Total Change in Expenditures $666,000
Total Change in Budgeted FB ($129,000)
Budgeted Deficit Spending at Second Interim ($3,799,000)
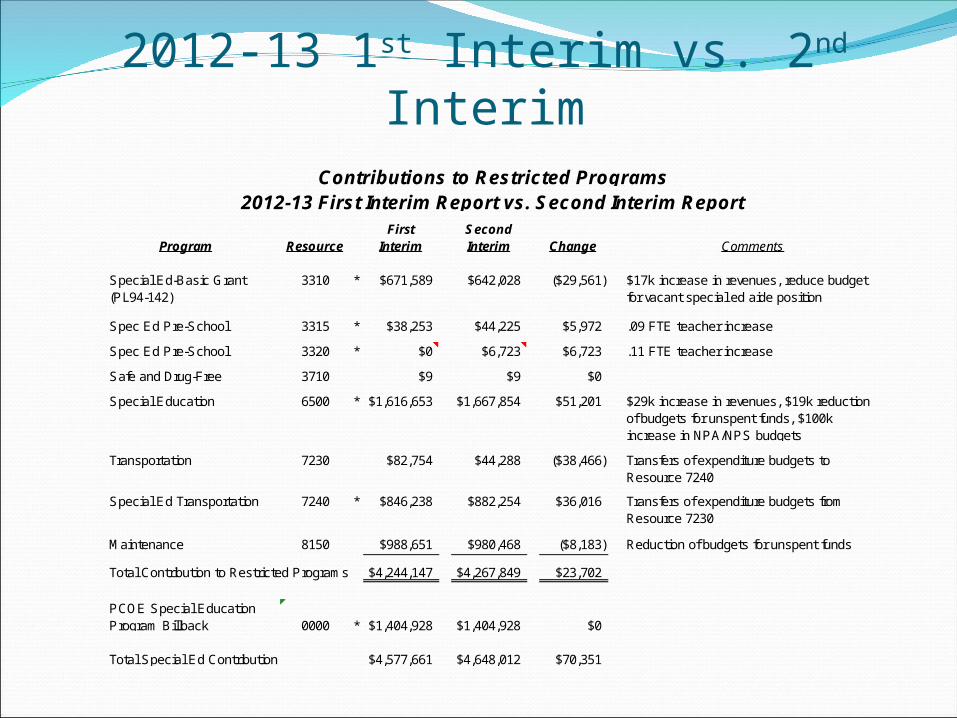
2012-13 1st Interim vs. 2nd Interim
First SecondProgram Resource Interim Interim Change Comments
Special Ed-Basic Grant (PL94-142)
3310 * $671,589 $642,028 ($29,561) $17k increase in revenues, reduce budget for vacant special ed aide position
Spec Ed Pre-School 3315 * $38,253 $44,225 $5,972 .09 FTE teacher increase
Spec Ed Pre-School 3320 * $0 $6,723 $6,723 .11 FTE teacher increase
Safe and Drug-Free 3710 $9 $9 $0
Special Education 6500 * $1,616,653 $1,667,854 $51,201 $29k increase in revenues, $19k reduction of budgets for unspent funds, $100k increase in NPA/NPS budgets
Transportation 7230 $82,754 $44,288 ($38,466) Transfers of expenditure budgets to Resource 7240
Special Ed Transportation 7240 * $846,238 $882,254 $36,016 Transfers of expenditure budgets from Resource 7230
Maintenance 8150 $988,651 $980,468 ($8,183) Reduction of budgets for unspent funds
Total Contribution to Restricted Programs $4,244,147 $4,267,849 $23,702
PCOE Special Education Program Billback 0000 * $1,404,928 $1,404,928 $0
Total Special Ed Contribution $4,577,661 $4,648,012 $70,351
Contributions to Restricted Programs2012-13 First Interim Report vs. Second Interim Report

2012-13 Budget Reductions
2012-13 One-T ime Budget Reductions
Wetland Reserve 750,000
Deferred Maint. Funds 50,000
Computer Replacements 150,000
Furlough Days 1,208,456
Teacher Lottery Funds 160,000
Class Size Overages 137,000
Teacher Column pay 67,500
2,522,956
$5.75 million in budget reductions•$3.25 million on-going•$2.5 million one-time

Multiple Year Projections (MYP) 2013-14 & 2014-15
2013-14 Budget Reductions –$4.4 million ($5.3M cuts less $842,000 Net Revenue increases)
$1.32 million in budget reductions approved by Board ($1.3 One-Time, $288,000 On-Going)
$2.0 million use of Fund balance Reserves – On-Time
$781,000 Reduction in force – certificated staffing – On-Going
$111,000 Contract, Management & Confidential - 6 Furlough Days – One-Time
$215,000 remaining to reduce
2014-15 Budget Reductions Needed – $2.9 million If all on-going reductions in 2013-14 continue

MYP -Budget Assumptions - Revenue12/13
Adopted
12/13 First
Interim
12/13
Second
Interim
13/14
Projec tion
14/15
Projec tion
REVENUE
Enrollment 6,588 6,593 6,593 6,626 6,692
ADA Y ield 95.5% 95.5% 95.5% 95.7% 96.0%
ADA 6,292 6,296 6,296 6,341 6,425
% Inc rease Enrollment 0.0% 0.1% 0.1% 0.5% 1.0%
# Inc rease Enrollment - 5 5 33 66
Prior Y ear RL $6,491.07 $6,491.07 $6,491.07 $6,703.07 $6,814.07
COLA % 3.24% 3.24% 3.24% 1.65% 2.20% SSC Dartboard
COLA $212.00 $212.00 $212.00 $111.00 $150.00 SSC Dartboard
Defic it % -22.272% -22.272% -22.272% -22.272% -22.272% SSC Dartboard
Defic it Applied (1,498.88) (1,498.88) (1,498.88) (1,523.70) (1,557.24)
Add'l RL adjustment (414.19) 26.81 26.81 27.25 27.85
Funded RL per ADA 4,790.00 5,231.00 5,231.00 5,317.62 5,434.68
Est. Revenue L imit 30,136,491 32,936,038 32,936,038 33,719,313 34,915,310
Basic Aid/Charter School 1,011,231 - - - -
Property Tax change 0.00% 1.00% 1.00% 1.00% 1.00%
Est. Property Taxes 31,331,089 31,644,400 31,960,844 31,644,400 31,960,844
Federal Revenue 0% 0% 0% 0% 0%
Categorical COLA 0.00% 0.00% 0.00% 0.00% 0.00% SSC Dartboard
Lottery Unrestric ted/ADA 118.00 124.00 124.25 124.25 124.25 SSC Dartboard
Lottery Restric ted/ADA 23.75 30.00 30.00 30.00 30.00 SSC Dartboard

MYP Budget Assumptions - Expenditures12/13
Adopted
12/13 First
Interim
12/13
Second
Interim
13/14
Projec tion
14/15
Projec tion
EXPENDITURES
Certificated New Hires 0 FTE 0 FTE 0 FTE 0 FTE 0 FTE
Estimated Retirements 0 FTE 0 FTE 0 FTE 0 FTE 0 FTE
Reductions in Staffing (21.2) FTE (21.2) FTE (21.2) FTE (13.00) FTE 0.0FTE Brd Approved March 2013
Staffing Ratios:
K indergarten 25:1 25:1 25:1 25:1 25:1 Increase in 13/14 & 14/15
1-3 28:1 28:1 28:1 28:1 28:1 may be necessary and will
4-5 31:1 31:1 31:1 31:1 31:1 be determined through the
6-8 26:1 26:1 26:1 26:1 26:1 budget process
9-12 29:1 29:1 29:1 29:1 29:1
Certificated Step/Column 1.50% 1.5% 1.5% 2.50% 2.50%
Classified new Hires 0.0 FTE 0.0 FTE 0.0 FTE 0.0 FTE 0.0 FTE
Estimated Retirements 0.0 FTE 0.0 FTE 0.0 FTE 0.0 FTE 0.0 FTE
Reductions in Staffing (11.75) FTE (11.75) FTE (11.75) FTE 0.0 FTE 0.0 FTE
Classified Step/Column 0.00% 1.00% 1.00% 1.00% 1.00%
Health Benefits 2.5% 2.5% 2.5% 2.6% 5.0% 2013 Preliminary Rates - 3/13
Budget Reductions (5,670,000) (5,670,000) (5,670,000) (214,646) (2,900,000)
Governors 13-14 Proposal &
Board Approved Reductions
Site Allocations:
Elementary 37.60 37.60 37.60 31.96 31.96 Board Approved
Middle School 46.80 46.80 46.80 39.78 39.78 Budget Reduction of 15%
High School 67.00 67.00 67.00 56.95 56.95 for Site Allocations
SL IG K -6 17.43 17.43 17.43 17.43 17.43 Brd Approved Add'l Transfer
SL IG 7-8 6.36 6.36 6.36 6.36 6.36 In 13-14 - Alloc To Be Adj.
MAA 165,000 165,000 165,000 165,000 165,000
Lottery per teacher - - - 500.00 500.00

Multiple Year Projections
Positive Certification – Adequate reserves and cash
Maintains a 3% general fund reserve for 13-14 and 14-15; As of Second Interim 12-13 reserve meets Board policy for minimum reserve of 5%
DM Reserve used to assist with negative cash flow due to state deferrals
On-going budget cuts necessary to achieve a balanced budget (Revenues = Expenses)
Combined Combined Combined Combined
RevenueRevenue Limit Sources 33,669,430 33,453,358 34,469,533 35,669,236 Federal Revenue 2,104,401 2,707,982 2,564,587 2,564,587 State Revenue 5,582,228 5,839,163 5,958,927 6,000,314 Local Revenue 3,521,877 3,414,272 3,454,137 3,454,137 Total Revenue 44,877,936 45,414,775 46,447,184 47,688,274 ExpendituresCertificated Salaries 23,027,808 22,912,539 23,640,000 24,330,000 Classified Salaries 6,277,614 6,294,299 6,570,000 6,670,000 Benefits 10,173,642 10,120,674 10,390,000 10,680,000 Books and Supplies 3,248,731 3,861,724 2,470,000 2,480,000 Other Services & Oper. Exp 4,105,366 4,288,283 3,950,000 3,950,000 Capital Outlay 13,515 34,958 10,000 10,000 Other Outgo 7xxx 1,797,360 1,797,360 1,800,000 1,800,000 Transfer of Indirect 73xx (102,386) (102,386) (100,000) (100,000) Unidentified Budget Cuts - - (214,646) (2,900,000) Total Expenditures 48,541,650 49,207,451 48,515,354 46,920,000 Deficit/Surplus (3,663,714) (3,792,676) (2,068,170) 768,274 Transfers In 17,400 17,400 20,000 20,000 Transfers out (23,360) (23,360) (20,000) (770,000) Net increase (decrease) in Fund Balance (3,669,674) (3,798,636) (2,068,170) 18,274 Beginning Balance 9,376,689 9,376,689 5,578,053 3,509,883 Ending Fund Balance 5,707,015 5,578,053 3,509,883 3,528,157 less: Deferred Maintenance Reserve (2,000,000) (1,963,000) (1,963,000) (1,963,000) Gen Fund Ending Bal w/out Reserves 3,707,015 3,615,053 1,546,883 1,565,157
7.64% 7.35% 3.19% 3.34%
Second Interim
2012-13
First Interim
2012-13
Projection
2014-15
Projection
2013-14

Components of Fund Balance
Economic Uncertainty Surplus used to support future year’s budget deficits - BUT it is One-Time
Deficit Spending in 2012-13 & 2013-14. Balanced in 2014-15 due to projected State COLA.
Combined Combined Combined Combined
Net increase (decrease) in Fund Balance (3,669,674) (3,798,636) (2,068,170) 18,274 Beginning Balance 9,376,689 9,376,689 5,578,053 3,509,883 Ending Fund Balance 5,707,015 5,578,053 3,509,883 3,528,157 less: Deferred Maintenance Reserve (2,000,000) (1,963,000) (1,963,000) (1,963,000) Gen Fund Ending Bal w/out Reserves 3,707,015 3,615,053 1,546,883 1,565,157
7.64% 7.35% 3.19% 3.34%Components of Ending Fund BalanceRevolving Fund 2,000 2,000 2,000 2,000 Prepaid Expenditures - - Unrestricted Designations - - Restricted Designations 112,370 139,255 623 3,378 Economic Uncertainty @ 3% 1,456,950 1,476,924 1,456,061 1,430,700 Economic Uncertainty surplus/ (shortfall) 2,135,695 1,996,874 88,200 129,079 Deferred Maintenance Reserve 2,000,000 1,963,000 1,963,000 1,963,000 Basic Aid Reserve - - - -
Total Ending Fund Balance 5,707,015 5,578,053 3,509,883 3,528,157
Second Interim
2012-13
First Interim
2012-13
Projection
2014-15
Projection
2013-14

Enrollment Trends
We have projected an enrollment increase of 33 students for the 2013-14 year and an increase of 66 students in fiscal year 2014-15.

Cash Flow 2012-2013, 2013-2014 and 2014-2015 (without TRANS financing support in 2013-14 and 2014-15)
(17,500,000)
(15,000,000)
(12,500,000)
(10,000,000)
(7,500,000)
(5,000,000)
(2,500,000)
0
2,500,000
5,000,000
7,500,000
10,000,000
12,500,000
15,000,000
17,500,000
20,000,000
Endi
ng C
ash
Bala
nce
Month
Cash Flow Comparison
2012-13
2013-14
2014-15
June 2012

Next StepsDeficit spending is budgeted for the current and two
subsequent years. The District is attempting to bring forward budget reductions
that are on-going to address the year-to-year structural deficit.
Any one-time budget reductions will continue to necessitate annual budget reductions in future years.
While the projections show that the district will be able to meet its financial obligations for the current and subsequent two years, the district must align spending with revenue to beyond the minimum 3% reserve for Economic Uncertainties to a Board policy of 5% reserve to maintain a healthy financial status.

Next StepsEducation Code requires that the district revise its budget at First Interim, Second Interim and at year end.
Changes that the Board should expect before 2013-14 Budget Adoption In June include:
Multi-year projections updated to reflect Governor’s 2013-14 May Revision Update COLA and deficit assumptions for 2013-14 and future years
Update on Federal, State and local funding notificationsRecalculation of Revenue limit for final P-2 ADA reportingUpdated projected ending Fund Balance Reserves based on year end
projections and actuals spent to dateRecommendations for remaining 2013-14 budget reductions.

QUESTIONS & COMMENTS


