2011 Monitoring Report - United States Fish and Wildlife … Columbia Spotted Frogs Spotted frogs...
32
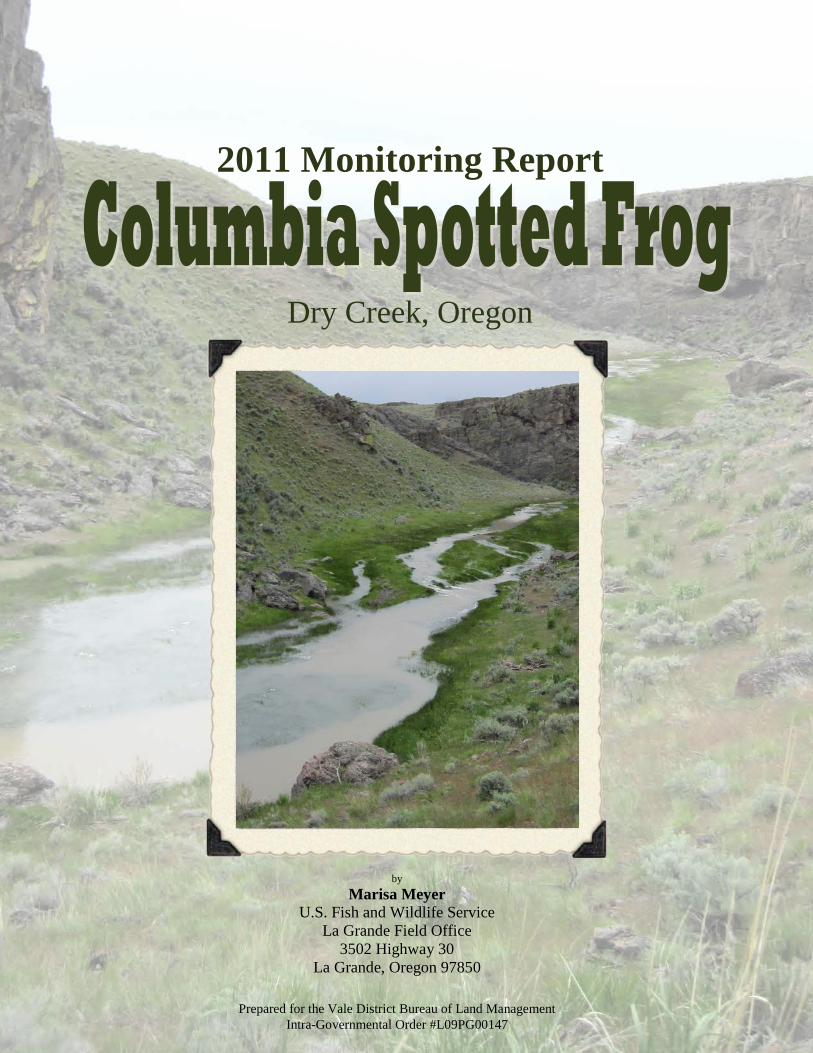
ii by Marisa Meyer U.S. Fish and Wildlife Service La Grande Field Office 3502 Highway 30 La Grande, Oregon 97850 Prepared for the Vale District Bureau of Land Management Intra-Governmental Order #L09PG00147 2011 Monitoring Report Dry Creek, Oregon
Transcript of 2011 Monitoring Report - United States Fish and Wildlife … Columbia Spotted Frogs Spotted frogs...
ii
by Marisa Meyer
U.S. Fish and Wildlife Service La Grande Field Office
3502 Highway 30 La Grande, Oregon 97850
Prepared for the Vale District Bureau of Land Management Intra-Governmental Order #L09PG00147
2011 Monitoring Report
Dry Creek, Oregon
i
2011 SURVEYORS
Todd Allai Bureau of Land Management
Vale District Office, Vale, Oregon
Brett Amdor Bureau of Land Management
Vale District Office, Vale, Oregon
Ruth Brandt-Miller U.S. Fish and Wildlife Service Volunteer
La Grande Field Office, La Grande, Oregon
Steve Christensen Bureau of Land Management
Vale District Office, Vale, Oregon
Aimee Huff Bureau of Land Management
Vale District Office, Vale, Oregon
Gary Miller U.S. Fish and Wildlife Service
La Grande Field Office, La Grande, Oregon
Shaney Rockefeller Bureau of Land Management
Vale District Office, Vale, Oregon
Naomi Wilson Bureau of Land Management
Vale District Office, Vale, Oregon
CONTRIBUTING RESEARCHERS
Janice Engle U.S. Fish and Wildlife Service
Endangered Species Program, Arlington, Virginia
Cynthia Tait U.S. Forest Service
Intermountain Regional Office, Ogden, Utah
ii
PREFACE
This study was initiated in 2001 by the Vale District Bureau of Land Management and the U.S. Fish and Wildlife Service’s Idaho Fish and Wildlife Office in Boise, Idaho in order to monitor long-term population trends, demographics and movement patterns for Columbia spotted frogs in Dry Creek. The Idaho Fish and Wildlife Office was responsible for the monitoring along Dry Creek until Janice Engle’s departure to Sacramento, California in 2006. In 2007, the U.S. Fish and Wildlife Service’s La Grande Field Office took over responsibility for the monitoring and reporting of the Dry Creek Columbia spotted frog monitoring study. This report constitutes the 2011 annual report for the long-term population monitoring study along Dry Creek and fulfills the annual reporting requirement under Intra-Governmental Order #L09PG00147.
iii
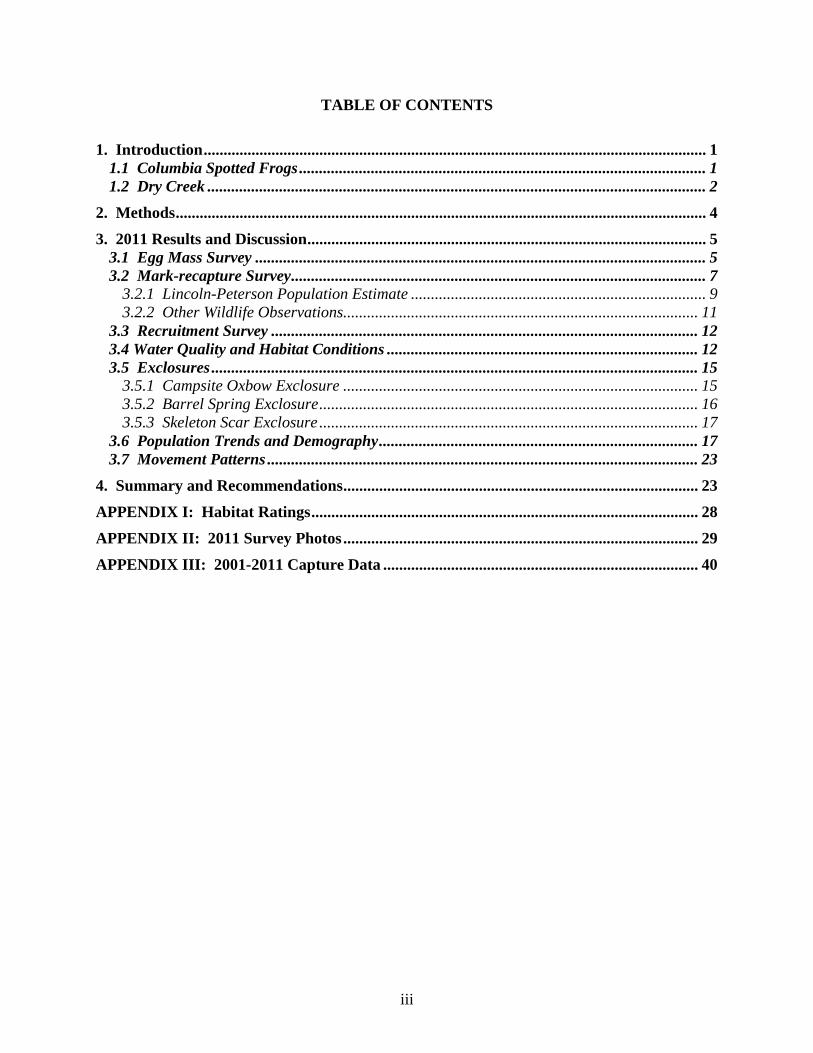
TABLE OF CONTENTS
1. Introduction .............................................................................................................................. 1 1.1 Columbia Spotted Frogs ...................................................................................................... 1 1.2 Dry Creek ............................................................................................................................. 2
2. Methods ..................................................................................................................................... 4
3. 2011 Results and Discussion .................................................................................................... 5 3.1 Egg Mass Survey ................................................................................................................. 5 3.2 Mark-recapture Survey ........................................................................................................ 7
3.2.1 Lincoln-Peterson Population Estimate .......................................................................... 9 3.2.2 Other Wildlife Observations......................................................................................... 11
3.3 Recruitment Survey ........................................................................................................... 12 3.4 Water Quality and Habitat Conditions .............................................................................. 12 3.5 Exclosures .......................................................................................................................... 15
3.5.1 Campsite Oxbow Exclosure ......................................................................................... 15 3.5.2 Barrel Spring Exclosure ............................................................................................... 16 3.5.3 Skeleton Scar Exclosure ............................................................................................... 17
3.6 Population Trends and Demography ................................................................................ 17 3.7 Movement Patterns ............................................................................................................ 23
4. Summary and Recommendations ......................................................................................... 23
APPENDIX I: Habitat Ratings ................................................................................................. 28
APPENDIX II: 2011 Survey Photos ......................................................................................... 29
APPENDIX III: 2001-2011 Capture Data ............................................................................... 40
1
1. Introduction 1.1 Columbia Spotted Frogs Spotted frogs are currently classified as two separate species, the Oregon spotted frog (Rana pretiosa) and the Columbia spotted frog (Rana luteiventris). Researchers found that while the two species are nearly identical morphologically, they differ genetically and occupy different ranges (Green et al. 1997). Green et al. 1997, indicates there is genetic evidence R. luteiventris may be one species with three subspecies or several weakly-differentiated species (Green et al. 1997). Additionally, Funk et al. 2008, found three highly divergent R. luteiventris clades, or groups consisting of a single common ancestor, that may actually represent different species. Currently, there are four recognized populations of Columbia spotted frogs: Northern, Great Basin, Wasatch, and West Desert. Columbia spotted frogs occur from Alaska and most of British Columbia to Washington and Oregon east of the Cascade Mountains, Idaho, Montana, the Bighorn Mountains in Wyoming, the Mary’s, Reese, and Owyhee River systems in Nevada, the Wasatch Mountains, and the western desert of Utah (Green et al. 1997, Funk et al. 2008). The Great Basin, Wasatch, and West Desert populations are experiencing declines, although the causes of decline are not fully understood. However, like most amphibians a major threat is believed to be the destruction, fragmentation and degradation of wetlands. The introduction of non-native predators such as bullfrogs, bass and predatory freshwater fish species are also believed to contribute to their decline. Due to the population’s current status, the Great Basin Columbia spotted frog is designated as a Federal candidate species for listing as endangered or threatened under the Endangered Species Act. The U.S. Fish and Wildlife Service (Service) has sufficient information on the biological status and threats for the Great Basin Columbia spotted frog to propose them for protection under the Endangered Species Act; however, development of a listing regulation is precluded by other higher priority listing activities (USDI 1993, USDI 2011). Great Basin Columbia spotted frogs (spotted frogs) are highly aquatic and live in or near permanent bodies of water, including lakes, ponds, slow streams and marshes; movements of spotted frogs are generally limited to wet riparian corridors. Spotted frogs occur in riparian areas, where emergent vegetation and standing water are present, within the sage-juniper shrublands (Engle 2001). Standing water, flooded meadows, and willows provide breeding, foraging, and overwintering habitat. Most spotted frogs hibernate and aestivate; hibernation occurs in spring-fed ponds with willows (Engle 2001). Spotted frogs hibernate under water or in burrows and holes in the streambanks where the water does not freeze and there is adequate oxygen levels (Bull and Hayes 2002). Spotted frog adults are light to dark brown, gray, or olive green with dark spots on the back, sides and legs. The number of spots and spotting pattern varies. The undersides of the legs are orange or yellow; this color may extend up to the chin or be replaced by a light, mottled gray on the chin, chest, and/or belly. Adult body length is 46 to 90 mm (Engle 2001). Spotted frogs breed during a short, two-week breeding window anywhere from early April to early June. Eggs are laid at the water surface in large, globular masses of 200 to 500 eggs (Engle 2001). Tadpoles
2
are black after hatching and their eyes are located on the top of the head. Tadpoles are approximately 8 to 10 mm in length at hatching and commonly metemorphose at 23 to 33 mm (Engle 2001). Metamorphosis usually occurs from late July until freezing weather. The lifespan of spotted frogs can be seven to nine years (Engle 2001). Spotted frog diets can vary widely. Adults eat insects, mollusks, crustaceans, and arachnids; larvae eat algae and organic debris. Predators of spotted frog adults include herons and garter snakes, and the recently introduced bullfrogs. In addition, larvae may be consumed by the larvae of dragon flies, predacious diving beetles, fish and garter snakes. 1.2 Dry Creek Dry Creek is a tributary to the Owyhee River and located in Malheur County in southeast Oregon. Dry Creek is characterized by steep canyons, scour pools, and meandering stream reaches with boulders, cobbles, and sandy substrate. The section of Dry Creek included in this study is an interrupted, perennial stream with a relatively wide open valley bottom and occasional narrow canyon pinches. Historically, the channel down cut several feet. The current stream channel is recovering and creating a new floodplain (Rockefeller pers. comm. 2011). Vegetation along Dry Creek consists of sedges, rushes, forbs and occasional willows and cattails. Oxbows and side pools along Dry Creek provide slack water and good habitat for breeding spotted frogs and developing tadpoles. However, periodic deep pools in Dry Creek contain large trout and may negatively affect and/or limit movement of frogs along the creek between breeding, foraging, and hibernation sites due to predation by these large fish. Dry Creek has the largest known spotted frog population on the Vale Bureau of Land Management (BLM) District, excluding the Baker Resource Area. The spotted frog population along Dry Creek is part of the Great Basin population, while the Baker Resource Area populations are comprised of the Northern population of Columbia spotted frogs (Funk et al. 2008). Dry Creek was chosen for long-term population monitoring not only for its large population of Great Basin Columbia spotted frogs, but also because the population is relatively isolated with no connectivity to other watersheds (Tait pers. comm. 2007). These conditions create a unique opportunity to monitor population trend and age class survival within a population. In addition, much of the land along Dry Creek is in public ownership; therefore, there is an ability to monitor effects from management practices, and modify management if needed. Spotted frogs in Dry Creek have been surveyed at least three times each year since 2001 (via mark-recapture surveys in June and recruitment surveys in August of each year). In 2011, the survey transect was visited a total of four times. On April 29, 2011, a spotted frog egg mass survey was conducted. Dry Creek was also visited from June 1 through June 3, 2011, to conduct the mark-recapture survey and record habitat parameters (each survey transect was visited twice) and on August 8-10, 2011, Dry Creek was visited to determine annual recruitment. Figure 1 shows the annual survey transect, photo point locations and water quality testing locations. Protocols followed for the 2011 surveys are described in the Methods section of this report and in Appendix I.
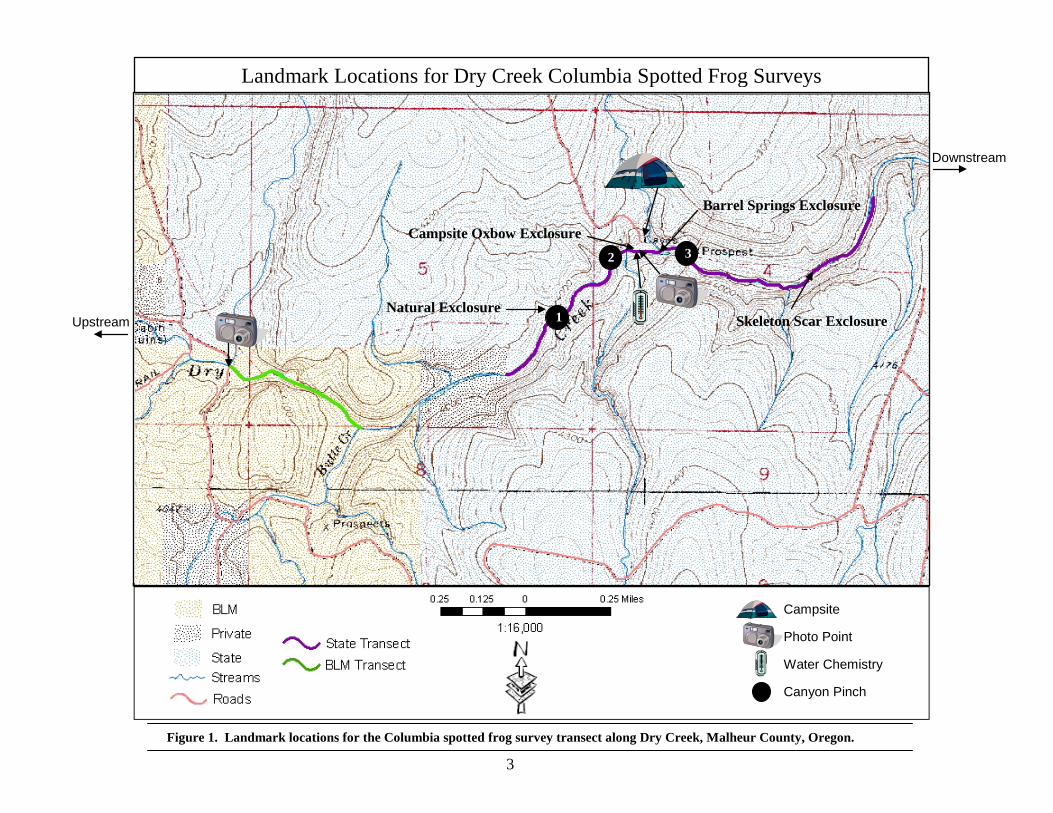
Downstream
Campsite Photo Point Water Chemistry Canyon Pinch
Figure 1. Landmark locations for the Columbia spotted frog survey transect along Dry Creek, Malheur County, Oregon.
Upstream 1
2 3 Campsite Oxbow Exclosure
Skeleton Scar Exclosure
Barrel Springs Exclosure
3
Natural Exclosure
Landmark Locations for Dry Creek Columbia Spotted Frog Surveys
4
2. Methods Two population estimate methods are used in this monitoring strategy: 1) mark-recapture, and 2) visual encounter surveys. Mark-recapture methods provide accurate estimates of population size within the constraints of the following assumptions (Fellers 1997, Hayne 1949):
1. Immigration and emigration must not exist; 2. Recruitment must not occur; and 3. Each individual has the equal probability of being caught.
Visual encounter surveys provide an estimate of relative abundance as long as every individual is equally likely to be observed (regardless of weather, season, or other variables) and each frog is recorded only once so there are no observer-related effects (Fellers 1997). These two methods are used to provide comparative numbers across years for the Dry Creek monitoring site. The goal is to accurately detect trends in numbers at the site over the long-term. Mark-recapture numbers are used to calculate the Lincoln-Peterson population estimate to estimate occurrence size in the spring and visual encounter numbers to assess breeding success in the late summer. Surveyors visit the site three times each year: twice in the spring (early June) for a mark-recapture population estimate and habitat analysis and once in the late summer (August) for an assessment of breeding success and habitat analysis. Attempts are made to capture every frog, using dip nets, within the delineated area and within a specific time frame. Captured frogs are measured for snout-vent length (SVL), weighed, aged, and sexed. All frogs larger than 40 mm are tagged with Passive Integrated Transponder (PIT) tags. GPS locations are recorded for each frog captured along the transect route (using NAD83 datum). GPS locations are also recorded for beginning and ending points of the surveys (determined by ownership, accessibility, and occurrence boundaries from previous surveys). Parameters measured during each survey, once in the spring and once in the late summer, include:
− Water chemistry: dissolved oxygen, temperature, pH, and conductivity; and − Habitat/land use: streambank soil alteration rating (SSAR) and vegetation use by animals
(VUBA) (Platts 1987). These ratings are further described in Appendix 1. Data are recorded in a log book and the site is photographed from a standard point in the spring and late summer. A report is compiled annually and submitted to the BLM. The report consists of tables summarizing population numbers and maps of the area surveyed. Water chemistry and habitat/land use measures are discussed along with their relevance to population trends; raw data and field notes are included as appendices. Additionally, egg mass surveys were conducted in April 2004, 2008, 2010, and 2011. Spotted frog egg masses are easily detected in the spring (Nussbaum et al. 1983, McAllister and Leonard 1997) via visual encounter surveys and have been conducted across much of Oregon and
5
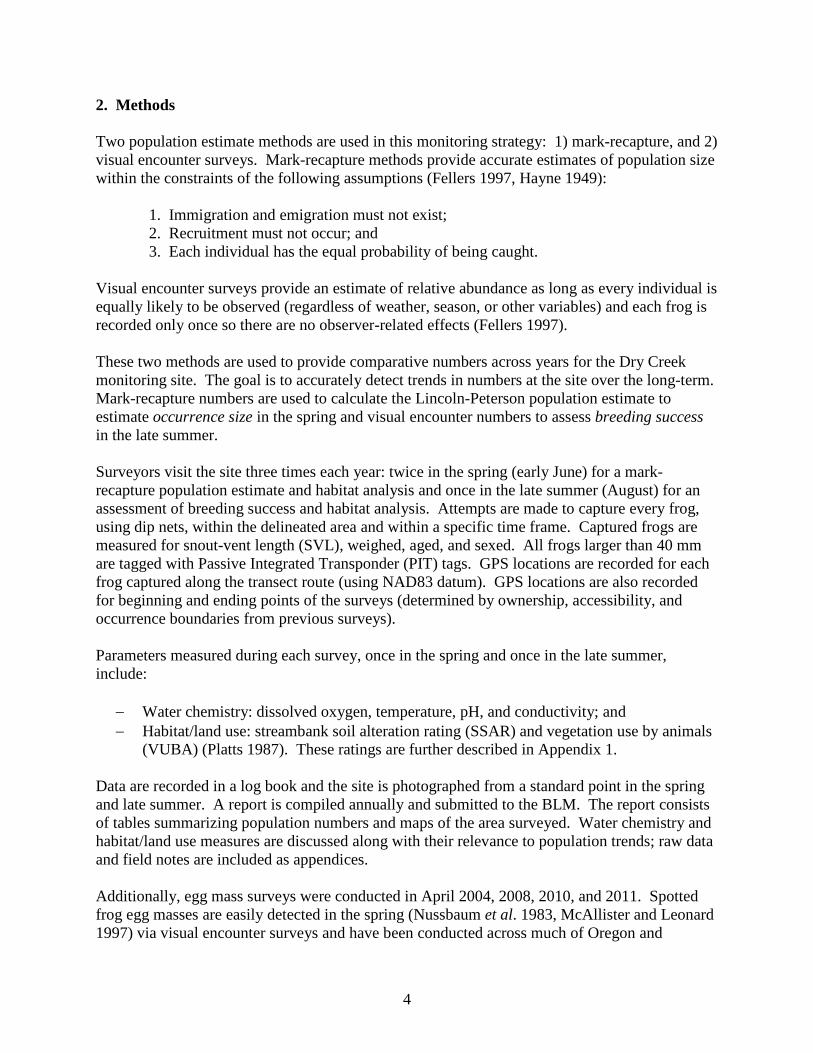
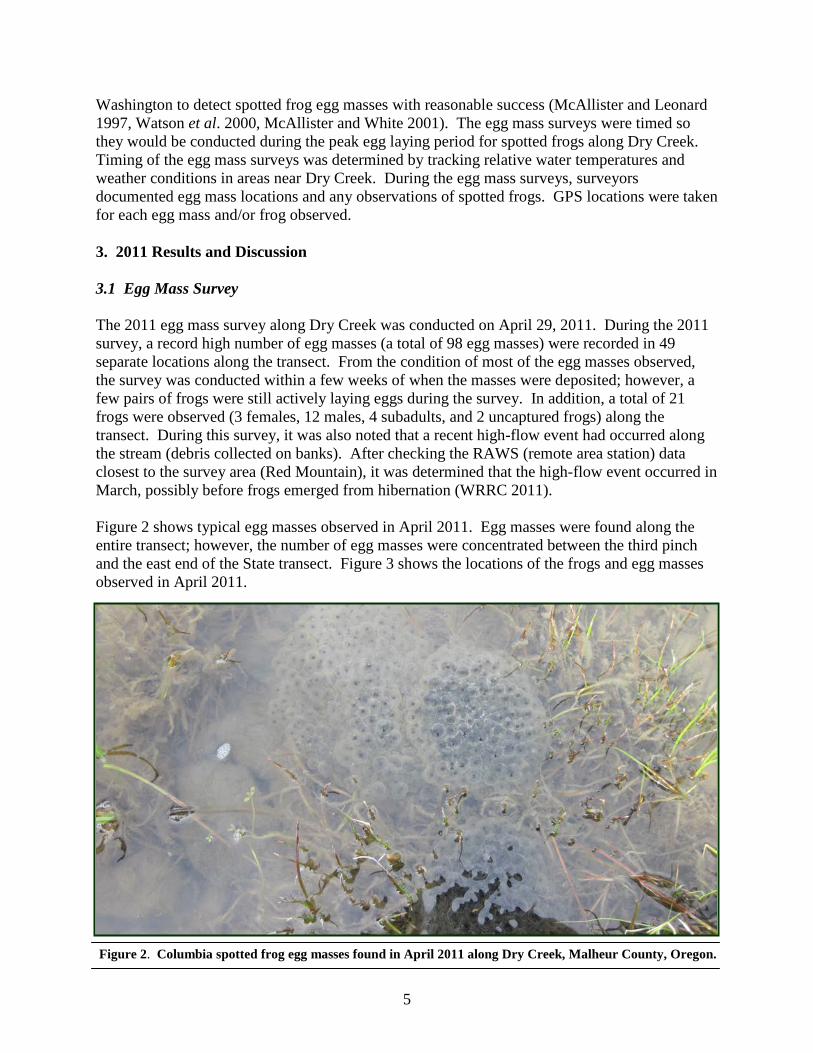
Washington to detect spotted frog egg masses with reasonable success (McAllister and Leonard 1997, Watson et al. 2000, McAllister and White 2001). The egg mass surveys were timed so they would be conducted during the peak egg laying period for spotted frogs along Dry Creek. Timing of the egg mass surveys was determined by tracking relative water temperatures and weather conditions in areas near Dry Creek. During the egg mass surveys, surveyors documented egg mass locations and any observations of spotted frogs. GPS locations were taken for each egg mass and/or frog observed. 3. 2011 Results and Discussion 3.1 Egg Mass Survey The 2011 egg mass survey along Dry Creek was conducted on April 29, 2011. During the 2011 survey, a record high number of egg masses (a total of 98 egg masses) were recorded in 49 separate locations along the transect. From the condition of most of the egg masses observed, the survey was conducted within a few weeks of when the masses were deposited; however, a few pairs of frogs were still actively laying eggs during the survey. In addition, a total of 21 frogs were observed (3 females, 12 males, 4 subadults, and 2 uncaptured frogs) along the transect. During this survey, it was also noted that a recent high-flow event had occurred along the stream (debris collected on banks). After checking the RAWS (remote area station) data closest to the survey area (Red Mountain), it was determined that the high-flow event occurred in March, possibly before frogs emerged from hibernation (WRRC 2011). Figure 2 shows typical egg masses observed in April 2011. Egg masses were found along the entire transect; however, the number of egg masses were concentrated between the third pinch and the east end of the State transect. Figure 3 shows the locations of the frogs and egg masses observed in April 2011. Figure 2. Columbia spotted frog egg masses found in April 2011 along Dry Creek, Malheur County, Oregon.
6
Figure 3. Egg mass locations along the survey transect in April 2011 along Dry Creek, Malheur County, Oregon.
2nd Canyon Pinch
1st Canyon Pinch
3rd Canyon Pinch
April 2011 Columbia Spotted Frog Egg Mass Locations
7
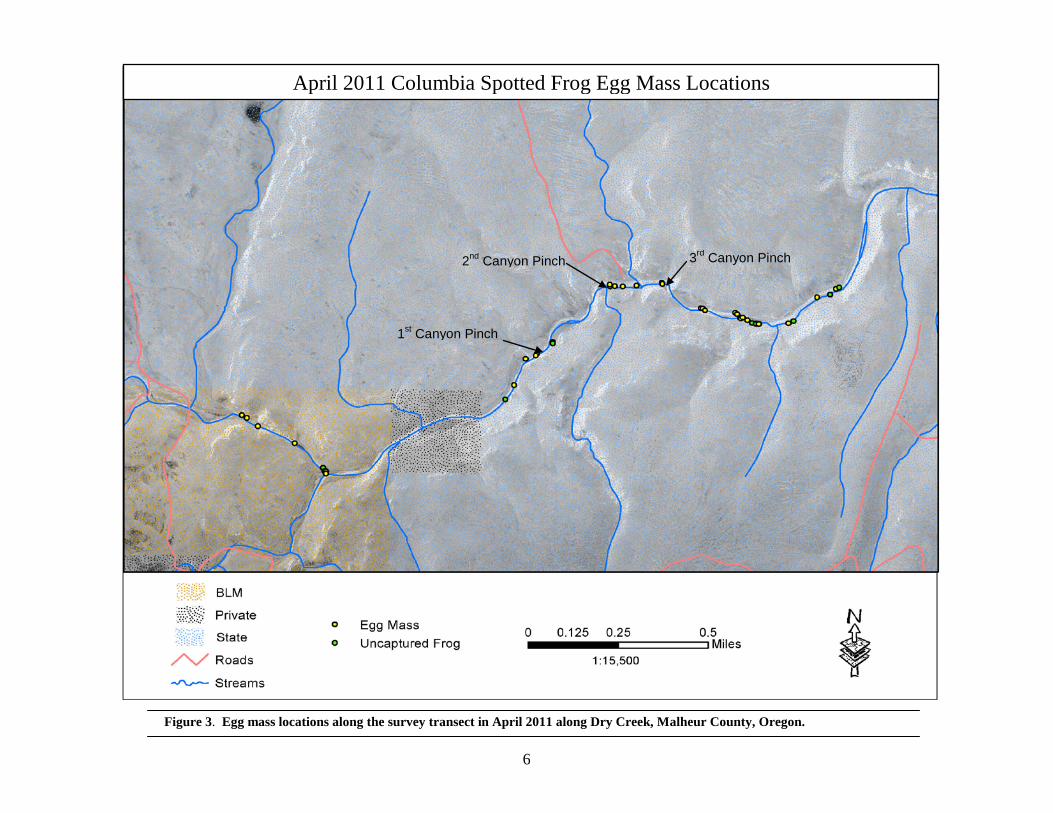
3.2 Mark-recapture Survey The spring of 2011 was a relatively cool, wet spring with a considerable amount of rain in March and May. During the June survey, it was noted that a second high-flow event had occurred along the stream (a second, lower high water line with debris collected on the banks). After checking the Red Mountain RAWS station, it was determined that the high-flow event occurred in May, sometime after the frogs emerged from hibernation and egg masses were laid (WRRC 2011). Aquatic habitat was uniform and well-connected in June. The flows in Dry Creek were elevated and fast and the water was discolored during the mark-recapture surveys. The June 2011 water level and water velocities were higher and faster than observed in any previous years of the project. In addition, there was little livestock use evident along the transect. Figure 4 shows the elevated water levels and the water discoloration during the June 2011 surveys. The mark-recapture surveys were conducted between June 1 and June 3, 2011 and between 0855 and 1800 hours. Along the entire transect, only 176 individual frogs were recorded (22 males, 19 females, 126 subadults, and 9 uncaptured frogs) in June 2011, a significantly lower number of frogs than the past three years. Frogs were found along the main channel and in available side pools and oxbows. Most frogs were caught after the second pinch down to the east end of the State land transect. Relatively, few frogs were recorded on BLM land (29 total frogs) and on State land down to the second pinch. Figure 5 shows the capture locations of all frogs recorded along the mark-recapture survey route for June 2011.
Figure 4. Water level and coloration along Dry Creek between the second and third pinches in June 2011, Malheur County, Oregon.
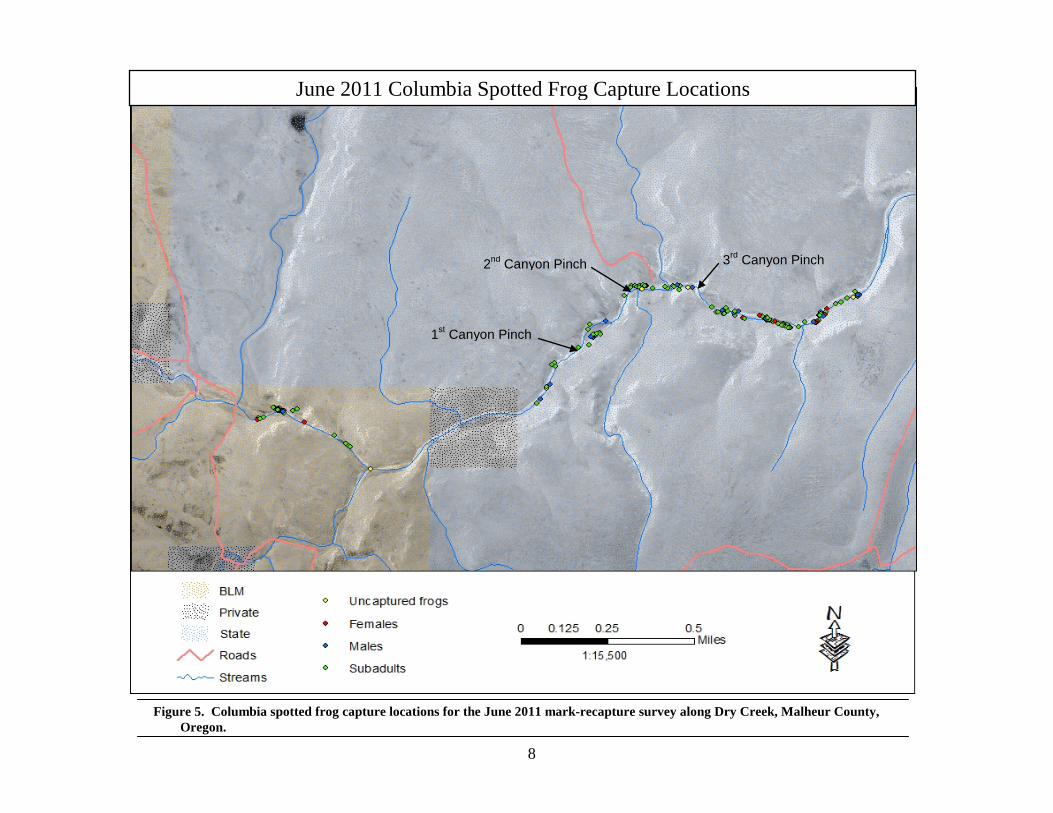
Figure 5. Columbia spotted frog capture locations for the June 2011 mark-recapture survey along Dry Creek, Malheur County, Oregon.
June 2011 Columbia Spotted Frog Capture Locations
8
3rd Canyon Pinch
1st Canyon Pinch
2nd Canyon Pinch
3.2.1 Lincoln-Peterson Population Estimate Population estimates are calculated for the State transect using the Lincoln-Peterson population estimate technique. This population estimate has been the most widely-used mark-recapture method for estimating population size (Nichols et al. 1981). The technique involves collecting a sample from the population, marking this sample, and then releasing the sample back into the population (Fellers 1997, Hayne 1949). This creates a ratio of marked to unmarked individuals in the population. After a period of time, a second collection is made and the ratio of marked to unmarked individuals is calculated. This ratio is then used to estimate the total population size (Fellers 1997, Hayne 1949). The Lincoln-Peterson technique uses the following assumptions:
− no immigration or emigration between the time of marking and the time of recapture; − no recruitment (reproduction) between the time of marking and the time of recapture; and − each individual has the equal probability of being caught.
Lincoln-Peterson population estimates are not calculated for the BLM transect because not enough frogs are captured on that transect to calculate a statistically valid population estimate. Additionally, frogs captured on the BLM transect cannot be combined with frogs captured on the State transect because of the intervening private land and the confluence of Butte Creek with Dry Creek. These existing conditions make it is impossible to ensure no individuals enter or leave the BLM transect during the survey period; therefore, it is impossible to ensure all assumptions of the Lincoln-Peterson method are accurate and true. The Lincoln-Peterson population estimate is calculated as follows:
N = (m)(n)/r Where:
N = population estimate m = number of frogs caught, marked, and released on day #1 n = number of frogs caught on day #2 r = total number of recaptured frogs caught on day #2
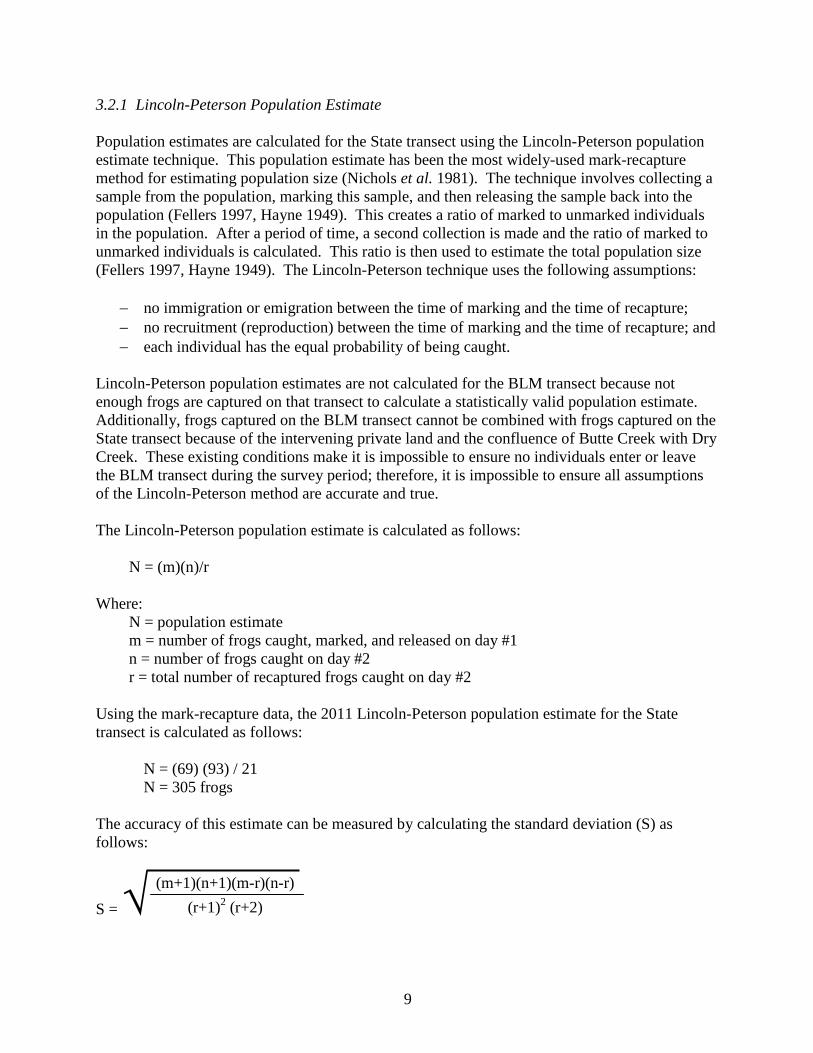
Using the mark-recapture data, the 2011 Lincoln-Peterson population estimate for the State transect is calculated as follows: N = (69) (93) / 21 N = 305 frogs The accuracy of this estimate can be measured by calculating the standard deviation (S) as follows:
S = √
(m+1)(n+1)(m-r)(n-r)
(r+1)2 (r+2)
9
10
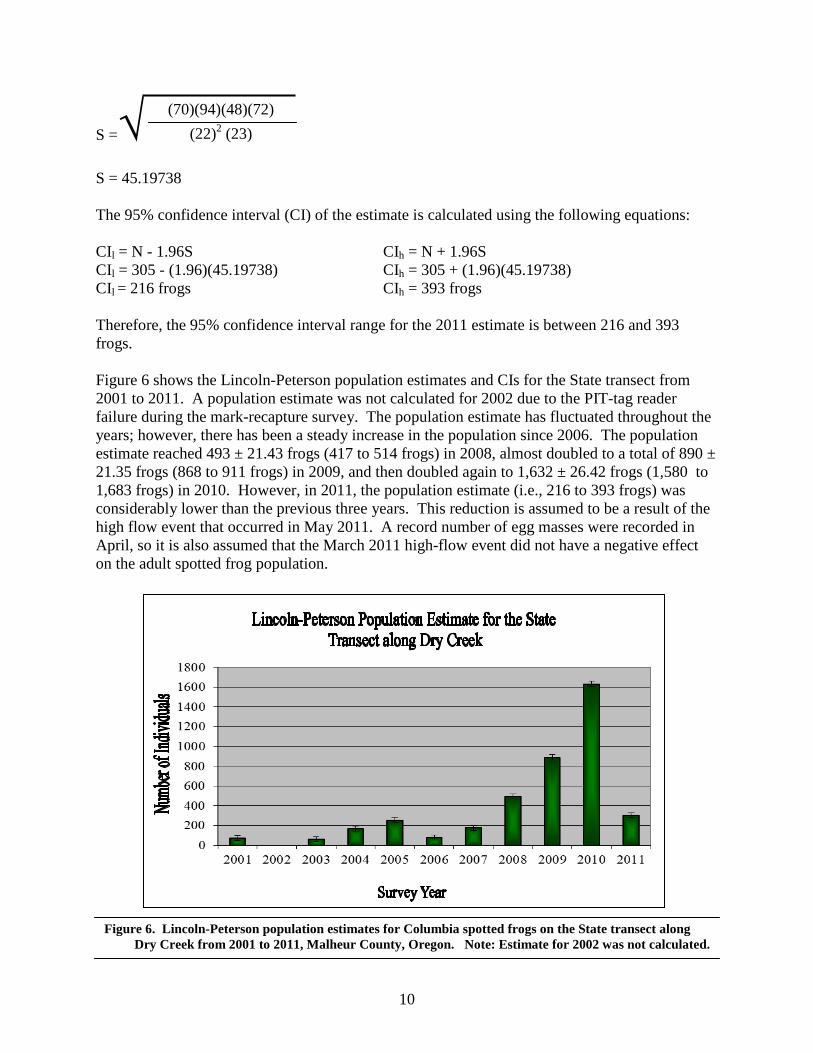
S =√ S = 45.19738 The 95% confidence interval (CI) of the estimate is calculated using the following equations: CIl = N - 1.96S CIh = N + 1.96S CIl = 305 - (1.96)(45.19738) CIh = 305 + (1.96)(45.19738) CIl = 216 frogs CIh = 393 frogs Therefore, the 95% confidence interval range for the 2011 estimate is between 216 and 393 frogs. Figure 6 shows the Lincoln-Peterson population estimates and CIs for the State transect from 2001 to 2011. A population estimate was not calculated for 2002 due to the PIT-tag reader failure during the mark-recapture survey. The population estimate has fluctuated throughout the years; however, there has been a steady increase in the population since 2006. The population estimate reached 493 ± 21.43 frogs (417 to 514 frogs) in 2008, almost doubled to a total of 890 ± 21.35 frogs (868 to 911 frogs) in 2009, and then doubled again to 1,632 ± 26.42 frogs (1,580 to 1,683 frogs) in 2010. However, in 2011, the population estimate (i.e., 216 to 393 frogs) was considerably lower than the previous three years. This reduction is assumed to be a result of the high flow event that occurred in May 2011. A record number of egg masses were recorded in April, so it is also assumed that the March 2011 high-flow event did not have a negative effect on the adult spotted frog population.
Figure 6. Lincoln-Peterson population estimates for Columbia spotted frogs on the State transect along Dry Creek from 2001 to 2011, Malheur County, Oregon. Note: Estimate for 2002 was not calculated.
(70)(94)(48)(72)
(22)2 (23)
11
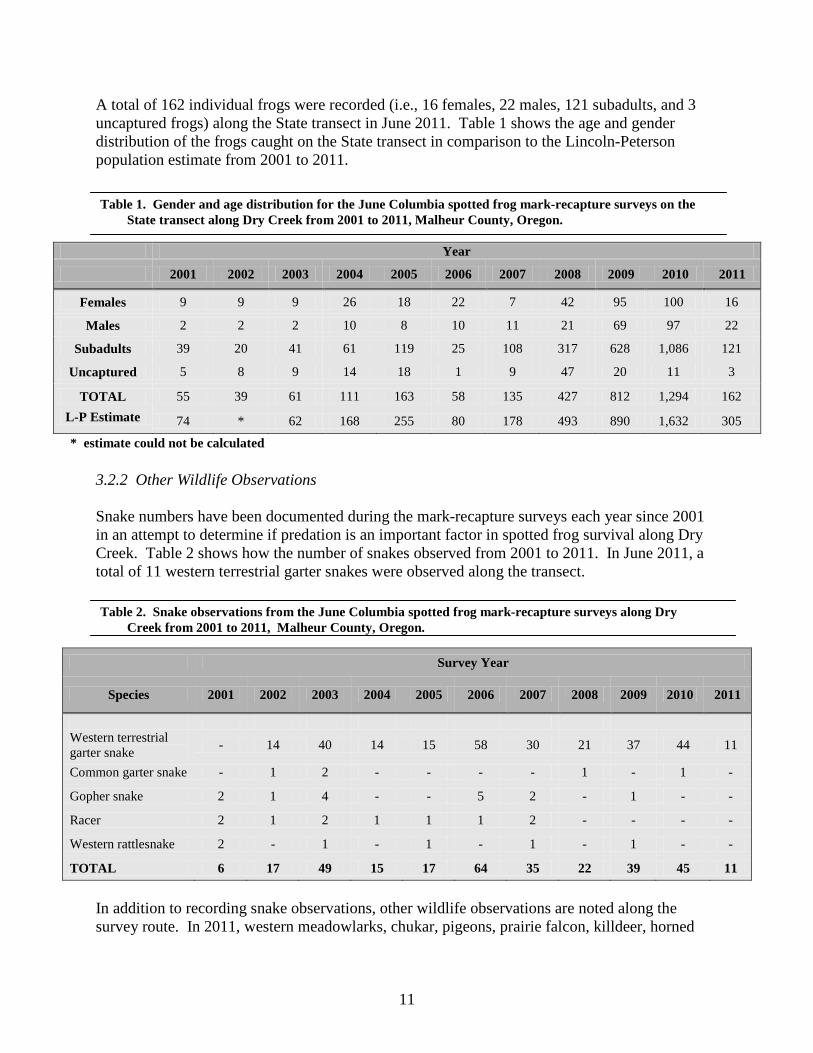
A total of 162 individual frogs were recorded (i.e., 16 females, 22 males, 121 subadults, and 3 uncaptured frogs) along the State transect in June 2011. Table 1 shows the age and gender distribution of the frogs caught on the State transect in comparison to the Lincoln-Peterson population estimate from 2001 to 2011.
3.2.2 Other Wildlife Observations Snake numbers have been documented during the mark-recapture surveys each year since 2001 in an attempt to determine if predation is an important factor in spotted frog survival along Dry Creek. Table 2 shows how the number of snakes observed from 2001 to 2011. In June 2011, a total of 11 western terrestrial garter snakes were observed along the transect.
In addition to recording snake observations, other wildlife observations are noted along the survey route. In 2011, western meadowlarks, chukar, pigeons, prairie falcon, killdeer, horned
Year
2001 2002 2003 2004 2005 2006 2007 2008 2009 2010 2011
Females 9 9 9 26 18 22 7 42 95 100 16
Males 2 2 2 10 8 10 11 21 69 97 22
Subadults 39 20 41 61 119 25 108 317 628 1,086 121
Uncaptured 5 8 9 14 18 1 9 47 20 11 3
TOTAL 55 39 61 111 163 58 135 427 812 1,294 162 L-P Estimate 74 * 62 168 255 80 178 493 890 1,632 305
Survey Year
Species 2001 2002 2003 2004 2005 2006 2007 2008 2009 2010 2011
Western terrestrial garter snake - 14 40 14 15 58 30 21 37 44 11
Common garter snake - 1 2 - - - - 1 - 1 -
Gopher snake 2 1 4 - - 5 2 - 1 - -
Racer 2 1 2 1 1 1 2 - - - -
Western rattlesnake 2 - 1 - 1 - 1 - 1 - -
TOTAL 6 17 49 15 17 64 35 22 39 45 11
Table 2. Snake observations from the June Columbia spotted frog mark-recapture surveys along Dry Creek from 2001 to 2011, Malheur County, Oregon.
Table 1. Gender and age distribution for the June Columbia spotted frog mark-recapture surveys on the State transect along Dry Creek from 2001 to 2011, Malheur County, Oregon.
* estimate could not be calculated
12
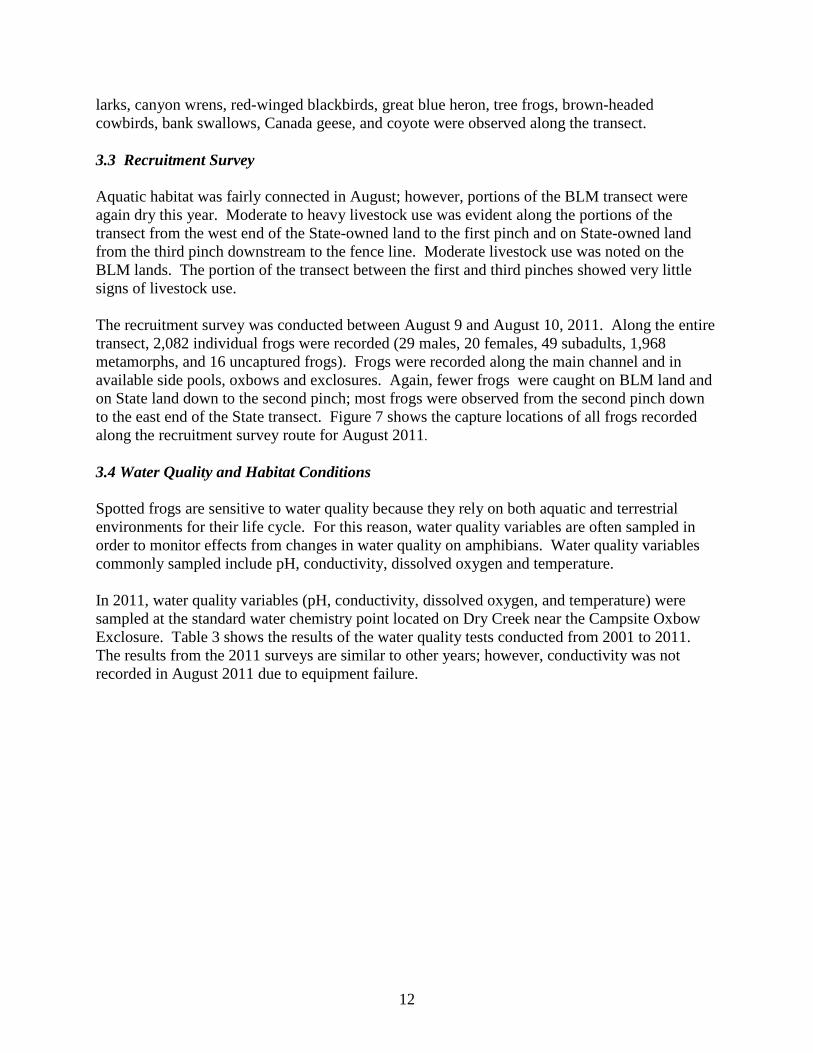
larks, canyon wrens, red-winged blackbirds, great blue heron, tree frogs, brown-headed cowbirds, bank swallows, Canada geese, and coyote were observed along the transect. 3.3 Recruitment Survey Aquatic habitat was fairly connected in August; however, portions of the BLM transect were again dry this year. Moderate to heavy livestock use was evident along the portions of the transect from the west end of the State-owned land to the first pinch and on State-owned land from the third pinch downstream to the fence line. Moderate livestock use was noted on the BLM lands. The portion of the transect between the first and third pinches showed very little signs of livestock use. The recruitment survey was conducted between August 9 and August 10, 2011. Along the entire transect, 2,082 individual frogs were recorded (29 males, 20 females, 49 subadults, 1,968 metamorphs, and 16 uncaptured frogs). Frogs were recorded along the main channel and in available side pools, oxbows and exclosures. Again, fewer frogs were caught on BLM land and on State land down to the second pinch; most frogs were observed from the second pinch down to the east end of the State transect. Figure 7 shows the capture locations of all frogs recorded along the recruitment survey route for August 2011. 3.4 Water Quality and Habitat Conditions Spotted frogs are sensitive to water quality because they rely on both aquatic and terrestrial environments for their life cycle. For this reason, water quality variables are often sampled in order to monitor effects from changes in water quality on amphibians. Water quality variables commonly sampled include pH, conductivity, dissolved oxygen and temperature. In 2011, water quality variables (pH, conductivity, dissolved oxygen, and temperature) were sampled at the standard water chemistry point located on Dry Creek near the Campsite Oxbow Exclosure. Table 3 shows the results of the water quality tests conducted from 2001 to 2011. The results from the 2011 surveys are similar to other years; however, conductivity was not recorded in August 2011 due to equipment failure.
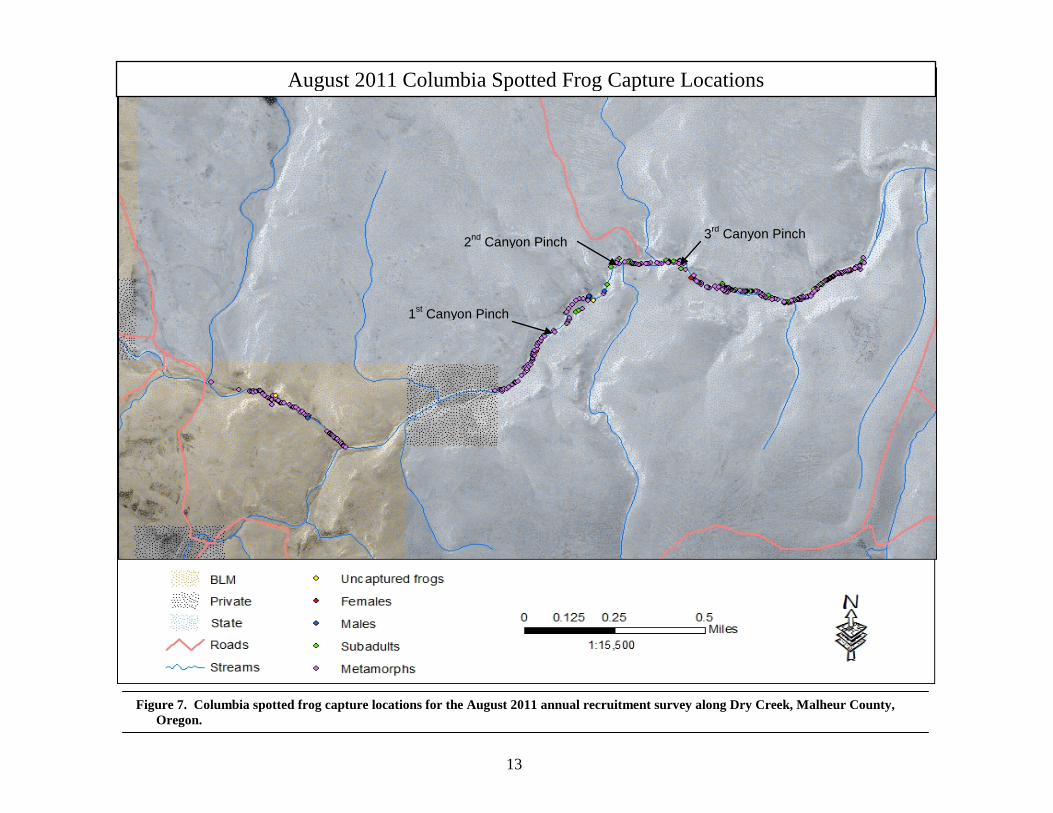
Figure 7. Columbia spotted frog capture locations for the August 2011 annual recruitment survey along Dry Creek, Malheur County, Oregon.
2nd Canyon Pinch
1st Canyon Pinch
3rd Canyon Pinch
13
August 2011 Columbia Spotted Frog Capture Locations
Additionally, streambank soil alteration rating (SSAR) and a vegetation use by animals (VUBA) rating using Platts (1987) have been documented during both the mark-recapture and recruitment surveys each year since 2001. Table 3 shows the percent streambank soil alteration rating SSAR) and the percent vegetation use by animals (VUBA) results of the habitat ratings from 2001 to 2011.
Date Time Water Temp (˚C)
DO Conductivity (ppm) pH
SSAR (percent streambank soil
alteration rating)
VUBA (percent vegetation use by
animals)
June 6, 2001
1310
17.3
14.7
192
9.2
0-25
0-25
August 4, 2001 1335 22.3 16.5 246 9.3 26-50 76-100
June 6, 2002 1315 22.5 -- 1 -- 1 -- 1 26-50 51-75
August 11, 2002 1300 21.8 -- 2 340 8.9 51-75 76-100
June 6, 2003 1200 20.9 12.6 270 9.1 51-75 0-25
August 9, 2003 1355 24.9 16.3 310 8.9 51-75 26-50
June 6, 2004 1515 22.2 13.8 250 8.9 51-75 51-75
August 20, 2004 1440 26.0 14.8 280 9.0 26-50 26-50
June 6, 2005 1730 17.0 14.4 230 8.9 0-25 0-25
August 11, 2005 1249 21.0 15.4 260 9.1 51-75 76-100
June 3, 2006 1330 17.0 10.0 250 10.4 76-100 0-25
August 10, 2006 1302 22.0 7.5 280 8.4 76-100 76-100
June 6, 2007 1700 16.0 12.3 200 9.1 51-75 0-25
August 8, 2007 1210 19.0 9.0 190 8.1 51-75 76-100
June 3, 2008 1120 15.0 8.9 170 6.33 0-25 26-50
August 6, 2008 1147 22.0 9.8 160 -- 1 26-50 76-100
June 3, 2009 0840 19.0 7.6 160 8.5 26-50 0-25
August 5, 2009
June 7, 2010
August 12, 2010
June 3, 2011
August 9, 2011
1518
1140
1735
1258
1348
25.0
18.0
-- 2
12
23
9.9
9.6
9.0
9.2
--1
180
150
-- 1
170
170
8.4
10.8
9.7
8.0
8.7
26-50
26-50
26-50
26-50
26-50
76-100
0-25
76-100
0-25
51-75
Table 3. Habitat ratings and water quality monitoring results for the Dry Creek Columbia spotted frog surveys from 2001 to 2011, Malheur County, Oregon.
1 equipment failure 2 not recorded 3 possible equipment failure
14
15
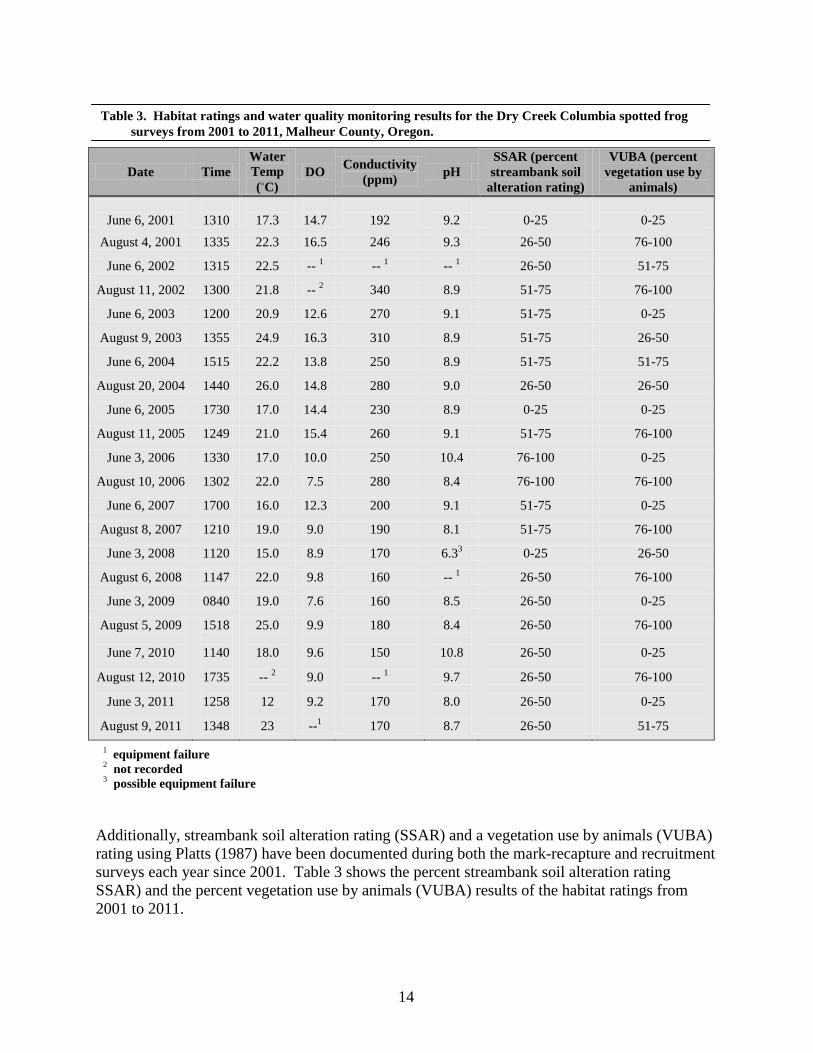
Vegetation use along Dry Creek in June 2011 was light and did not vary much along the transect. However, vegetation use along Dry Creek varied in August 2011, making it more difficult to determine habitat ratings. Figure 8 shows the habitat ratings in combination with the Lincoln-Peterson population estimates from 2001 to 2011. Lincoln-Peterson population estimates are plotted on the same graph as the habitat measures to help determine if a relationship between frog numbers and habitat conditions exists.
3.5 Exclosures In June 2006, three small exclosures were built around areas believed to be important to the spotted frog population within the survey route. Since their construction, minimal maintenance has been completed on the exclosures and until 2010, they were in need of only minor repair (i.e., sagging wires, corner posts pushed up, etc.). However, as a result of the two high-flow events in 2011, all three exclosure fences are in need of a complete re-build or in need of removal. 3.5.1 Campsite Oxbow Exclosure The Campsite Oxbow Exclosure is located just south of the campsite. Due to its close proximity to a livestock trail, the area received a high amount of disturbance from trampling and vegetation loss prior to construction of the exclosure. This exclosure provides aquatic habitat for foraging and overwintering frogs. As of 2011, spotted frog breeding has not been documented at this site. This oxbow pool has had consistent capture success over the past nine years and contains
Figure 8. Habitat measures and Columbia spotted frog population estimates observed along Dry Creek from 2001 to 2011, Malheur County, Oregon. For both habitat ratings depicted here, higher percentages represent poorer habitat conditions. (See Appendix II for rating criteria.)
SSAR
VUBA
L-P Estimate
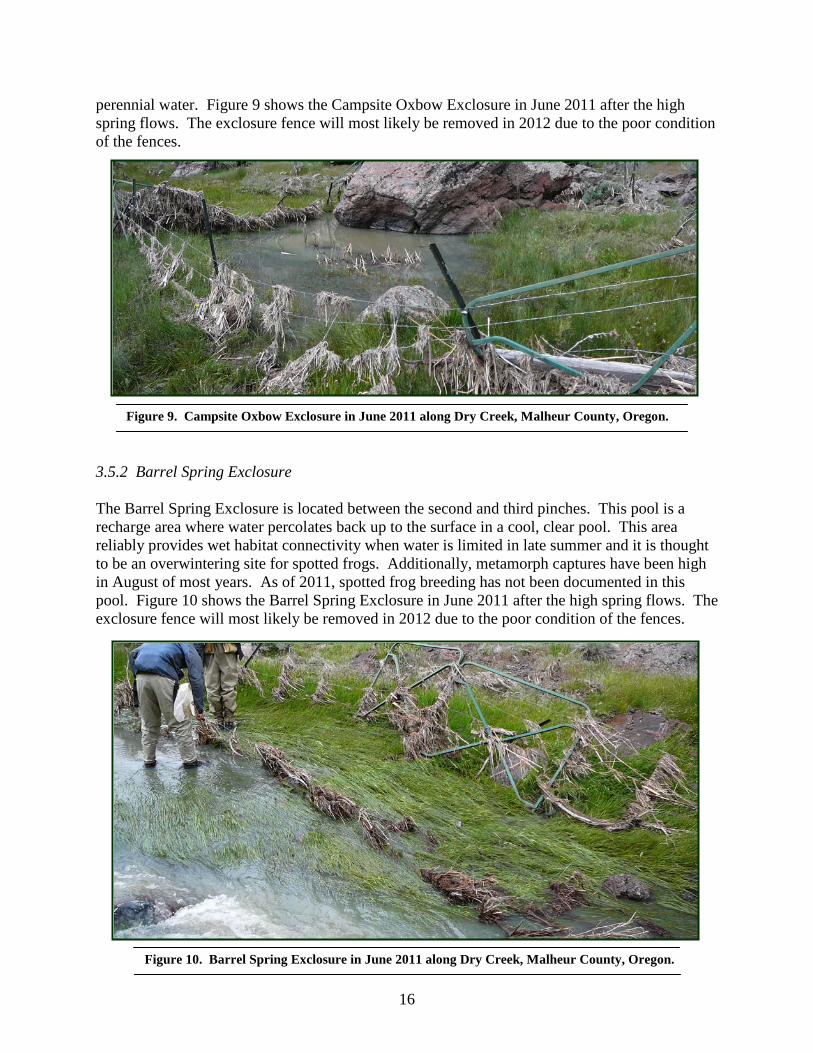
16
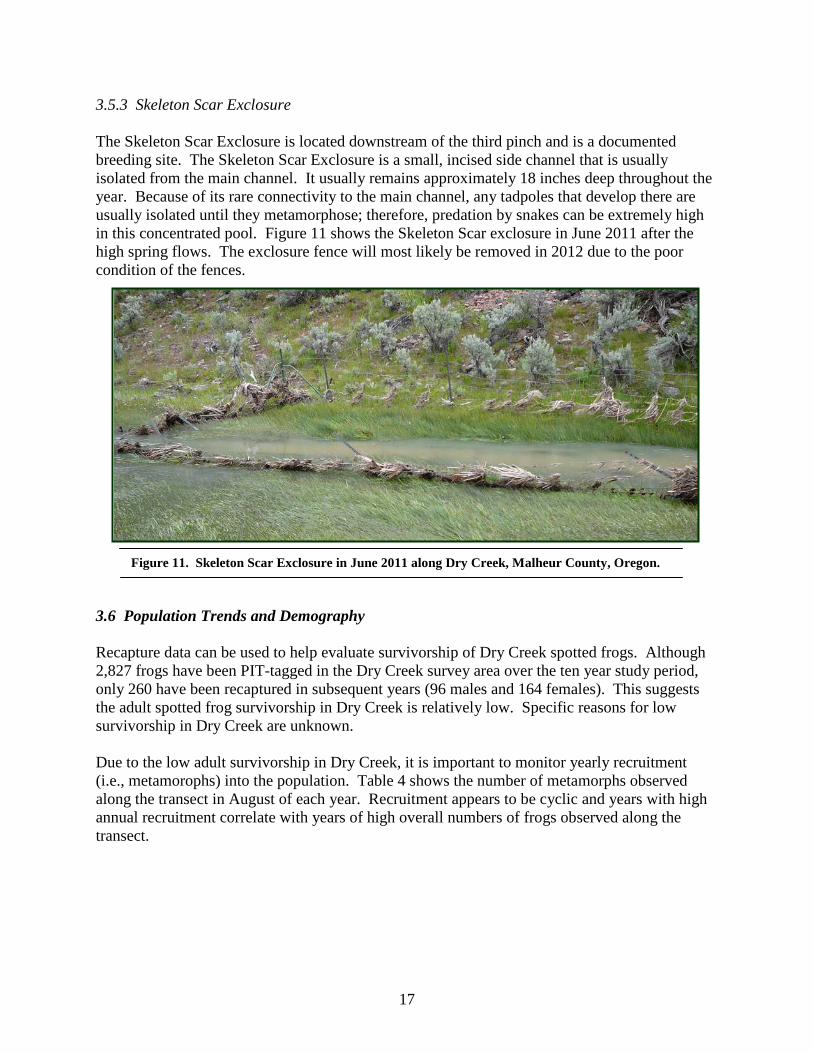
perennial water. Figure 9 shows the Campsite Oxbow Exclosure in June 2011 after the high spring flows. The exclosure fence will most likely be removed in 2012 due to the poor condition of the fences. 3.5.2 Barrel Spring Exclosure The Barrel Spring Exclosure is located between the second and third pinches. This pool is a recharge area where water percolates back up to the surface in a cool, clear pool. This area reliably provides wet habitat connectivity when water is limited in late summer and it is thought to be an overwintering site for spotted frogs. Additionally, metamorph captures have been high in August of most years. As of 2011, spotted frog breeding has not been documented in this pool. Figure 10 shows the Barrel Spring Exclosure in June 2011 after the high spring flows. The exclosure fence will most likely be removed in 2012 due to the poor condition of the fences.
Figure 9. Campsite Oxbow Exclosure in June 2011 along Dry Creek, Malheur County, Oregon.
Figure 10. Barrel Spring Exclosure in June 2011 along Dry Creek, Malheur County, Oregon.
17
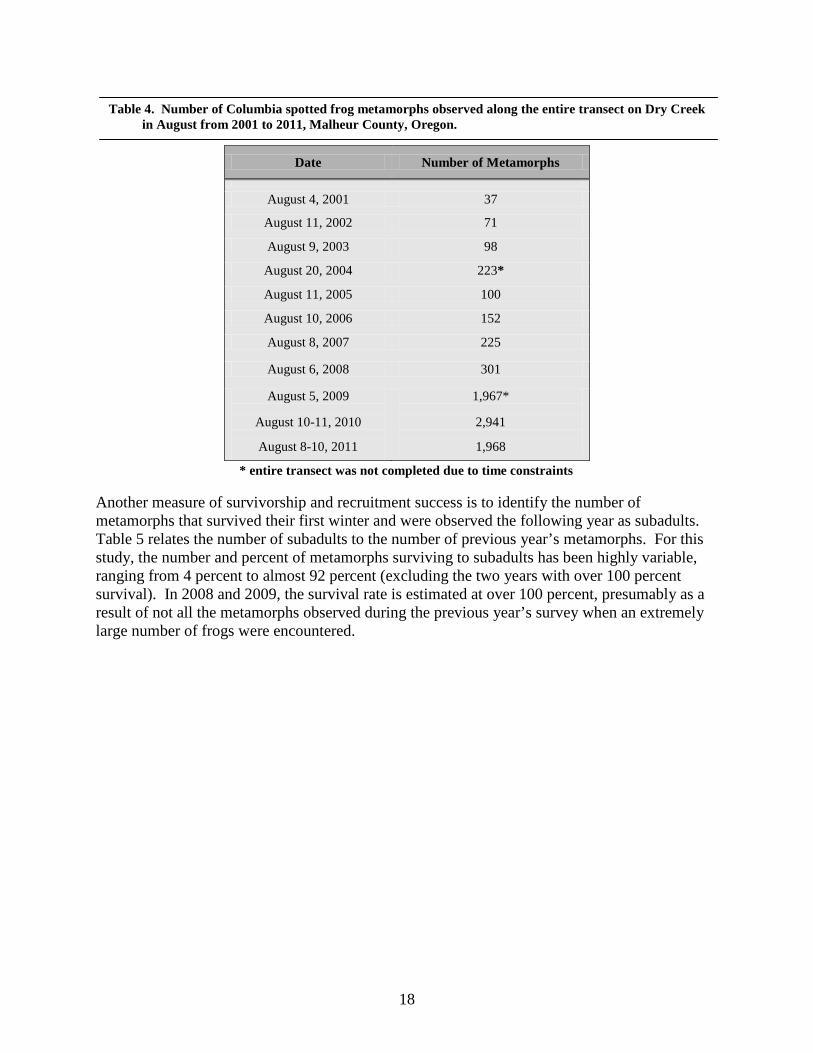
3.5.3 Skeleton Scar Exclosure The Skeleton Scar Exclosure is located downstream of the third pinch and is a documented breeding site. The Skeleton Scar Exclosure is a small, incised side channel that is usually isolated from the main channel. It usually remains approximately 18 inches deep throughout the year. Because of its rare connectivity to the main channel, any tadpoles that develop there are usually isolated until they metamorphose; therefore, predation by snakes can be extremely high in this concentrated pool. Figure 11 shows the Skeleton Scar exclosure in June 2011 after the high spring flows. The exclosure fence will most likely be removed in 2012 due to the poor condition of the fences.
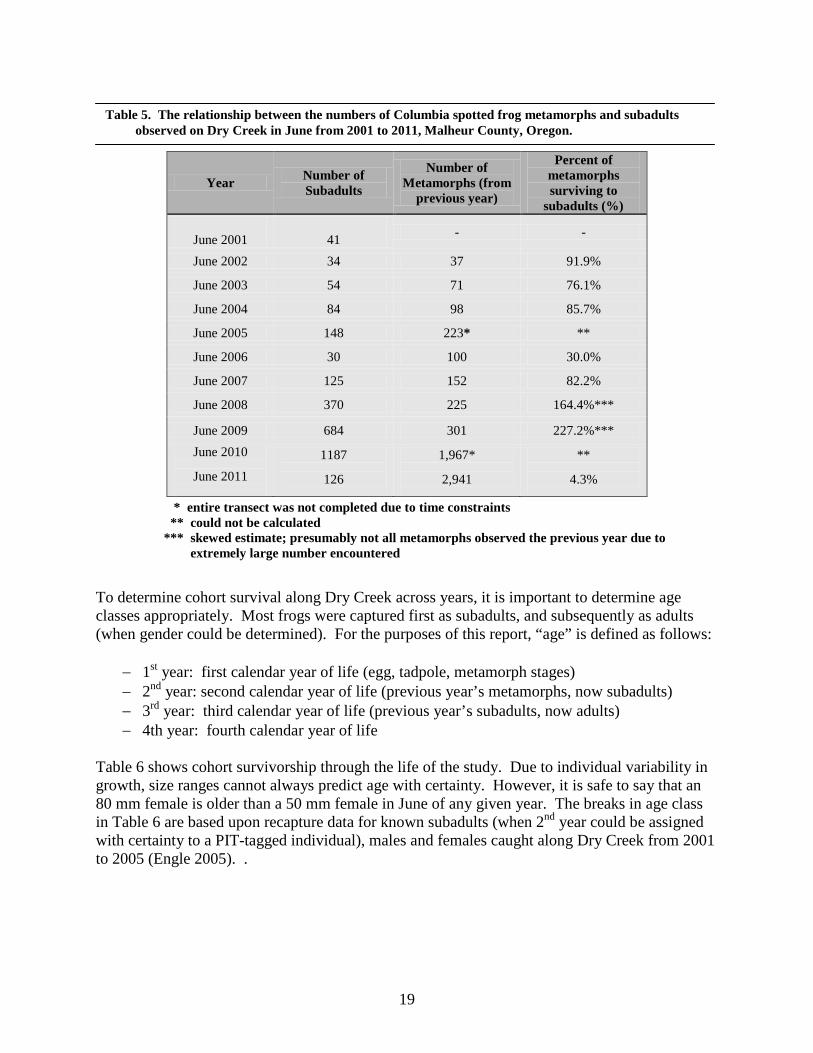
3.6 Population Trends and Demography Recapture data can be used to help evaluate survivorship of Dry Creek spotted frogs. Although 2,827 frogs have been PIT-tagged in the Dry Creek survey area over the ten year study period, only 260 have been recaptured in subsequent years (96 males and 164 females). This suggests the adult spotted frog survivorship in Dry Creek is relatively low. Specific reasons for low survivorship in Dry Creek are unknown. Due to the low adult survivorship in Dry Creek, it is important to monitor yearly recruitment (i.e., metamorophs) into the population. Table 4 shows the number of metamorphs observed along the transect in August of each year. Recruitment appears to be cyclic and years with high annual recruitment correlate with years of high overall numbers of frogs observed along the transect.
Figure 11. Skeleton Scar Exclosure in June 2011 along Dry Creek, Malheur County, Oregon.
18
* entire transect was not completed due to time constraints
Another measure of survivorship and recruitment success is to identify the number of metamorphs that survived their first winter and were observed the following year as subadults. Table 5 relates the number of subadults to the number of previous year’s metamorphs. For this study, the number and percent of metamorphs surviving to subadults has been highly variable, ranging from 4 percent to almost 92 percent (excluding the two years with over 100 percent survival). In 2008 and 2009, the survival rate is estimated at over 100 percent, presumably as a result of not all the metamorphs observed during the previous year’s survey when an extremely large number of frogs were encountered.
Date Number of Metamorphs
August 4, 2001 37
August 11, 2002 71
August 9, 2003 98
August 20, 2004 223*
August 11, 2005 100
August 10, 2006 152
August 8, 2007 225
August 6, 2008 301
August 5, 2009
August 10-11, 2010
August 8-10, 2011
1,967*
2,941
1,968
Table 4. Number of Columbia spotted frog metamorphs observed along the entire transect on Dry Creek in August from 2001 to 2011, Malheur County, Oregon.
19
* entire transect was not completed due to time constraints ** could not be calculated *** skewed estimate; presumably not all metamorphs observed the previous year due to extremely large number encountered
To determine cohort survival along Dry Creek across years, it is important to determine age classes appropriately. Most frogs were captured first as subadults, and subsequently as adults (when gender could be determined). For the purposes of this report, “age” is defined as follows:
− 1st year: first calendar year of life (egg, tadpole, metamorph stages) − 2nd year: second calendar year of life (previous year’s metamorphs, now subadults) − 3rd year: third calendar year of life (previous year’s subadults, now adults) − 4th year: fourth calendar year of life
Table 6 shows cohort survivorship through the life of the study. Due to individual variability in growth, size ranges cannot always predict age with certainty. However, it is safe to say that an 80 mm female is older than a 50 mm female in June of any given year. The breaks in age class in Table 6 are based upon recapture data for known subadults (when 2nd year could be assigned with certainty to a PIT-tagged individual), males and females caught along Dry Creek from 2001 to 2005 (Engle 2005). .
Year Number of Subadults
Number of Metamorphs (from
previous year)
Percent of metamorphs surviving to
subadults (%)
June 2001
41 - -
June 2002 34 37 91.9%
June 2003 54 71 76.1%
June 2004 84 98 85.7%
June 2005 148 223* **
June 2006 30 100 30.0%
June 2007 125 152 82.2%
June 2008 370 225 164.4%***
June 2009 684 301 227.2%*** June 2010
June 2011
1187
126
1,967*
2,941
**
4.3%
Table 5. The relationship between the numbers of Columbia spotted frog metamorphs and subadults observed on Dry Creek in June from 2001 to 2011, Malheur County, Oregon.
Life Stage Cohort/“Birth” year
1998 cohort
1999 cohort
2000 cohort
2001 cohort
2002 cohort
2003 cohort
2004 cohort
2005 cohort
2006 cohort
2007 cohort
2008 cohort
2009 cohort
2010 cohort
2011 cohort
1st y
ear
of li
fe
Egg masses Unknown Unknown Unknown Unknown Unknown Unknown
12 masses, at least 6,000
individuals
Unknown Unknown Unknown
13 masses, at least 6,500
individuals
Unknown
70 masses, at least 35,000
individuals
98 masses, at least 49,000
individuals
Metamorph
(Gosner
stage 47 to 45mm in August)
Unknown Unknown Unknown
(2001 survey)
37
(2002 survey)
71
(2003 survey)
98
(2004 survey)
223*
(2005 survey)
100
(2006 survey)
152
(2007 survey)
225
(2008 survey)
301
(2009 survey)
1,967*
(2010 survey)
2,941
(2011
survey)
1,968
2nd y
ear
of li
fe
Subadult
(39-60mm in
June; no males over
53mm; females to 69mm in August)
Unknown Unknown
(2001 survey)
41
(2002 survey)
34
(2003 survey)
54
(2004 survey)
84
(2005 survey)
148
(2006 survey)
30
(2007 survey)
125
(2008 survey)
370
(2009 survey)
684
(2010 survey)
1,187
(2011 survey)
175
3rd y
ear
of li
fe
Adult
(females 61-
75mm in June;
females70-75mm in August;
males 54-57mm)
Unknown
(2001 survey)
3 females 0 males
3
(2002 survey)
7 females 3 males
10
(2003 survey)
11 females
3 males
14
(2004 survey)
18 females
8 males
26
(2005 survey)
16 females
6 males
22
(2006 survey)
19 females 11 males
30
(2007 survey)
8 females 8 males
16
(2008 survey)
42 females 24 males
66
(2009 survey)
93 females 46 males
139
(2010 survey)
98 females 94 males
192
(2011 survey)
30 females 23 males
63
4th +
yea
r of
life
Adult
(females 76+ mm;
males 58+ mm)
(2001 survey)
4 females 3 males
7
(2002 survey)
1 female 1 male
2
(2003 survey)
0 females 3 males
3
(2004 survey)
1 female 1 male
2
2005 survey)
0 females 0 males
0
(2006 survey)
1 females 4 males
5
(2007 survey)
2 females 6 males
8
(2008 survey)
3 females 17 males
20
(2009 survey)
16 females 36 males
52
(2010 survey)
11 females 44 males
55
(2011 survey)
2 females 19 males
21
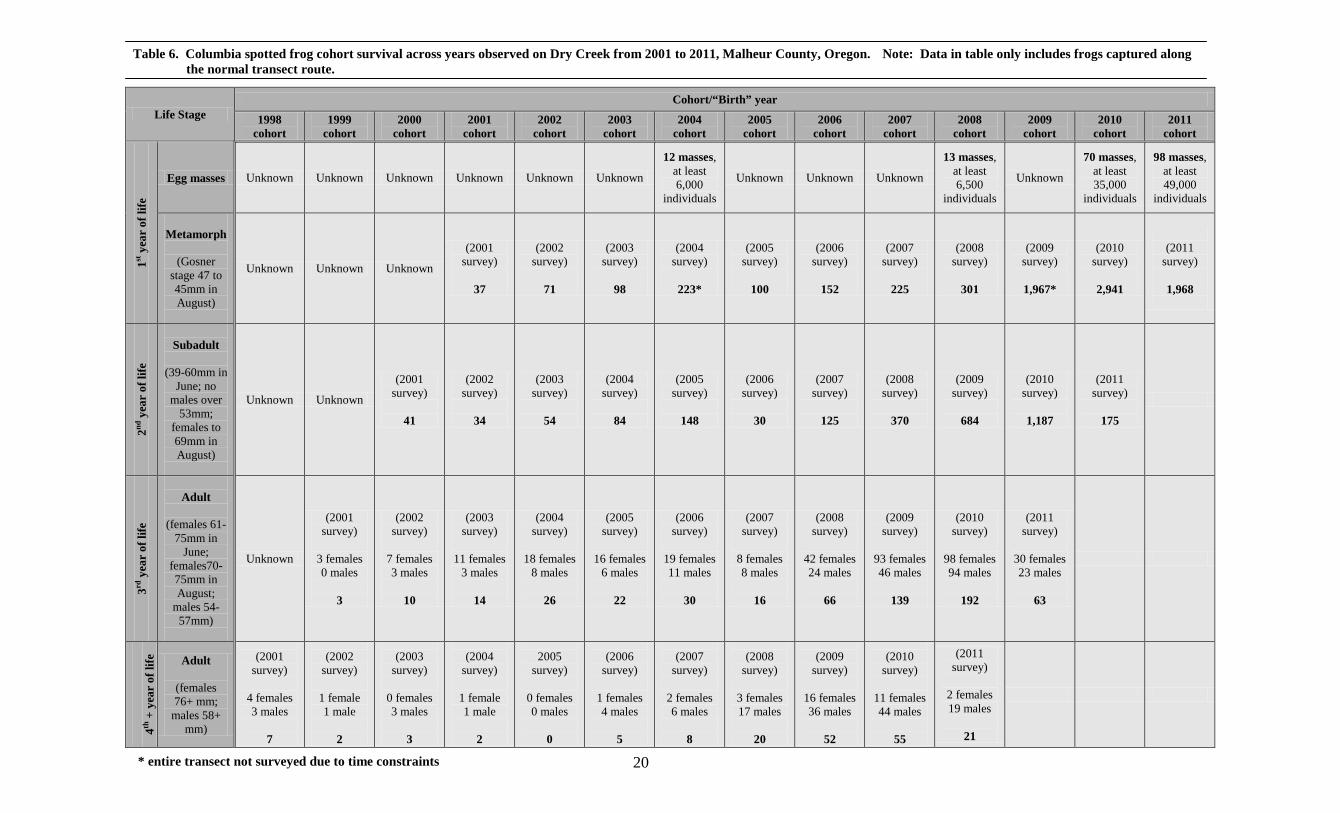
Table 6. Columbia spotted frog cohort survival across years observed on Dry Creek from 2001 to 2011, Malheur County, Oregon. Note: Data in table only includes frogs captured along the normal transect route.
* entire transect not surveyed due to time constraints 20
In addition, the following criteria, based upon capture data, can be used to infer survivorship trends:
− Uncaptured subadults and adults are not included since there is a possibility that they may be captured and counted another time in any given year;
− Uncaptured metamorphs are included because they are only viewed once (in the last survey of the year);
− Recaptured frogs are only counted on the first capture of the year (when it is easiest to determine subadult age class);
− Frogs 42 mm and under in August are considered metamorphs; and − Females captured in August are adjusted for annual growth; males caught in August are
not adjusted for annual growth. Females will continue to grow rapidly between June and August. Males do not have as fast of growth rate between June and August; therefore, males do not need to be adjusted for annual growth in August.
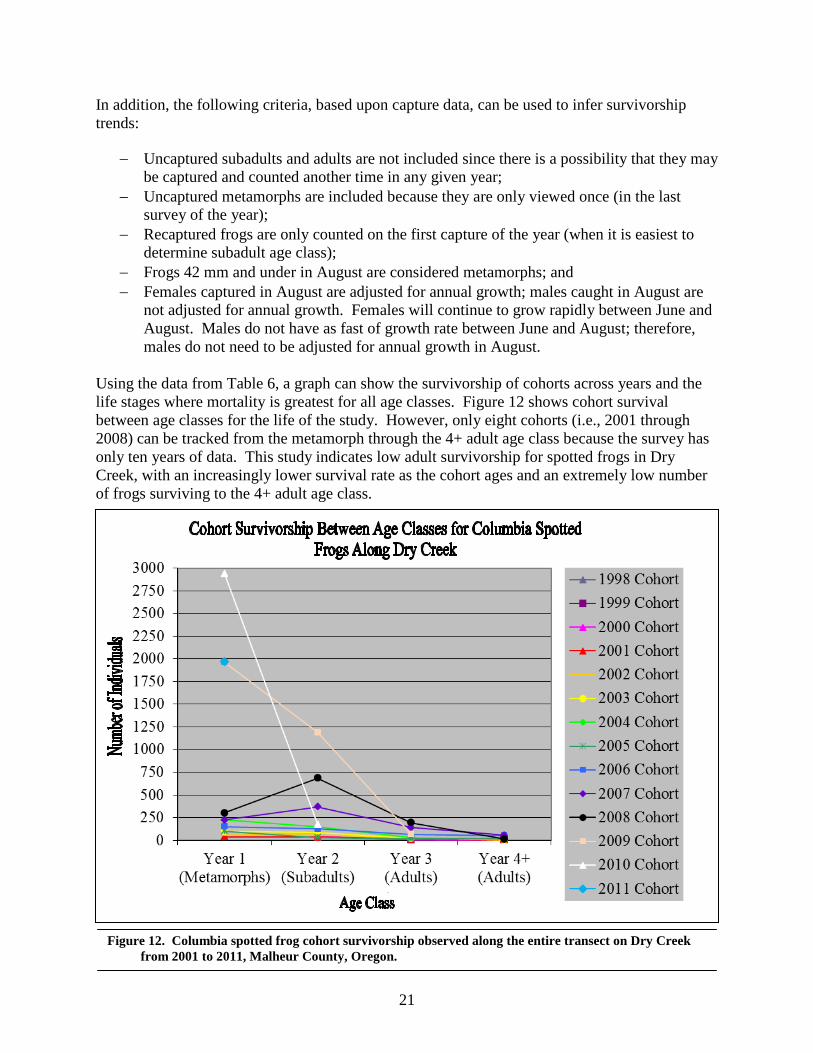
Using the data from Table 6, a graph can show the survivorship of cohorts across years and the life stages where mortality is greatest for all age classes. Figure 12 shows cohort survival between age classes for the life of the study. However, only eight cohorts (i.e., 2001 through 2008) can be tracked from the metamorph through the 4+ adult age class because the survey has only ten years of data. This study indicates low adult survivorship for spotted frogs in Dry Creek, with an increasingly lower survival rate as the cohort ages and an extremely low number of frogs surviving to the 4+ adult age class.
Figure 12. Columbia spotted frog cohort survivorship observed along the entire transect on Dry Creek
from 2001 to 2011, Malheur County, Oregon.
21
22
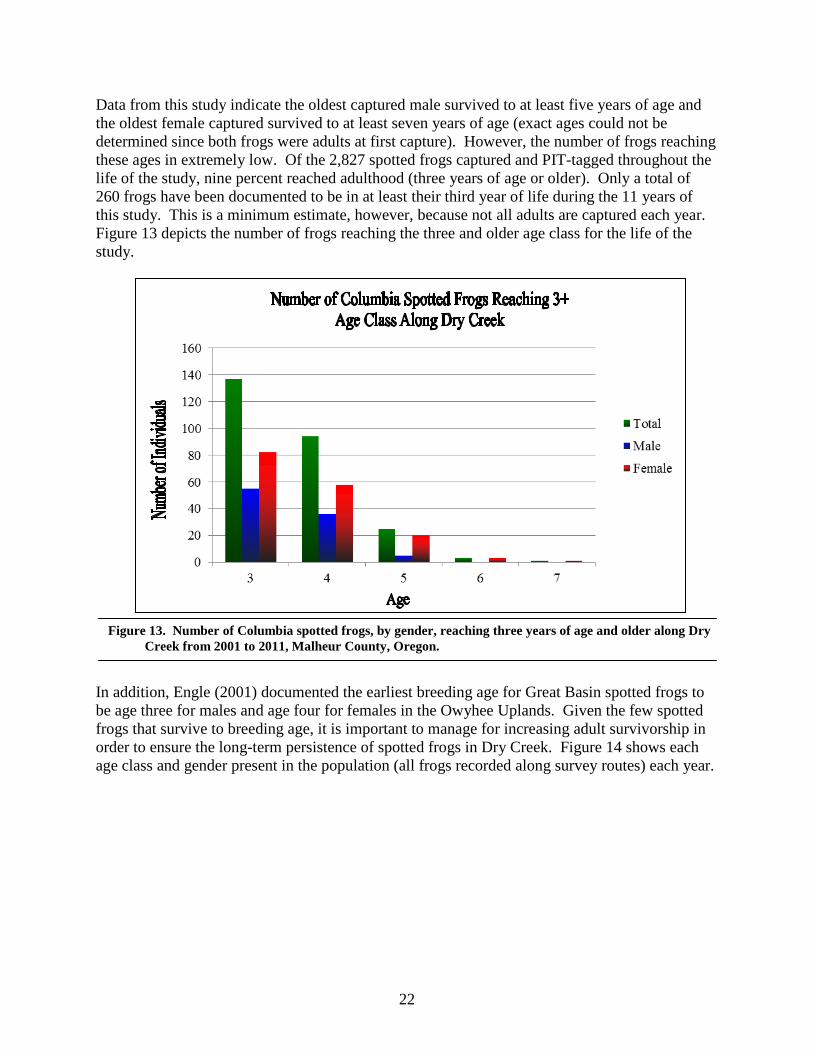
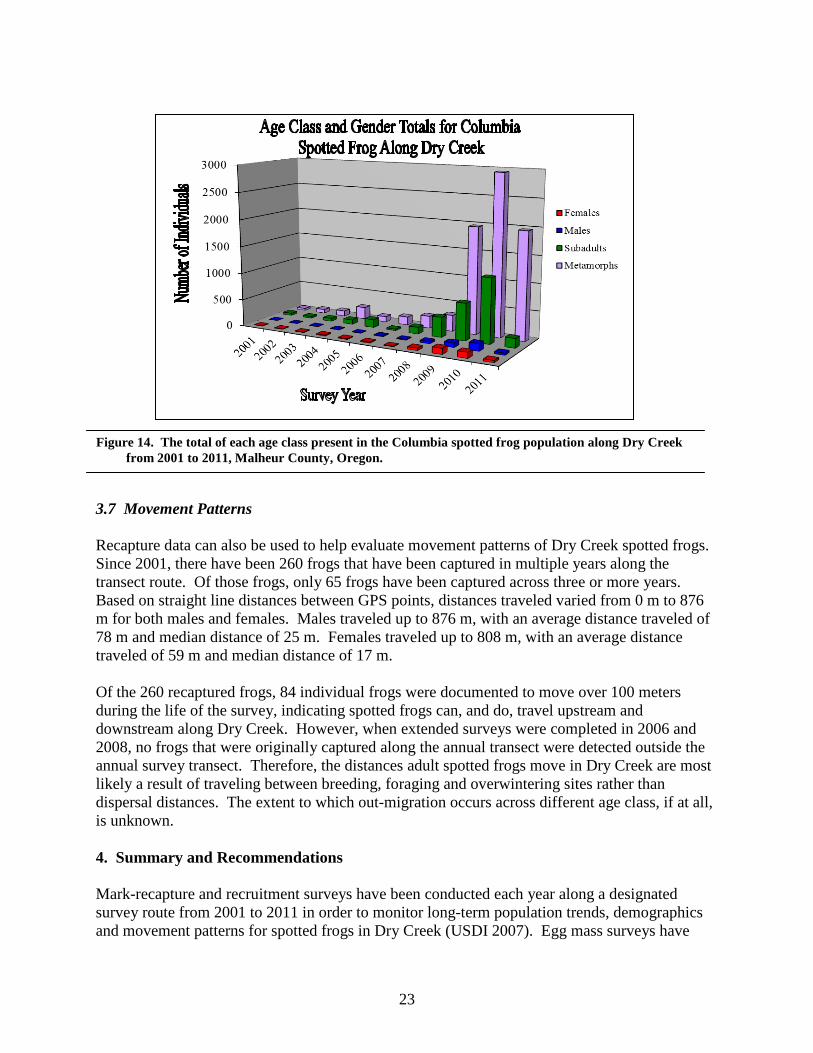
Data from this study indicate the oldest captured male survived to at least five years of age and the oldest female captured survived to at least seven years of age (exact ages could not be determined since both frogs were adults at first capture). However, the number of frogs reaching these ages in extremely low. Of the 2,827 spotted frogs captured and PIT-tagged throughout the life of the study, nine percent reached adulthood (three years of age or older). Only a total of 260 frogs have been documented to be in at least their third year of life during the 11 years of this study. This is a minimum estimate, however, because not all adults are captured each year. Figure 13 depicts the number of frogs reaching the three and older age class for the life of the study. In addition, Engle (2001) documented the earliest breeding age for Great Basin spotted frogs to be age three for males and age four for females in the Owyhee Uplands. Given the few spotted frogs that survive to breeding age, it is important to manage for increasing adult survivorship in order to ensure the long-term persistence of spotted frogs in Dry Creek. Figure 14 shows each age class and gender present in the population (all frogs recorded along survey routes) each year.
Figure 13. Number of Columbia spotted frogs, by gender, reaching three years of age and older along Dry Creek from 2001 to 2011, Malheur County, Oregon.
23
3.7 Movement Patterns Recapture data can also be used to help evaluate movement patterns of Dry Creek spotted frogs. Since 2001, there have been 260 frogs that have been captured in multiple years along the transect route. Of those frogs, only 65 frogs have been captured across three or more years. Based on straight line distances between GPS points, distances traveled varied from 0 m to 876 m for both males and females. Males traveled up to 876 m, with an average distance traveled of 78 m and median distance of 25 m. Females traveled up to 808 m, with an average distance traveled of 59 m and median distance of 17 m. Of the 260 recaptured frogs, 84 individual frogs were documented to move over 100 meters during the life of the survey, indicating spotted frogs can, and do, travel upstream and downstream along Dry Creek. However, when extended surveys were completed in 2006 and 2008, no frogs that were originally captured along the annual transect were detected outside the annual survey transect. Therefore, the distances adult spotted frogs move in Dry Creek are most likely a result of traveling between breeding, foraging and overwintering sites rather than dispersal distances. The extent to which out-migration occurs across different age class, if at all, is unknown. 4. Summary and Recommendations Mark-recapture and recruitment surveys have been conducted each year along a designated survey route from 2001 to 2011 in order to monitor long-term population trends, demographics and movement patterns for spotted frogs in Dry Creek (USDI 2007). Egg mass surveys have
Figure 14. The total of each age class present in the Columbia spotted frog population along Dry Creek from 2001 to 2011, Malheur County, Oregon.
24
only been conducted in 2004, 2008, 2010, and 2011 due to the lack of access into the survey transect in early spring most years. In addition, expanded surveys were completed in 2006 (immediately upstream and downstream of the annual survey transect) and in 2008 (three separate locations downstream of annual survey transect) to document presence and movements of marked frogs upstream and/or downstream of the annual survey route. This study indicates that the Dry Creek spotted frog population may be cyclic. The cycle is most likely a result of many factors working together, including precipitation amounts, timing of precipitation, condition of the habitat and the ability of the habitat to withstand disturbances. Additionally, overwintering sites appear to be limited along Dry Creek. The current condition of Dry Creek may be limiting the number of suitable overwintering sites and the suitability of these overwintering sites may vary from year to year depending on the timing and intensity of grazing, timing and intensity of high-flow events, and other factors. Suitable breeding sites are widespread, but many are not being used; therefore, breeding sites are not considered a limiting factor. This study also indicates low spotted frog adult survivorship, with an increasingly lower survival rate as the cohort ages. An extremely low number of frogs survive to the 4+ age class and the breeding age. Variability in the survivorship of cohorts is most likely caused by factors such as summer and overwintering habitat conditions, precipitation, and temperature. Another factor that may be affecting the Dry Creek population, but was not analyzed in this study is Chytridiomycosis (Chytrid fungus). Chytrid fungus was found to be present in the Dry Creek population in 2006 (Engle 2006), but the extent of this outbreak was not studied. Additionally, the effects and timing of high flow events on the spotted frog population in Dry Creek are unclear. For example, the record number of egg masses found in April 2011 indicates that the timing of the March high flow event in Dry Creek may have had little impact to the spotted frog population (frogs may have still been in their overwintering sites). However, after the May high flow event, very few adult and subadult frogs were documented during the June 2011 survey. Therefore, it is unclear if two high flow events in one year have negative impacts on spotted frogs or whether it was the timing of the May high flow event rather than the event itself that lead to the apparent negative impact. It is also unclear as to whether the adult and subadult frogs were killed by the high flows that occurred in May or were simply washed downstream. Further studies are needed to determine the effect of high flow events on the Dry Creek spotted frog population. In conclusion, the population trend of spotted frogs in Dry Creek is unknown at this time. The likelihood of long-term persistence of spotted frogs in Dry Creek is also unclear given the low adult survivorship and the number of frogs that survive to the breeding age. More survey years are needed to infer trend and long-term persistence. The following are recommendations to be considered for future years:
25
1. Continue monitoring the Dry Creek spotted frog population. Changes in study design may be needed to address questions on effects of weather, land management, disease and other remaining questions.
2. Consider rebuilding and enlarging the exclosures if the current, small exclosures appear to be beneficial and create diverse and reliable frog habitat.
3. Consider changes to the grazing management along Dry Creek if improvements in the
condition of the stream and related riparian habitat are needed (e.g., winter-use grazing has proven beneficial along Dry Creek on BLM-managed lands downstream).
4. Conduct additional, and more frequent, egg mass surveys to document breeding sites (as
weather permits).
26
LITERATURE CITED Bull, E.L. and M.P Hayes. 2002. Overwintering of Columbia Spotted Frogs in Northeastern
Oregon. Northwest Science. 76: 141-147. Bull, E.L. and M.P Hayes. 2000. Livestock effects on reproduction of the Columbia spotted frog.
Journal of Range Management. 53: 291-294. Engle, J.C. 2006. Columbia Spotted Frog (Rana luteiventris) 2006 Monitoring Report Dry Creek,
Oregon. Prepared for the Vale Bureau of Land Management. 57 pp. Engle, J.C. 2005. Columbia Spotted Frog (Rana luteiventris) 2005 Monitoring Report Dry Creek,
Oregon. Prepared for the Vale Bureau of Land Management. 60 pp. Engle, J.C. 2001. Population Biology and Natural History of Columbia spotted frogs (Rana
luteiventris) in the Owyhee Uplands of Southwest Idaho: Implications for Monitoring and Management. M.S. Thesis, Boise State University, Boise, Idaho. 66 pages.
Fellers, G.M. 1997. Design of Amphibian Surveys. In Olson, D.H., Leonard, W.P., and R.B.
Bury, (eds.). Sampling Amphibians in Lentic Habitats. Northwest Fauna No. 4. Society for Northwestern Vertebrate Biology, Olympia, Washington.
Funk, W. C., C. A. Pearl, H. M. Draheim, M. J. Adams, T. D. Mullins, and S. M. Haig. 2008.
Range-wide phylogeographic analysis of the spotted frog complex (Rana luteiventris and Rana pretiosa) in northwestern North America. Mol Phylogenet and Evol.
Green, D. M.; H. Kaiser; T.F. Sharbel; J. Kearsley; K. R. McAllister. 1997. Cryptic Species of
Spotted Frogs, Rana pretiosa Complex, in Western North America. Copeia 1997:1-8. Hayne, D.W. 1949. Two Methods for Estimating Population from Trapping Records. Journal of
Mammalogy. Vol. 30, No. 4, pp. 399-411. McAllister, K.R., and H.Q. White. 2001. Oviposition Ecology of the Oregon Spotted Frog at
Beaver Creek, Washington. Final Report. WDFW, Olympia, Washington 24 pp. McAllister, K.R. and W. P. Leonard. 1997. Washington State status report for the Oregon
Spotted Frog. WDFW, Olympia, Washington. 38 pp. Nichols, J.D., B.R. Noon, S. L. Stokes, and J.E. Hines. 1981. Remarks on the Use of Mark-
recapture Methodology in Estimating Avian Population Size. In C.J. Ralph and J.M. Scott (eds.). Estimating Numbers of Terrestrial Birds. Studies in Avian Biology No. 6. Cooper Ornithological Society, Lawrence, Kansas.
Nussbaum, R.A.; E.D. Brodie, Jr.; and R.M. Storm. 1983. Amphibians and reptiles of the Pacific
Northwest. University of Idaho Press, Moscow, Idaho. 332pp.
27
Platts W. S. 1987. Methods for evaluating riparian habitat with applications to management. USFS Intermountain Forest and Range Experiment Station. Ogden, Utah. GTR INT-221.
Tait, C. 2007. Personal communication on August 16, 2007, between Cynthia Tait, US Forest
Service, Ogden, Utah and Marisa Meyer, U.S. Fish and Wildlife Service, La Grande, Oregon concerning the Columbia spotted frog surveys on Dry Creek.
USDI. U.S. Fish and Wildlife Service. 2007. Intra-Governmental Order between Vale District
BLM and U.S. Fish and Wildlife Service La Grande Field Office. Agreement No. HVI070006. October 19, 2007.
USDI. U.S. Fish and Wildlife Service. 1993. Endangered and threatened wildlife and plants; 12-
month finding on petition to list the spotted frog. Federal Register 58:27260-27263. May 7, 1993.
USDI. U.S. Fish and Wildlife Service. 2011. US Fish and Wildlife Service Species Assessment
and Listing Priority Assignment Form. Federal Register 76:66370-66439. October 26, 2011. http://www.gpo.gov/fdsys/pkg/FR-2011-10-26/pdf/2011-27122.pdf
Watson, J.W., K.R. McAllister, D. J. Pierce, and A. Alvarado. 2000. Ecology of a remnant
population of Oregon spotted frogs (Rana pretiosa) in Thurston County, Washington. Final Report. WDFW, Olympia, Washington.
WRRC. Western Regional Climate Center. 2011. Remote Automated Weather Station (RAWS)
USA Climate Archive for Red Butte, Oregon, located at http://www.raws.dri.edu/cgi-bin/rawMAIN.pl?orORED
28
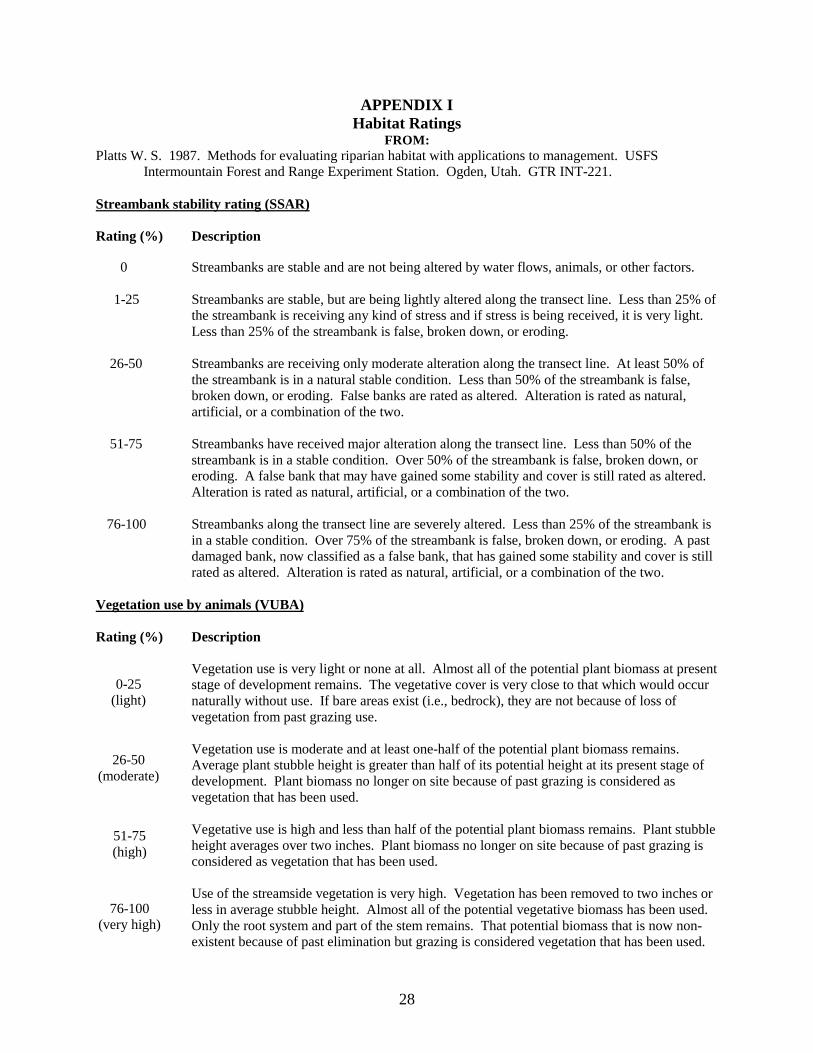
APPENDIX I Habitat Ratings
FROM: Platts W. S. 1987. Methods for evaluating riparian habitat with applications to management. USFS
Intermountain Forest and Range Experiment Station. Ogden, Utah. GTR INT-221.
Streambank stability rating (SSAR) Rating (%) Description 0 Streambanks are stable and are not being altered by water flows, animals, or other factors.
1-25 Streambanks are stable, but are being lightly altered along the transect line. Less than 25% of the streambank is receiving any kind of stress and if stress is being received, it is very light. Less than 25% of the streambank is false, broken down, or eroding.
26-50 Streambanks are receiving only moderate alteration along the transect line. At least 50% of
the streambank is in a natural stable condition. Less than 50% of the streambank is false, broken down, or eroding. False banks are rated as altered. Alteration is rated as natural, artificial, or a combination of the two.
51-75 Streambanks have received major alteration along the transect line. Less than 50% of the
streambank is in a stable condition. Over 50% of the streambank is false, broken down, or eroding. A false bank that may have gained some stability and cover is still rated as altered. Alteration is rated as natural, artificial, or a combination of the two.
76-100 Streambanks along the transect line are severely altered. Less than 25% of the streambank is
in a stable condition. Over 75% of the streambank is false, broken down, or eroding. A past damaged bank, now classified as a false bank, that has gained some stability and cover is still rated as altered. Alteration is rated as natural, artificial, or a combination of the two.
Vegetation use by animals (VUBA) Rating (%) Description
Vegetation use is very light or none at all. Almost all of the potential plant biomass at present stage of development remains. The vegetative cover is very close to that which would occur naturally without use. If bare areas exist (i.e., bedrock), they are not because of loss of vegetation from past grazing use.
Vegetation use is moderate and at least one-half of the potential plant biomass remains. Average plant stubble height is greater than half of its potential height at its present stage of development. Plant biomass no longer on site because of past grazing is considered as vegetation that has been used. Vegetative use is high and less than half of the potential plant biomass remains. Plant stubble height averages over two inches. Plant biomass no longer on site because of past grazing is considered as vegetation that has been used. Use of the streamside vegetation is very high. Vegetation has been removed to two inches or less in average stubble height. Almost all of the potential vegetative biomass has been used. Only the root system and part of the stem remains. That potential biomass that is now non-existent because of past elimination but grazing is considered vegetation that has been used.
0-25 (light)
26-50 (moderate)
51-75 (high)
76-100 (very high)