2011-2012 Fact Sheet Physical Therapist Education Programs
25
COMMISSION ON ACCREDITATION IN PHYSICAL THERAPY EDUCATION| 1111 N. FAIRFAX ST. ALEXANDRIA, VA [email protected] AGGREGATE PROGRAM DATA 2017 – 2018 PHYSICAL THERAPIST EDUCATION PROGRAMS FACT SHEETS
Transcript of 2011-2012 Fact Sheet Physical Therapist Education Programs

COMMISSION ON ACCREDITATION IN PHYSICAL THERAPY EDUCATION| 1111 N. FAIRFAX ST. ALEXANDRIA, VA [email protected]
AGGREGATE PROGRAM DATA 2017 – 2018 PHYSICAL THERAPIST EDUCATION PROGRAMS FACT SHEETS

2017 – 18 Fact Sheets Physical Therapist Education Programs
1 Introduction & Contents
2017 – 18 Fact Sheet Physical Therapist Education Programs
This Fact Sheet is designed to provide the education community with current and historical information about physical therapist education programs, students and faculty. The data included in this Fact Sheet is taken from the following sources:
THE 2017 ANNUAL ACCREDITATION REPORT, COMPLETED DECEMBER 2017 BY US ACCREDITED PROGRAMS THE 2016, 2015, 2014, 2012, 2011, 2010, 2009, 2008, 2007, AND 2006 ANNUAL ACCREDITATION REPORTS THE 2000, 2002, AND 2004 BIENNIAL ACCREDITATION REPORTS PREVIOUS SURVEYS OF THE PT EDUCATIONAL PROGRAMS CONDUCTED BY THE EDUCATION DIVISION DEPARTMENT OF ACCREDITATION RECORDS LICENSURE PASS RATE INFORMATION PROVIDED BY THE FSBPT ON APRIL 2005, APRIL 2006, APRIL 2007, APRIL 2011, APRIL 2012, APRIL 2014, APRIL 2015, APRIL 2016, APRIL 2017 AND DECEMBER 2017.
Unless otherwise indicated, the data reflects accredited and developing physical therapist education programs in the United States for the academic year 2017 – 18. All uses of this data should reference the Commission on Accreditation in Physical Therapy Education (CAPTE) as the source of the data and acknowledge that CAPTE bears no responsibility for interpretations presented or conclusions reached based on analysis of the data. Symbols Many tables in this volume use a series of symbols to alert the reader to special statistical notes. These symbols, and their meanings, are as follows: — Not available. † Not applicable. # Rounds to zero. ‡ Reporting standards not met. Originally Published March 12, 2018 Last Updated October 23, 2018 (updates made after the date of original publication will be highlighted in yellow) CAPTE’s Home Page address is www.capteonline.org CAPTE’s Resource Documents address is www.capteonline.org/resources This publication is only available online. To download, view, and print the report as a PDF file, go to CAPTE’s Resource Documents address shown above. CONTENT CONTACT TEJ CHANA – SR. DATABASE SPECIALIST [email protected]

2017 – 18 Fact Sheets Physical Therapist Education Programs
2 Introduction & Contents
Glossary Faculty – All faculty including core and associated. Associated Faculty – Associated faculty are those individuals who have classroom and/or laboratory teaching responsibilities in the curriculum and who are not core faculty or clinical education faculty. The associated faculty may include individuals with full-time appointments in the unit in which the professional program resides, but who have primary responsibilities in programs other than the professional program. Core Faculty – Core faculty are those individuals appointed to and employed primarily in the program. Members of the core faculty typically have full-time appointments, although some part-time faculty members may be included among the core faculty. The core faculty are generally the group with the responsibility and the authority related to the curriculum. Includes Program Directors and DCEs; does not include associated faculty. Other Faculty – Core faculty excluding Program Directors and Clinical Education Coordinators (DCEs & ACCEs).
Table of Contents Glossary ................................................................................................................................................................................... 2
THE AVERAGE PHYSICAL THERAPIST PROGRAM ..................................................................................................................... 3
PROGRAM DATA ..................................................................................................................................................................... 6
Numbers of Programs ......................................................................................................................................................... 6
Distribution of Programs ..................................................................................................................................................... 7
Financing of Professional Education ................................................................................................................................... 8
Measures of Program Length .............................................................................................................................................. 9
Credits Required ............................................................................................................................................................... 10
Clinical Education .............................................................................................................................................................. 11
Outcomes .......................................................................................................................................................................... 12
STUDENT DATA ..................................................................................................................................................................... 13
Admissions ........................................................................................................................................................................ 13
Enrollment......................................................................................................................................................................... 15
Graduates .......................................................................................................................................................................... 16
FACULTY DATA ...................................................................................................................................................................... 17
Number of Faculty ............................................................................................................................................................ 17
Ratios ................................................................................................................................................................................ 17
Workload ........................................................................................................................................................................... 17
Scholarship & Grants ......................................................................................................................................................... 18
Clinical Specialists ............................................................................................................................................................. 18
Faculty Demographics ....................................................................................................................................................... 19
Degrees Held, Rank, Tenure Status ................................................................................................................................... 19
Salaries .............................................................................................................................................................................. 22

2017 – 18 Fact Sheets Physical Therapist Education Programs
3 Average Program Data
THE AVERAGE PHYSICAL THERAPIST PROGRAM 2015-2016 2016-2017 2017-2018 Type of Institution (% of Total Programs) Private (52.8%) Private (50.9%) Private (51.8%)
Geographic Location (% of Total Programs) South Atlantic (19%) South Atlantic (20%) South Atlantic (21%)
Top 3 States (States with Highest % of Total Programs) (NY, PA, CA-TX same total) (NY, PA, CA-TX same total) (NY, PA, CA-TX same total)
Costs (Mean) Public Private Public Private Public Private
Annual Tuition 15,404 33,411 17,175 35,199 17,742 35,534
Annual Fees 2,445 1,501 2,490 1,575 2,340 1,951
Total Cost of Professional Program *Room & Board Excluded
48,135 105,229 59,210 105,857 60,627 109,099
Admissions (Mean) 2015 2016 2017
Planned Class Size 50 45 45
Total Applicants 494 500 502
Applicants Qualified 326 336 330
Applicants Offered Place 81 87 86
Applicants Enrolled 44 44 46
GPA of Enrollees 3.5 3.6 3.6
Enrollment (Mean)
Total Students Enrolled 124 133 136
Percent Women Enrolled 62% 62% 62%
Percent Minority Enrolled 19% 22.9% 23.9%
Outcomes (US Programs)
Degree Awarded (% of Total Programs) DPT (98.6%) DPT (99.2%) DPT (100%)
Graduates Per Program (Mean) 41.8 41.3
43
Graduation rate (Mean) 95.9%(‘14) 95.5%(‘15) 97.2%(‘16)
Percent Graduates Minority (Mean) 20.1% 20.3% 20.9%
Licensure Pass Rate, First Time Takers (Mean) 89.8%(’14) 91%(’15) 92.59(’16)
Licensure Pass Rate, Ultimate (Mean) 98.1% 98.2% 98.3%
Employment Rate, Post 6 Months Graduation (Mean) 99% 99% 99%
Length of Program (Professional Phase)
Curricular Format (% of Total Programs) 4+3 (66.93%) 4+3 (65.3%) 4+3 (64.3%)
Weeks in Class (Didactic/Laboratory) (Mean) 122.4 95 88.2
Weeks in Class (Full-Time Clinical Education) (Mean) 34 36 35.7
Total Weeks in Program (Mean) 122.4 123.4 123.3
2017 – 18 Fact Sheets Physical Therapist Education Programs
4 Average Program Data
2015-2016 2016-2017 2017-2018 Contact/Clock Hours (Didactic/Laboratory) (Mean) 1,869 1,882 --
Contact/Clock Hours (Clinical Education) (Mean) 1,440 1,535 --
Total Contact/Clock Hours in Program (Mean) 3,363 3,405 --
Curriculum (Mean)
Academic Calendar Semesters (85%) Semesters (86%) Semesters (86.7%)
Curricular Model Hybrid (76%) Hybrid (75%) Hybrid (76%)
Total Semester Credits Required to Complete 113 120 115
Semester Credits in Professional Phase 102 95 95
Semester Credits in Prerequisite Phase 118 120 119
Clinical Education (Mean)
Clinical Education Sites 415 581 579
Credentialed Clinical Instructors 53 53 53
Certified Clinical Instructors 26 27 29
Faculty (Mean)
Full-Time Core Faculty Positions 10 11 11
Part-Time Core Faculty Positions 1 1 1
Associated Faculty Positions 7.5 7.9 8
Core Faculty to Student Ratio 1:11 1:12 1:12
Faculty to Student Ratio (Lab) 1:13 1:13 1:13
Full-Time Core Faculty Characteristics (Mean) Director DCE Faculty** Director* DCE Faculty** Director* DCE Faculty**
Age 59
49
49
65
55
40
55 50.5 53.2
Total Years as Faculty Member 20.9
10.5
12
20.6
10.8
12.5
20.6 10.5 12.4
Years as Faculty Member (Current Program) 13.8
8.8
9.7
13.8
9.1
9.6
13.5 9 9.5
Full-Time Core Faculty Workload (%)
Workload Allotted to Teaching in Entry Level 26.5
37.2
50.9
26.6
37.1
51.4
26.25 37.6 50.6
Workload Allotted to Service 10.3
10.1
10.8
10.4
10.1
11.3
10.1 10.2 11.4
Workload Allotted to Clinical Practice 2.7
4
6.6
2.4
4.3
6.5
2.6 4.6 6.7
Workload Allotted to Scholarship 14.9
10.3
21.1
14.8
10.4
21.1
14.5 10.33 21.1

2017 – 18 Fact Sheets Physical Therapist Education Programs
5 Average Program Data
- Not available. * Director refers to Program Director. ** Faculty refers to Other Faculty, excluding program director and DCE/ACCE.

2017 – 18 Fact Sheets Physical Therapist Education Programs
Program Data 6 Numbers of Programs
PROGRAM DATA Numbers of Programs Figure 1 Number of Accredited and Developing PT Programs
Figure 2 Number of accredited programs by degree offered 1979 – 2018
230 238 241 243
8 12 14 17
0
50
100
150
200
250
300
350
400
450
2013 2015 2016 2017
Num
ber o
f Pro
gram
s
Accredited Developing
0
50
100
150
200
250
300
79 80 81 82 83 84 85 86 87 88 89 90 91 92 93 94 95 96 97 98 99 00 01 02 03 04 05 06 07 08 09 11 12 13 14 15 16 17 18
Master's
DPT
Total
2017 – 18 Fact Sheets Physical Therapist Education Programs
Program Data 7 Distribution of Programs
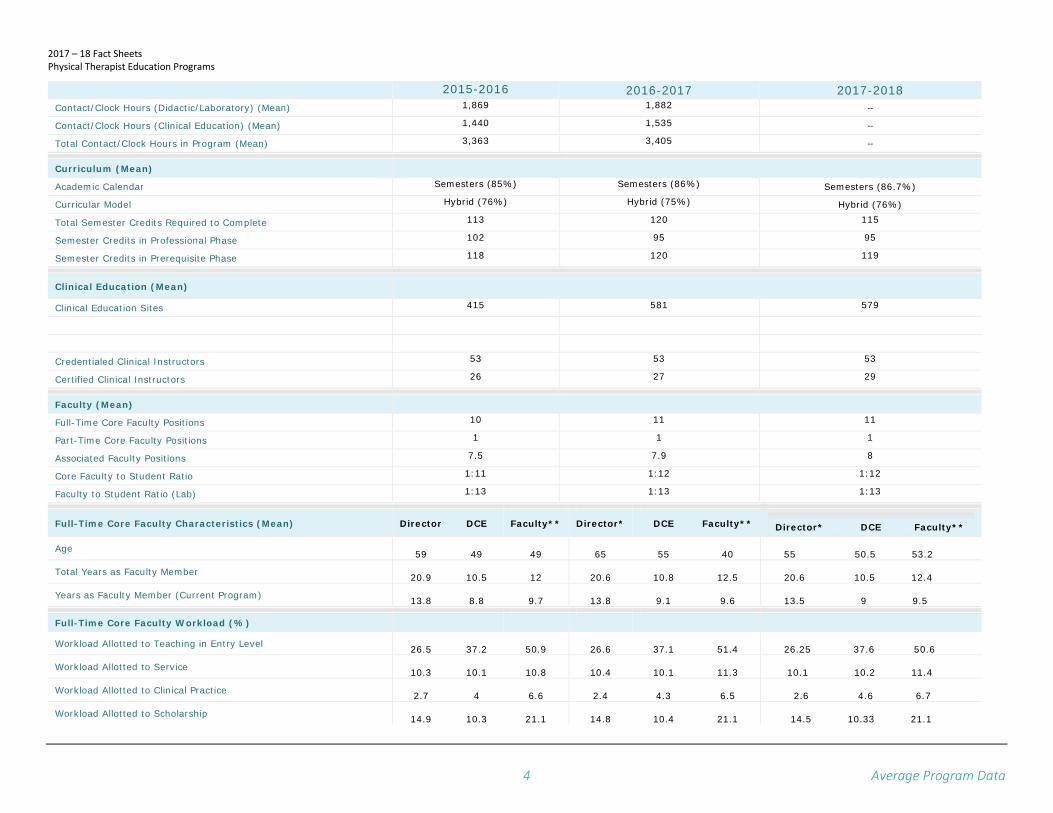
Distribution of Programs Table 1 Distribution of accredited and developing programs by geographical region 2012 – 18 [as of 3/2018]
States 2012 2013 2015 2016 2017 2018 South Atlantic DE, DC, FL, GA, MD, NC, PR, SC, VA, WV 42 44 47 53 54 54
Middle Atlantic NJ, NY, PA 41 41 44 46 46 47
East North Central IL, IN, MI, OH, WI 33 32 34 37 37 37
West North Central IA, KS, MN, MO, NE, ND, SD 23 22 25 26 26 26
West South Central AR, LA, OK, TX 19 20 23 25 25 26
New England CT, ME, MA, NH, RI, VT 17 17 17 17 18 18
Pacific AK, CA, HI, OR, WA 19 18 22 22 22 22
East South Central AL, KY, MS, TN 12 14 12 15 15 15
Mountain AZ, CO, ID, MT, NV, NM, UT, WY 12 9 15 14 14 14
Other Canada, Scotland 3 3 3 0 1 1
Total 221 220 242 255 257 260
Table 2 Distribution of accredited and developing programs in the US by regional accreditation 2012 – 18
2012 2013 2015 2016 2017 2018 North Central 70 70 75 79 79 79
Southern 58 54 64 73 73 74
Middle States 47 48 50 52 53 53
New England 17 18 18 18 19 19
Western 15 15 22 23 23 24
Northwest 10 9 10 10 10 10
Total 225 217 239 255 257 259
Table 3 Distr ibution of accredited and developing programs in the US by Carnegie Classif ication 2012 – 18
[as of 8/2017] 2006 Classification 2012 2013 2015 2016 2017 2018 Doctoral/Research Universities 22 23 17 18 18 19
Research Universities (very high research activity) 32 33 39 39 39 39
Research Universities (high research activity) 30 27 35 35 35 35
Master’s Colleges and Universities (larger programs) 60 57 71 74 76 77
Master’s Colleges and Universities (medium programs) 19 19 15 17 17 17
Master’s Colleges and Universities (smaller programs) 11 11 12 13 13 13
Baccalaureate Colleges – Arts & Sciences 2 1 1 2 2 2
Baccalaureate Colleges –Diverse Fields 4 3 5 9 9 9
Special Focus Institutions – Medical Schools and Medical Centers
40 32 30 31 31 31
Special Focus Institutions – Other Health Professions Schools 6 4 12 14 12 14
Not Classified 5 6 2 2 3 3
Total 231 216 239 255 256 259

2017 – 18 Fact Sheets Physical Therapist Education Programs
Program Data 8 Distribution of Programs & Finances
Figure 3 Distribution of accredited and developing programs in the US by type of institution 2011 – 18
Financing of Professional Education Table 4 Average annual tuit ion, fees, and other costs by type of institution FY 2017 – 18 ($)
Public In-State Public Out-of-State Private
Annual Tuition
Range $0-36,522 $0-56,898 $16,600 – 64,233
Median $17,722 $34,514 $34,690
Mean $17,742 $33,981 $35,534
STDEV 6,919 19,424 7,859
Annual Fees
Range $0-8,376 -- $0–35,229
Median $2,178 -- $1,110
Mean $2,446 -- $1,951
STDEV 1,711 -- 3,442
Other Program Expenses
Range $0-4,692 -- $0–20,080
Median $3,762 -- $3,499
Mean $4,692 -- $4,070
STDEV 1,711 -- 3,213
Total Cost of Professional Program
Range $0-108,576 $0-196,311 $23,500–171,748
Median $58,074 $107,144 $105,817
Mean $59,504 $105,621 $109,099 STDEV 20,330 33,375 23,682
Table 5 Program expenses for programs in the US FY 2017 – 18 ($)
Total Operating Expenses (excluding salary & benefits) Range $14,278 – 10,051,076
Mean $413,899
Total Salary Expenses (excluding benefits) Range $288,739 – 5,326,761
Mean $1,300,173
114
108
110
116
119
120
120
115
113
109 12
3 136
137
140
0
20
40
60
80
100
120
140
160
2011 2012 2013 2015 2016 2017 2018
Public
Private

2017 – 18 Fact Sheets Physical Therapist Education Programs
Program Data 9 Finances & Measures of Program Length
Table 6 Program expenses for accredited programs in the US by type of institution FY 2017 – 18 ($)
Public Private
Total Operating Expenses (excluding salary & benefits) Range $16,100 - 1,930,759 $14,278 – 10,051,076
Mean $301,060 $536,833
Total Salary Expenses (excluding benefits) Range
$1 – 4,283,585 $288,739 – 5,326,761
Mean $1,297,531
$1,343,385
Measures of Program Length Table 7 Academic calendar 2017 – 18 (%)
% of programs Semesters 86.72%
Trimesters 8.30 %
Quarters 4.98 %
Table 8 Average length of professional curr iculum (in weeks) 2010 – 17
2010 – 11
2011 – 12
2012 – 13
2014 – 15
2015 – 16
2016 – 17
2017 – 18
Number of weeks in didactic portion
Range 71 – 120 48 – 122 34 – 161 48 – 157 48 – 135 48-157 49.5-157
Mean 85.3 85.4 93.2 87.4 86.4 87.76 88.2
Number of weeks in full-time Clinical Education
Range 24 – 60 23 – 60 23 – 68 21 – 58 23 – 58 23-56 20-56.6
Mean 35.9 35.9 35.6 35.6 36.01 37.8 35.7
Total number of weeks in program
Range 95 – 164 86 – 164 75 – 180 84 – 180 84 – 175 84-180 84-180
Mean 121.2 122 122.5 122.8 122.4 123.4 123.3
2017 – 18 Fact Sheets Physical Therapist Education Programs
Program Data 10 Measures of Program Length & Credits Required
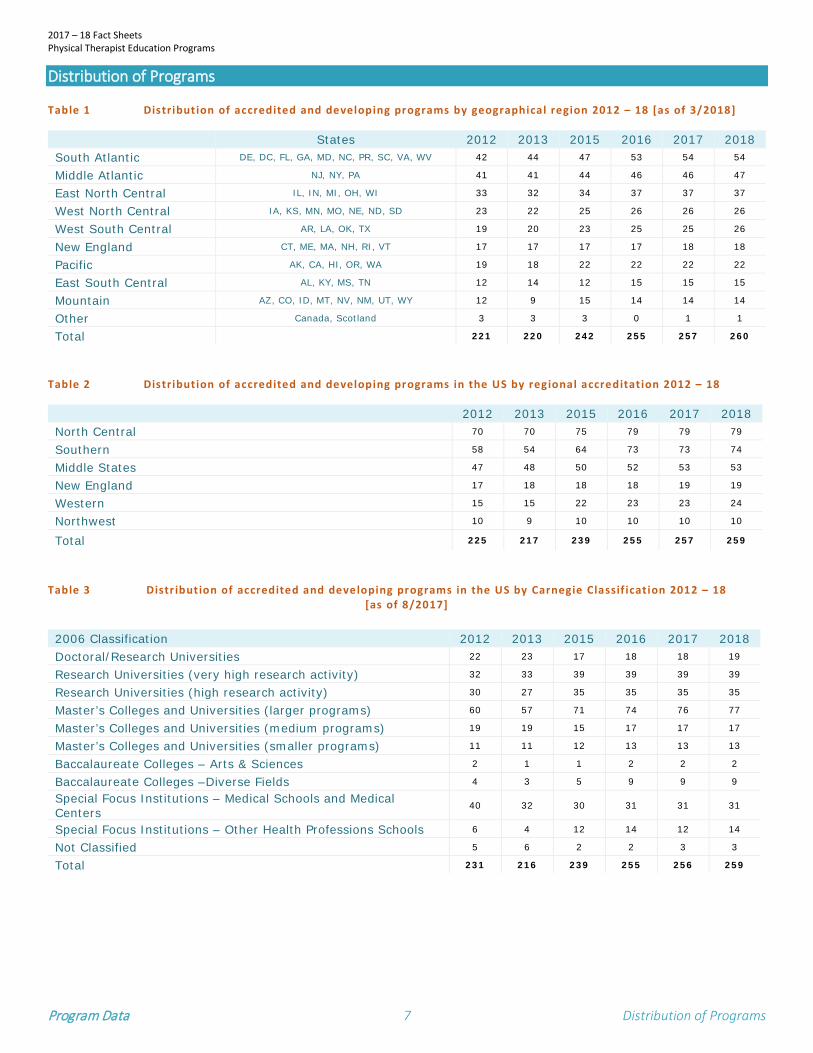
Table 9 Average length of professional program (N = 241)
Length in Weeks
Number of weeks in didactic portion Range 49.5-157
Mean 88.2
STDEV 15.4
Number of weeks in full-time clinical education Range 20-56.6
Mean 35.7
STDEV 5.1
Total number of weeks in program
Range 84-180
Mean 123.3
STDEV 14
Credits Required Table 10 Average pre-professional and professional semester credits required for accredited programs in the US 2012 – 18
2012 – 13 2014 – 15 2015 - 16 2016 – 17 2017 – 18
Pre-Professional
Range 80 – 180 80 – 130 68 - 180 80 - 480 80 – 480
Median 120 120 120 120 120
Mean 115 116 118 120 114.05
STDEV 12.6 11 16 29 38.40
Professional*
Range 77 – 185 90 – 171 55 - 165 23 - 165 --
Median 116 117 100 93 -- Mean 117.2 118 102 95 --
STDEV 29 14.6 22 15 --
Clinical Education
Range — 2 – 47 2 - 51 2 - 93 2 – 90
Median — 22 25 22 22
Mean — 24 25 25 24.79
STDEV — 9 12 11 10.07
- Not available. * Professional excluding clinical education.

2017 – 18 Fact Sheets Physical Therapist Education Programs
Program Data 11 Credits Required, Curricular Models & Clinical Education
Figure 4 Credit hours in classroom/laboratory and cl inical education
Clinical Education Table 11 Average length of f inal cl inical education experience 2012 – 17
2012 2014 2015 2016 2017
Number of weeks in final clinical experience Range 8 – 68 5 – 52 5 - 52 6-50 20 - 56
Mean 21.2 21 23 21 36
Clin Ed20.9%
Class/Lab79.1%
PROPORTION OF CREDIT HOURS IN CLASS/LAB AND CLINICAL EDUCATION 2017-18
Clin Ed
Class/Lab

2017 – 18 Fact Sheets Physical Therapist Education Programs
Student Data 12 Admissions
Outcomes Table 12 Sum of al l degrees conferred 2006 – 17
2006 2008 2009 2010 2011 2012 2014 2015 2016 2017 Total 5,537 5,809 6,373 6,458 7,423 7,998 8,806 9,389 9,743 10,292
Table 13 Graduation rates 2007 – 17 (%)
2007* 2010* 2011* 2012* 2013* 2014* 2016* 2017* Range 11 – 100 43 – 100 47 – 100 70 – 100 60 – 100 78-100 65-100 56.2-100
Mean 88.7 89.17 90.1 96.1 91.9 95.9 96.7 96
Median 92.1 97.8 91.6 99 94 94 97 97.2
STDEV 11.7 8.7 7.8 10.6 7.7 4.7 5.4 5
*Rate based on the percentage of students admitted to the professional program who complete the program within 150% of the time normally expected for completion. Table 14 Employment rates at 12 months post-graduation 2005 – 16 (%)
2006* 2008* 2010* 2011* 2012* 2014* 2015* 2016 2017 Range 75 – 100 83 – 100 85 – 100 83 – 100 83 – 100 92 – 100 90-100 91-100 90-100
Mean 99.6 99.5 99.6 99.5 99.5 99 99.1 99.4 99
* To the best of the program’s ability to determine, the % of graduates employed within 6 months of passing the licensure exam. Table 15 Pass rates of f irst t ime takers on l icensure exam 2006 – 17(%)
2006*** 2007**** 2008§ 2009§ 2011§ 2012§ 2014§ 2015** 2017
Range 0 – 100 33 – 100 25 – 100 38 – 100 0 – 100 47 – 100 0 – 100 25-100 48-100
Mean 85.2 86.2 83.9 86.5 88.2 87.7 91 91 92.8
Median
88.6 90.9 87 90 92.5 90-9 94 93.6 94.89
STDEV 14.3 13.8 13.9 12.2 13.9 11.71 10 10.6 8
NOTE Based on data provided by FSBPT:** on 4/11/2005; *** on 4/11/2006; **** on 4/18/2007; § on 4/11/2012 for data current as of March 31, 2012; on April 17, 2013; on April 2, 2015; on April 13, 2016, December 2, 2016, December 2017. Table 16 Number of programs by pass rate of f irst t ime takers 2006 – 17
2006** 2007*** 2008§ 2009§ 2011§ 2012§ 2014§ 2015§ 2016 2017 0-9% 1 2
10-19%
20-29% 1 1 1 1
30-39% 1 3 1 1 1
40-49% 2 3 1 1 1
50-59% 7 3 7 5 4 8 6 4 5 1
60-69% 10 20 15 15 3 10 6 6 7 2
70-79% 26 24 31 24 27 22 15 16 15 12
80-89% 59 37 53 49 40 45 41 39 48 44
90-99% 55 69 57 77 84 96 112 113 108 116
100% 31 32 20 21 36 27 36 35 43 52
N= 192 189 187 191 197 209 216 218 227 228
NOTE Based on data provided by FSBPT: * on 4/19/2004; ** on 4/11/2005; *** on 4/11/2006; **** on 4/18/2007; § on 4/11/2012 for data current as of March 31, 2012; on April 17, 2013; on April 2, 2015; on April 13, 2016; on December 2, 2016, December 2017.
2017 – 18 Fact Sheets Physical Therapist Education Programs
Student Data 13 Admissions
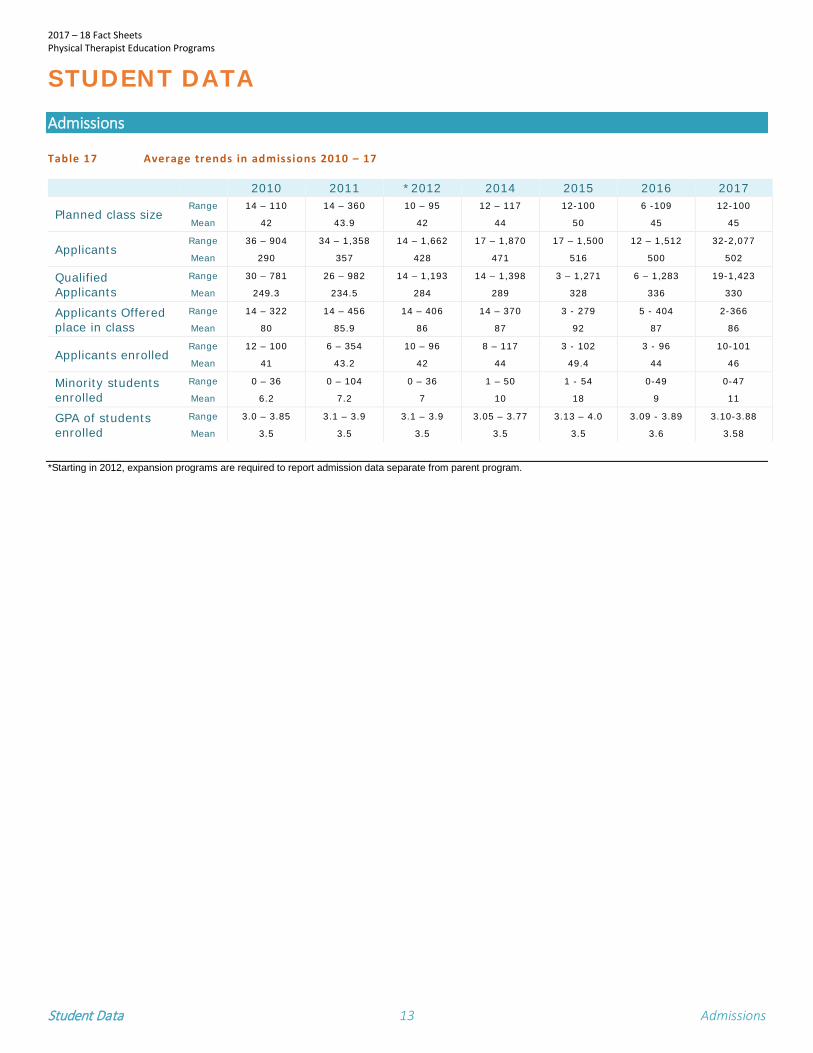
STUDENT DATA Admissions Table 17 Average trends in admissions 2010 – 17
2010 2011 *2012 2014 2015 2016 2017
Planned class size Range 14 – 110 14 – 360 10 – 95 12 – 117 12-100 6 -109 12-100
Mean 42 43.9 42 44 50 45 45
Applicants Range 36 – 904 34 – 1,358 14 – 1,662 17 – 1,870 17 – 1,500 12 – 1,512 32-2,077
Mean 290 357 428 471 516 500 502
Qualified Applicants
Range 30 – 781 26 – 982 14 – 1,193 14 – 1,398 3 – 1,271 6 – 1,283 19-1,423
Mean 249.3 234.5 284 289 328 336 330
Applicants Offered place in class
Range 14 – 322 14 – 456 14 – 406 14 – 370 3 - 279 5 - 404 2-366
Mean 80 85.9 86 87 92 87 86
Applicants enrolled Range 12 – 100 6 – 354 10 – 96 8 – 117 3 - 102 3 - 96 10-101
Mean 41 43.2 42 44 49.4 44 46
Minority students enrolled
Range 0 – 36 0 – 104 0 – 36 1 – 50 1 - 54 0-49 0-47
Mean 6.2 7.2 7 10 18 9 11
GPA of students enrolled
Range 3.0 – 3.85 3.1 – 3.9 3.1 – 3.9 3.05 – 3.77 3.13 – 4.0 3.09 - 3.89 3.10-3.88
Mean 3.5 3.5 3.5 3.5 3.5 3.6 3.58
*Starting in 2012, expansion programs are required to report admission data separate from parent program.

2017 – 18 Fact Sheets Physical Therapist Education Programs
Student Data 14 Admissions
Table 18 Average trends in admissions by public and pr ivate institution 2009 – 17
Public 2009 2010 2011 *2012 *2014 *2015 2016 2017 Planned class size
Range 14 – 98 16 – 100 14 – 102 14 – 87 12 – 91 12 - 89 14 – 97 12-70
Mean 37.7 42.9 39 39 41 44 36 42
Applicants Range 24 – 557 36 – 748 81 – 1,354 58 – 1,662 24 – 1,447 26 – 1,459 21 – 404 44-2,077
Mean 206.3 287.3 321 400 472 484.8 148 537
Qualified Applicants
Range 23 – 453 33 – 748 37 – 982 30 – 1,193 16 – 1,398 3 – 1,097 4 – 297 27-1,423
Mean 146.3 192.6 212 267 312 323.6 107 368
Applicants Offered place in class
Range 19 – 163 20 – 247 14 – 202 14 – 187 16 – 370 18 – 279 16 – 150 21-193
Mean 60.1 79.8 71 71 79 80 53 80
Applicants enrolled
Range 14 – 98 17 – 100 14 – 102 14 – 87 8 – 91 12 - 89 8 – 97 12-71
Mean 38.1 42.8 39 40 41 43 35 42
Minority students enrolled
Range 0 – 38 0 – 28 0 – 35 0 – 29 0 – 40 0 - 36 0 – 38 0-37
Mean 6.2 6 6 6 7 12 5 10
GPA of students enrolled
Range 3 – 3.82 3.1 – 3.8 3.2 – 3.8 3.3 – 3.9 3.3 – 3.9 3.3 – 3.9 2.9 – 3.8 3.10-3.88
Mean 3.6 3.5 3.6 3.6 3.57 3.6 3.49 3.66
Private 2009 2010 2011 *2012 *2014 *2015 2016 2017
Planned class size
Range 20 – 315 14 – 110 20 – 360 10 – 95 14 – 117 17 - 100 10 – 210 12-100
Mean 47.4 41.1 50 45 47 53 43 48
Applicants Range 42 – 763 39 – 892 34 – 1,358 14 – 1,684 17 – 1,870 17 – 1,500 13 – 603 32-1,400
Mean 256.4 300.5 402 517 487 497.7 140 474
Qualified Applicants
Range 32 – 680 30 – 781 26 – 980 14 – 1,184 14 – 992 11 – 1,271 3 – 492 19-1,294
Mean 89.4 77 102 101 95 318.5 62 299
Applicants Offered place in class
Range 13 – 411 14 – 213 14 – 456 16 – 106 14 – 736 12 - 253 3 – 244 2-366
Mean 89.4 77 102 101 95 91 62 91
Applicants enrolled
Range 7 – 310 12 – 89 6 – 354 10 – 96 12 – 117 10 - 102 3 – 178 10-101
Mean 45.3 39.4 48 45 47 51 35 49
Minority students enrolled
Range 0 – 69 0 – 36 0 – 104 0 – 36 1 – 50 1 - 54 0 – 47 0-47
Mean 8.2 6.5 8 8 10 17.5 7 12
GPA of students enrolled
Range 3.0 – 3.8 3.0 – 3.9 3.1 – 3.9 3.1 – 3.8 3.1 – 3.8 3.1 – 4.0 2.9 – 3.8 3.13-3.80
Mean 3.4 3.5 3.47 3.47 3.5 3.5 3.37 3.51
*Starting in 2012, expansion programs are required to report admission data separate from parent program.
2017 – 18 Fact Sheets Physical Therapist Education Programs
Student Data 15 Admissions & Enollment
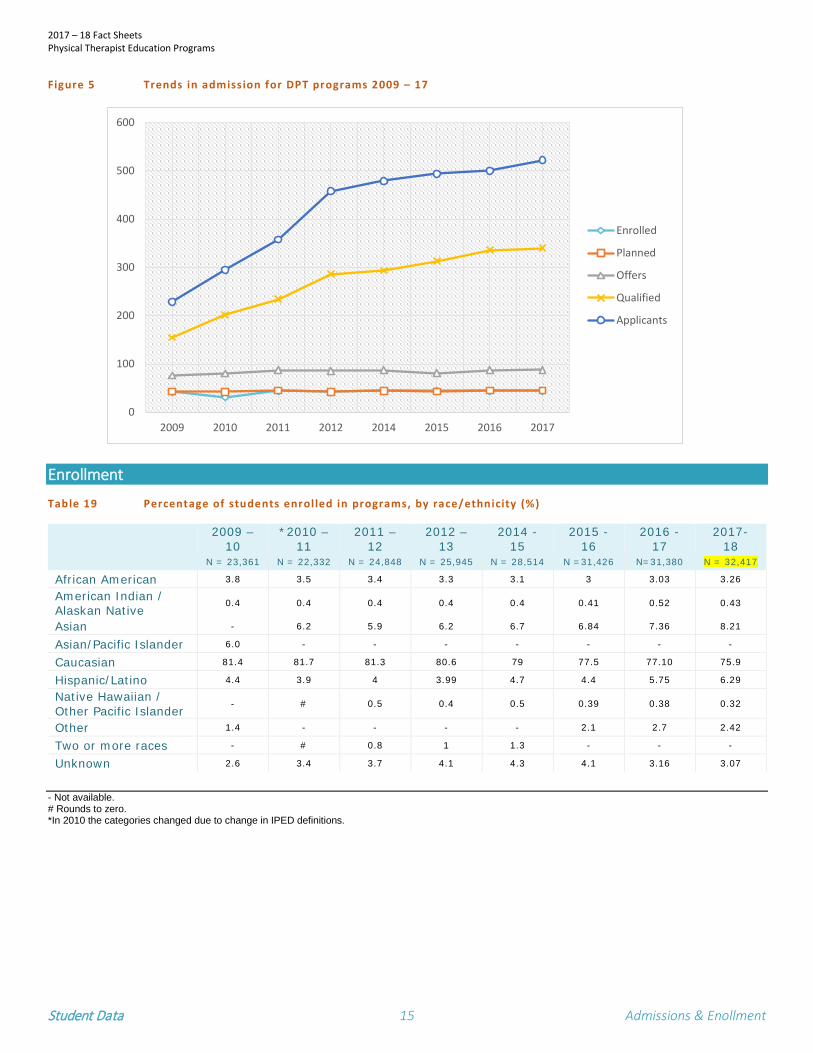
Figure 5 Trends in admission for DPT programs 2009 – 17
Enrollment Table 19 Percentage of students enrolled in programs, by race/ethnicity (%)
2009 – 10
*2010 – 11
2011 – 12
2012 – 13
2014 - 15
2015 - 16
2016 - 17
2017- 18
N = 23,361 N = 22,332 N = 24,848 N = 25,945 N = 28,514 N =31,426 N=31,380 N = 32,417
African American 3.8 3.5 3.4 3.3 3.1 3 3.03 3.26
American Indian / Alaskan Native
0.4 0.4 0.4 0.4 0.4 0.41 0.52 0.43
Asian - 6.2 5.9 6.2 6.7 6.84 7.36 8.21
Asian/Pacific Islander 6.0 - - - - - - -
Caucasian 81.4 81.7 81.3 80.6 79 77.5 77.10 75.9
Hispanic/Latino 4.4 3.9 4 3.99 4.7 4.4 5.75 6.29
Native Hawaiian / Other Pacific Islander
- # 0.5 0.4 0.5 0.39 0.38 0.32
Other 1.4 - - - - 2.1 2.7 2.42
Two or more races - # 0.8 1 1.3 - - -
Unknown 2.6 3.4 3.7 4.1 4.3 4.1 3.16 3.07
- Not available. # Rounds to zero. *In 2010 the categories changed due to change in IPED definitions.
0
100
200
300
400
500
600
2009 2010 2011 2012 2014 2015 2016 2017
Enrolled
Planned
Offers
Qualified
Applicants

2017 – 18 Fact Sheets Physical Therapist Education Programs
Student Data 16 Graduates
Graduates Figure 6 Number of actual and projected graduates, 1981 – 2019
* Indicates years where one or the other, not both, graduate numbers were available. Table 20 Ethnicity of Graduates of Physical Therapist Programs
2017
N=10,223 African American 2.60%
American Indian/Alaskan Native 0.31%
Asian 7.10%
Hawaiian Native/Pacific Islander 0.34%
Hispanic/Latino 5.72% White 78.94% Other 2.26%
Unknown 3.06%
Table 21 Enrollment by Sex
Female Male Other/No Answer* Total 2015 2016 2017 2015 2016 2017 2015 2016 2017 2015 2016 2017
Number of students in
all programs
18,267
19,501
20,393
10,811
11,879
12,437
-
-
10
29,078
31,380
32,417
Number of students
per program
Mean Range
84.18 19-236
82.63 11-248
84.62 6-259
49.82 7-176
50.33 4-215
51.61 2-247 - - 0.04
0 - 2 134
35-405 132.97 15-405
136.27 8-438
• Option added to 2017 AAR for Student and Faculty Gender ‘Other/Choose Not To Answer’
2,88
8
3,10
4
3,43
4
4,06
2
4,10
5
4,24
0 6,51
2
7,41
1
6,76
3
5,11
9
4,91
3
5,24
2
5,53
7
5,51
6
5,80
9
6,37
3
6,45
8
7,42
3
7,79
8
8,51
7
8,80
64,37
6
5,26
7
5,82
0
5,15
8
5,38
6
5,48
6
5,64
7
5,71
5
5,92
1
6,54
4
7,22
7
7,29
7
7,82
4
8,08
1
8,50
7
9,45
3
9,92
3
10,5
99
10,6
72
10,7
21
0
2000
4000
6000
8000
10000
12000
14000
Actual Graduates Projected Graduates

2017 – 18 Fact Sheets Physical Therapist Education Programs
Faculty Data 17 Number of Faculty, Ratios, & Workload
FACULTY DATA
Number of Faculty
Table 22 Number of core and associated faculty 2017
Totals (Core) Total number of full-time core faculty positions 2,712.4
Total number of part-time core faculty positions 235.5
Mean (Core) Full-time core faculty positions 10.6
Part-time core faculty positions 0.9
Core faculty FTEs 10.9
Mean (Associated) Number of associated faculty 7.4
Total FTE of associated faculty 1.4
Table 23 Average number of core faculty vacancies 2017
Totals Total current vacancies in allocated positions 156
Total projected vacancies in allocated positions 116
Total number of new positions to be filled 52
Ratios
Table 24 Ratio of students per core faculty and laboratory faculty member 2017
Number of students per core faculty member 12.19
Number of students per faculty member in laboratory experiences 13.42
Workload
Table 25 Percentage of faculty by workload (%)
% of Time Devoted to Teaching
Entry-level Program
Other Programs Administration Scholarship Service Clinical
Practice
Program Director 26.25 1.6 44.8 14.5 10.1 2.6 DCE 37.6 0.63 36.05 10.33 10.2 4.6
Other Faculty 50.6 3.2 6.6 21.1 11.4 6.7

2017 – 18 Fact Sheets Physical Therapist Education Programs
Faculty Data 18 Scholarship, Grants, & Clinical Specialists
Scholarship & Grants
Table 26 Scholarship productivity of core faculty 2017
Total number of peer reviewed articles 3,020
Total number of other articles 489
Total number of books or book chapters 386
Total number of presentations 6,456
Total number of other scholarly products subjected to external review and disseminated -
Total number of papers, proposals, etc. submitted but not yet accepted or published 2,395
Mean Peer reviewed articles (excluding abstracts) 12
Other articles accepted or published 2
Books or book chapters published 1
Presentations 25
Other scholarly products subjected to external review and disseminated -
Papers, proposals, etc. submitted but not yet accepted or published 9
Table 27 Grants and grant funding FY 2017 – 18
Total for All Programs Total number of core faculty with grant funding 862
Total amount of grant funding $582,105,265
Total amount of above funding from NIH $314,425,394
Total number of core faculty who submitted proposals for funding, not funded or are not yet funded
1,098
Per Program
Number of core faculty with grant funding (per program) Range 0-17
Mean 3
Amount of grant funding (per program) Range $0-$66,435,607
Mean $2,256,222
Amount of funding from NIH (per program) Range $0-$43,183,301
Mean $1,230,331
Number of core faculty who submitted proposals for funding that were not funded or are not yet funded (per program)
Range 0-82
Mean 4
Clinical Specialists
Table 28 Number of core faculty who are cert if ied cl inical specialists 2004 – 17
2007 – 08
2009 – 10
2010 – 11
2011 – 12
2012 – 13
2014 – 15
2015 – 16
2016 – 17
2017-2018
Total 690 754 746 828 891 1,103 1,196 1,268 1,327
% 32.8 34.3 35.1 37.6 37.4 39.9 41.9 43.7 45.7

2017 – 18 Fact Sheets Physical Therapist Education Programs
Faculty Data 19 Faculty Demographics & Degrees Held
Faculty Demographics
Table 29 Number of faculty by race/ethnicity 2017
Program Director DCE Other Faculty All Core Faculty Associated Black or African American 8 10 55 73 96 American Indian/Alaskan Native 0 2 4 6 1 Asian 8 8 144 160 96 White 229 310 1,976 2,515 1,815 Hispanic/Latino of any race 4 6 87 97 81 Native Hawaiian/Pacific Islander 0 2 4 6 14 Two or more races 3 1 25 29 16 Unknown 1 0 13 14 76 Total 253 339 2,308 2,900 2,155
Degrees Held, Rank, Tenure Status
Figure 7 Percentage of highest academic degree held by all core faculty 2017
*Not including DPT Degree
7.50
%
13.8
0%
44.8
0%
3% 25.3
2%0.00%5.00%
10.00%15.00%20.00%25.00%30.00%35.00%40.00%45.00%50.00%
Masters (advanced) ProfessionalDoctorate (EdD,DRPH, DSc, etc.)
Doctor of Philosophy Other Not Applicable
2016(n=2,901)
2017(n=2,899)
2017 – 18 Fact Sheets Physical Therapist Education Programs
Faculty Data 20 Tenure Status
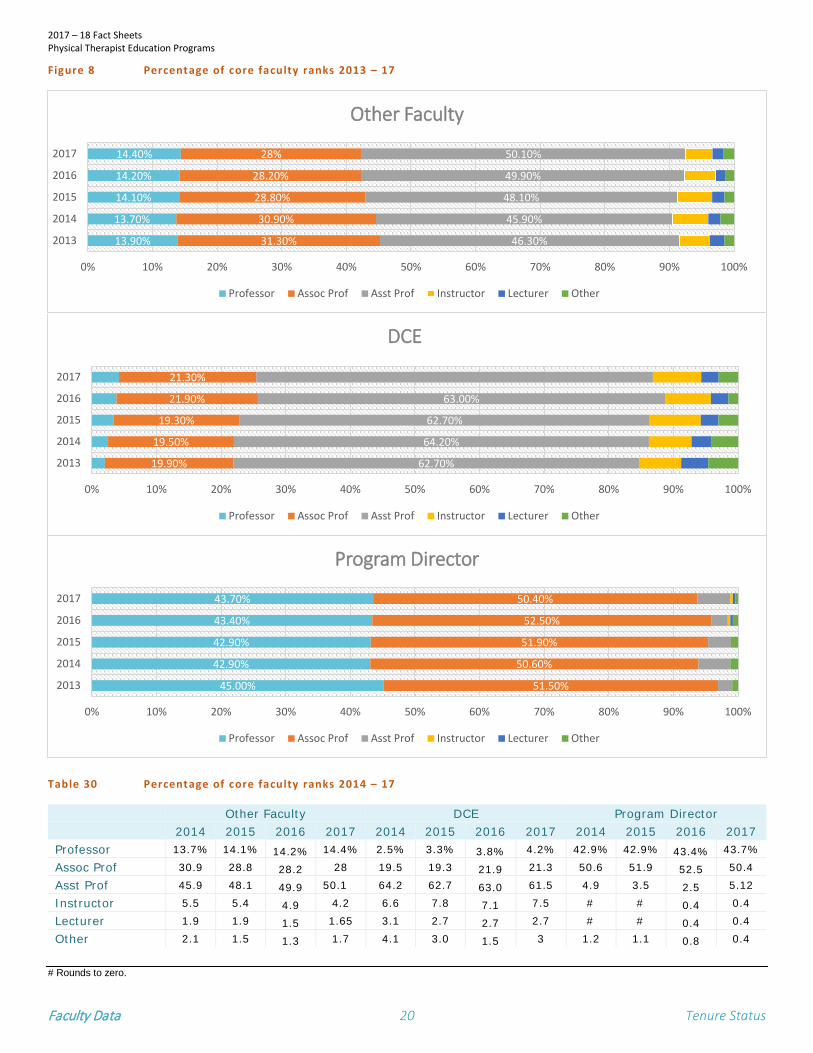
Figure 8 Percentage of core faculty ranks 2013 – 17
Table 30 Percentage of core faculty ranks 2014 – 17
Other Faculty DCE Program Director 2014 2015 2016 2017 2014 2015 2016 2017 2014 2015 2016 2017
Professor 13.7% 14.1% 14.2% 14.4% 2.5% 3.3% 3.8% 4.2% 42.9% 42.9% 43.4% 43.7% Assoc Prof 30.9 28.8 28.2 28 19.5 19.3 21.9 21.3 50.6 51.9 52.5 50.4 Asst Prof 45.9 48.1 49.9 50.1 64.2 62.7 63.0 61.5 4.9 3.5 2.5 5.12 Instructor 5.5 5.4 4.9 4.2 6.6 7.8 7.1 7.5 # # 0.4 0.4 Lecturer 1.9 1.9 1.5 1.65 3.1 2.7 2.7 2.7 # # 0.4 0.4 Other 2.1 1.5 1.3 1.7 4.1 3.0 1.5 3 1.2 1.1 0.8 0.4
# Rounds to zero.
13.90%
13.70%
14.10%
14.20%
14.40%
31.30%
30.90%
28.80%
28.20%
28%
46.30%
45.90%
48.10%
49.90%
50.10%
0% 10% 20% 30% 40% 50% 60% 70% 80% 90% 100%
2013
2014
2015
2016
2017
Other Faculty
Professor Assoc Prof Asst Prof Instructor Lecturer Other
19.90%
19.50%
19.30%
21.90%
21.30%
62.70%
64.20%
62.70%
63.00%
0% 10% 20% 30% 40% 50% 60% 70% 80% 90% 100%
2013
2014
2015
2016
2017
DCE
Professor Assoc Prof Asst Prof Instructor Lecturer Other
45.00%
42.90%
42.90%
43.40%
43.70%
51.50%
50.60%
51.90%
52.50%
50.40%
0% 10% 20% 30% 40% 50% 60% 70% 80% 90% 100%
2013
2014
2015
2016
2017
Program Director
Professor Assoc Prof Asst Prof Instructor Lecturer Other

2017 – 18 Fact Sheets Physical Therapist Education Programs
Faculty Data 21 Tenure Status
Figure 9 Tenure status of core faculty 2017
Table 31 Tenure status of core faculty 2017
Other Faculty DCE Program Director Tenured 23.6% 8.50% 57.54% On Tenure Track 26.70% 15.34% 13.89% No Tenure Track 22.14% 33% 19.80% Not Eligible (Clinical Track) 20.10% 32.70% 5.16% Not Eligible (Other) 7.4% 10.10% 5.5%
23.60%
8.50%
57.54%
26.70%
15.34%
13.89%
22.14%
33.00%
19.80%
20.10%
32.70%
5.16%
7.40%
10.10%
Other Faculty
DCE
Program Director
Tenure Status of Core FacultyTenured On Tenure Track No Tenure Track Not Eligible (Clinical Track) Not Eligible (Other)

2017 – 18 Fact Sheets Physical Therapist Education Programs
Faculty Data 22 Salary
Salaries
Table 32 Salar ies of Program Directors (N = 176) in Physical Therapist Education Programs by Rank, Length of Appointment, and Type of Institution
Program Director
9-9.5Public
10-11 12 9-9.5Private
10-11 12 Lecturer
N - - - - - - Mean - - - - - - Median - - - - - - Range - - - - - - STDEV - - - - - -
Instructor N - - - - - -
- - - -
Mean - - - - - Median - - - - - Range - - - - - STDEV - - - - -
Assistant Professor N - - 4 - -
- - - -
4 Mean - - 124,148 - 111,190 Median - - 117,477 - 106,137 Range - - 84,411 - 177,359 - 92,000 - 140,486 STDEV - - 41,657 - 20,795
Associate Professor N 1 2 25 - 5 52 Mean 118,705 - 109,631 133,900 Median 119,917 - 112,000 127,110 Range 87,996 - 163,162 - 82,749 - 136,433 81,813 -330,000 STDEV 20,560 - 20,200 39,964
Professor N 1 1 42 1 5 32 Mean 146,876 134,085 142,793 Median 143,136 127,246 135,000 Range 86,220 - 256,250 112,250 - 171,762
23,973 96,136 -264,158
31,613 STDEV 30,465
Other N - - -
- - - -
- - 1 Mean - - - - Median - - - - Range - - - - STDEV - - - -
2017 – 18 Fact Sheets Physical Therapist Education Programs
Faculty Data 23 Salary
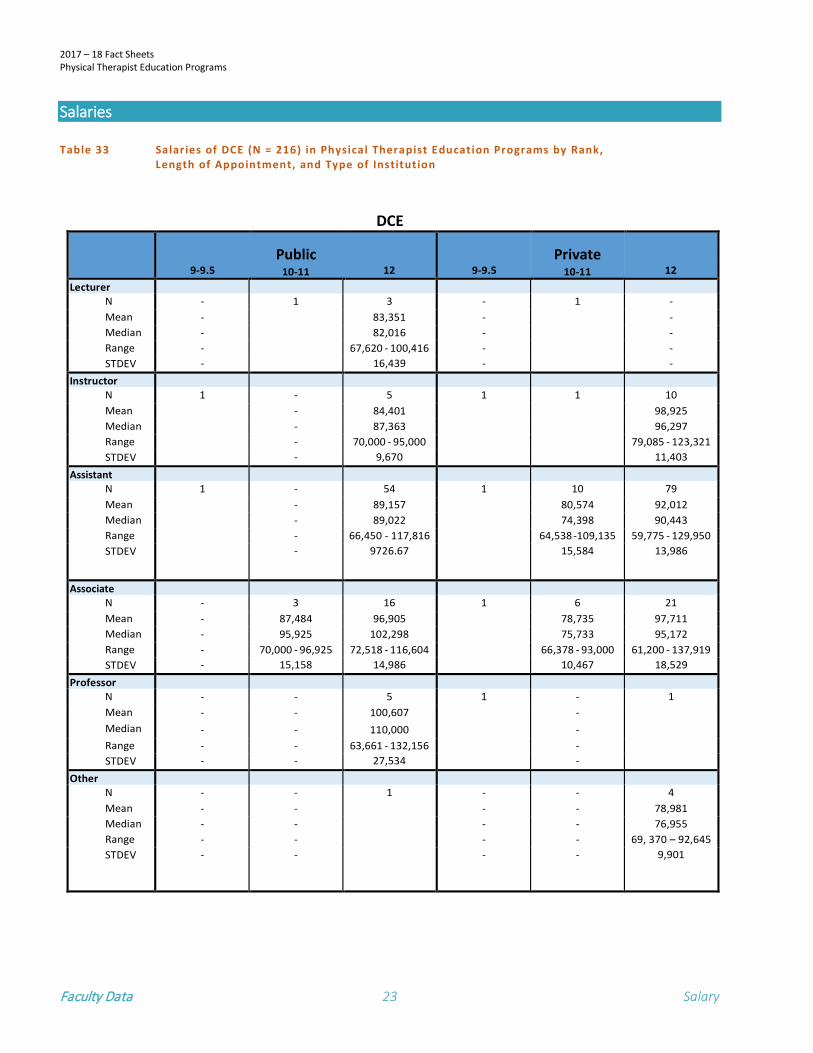
Salaries
Table 33 Salar ies of DCE (N = 216) in Physical Therapist Education Programs by Rank, Length of Appointment, and Type of Institution
DCE
9-9.5Public
10-11 12 9-9.5Private
10-11 12 Lecturer
N - 1 3 - 1 - Mean - 83,351 - - Median - 82,016 - - Range - 67,620 - 100,416 - - STDEV - 16,439 - -
Instructor N 1 - 5 1 1 10 Mean - 84,401 98,925 Median - 87,363 96,297 Range - 70,000 - 95,000 79,085 - 123,321 STDEV - 9,670 11,403
Assistant N 1 - 54 1 10 79 Mean - 89,157 80,574 92,012 Median - 89,022 74,398 90,443 Range - 66,450 - 117,816 64,538 -109,135 59,775 - 129,950 STDEV - 9726.67 15,584 13,986
Associate N - 3 16 1 6 21
Mean - 87,484 96,905 78,735 97,711 Median - 95,925 102,298 75,733 95,172 Range - 70,000 - 96,925 72,518 - 116,604 66,378 - 93,000 61,200 - 137,919 STDEV - 15,158 14,986 10,467 18,529
Professor N - - 5 1 - 1 Mean - - 100,607 - Median - - 110,000 - Range - - 63,661 - 132,156 - STDEV - - 27,534 -
Other N - - 1 - - 4 Mean - - - - 78,981 Median - - - - 76,955 Range - - - - 69, 370 – 92,645 STDEV - - - - 9,901

2017 – 18 Fact Sheets Physical Therapist Education Programs
Faculty Data 24 Salary
Salaries
Table 34 Salar ies of Other faculty (N = 1,393) in Physical Therapist Education Programs by Rank, Length of Appointment, and Type of Institution
Other Faculty
9-9.5
Public
10-11
12
9-9.5
Private
10-11
12 Lecturer
N 2 7 6 - - - Mean 80,818 86,486 - - - Median 76,097 84,948 - - - Range 70,000 - 97,145 72,686 - 106,400 - - - STDEV 10,436 11,827 - - -
Instructor N 2 - 26 1
3 25 Mean - 79,423 64,037 78,945 Median - 83,054 60,113 81,271 Range - 47,470 - 97,003 60,000 - 71,999
6,896 63,000- 92,882
9,043 STDEV - 11,111
Assistant Professor 55
41
224
32
47
317 N
Mean Median Range STDEV
78,477 82,946 89,296 76,421 74,962 92,677 76,400 88,892 90,200 74,106 69,494 91,792
55,029 - 152,441 66,330 - 105,860 45,281- 127,230 61,800-74,106 41,000 - 104,040 60,615 - 180,476 15,373 8,876 10,557 10,369 13,757 14,636
Associate Professor 28
23
124
31
37
160 N
Mean Median Range STDEV
88,146 94,847 103,776 83,514 89,401 105,089 85,281 87,000 101,979 83,134 89,095 102,149
67,000 - 120,416 72,430 - 153,750 65,000 - 148,621 67,980 - 110,00 35,515 - 127,171 59,260 - 181,322 11,921 18,699 14,653 10,625 16,553 17,237
Professor 21
15
45
18
26
64 N
Mean Median Range STDEV
99,622 113,584 122,613 94,583 115,826 121,716 99,660 109,580 119,686 90,201 116,301 116,556
68,263 - 130,354 89,799 - 175,791 73,176 - 185,000 79,871 - 143,000 66,960 – 160,725 78,795 - 182,195 16,215 21,330 22,350 15,585 24,626 23,164
Other N 2 1 6 1
- - - - -
3 84,438 85,000
73,348-94,965 10,819
Mean 74,120 Median 71,250 Range 65,865 -86,405 STDEV 8,585