2011-12 Budget Paper No. 3 - Economic and Fiscal Outlook
313
2011-12 Budget Economic and Fiscal Outlook aper No. 3 Presented to the Legislative Assembly on 19 May 2011
Transcript of 2011-12 Budget Paper No. 3 - Economic and Fiscal Outlook
2011-12
Budget
Economic and Fiscal Outlookaper No. 3
Presented to the Legislative Assembly on 19 May 2011
2011-12 Budget Paper set includes:
Budget Paper No. 1 Budget Speech
Budget Paper No. 2 Budget Statements (Volumes 1-2)
Budget Paper No. 3 Economic and Fiscal Outlook
Budget Overview
Reader's Guide to the 2011-12 Budget Statements (Available electronically from http://ourstatebudget.wa.gov.au)

2011 -12 BUDGET
ECONOMIC AND FISCAL OUTLOOK
Budget Paper No. 3
PRESENTED TO THE LEGISLATIVE ASSEMBLYON 19 MAY 2011
2011-12 Economic and Fiscal Outlook
© Government of Western Australia
Excerpts from this publication may be reproduced, with appropriate acknowledgement, as permitted
under the Copyright Act.
For further information please contact:
Department of Treasury
197 St Georges Terrace
Perth WA 6000
Telephone: +61 8 9222 9222
Facsimile: +61 8 9222 9117
Website: http://ourstatebudget.wa.gov.au
Published May 2011
John A. Strijk, Government Printer
ISSN 1448-2630

2011-12 BUDGET
ECONOMIC AND FISCAL OUTLOOK
TABLE OF CONTENTS
Page
UNDER TREASURER'S CERTIFICATION
CHAPTER 1: OVERVIEW 1
Economic and Revenue Outlook 2Fiscal Outlook 4Budget Objectives 6
Supporting Our Community 6
Building the State 8
CHAPTER 2: THE WESTERN AUSTRALIAN ECONOMY 11
Overview 11
Global Outlook 15
Household Sector 18
Household Spending 18
Housing Market 19Business Investment 20Government Sector 21
Government Consumption 21Government Investment 22
International Trade 22Exports 22Imports 22
Labour Market 23Employment 23Unemployment and Participation 23Wages 24
Prices 25Consumer Prices Index 25
Risks to the Outlook 26Global Risks 26Domestic Risks 28
CHAPTER 3: FINANCIAL PROJECTIONS AND FISCAL STRATEGY 31
Overview 31Summary of Financial Projections 33
General Government Sector 33Summary 33Operating Statement 34Capital Investment 42Balance Sheet 44Cashflow Statement 45
Total Public Sector 45Summary 45Operating Statement 46Capital Investment 48
Net Debt and Net Financial Liabilities 51Fiscal Strategy 54
Financial Targets 54Statement of Risks 61

PageCHAPTER 4: GENERAL GOVERNMENT REVENUE 69
Overview 692010-11 702011-12 712012-13 Onwards 73
Revenue Measures 74Taxation Revenue Estimates
Commonwealth Grants
Royalty Income
Other Revenue
75
80
89
94
CHAPTER 5: GENERAL GOVERNMENT EXPENSES 103
Overview 103Building the State Investing Now to Keep the Growth Going Into the Future 106Major Expense Changes by Portfolio 107
Summary 107Premier; Minister for State Development 109Deputy Premier; Minister for Health; Tourism 113Minister for Mines and Petroleum; Fisheries; Electoral Affairs 117Minister for Regional Development; Lands; Minister Assisting the Minister for State 121Treasurer; Attorney General 127Minister for Education 132Minister for Finance; Commerce; Small Business 134Minister for Police; Emergency Services; Road Safety 137Minister for Sport and Recreation; Racing and Gaming 139Minister for Planning; Culture and the Arts; Science and Innovation 141Minister for Energy; Training and Workforce Development; Indigenous Affairs 145Minister for Transport; Housing 148Minister for Child Protection; Community Services; Seniors and Volunteering; Women's 153Minister for Local Government; Heritage; Citizenship and Multicultural Interests 155Minister for Agriculture and Food; Forestry; Corrective Services 157Minister for Environment; Water 159Minister for Mental Health; Disability Services 162Provisions 164
CHAPTER 6: ASSET INVESTMENT 167
Overview 167Major Infrastructure Spending Changes by Portfolio 172
Summary 172Premier; Minister for State Development 173Deputy Premier; Minister for Health; Tourism 174Minister for Mines and Petroleum; Fisheries; Electoral Affairs 176Minister for Regional Development; Lands; Minister Assisting the Minister for State 177Treasurer; Attorney General 179Minister for Education 180Minister for Finance; Commerce; Small Business 181Minister for Police; Emergency Services; Road Safety 183Minister for Sport and Recreation; Racing and Gaming 185Minister for Planning; Culture and the Arts; Science and Innovation 186Minister for Energy; Training and Workforce Development; Indigenous Affairs 188Minister for Transport; Housing 190Minister for Child Protection; Community Services; Seniors and Volunteering; Women's 195Minister for Local Government; Heritage; Citizenship and Multicultural Interests 196Minister for Agriculture and Food; Forestry; Corrective Services 197Minister for Environment; Water 199

PageCHAPTER 7: ROYALTIES FOR REGIONS 203
Overview
Key Initiatives
APPENDIX 1:
APPENDIX 2:
APPENDIX 3:
APPENDIX 4:
APPENDIX 5:
APPENDIX 6:
APPENDIX 7:
APPENDIX 8:
APPENDIX 9:
DETAILED FINANCIAL PROJECTIONS
GENERAL GOVERNMENT OPERATING REVENUE
2010-11 GENERAL GOVERNMENT OPERATING REVENUE
POLICY DECISIONS AFFECTING SPENDING
THE TREASURER'S ADVANCE
STATE GOVERNMENT SOCIAL CONCESSIONS EXPENDITURESTATEMENT 265
ASSET INVESTMENT PROGRAM SUMMARY OF EXPENDITUREAND SOURCE OF FUNDS 275
203
203
217
247
251
255
259
PUBLIC CORPORATIONS IMPACT ON GENERALGOVERNMENT REVENUE AND EXPENSES 283
TARIFFS, FEES AND CHARGES 297
Under Treasurer's Certification
The Government Financial Projections Statement presented in this budget is based uponGovernment decisions I was aware of or that were made available to me by the Treasureron or before the budget planning cut-off date of 20 April 2011 and which had a materialeffect on the Government's financial projections.
It has been prepared in accordance with applicable Australian Accounting Standards andGovernment Finance Statistics principles, and is based on the economic assumptionsoutlined in Chapter 2: The Western Australian Economy. These assumptions werefinalised on 20 April 2011.
Timothy MarneyUNDER TREASURER
19 May 2011
CHAPTER 1
Overview
Overall, the Western Australian economy has recovered well from the global economicdownturn, with growth of 4.5% forecast for 2011-12, following estimated growth of 4.0%in the current financial year.
However, there is significant divergence in the performance of key sectors of the State'seconomy. Growing demand from emerging economies and soaring commodity prices aregenerating a substantial pipeline of investment activity in the resources sector andboosting the State's royalty revenue. At the same time, households are being cautious intheir spending, and the housing market has been much weaker than expected, resulting ina substantial downward revision to property transfer duty revenue.
In addition, the projected decline in Western Australia's share of national GST revenueover coming years, from 7.4% in 2011-12 to an unsustainable 3.5% by 2014-15,represents a major structural challenge in managing the State's finances. The StateGovernment will continue to actively pursue a more equitable and sustainable GSTsharing arrangement, including through the Review of the GST Distribution recentlyannounced by the Prime Minister.
Against this background, the 2011-12 State Budget:
delivers major social infrastructure for future generations;
targets spending to deliver high quality services for all Western Australians, includingthrough the biggest ever injection of additional funding into the not-for-profit sector;
invests in the Western Australian economy to sustain growth into the future; and
provides increased accountability through disciplined financial management.
Following an estimated operating surplus for the general government sector of$784 million in 2010-11, this budget delivers an operating surplus of $442 million for thecoming financial year.
1
2011-12 Economic and Fiscal Outlook
Despite these surpluses on day-to-day or recurrent operations, and the new measuresimplemented in this budget that build on the Government's track record of strongfinancial management, net debt levels are projected to rise over the forward estimatesperiod, from an estimated $13.4 billion at 30 June 2011 to $22.4 billion by 30 June 20151.This reflects that the State's total revenue from State taxes, mining royalties, GSTrevenue and other sources is not sufficient to meet the State's total expenditurerequirements, including infrastructure investment for essential utilities such as power andwater. The resulting cash shortfall must be funded by borrowings, which are used toinvest in infrastructure that is essential for the State's continued growth.
Importantly, the net debt levels projected in this budget are sustainable and affordable,and remain consistent with the State's triple-A credit rating.
Economic and Revenue Outlook
Western Australia's economy is expanding at a stable pace. Conditions in the resourcessector are particularly strong, with robust demand from emerging economies and highcommodity prices creating a substantial pipeline of investment activity.
However, conditions in other sectors of the State's economy are more subdued.Households continue to display a heightened level of fiscal restraint, resulting in modestgrowth in discretionary spending. Activity in the established housing market has softenedmarkedly, partly in response to higher interest rates and the withdrawal of Commonwealthstimulus measures. At the same time, the agricultural sector has been affected by extremeweather conditions, and a number of industries are being challenged by the highAustralian dollar.
Nevertheless, the overall outlook for growth is positive. Western Australia is in the midstof a major investment cycle, led by construction of the $43 billion Gorgon LiquefiedNatural Gas (LNG) project and several iron ore developments in the Pilbara andMid West. Investment on these projects will underpin growth in the State's economy in2011-12 and 2012-13, with exports becoming the major driver of growth from 2013-14.
Conditions in the household sector are also expected to strengthen over the budget period,supported by improving conditions in the labour market, stronger asset prices and afurther consolidation in household balance sheets.
Overall, Gross State Product (GSP) is forecast to grow by 4.5% in 2011-12, followingestimated growth of 4.0% in 2010-11.
Across the outyears, GSP is projected to grow at 4.0% per annum, which is broadlyconsistent with the long-run trend rate of growth in the Western Australian economy.This reflects a number of factors, including expectations of moderating growth in theworking age population, above-average levels of household debt, and a projectedmoderation in business investment after several years of exceptional growth.
The forward estimates are based on the projected future costs of the Government's existing expenditure and revenue policies.They therefore provide a guide as to the future direction of the State's finances, but do not take into consideration or seek toanticipate future changes in Government policy.
2

Economic and Fiscal Outlook Overview
Table 1
KEY ECONOMIC FORECASTSWestern Australia, Annual Growth (%)
2009-10
Actual
2010-11Estimated
Actual
2011-12Budget
Estimate
2012-13ForwardEstimate
2013-14ForwardEstimate
2014-15ForwardEstimate
Gross State Product (GSP) 4.3 4.0 4.5 4.0 4.0 4.0
Gross State Income (GS!) 3.6 14.5 2.75 0.25 0.25 -0.25
Employment 0.3 3.0 2.5 2.5 2.25 2.0
Unemployment rate (a) 5.0 4.5 4.5 4.25 4.25 4.0
Consumer Price Index (CPI) 2.5 2.75 3.0 3.25 3.25 3.25
Wage Price Index (WPI) 3.3 4.0 4.25 4.5 4.5 4.5
Population 2.4 2.3 2.2 2.2 2.1 2.1
(a) Average level over the year.
The strength in global commodity markets, particularly for iron ore, has underpinned asharp rise in royalty income, which is expected to grow by $1.8 billion or almost 80% in2010-11. On the other hand, underlying taxation revenue is expected to contract slightlyin 2010-11, largely due to a significant downturn in transfer duty. Commonwealth grantsare also expected to decline, reflecting a withdrawal of stimulus funding and a reductionin GST grants.
In 2011-12, total general government revenue is forecast to grow by $1.5 billion or 6.2%.Revenue growth in 2011-12 is expected to be more evenly balanced than in 2010-11, withroyalties continuing to increase but at a more moderate pace, and tax revenue risingsteadily due to stronger domestic economic activity. GST revenue is also expected to risein 2011-12.
However, growth in total revenue is expected to moderate to an average of 3.8% perannum across the outyears, notwithstanding expectations of solid growth in own-sourcerevenue (predominantly payroll tax and transfer duty). This compares with averagegrowth of 10.8% per annum during the period 2003-04 to 2007-08, and average growth of8.5% per annum over the last decade.
In this regard, Commonwealth grants are expected to decline significantly over the budgetperiod. This reflects the principle of 'fiscal equalisation', which is applied by theCommonwealth Grants Commission in allocating national GST revenue to the States andTerritories. Based on the Grants Commission's current methodology, Western Australia'sGST grants are forecast to decline from $3.6 billion in 2011-12 to just $2 billion in2014-15.
2 That is, abstracting from the one-off payment of $350 million by major iron ore producers, which is classified as a 'tax' forgovernment financial reporting purposes.
3
2011-12 Economic and Fiscal Outlook
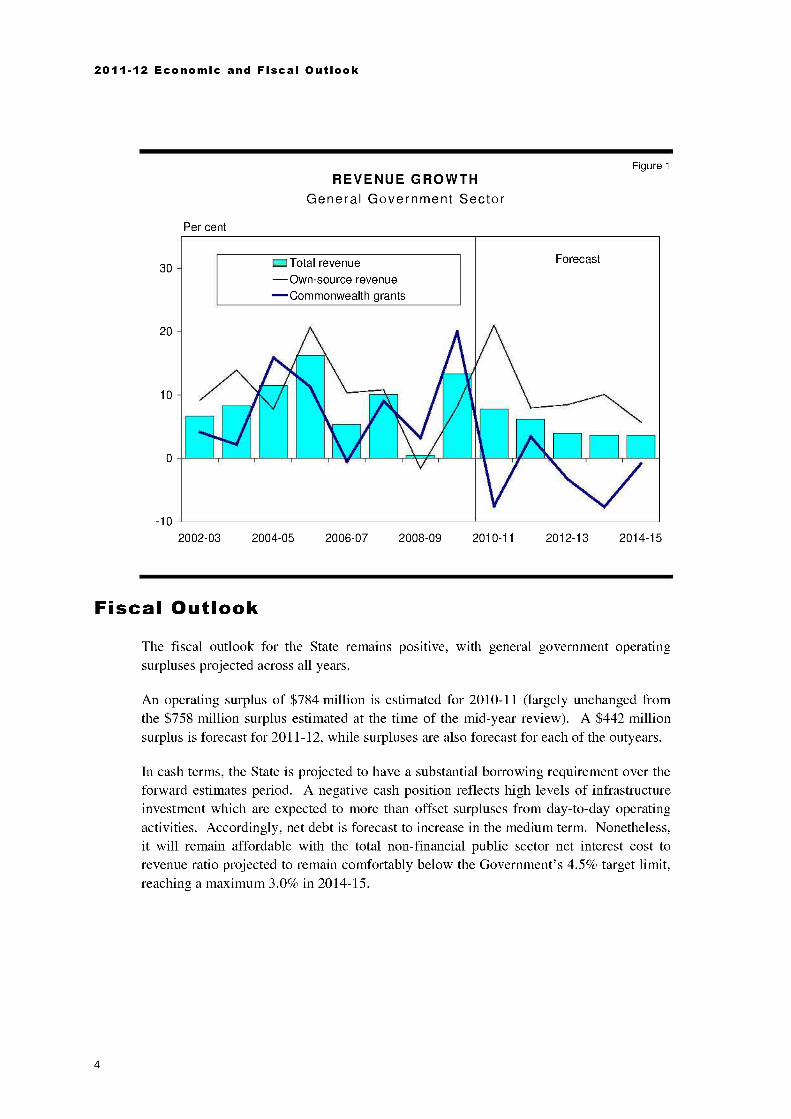
REVENUE GROWTHGeneral Government Sector
Per cent
Figure 1
30
20
10
=Total revenueOwn-source revenueCommonwealth grants
Forecast
-10
2002-03 2004-05 2006-07 2008-09 2010-11 2012-13 2014-15
Fiscal OutlookThe fiscal outlook for the State remains positive, with general government operatingsurpluses projected across all years.
An operating surplus of $784 million is estimated for 2010-11 (largely unchanged fromthe $758 million surplus estimated at the time of the mid-year review). A $442 millionsurplus is forecast for 2011-12, while surpluses are also forecast for each of the outyears.
In cash terms, the State is projected to have a substantial borrowing requirement over theforward estimates period. A negative cash position reflects high levels of infrastructureinvestment which are expected to more than offset surpluses from day-to-day operatingactivities. Accordingly, net debt is forecast to increase in the medium term. Nonetheless,it will remain affordable with the total non-financial public sector net interest cost torevenue ratio projected to remain comfortably below the Government's 4.5% target limit,reaching a maximum 3.0% in 2014-15.
4
Economic and Fiscal Outlook Overview
This outcome incorporates a $3.5 billion package of new measures implemented in thisbudget to contain growth in net debt over the forward estimates period. These measuresinclude:
an increase in the iron ore 'fines' royalty rate, from the current 5.625% rate to 6.5% in2012-13 and to the 'lump' ore rate of 7.5% from 2013-14. It is envisaged that theadditional revenue from this measure over the forward estimates period, estimated at$1.9 billion, will be quarantined for debt reduction purposes;
the deferral of spending totalling $541 million from the Government's AssetInvestment Program, relating to the West Pilbara desalination plant and adjustmentsto the cashflow for the Eastern Goldfields Regional Prison to be consistent with thelatest construction timing estimates;
a 5% efficiency dividend on the discretionary operating expenditure of GovernmentTrading Enterprises from 2011-12 (with an expected net debt reduction of$515 million by 30 June 2015); and
further savings of $300 million over the period 2012-13 to 2014-15 to be achievedthrough a targeted review (to be led by Treasury) of specific programs and activitiesthat are no longer considered a priority of the Government or to provide value formoney.
The budget aggregates also include the impact of savings measures implemented over thelast two years, including the 3% efficiency dividend (which is estimated to achievesavings of $1.46 billion over its first four full years, including $376 million in 2011-12).As a result of these savings measures and improved controls implemented by thisGovernment, expense growth is moderating, from an average of 10.9% over the last threeyears to an expected 7.9% in 2011-12.
5
2011 -12 Economic and Fiscal Outlook
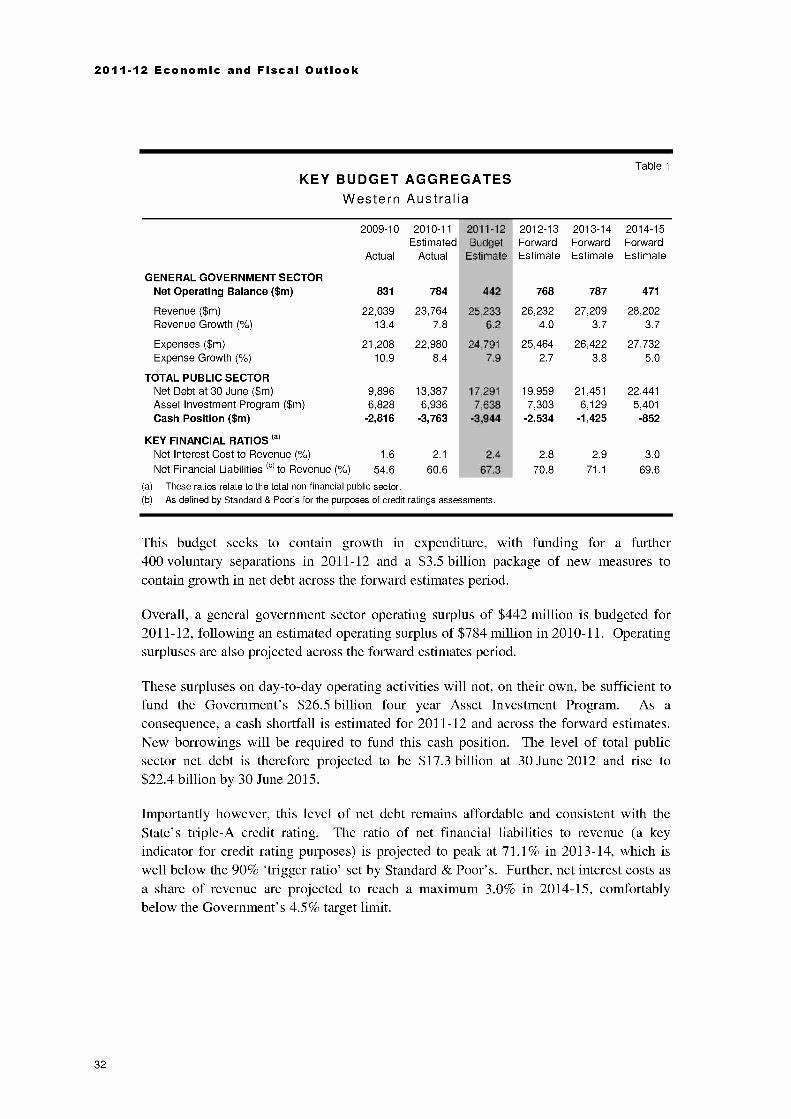
Table 2KEY BUDGET AGGREGATES
Western Australia
GENERAL GOVERNMENT SECTOR
2009-10
Actual
2010-11Estimated
Actual
2011-12Budget
Estimate
2012-13ForwardEstimate
2013-14ForwardEstimate
2014-15ForwardEstimate
Net Operating Balance ($m) 831 784 442 768 787 471
Revenue ($m) 22,039 23,764 25,233 26,232 27,209 28,202Revenue Growth ( %) 13.4 7.8 6.2 4.0 3.7 3.7
Expenses ($m) 21,208 22,980 24,791 25,464 26,422 27,732Expense Growth (°/0) 10.9 8.4 7.9 2.7 3.8 5.0
TOTAL PUBLIC SECTORNet Debt at 30 June ($m) 9,896 13,387 17,291 19,959 21,451 22,441Asset Investment Program ($m) 6,828 6,936 7,638 7,303 6,129 5,401Cash Position ($m) -2,816 -3,763 -3,944 -2,534 -1,425 -852
KEY FINANCIAL RATIOS (a)
Net Interest Cost to Revenue ( %) 1.6 2.1 2.4 2.8 2.9 3.0
Net Financial Liabilities to to Revenue ( %) 54.6 60.6 67.3 70.8 71.1 69.6
(a) These ratios relate to the total non-financial public sector.(b) As defined by Standard & Poor's for the purposes of credit ratings assessments.
Budget ObjectivesSupporting Our Community
Delivering Major Social Infrastructure for Future Generations
Significant infrastructure investments in the 2011-12 State Budget that will benefit futuregenerations of Western Australians include:
the Perth Waterfront Project, which represents an important shift to a more diverse,liveable and contemporary city. Net of land sales revenue, the State Government willinvest $270 million to see this project come to fruition;
$505 million will be appropriated to the New Children's Hospital Special PurposeAccount in 2011-12. This will be a state of the art children's hospital providing274 beds, and will house the State's only paediatric trauma centre. The hospital willhave increased family facilities and bedside accommodation for parents and carers,will provide tertiary and key secondary health services including inpatient,ambulatory and outpatient care, and include a new Integrated Research and Educationfacility (combining efforts with the Telethon Institute of Child Health Research,university research units and other research bodies). Construction is expected to startin early 2012 and be completed by late 2015;
$169 million for new schools, additional school infrastructure, preventativemaintenance and the extension of air conditioning to all government schools toprovide students with an optimal learning environment;
6
Economic and Fiscal Outlook Overview
$41 million over four years for the implementation of the Kimberley Science andConservation Strategy which includes the following suite of initiatives aimed atpreserving the unique environmental and cultural values of the Kimberley:
$10 million in funding for the Western Australian Marine Science Institute and anIntegrated Marine Observation System, to contribute to the study of theKimberley's marine environment;
$9 million for the establishment and management of Eighty Mile Beach andCamden Sound Marine Parks;
$9 million for the creation of a conservation reserve corridor, an islandconservation reserve, and additional conservation linkages across theNorth Kimberley through voluntary partnerships with traditional owners,pastoralists and non-government organisations;
$7 million from Royalties for Regions (RJR) for the development and promotionof tourism corridors across the region, including the development and upgrade ofcamping facilities;
$3 million to enable geophysical and geochemical surveys of the region; and
$3 million for two new recreational fishing initiatives in the Kimberley and tomonitor progress of the Strategy;
$16 million over four years from RJR for the establishment and management of CapesMarine Park and Dampier Archipelago Marine Park and for research activities whichaim to promote a sustained increase in the abundance and diversity of existing fishstocks in Western Australian waters; and
planning money for a new major stadium ($13 million), a new purpose builtWestern Australian Institute of Sport Centre ($2 million), and a new Museum in thePerth Cultural Centre ($5 million).
Targeted Spending to Deliver Quality Services for All Western Australians
Key initiatives in the 2011-12 State Budget that support the community through targetedspending on high quality services include:
over $600 million to support the development of a sustainable not-for-profit sector.This includes $491 million to provide an average 25% increase in funding for humanservices contracts by 2014-15, and $96 million in additional indexation funding;
$538 million for the RJR Southern Inland Health Initiative package (to 2014-15). Thisincludes $240 million to be spent over four years to address the shortfall of GeneralPractitioners (GPs) in regional Western Australia by providing GPs with incentives toretain and/or attract them into the regions, improving the level of Telehealth services,and increasing the number of primary health care staff associated with theredevelopment of six integrated district health services across the State;
7

2011-12 Economic and Fiscal Outlook
$151 million for an additional 284 homes for people who are significantly impairedby a disability, living with mental illness, or dealing with alcohol and drug relatedissues;
expansion of the working hours criterion for eligibility for the Seniors Card to anaverage of 25 hours per week (compared to the current limit of 20 hours per week),and a significant increase in the Seniors Cost of Living Rebate to $150 (up from$104.80) for singles and $225 (up from $157.22) for couples in 2011-12;
$363 million for additional spending on health services, supporting increased hospitaldemand growth, and a further $75 million for the employment and training of juniordoctors graduating from Western Australian universities to ensure an appropriatesupply of locally trained doctors;
an additional $51 million to meet increases in demand for child protection services(including increased effort in prevention and early intervention programs for at-riskfamilies), and $41 million to meet the expected growth in demand for disabilityservices (including respite options, access to aids and equipment, and family and carersupport);
an increase in the amount of speed and red light camera revenue provided to the RoadTrauma Trust Fund, doubling the current one-third proportion to two-thirds in2011-12 and further increasing it to 100% from 2012-13. The Government will havethe dedicated capacity to significantly increase road safety programs, police trafficenforcement, road building and maintenance, community education campaigns andschool-based programs in both metropolitan and regional Western Australia; and
$113 million for information and communications technology infrastructure andsystems for Western Australia Police in support of modern policing techniques andthe increasingly intelligence-led approach to crime reduction.
Building the State
The following initiatives in the 2011-12 State Budget are about investing now to keep thegrowth going into the future:
$164 million over five years to purchase an additional 15 three-car train sets (with$137 million to be spent over the period to 2014-15). Once operational, these willhave the capacity to carry an additional 8,400 passengers;
$40 million to purchase an additional 78 buses over the next four years, and a further$134 million to provide more frequent and accessible bus services;
$30 million over the next two years to widen the Mitchell Freeway between HepburnAvenue and Hodges Drive. The northbound carriageway of Mitchell Freeway will bewidened from two to three lanes, increasing capacity to meet the existing and forecasttraffic demand, and reduce delays;
8
Economic and Fiscal Outlook Overview
$33 million in 2011-12 for an additional 12,000 training places, including $23 millionfor 7,500 places in occupations that are in higher demand from industry and theremainder for an additional 4,546 workforce participation training places;
$4 million over four years to attract and retain skilled migrants to Western Australiaand meet State sponsorship targets;
continued investment in the Pilbara Cities Initiative, which totals over $1 billion overfive years, and aims to transform the Pilbara by building sustainable communities thatare well serviced by modern infrastructure and amenities to support continuedeconomic growth;
$283 million over four years for the State Government's contribution to the Perth CityLink project;
$100 million over four years to widen Great Eastern Highway between KooyongRoad and Tonkin Highway; and
$60 million over the next four years to expand Western Australia's events calendar,including $40 million from RJR, enabling major new metropolitan and regional eventsto be developed and facilitate enhancements to existing events.
9

2011-12 Economic and Fiscal Outlook
10
CHAPTER 2
The Western AustralianEconomy
Overview
Western Australia's economy is expanding at a stable pace. Conditions in the resourcessector are particularly strong, with robust demand from emerging economies and highcommodity prices creating a substantial pipeline of investment activity.
However, conditions in other sectors of the State's economy are more subdued.Households continue to display a heightened level of fiscal restraint, resulting in modestgrowth in discretionary spending, whilst activity in Western Australia's establishedhousing market has softened significantly, partly in response to higher interest rates andthe withdrawal of Commonwealth Government stimulus measures. At the same time, theagricultural sector has been affected by extreme weather conditions, while a number ofindustries are being challenged by the high Australian dollar.
The overall outlook for growth is nevertheless positive. Western Australia is in the midstof a major investment cycle, led by construction of the $43 billion Gorgon LiquefiedNatural Gas (LNG) project and several iron ore developments in the Pilbara and theMid West. Investment on these projects will underpin growth in Western Australia'seconomy in both 2011-12 and 2012-13, with exports becoming the major driver of growthfrom 2013-14.
Conditions in the household sector are also expected to strengthen over the budget period,supported by improving conditions in the labour market, stronger asset prices and afurther consolidation in household balance sheets.
Overall, Gross State Product (GSP) is forecast to grow by 4.5% in 2011-12, following anestimated increase of 4.0% in 2010-11. Major drivers of growth in 2011-12 includebusiness investment (up 15.0%), merchandise exports (up 6.5%) and householdconsumption (up 3.75%).
11
2011-12 Economic and Fiscal Outlook
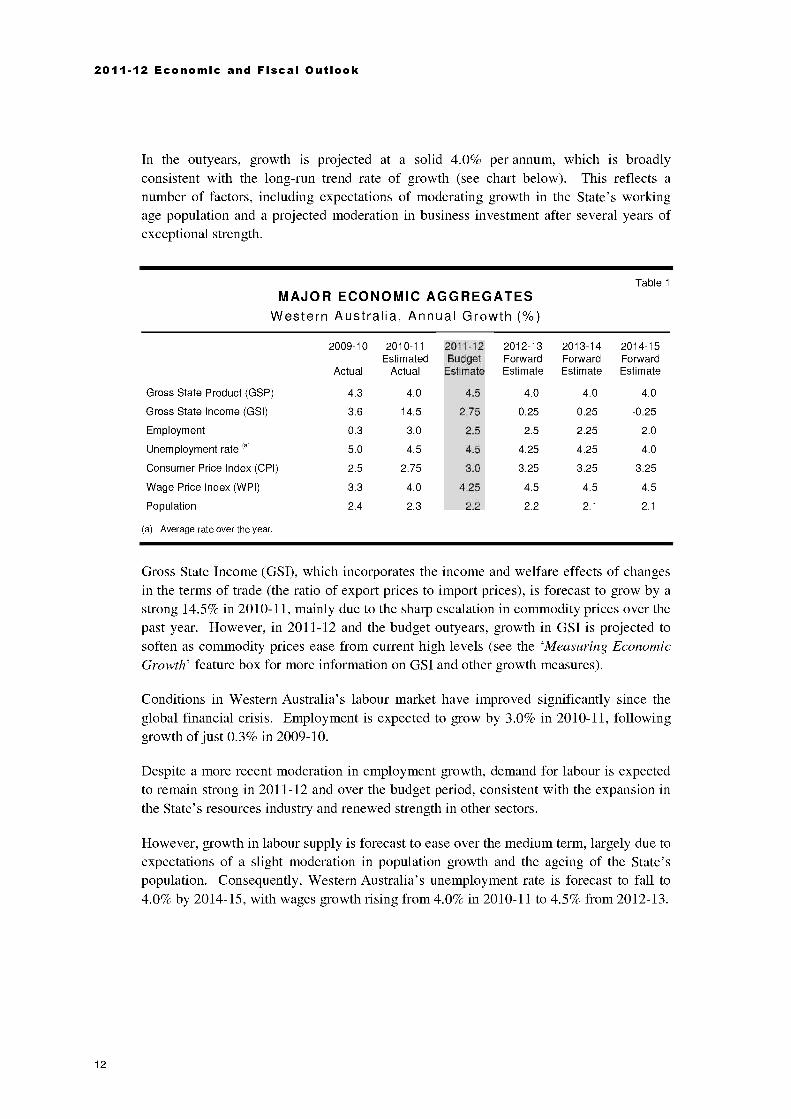
In the outyears, growth is projected at a solid 4.0% per annum, which is broadlyconsistent with the long-run trend rate of growth (see chart below). This reflects anumber of factors, including expectations of moderating growth in the State's workingage population and a projected moderation in business investment after several years ofexceptional strength.
Table 1
MAJOR ECONOMIC AGGREGATESWestern Australia, Annual Growth (%)
2009-10
Actual
2010-11Estimated
Actual
2011-12Budget
Estimate
2012-13ForwardEstimate
2013-14ForwardEstimate
2014-15ForwardEstimate
Gross State Product (GSP) 4.3 4.0 4.5 4.0 4.0 4.0
Gross State Income (GS!) 3.6 14.5 2.75 0.25 0.25 -0.25
Employment 0.3 3.0 2.5 2.5 2.25 2.0
Unemployment rate (a) 5.0 4.5 4.5 4.25 4.25 4.0
Consumer Price Index (CPI) 2.5 2.75 3.0 3.25 3.25 3.25
Wage Price Index (WPI) 3.3 4.0 4.25 4.5 4.5 4.5
Population 2.4 2.3 2.2 2.2 2.1 2.1
(a) Average rate over the year.
Gross State Income (GSI), which incorporates the income and welfare effects of changesin the terms of trade (the ratio of export prices to import prices), is forecast to grow by astrong 14.5% in 2010-11, mainly due to the sharp escalation in commodity prices over thepast year. However, in 2011-12 and the budget outyears, growth in GSI is projected tosoften as commodity prices ease from current high levels (see the 'Measuring EconomicGrowth' feature box for more information on GSI and other growth measures).
Conditions in Western Australia's labour market have improved significantly since theglobal financial crisis. Employment is expected to grow by 3.0% in 2010-11, followinggrowth of just 0.3% in 2009-10.
Despite a more recent moderation in employment growth, demand for labour is expectedto remain strong in 2011-12 and over the budget period, consistent with the expansion inthe State's resources industry and renewed strength in other sectors.
However, growth in labour supply is forecast to ease over the medium term, largely due toexpectations of a slight moderation in population growth and the ageing of the State'spopulation. Consequently, Western Australia's unemployment rate is forecast to fall to4.0% by 2014-15, with wages growth rising from 4.0% in 2010-11 to 4.5% from 2012-13.
12

The Western Australian Economy
8Per cent
7
6
5
4
3
2
1
0
Figure 1
ECONOMIC GROWTHGross State Product, Western Australia
Forecast=Western Australia AustraliaWestern AustraliaLong-run average
j1 1
1990-91 1993-94 1996-97 1999-00 2002-03 2005-06 2008-09 2011-12 2014-15
Source: Australian Bureau of Statistics Catalogue 5220.0, Department of Treasury and Commonwealth 2011-12 Budget.
13
2011-12 Economic and Fiscal Outlook
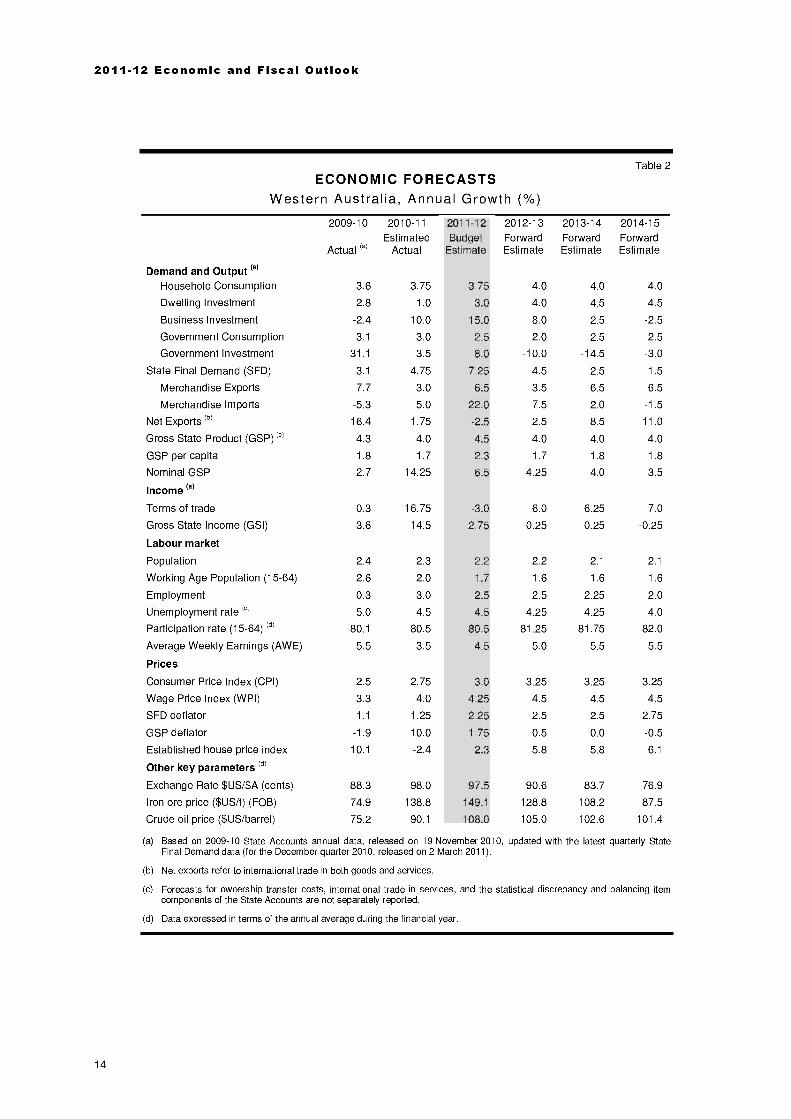
Table 2
ECONOMIC FORECASTSWestern Australia, Annual Growth (%)
Demand and Output (a)
2009-10
Actual (a)
2010-11
EstimatedActual
2011-12Budget
Estimate
2012-13ForwardEstimate
2013-14ForwardEstimate
2014-15ForwardEstimate
Household Consumption 3.6 3.75 3.75 4.0 4.0 4.0
Dwelling Investment 2.8 1.0 3.0 4.0 4.5 4.5
Business Investment -2.4 10.0 15.0 8.0 2.5 -2.5
Government Consumption 3.1 3.0 2.5 2.0 2.5 2.5
Government Investment 31.1 3.5 8.0 -10.0 -14.5 -3.0
State Final Demand (SFD) 3.1 4.75 7.25 4.5 2.5 1.5
Merchandise Exports 7.7 3.0 6.5 3.5 6.5 6.5
Merchandise Imports -5.3 5.0 22.0 7.5 2.0 -1.5
Net Exports (b) 16.4 1.75 -2.5 2.5 8.5 11.0
Gross State Product (GSP) (d) 4.3 4.0 4.5 4.0 4.0 4.0
GSP per capita 1.8 1.7 2.3 1.7 1.8 1.8
Nominal GSP 2.7 14.25 6.5 4.25 4.0 3.5
Income (a)
Terms of trade 0.3 16.75 -3.0 -6.0 -6.25 -7.0
Gross State Income (GS!) 3.6 14.5 2.75 0.25 0.25 -0.25
Labour market
Population 2.4 2.3 2.2 2.2 2.1 2.1
Working Age Population (15-64) 2.6 2.0 1.7 1.6 1.6 1.6
Employment 0.3 3.0 2.5 2.5 2.25 2.0
Unemployment rate (d) 5.0 4.5 4.5 4.25 4.25 4.0
Participation rate (15-64) (d) 80.1 80.5 80.5 81.25 81.75 82.0
Average Weekly Earnings (AWE) 5.5 3.5 4.5 5.0 5.5 5.5
Prices
Consumer Price Index (CPI) 2.5 2.75 3.0 3.25 3.25 3.25
Wage Price Index (WPI) 3.3 4.0 4.25 4.5 4.5 4.5
SFD deflator 1.1 1.25 2.25 2.5 2.5 2.75
GSP deflator -1.9 10.0 1.75 0.5 0.0 -0.5
Established house price index 10.1 -2.4 2.3 5.8 5.8 6.1
Other key parameters (d)
Exchange Rate $US/$A (cents) 88.3 98.0 97.5 90.6 83.7 76.9
Iron ore price ($USit) (FOB) 74.9 138.8 149.1 128.8 108.2 87.5
Crude oil price ($US/barrel) 75.2 90.1 108.0 105.0 102.6 101.4
(a) Based on 2009-10 State Accounts annual data, released on 19 November 2010, updated with the latest quarterly StateFinal Demand data (for the December quarter 2010, released on 2 March 2011).
(b) Net exports refer to international trade in both goods and services.
(c) Forecasts for ownership transfer costs, international trade in services, and the statistical discrepancy and balancing itemcomponents of the State Accounts are not separately reported.
(d) Data expressed in terms of the annual average during the financial year.
14
The Western Australian Economy
Global Outlook
The global economic recovery is continuing, albeit at a modest pace.
Activity has been stronger than previously expected in advanced economies, but growthremains unbalanced and unemployment rates are still high, with renewed fiscal stresses inthe euro area periphery adding to the downside risks. On the other hand, activity in manyemerging economies remains robust, although inflationary pressures are intensifying inmany of these countries.
In its April 2011 World Economic Outlook, the International Monetary Fund (IMF)forecast global growth of 4.4% in 2011, with advanced economies growing by 2.4% andemerging and developing economies growing by 6.5%.
The IMF argues that due to 'improvements in financial markets, buoyant activity in manyemerging and developing economies, and growing confidence in advanced economies,economic prospects for 2011-12 are good, notwithstanding new volatility caused by fearsabout disruptions to oil supply'. The Organisation for Economic Cooperation andDevelopment (OECD) also shares a cautiously optimistic outlook on global growth.
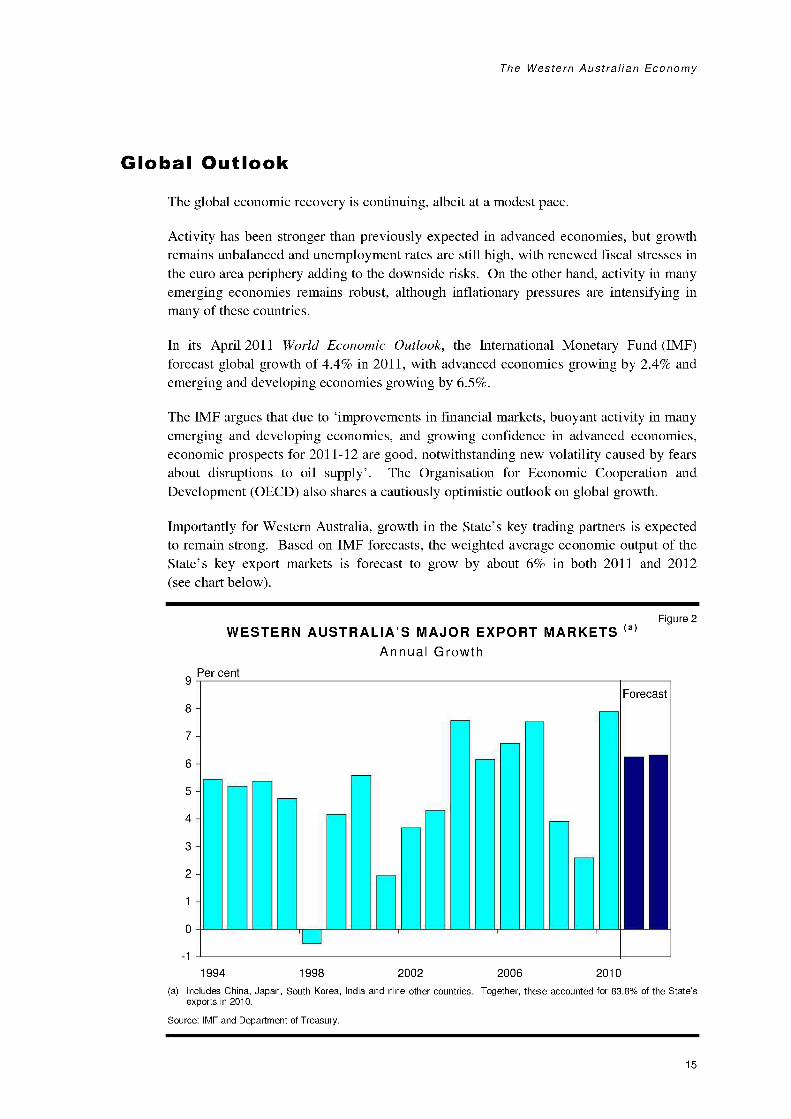
Importantly for Western Australia, growth in the State's key trading partners is expectedto remain strong. Based on IMF forecasts, the weighted average economic output of theState's key export markets is forecast to grow by about 6% in both 2011 and 2012(see chart below).
WESTERN AUSTRALIA'S MAJOR EXPORT MARKETS (a)Annual Growth
9Per cent
8
7
6
5
4
3
2
1
0
1
1994
Figure 2
Forecast
I I1998 2002 2006 2010
(a) Includes China, Japan, South Korea, India and nine other countries. Together, these accounted for 83.8% of the State'sexports in 2010.
Source: IMF and Department of Treasury.
15
2011-12 Economic and Fiscal Outlook
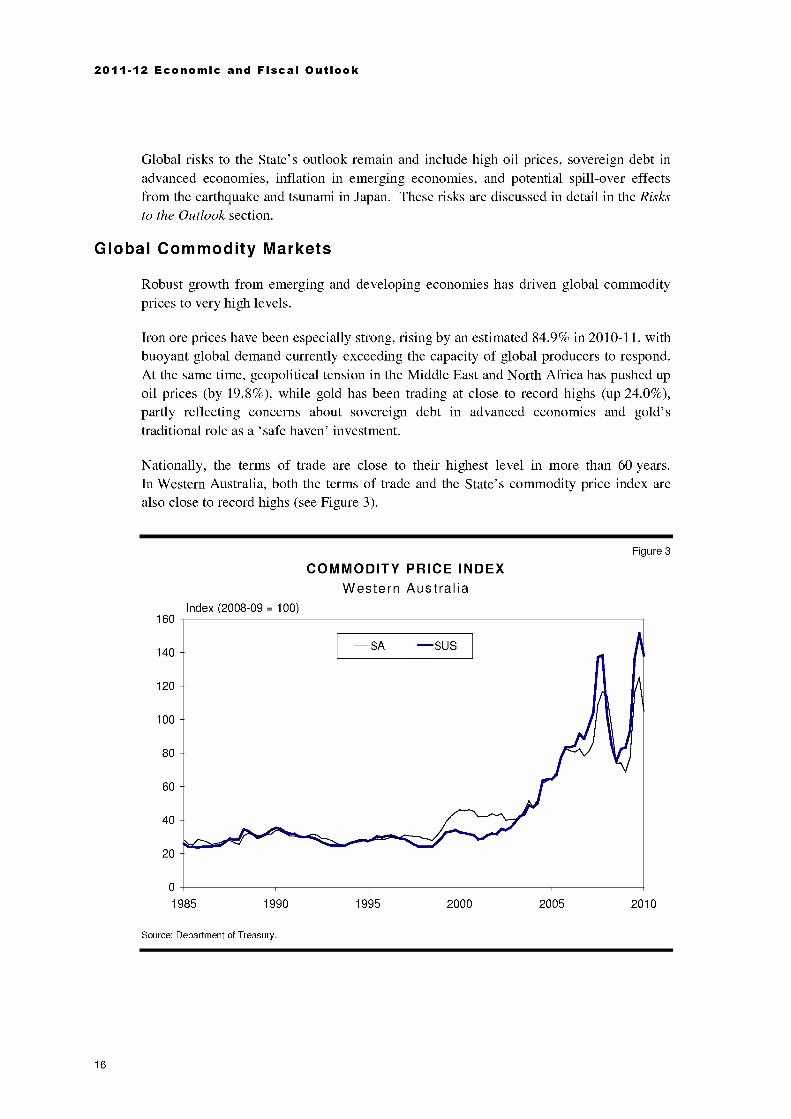
Global risks to the State's outlook remain and include high oil prices, sovereign debt inadvanced economies, inflation in emerging economies, and potential spill-over effectsfrom the earthquake and tsunami in Japan. These risks are discussed in detail in the Risksto the Outlook section.
Global Commodity Markets
Robust growth from emerging and developing economies has driven global commodityprices to very high levels.
Iron ore prices have been especially strong, rising by an estimated 84.9% in 2010-11, withbuoyant global demand currently exceeding the capacity of global producers to respond.At the same time, geopolitical tension in the Middle East and North Africa has pushed upoil prices (by 19.8%), while gold has been trading at close to record highs (up 24.0%),partly reflecting concerns about sovereign debt in advanced economies and gold'straditional role as a 'safe haven' investment.
Nationally, the terms of trade are close to their highest level in more than 60 years.In Western Australia, both the terms of trade and the State's commodity price index arealso close to record highs (see Figure 3).
160
140
120
100
80
60
40
20
0
COMMODITY PRICE INDEXWestern Australia
Index (2008-09 = 100)
Figure 3
1985 1990
Source: Department of Treasury.
1995 2000 2005 2010
16
The Western Australian Economy
Although strength in the terms of trade presents a challenge for some industries (due to anassociated appreciation in the exchange rate), it will deliver a number of importanteconomy-wide benefits, both at the State and national level. High prices forWestern Australia's key export commodities are underpinning a wave of new investmentprojects, particularly in the iron ore and LNG sectors, which will drive economic growthover coming years. In addition, the high terms of trade and strong Australian dollar haveboosted the purchasing power of households, whilst Western Australia is also benefitingfrom a sharp rise in royalty incomes.
Most analysts forecast that prices for many commodities will gradually moderate incoming years. This reflects expectations that the global supply response will eventuallygather momentum, alleviating upward pressure on prices. Nevertheless, prices aregenerally expected to be sustained at high levels by historical standards.
More information on the outlook for commodity prices is contained in Chapter 4: GeneralGovernment Revenue.
Measuring Economic Growth
The Australian Bureau of Statistics (ABS) publishes a number of different measures ofeconomic growth for Australia's States and Territories. The most well-known of theseis GSP, which is a broad measure of the total level of goods and services produced in aState economy (in value added terms). The national equivalent of GSP isGross Domestic Product, or GDP.
GSP data are typically presented in two ways in nominal terms, where output ismeasured in current prices, and in real (`chain volume') terms, where only volumes aremeasured, and price effects are held constant. Economic growth data, both in Australiaand overseas, are typically expressed in real terms.
Although real GSP is a frequently quoted indicator of economic growth, one of itslimitations is that it excludes the income and welfare effects of changes in the terms oftrade (i.e. export prices relative to import prices). When export prices rise relative toimport prices, a larger volume of goods and services (e.g. motor vehicles) can beimported in exchange for a given volume of exports (e.g. iron ore). In other words, thereal purchasing power of domestic income rises.
Growth in nominal GSP can capture some of these relative price effects, especially ifimport prices are unchanged. Due to sharply increasing export prices inWestern Australia, nominal GSP is forecast to grow by more than 14% in 2010-11.
This translates to per capita GSP of around $90,600 in 2010-11, which is 45% higherthan national GDP per capita ($62,200).
Albeit that approximately 70% of royalty income generated in Western Australia is ultimately redistributed to other States (via areduction in GST grants) under the Commonwealth Grants Commission process. See Chapter 4: General Government Revenuefor more detail.
17

2011-12 Economic and Fiscal Outlook
A more complete adjustment for movements in the terms of trade is incorporated inABS estimates of real GSI. Real GSI is calculated by adjusting real GSP to accountfor the relative purchasing power of the State's exports (with domestic prices heldconstant). In 2010-11, GSI in Western Australia is forecast to grow by 14.5%, whichcompares to estimated growth of 4.0% in real GSP.
Both GSP and GSI have limitations as indicators of economic welfare. For instance,neither variable accounts for net income transfers to other States or overseas, i.e. due toforeign ownership. The depreciation of the economy's capital stock and the depletionof non-renewable resources are also excluded from these indicators.
Gross household disposable income is often regarded as a more direct indicator ofeconomic well-being, since it accounts for net income transfers in the economy. Overthe five years to 2009-10, per capita gross household disposable income inWestern Australia grew by 47% (to around $42,000), compared to national growthof 31% over the same period (to around $37,700).
Household Sector
Household Spending
Household spending grew at a moderate pace in the second half of 2010, with growthlargely concentrated on non-discretionary items, including utilities, transportation,services and food.
Consumers in Western Australia (and the rest of the nation) are generally being cautiousin their spending behaviour. This restraint in spending has occurred against a backdrop ofslightly above-average consumer sentiment, improving conditions in the State's labourmarket and the strong appreciation of the Australian dollar. Nevertheless, it is consistentwith the withdrawal of Commonwealth stimulus funding, higher interest rates andabove-average levels of household debt.
With Commonwealth Government policy measures, including the flood levy and theproposed carbon tax, potentially adding to household conservatism in the near term,household consumption is forecast to grow by 3.75% in both 2010-11 and 2011-12(slightly below the trend growth rate of around 4%).
Close to trend growth is forecast for the remaining years, as consumers relax theirpost-financial crisis conservatism and increase discretionary spending on the back ofrising household income. However, growth is not expected to return to the same ratesobserved in the last resources boom, partly reflecting expectations that household debtwill remain relatively high, as well as expectations that population growth will moderateslightly over the budget period.
18

The Western Australian Economy
Housing Market
Established Housing Market
Activity in Western Australia's established housing market has been very subdued in2010-11.
House prices have fallen, turnover remains low, and the number of houses on the marketis well above the long-term trend. In part, this reflects a rise in variable home loan ratesover the past 18 months by around 2 percentage points, together with a continuedunwinding of First Home Owner Boost (FHOB) induced activity (which is having anegative impact on the trade-up segment of the market). It also reflects elevatedhousehold debt and heightened levels of household caution over the past year.
The established housing market is expected to gradually improve in 2011-12 and acrossthe forward estimates period. House prices in Perth are forecast to grow by 2.3% in2011-12 (following an estimated decrease of 2.4% in 2010-11), while the volume ofhouse sales is expected to increase from current low levels. House price growth isforecast to accelerate in the outyears, supported by rising incomes and stronger householdbalance sheets.
Dwelling Investment2
After growing by 2.8% in 2009-10 (in part due to Commonwealth Government stimulusmeasures, including the FHOB and the solar panel and home insulation schemes),dwelling investment has contracted in the first half of 2010-11. Both of the maincomponents of dwelling investment new residential construction, and alterations andadditions have been subdued.
Despite the recent moderation in investment activity, the number of dwellings underconstruction in Western Australia remains high by historical standards, in part due to thepull-forward in activity caused by the FHOB. This should be sufficient to underpinmodest growth of 1.0% in dwelling investment for the full 2010-11 year.
In 2011-12, first-home buyers are expected to gradually re-enter the market in increasingnumbers. Growth in household income should also stimulate more investment, althoughcurrent weakness in forward indicators of activity (including building approvals andhousing finance) points to moderate growth in the second half of 2011. Overall, dwellinginvestment is forecast to grow by 3.0% in 2011-12.
In 2012-13 and beyond, growth in dwelling investment is forecast to strengthen tobetween 4.0% and 4.5% per year, which is broadly consistent with the long-run trend.Activity should be supported by rising incomes and solid (albeit moderating) growth inthe State's population.
2 Dwelling investment consists of the construction of new dwellings (usually around 60% of overall dwelling investment) andresidential alterations and additions (the remaining 40%). Ownership transfer costs are forecast separately and track transfer dutyforecasts. See Chapter 4: General Government Revenue.
19

2011-12 Economic and Fiscal Outlook
Numberumber
20,000
15,000
10,000
5,000
Figure 4RESIDENTIAL BUILDING WORK
Stage of Production, Number, Quarterly
Commencements (Trend)
Completions (Trend)
Under Construction (Original)
0
1989 1992 1995 1998 2001 2004 2007 2010
Source: ABS Catalogue 8752.0 and Department of Treasury.
Business Investment
The outlook for business investment in Western Australia is bright.
Robust demand from emerging economies, particularly for mineral and energycommodities, has created a significant pipeline of investment activity in the State'sresources sector. As at December 2010, the value of engineering construction yet to bedone in Western Australia stood at almost $65 billion3.
Over the next two years, investment growth will be driven by the $43 billion GorgonLNG project and around $20 billion of expenditure on iron ore projects in the Pilbara andthe Mid West4. Petroleum and iron ore projects dominate the State's medium-terminvestment horizon, accounting for over 80% of current and prospective resource projects.
Reflecting the expected profile of spending on these projects, total business investment isforecast to grow by 10.0% in 2010-11, 15.0% in 2011-12 and 8.0% in 2012-13.
As the Gorgon project passes peak construction (to be expected around 2012-13), totalbusiness investment in Western Australia is expected to moderate and eventually contract.This is due to the enormous size of the Gorgon project, and the scale of replacementactivity needed to sustain investment spending at such high levels.
3 Source: ABS catalogue 8762.0, Engineering Construction Activity, Australia, December 2010.
4 Source: Project values from Access Economics' Investment Monitor, December quarter 2010, and other various sources.
20

The Western Australian Economy
70
60
50
40
30
20
10-
0
BUSINESS INVESTMENTWestern Australia, Chain Volume
$ Billion (2008-09)
Figure 5
Fo recast
1989-90 1992-93 1995-96 1998-99 2001-02 2004-05 2007-08 2010-11 2013-14
Note: Excludes net purchases of second-hand public sector assets by the private sector. Data adjusted for 1997-98 sale ofDampier to Bunbury Natural Gas Pipeline from the public sector to the private sector.
Source: ABS Catalogue 5206.0 and Department of Treasury.
Based on the current status of major projects in the outyears, business investment isprojected to grow by 2.5% in 2013-14, before declining by 2.5% in 2014-15. The level ofinvestment is nevertheless expected to remain very high in historical terms (see chartabove).
There is a possibility that business investment could exceed these projections, particularlyif a number of the State's prospective LNG projects receive final investment approval andcommence construction over the budget period. These include: Woodside's proposed$30 billion Browse LNG precinct; Chevron's $23 billion Wheatstone LNG development;and Woodside's Pluto 2 project (approximately $10 billion). It is noted, however, that theCommonwealth Government will collect all of the royalties generated by these LNGprojects, under its Petroleum Resource Rent Tax (PRRT) regime.
Government Sector
Government Consumption
Public consumption expenditure, which includes spending by Commonwealth, State andlocal governments, is expected to grow by 3.0% (in real terms) in 2010-11.
In 2011-12 and the outyears, growth in public consumption is expected to range between2.0% and 2.5%. The expected moderation in growth is consistent with the expense growthprojections in Chapter 3: Financial Projections and Fiscal Strategy, and with expectationsthat population growth in Western Australia will be slightly lower than in previous years.
21
2011-12 Economic and Fiscal Outlook
Government Investment
After increasing by more than 30% in 2009-10 (due to stimulus measures in response tothe global financial crisis), growth in investment by Commonwealth, State and localgovernments is expected to moderate to 3.5% in 2010-11.
State Government investment on major projects and other economic and socialinfrastructure is expected to drive growth in total public investment of 8.0% in 2011-12.Growth in public investment is then projected to contract over the forward estimatesperiod, partly due to the completion of a number of large projects.
Further information on the State Government's recurrent expenditure and its AssetInvestment Program is outlined in Chapter 5: General Government Expenses, andChapter 6: Asset Investment.
International TradeExports
International demand for resources, particularly from China and other emergingeconomies, remains very strong.
Export growth is nevertheless expected to moderate to 3.0% in 2010-11 (following 7.7%growth in the previous year). This reflects a number of temporary supply factors,including the impact of extreme weather conditions on agricultural production and theeffect of recent cyclone activity on iron ore shipments.
However, export growth is forecast to accelerate to 6.5% in 2011-12, mainly due to anassumed recovery from the drought and the completion of a number of major projects.These include Woodside's Pluto LNG project, Rio Tinto's Brockman 4 iron oredevelopment and Gindalbie Metals' Karara iron ore project.
In 2012-13, exports are forecast to grow at a slower pace of 3.5%, reflecting ananticipated pause in completions of large resource projects. However, growth is expectedto strengthen to 6.5% per annum in 2013-14 and 2014-15, supported by additionaliron ore capacity and initial production from the Gorgon LNG project (in 2014-15).
Imports
Imports are expected to grow strongly in coming years, largely driven by the projectedupswing in business investment (including major items of capital equipment required tosupport the construction of the State's major resource projects). In addition, imports willbe boosted by slightly stronger growth in household consumption.
Following estimated growth of 5.0% in 2010-11, imports are projected to grow by 22.0%in 2011-12. As the investment cycle unwinds, import growth will moderate in 2012-13and the outyears.
22

The Western Australian Economy
Labour MarketEmployment
Employment growth stalled in 2009 (as a lagged response to the global financial crisis),but rebounded strongly throughout most of 2010.
Over the past two quarters, however, the pace of employment growth has softenednoticeably5. Leading indicators of employment demand6 have also plateaued, and remainwell down from the levels observed in the last resources boom.
The outlook for employment demand is nevertheless quite positive, particularly asbusiness investment grows and domestic activity strengthens. Based on outcomes in theyear-to-date, employment is expected to grow by 3.0% in 2010-11.
Labour demand is expected to strengthen in 2011-12 and the outyears, underpinned byrobust activity in the resources sector and renewed strength in other sectors of the State'seconomy.
However, growth in labour supply is projected to slow over this period, mainly due toexpectations of moderating population growth and the ageing of the State's population.Reflecting these constraints, employment growth is expected to moderate slightly over themedium term, from 2.5% in 2011-12 and 2012-13 to 2.25% in 2013-14 and 2.0% in2014-15.
Unemployment and Participation
The unemployment rate in Western Australia has been fairly steady so far in 2010-11,ranging between 4.2% and 4.6% in seasonally adjusted terms.
Over the whole of 2010-11, the unemployment rate is expected to average 4.5%. This ishigher than the average rate observed over the period 2006-07 to 2008-09, but lower thanthe average unemployment rate over the past decade (4.9%).
Western Australia's unemployment rate is likely to remain relatively low in 2011-12, asstrengthening domestic economic growth boosts demand for labour. The unemploymentrate is forecast to fall further over the outyears, to 4.25% in 2012-13 and 2013-14 and to4.0% in 2014-15, as economic activity expands and demand for labour intensifies.
At the national level, the Commonwealth Treasury predicts the unemployment rate willfall to 4.5% by the end of 2012-13.
5 The Reserve Bank of Australia has recently expressed concern that the ABS may have overestimated employment growth inearly 2010. This would imply that employment growth more recently could be understated.
6 For instance, the ANZ Newspaper Jobs Advertisement series, and the Federal Department of Education, Employment andWorkplace Relations' Skilled Vacancy Index.
23

2011-12 Economic and Fiscal Outlook
14
12
10
8
6
4
2
Mar-78 Mar-82 Mar-86 Mar-90 Mar-94 Mar-98 Mar-02 Mar-06 Mar-10
UNEMPLOYMENT RATETrend
Per cent
Figure 6
Source: ABS Catalogue 6202.0.
Strong demand for labour and rising wages are expected to drive a moderate increase inthe State's participation rate (for workers aged between 15-64) over the budget period,from 80.5% in 2011-12 to 82.0% in 2014-15.
Wages
Wages growth in Western Australia has been relatively moderate so far in 2010-11.
The Wage Price Index' (WPI) grew by 0.9% in the December quarter 2010, following anincrease of 1.2% in the previous quarter. Based on these outcomes, and the positive nearterm outlook for the labour market, the WPI is forecast to grow by 4.0% in 2010-11.
Increasing demand for labour, combined with expectations of moderating growth inlabour supply, means that wages growth is likely to strengthen over the budget period.
However, wage pressures are not expected to be as acute as the resource boom period ofthe mid to late 2000s. Although forward indicators of labour demand are positive, theyare still below the levels observed over the three years to 2008-09. The projectedmoderation in business investment in 2013-14 and 2014-15 could also partly offsettightness in the labour market over this period.
7 The WPI is viewed as a better measure of underlying wages growth than other indicators reported by the ABS. This is because theWPI is designed to measure wage changes for a fixed quantity and quality of labour, and so abstracts from compositional changesin the labour market.
24

The Western Australian Economy
Overall, the WPI is forecast to grow by 4.25% in 2011-12, and by 4.5% per annum ineach of the outyears. This is slightly higher than the long-run average of 4.1% growth.
0
WAGE PRICE INDEXAnnual Growth ( %)
Per cent
Figure 7
Long-run average
Forecast
1998-99 2000-01 2002-03 2004-05 2006-07 2008-09 2010-11 2012-13 2014-15
Source: ABS Catalogue 6345.0 and Department of Treasury.
Average Weekly Earnings (AWE), which are affected by compositional change in thelabour market, rose by just 0.1% in the three months to November 2010, partly reflectinga reduction in average hours worked. Based on modest outcomes in the year-to-date,AWE are forecast to rise by 3.5% in 2010-11.
Similar to the expected profile for the WPI, growth in AWE is expected to strengthen in2011-12 and the outyears. AWE is forecast to grow by 4.5% in 2011-12, 5.0% in2012-13 and 5.5% in 2013-14 and 2014-15. This compares to average growth of 6.0%over the past decade.
Prices
Consumer Price Index
Inflation has been relatively low so far in 2010-11, with Perth's Consumer PriceIndex (CPI) increasing by just 0.1% in the December quarter 2010, after a 0.5% rise in theprevious quarter. This partly reflects the dampening effect of the high Australian dollar,together with moderate wages growth and relatively subdued consumer demand.
25

2011-12 Economic and Fiscal Outlook
In the remainder of 2010-11, however, food prices are likely to rise, with the supply offresh produce affected by flooding in the State's Gascoyne region and extreme weatherevents in Australia's eastern seaboard. This is expected to boost overall growth in Perth'sCPI to 2.75% in 2010-118.
Inflation is expected to accelerate in 2011-12 and over the forward estimates period, asthe State's economy strengthens and spare capacity diminishes. Perth's CPI is forecast torise by 3.0% in 2011-12 and 3.25% per annum in the outyears. This is similar to theaverage level of inflation recorded over the past decade.
These forecasts are also broadly consistent with national CPI projections from theReserve Bank of Australia and the Commonwealth Treasury.
Risks to the OutlookGlobal Risks
The economic forecasts outlined in this Chapter are based on assumptions about theglobal outlook sourced from the IMF, OECD, Consensus Forecasts and other globalanalysts.
Although international economic conditions have been gradually improving in recentmonths (see Global Outlook section), global risks to the State's economic outlook remain.
The broad consensus among economists and financial analysts is that the most acute risksto the global economy and financial markets are high oil prices (including the potentialfor a supply shock), sovereign debt in advanced economies, inflation in emergingeconomies, and potential spill-over effects arising from the natural disasters in Japan.
Oil Prices
Recent turmoil in the Middle East and North Africa has contributed to sharp rises in oilprices. With the earthquake in Japan also reducing its oil refining capacity by around20%, energy prices could be sustained at high levels in the near term.
Historically, oil price shocks have had significant impacts on financial markets and realeconomic activity. Although the effect of such shocks on developed economies isperhaps less significant than in the past (due to gradually declining oil dependency perunit of output), a further increase in oil prices in 2011-12 could have adverseconsequences for global growth and inflation.
8 The Reserve Bank of Australia estimates that the direct impact of these events will be to add 0.5 percentage points to growth in thenational CPI in 2010-11. These effects should begin to reverse in the second half of the year and should have largely dissipated bythe end of 2011.
26

The Western Australian Economy
Sovereign Debt
Despite some gradual progress in austerity measures, risks associated with the Europeanfinancial crisis remain a concern, as highlighted by Portugal's bailout negotiations, fearsthat Greece may need to restructure its debt, and the credit rating downgrade for Ireland'smajor banks to 'junk' status.
With Europe still comprising a significant share of the global economy and the globalfinancial system, any major problems in the euro area could quickly spread to otherregions, and potentially drive increased market volatility and heightened risk aversion.
In the United States (US), Standard & Poor's has recently revised its outlook on thelong-term rating of US sovereign bonds from stable to negative. This indicates that therating on these securities could be downgraded unless the US Government reduces itsbudget deficit within two years9. If investors start demanding higher returns for holdingriskier US debt, higher bond yields would translate to higher borrowing costs forconsumers and businesses, and potentially threaten the global economic recovery.
Inflation in Emerging Economies
Risks in the medium term include whether emerging economies, including China, canaddress inflationary concerns while also maintaining strong rates of economic growth.In China, inflation has exceeded its 4.0% target rate since October 2010, promptingsuccessive increases in capital reserve requirements for banks and repeated interest ratehikes. If high inflation persists, further action could be required, potentially reducing theoutlook for growth.
Japan's Natural Disasters
The devastating earthquake and tsunami in Japan pose some key risks for the globaleconomic outlook. Japan is the world's third largest economy, and the State's secondlargest export destination (accounting for around 15% of the State's total exports by valuein 2010). The full effects from the earthquake, tsunami and ensuing nuclear crisis are notknown with certainty, but are potentially significant.
According to the OECD, growth in Japan might be reduced by between0.2-0.6 percentage points in the March quarter 2011, and by between 0.5-1.4 percentagepoints in the June quarter 2011.
Reconstruction efforts could offset the negative effects on GDP from theSeptember quarter 2011 onwards10. However, it is relevant to note that Japan's fiscalposition was precarious prior to these disasters. Like many other countries, the extent towhich Japan's financial difficulties impinge upon future economic growth is also a keyrisk.
9 Source: Standard & Poor's, AAA/A-1+' Rating On United States of America Affirmed; Outlook Revised To Negative,18 April 2011.
I° Source: OECD, What is the economic outlook for OECD countries? Interim Assessment, April 2011.
27
2011-12 Economic and Fiscal Outlook
Domestic Risks
Key domestic risks to the economic outlook relate to Commonwealth Government policymeasures, sustained fiscal caution by households, the high Australian dollar, and thepossibility of rising labour shortages and associated wage inflation in the outyears.
Commonwealth Government Policies
In February 2011, the Prime Minister announced that a fixed carbon price (equivalent to acarbon tax) would be imposed from 1 July 2012, before the scheme transitions to a capand trade emissions trading system after three to five years.
Many key details, including the carbon price and compensation for energy-intensive,trade-exposed industries, had not been released at the time of this budget. Key risks forWestern Australia relate to the impact of a carbon tax on the State's LNG and magnetiteiron ore sectors, and the potential loss of major projects to overseas jurisdictions that donot impose a carbon tax.
Ongoing uncertainty in relation to the Commonwealth Government's Minerals ResourceRent Tax, which is also proposed to commence on 1 July 2012, could also potentiallyaffect future business investment, particularly in the State's emerging magnetite iron oresector.
Household Sector and the Housing Market
Persistent consumer conservatism presents another risk to the State's economic outlook,and the potential for higher interest rates, particularly if inflation gathers momentum atthe national level, risks denting consumer confidence.
On the other hand, the State's labour market could grow faster than currently anticipated,boosting household income and spending. This would also stimulate a faster thanexpected recovery in the housing market.
The Australian Dollar
The Australian dollar has appreciated by 11% against the US dollar and significantlyagainst many other currencies so far in 2010-11. This is due to a combination of factors,including strong demand for Australia's resources commodities, relatively high interestrate differentials between Australia and other countries, and weakness in the US dollar.
Persistent strength in the Australian dollar could exert continued competitive pressure ona number of the State's trade-exposed industries, including the tourism, manufacturingand agricultural sectors.
Even so, there are some potential economy-wide benefits associated with a strongAustralian dollar. To the extent that the currency reflects bullish demand for resources,this could underpin a further rise in investment and employment in Western Australia.A high Australian dollar will also boost the purchasing power of households andpotentially assist in curbing inflation.
28
The Western Australian Economy
Population and the Labour Market
After hitting a peak of 3.3% in 2008-09, population growth in Western Australia hasmoderated (to 2.4% in 2009-10), partly reflecting reduced growth in the CommonwealthGovernment's migration program.
Combined with the impact of population ageing, growth in the State's core working agepopulation (i.e. those aged between 15-64) is expected to moderate over the budgetperiod. If aggregate demand in the State's economy is higher than expected, competitionfor labour could intensify, potentially resulting in higher wages and inflation.
29

2011-12 Economic and Fiscal Outlook
30

CHAPTER 3
Financial Projections and FiscalStrategy
Overview
As outlined in Chapter 2, the Western Australian economy is expanding at a stable pace,which is expected to deliver solid growth in the State's taxation and royalty revenue overthe budget period. However, this growth in the State's own-source revenue will besignificantly offset by a substantial decline in Western Australia's share of GST revenueunder the current Commonwealth Grants Commission (CGC) arrangements.
At the same time, the State's growing economy is increasing demand for Stategovernment services (e.g. health and education) and infrastructure (e.g. public transport,electricity and water infrastructure). In this regard, general government expenses arebudgeted to increase by $1,811 million or 7.9% in 2011-12, and the State's AssetInvestment Program is expected to total $7.6 billion in 2011-12, an increase of$702 million on the current financial year.
31
2011 -12 Economic and Fiscal Outlook
Table 1
KEY BUDGET AGGREGATESWestern Australia
GENERAL GOVERNMENT SECTOR
2009-10
Actual
2010-11Estimated
Actual
2011-12Budget
Estimate
2012-13ForwardEstimate
2013-14ForwardEstimate
2014-15ForwardEstimate
Net Operating Balance ($m) 831 784 442 768 787 471
Revenue ($m) 22,039 23,764 25,233 26,232 27,209 28,202Revenue Growth (%) 13.4 7.8 6.2 4.0 3.7 3.7
Expenses ($m) 21,208 22,980 24,791 25,464 26,422 27,732Expense Growth (%) 10.9 8.4 7.9 2.7 3.8 5.0
TOTAL PUBLIC SECTORNet Debt at 30 June ($m) 9,896 13,387 17,291 19,959 21,451 22,441Asset Investment Program ($m) 6,828 6,936 7,638 7,303 6,129 5,401Cash Position ($m) -2,816 -3,763 -3,944 -2,534 -1,425 -852
KEY FINANCIAL RATIOS (a)
Net Interest Cost to Revenue (%) 1.6 2.1 2.4 2.8 2.9 3.0
Net Financial Liabilities (b) to Revenue (%) 54.6 60.6 67.3 70.8 71.1 69.6
(a) These ratios relate to the total non-financial public sector.(b) As defined by Standard & Poor's for the purposes of credit ratings assessments.
This budget seeks to contain growth in expenditure, with funding for a further400 voluntary separations in 2011-12 and a $3.5 billion package of new measures tocontain growth in net debt across the forward estimates period.
Overall, a general government sector operating surplus of $442 million is budgeted for2011-12, following an estimated operating surplus of $784 million in 2010-11. Operatingsurpluses are also projected across the forward estimates period.
These surpluses on day-to-day operating activities will not, on their own, be sufficient tofund the Government's $26.5 billion four year Asset Investment Program. As aconsequence, a cash shortfall is estimated for 2011-12 and across the forward estimates.New borrowings will be required to fund this cash position. The level of total publicsector net debt is therefore projected to be $17.3 billion at 30 June 2012 and rise to$22.4 billion by 30 June 2015.
Importantly however, this level of net debt remains affordable and consistent with theState's triple-A credit rating. The ratio of net financial liabilities to revenue (a keyindicator for credit rating purposes) is projected to peak at 71.1% in 2013-14, which iswell below the 90% 'trigger ratio' set by Standard & Poor's. Further, net interest costs asa share of revenue are projected to reach a maximum 3.0% in 2014-15, comfortablybelow the Government's 4.5% target limit
32

Financial Projections and Fiscal Strategy
Summary of Financial ProjectionsGeneral Government Sector
Summary
The financial projections presented in this budget include operating surpluses in all yearsof the forward estimates, including a surplus of $442 million in 2011-12.
Table 2
GENERAL GOVERNMENTSummary Financial Statements
2009-10 2010-11 2011-12 2012-13 2013-14 2014-15Estimated Budget Forward Forward Forward
Actual Actual Estimate Estimate Estimate Estimate$m $m $m $m $m $m
OPERATING STATEMENTRevenue 22,039 23,764 25,233 26,232 27,209 28,202Change 2,604 1,725 1,469 1,000 976 994Growth (%) 13.4 7.8 6.2 4.0 3.7 3.7
Expenses 21,208 22,980 24,791 25,464 26,422 27,732Change 2,092 1,772 1,811 673 958 1,310Growth (%) 10.9 8.4 7.9 2.7 3.8 5.0
Net Operating Balance 831 784 442 768 787 471
BALANCE SHEETAssets 124,797 129,116 135,507 140,827 145,963 150,918Liabilities 16,953 17,851 21,039 22,574 24,403 25,450Net Worth 107,844 111,265 114,468 118,253 121,560 125,468
STATEMENT OF CASHFLOWSNet Increase in Cash and Equivalents 1,012 -1,278 -122 -463 510 199Cash Position -867 -1,462 -2,283 -1,086 -641 -263
Memorandum Item: Net Debt -1,076 1,086 4,129 5,665 6,543 7,001
Note: Columns may not add due to rounding.
Revenue growth is projected to be relatively subdued compared to its long-run trend of8.5% per annum over the past decade, averaging 4.4% per annum across the four yearbudget period. This reflects the combined impact of:
higher forecast royalty revenue, including the impact of the Government's decision toalign the royalty rate for iron ore 'fines' with the 'lump' ore rate of 7.5% (phased inover two years commencing in 2012-13);
recovering forecasts of taxation revenue, underpinned by an expectation that propertymarket activity will gradually recover over coming years; and
a sharp decline in GST grant revenue (from $3.6 billion in 2011-12 to $2 billion in2014-15), due to weaker growth in consumer spending and an expected decline inWestern Australia's share of the national GST pool.
33

2011-12 Economic and Fiscal Outlook
To help offset the negative effect of Western Australia's declining share of GST revenue,and to ensure a sustainable level of borrowings to support infrastructure investment, thisbudget includes a $3.5 billion package of measures to contain growth in net debt.This includes:
a phased increase in the iron ore 'fines' royalty rate to the 'lump' ore rate over twoyears, with an increase to 6.5% from 1 July 2012 and to 7.5% from 1 July 2013. It isenvisaged that the additional revenue from this measure over the forward estimatesperiod, projected at $1.9 billion, will be quarantined for debt reduction purposes;
the deferral of spending totalling $541 million from the Government's AssetInvestment Program, relating to the West Pilbara desalination plant and adjustmentsto the cashflow for the Eastern Goldfields Regional Prison to be consistent with thelatest construction timing estimates;
implementation of a 5% efficiency dividend on the discretionary operatingexpenditure of Government Trading Enterprises from 2011-12 (with an expected netdebt reduction of $515 million by 30 June 2015); and
further savings of $300 million over the period 2012-13 to 2014-15 through a targetedreview of specific programs and activities that are no longer considered to providevalue for money.
As announced in March this year, this budget also includes funding of $40 million in2011-12 for a further 400 voluntary separations, which is expected to deliver ongoingsavings of around $15 million per year.
Operating Statement
2010-11 Estimated Actual
A general government operating surplus of $784 million is forecast for 2010-11. This islargely unchanged from the $758 million surplus projection in the December 2010mid-year review.
Relative to the mid-year review, general government revenue in 2010-11 has been revisedup by $391 million (or 1.7%). This mainly reflects:
a one-off payment of $350 million from BHP Billiton and Rio Tinto as part of anagreement to allow the companies greater flexibility to expand and integrate theiriron ore operations in the Pilbara;
an upward revision to iron ore royalty estimates (up $112 million), due to highershort-term prices, partially offset by a higher than expected exchange rate;
34
Financial Projections and Fiscal Strategy
higher Commonwealth grants (up $109 million), with higher tied grants1
(up $214 million) offsetting lower GST grants (down $105 million, mainly due to alower national pool of collections);
lower duty on transfers (down $95 million), mainly reflecting weaker conditions inWestern Australia's established housing market; and
lower fines revenue (down $43 million), largely due to a downward revision to speedand red light camera infringement revenue.
At the same time, general government expenses have been revised up by $366 million(or 1.6%). This includes policy decisions totalling $33 million (outlined inChapter 5: General Government Expenses), higher electricity price subsidies(up $131 million), a substantial boost to the education budget ($104 million) to fundgrowth in student numbers and other pressures that have emerged through the year, andspending of the additional Commonwealth health grants (up $61 million).
The following table provides a breakdown of the major policy decisions and parameterchanges that have affected the estimates since the mid-year review. Parameter changesinclude movements in financial aggregates arising from changes in key economicparameters, Commonwealth programs, cost and demand pressures, adjustments toexisting fees and charges, movements in interest and depreciation, etc.
For funding services such as non-government schools, local governments and health-related grants under the National PartnershAgreement on Improving Public Hospital Services.
p
35

2011-12 Economic and Fiscal Outlook
Table 3SUMMARY OF GENERAL GOVERNMENT REVENUE AND EXPENSE
VARIATIONS SINCE THE 2010-11 MID-YEAR REVIEW2010-11 2011-12 2012-13 2013-14 2014-15 Total
$m $m $m $m $m $m
2010-11 MID-YEAR REVIEW - NETOPERATING BALANCE 758 1,063 940 147
RevenuePolicy DecisionsIron ore royalties phased implementation of a 7.5% royalty
on iron ore 'fines' (a) 377.8 824.0 817.1 2,018.9Contribution from mining companies 350.0 350.0Government Trading Enterprises (GTEs) Efficiency
Dividend (dividends and tax equivalents) 30.5 78.5 82.6 84.9 6_ 276.5Other lb) 3.4 18.7 24.2 25.7 21.2 r 93.1Total Policy 353.4 49.2 480.4 932.3 923.2 2,738.6
ParameterTaxation -135.6 -220.3 -194.7 -87.0 -637.6
Payroll tax -31.5 42.2 59.5 91.6 161.9Land tax -13.1 -5.8 -60.7 -66.8 -146.5Total duty on transfers -95.1 -247.4 -179.3 -99.4 -621.2Other taxes 4.0 -9.3 -14.2 -12.4 -31.8
Commonwealth grants 108.7 603.5 387.1 49.9 1,149.3GST grants -104.8 236.3 141.9 -267.6 5.8Health grants 31.0 143.4 124.5 188.3 487.2Transport grants 26.7 163.2 66.7 97.7 354.3Other Commonwealth grants -26.3 46.9 136.0 102.9 259.4
Royalty income 113.4 387.5 136.5 502.0 1,139.4Iron ore 111.6 335.5 50.6 412.4 910.1Nickel 5.3 24.3 36.2 41.6 107.4Other royalties -3.5 27.7 49.7 48.0 121.9
Revenue from public corporations -2.0 47.3 -41.4 -127.3 -123.4Goods and services revenue -39.8 -51.1 -52.5 -47.9 -191.3Interest income 20.5 37.2 36.6 55.8 150.1
Other -27.2 -4.6 12.6 17.9 -1.3Total Parameter 38.0 799.5 284.1 363.5 1,485.1
TOTAL REVENUE 391.4 848.7 764.5 1,295.9 3,300.5
36

Financial Projections and Fiscal Strategy
Table 3 (cont.)
SUMMARY OF GENERAL GOVERNMENT REVENUE AND EXPENSEVARIATIONS SINCE THE 2010-11 MID-YEAR REVIEW
2010-11
$m
2011-12$m
2012-13$m
2013-14$m
2014-15 pol Total
$m r $m
Expenses
Policy Decisions (')Sustainable Funding and Contracting with the
Not-For-Profit Sector 87.8 91.6 145.6 165.9 0.9RfR- Southern Inland Health Initiative 42.4 55.3 69.8 72.6 0.0RfR- Mid West Revitalisation 40.8 40.8 70.8 70.8 223.0Additional Bus Service Kilometres 7.2 16.5 26.3 36.9 87.0RfR Regional Centres Development Plan (SuperTowns) 85.5 85.5RfR Regional Development Water and Natural
Resource Management Initiatives 22.8 17.7 16.5 21.2 8.2Junior Doctors Training 2.8 11.5 15.0 22.6 22.3 74.2Voluntary Separation Offers 25.4 -14.6 -14.6 -14.6 -18.4Deferral of Eastern Goldfields Regional Prison -23.3 -12.0 -35.3GTE Efficiency Dividend (appropriation support) -18.8 -19.1 -20.9 -21.3 -80.2Deferral of West Pilbara Desalination Plant -0.2 -4.4 -29.8 -47.0 -47.5 -128.7General Government Savings Target -50.0 -100.0 -150.0 -300.0Other 30.2 374.4 188.0 139.2 160.5 892.3
Total Policy Decisions 32.8 674.5 311.4 284.9 304.8 1,608.5
ParameterElectricity tariffs operating subsidy 131.0 366.5 374.2 212.0 1,083.7Education structural re-alignment 103.9 149.1 70.9 39.6 363.5Spending under the National Partnership Agreement
on Improving Public Hospital Services 60.7 52.7 73.1 90.7 277.2Health cost and activity increases 20.0 57.9 49.0 114.5 241.4Transfer of Assets Associated with the
RfR Ord-East Kimberley Expansion Project 71.1 77.1 148.2Other 17.6 98.2 -20.0 -85.8 9.9
Total Parameter 333.2 795.5 624.3 371.0 2,123.9
TOTAL EXPENSES 366.0 1,470.0 935.7 655.9 3,427.6
TOTAL VARIANCE 25.4 -621.3 -171.1 640.0 -127.1
2011-12 BUDGET - NET OPERATING BALANCE 784 442 768 787 471
(a) This is accompanied by an ongoing reduction in GST revenue commencing from 2014-15 ($96 million).
(b) Includes the introduction of a building services levy (which forms part of the reform to the building regulationsystem further details are available in Chapter 4), and additional revenue expected to be generated by the Department ofCulture and the Arts as part of the presentation of a series of exhibitions from New York's Museum of Modern Art.
(c) An agency listing of expense policy decisions taken since the 2010-11 Mid-year Review is provided in Appendix 4.
Note: Columns may not add due to rounding.
2011-12 and Beyond
A general government operating surplus of $442 million is forecast for 2011-12.Operating surpluses are also in prospect in each year of the forward estimates period.The expected surplus for 2014-15 ($471 million) is lower than forecasts for the twopreceding years, mainly reflecting the State's declining share of GST revenue, and anexpected moderation in commodity prices.
37

2011-12 Economic and Fiscal Outlook
Revenue
In 2011-12, total revenue is forecast to grow by 6.2% or $1.5 billion. The drivers ofgrowth are expected to be more evenly balanced than in 2010-11, with royaltiesincreasing (albeit at a more moderate pace) due to sustained strength in iron ore prices,and taxes rising steadily due to stronger domestic economic activity. GST revenue is alsoexpected to rise in 2011-12.
However, growth in total revenue is expected to moderate over the remainder of thebudget period, with steady growth in the State's own-source revenue being partly offsetby a projected decline in GST grants from the Commonwealth.
Under the principle of 'fiscal equalisation', which is applied by the CGC in allocatingnational GST revenue to the States and Territories, Western Australia's per capita share isset to decrease significantly after 2011-12. This will offset projected growth in thenational GST pool, resulting in a forecast decline in GST grants of 45% over the period2011-12 to 2014-15.
Overall, this means that total revenue is projected to grow at an average rate of3.8% per annum across the three outyears, compared with average growth of8.5% per annum over the last decade.
Expenses
General government expenses are forecast to be $24.8 billion in 2011-12, up$1,811 million or 7.9% compared to 2010-11. Growth is mainly underpinned by highersalary costs (up $729 million or 8.2%), largely reflecting the impact of a number ofsignificant Enterprise Bargaining Agreements (EB As), and current transfers 2
(up $461 million or 9.1%). Capital transfers are expected to be $123 million or 16.8%lower in 2011-12, as Commonwealth stimulus payments (particularly to non-governmentschools) wind down.
The following figure shows that growth in general government expenses is moderatingrelative to the peak (of 13.5%) in 2008-09. This reflects the impact of Governmentinitiatives to contain expense growth, including the 3% efficiency dividend, a concertedeffort to rein in employee costs through staff ceilings and wage policy settings and, as partof this budget, a provision for further savings through a targeted review of programs andactivities that no longer represent value for money. Expense growth is also moderatingdue to the phase-out of Commonwealth stimulus monies.
2 Mainly grants and subsidies.
38

Financial Projections and Fiscal Strategy
12
8
4
0
2000-01
GENERAL GOVERNMENT EXPENSE GROWTH
Per cent
Figure 1
Average growth = 8.1%
Forecast
Average growth = 5.5%
2002-03 2004-05 2006-07 2008-09 2010-11 2012-13 2014-15
This budget includes $1.6 billion of new policy expense decisions over the forwardestimates relative to the mid-year review, including $675 million in 2011-12. In additionto this, the budget also includes parameter driven increases to spending, including$796 million in 2011-12.
Key increases in general government expenses since release of the mid-year reviewinclude:
higher payments to Synergy and Horizon (up $1.1 billion over 2011-12 to 2014-15) toreflect lower electricity price increases than were assumed in the 2010-11 Budget andmid-year review. Specifically, the revised estimates assume a 5% increase inresidential tariffs in 2011-12 and 2012-13, and 12% in 2013-14 and 2014-15(compared to a previous 22% assumption for 2011-12, 5.6% in 2012-13 and 6.0% in2013-14);
additional spending on health, including:
$343 million to address the predicted population increase and corresponding takeup of health services across Western Australia and the increasing cost ofdelivering those services;
$240 million over four years to 2014-15 on the Royalties for Regions (RJR)Southern Inland Health Initiative to improve medical access and services in theGreat Southern, Mid West, South West and Wheatbelt regions;
39
2011-12 Economic and Fiscal Outlook
$217 million between 2011-12 and 2013-14 on targeted elective surgery,emergency department and sub-acute care initiatives, through a new NationalPartnership Agreement on Improving Public Hospital Services; and
$74 million over the five years to 2014-15 to employ all graduating domesticjunior doctors in Western Australia and provide additional supervision andexpand simulated learning and training environments;
$604 million over the five years to 2014-15 to support the development of asustainable not-for-profit sector, including $491 million to provide an average 25%increase in funding for existing human services contracts by 2014-15, and $96 millionin additional indexation funding;
an additional $258 million over 2011-12 to 2014-15 to meet costs associated with the2011 Teachers and Administrators EBA and ongoing implementation of theIndependent Public Schools initiative, and to place the Department of Education on afinancially sustainable setting as it moves towards a more efficient and effectiveservice delivery model for the public school education system;
$223 million over the four years to 2014-15 for the RJR Mid West Revitalisationproject to implement major infrastructure projects and initiatives in the Mid Westregion and enable a more sustainable social and economic base;
the transfer of assets to local governments and the private sector associated with theOrd-East Kimberley Expansion Project on completion of works (up $148 million);
increases in spending on community support, including $51 million to meet increasesin demand for child protection services, $41 million to cater for growth in demand fordisability services, and $45 million to provide recurrent support services for high needclients in social housing;
an additional $87 million in appropriation funding to the Public TransportAuthority (PTA) over four years from 2011-12 (as part a total $134 million increasein operating costs associated with providing additional bus services in the Perthmetropolitan area);
$86 million in 2011-12 on the RJR Regional Centres Development Plan (SuperTowns)initiative, to promote growth and development of regional towns and communities,and deliver four initial Pilot Towns;
$78 million over 2011-12 to 2014-15, funded from RJR, on a series of strategicinitiatives to deliver greater access to information about water availability and supplyoptions in regional Western Australia;
$40 million to increase the Seniors Cost of Living Rebate to $150 for singles and$225 for couples in 2011-12. In addition, the working hours criterion for eligibility forthe Seniors Card has been eased to an average of 25 hours per week (compared to thecurrent limit of 20 hours per week); and
40

Financial Projections and Fiscal Strategy
$37 million for the establishment and ongoing management of the Eighty Mile Beachand Camden Sound Marine Parks and related initiatives under the Kimberley Scienceand Conservation Strategy.
Further detail on these items is available in Chapter 5: General Government Expenses.
The General Government Sector Operating Surplus, the Total PublicSector Cash Position and Movements in Net Debt
The general government sector net operating balance is a key focus for the StateGovernment's financial management framework.
An operating surplus for this sector is important on several counts:
the general government sector is most directly influenced by Government policysettings in terms of its day-to-day operations;
a surplus is a clear indicator that the current generation of taxpayers are adequatelyfunding the services they consume rather than increasing debt for futuregenerations to pay off;
it covers all day-to-day running costs (both cash and non-cash); and
the operating surplus provides an important non-debt funding source forinfrastructure investment.
A drawback with the operating surplus is that it only captures a part of the State'sfinances. For example, it does not capture spending that, for accounting purposes, istreated as capital (i.e. the cash required to fund asset investment each year).
In this regard, a surplus or deficit in the total public sector cash position captures allGovernment spending for the year and, therefore, directly relates to movements in netdebt. In particular, while operating receipts such as State taxes, royalties andCommonwealth grants may be larger than operating payments such as salaries,subsidies and rent (generating an operating surplus), this surplus will generally beinsufficient to meet the State's infrastructure spending requirements in the year.The resulting cash shortfall needs to be funded through borrowings.
Borrowing for infrastructure is considered appropriate when the assets purchased are:
available for use by future generations, not just the current generation of taxpayers(i.e. the debt servicing costs are spread out over the life of the asset and all userscontribute to the cost of the asset spreading the burden equitably over time); and
there is a return on the investment that provides a measurable benefit into thefuture some benefits may be easy to measure such as the economic return on theelectricity network, while others may be harder to measure (such as the socialbenefits of providing schools to educate our community, which benefits thecommunity and the economy in the future).
41

2011-12 Economic and Fiscal Outlook
The following table broadly reconciles the relationship between the generalgovernment net operating balance, the total public sector cash position and the need toborrow (i.e. movements in total pubic sector net debt).
Table 4
RECONCILING KEY FINANCIAL AGGREGATES
2010-11 2011-12 2012-13 2013-14 2014-15$m $m $m $m $m
General government sector net operating balance 784 442 768 787 471
plus depreciation (a) 906 936 1,041 1,180 1,175
plus other accruals (b) -235 303 189 151 302
less general government net infrastructure spending (c) 2,917 3,964 3,084 2,759 2,211
equals general government sector cash position -1,462 -2,283 -1,086 -641 -263
Public Corporations
less public corporations net infrastructure spending (c) 3,208 2,644 2,870 2,003 2,040
plus public corporations cash from operations 1,701 1,720 2,263 2,313 2,687
less dividends paid to general government 794 736 842 1,095 1,237
equals total public sector cash position -3,763 -3,944 -2,534 -1,425 -852
Other movements in net debt (d) -271 -40 134 66 138
Annual movement in net debt (new borrowings,
repayments, use of cash, etc.) 3,492 3,903 2,668 1,492 991
Total public sector net debt at 30 June 13,387 17,291 19,959 21,451 22,441
(a) Non-cash costs.
(b) Items such as accounts receivable and accounts payable, etc.
(c) Infrastructure spending less the sale of second-hand assets.
(d) Changes in the value of debt liabilities with no cashflows such as the value of Insurance Commission ofWestern Australia investments, new finance leases, etc.
Capital Investment
The general government sector is expected to spend $4.2 billion on infrastructure in2011-12, and a further $8.8 billion over the three outyears. Spending on healthinfrastructure is the most significant component of this program (accounting for$1.6 billion or 37% of general government investment in 2011-12), and includesinvestment in the Fiona Stanley Hospital and the New Children's Hospital. Educationand road infrastructure are also significant areas of investment, accounting for a further$1.5 billion or 35% of the sector's spend in 2011-12.
This budget includes $1.5 billion of new infrastructure policy decisions since the time ofthe mid-year review, including $202 million in 2011-12. The budget also includesadditional parameter driven increases in infrastructure investment, including $355 millionin 2011-12.
42

Financial Projections and Fiscal Strategy
Key increases in general government infrastructure spending since release of the mid-yearreview include:
$369 million over the five years to 2014-15 for the Perth Waterfront Project (net ofland sales revenue, the public sector will invest a total of $270 million in this projectover the period to 2021-22);
higher roads spending, including:
$124 million between 2011-12 and 2013-14 on Perth Urban and Freight CorridorUpgrade initiatives to complement Commonwealth funding for the NationBuilding Program;
an additional $100 million on widening Great Eastern Highway betweenKooyong Road and Tonkin Highway, scheduled to be completed by 2014-15; and
$30 million to widen the northbound carriageway of the Mitchell Freewaybetween Hepburn Avenue and Hodges Drive from two to three lanes scheduled tobe completed by 2012-13;
significant increases to health infrastructure, including:
$298 million for the Southern Inland Health Initiative (funded from RJR) toimprove medical access and services in the Great Southern, Mid West, SouthWest and Wheatbelt regions;
$71 million to upgrade small hospitals and nursing posts; and
$40 million for medical equipment replacement in 2012-13;
$169 million for new schools, additional school infrastructure, preventativemaintenance and air-conditioning;
$91 million for information and communications technology (ICT) for theWestern Australia Police, including the replacement of core police ICT businesssystems, and a program of ICT infrastructure replacement to mitigate operationalrisks and support the delivery of services by frontline police and operational staff; and
new facilities supporting the development of skills and training in regional areas($78 million, which is to be funded by RJR).
Further details on major changes to infrastructure spending are disclosed in full inChapter 6: Asset Investment.
43

2011-12 Economic and Fiscal Outlook
In line with previous rounds of forward estimates, the general government infrastructureprojections also include a central provision for unforeseen slippage in the sector's verylarge spending program. This provision is $125 million in 2010-11 (down from anestimated $375 million at the time of the mid-year review) and a further $375 million in2011-12. The reduction in the 2010-11 provision reflects the magnitude of deferrals nowdirectly recognised by agencies within their individual infrastructure programs, the timingof which has become clearer since mid-year review. The new provision in 2011-12represents 8% of the total program, which is in line with underspending between agencybudgets and actuals in the sector over recent years.
Balance Sheet
General government sector net worth is forecast to rise from $107.8 billion at30 June 2010 to $125.5 billion by 30 June 2015.
Table 5GENERAL GOVERNMENTBalance Sheet at 30 June
2011-12 BUDGET
2010$m
2011 2012$m $m
2013$m
2014$m
2015$m
Assets 124,797 129,116 135,507 140,827 145,963 150,918Liabilities 16,953 17,851 21,039 22,574 24,403 25,450Net Worth 107,844 111,265 114,468 118,253 121,560 125,468Net Debt -1,076 1,086 4,129 5,665 6,543 7,001
2010-11 MID-YEAR REVIEWAssets 124,797 130,834 137,013 142,239 146,520 naLiabilities 16,953 18,339 19,797 20,750 22,135 naNet Worth 107,844 112,495 117,216 121,489 124,385 naNet Debt -1,076 1,436 3,153 4,061 5,125 na
VARIANCEAssets 1,718' -1,506 -1,412 -556 naLiabilities -488 1,242 1,825 2,269 naNet Worth -1,230 -2,748 -3,236 -2,825 naNet Debt -350 975 1,604 1,418 na
Note: Columns may not add due to rounding.
General government assets are forecast to increase by $22 billion over the forwardestimates period, largely due to:
an increase in the equity asset holding in public corporations (up $5.6 billion),reflecting injections of infrastructure capital by the general government sector, andthe effect of operating surpluses; and
increasing holdings of fixed assets reflecting the Asset Investment Program($15.6 billion).
44

Financial Projections and Fiscal Strategy
General government liabilities are projected to increase by around $7.6 billion by30 June 2015. This is mainly due to increases in borrowings in support of the sector'sinfrastructure program (net debt is discussed later in this chapter).
Unfunded superannuation liabilities are expected to be around $7.8 billion at30 June 2015. Importantly, the State's large unfunded schemes are closed (with the lastsignificant scheme, Gold State Super, closing to new members in 1996), withsuperannuation entitlements of the State's open schemes fully funded. This means thatthis liability will gradually decline as entitlements are paid out over the next two to threedecades.
Cashflow Statement
The cash shortfall is expected to peak in 2011-12, and then decline in the outyears.
Importantly, in cash terms, net cashflows from operating activities are expected to be insurplus in all years. Proceeds from the general government operating surplus are investedin the provision of infrastructure.
Infrastructure spending more than offsets the cash operating surplus in each of theoutyears. While this gives rise to a borrowing requirement (and hence, growth in netdebt), the higher borrowings remain affordable (net debt is discussed later in this chapter).
Total Public Sector3
Summary
Operating surpluses are forecast for the total public sector in each year of the forwardestimates, while net debt levels are projected to rise from $13.4 billion at 30 June 2011 to$22.4 billion at 30 June 2015, in line with the substantial investment in public sectorinfrastructure.
The following table summarises the key financial aggregates for the total public sector.
The total public sector consolidates the general government sector (discussed above), the public non-financial corporations sector(which includes entities operating on a predominantly cost recovery basis like the State's ports, and the electricity and waterutilities), and the public financial corporations sector (which includes agencies mainly engaged in financial activities such as theWestern Australian Treasury Corporation and the Insurance Commission of Western Australia).
45
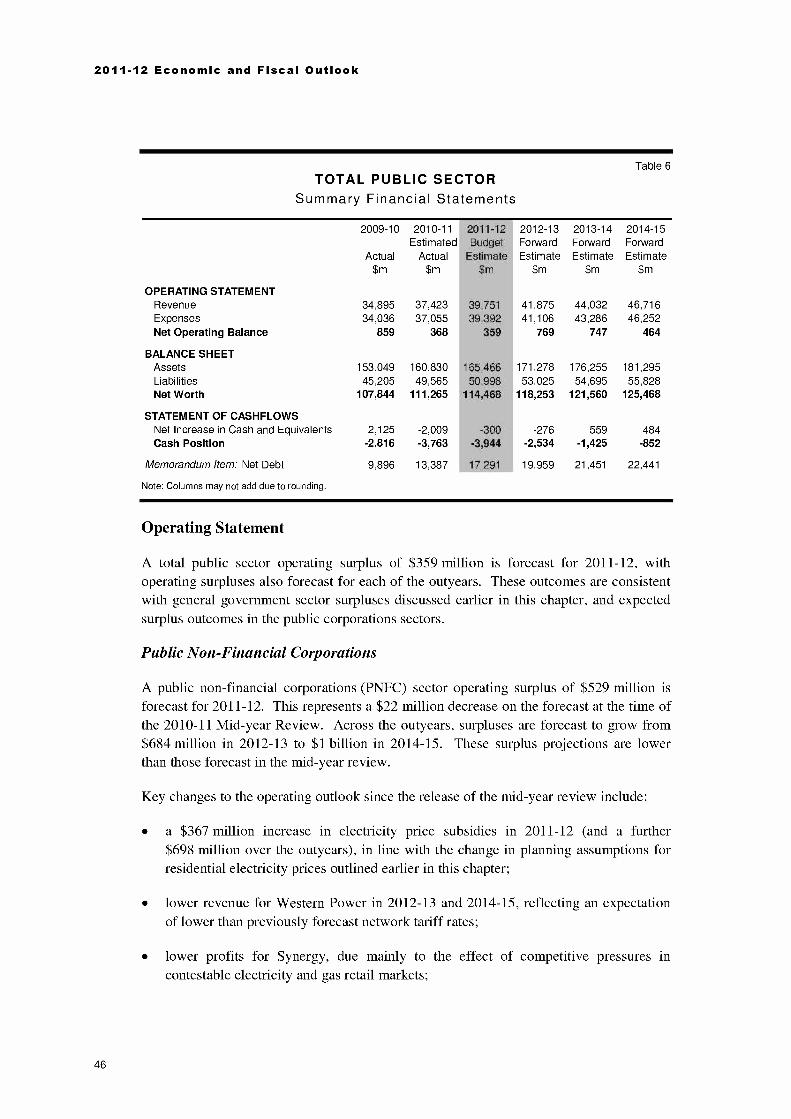
2011 -12 Economic and Fiscal Outlook
Table 6TOTAL PUBLIC SECTOR
Summary Financial Statements
OPERATING STATEMENT
2009-10 2010-11 2011-12 2012-13Estimated II Budget Forward
Actual Actual Estimate Estimate$m $m $m $m
2013-14ForwardEstimate
$m
2014-15ForwardEstimate
$m
Revenue 34,895 37,423 39,751 41,875 44,032 46,716Expenses 34,036 37,055 39,392 41,106 43,286 46,252Net Operating Balance 859 368 359 769 747 464
BALANCE SHEETAssets 153,049 160,830 165,466 171,278 176,255 181,295Liabilities 45,205 49,565 50,998 53,025 54,695 55,828Net Worth 107,844 111,265 114,468 118,253 121,560 125,468
STATEMENT OF CASHFLOWSNet Increase in Cash and Equivalents 2,125 -2,009 -300 I -276 559 484Cash Position -2,816 -3,763 -3,944 -2,534 -1,425 -852
Memorandum Item: Net Debt 9,896 13,387 17,291 19,959 21,451 22,441
Note: Columns may not add due to rounding.
Operating Statement
A total public sector operating surplus of $359 million is forecast for 2011-12, withoperating surpluses also forecast for each of the outyears. These outcomes are consistentwith general government sector surpluses discussed earlier in this chapter, and expectedsurplus outcomes in the public corporations sectors.
Public Non-Financial Corporations
A public non-financial corporations (PNFC) sector operating surplus of $529 million isforecast for 2011-12. This represents a $22 million decrease on the forecast at the time ofthe 2010-11 Mid-year Review. Across the outyears, surpluses are forecast to grow from$684 million in 2012-13 to $1 billion in 2014-15. These surplus projections are lowerthan those forecast in the mid-year review.
Key changes to the operating outlook since the release of the mid-year review include:
a $367 million increase in electricity price subsidies in 2011-12 (and a further$698 million over the outyears), in line with the change in planning assumptions forresidential electricity prices outlined earlier in this chapter;
lower revenue for Western Power in 2012-13 and 2014-15, reflecting an expectationof lower than previously forecast network tariff rates;
lower profits for Synergy, due mainly to the effect of competitive pressures incontestable electricity and gas retail markets;
46

Financial Projections and Fiscal Strategy
the effect of higher gold prices (which have traded at up to around $US1,500 per troyounce and are forecast to continue to remain at high levels in the outyears) for GoldCorporation products, which increases both revenue and expenses;
lower revenue for the Water Corporation (partially offset by lower expenses),reflecting a downward revision to growth forecasts across the forward estimatesperiod; and
lower revenue (and subsequently expenses) for the Lotteries Commission, reflectinga decline in overall sales revenue forecasts across the forward estimates.
The PNFC sector includes most of the State's Government Trading Enterprises (GTEs)4.As part of measures to contain growth in net debt, the Government has decided toimplement a 5% efficiency dividend on the discretionary operating expenditure of GTEsfrom 2011-12.
The efficiency dividend (and the associated improvement in GTE profitability) is
expected to generate an additional $277 million in dividends and tax equivalent revenueto the general government sector and reduce total public sector net debt by a total of$515 million by 30 June 2015. These savings have been included as a central provision inthis budget. Agency-level budget adjustments will be reflected in the 2011-12 Mid-yearReview (to be published in December 2011). Further details are in Appendix 8: PublicCorporations Impact on General Government Revenue and Expenses.
The following chart shows that expenses (and salaries) for the PNFC sector have grownsignificantly in recent times. For example, salaries growth has accelerated from anaverage of 4.8% per annum over the period 2000-01 to 2004-05, to 12.6% over 2005-06to 2009-10. The efficiency dividend will ensure that GTEs are operating as efficiently aspossible.
4 GTEs include corporatised agencies that are subject to dividend and tax equivalent arrangements with the general governmentsector. Not all public corporations are GTEs.
47

2011-12 Economic and Fiscal Outlook
EXPENSE AND SALARIES GROWTHPublic Non-Financial Corporations Sector (a)
$ Million $ Million
12,000
8,000
4,000
2000-01 to 2004-05:Salaries (4.8% p.a.)Total expenses (2.4% p.a.)
=Total Expenses (LHS)
Salaries (RHS)
0 Ai2000-01 2002-03
2005-06 to 2009-10:Salaries (12.6% p.a.)Total expenses (9.6% p.a.)
Figure 2
1,200
800
400
2004-05 2006-07 2008-09
(a) For comparative purposes, AlintaGas (which ceased operations in 2000-01) and Gold Corporation (which acquired a goldrefinery in 2009-10) have been removed from the data underlying this chart.
Note: Columns may not add due to rounding.
Public Financial Corporations
The public financial corporation sector is forecast to record an operating surplus of$127 million in 2011-12. Surplus outcomes of increasing magnitude are also expectedacross the outyears, rising to $184 million in 2014-15.
These outcomes are largely unchanged from the mid-year review, and mainly reflect theprofitability of the Insurance Commission of Western Australia (which has substantialinvestment assets in support of the claims liabilities it manages).
Capital Investment
The Asset Investment Program for the total public sector is forecast to total $7.6 billion in2011-12, up from $6.9 billion in the current financial year.
48
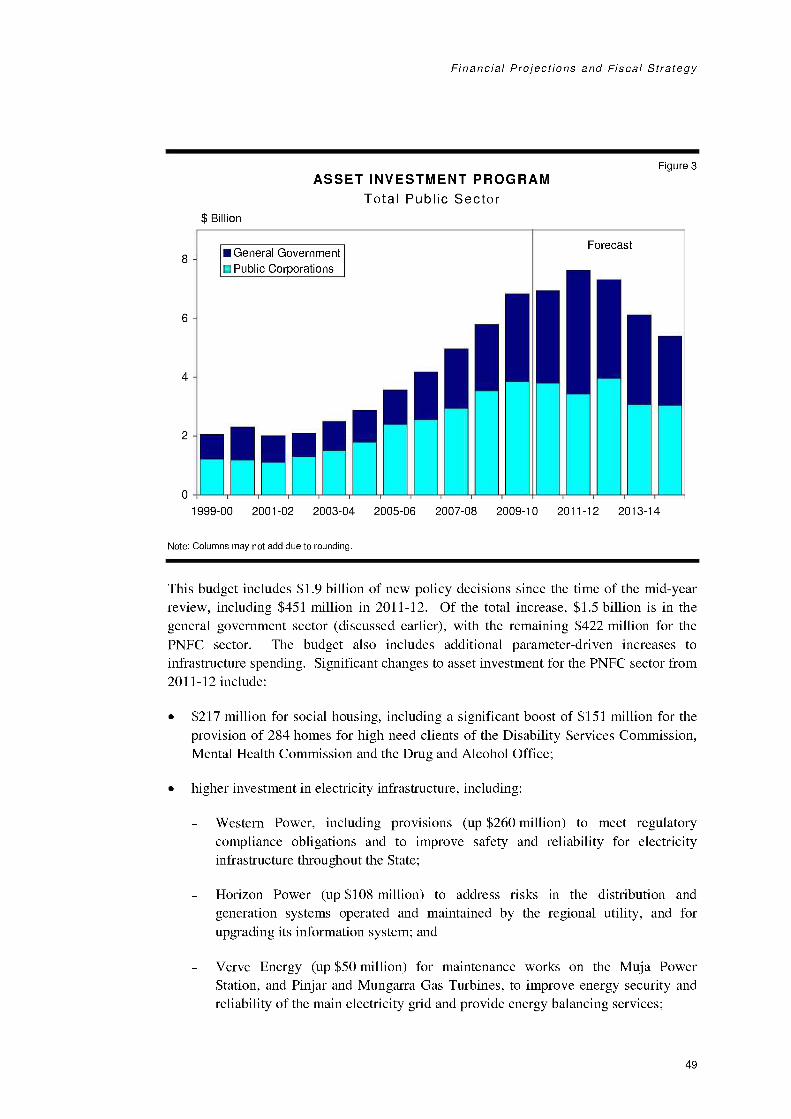
Financial Projections and Fiscal Strategy
ASSET INVESTMENT PROGRAMTotal Public Sector
$ Billion
Figure 3
8-
6-
4-
General GovernmentPublic Corporations
0
I
Forecast
1999-00 2001-02 2003-04 2005-06 2007-08 2009-10 2011-12 2013-14
Note: Columns may not add due to rounding.
This budget includes $1.9 billion of new policy decisions since the time of the mid-yearreview, including $451 million in 2011-12. Of the total increase, $1.5 billion is in thegeneral government sector (discussed earlier), with the remaining $422 million for thePNFC sector. The budget also includes additional parameter-driven increases toinfrastructure spending. Significant changes to asset investment for the PNFC sector from2011-12 include:
$217 million for social housing, including a significant boost of $151 million for theprovision of 284 homes for high need clients of the Disability Services Commission,Mental Health Commission and the Drug and Alcohol Office;
higher investment in electricity infrastructure, including:
Western Power, including provisions (up $260 million) to meet regulatorycompliance obligations and to improve safety and reliability for electricityinfrastructure throughout the State;
Horizon Power (up $108 million) to address risks in the distribution andgeneration systems operated and maintained by the regional utility, and forupgrading its information system; and
Verve Energy (up $50 million) for maintenance works on the Muja PowerStation, and Pinjar and Mungarra Gas Turbines, to improve energy security andreliability of the main electricity grid and provide energy balancing services;
49

2011-12 Economic and Fiscal Outlook
land investment by the Western Australian Land Authority (up $140 million),reflecting increased activity in response to new priority projects in the metropolitanregion (such as the Claremont North East Precinct) and accelerated land deliveryprograms in areas such as Alkimos, Broome, Karratha and Kununurra;
higher PTA spending, including:
$164 million over five years to procure an additional 15 three-car train sets (with$137 million to be spent over the forward estimates period to 2014-15); and
$40 million on the purchase of additional buses to provide new services andimprovements to existing services, offset by a $50 million saving from thepurchase of diesel fuelled buses in preference to buses using natural gas fuel; and
lower spending by the Water Corporation, mainly reflecting:
deferral of the West Pilbara Desalination Plant ($370 million, including$5 million in 2010-11), due to recent heavy rain in the State's north;
an additional $141 million for construction of water and wastewater distributioninfrastructure in support of future urban residential land development; and
an extra $65 million to upgrade and refurbish the pipeline between WellingtonDam and Shotts Industrial Park.
Further detail of the Asset Investment Program is available in Chapter 6: AssetInvestment.
Like the general government sector discussed earlier, the PNFC sector also includes aprovision for as yet unidentified slippage across the four year infrastructure program.These provisions are worth $125 million in 2010-11 and $375 million in 2011-12.The total provision for capital underspending represents 3% of the total program over2010-11 and the forward estimates, which is conservative by historical standards.
Balance Sheet
Total public sector net worth is equal to that of the general government sector. Thisreflects the consolidation of the net worth of public corporations as an equity asset in thebalance sheet of the general government sector, which was discussed earlier in thischapter.
Further detail of total public sector net debt and net financial liabilities are discussedbelow.
Cashflow Statement
A cash shortfall of $3.9 billion is forecast for the total public sector in 2011-12. Thisreflects the large Asset Investment Program for the year ($7.6 billion), which more thanoutweighs a cash surplus from operating activities of $2.7 billion.
50

Financial Projections and Fiscal Strategy
Reflecting the combination of continuing cash surpluses from operating activities as wellas a declining annual infrastructure program, the magnitude of the cash shortfall isexpected to decline across the outyears, with a forecast $852 million cash shortfall in2014-15.
Net Debts and Net Financial Liabilities6
Total public sector net debt is forecast to rise from an estimated $13.4 billion at30 June 2011 to $22.4 billion by 30 June 2015. Rising net debt reflects significantinfrastructure spending which is only partially funded by operating surpluses (with thebalance largely funded by new borrowings).
$ Billion25
20
15-
10-
5
NET DEBT AT 30 JUNETotal Public Sector
Per cent (a)
Figure 4
=Net Debt (LHS)
- Net Financial Liabilities as aShare of Revenue (RHS)
Forecast
2001 2003 2005 2007 2009 2011 2013 2015
(a) For the total non-financial public sector (total public sector excluding public financial corporations).
100
80
60
40
20
0
As noted earlier, this budget includes a $3.5 billion package of measures to ensure that netdebt levels remain sustainable and affordable. These measures result in the net financialliabilities to revenue ratio peaking at 71.1% in 2013-14 before declining to 69.6% in2014-15, which is well below the 90% 'trigger' threshold set by Standard & Poor's forcredit rating purposes.
5
6
Net debt is a balance sheet indicator based on Government Finance Statistics concepts. It is calculated as the difference betweenliquid financial assets (including cash and cash equivalents, loans made by government instrumentalities, and other liquidinvestments) and financial liabilities that attract a debt servicing cost (which also includes finance leases).
Net financial liabilities are a wider measure of balance sheet liabilities than net debt. References to net financial liabilities in thissection are consistent with the definition applied by Standard & Poor's for the purposes of credit ratings assessments.This measure takes account of net debt and unfunded superannuation liabilities. This differs from the net financial liabilitiesdisclosed in Appendix 1 of these budget papers, as its calculation excludes some assets and liabilities that are included in theUniform Presentation Framework (UPF) measure (e.g. government loan assets and accounts payable are not included in theStandard & Poor's measure).
51
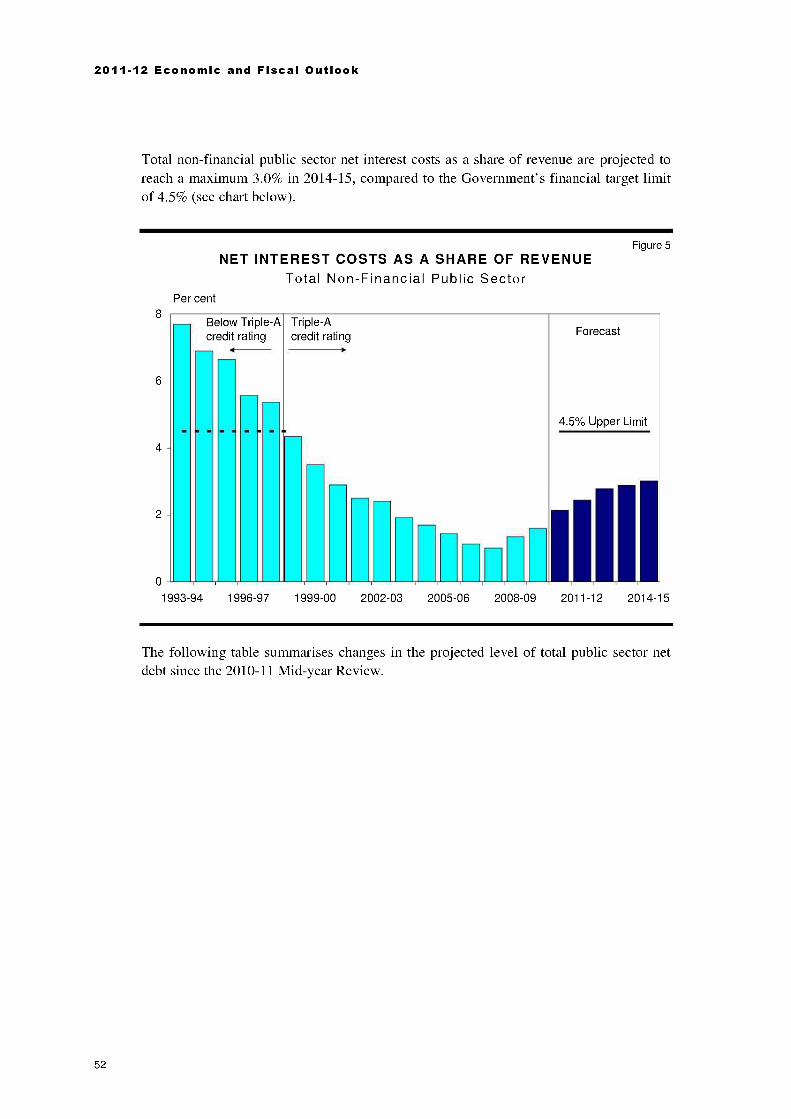
2011-12 Economic and Fiscal Outlook
Total non-financial public sector net interest costs as a share of revenue are projected toreach a maximum 3.0% in 2014-15, compared to the Government's financial target limitof 4.5% (see chart below).
Per cent8
6
4
2
0
1993-94
Figure 5
NET INTEREST COSTS AS A SHARE OF REVENUETotal Non-Financial Public Sector
Below Triple-Acredit rating
Triple-Acredit rating Forecast
4.5% Upper Limit
1996-97 1999-00 2002-03 2005-06 2008-09 2011-12 2014-15
The following table summarises changes in the projected level of total public sector netdebt since the 2010-11 Mid-year Review.
52

Financial Projections and Fiscal Strategy
Table 7
NET DEBT OF THE TOTAL PUBLIC SECTOR AT 30 JUNE
2010-11 MID-YEAR REVIEW - TOTAL PUBLIC SECTOR
2011
$m
2012
$m
2013
$m
2014
$m
2015
$m
NET DEBT 14,009 16,774 18,305 19,886
Less change in net cashflows from operating activitiesand dividends paid
general government -200.1 -607.7 -108.9 453.9public non-financial corporations 159.9 25.9 -168.4 -133.3public financial corporations -1.4 -4.8 -1.8 -4.0
Total public sector -41.6 -586.5 -279.1 316.7
Plus purchases of non-financial assetsPolicy decisions (a)
Perth Waterfront Project 0.4 48.0 162.2 135.9 22.3Health 7.7 47.0 142.4 102.0Social Housing 25.0 164.5 37.8 14.4Water Corporation 1.0 97.6 116.3 9.6Roads 24.9 103.4 78.2 5.0Additional train sets and buses 25.0 51.6 59.4 41.1Education 31.0 47.0 36.0 55.0Electricity Utilities 19.7 73.5 36.6 2.4 17.4Deferral of Eastern Goldfields Regional Prison -53.7 -76.7 -28.8 62.7 89.5Deferral of West Pilbara Desalination Plant -5.0 -135.0 -200.0 -30.0Other 20.2 190.9 77.9 75.7 88.3
Total policy decisions 7.6 451.4 451.1 586.6 420.7
Parameter movementsReduction in Underspend Provision (2010-11 Program) 500.0Provision for Underspend (2011-12 Program) -750.0Education -441.5 430.5 16.3 8.0Health -101.0 119.1 89.4 -22.9Main Roads -100.2 47.5 78.2 -29.7Electricity Utilities -234.3 -25.9 276.2 55.9Western Australian Sports Centre Trust -56.5 56.7Fremantle Port Authority -53.4 53.4Public Tranport Authority -50.5 29.8 20.7Agriculture and Food -6.3 -22.8 -79.1 -51.4Other -147.4 165.1 149.1 -144.8
Total parameter movements -691.0 103.4 550.8 -184.8
Total purchase of non-financial assets -683.4 554.8 1,001.9 401.9
Less proceeds from sale of non-financial assets -102.5 8.1 105.1 155.5
Plus all other financing -82.4 4.9 -38.3 -19.5
Cumulative impact on net debt at 30 June -621.7 516.4 1,654.0 1,564.1
2011-12 BUDGET - TOTAL PUBLIC SECTOR NET DEBT 13,387 17,291 19,959 21,451 22,441
(a) An agency listing of the infrastructure policy decisions taken since the 2010-11 Mid-year Review is provided in Appendix 4.
(b) Includes revaluations of investment assets, net acquisition of financial assets for liquidity purposes, etc.
Note: Columns may not add due to rounding.
53

2011-12 Economic and Fiscal Outlook
Fiscal StrategyThe Government is committed to responsible and sustainable financial managementoutcomes, using the financial targets outlined below as the framework for delivering thiscommitment.
Financial Targets
The Government's financial targets are unchanged from last year. These targets are to:
maintain or increase the real net worth of the total public sector;
achieve an operating surplus for the general government sector;
maintain the ratio of total non-financial public sector net interest costs as a share ofrevenue at or below 4.5%;
ensure that real per capita own-purpose general government expenses do not increase;and
provide a fair and efficient taxation system that is competitive with other AustralianStates.
54

Financial Projections and Fiscal Strategy
Maintain or Increase Real Net Worth of the Total Public Sector
This target is forecast to be met in each of the forward estimate years.
Net worth represents the difference between total assets and total liabilities. This targetmeasures the strength of the State's financial position, with an increase in net worth inreal terms indicating a strengthening balance sheet after adjusting for inflation.
In nominal terms, net worth is projected to be around $111 billion at 30 June 2011, risingto around $125 billion by the end of the forward estimates period. This increase is drivenby operating surpluses across all sectors of government in each year of the forwardestimates period.
Figure 6REAL NET WORTH AT 30 JUNE
Total Public Sector$ Billion (2011-12 Dollars)
120
100
80
60
40
20
0
Forecast
2000 2002 2004 2006 2008 2010 2012 2014
55
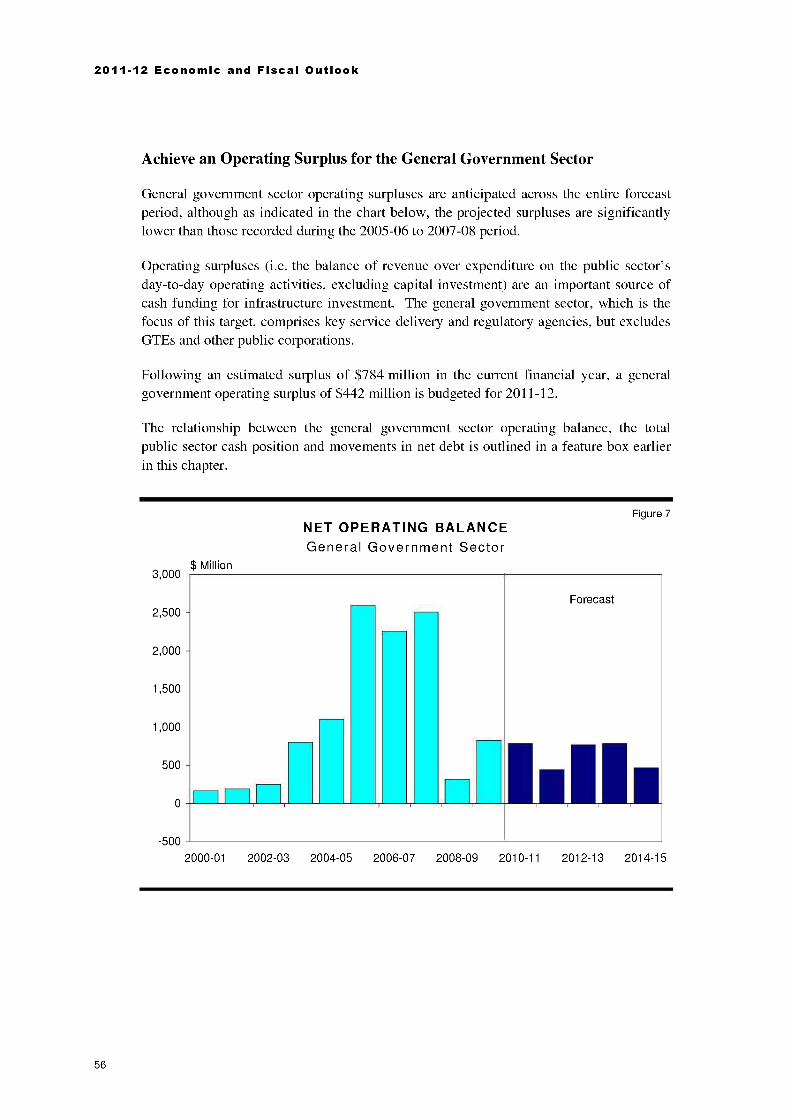
2011-12 Economic and Fiscal Outlook
Achieve an Operating Surplus for the General Government Sector
General government sector operating surpluses are anticipated across the entire forecastperiod, although as indicated in the chart below, the projected surpluses are significantlylower than those recorded during the 2005-06 to 2007-08 period.
Operating surpluses (i.e. the balance of revenue over expenditure on the public sector'sday-to-day operating activities, excluding capital investment) are an important source ofcash funding for infrastructure investment. The general government sector, which is thefocus of this target, comprises key service delivery and regulatory agencies, but excludesGTEs and other public corporations.
Following an estimated surplus of $784 million in the current financial year, a generalgovernment operating surplus of $442 million is budgeted for 2011-12.
The relationship between the general government sector operating balance, the totalpublic sector cash position and movements in net debt is outlined in a feature box earlierin this chapter.
3,000
2,500
2,000
1,500
1,000
500
NET OPERATING BALANCEGeneral Government Sector
$ Million
Figure 7
-500
2000-01
-F 7-
Forecasti2002-03 2004-05 2006-07 2008-09 2010-11 2012-13 2014-15
56
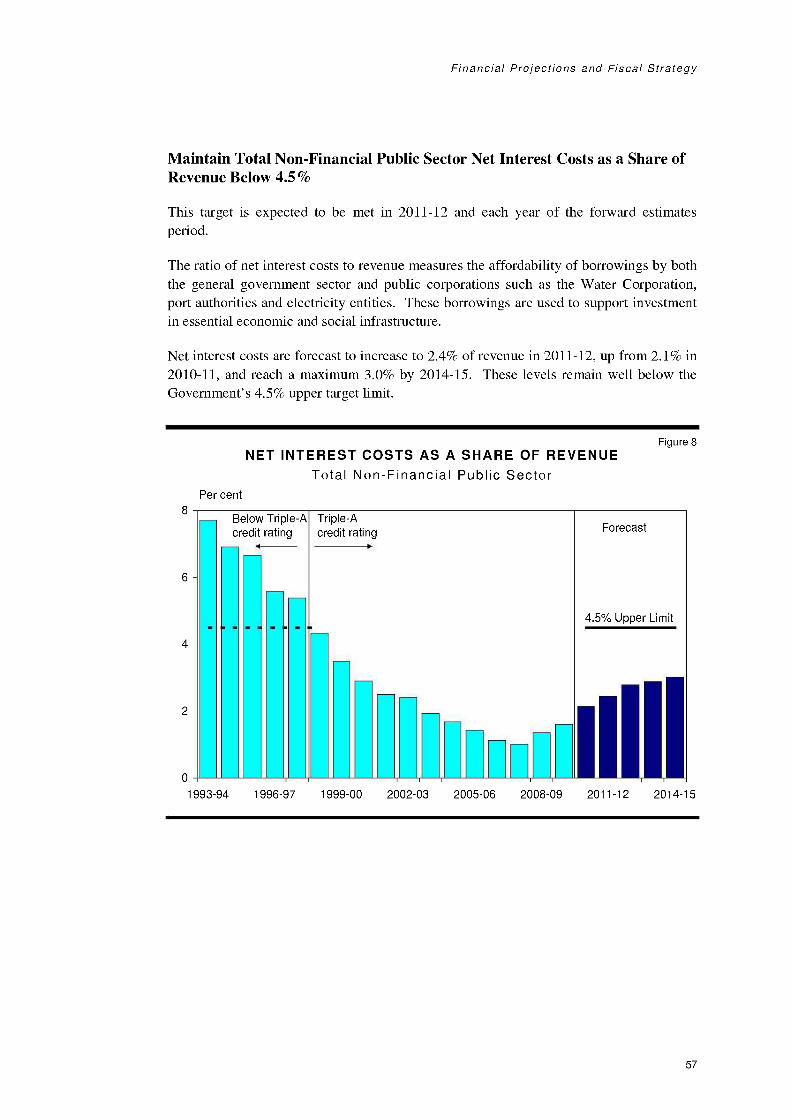
Financial Projections and Fiscal Strategy
Maintain Total Non-Financial Public Sector Net Interest Costs as a Share ofRevenue Below 4.5 %
This target is expected to be met in 2011-12 and each year of the forward estimatesperiod.
The ratio of net interest costs to revenue measures the affordability of borrowings by boththe general government sector and public corporations such as the Water Corporation,port authorities and electricity entities. These borrowings are used to support investmentin essential economic and social infrastructure.
Net interest costs are forecast to increase to 2.4% of revenue in 2011-12, up from 2.1% in2010-11, and reach a maximum 3.0% by 2014-15. These levels remain well below theGovernment's 4.5% upper target limit.
Per cent8
6
4
2
0
1993-94
Figure 8NET INTEREST COSTS AS A SHARE OF REVENUE
Total Non-Financial Public Sector
Below Triple-Acredit rating
Triple-Acredit rating Forecast
4.5% Upper Limit
1996-97 1999-00 2002-03 2005-06 2008-09 2011-12 2014-15
57

2011-12 Economic and Fiscal Outlook
Ensure that Real Per Capita Own-Purpose Expenses for the GeneralGovernment Sector do not Increase
This target measures growth in day-to-day spending controlled by the State Government.The target abstracts from Commonwealth grants passed through the State, and providesfor expenses to grow in line with increases in population and the Wage Price Index(wages and salaries are the most significant day-to-day running cost for the generalgovernment sector).
As forecast in the 2010-11 Mid-year Review, the target is not expected to be met in2010-11. The target is also not expected to be met in 2011-12, reflecting the impact ofnew spending supporting the delivery of services by the not-for-profit sector, highersubsidies for electricity consumers, targeted spending increases in key service deliveryagencies, and the transfer of assets to local government associated with completion of theOrd-East Kimberley Expansion Project (these asset transfers are expensed for accountingand government financial reporting purposes).
The target is forecast to be met in each of the outyears.
Figure 9REAL PER CAPITA OWN-PURPOSE EXPENSES
General Government Sector2011-12 Dollars
10,000
9,000
8,000
7,000
1999-00
7- 7- -7 -7
2002-03
Forecast
2005-06 2008-09 2011-12 2014-15
The projections include the Government's substantial savings measures implemented inthe previous two budgets (including recommendations from the Economic AuditCommittee, implementation of the 3% efficiency dividend, and two rounds of voluntaryseparations). A new round of measures included in this budget (including a provision fortargeted savings in agency programs and activities and a new round of voluntaryseparations) are reflected in the outyears.
58

Financial Projections and Fiscal Strategy
Provide a Fair and Efficient Tax System that is Competitive with other States
A key objective for the State Government is to provide a fair and efficient taxation systemthat is competitive with other jurisdictions and raises sufficient revenue to meet theState's service delivery and infrastructure needs.
Performance against this target is assessed by reference to a variety of indicators whichtogether indicate that the State has a competitive tax system. These include tax revenueas a share of Gross State Product (GSP), tax revenue on a per capita basis, and total tax`effort' as calculated by the CGC.
Tax as a proportion of the economy (i.e. GSP) is an internationally recognised measure oftax competitiveness, which, unlike tax per capita, accounts for the impact of differences inthe size and composition of each State's economy on tax revenue. Western Australia'stax to GSP ratio is expected to be 3.2% in 2010-11. This is the lowest of all States andcompares to an average of 4.3% in the rest of Australia.
In contrast, tax per capita in Western Australia is higher than other States. This mainlyreflects Western Australia's higher per capita economic base, as opposed to higheraverage tax rates. Under the CGC process, this relative economic advantage isredistributed to other States through a reduction in Western Australia's share of nationalGST revenue.
Tax effort refers to the level of tax actually raised by a State, divided by the State's`standardised' tax revenue (i.e. the level of tax revenue the CGC estimates the Statewould have raised had it applied national average State tax rates and concessions).According to the CGC, Western Australia's tax effort was 5.2% lower than the nationalaverage in 2009-10 (the latest available year). Tax effort was higher in New South Wales,Victoria and South Australia.
59
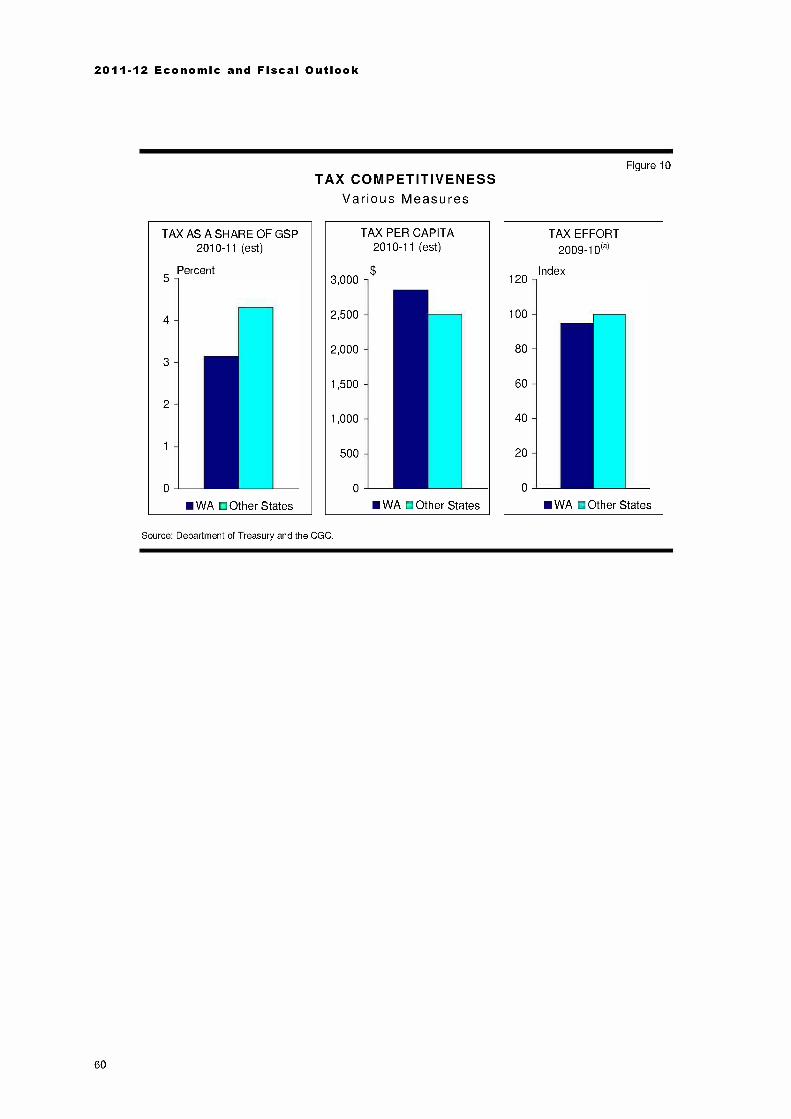
2011-12 Economic and Fiscal Outlook
TAX COMPETITIVENESSVarious Measures
Figure 10
Source: Department of Treasury and the CGC.
60
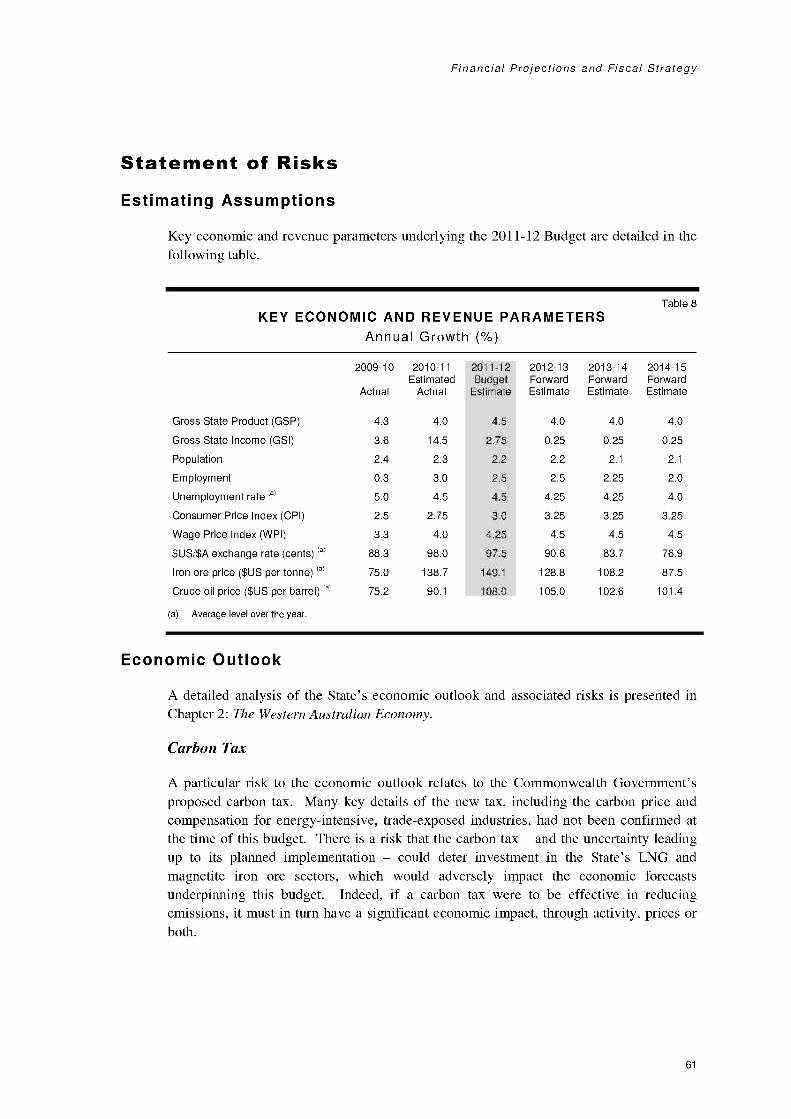
Financial Projections and Fiscal Strategy
Statement of RisksEstimating Assumptions
Key economic and revenue parameters underlying the 2011-12 Budget are detailed in thefollowing table.
Table 8KEY ECONOMIC AND REVENUE PARAMETERS
Annual Growth (%)
2009-10
Actual
2010-11Estimated
Actual
2011-12Budget
Estimate
2012-13ForwardEstimate
2013-14ForwardEstimate
2014-15ForwardEstimate
Gross State Product (GSP) 4.3 4.0 4.5 4.0 4.0 4.0
Gross State Income (GS!) 3.6 14.5 2.75 0.25 0.25 -0.25
Population 2.4 2.3 2.2 2.2 2.1 2.1
Employment 0.3 3.0 2.5 2.5 2.25 2.0
Unemployment rate (a) 5.0 4.5 4.5 4.25 4.25 4.0
Consumer Price Index (CPI) 2.5 2.75 3.0 3.25 3.25 3.25
Wage Price Index (WPI) 3.3 4.0 4.25 4.5 4.5 4.5
$US/$A exchange rate (cents) (a) 88.3 98.0 97.5 90.6 83.7 76.9
Iron ore price ($US per tonne) (a) 75.0 138.7 149.1 128.8 108.2 87.5
Crude oil price ($US per barrel) (a) 75.2 90.1 108.0 105.0 102.6 101.4
(a) Average level over the year.
Economic Outlook
A detailed analysis of the State's economic outlook and associated risks is presented inChapter 2: The Western Australian Economy.
Carbon Tax
A particular risk to the economic outlook relates to the Commonwealth Government'sproposed carbon tax. Many key details of the new tax, including the carbon price andcompensation for energy-intensive, trade-exposed industries, had not been confirmed atthe time of this budget. There is a risk that the carbon tax and the uncertainty leadingup to its planned implementation could deter investment in the State's LNG andmagnetite iron ore sectors, which would adversely impact the economic forecastsunderpinning this budget. Indeed, if a carbon tax were to be effective in reducingemissions, it must in turn have a significant economic impact, through activity, prices orboth.
61

2011-12 Economic and Fiscal Outlook
Minerals Resource Rent Tax
Ongoing uncertainty in relation to the Commonwealth Government's Minerals ResourceRent Tax (MRRT), which is proposed to commence on 1 July 2012, could also potentiallyaffect future business investment, particularly in the State's emerging magnetite iron oresector.
This uncertainty extends to the interaction of the MRRT with the State's royalties.Previous assurance has been given by the Commonwealth Government that the royaltyincrease contained in this budget would be accommodated by the MRRT. If thisassurance is not honoured, there will be significant consequences for investor certaintyand State revenue projections.
Revenue Estimates
The revenue estimates are sensitive to changes in key economic parameters, including the$US/$A exchange rate, commodity prices (especially iron ore), employment and wagesgrowth. Approximate annual impacts of changes in these variables are outlined in thefollowing table.
Table 9
APPROXIMATE PARAMETER SENSITIVITY OF REVENUE ESTIMATES2011 -12
Variability ($m)
Royalty income and ±60North West Shelf grants
Iron ore royalties ±28
Petroleum royalties ±4
Payroll tax ±29
Transfer duty ±18
Detail
For each US1 cent decrease/increase in the $US/$Aexchange rate
For each $US1 per tonne increase/decrease in the price ofiron ore
For each $US1 increase/decrease in the price of a barrel of oil
For each one per cent increase/decrease in taxable wages oremployment growth (i.e. the total wages bill)
For each one per cent increase/decrease in average propertyprices
In addition to the above sensitivities, specific risks to the revenue estimates are discussedbelow.
State Taxes ($6,965 million in 2011-12)
Tax Forum
On 20 March 2011, the Commonwealth Treasurer announced that the CommonwealthGovernment will hold a Tax Forum on 4-5 October 2011 to assist the Commonwealth todevelop its tax reform agenda. The Commonwealth Treasurer's press release indicatedthat the Forum would focus on a broad range of topics, including State taxes.
62
Financial Projections and Fiscal Strategy
The State tax revenue estimates in this budget are based on the assumption of no changein tax bases or rates as a result of any new reform. Any agreed changes to State taxesfollowing the Forum could have positive or negative revenue effects, and would beincorporated in the revenue estimates as appropriate at that time.
Transfer Duty
Forecasting transfer duty is a challenging task, reflecting the cyclical nature of activity inthe State's housing market and the amplitude of those cycles.
The transfer duty forecasts in this budget are based on an assumption that residentialproperty prices will increase slightly in 2011-12, and that the number of taxable propertytransactions gradually recovers to its long-run trend level by 2014-15. A key risk to theoutlook is that if sentiment in the housing market remains low, there could be continuedweakness in housing turnover.
Commonwealth Grants ($9,762 million in 2011-12)
General Purpose Grants
Growth in Western Australia's general purpose grants fundamentally depends first ongrowth in the Commonwealth's overall GST collections, exposing Western Australiadirectly to national economic conditions. And second, on the distribution of GSTcollections among States and Territories according to the recommendations of the CGC.
There are two key risks known to Western Australia in this process. The first is the riskassociated with increases and decreases in the total pool of GST collected, and the secondis Western Australia's declining share of the total GST pool. The first risk factor seesWestern Australia exposed to fluctuations in national economic conditions. An exampleof such exposure is Western Australia's share of the GST pool being revised down by$725 million over the budget and forward estimates period since the State's mid-yearreview, on account of lower estimates of GST pool growth.
The second risk factor, relating to Western Australia's declining share of the total pool ofGST revenue collected, is presently at critical levels. This risk is occasioned by CGCmethodology. Essentially, the CGC's recommendations incorporate estimates of eachState's and Territory's capacity to raise revenue from its own sources and its costs ofproviding services, compared to other States, yielding substantial penalties in the form ofreduced GST grants for Western Australia. There are hundreds of variables at play in thecomplicated and now largely capricious 'equalisation' formula used in the distributiveprocess by the CGC. Given the complex methodology and numerous variables taken intoconsideration, significant difficulties are attached to predicting Western Australia's futureshare of GST revenue. However, as discussed in depth in Chapter 4: GeneralGovernment Revenue, Western Australia's current estimates are that the State'spopulation share of GST will fall to a record low of 33% by 2014-15.
63
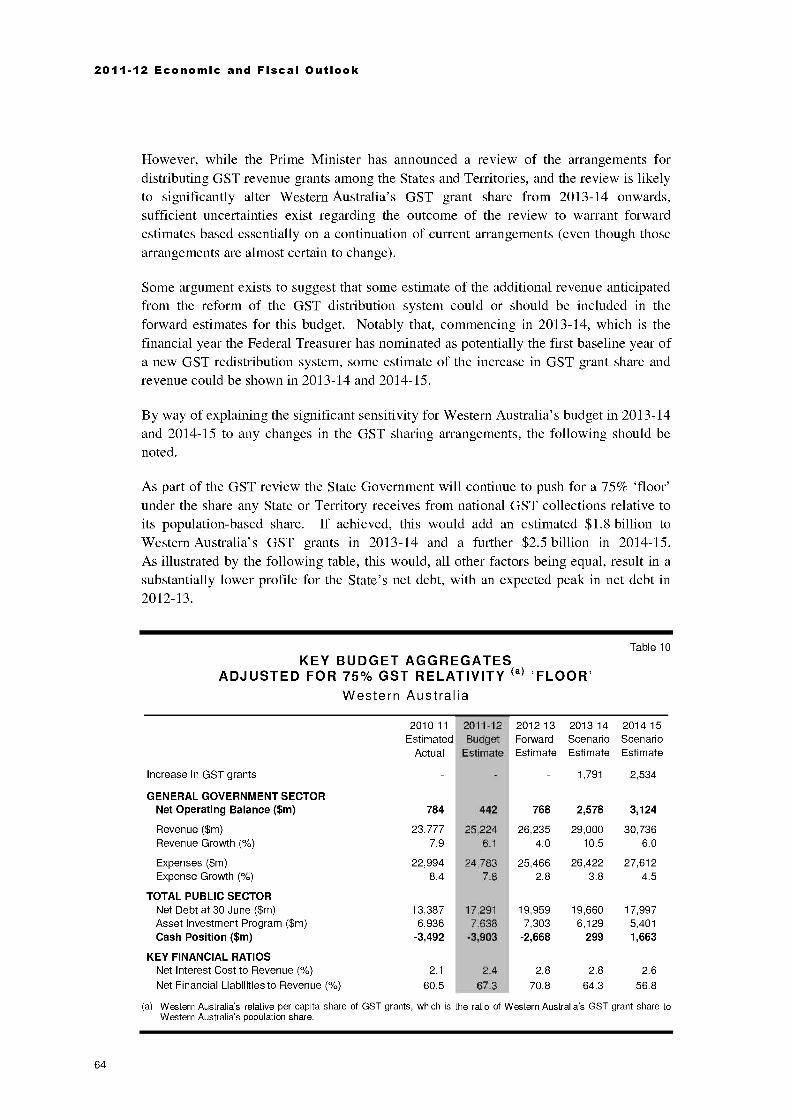
2011-12 Economic and Fiscal Outlook
However, while the Prime Minister has announced a review of the arrangements fordistributing GST revenue grants among the States and Territories, and the review is likelyto significantly alter Western Australia's GST grant share from 2013-14 onwards,sufficient uncertainties exist regarding the outcome of the review to warrant forwardestimates based essentially on a continuation of current arrangements (even though thosearrangements are almost certain to change).
Some argument exists to suggest that some estimate of the additional revenue anticipatedfrom the reform of the GST distribution system could or should be included in theforward estimates for this budget. Notably that, commencing in 2013-14, which is thefinancial year the Federal Treasurer has nominated as potentially the first baseline year ofa new GST redistribution system, some estimate of the increase in GST grant share andrevenue could be shown in 2013-14 and 2014-15.
By way of explaining the significant sensitivity for Western Australia's budget in 2013-14and 2014-15 to any changes in the GST sharing arrangements, the following should benoted.
As part of the GST review the State Government will continue to push for a 75% 'floor'under the share any State or Territory receives from national GST collections relative toits population-based share. If achieved, this would add an estimated $1.8 billion toWestern Australia's GST grants in 2013-14 and a further $2.5 billion in 2014-15.As illustrated by the following table, this would, all other factors being equal, result in asubstantially lower profile for the State's net debt, with an expected peak in net debt in2012-13.
Table 10KEY BUDGET AGGREGATES
ADJUSTED FOR 75% GST RELATIVITY (a) 'FLOOR'Western Australia
Increase in GST grants
GENERAL GOVERNMENT SECTOR
2010-11 2011-12Estimated' Budget
Actual Estimate
2012-13ForwardEstimate
2013-14ScenarioEstimate
1,791
2014-15ScenarioEstimate
2,534
Net Operating Balance ($m) 784 442 768 2,578 3,124
Revenue ($m) 23,777 25,224 26,235 29,000 30,736Revenue Growth (%) 7.9 6.1 4.0 10.5 6.0
Expenses ($m) 22,994 24,783 25,466 26,422 27,612Expense Growth (%) 8.4 7.8 2.8 3.8 4.5
TOTAL PUBLIC SECTORNet Debt at 30 June ($m) 13,387 . 17,291 19,959 19,660 17,997Asset Investment Program ($m) 6,936 7,638 7,303 6,129 5,401Cash Position ($m) -3,492 -3,903 -2,668 299 1,663
KEY FINANCIAL RATIOSNet Interest Cost to Revenue ( %) 2.1 2.4 2.8 2.8 2.6Net Financial Liabilities to Revenue (%) 60.5 ...67.3 j 70.8 64.3 56.8
(a) Western Australia's relative per capita share of GST grants, which is the ratio of Western Australia's GST grant share toWestern Australia's population share.
64
Financial Projections and Fiscal Strategy
Risks associated with North West Shelf grants (which are classed as general purposegrants) revolve mainly around oil price and exchange rate volatility (see Royalty Incomebelow).
Payments for Specific Purposes
The forward estimates of payments for specific purposes, and associated impacts on Statespending, have a significant margin of uncertainty, reflecting:
the potential for Commonwealth policy changes (including possible new NationalPartnerships), including greater intrusion by the Commonwealth into the delivery ofState services;
uncertainty over the outcomes of the Commonwealth's proposed changes to healthfunding;
that some National Partnership payments are contingent on the State's performanceand may require the State to match Commonwealth funding;
that National Partnership agreements continue to impose inflexible input controls andonerous reporting requirements, which may limit the State's autonomy and ability toimprove service outcomes;
in some cases, the need for the States to compete for national pools of funding, and toprovide matching funding; and
parameter uncertainties (such as timing and indexation for inflation and wagesgrowth).
Commonwealth Funding for Infrastructure
In its 2007 election, the Commonwealth Government committed to establish a
Western Australia Infrastructure Fund from Gorgon/Pluto petroleum revenue.The Commonwealth's commitment equates to $100 million per annum, which would bequarantined from the CGC process. However, there had been no formal agreement onthis issue at the time of the budget cut-off date (20 April 2011).
On 2 May 2010, the Commonwealth indicated that some of the additional revenue fromits proposed mining tax regime would be directed to a Regional Infrastructure Fund from2012-13. The Commonwealth has committed that Western Australia would receive atleast $2 billion over 10 years from the Fund (out of a total of $6 billion). However, noprovision for this funding has been made in the State forward estimates at this stage.
Royalty Income ($4,794 million in 2011-12)
The royalty income estimates (and North West Shelf grant estimates) are particularlysensitive to the $US/$A exchange rate and $US commodity price assumptions notedabove.
65

2011-12 Economic and Fiscal Outlook
Exchange Rate
The exchange rate projections underlying this budget are based on an assumption that thecurrent rate moves towards the long-term average (of US74 cents) by the end of theforward estimates period7.
There is a risk that the $US/$A could remain at a high level for a sustained period,particularly if global commodity markets remain strong and if domestic interest ratesremain relatively high.
Iron Ore Prices
Iron ore prices are assumed to return to a value of $US78 per tonne over the course of theforward estimates period8. This is broadly consistent with Consensus Forecasts, andreflects an expectation that the global supply of iron ore will gradually accelerate incoming years in response to current high prices.
To the extent that global demand remains strong, there is some upside risk to the priceforecasts, particularly in the short run. Conversely, if global economic conditions were todeteriorate sharply, this could result in a significant contraction in iron ore prices.
Spending Risks
Savings Measures
As part of a strategy to contain growth in net debt, this budget includes initiatives to:
achieve savings from a targeted review of specific programs and activities that nolonger provide value for money; and
implement a 5% efficiency dividend across the State's GTEs (to be applied from2011-12 and target discretionary expenditure of the affected corporations, such assalaries and administration).
The resulting impacts on general government revenue (through tax equivalent anddividend arrangements) and expenses, and the anticipated effect on total public sector netdebt, have been calculated by the Department of Treasury (based on financial estimatesavailable during budget formulation).
There are risks that projected financial benefits for 2011-12 and beyond will change as theaffected agencies implement these savings initiatives. The exact savings and reduction innet debt will be finalised as part of the 2011-12 Mid-year Review.
7 This equates to an average exchange rate of US76.9 cents in 2014-15.
This equates to an average iron ore price of $US87.5 per tonne in 2014-15.
66
Financial Projections and Fiscal Strategy
Road Trauma Trust Fund
The Government announced in April 2011 that, by 2012-13, all speed and red lightinfringement revenue will be allocated to the Road Trauma Trust Fund (RTTF).The appropriation of this revenue to the RTTF is reflected in this budget.
However, spending these funds is subject to the submission of individual business casesand subsequent approval by Cabinet. As expenditure decisions are yet to be taken byCabinet, the spending of these funds is not reflected in the forward estimates. Thisstrategy has been adopted to provide the best utilisation of RTTF funding to deliver theGovernment's 'Towards Zero' program.
Electricity Tariffs
Despite recent increases in electricity tariffs, there remain a number of risks for the cost ofproviding electricity in Western Australia. These include the CommonwealthGovernment's proposed carbon tax and renewable energy policies, and the forthcomingreview of network tariffs under Western Power's Access Arrangement 3 (AA3).
Asset Investment
The budget estimates are based on latest cost estimates available to agencies. Further costincreases could arise depending on a range of factors including market conditions and thecapacity of the construction sector. The Asset Investment Program also includes someprojects that are subject to confirmation of Commonwealth funding for further planningand definition of scope and design, finalisation of contract negotiations, and/or otherevents.
Health Information and Communications Technology Project
The Department of Health's Asset Investment Program includes approved spending of$335 million for the ICT Project. Outcomes of a review of system-wide needs andassociated funding requirements are expected to be presented to Government during2012-13. It is envisaged that this review will provide clarity on the ICT scope andbudgets of individual health infrastructure projects and the system-wide HealthInformation Network.
Western Power Capital Expenditure
Western Power is required to provide its AA3 submission to the Economic RegulationAuthority on 1 October 2011. This access arrangement will outline Western Power'scapital investment over the period 2012-13 to 2016-17. Additional capital expendituremay be required to meet growth requirements in the network and undertake assetmaintenance and replacement to mitigate safety, security and reliability issues.
67
2011-12 Economic and Fiscal Outlook
Contingent Liabilities
Contingent liabilities are costs that the Government will have to meet should particularevents occur. Typically, contingent liabilities consist of guarantees, indemnities andsureties, as well as legal and contractual claims They constitute a potential risk to thefinancial projections.
Details of the quantified contingent liabilities of the State at 30 June 2010 are provided inthe 2009-10 Annual Report on State Finances, released on 28 September 2010. At thattime, quantified guarantees, warranties, indemnities and sureties totalled $1.2 billion atthe end of 30 June 2010. No material change to that disclosure has been noted to date.
68

CHAPTER 4
General Government Revenue
Overview
General government revenue, including Commonwealth grants, is projected to grow at anaverage rate of 4.4% per year over the period 2010-11 to 2014-15. This compares withaverage growth of 10.8% per annum during the resources boom (2003-04 to 2007-08),and average growth of 8.5% per annum over the past decade.
Of particular note is the widely divergent outlook for the State's own-source revenue(predominantly State taxes and mining royalties) and Commonwealth grants(see Figure 1).
Growth in own-source revenue has been strong in 2010-11, with robust conditions inglobal commodity markets driving a sharp increase in royalty income, particularly foriron ore. Royalties are likely to be sustained at a high level over the budget period,underpinned by rising domestic production and further reform of iron ore royalty rates.These factors should offset projected moderation in commodity prices over the mediumterm.
After a subdued outcome in 2010-11 (largely due to a weak housing market), taxationrevenue is also expected to rise at a solid pace over the budget period, consistent withexpectations of steady growth in domestic economic activity.
Total own-source revenue is projected to grow at an average rate of 8.1% per annum from2010-11 to 2014-15.
Conversely, Commonwealth grants are expected to decline significantly over the budgetperiod, mainly due to lower GST revenue. This reflects the principle of 'fiscalequalisation', which is applied by the Commonwealth Grants Commission (CGC) inallocating national GST revenue to the States and Territories. Based on the current CGCmethodology, Western Australia's GST grants are projected to fall dramatically over theforward estimates period, from $3.6 billion in 2011-12 to just $2.0 billion in 2014-15.
69
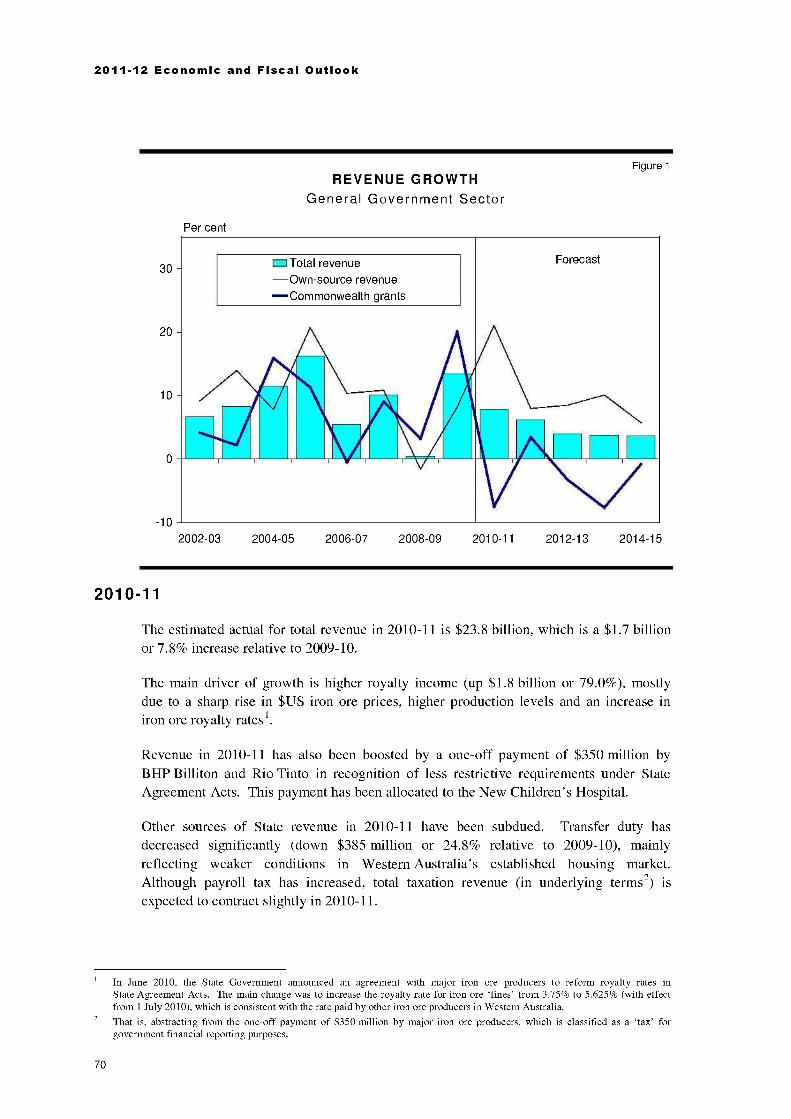
2011-12 Economic and Fiscal Outlook
REVENUE GROWTHGeneral Government Sector
Per cent
Figure 1
30
20
10
=Total revenueOwn-source revenueCommonwealth grants
Forecast
-10
2002-03 2004-05 2006-07 2008-09 2010-11 2012-13 2014-15
2010-11
The estimated actual for total revenue in 2010-11 is $23.8 billion, which is a $1.7 billionor 7.8% increase relative to 2009-10.
The main driver of growth is higher royalty income (up $1.8 billion or 79.0%), mostlydue to a sharp rise in $US iron ore prices, higher production levels and an increase iniron ore royalty rates 1.
Revenue in 2010-11 has also been boosted by a one-off payment of $350 million byBHP Billiton and Rio Tinto in recognition of less restrictive requirements under StateAgreement Acts. This payment has been allocated to the New Children's Hospital.
Other sources of State revenue in 2010-11 have been subdued. Transfer duty hasdecreased significantly (down $385 million or 24.8% relative to 2009-10), mainlyreflecting weaker conditions in Western Australia's established housing market.Although payroll tax has increased, total taxation revenue (in underlying terms) isexpected to contract slightly in 2010-11.
2
70
In June 2010, the State Government announced an agreement with major iron ore producers to reform royalty rates inState Agreement Acts. The main change was to increase the royalty rate for iron ore 'fines' from 3.75% to 5.625% (with effectfrom 1 July 2010), which is consistent with the rate paid by other iron ore producers in Western Australia.
That is, abstracting from the one-off payment of $350 million by major iron ore producers, which is classified as a 'tax' forgovernment financial reporting purposes.
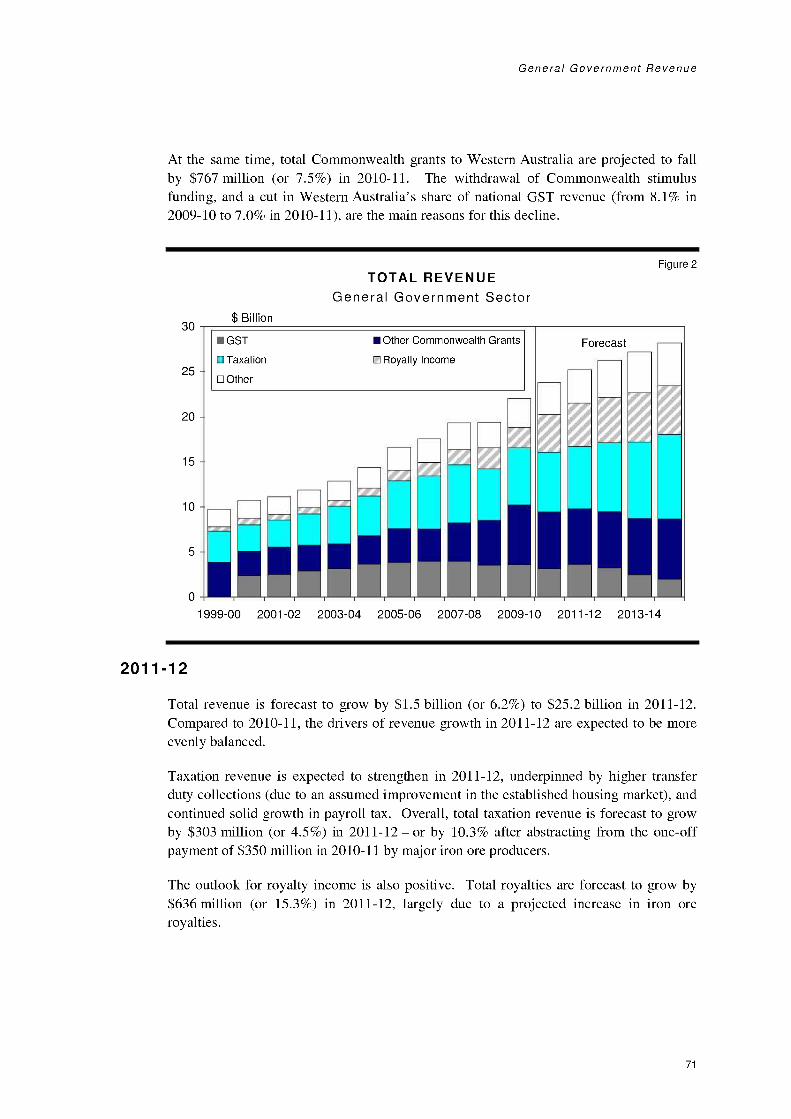
General Government Revenue
At the same time, total Commonwealth grants to Western Australia are projected to fallby $767 million (or 7.5%) in 2010-11. The withdrawal of Commonwealth stimulusfunding, and a cut in Western Australia's share of national GST revenue (from 8.1% in2009-10 to 7.0% in 2010-11), are the main reasons for this decline.
30
25
20
15
10
5
0
TOTAL REVENUEGeneral Government Sector
$ Billion
Figure 2
GST Other Commonwealth Grants
Taxation le Royalty Income
Other
Forecast
dr
104
1999-00 2001-02 2003-04 2005-06 2007-08 2009-10 2011-12 2013-14
2011-12
Total revenue is forecast to grow by $1.5 billion (or 6.2%) to $25.2 billion in 2011-12.Compared to 2010-11, the drivers of revenue growth in 2011-12 are expected to be moreevenly balanced.
Taxation revenue is expected to strengthen in 2011-12, underpinned by higher transferduty collections (due to an assumed improvement in the established housing market), andcontinued solid growth in payroll tax. Overall, total taxation revenue is forecast to growby $303 million (or 4.5%) in 2011-12 or by 10.3% after abstracting from the one-offpayment of $350 million in 2010-11 by major iron ore producers.
The outlook for royalty income is also positive. Total royalties are forecast to grow by$636 million (or 15.3%) in 2011-12, largely due to a projected increase in iron oreroyalties.
71

2011-12 Economic and Fiscal Outlook
GST revenue is also expected to increase in 2011-12 (by $452 million or 14.3%).This reflects projected growth in the national GST pool (notwithstanding recentdownward revisions to national GST collections) and a rise in the State's share of GSTrevenue (from 7.0% in 2010-11 to 7.4% in 2011-12). However, as explained later in thischapter, the increase in Western Australia's share of GST revenue is expected to beshort-lived.
GENERAL GOVERNMENT REVENUE (a)2 0 1 1-1 2
GST14%
$3,617 million
OtherCommonwealth
Grants24%
$6,145 million
Taxation28%
$6,965 million
Other Public3%Corporations
$748 million 5%
$1,149 million
Sale of goods andservices
7%
$1,815 million
TOTAL REVENUE = $25,233 MILLION(a) Numbers may not add due to the rounding.
Figure 3
Royalty Income19%
$4,794 million
The composition of State revenue has changed significantly in recent years. Royaltyincome is expected to account for 19% of total revenue in 2011-12, up from 9% in2007-08 and 6% a decade ago. Conversely, Commonwealth grants are shrinking rapidlyas a source of State revenue. After hitting a peak of almost 50% in 2001-02,Commonwealth grants are expected to account for around 39% of total revenue in2011-12, and approximately 31% by the end of the forward estimates period.
In 2011-12, the main sources of State revenue are expected to be:
taxation ($7.0 billion);
Commonwealth grants (other than GST) ($6.1 billion);
royalty income ($4.8 billion);
GST ($3.6 billion);
72
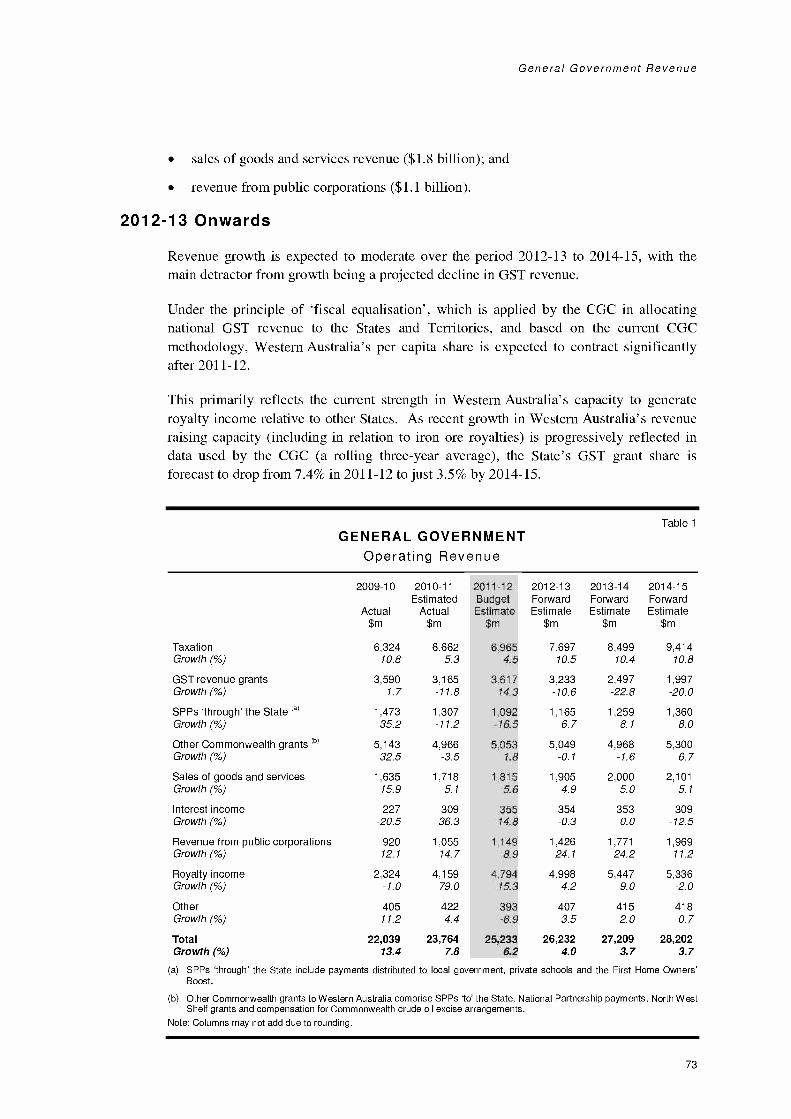
General Government Revenue
sales of goods and services revenue ($1.8 billion); and
revenue from public corporations ($1.1 billion).
2012-13 Onwards
Revenue growth is expected to moderate over the period 2012-13 to 2014-15, with themain detractor from growth being a projected decline in GST revenue.
Under the principle of 'fiscal equalisation', which is applied by the CGC in allocatingnational GST revenue to the States and Territories, and based on the current CGCmethodology, Western Australia's per capita share is expected to contract significantlyafter 2011-12.
This primarily reflects the current strength in Western Australia's capacity to generateroyalty income relative to other States. As recent growth in Western Australia's revenueraising capacity (including in relation to iron ore royalties) is progressively reflected indata used by the CGC (a rolling three-year average), the State's GST grant share isforecast to drop from 7.4% in 2011-12 to just 3.5% by 2014-15.
Table 1
GENERAL GOVERNMENTOperating Revenue
2009-10
Actual$m
2010-11Estimated
Actual$m
2011-12BudgetEstimate
$m
2012-13ForwardEstimate
$m
2013-14ForwardEstimate
$m
2014-15ForwardEstimate
$m
Taxation 6,324 6,662 6,965 7,697 8,499 9,414Growth (%) 10.8 5.3 4.5 10.5 10.4 10.8
GST revenue grants 3,590 3,165 3,617 3,233 2,497 1,997Growth (%) 1.7 -11.8 14.3 -10.6 -22.8 -20.0
SPPs 'through' the State (a) 1,473 1,307 1,092 1,165 1,259 1,360Growth (%) 35.2 -11.2 -16.5 6.7 8.1 8.0
Other Commonwealth grants (b) 5,143 4,966 5,053 5,049 4,968 5,300Growth (%) 32.5 -3.5 1.8 -0.1 -1.6 6.7
Sales of goods and services 1,635 1,718 1,815 1,905 2,000 2,101Growth (%) 15.9 5.1 5.6 4.9 5.0 5.1
Interest income 227 309 355 354 353 309Growth (%) -20.5 36.3 14.8 -0.3 0.0 -12.5
Revenue from public corporations 920 1,055 1,149 1,426 1,771 1,969Growth (%) 12.1 14.7 8.9 24.1 24.2 11.2
Royalty income 2,324 4,159 4,794 4,998 5,447 5,336Growth (%) -1.0 79.0 15.3 4.2 9.0 -2.0
Other 405 422 393 407 415 418Growth (%) 11.2 4.4 -6.9 3.5 2.0 0.7
Total 22,039 23,764 25,233 26,232 27,209 28,202Growth (%) 13.4 7.8 6.2 4.0 3.7 3.7
(a) SPPs 'through' the State include payments distributed to local government, private schools and the First Home Owners'Boost.
(b) Other Commonwealth grants to Western Australia comprise SP Ps 'to' the State, National Partnership payments, North WestShelf grants and compensation for Commonwealth crude oil excise arrangements.
Note: Columns may not add due to rounding.
73
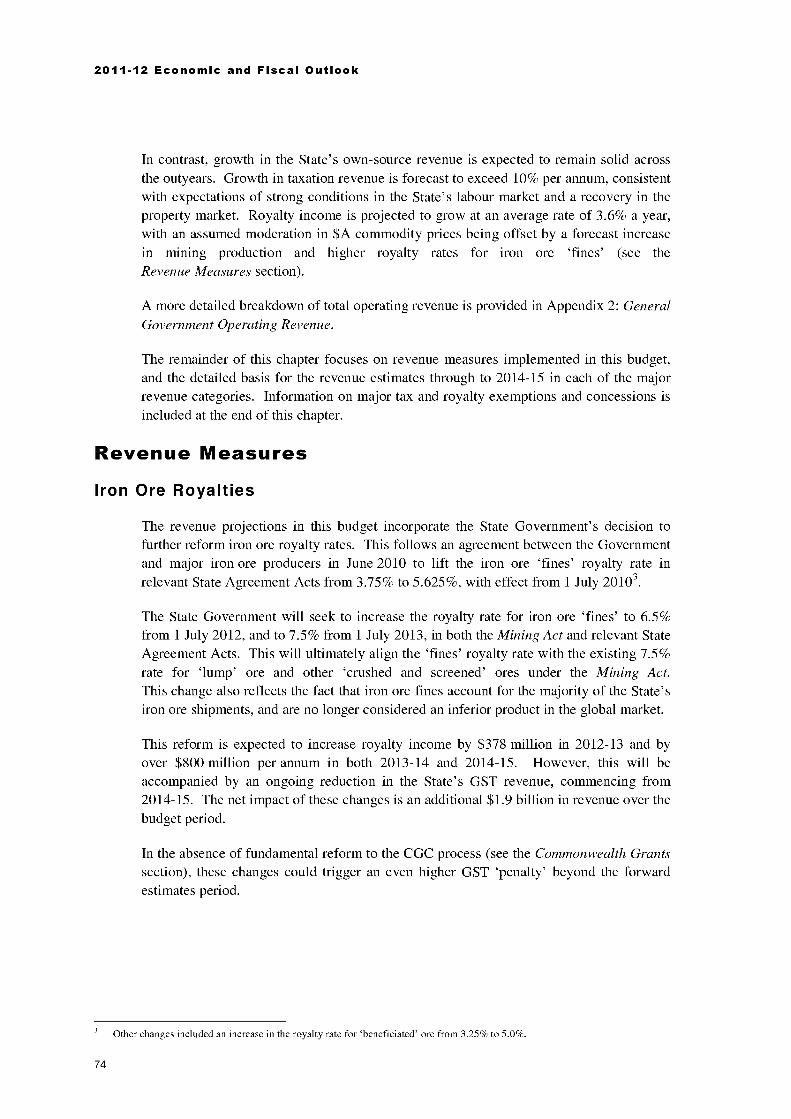
2011-12 Economic and Fiscal Outlook
In contrast, growth in the State's own-source revenue is expected to remain solid acrossthe outyears. Growth in taxation revenue is forecast to exceed 10% per annum, consistentwith expectations of strong conditions in the State's labour market and a recovery in theproperty market. Royalty income is projected to grow at an average rate of 3.6% a year,with an assumed moderation in $A commodity prices being offset by a forecast increasein mining production and higher royalty rates for iron ore 'fines' (see theRevenue Measures section).
A more detailed breakdown of total operating revenue is provided in Appendix 2: GeneralGovernment Operating Revenue.
The remainder of this chapter focuses on revenue measures implemented in this budget,and the detailed basis for the revenue estimates through to 2014-15 in each of the majorrevenue categories. Information on major tax and royalty exemptions and concessions isincluded at the end of this chapter.
Revenue Measures
Iron Ore Royalties
The revenue projections in this budget incorporate the State Government's decision tofurther reform iron ore royalty rates. This follows an agreement between the Governmentand major iron ore producers in June 2010 to lift the iron ore 'fines' royalty rate inrelevant State Agreement Acts from 3.75% to 5.625%, with effect from 1 July 20103.
The State Government will seek to increase the royalty rate for iron ore 'fines' to 6.5%from 1 July 2012, and to 7.5% from 1 July 2013, in both the Mining Act and relevant StateAgreement Acts. This will ultimately align the 'fines' royalty rate with the existing 7.5%rate for 'lump' ore and other 'crushed and screened' ores under the Mining Act.This change also reflects the fact that iron ore fines account for the majority of the State'siron ore shipments, and are no longer considered an inferior product in the global market.
This reform is expected to increase royalty income by $378 million in 2012-13 and byover $800 million per annum in both 2013-14 and 2014-15. However, this will beaccompanied by an ongoing reduction in the State's GST revenue, commencing from2014-15. The net impact of these changes is an additional $1.9 billion in revenue over thebudget period.
In the absence of fundamental reform to the CGC process (see the Commonwealth Grantssection), these changes could trigger an even higher GST 'penalty' beyond the forwardestimates period.
Other changes included an increase in the royalty rate for `beneficiated' ore from 3.25% to 5.0%.
74

General Government Revenue
Table 2IRON ORE ROYALTY RATE CHANGES
Western Australia
2010-11 2011-12 2012-13 2013-14 2014-15 Total
Royalty rate iron ore 'fines' 5.625% 5.625% 6.5% 7.5% 7.5%Royalty income ($m) 378 824 817 2,019GST impact ($m) -96 -96Net revenue impact ($m) 378 824 722 1,923
Vehicle Licence Duty Exemption for Transfers of VehicleLicenses Between Spouses
From 1 July 2011, an exemption from motor vehicle duty will apply for transfers ofprivate vehicle licences between spouses or de facto partners of at least two years.
This exemption will provide more consistent treatment with the existing duty exemptionfor transfers of a principal place of residence from one spouse or de facto partner into thejoint ownership of both partners. Similar exemptions apply in most other jurisdictions.
As a result, a husband and wife (for example) will be able to swap the person responsiblefor all dealings with the Department of Transport in relation to their vehicle (such aslicence renewals or traffic infringements) without paying duty. A transfer fee(currently $15) will continue to apply to cover the Department of Transport'sadministrative costs.
The exemption will save spouses or other eligible partners $275 on the transfer ofa licence for a $10,000 vehicle, $550 for a $20,000 vehicle, and $1,050 fora $30,000 vehicle.
The cost of the exemption is expected to be negligible.
Taxation Revenue Estimates
Summary
The estimated actual for taxation revenue in 2010-11 is $6.7 billion, which representsgrowth of 5.3% relative to 2009-10. However, excluding the one-off payment of$350 million from BHP Billiton and Rio Tinto in relation to changes to State AgreementActs, taxation revenue is expected to decline in underlying terms by 0.2% in 2010-11,reflecting a significant reduction in property transfer duty.
Consistent with the economic outlook described in Chapter 2: The Western AustralianEconomy, growth in taxation revenue is expected to strengthen to 4.5% (or 10.3% inunderlying terms) in 2011-12. Sustained growth in the State's economy should underpina solid rise in tax revenue across the outyears, with growth averaging 10.6% per annumover the period 2012-13 to 2014-15, which is slightly above the trend rate of growth overthe past decade.
75

2011-12 Economic and Fiscal Outlook
Table 3TAXATION REVENUE
Western Australia
TAXES ON EMPLOYERS'PAYROLL
2009-10
Actual$m
2010-11Estimated
Actual$m
2011-12Budget
Estimate$m
2012-13ForwardEstimate
$m
2013-14ForwardEstimate
$m
2014-15ForwardEstimate
$m
Payroll tax 2,303 2,604 2,927 3,256 3,692 4,171Growth (%) 2.5 13.1 12.4 11.2 13.4 13.0
TAXES ON PROPERTYLand tax 528 515 548 549 604 663MRIT 78 77 84 84 92 101Transfer duty 1,552 1,167 1,345 1,618 1,782 2,014Landholder duty 87 38 49 59 65 73Other 197 227 244 258 276 285Total 2,443 2,024 2,269 2,568 2,818 3,136Growth (%) 24.8 -17.2 12.1 13.2 9.8 11.3
TAXES ON GAMBLINGLotteries Commission 130 134 138 142 146 150Casino tax 92 92 115 117 120 122Betting tax 32 33 34 36 38 40Other 21 1 1 1 1
Total 254 279 288 295 304 312Growth (%) -1.2 9.9 3.1 2.6 2.9 2.6
TAXES ON INSURANCEInsurance duty 404 440 467 504 545 588Other 24 26 21 22 22 22Total 428 466 488 526 567 610Growth (%) 7.7 8.8 4.8 7.7 7.7 7.7
MOTOR VEHICLE TAXESVehicle licence duty 332 343 365 394 425 458Motor vehicle registrations 516 546 575 604 638 668Other 48 50 52 54 55 57Total 895 939 992 1,052 1,118 1,184Growth (%) 5.6 4.9 5.7 6.0 6.3 5.9
OTHER TAXES 350.0
TOTAL TAXES 6,324 6,662 6,965 7,697 8,499 9,414Growth (%) 10.8 5.3 4.5 10.5 10.4 10.8Underlying Growth ( %)(a) 10.8 -0.2 10.3 10.5 10.4 10.8
(a) Excluding a one-off payment of $350 million in 2010-11 by BHP Billiton and Rio Tinto in relation to changes to StateAgreement Acts.
Note: Columns may not add due to rounding.
76
General Government Revenue
Detail
Payroll Tax
Payroll tax is forecast to grow by 13.1% (or $301 million) in 2010-11. This followsgrowth of just 2.5% in the previous year, and reflects a solid recovery inWestern Australia's labour market since the global financial crisis.
As detailed in Chapter 2: The Western Australian Economy, activity in the State's labourmarket is expected to remain strong in 2011-12. Employment is forecast to grow by2.5%, whilst growth in Average Weekly Earnings is expected to strengthen to 4.5%.On this basis, payroll tax is projected to grow by 12.4% (or $323 million) in 2011-12.
The longer-term outlook for payroll tax is similarly robust. This is based on expectationsof continued strength in the State's labour market, with both employment and earningsassumed to expand at a solid pace. Incorporating the impact of payroll tax harmonisationmeasures from 2012-13 (which have an estimated revenue cost of $62 million in the firstyear), payroll tax is projected to grow at an average rate of 12.5% per annum in theoutyears. This is broadly consistent with the trend growth rate recorded over the pastdecade.
Taxes on Property
Taxes on property include transfer duty (the State's second largest tax after payroll tax),landholder duty, land tax, the metropolitan region improvement tax (MRIT), theemergency services levy, and loan guarantee fees.
Transfer Duty4
Transfer duty has been very weak in 2010-11. This reflects current subdued conditions inthe State's established housing market, including a significant decline in the number ofdutiable property transactions (see following chart) and a contraction in house prices.
4 This section discusses total duty on transfers which is the sum of transfer duty and landholder duty.
77

2011-12 Economic and Fiscal Outlook
HOUSING FINANCE COMMITMENTSExcluding Refinancing and First-home Buyers
20Thousands
18
16
14
12
10
8
6
4
2
0
Trend
Figure 4
Forecast
Sep-91 Sep-94 Sep-97 Sep-00 Sep-03 Sep-06 Sep-09 Sep-12
With revenue from large commercial transactions also much lower than in 2009-10,transfer duty is expected to decline by $435 million (or almost 27%) in 2010-11 relativeto 2009-10.
2,500
TOTAL DUTY ON TRANSFERS (a)Western Australia
$ Million
Figure 5
2,000
1,500
1,000
500
Forecast
0 i 7 T 7 T T 7 T T T T 772000-01 2002-03 2004-05 2006-07 2008-09 2010-11 2012-13 2014-15
(a) The sum of transfer duty and landholder duty.
78

General Government Revenue
The transfer duty projections for 2011-12 and the outyears are based on an assumedrecovery in Western Australia's established property market. The projections reflect anassumed modest growth in house prices (averaging 5.0% per annum across the forwardestimates period), and an assumed return to the long-run trend level of activity(i.e. volume of transactions) by 2014-15.
After falling by an estimated 2.4% in 2010-11, house prices are forecast to grow by 2.3%in 2011-12, supported by rising incomes, solid (albeit moderating) population growth, andstronger household balance sheets. Rising confidence in the housing market should alsounderpin a recovery in the number of residential property sales. Combined with anassumed improvement in the non-residential property market, transfer duty is estimated toincrease by 15.7% (or $189 million) in 2011-12.
Across the outyears, transfer duty is forecast to increase at an average rate of14.4% per annum. Although this is higher than the long-run average (of around12% growth per annum), the transfer duty estimate for 2014-15 ($2.1 billion) is stillbelow the peak recorded in 2007-08 (see chart above).
These estimates incorporate the revenue impact of the abolition of duty on non-realbusiness transfers from 1 July 2013 (which reduces revenue by approximately$118 million in 2013-14 and $131 million in 2014-15).
Land Tax
Land tax is forecast to rise by $34 million (or 6.5%) to $548 million in 2011-12. This isbased on advice from the Valuer General with respect to unimproved land values as atAugust 2010.
With 2012-13 land tax assessments reflecting unimproved land values at August 2011,and with expected flat growth in property prices between August 2010 and August 2011,land tax is expected to remain flat in 2012-13. However, growth in land tax is assumed toreturn to its long-run average of 10% per annum in both 2013-14 and 2014-15.
Taxes on Gambling
Taxes on gambling mainly comprise lotteries, casino and betting taxes. Due to theprohibition of gaming machines in hotels and clubs in Western Australia, gambling taxesin this State account for a much smaller share of total taxes than in other jurisdictions(4.1% in Western Australia relative to an average of 9.8% across the other States in2011-12).
Gambling taxes are forecast to increase by 3.1% in 2011-12, following an estimatedincrease of 9.9% in 2010-11. The strong growth in 2010-11 is mainly due to the paymentof a one-off fee of $20 million in relation to the expansion of Burswood Casino. Growthin gambling taxes is projected to moderate in the outyears, averaging 2.7% per annum.
79
2011-12 Economic and Fiscal Outlook
Taxes on Insurance
Taxes on insurance mainly consist of duty on insurance policies (with a number of keyexemptions, including health insurance and life insurance). In 2011-12, insurance duty isforecast to increase by 6.1% to $467 million, following expected growth of 8.9% in2010-11. In the outyears, growth in insurance duty is forecast to grow by 8.0%per annum.
Motor Vehicle Taxes
Motor vehicle taxes comprise duty on the transfer of vehicles (vehicle licence duty),annual vehicle registration fees, permit fees for oversize vehicles and loads, and the motorvehicle recording fee.
Revenue from vehicle licence duty (which in 2011-12 is expected to account forapproximately 37% of total motor vehicle taxes) is forecast to increase by 6.4% in2011-12, following expected growth of 3.4% in 2010-11. Consistent with expectations ofstrengthening economic activity, growth in motor vehicle sales is expected to accelerateover the outyears. Accordingly, vehicle licence duty is forecast to grow by an average of7.9% per annum in the outyears.
Total motor vehicle taxes are forecast to grow by 5.7% in 2011-12 and by an average of6.1% per annum across the outyears.
Commonwealth Grants
Commonwealth grants are expected to total $9.8 billion, accounting for 39% of the State'srevenue in 2011-12 (down from 46% in 2009-10), and take three forms:
GST revenue grants which carry no restrictions on how the money can be spent, andcomprise around 37% ($3.6 billion) of forecast total Commonwealth grants toWestern Australia in 2011-12;
North West Shelf grants which also carry no spending restrictions, and comprisearound 11% ($1.1 billion) of forecast total Commonwealth grants toWestern Australia in 2011-12; and
payments for specific purposes (PSPs) which must be spent on specific activities(e.g. health, education, roads and social housing). These comprise around 52%($5.1 billion) of forecast total Commonwealth grants to Western Australia in 2011-12.
The Commonwealth and all State and Territory Governments signed a Heads ofAgreement on National Health Reform in February 2011. The details of this reform(which will eventually see the Commonwealth and States equally share the 'efficient' costof growth in hospital service costs) are being worked through by governments.
80

General Government Revenue
Table 4COMMONWEALTH GRANTS
2009-10 2010-11 2011-12 2012-13 2013-14 2014-15Estimated Budget Forward Forward Forward
Actual Actual Estimate Estimate Estimate Estimate$m $m $m $m $m $m
General Purpose GrantsGST revenue 3,590 3,165 3,617 3,233 2,497 1,997
Growth ( %) 1.7 -11.8 14.3 -10.6 -22.8 -20.0
North West Shelf grants (a) 948 947 1,084 1,160 1,259 1,340
Growth (%) 9.3 0.0 14.5 6.9 8.6 6.4
Total general purpose grants 4,537 4,113 4,702 4,392 3,756 3,336
Payments for Specific Purposes
PSPs 'to' the State (b) 4,196 4,018 3,968 3,889 3,709 3,960Growth ( %) 39.1 -4.2 -1.2 -2.0 -4.6 6.8
PSPs 'through' the State 1,473 1,307 1,092 1,165 1,259 1,360
Growth (%) 35.2 -11.2 -16.5 6.7 8.1 8.0
Total PSPs 5,668 5,326 5,061 5,054 4,969 5,321
TOTAL COMMONWEALTH 10,206 9,439 9,762 9,447 8,725 8,657GRANTS
Growth (%) 20.1 -7.5 3.4 -3.2 -7.6 -0.8
(a) Includes compensation for Commonwealth crude oil excise arrangements.
(b) Payments in areas of State responsibility. Does not include payments on-passed through the State (e.g. to localgovernment, private schools and the First Home Owners' Boost).
Note: Columns may not add due to rounding.
GST Revenue
The Commonwealth's national GST collections are distributed among the Statesaccording to the CGC recommendations.
GST revenue grants to Western Australia are expected to grow by $452 million in2011-12. This reflects forecast growth in the national pool of GST revenue (of 6.7%),together with an increase in Western Australia's share of GST collections (from 7.0% in2010-11 to 7.4% in 2011-12), in line with the February 2011 recommendations of theCGC (see below).
However, GST grants are forecast to decline significantly in each of the outyears.This reflects large projected declines in Western Australia's share of GST grants, morethan offsetting projected growth in the national pool of GST revenue. By 2014-15,Western Australia's GST grants are forecast to be 45% (or $1.6 billion) lower than in2011-12.
The Federal Government has announced a review of the GST distribution arrangements(see below). Subject to the timing of the Commonwealth Government's response to thisreview, there could be a significant impact on the States' GST grant shares from 2013-14or 2014-15 onwards.
81
2011-12 Economic and Fiscal Outlook
GST Grant Shares in 2011-12
Each year, the CGC determines States' relative per capita GST grant shares (i.e. GST`relativities', which are ratios of each State's GST grant share to its population share),applying the principle of 'fiscal equalisation' and the latest available data on States' fiscalcapacities. A State whose revenue bases have grown faster than other States, or whoserelative costs of providing a 'standard' level of services have declined, will have its grantshare reduced (and vice versa).
The CGC updates relativities annually, using the latest available data (e.g. on Staterevenue bases and the composition of State populations). In addition to annual updates,the CGC undertakes a major review of the methods used to implement fiscal equalisationevery five or six years.
The CGC reported on its latest annual update (the '2011 Update') in February 2011.The report determines States' GST relativities in 2011-12.
Changes in the GST relativities in the 2011 Update will see an increase of $171 millionsin Western Australia's share of the GST grant pool in 2011-12 which is mainly theresult of revisions to data, particularly data on relative wage levels across the States.
This increase only slightly offsets a longer term trend that has seen Western Australia'sgrant share decline on the back of its strong economic and revenue base growth relative toother States. This downward trend is expected to continue in future years.
Apart from changes to the relativities, GST revenue grants are also affected by growth inthe national pool of GST revenue and changes in each State's share of the nationalpopulation. Western Australia's forecast GST revenue grant for 2011-12 includes a$215 million increase on account of growth in the GST pool and a $22 million increase onaccount of the State's increasing population share. In addition, Western Australia's GSTrevenue grant in 2010-11 was reduced for a $44 million overpayment in 2009-106.
Together, these influences increase Western Australia's overall GST revenue in 2011-12by $452 million relative to 2010-11.
5 This is based on latest estimates of the 2011-12 GST grant pool and population shares. The CGC estimated this gain at$164 million, based on estimates of the 2010-11 GST grant pool and population shares from the Commonwealth's2010-11 Mid-Year Economic and Fiscal Outlook.
6 GST revenue grants are paid during the budget year on the basis of estimated GST collections and population shares, witha reconciliation the following year once actual GST collections and population shares are known.
82
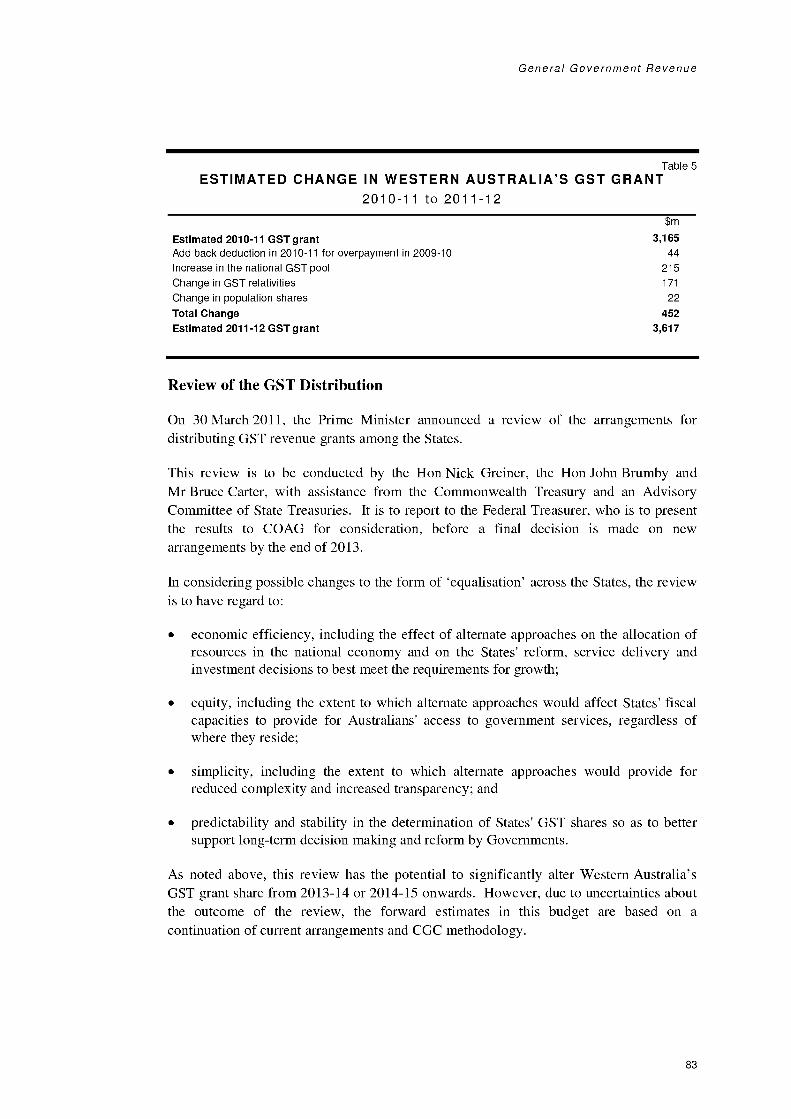
General Government Revenue
Table 5ESTIMATED CHANGE IN WESTERN AUSTRALIA'S GST GRANT
2010-11 to 2011-12
$m
Estimated 2010-11 GST grant 3,165Add back deduction in 2010-11 for overpayment in 2009-10 44
Increase in the national GST pool 215
Change in GST relativities 171
Change in population shares 22
Total Change 452
Estimated 2011-12 GST grant 3,617
Review of the GST Distribution
On 30 March 2011, the Prime Minister announced a review of the arrangements fordistributing GST revenue grants among the States.
This review is to be conducted by the Hon Nick Greiner, the Hon John Brumby andMr Bruce Carter, with assistance from the Commonwealth Treasury and an AdvisoryCommittee of State Treasuries. It is to report to the Federal Treasurer, who is to presentthe results to COAG for consideration, before a final decision is made on newarrangements by the end of 2013.
In considering possible changes to the form of 'equalisation' across the States, the reviewis to have regard to:
economic efficiency, including the effect of alternate approaches on the allocation ofresources in the national economy and on the States' reform, service delivery andinvestment decisions to best meet the requirements for growth;
equity, including the extent to which alternate approaches would affect States' fiscalcapacities to provide for Australians' access to government services, regardless ofwhere they reside;
simplicity, including the extent to which alternate approaches would provide forreduced complexity and increased transparency; and
predictability and stability in the determination of States' GST shares so as to bettersupport long-term decision making and reform by Governments.
As noted above, this review has the potential to significantly alter Western Australia'sGST grant share from 2013-14 or 2014-15 onwards. However, due to uncertainties aboutthe outcome of the review, the forward estimates in this budget are based on acontinuation of current arrangements and CGC methodology.
83

2011-12 Economic and Fiscal Outlook
Forecasts of Future GST Shares
The forward estimates of Western Australia's GST grants are based on projections by theWestern Australian Department of Treasury of:
the national pool of GST grants;
Western Australia's share of the national population; and
Western Australia's GST relativity.
In line with the CGC's process, the GST relativity projections for each year of theforward estimates (2012-13 to 2014-15) are based on a rolling average of assessments ofWestern Australia's revenue capacity and expenditure requirements (relative to otherStates) for three consecutive years. For example, the relativity projections for 2014-15are based on projected assessments of States' revenue capacities and expenditurerequirements for the years 2010-11 to 2012-13.
As growth in Western Australia's revenue raising capacity becomes reflected in thethree data years used by the CGC, Western Australia's GST grant share is forecast to dropfrom 7.0% in 2010-11 to a historically unprecedented figure of just 3.5% by 2014-15.
Table 6PROJECTED GST RELATIVITY AND SHARE
WA population share %
WA 'relativity' (a), (b)
WA GST share % (e)
2009-10
10.2
0.78
8.1
2010-11
10.3
0.68
7.0
2011-12
10.4
0.72
7.4
2012-13
10.4
0.60
6.3
2013-14
10.5
0.44
4.6
2014-15
10.6
0.33
3.5(a) Western Australia's relative per capita share of GST grants, which is the ratio of Western Australia's GST grant share to
Western Australia's population share.
(b) These relativity projections will differ from those published in the Commonwealth Budget Papers, as they incorporateprojected changes in the relative revenue raising capacity of the States and Territories, which are not included in theequivalent Commonwealth projections.
(c) Western Australia's GST share equals Western Australia's population share multiplied by its relativity.
Over the period from 2010-11 to 2014-15, Western Australia's GST grants are projectedto be $12.3 billion lower than if the State received an equal per capita share of GSTrevenue (see following chart). Such penalties being borne by Western Australia havecome about through a now outdated and inequitable CGC redistributive system, and willnot be sustainable after 2014-15.
84
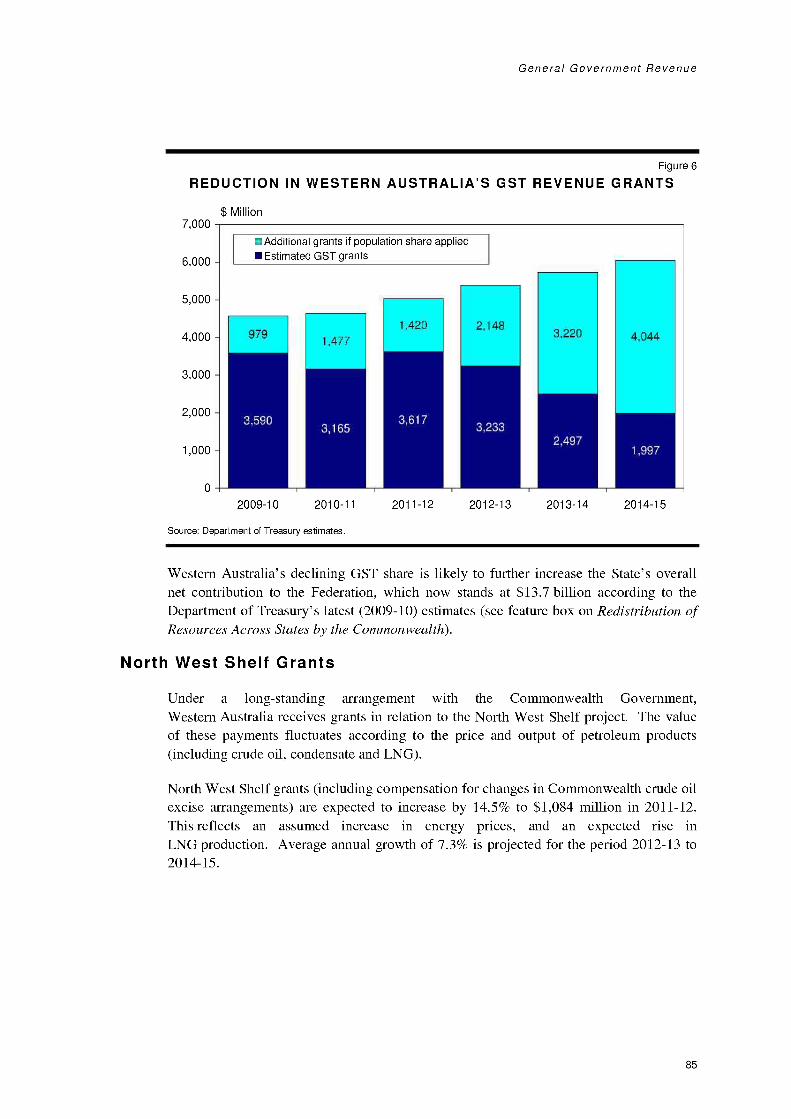
General Government Revenue
Figure 6
REDUCTION IN WESTERN AUSTRALIA'S GST REVENUE GRANTS
7,000
6,000
5,000
4,000
3,000
2,000
1,000
$ Million
Additional grants if population share appliedEstimated GST grants
979
3,590
1,477
3,165
2009-10 2010-11
Source: Department of Treasury estimates.
1,420
3,617
2,148
3,233
2011-12 2012-13
3,220
2,497
4,044
1,997
2013-14 2014-15
Western Australia's declining GST share is likely to further increase the State's overallnet contribution to the Federation, which now stands at $13.7 billion according to theDepartment of Treasury's latest (2009-10) estimates (see feature box on Redistribution ofResources Across States by the Commonwealth).
North West Shelf Grants
Under a long-standing arrangement with the Commonwealth Government,Western Australia receives grants in relation to the North West Shelf project. The valueof these payments fluctuates according to the price and output of petroleum products(including crude oil, condensate and LNG).
North West Shelf grants (including compensation for changes in Commonwealth crude oilexcise arrangements) are expected to increase by 14.5% to $1,084 million in 2011-12.This reflects an assumed increase in energy prices, and an expected rise inLNG production. Average annual growth of 7.3% is projected for the period 2012-13 to2014-15.
85
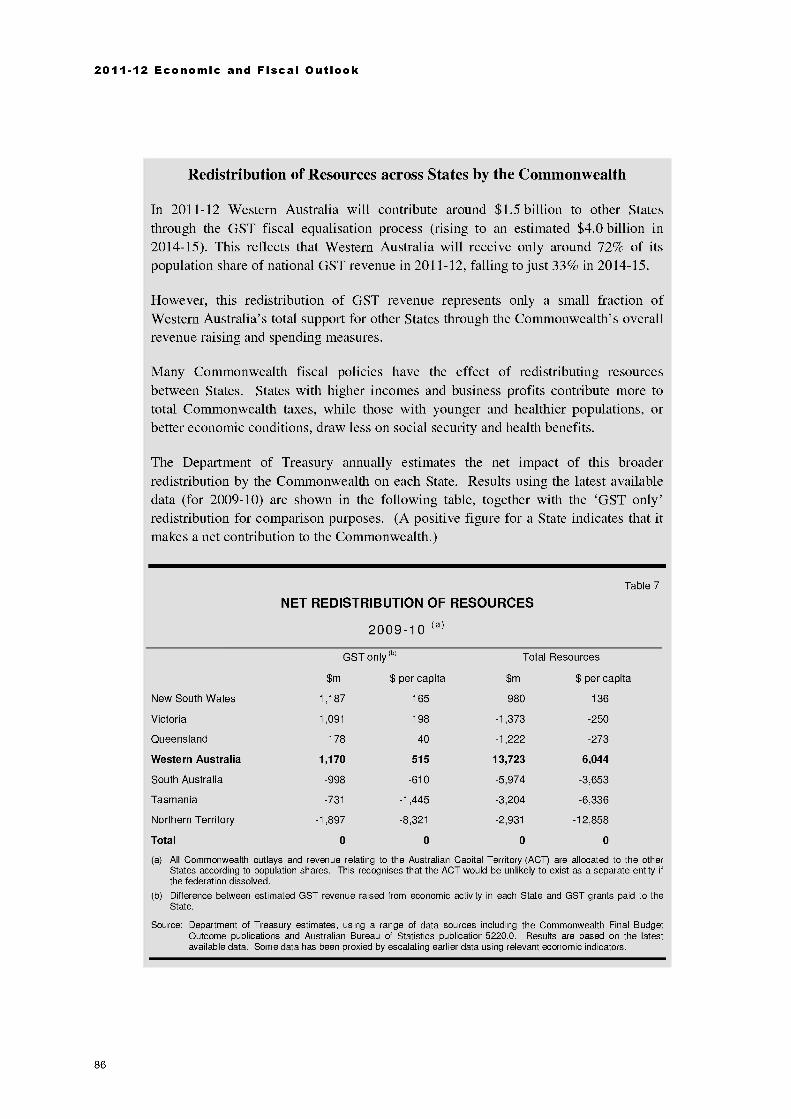
2011-12 Economic and Fiscal Outlook
Redistribution of Resources across States by the Commonwealth
In 2011-12 Western Australia will contribute around $1.5 billion to other Statesthrough the GST fiscal equalisation process (rising to an estimated $4.0 billion in2014-15). This reflects that Western Australia will receive only around 72% of itspopulation share of national GST revenue in 2011-12, falling to just 33% in 2014-15.
However, this redistribution of GST revenue represents only a small fraction ofWestern Australia's total support for other States through the Commonwealth's overallrevenue raising and spending measures.
Many Commonwealth fiscal policies have the effect of redistributing resourcesbetween States. States with higher incomes and business profits contribute more tototal Commonwealth taxes, while those with younger and healthier populations, orbetter economic conditions, draw less on social security and health benefits.
The Department of Treasury annually estimates the net impact of this broaderredistribution by the Commonwealth on each State. Results using the latest availabledata (for 2009-10) are shown in the following table, together with the `GST only'redistribution for comparison purposes. (A positive figure for a State indicates that itmakes a net contribution to the Commonwealth.)
Table 7
NET REDISTRIBUTION OF RESOURCES
2009-10 (a)
GST only (b)
$m $ per capita
Total Resources
$m $ per capita
New South Wales 1,187 165 980 136
Victoria 1,091 198 -1,373 -250
Queensland 178 40 -1,222 -273
Western Australia 1,170 515 13,723 6,044
South Australia -998 -610 -5,974 -3,653
Tasmania -731 -1,445 -3,204 -6,336
Northern Territory -1,897 -8,321 -2,931 -12,858
Total 0 0 0 0
(a) All Commonwealth outlays and revenue relating to the Australian Capital Territory (ACT) are allocated to the otherStates according to population shares. This recognises that the ACT would be unlikely to exist as a separate entity ifthe federation dissolved.
(b) Difference between estimated GST revenue raised from economic activity in each State and GST grants paid to theState.
Source: Department of Treasury estimates, using a range of data sources including the Commonwealth Final BudgetOutcome publications and Australian Bureau of Statistics publication 5220.0. Results are based on the latestavailable data. Some data has been proxied by escalating earlier data using relevant economic indicators.
86
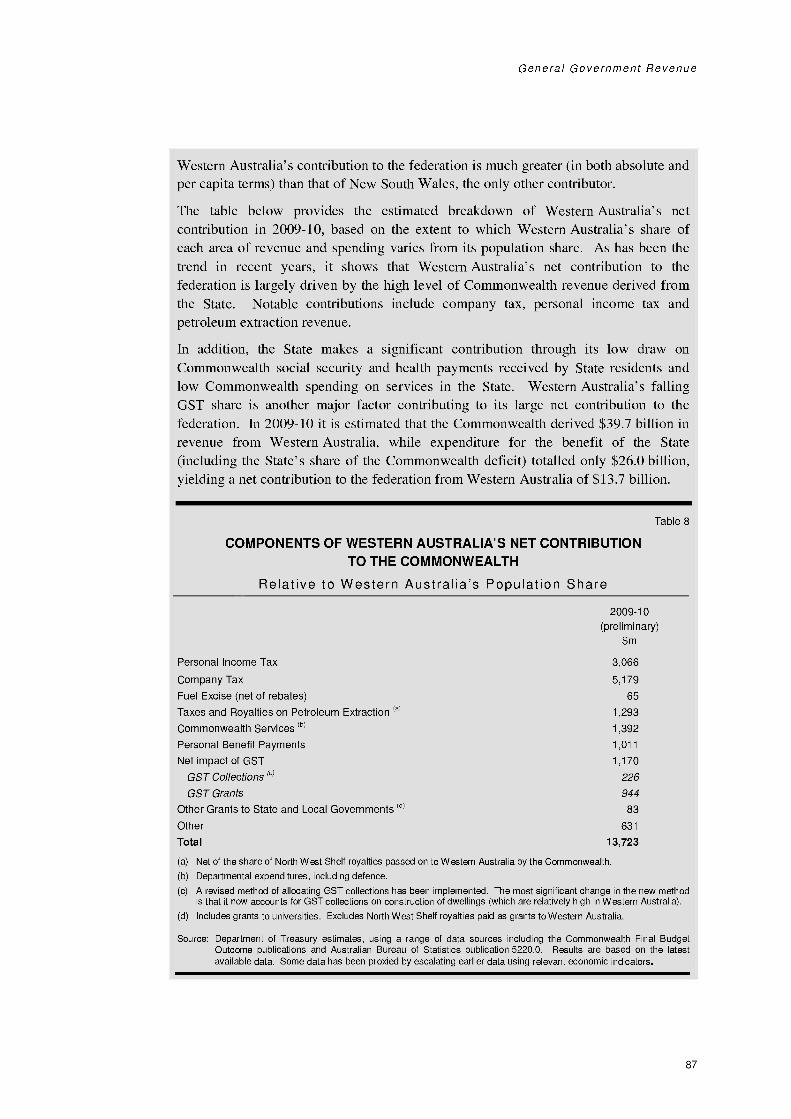
General Government Revenue
Western Australia's contribution to the federation is much greater (in both absolute andper capita terms) than that of New South Wales, the only other contributor.
The table below provides the estimated breakdown of Western Australia's netcontribution in 2009-10, based on the extent to which Western Australia's share ofeach area of revenue and spending varies from its population share. As has been thetrend in recent years, it shows that Western Australia's net contribution to thefederation is largely driven by the high level of Commonwealth revenue derived fromthe State. Notable contributions include company tax, personal income tax andpetroleum extraction revenue.
In addition, the State makes a significant contribution through its low draw onCommonwealth social security and health payments received by State residents andlow Commonwealth spending on services in the State. Western Australia's fallingGST share is another major factor contributing to its large net contribution to thefederation. In 2009-10 it is estimated that the Commonwealth derived $39.7 billion inrevenue from Western Australia, while expenditure for the benefit of the State(including the State's share of the Commonwealth deficit) totalled only $26.0 billion,yielding a net contribution to the federation from Western Australia of $13.7 billion.
Table 8
COMPONENTS OF WESTERN AUSTRALIA'S NET CONTRIBUTIONTO THE COMMONWEALTH
Relative to Western Australia's Population Share
2009-10(preliminary)
$m
Personal Income Tax 3,066
Company Tax 5,179
Fuel Excise (net of rebates) 65
Taxes and Royalties on Petroleum Extraction (a) 1,293
Commonwealth Services (b) 1,392
Personal Benefit Payments 1,011
Net impact of GST 1,170
GST Collections (') 226
GST Grants 944
Other Grants to State and Local Governments (d) -83
Other 631
Total 13,723
(a) Net of the share of North West Shelf royalties passed on to Western Australia by the Commonwealth.
(b) Departmental expenditures, including defence.
(c) A revised method of allocating GST collections has been implemented. The most significant change in the new methodis that it now accounts for GST collections on construction of dwellings (which are relatively high in Western Australia).
(d) Includes grants to universities. Excludes North West Shelf royalties paid as grants to Western Australia.
Source: Department of Treasury estimates, using a range of data sources including the Commonwealth Final BudgetOutcome publications and Australian Bureau of Statistics publication 5220.0. Results are based on the latestavailable data. Some data has been proxied by escalating earlier data using relevant economic indicators.
87
2011-12 Economic and Fiscal Outlook
Payments for Specific Purposes
PSPs are grants from the Commonwealth to the States for specific activities. Under majorreforms agreed by COAG (effective from 1 January 2009), they comprise NationalSpecific Purpose Payments (NSPPs), National Partnership (NP) payments, and certainother payments.
There are five NSPPs, for health (easily the largest), school education, vocationaleducation and training, disability services, and housing. These payments are ongoing,and comprise an estimated $2.1 billion for Western Australia in 2011-12. They growin line with agreed indexation arrangements. No conditions are attached other thanthe requirement to spend the payments in the relevant sector.
There are many NPs. Together with some minor Commonwealth own purposeoutlays paid to the State, they comprise an estimated $3 billion for Western Australiain 2011-12, including funding from the NP on Improving Public Hospital Servicessigned in conjunction with the Heads of Agreement on National Health Reform inFebruary 2011. NPs are generally time limited and funding to States is usuallycontingent on the achievement of milestones or targets.
In 2011-12, Western Australia expects to receive around $4 billion in PSPs 'to' the State,a decrease of 1.2% compared with 2010-11. This is largely due to lower grants providedunder the Commonwealth's Nation Building and Jobs Plan stimulus program($599 million for 2010-11, declining to $60 million in 2011-12).
Over the outyears, PSPs 'to' the State are projected to decrease by an average of0.1% per annum, as existing NPs (including stimulus programs) expire.
PSPs that pass 'through' the State's accounts (e.g. funding for local governments andprivate schools) are expected to decline by 16.5% in 2011-12, but increase by an averageof 7.6% over the outyears. The decrease in 2011-12 mainly reflects reduced funding fornon-government schools due to the unwinding of the Commonwealth's Building theEducation Revolution stimulus program.
88
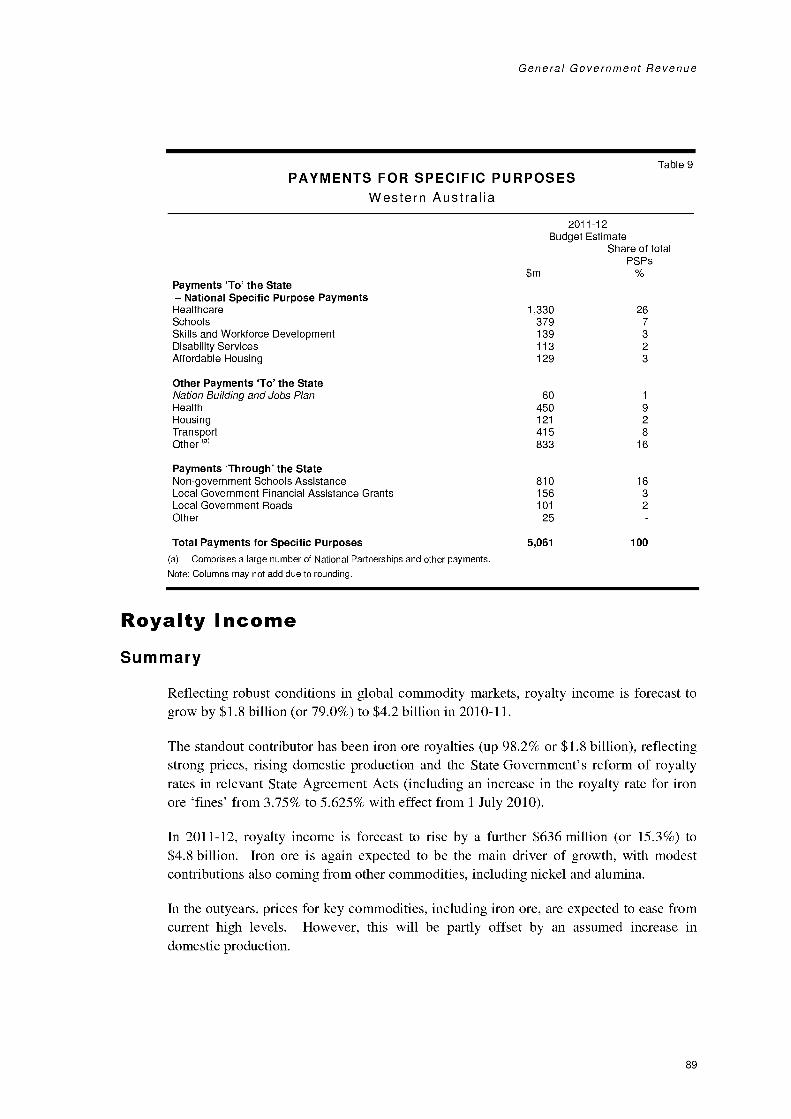
General Government Revenue
Table 9PAYMENTS FOR SPECIFIC PURPOSES
Western Australia
Payments 'To' the StateNational Specific Purpose Payments
2011-12Budget Estimate
Share of totalPSPs
$m
Healthcare 1,330 26Schools 379 7Skills and Workforce Development 139 3Disability Services 113 2Affordable Housing 129 3
Other Payments 'To' the StateNation Building and Jobs Plan 60 1
Health 450 9Housing 121 2Transport 415 8Other (a) 833 16
Payments 'Through' the StateNon-government Schools Assistance 810 16Local Government Financial Assistance Grants 156 3Local Government Roads 101 2Other 25
Total Payments for Specific Purposes 5,061 100
(a) Comprises a large number of National Partnerships and other payments.
Note: Columns may not add due to rounding.
Royalty IncomeSummary
Reflecting robust conditions in global commodity markets, royalty income is forecast togrow by $1.8 billion (or 79.0%) to $4.2 billion in 2010-11.
The standout contributor has been iron ore royalties (up 98.2% or $1.8 billion), reflectingstrong prices, rising domestic production and the State Government's reform of royaltyrates in relevant State Agreement Acts (including an increase in the royalty rate for ironore 'fines' from 3.75% to 5.625% with effect from 1 July 2010).
In 2011-12, royalty income is forecast to rise by a further $636 million (or 15.3%) to$4.8 billion. Iron ore is again expected to be the main driver of growth, with modestcontributions also coming from other commodities, including nickel and alumina.
In the outyears, prices for key commodities, including iron ore, are expected to ease fromcurrent high levels. However, this will be partly offset by an assumed increase indomestic production.
89
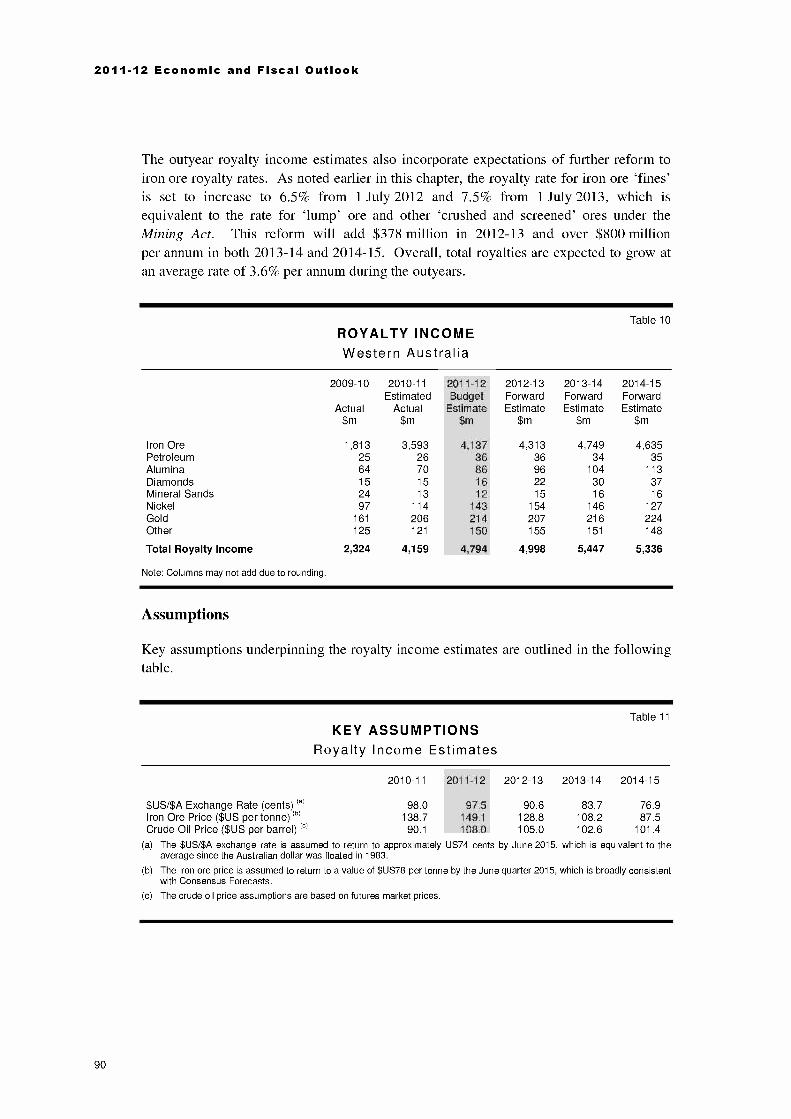
2011-12 Economic and Fiscal Outlook
The outyear royalty income estimates also incorporate expectations of further reform toiron ore royalty rates. As noted earlier in this chapter, the royalty rate for iron ore 'fines'is set to increase to 6.5% from 1 July 2012 and 7.5% from 1 July 2013, which isequivalent to the rate for 'lump' ore and other 'crushed and screened' ores under theMining Act. This reform will add $378 million in 2012-13 and over $800 millionper annum in both 2013-14 and 2014-15. Overall, total royalties are expected to grow atan average rate of 3.6% per annum during the outyears.
Table 10ROYALTY INCOMEWestern Australia
2009-10
Actual$m
2010-11Estimated
Actual$m
2011-12Budget
Estimate$m
2012-13ForwardEstimate
$m
2013-14ForwardEstimate
$m
2014-15ForwardEstimate
$m
Iron Ore 1,813 3,593 4,137 4,313 4,749 4,635Petroleum 25 26 36 36 34 35Alumina 64 70 86 96 104 113Diamonds 15 15 16 22 30 37Mineral Sands 24 13 12 15 16 16Nickel 97 114 143 154 146 127Gold 161 206 214 207 216 224Other 125 121 150 155 151 148
Total Royalty Income 2,324 4,159 4,794 4,998 5,447 5,336
Note: Columns may not add due to rounding.
Assumptions
Key assumptions underpinning the royalty income estimates are outlined in the followingtable.
Table 11
KEY ASSUMPTIONSRoyalty Income Estimates
2010-11 2011-12 2012-13 2013-14 2014-15
$US/$A Exchange Rate (cents) (a) 98.0 97.5 90.6 83.7 76.9Iron Ore Price ($US per tonne) (b) 138.7 149.1 128.8 108.2 87.5Crude Oil Price ($US per barrel) (e) 90.1 108.0 105.0 102.6 101.4
(a) The $US/$A exchange rate is assumed to return to approximately US74 cents by June 2015, which is equivalent to theaverage since the Australian dollar was floated in 1983.
(b) The iron ore price is assumed to return to a value of $US78 per tonne by the June quarter 2015, which is broadly consistentwith Consensus Forecasts.
(c) The crude oil price assumptions are based on futures market prices.
90
General Government Revenue
The mining production estimates that underpin the royalty income forecasts are guided bya confidential survey undertaken by the Department of Mines and Petroleum. Only thosenew mining projects or project expansions assessed as having a strong likelihood ofproceeding have been included in the estimates (in most cases this will involve the newproject or project expansion having received both final investment approval by thecompany and formal government approvals).
Detail
Iron ore
Iron ore royalties are forecast to grow by 98.2% or $1.8 billion in 2010-11. Growth hasbeen driven by a combination of factors, including a sharp rise in prices, higher domesticproduction, and the State Government's reform of State Agreement Acts, which hasincluded an increase in the royalty rate for iron ore 'fines' from 3.75% to 5.625% witheffect from 1 July 2010. Total iron ore royalties are expected to reach $3.6 billion thehighest on record and 10 times higher than a decade ago (see chart below).
Iron ore prices have been exceptionally strong in 2010-11, reflecting robust demand fromdeveloping and emerging economies (including China) and a comparatively limitedsupply response by global producers. This has induced a significant investment response,both domestically and overseas, which will eventually see a moderation in prices fromcurrent elevated levels. In this budget, the price of iron ore 'fines' 7 is projected to fallfrom $U5149.1 per tonne in 2011-12 to $US87.5 per tonne by the end of the budgetperiod (which is broadly consistent with projections by other analysts). Conversely,iron ore production in Western Australia is assumed to grow by 27% over the budgetperiod, from 445 Mt in 2011-12 to 565 Mt in 2014-15.
The iron ore royalty estimates in this budget also reflect the State Government's intentionto pursue further reform of royalty rates. This will see the royalty rate for iron ore 'fines'increasing to 6.5% in 2012-13 and 7.5% in 2013-14, which is equivalent to the existingrate for 'lump' ore (see the Revenue Measures section for more detail). The effect of thisreform will be to boost royalties by $378 million in 2012-13 and by more than$800 million per annum in the last two years of the budget period.
Overall, iron ore royalties are expected to grow by $544 million (or 15.1%) in 2011-12.Iron ore royalties are expected to increase further in 2012-13 and 2013-14, largely due tothe assumed increase in royalty rates. However, royalties are projected to contractslightly in 2014-15, with higher iron ore shipments being offset by an assumedmoderation in prices.
7 Based on a purity of 62% in 'free on board' terms.
91

2011-12 Economic and Fiscal Outlook
5
4
3
2
1
0
1994-95
IRON ORE ROYALTIESWestern Australia
$ Billion
Figure 7
ForecastUnderlying royalties Policy impact(a)
in 1-11In n1998-99 2002-03 2006-07 2010-11 2014-15
(a) Reflects the cumulative effect of iron ore royalty rate changes, including an increase in the iron ore 'fines' rate to 5.625%from 1 July 2010, 6.5% from 1 July 2012 and 7.5% from 1 July 2013.
Although growth in iron ore royalties has provided a significant boost to Stategovernment revenue, it must be considered in the broader context of Australia's system ofCommonwealth-State financial relations. In the longer term, approximately 70% of theseroyalties will be redistributed to other States and Territories (in the form of reducedGST grants). This is due to the principle of 'fiscal equalisation', which is applied by theCGC in making recommendations about Western Australia's share of national GSTrevenue. The CGC process and the GST forecasts are discussed in the CommonwealthGrants section above.
Petroleum
Petroleum royalties are forecast to grow by $10 million (or 39.1%) in 2011-12, primarilyreflecting strong growth in energy prices.
Across the outyears, petroleum royalties are projected to decrease slightly, with highprices being offset by declining output from existing on-shore oil and gas fields.
Alumina
Alumina royalties are forecast to grow by $15 million (or 21.9%) in 2011-12, supportedby higher prices and a moderate increase in production. These factors are also expectedto underpin strong growth of 9.6% per annum in the outyears.
92
General Government Revenue
Diamonds
Diamond royalties are expected to total $16 million in 2011-12, a slight increase on theestimated actual in 2010-11. Growth in diamond royalties is expected to accelerate in theoutyears, buoyed by the underground development at the Argyle diamond mineBy 2014-15, diamond royalties are projected to reach $37 million
Mineral Sands
In 2010-11, royalties from mineral sands are expected to decline by $11 million(or 45.2%), partly reflecting a decline in production, particularly for leucoxene, rutile andzircon. However, mineral sands royalties are forecast to increase over the budget period,rising from an estimated $12 million in 2011-12 to $16 million in 2014-15.
Nickel
Nickel royalties are forecast to grow by $30 million (or 26.0%) to $143 million in2011-12. This largely reflects an assumed increase in nickel output, including from theRavensthorpe nickel mine
After a further increase in 2012-13, nickel royalties are projected to contract in both2013-14 and 2014-15, reflecting an assumed moderation in prices and a decline indomestic production.
Gold
The gold price has been trading at close to record highs, partly reflecting concerns aboutthe global economic recovery and gold's traditional role as a 'safe haven' investment.With domestic output also increasing at a solid pace, gold royalties are expected to growby $45 million (or 27.8%) to $206 million in 2010-11.
The price of gold is assumed to remain at high levels in 2011-12 and over the forwardestimates period. However, gold production is expected to moderate due to a decline inoutput from existing gold operations. Consequently, gold royalties are forecast to growby a more moderate $8 million (or 3.7%) in 2011-12, and by an average of1.5% per annum across the outyears.
93
2011-12 Economic and Fiscal Outlook
Other Revenue
Sales of Goods and Services
Sales of goods and services are forecast to increase by $97 million (or 5.6%) in 2011-12.Excluding the introduction of the building services levy the increase is just below 5.0%8.Across the outyears, goods and services revenue is forecast to grow by between 4.9% and5.1% per annum. This reflects the effect of population and economic growth on demandfor State government goods and services.
Interest Income
Revenue from interest earning investments, including cash and other liquid financialassets, is projected to be $355 million in 2011-12. This represents a $46 million(or 14.8%) increase on the expected actual for 2010-11, and mainly reflects the impact ofhigher interest rates.
Interest revenue across the outyears is forecast to remain broadly unchanged reflectingmodest movements in interest earning investment balances and anticipated interest rateson those balances.
Revenue from Public Corporations
The State's major public corporations are liable for income tax equivalent and dividendpayments to the State9. A number of these public corporations are also liable for localgovernment rate equivalent payments.
Revenue from public corporations in 2011-12 is estimated to be $1.1 billion, comprising$699 million in dividends, $437 million in income tax equivalent payments and$13 million in local government rate equivalent payments. This is an increase of$93 million (or 8.9%) from the estimated actual for 2010-11.
Across the outyears, revenue from public corporations is forecast to grow at an averagerate of 19.7% per annum, mainly reflecting:
changes to revenue earned by Western Power as a result of the Economic RegulationAuthority's approval to change the treatment of capital contributions (which has theeffect of increasing network tariff revenue);
higher profitability for Verve Energy, driven by higher prices under its contracts forelectricity supply, lower coal costs due to new supply arrangements, and reducedinterest costs as a result of earlier than expected repayment of debt;
8 The building services levy forms part of the reform to the building regulation system. This includes the transfer of the functions ofthe Builder's Registration Board, the Painter's Registration Board, the Building Disputes Tribunal and the Building IndustryDevelopment group into the Department of Commerce's Building Commission Division. As part of the restructure, the levy willbe implemented to fund operations of the Building Commission Division and will be calculated on a percentage of buildingapproval values for government and non-government buildings.
9 Tax and local government rate equivalents are levied by the State to ensure competitive neutrality between significant governmentbusiness activities and private sector businesses.
94
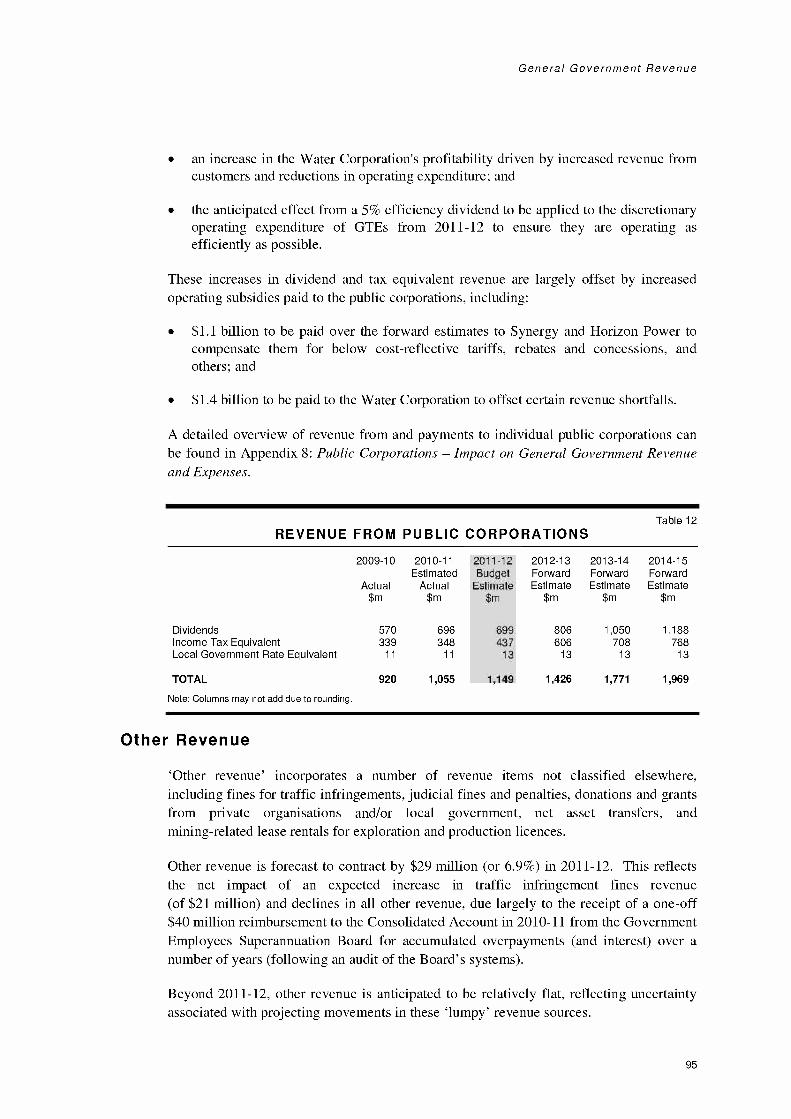
General Government Revenue
an increase in the Water Corporation's profitability driven by increased revenue fromcustomers and reductions in operating expenditure; and
the anticipated effect from a 5% efficiency dividend to be applied to the discretionaryoperating expenditure of GTEs from 2011-12 to ensure they are operating asefficiently as possible.
These increases in dividend and tax equivalent revenue are largely offset by increasedoperating subsidies paid to the public corporations, including:
$1.1 billion to be paid over the forward estimates to Synergy and Horizon Power tocompensate them for below cost-reflective tariffs, rebates and concessions, andothers; and
$1.4 billion to be paid to the Water Corporation to offset certain revenue shortfalls.
A detailed overview of revenue from and payments to individual public corporations canbe found in Appendix 8: Public Corporations Impact on General Government Revenueand Expenses.
Table 12REVENUE FROM PUBLIC CORPORATIONS
2009-10 2010-11 2011-12 2012-13 2013-14 2014-15Estimated Budget Forward Forward Forward
Actual Actual Estimate Estimate Estimate Estimate$m $m $m $m $m $m
Dividends 570 696 699 806 1,050 1,188Income Tax Equivalent 339 348 437 606 708 768Local Government Rate Equivalent 11 11 13 13 13 13
TOTAL 920 1,055 1,149 1,426 1,771 1,969
Note: Columns may not add due to rounding.
Other Revenue
`Other revenue' incorporates a number of revenue items not classified elsewhere,including fines for traffic infringements, judicial fines and penalties, donations and grantsfrom private organisations and/or local government, net asset transfers, andmining-related lease rentals for exploration and production licences.
Other revenue is forecast to contract by $29 million (or 6.9%) in 2011-12. This reflectsthe net impact of an expected increase in traffic infringement fines revenue(of $21 million) and declines in all other revenue, due largely to the receipt of a one-off$40 million reimbursement to the Consolidated Account in 2010-11 from the GovernmentEmployees Superannuation Board for accumulated overpayments (and interest) over anumber of years (following an audit of the Board's systems).
Beyond 2011-12, other revenue is anticipated to be relatively flat, reflecting uncertaintyassociated with projecting movements in these 'lumpy' revenue sources.
95
2011-12 Economic and Fiscal Outlook
TAX AND ROYALTY EXPENDITURE STATEMENT
What is a tax or royalty expenditure?
Tax and royalty expenditure includes revenue forgone by government, and financialbenefits to taxpayers, from exemptions and other concessions that depart from thegeneral tax or royalty treatment. It is 'expenditure' in the sense that the impact on thebudget is similar to direct outlays, and can be used to achieve similar goals asexpenditure programs.
Labelling an exemption or concession as a tax or royalty expenditure does notnecessarily imply any judgement about its appropriateness. Rather, it makes theamount of the exemption or concession explicit, and thereby facilitates scrutiny as partof the annual budget process (including review of whether the exemption or concessionis still effective in achieving any specific objective originally intended).
Measuring tax and royalty expenditure
Measuring a tax or royalty expenditure requires identification of:
a benchmark tax or royalty base and rate; and
concessionary tax treatment of components of the benchmark tax or royalty base(e.g. a concession or exemption for a particular industry, activity or class oftaxpayer).
Identification of benchmark revenue bases and rates requires a degree of judgement.Furthermore, data limitations mean that the tax and royalty expenditures identified inthis statement are only approximations (data sources and methods used for estimatingthis expenditure are also subject to review each year).
This statement is not exhaustive. For example, it does not include estimates of revenueforgone from exemptions provided to charities, religious organisations or governmentagencies. Very small exemptions or concessions are also excluded.
This year's statement includes actual outcomes for 2009-10 and estimates for 2010-11.
96
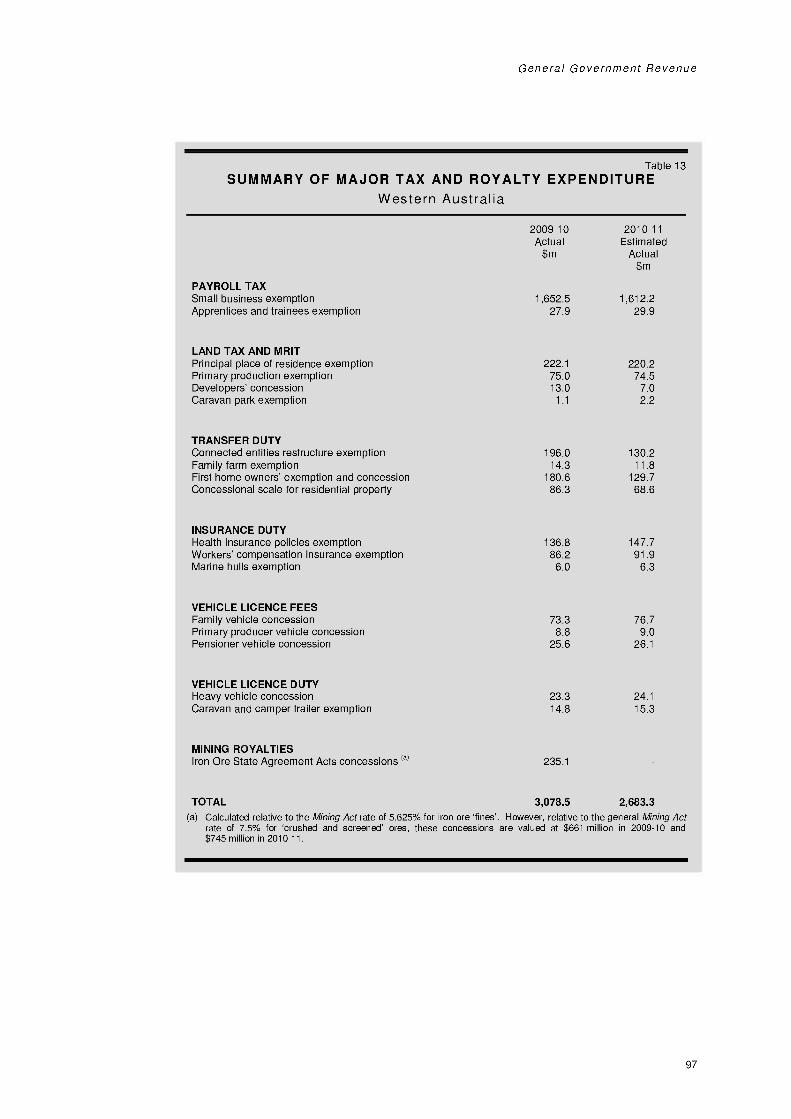
General Government Revenue
Table 13SUMMARY OF MAJOR TAX AND ROYALTY EXPENDITURE
Western Australia
PAYROLL TAX
2009-10Actual
$m
2010-11Estimated
Actual$m
Small business exemption 1,652.5 1,612.2Apprentices and trainees exemption 27.9 29.9
LAND TAX AND MRITPrincipal place of residence exemption 222.1 220.2Primary production exemption 75.0 74.5Developers' concession 13.0 7.0Caravan park exemption 1.1 2.2
TRANSFER DUTYConnected entities restructure exemption 196.0 130.2Family farm exemption 14.3 11.8First home owners' exemption and concession 180.6 129.7Concessional scale for residential property 86.3 68.6
INSURANCE DUTYHealth insurance policies exemption 136.8 147.7Workers' compensation insurance exemption 86.2 91.9Marine hulls exemption 6.0 6.3
VEHICLE LICENCE FEESFamily vehicle concession 73.3 76.7Primary producer vehicle concession 8.8 9.0Pensioner vehicle concession 25.6 26.1
VEHICLE LICENCE DUTYHeavy vehicle concession 23.3 24.1Caravan and camper trailer exemption 14.8 15.3
MINING ROYALTIESIron Ore State Agreement Acts concessions (a) 235.1
TOTAL 3,078.5 2,683.3(a) Calculated relative to the Mining Act rate of 5.625% for iron ore 'fines'. However, relative to the general Mining Act
rate of 7.5% for 'crushed and screened' ores, these concessions are valued at $661 million in 2009-10 and$745 million in 2010-11.
97
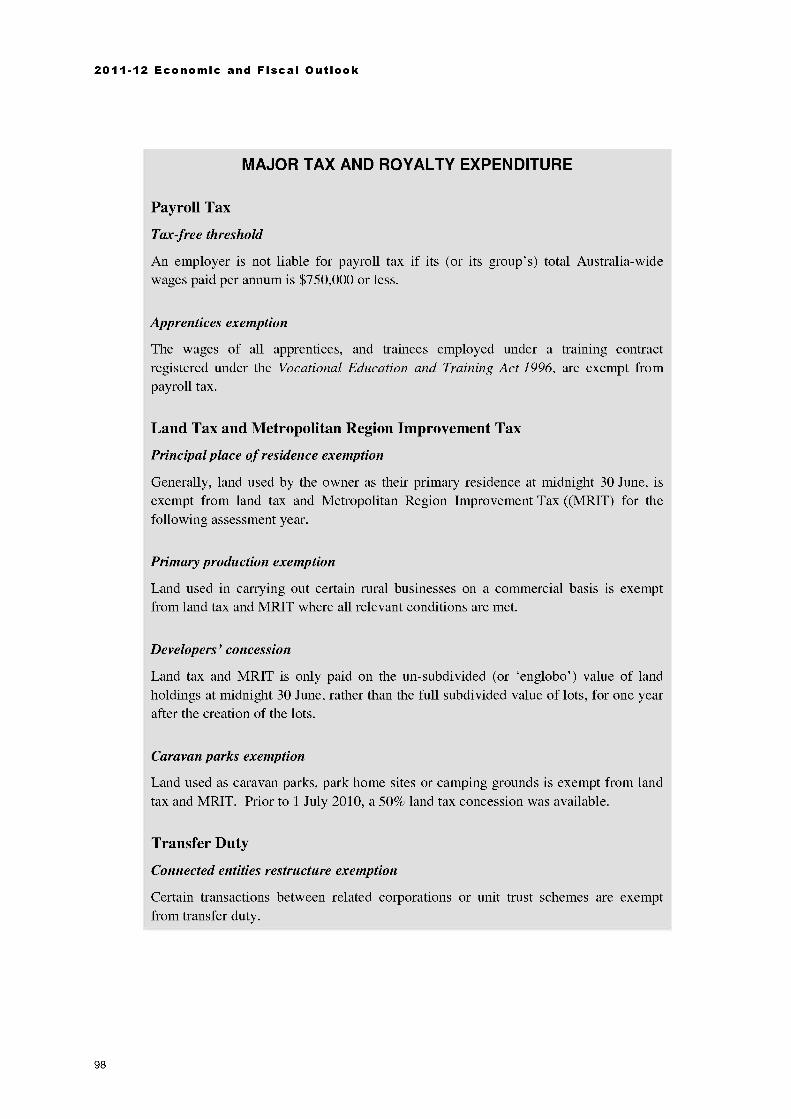
2011-12 Economic and Fiscal Outlook
MAJOR TAX AND ROYALTY EXPENDITURE
Payroll Tax
Tax-free threshold
An employer is not liable for payroll tax if its (or its group's) total Australia-widewages paid per annum is $750,000 or less.
Apprentices exemption
The wages of all apprentices, and trainees employed under a training contractregistered under the Vocational Education and Training Act 1996, are exempt frompayroll tax.
Land Tax and Metropolitan Region Improvement Tax
Principal place of residence exemption
Generally, land used by the owner as their primary residence at midnight 30 June, isexempt from land tax and Metropolitan Region Improvement Tax ((MRIT) for thefollowing assessment year.
Primary production exemption
Land used in carrying out certain rural businesses on a commercial basis is exemptfrom land tax and MRIT where all relevant conditions are met.
Developers' concession
Land tax and MRIT is only paid on the un-subdivided (or `englobo') value of landholdings at midnight 30 June, rather than the full subdivided value of lots, for one yearafter the creation of the lots.
Caravan parks exemption
Land used as caravan parks, park home sites or camping grounds is exempt from landtax and MRIT. Prior to 1 July 2010, a 50% land tax concession was available.
Transfer Duty
Connected entities restructure exemption
Certain transactions between related corporations or unit trust schemes are exemptfrom transfer duty.
98
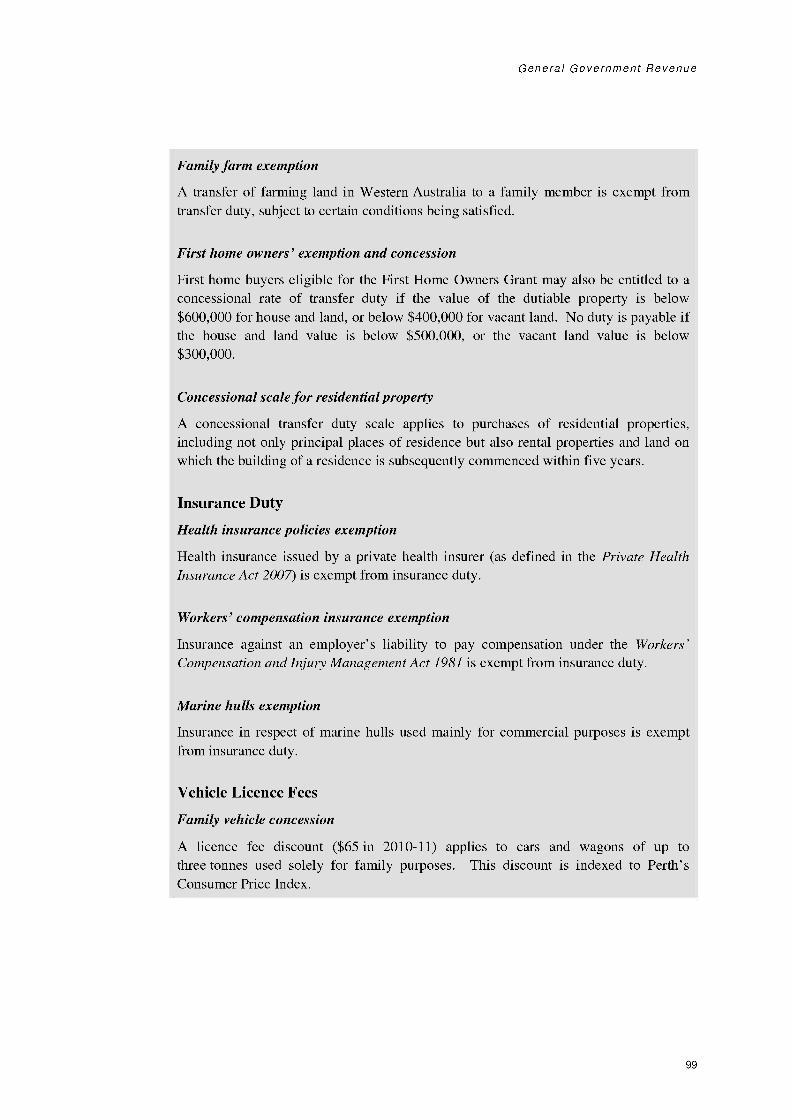
General Government Revenue
Family farm exemption
A transfer of farming land in Western Australia to a family member is exempt fromtransfer duty, subject to certain conditions being satisfied.
First home owners' exemption and concession
First home buyers eligible for the First Home Owners Grant may also be entitled to aconcessional rate of transfer duty if the value of the dutiable property is below$600,000 for house and land, or below $400,000 for vacant land. No duty is payable ifthe house and land value is below $500,000, or the vacant land value is below$300,000.
Concessional scale for residential property
A concessional transfer duty scale applies to purchases of residential properties,including not only principal places of residence but also rental properties and land onwhich the building of a residence is subsequently commenced within five years.
Insurance Duty
Health insurance policies exemption
Health insurance issued by a private health insurer (as defined in the Private HealthInsurance Act 2007) is exempt from insurance duty.
Workers' compensation insurance exemption
Insurance against an employer's liability to pay compensation under the Workers'Compensation and Injury Management Act 1981 is exempt from insurance duty.
Marine hulls exemption
Insurance in respect of marine hulls used mainly for commercial purposes is exemptfrom insurance duty.
Vehicle Licence Fees
Family vehicle concession
A licence fee discount ($65 in 2010-11) applies to cars and wagons of up tothree tonnes used solely for family purposes. This discount is indexed to Perth'sConsumer Price Index.
99

2011-12 Economic and Fiscal Outlook
Primary producer vehicle concession
Vehicles used by farmers or graziers principally on their farm, and vehicles used bybeekeepers, kangaroo hunters, prospectors and sandalwood pullers solely or principallyin the course of their occupation, are entitled to a 50% vehicle licence fee concession.
Pensioner vehicle concession
A 50% concession on vehicle licence fees is available to holders of a Centre linkPensioner Concession Card or Veterans' Affairs Pensioner Concession Card, andseniors who hold both a State Seniors Card and a Commonwealth Seniors Health Card.
Vehicle Licence Duty
Heavy vehicle concession
Transfers of heavy vehicle licences are subject to a single flat duty rate (currently 3%)and a maximum duty amount (of $12,000) rather than the progressive rate scale thatapplies to light vehicles.
Caravan and camper trailers exemption
Caravans and camper trailers that are permanently fitted for human habitation areexempt from vehicle licence duty.
Royalty income
Iron Ore State Agreement Acts concessions
Previously, State Agreement Acts included a concessional royalty rate of 3.75% foriron ore 'fines' and 3.25% for beneficiated ore. From 1 July 2010, the current rates inthe Mining Regulations apply (5.625% for fine ore and 5% for beneficiated ore),achieving consistency across all iron ore producers. The current 5.625% rate for`fines' ore is regarded as a transitional rate towards the full rate of 7.5% that applies to`crushed and screened' ores.
Notable changes in tax and royalty expenditure
Notable movements in the value of specific tax and royalty expenditure between2009-10 (actual) and 2010-11 (estimated) include:
a decrease of 45.9% (or $6 million) in the value of the developers' land tax andMRIT concession, largely due to subdued residential housing activity;
an increase of 105.5% (or $1 million) in the value of the caravan park land tax andMRIT concession, due to the change in the then 50% concession to a100% exemption from 1 July 2010;
100
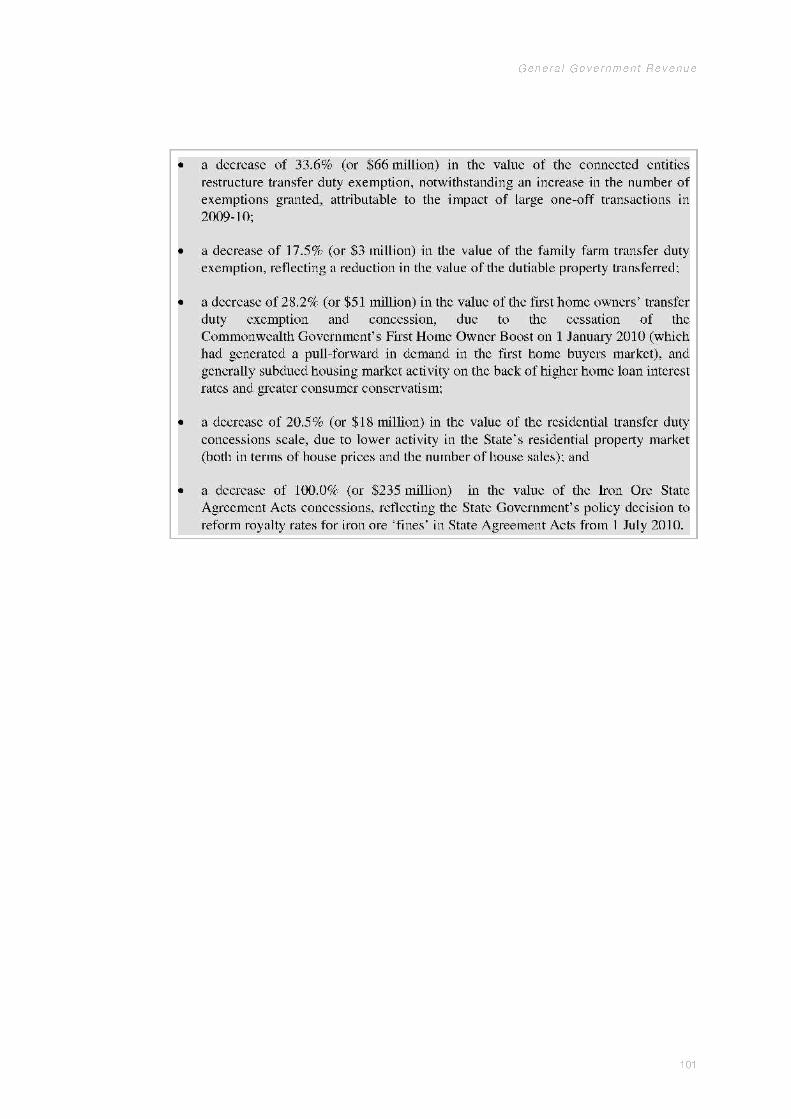
General Government Revenue
a decrease of 33.6% (or $66 million) in the value of the connected entitiesrestructure transfer duty exemption, notwithstanding an increase in the number ofexemptions granted, attributable to the impact of large one-off transactions in2009-10;
a decrease of 17.5% (or $3 million) in the value of the family farm transfer dutyexemption, reflecting a reduction in the value of the dutiable property transferred;
a decrease of 28.2% (or $51 million) in the value of the first home owners' transferduty exemption and concession, due to the cessation of theCommonwealth Government's First Home Owner Boost on 1 January 2010 (whichhad generated a pull-forward in demand in the first home buyers market), andgenerally subdued housing market activity on the back of higher home loan interestrates and greater consumer conservatism;
a decrease of 20.5% (or $18 million) in the value of the residential transfer dutyconcessions scale, due to lower activity in the State's residential property market(both in terms of house prices and the number of house sales); and
a decrease of 100.0% (or $235 million) in the value of the Iron Ore StateAgreement Acts concessions, reflecting the State Government's policy decision toreform royalty rates for iron ore 'fines' in State Agreement Acts from 1 July 2010.
101

2011-12 Economic and Fiscal Outlook
102

CHAPTER 5
General Government Expenses
Overview
In 2011-12, general government expenses are budgeted to increase by $1.8 billion or7.9%, to $24.8 billion. Targeted spending increases in the key service delivery areas ofhealth, education, and law and order account for $766 million or 42% of the total increasein general government expenses in 2011-12.
The Government continues to pay close attention to growth in general governmentexpenses. This budget builds on previous measures implemented by this Government(including the 3% efficiency dividend, a ceiling on the number of full-time equivalentpublic servants, and a very clear and fair public sector wages policy), by funding a further400 voluntary separations in 2011-12 and targeting $300 million across the forwardestimates period in savings from general government programs and activities that nolonger provide value for money.
At the same time, the 2011-12 State Budget seeks to support our community throughtargeted spending to deliver quality services for all Western Australians. Key initiativesinclude the following.
Supporting Our Community Targeting Spending to DeliverQuality Services for All Western Australians
Sustainable Funding and Contracting with the Not-For-Profit Sector
The Government is committed to improving services and support for disadvantaged andvulnerable people in the Western Australian community by building the capacity of thenot-for-profit (NFP) to improve the welfare and wellbeing of the people for whom theycare.
103
2011-12 Economic and Fiscal Outlook
The 2011-12 Budget includes additional expenditure of more than $600 million over theperiod to 2014-15, including $99 million in 2011-12, to support the development of asustainable NFP sector now and into the future, and to address historical fundingshortfalls that have emerged in service agreements with NFP organisations.This includes:
$491 million over the forward estimates period, including $88 million in 2011-12, tobring funding of the sector to a sustainable foundation. This represents an average25% increase in funding provided for human services contracts by 2014-15;
$96 million for indexation of their costs, recognising the ongoing growth in costsfaced by the NFP sector; and
$18 million for appropriate education, training and support to the public and NFPsectors for the roll-out of the additional funding and the implementation ofcontracting reforms.
Health
Spending on health services will increase to $6.2 billion in 2011-12, an increase of$470 million or 8.2% from 2010-11. The key health initiatives funded as part of thisbudget include:
an additional $363 million over five years from 2010-11, including $58 million in2011-12, to meet forecast health service needs including inpatient, emergencydepartment and outpatient activity. The continued implementation of activity basedfunding and management which promotes equity, transparency and efficiency inhealth, will assist in providing a sustainable health system;
$277.1 million over four years from 2010-11, including $52.7 million in 2011-12, ontargeted elective surgery, emergency department and sub-acute care initiatives;
$240 million over four years, including $42 3 million in 2011-12, from Royalties forRegions (RJR) to improve the level of access to regional health services; and
$74.2 million over five years from 2010-11, including $11 5 million in 2011-12, toemploy all graduating domestic junior doctors in Western Australia and provideadditional supervision and expand simulated learning and training environments.
Education
Relative to 2010-11, spending by the Department of Education is budgeted to increase by$185.6 million or 4.9% in 2011-12 to $4 billion. Key education-related spendinginitiatives in this budget include:
additional expenditure of $361 6 million over five years from 2010-11, including$149 1 million in 2011-12, to meet the anticipated costs associated with the2011 Teachers and Administrators Enterprise Bargaining Agreement, the ongoingimplementation of the Independent Public Schools initiative, and to place theDepartment of Education on a financially sustainable setting as it moves towards amore efficient and effective service delivery model;
104
General Government Expenses
additional expenditure of $78 million over five years from 2010-11, including$17 8 million in 2011-12, to fund growth in student numbers, including thosestudents with disabilities or learning difficulties and to support children of 457 visaholders with English as a Second Language programs;
additional expenditure of $23 2 million over four years from 2011-12 to support theincrease in costs associated with compulsory Year 12 examinations inWestern Australia; and
$7 5 million over two years from 2011-12 for the ongoing implementation of theNational Curriculum in Western Australia.
Child Protection
This budget provides for a $39.2 million or 8.8% increase in spending on child protectionand related services in 2011-12. Key initiatives include:
increased spending of $51 million over four years, including $12 2 million in2011-12, to ensure the safety of children and young people by responding toincreases in demand for core child protection services, increasing prevention andearly intervention programs for at-risk families and improving outcomes for childrenand young people in care;
additional spending of $20.5 million over four years, including $2 4 million in2011-12, for increases in indexation to NFP child protection sector organisations forthe continued delivery of services; and
as a direct result of discussions between the Premier and Western Australian Councilof Churches, $5 4 million has been allocated for the construction ($4 million) andoperation ($1 4 million) of an Acute Overnight Homeless Centre for Men in the cityarea.
Seniors
This budget significantly increases the Seniors Cost of Living Rebate at an estimated costof $40 million over the next four years. In 2011-12, the rebate increases to $150 forsingles (up from the current $104.80) and to $225 for couples (up from $157.22).The Government has also expanded access to the Seniors Card to seniors who work up to25 hours a week (up from the current limit of 20 hours) at a cost of $10.5 million
Law and Order
Spending by Western Australia Police and the Departments of Corrective Services and theAttorney General will increase by $110.9 million (or 5%) to $2.3 billion in 2011-12. Keyspending initiatives as part of this budget include:
an additional $22 million over four years to meet the recurrent costs associated withthe upgrade and replacement of Information and Communications Technology (ICT)software and hardware to ensure the ongoing provision of quality and timely policingservices;
105
2011-12 Economic and Fiscal Outlook
an additional $28.6 million over two years, including $20 6 million in 2011-12, tomeet the recurrent costs associated with hosting the Commonwealth Heads ofGovernment Meeting (CHOGM);
$10 2 million over three years on the operation of new work camps at Roebourne andGnowangerup, funded from RJR; and
additional expenditure of $11 6 million over four years to enable the Legal AidCommission to expand its duty lawyer service throughout the State and provideadditional grants of aid primarily for people defending criminal charges in theMagistrate's Court.
Building the State Investing Now to Keep the Growth GoingInto the Future
Labour Supply and Training
The Government is providing additional training places to ensure Western Australianshave the opportunity to contribute to and benefit from the next period of economicgrowth, and to help ensure industry has access to the skills needed for the future.
Spending by the Department of Training and Workforce Development (DTWD) willincrease by $62.5 million or 9% in 2011-12, to $758 million Key initiatives funded aspart of this budget include:
expenditure of $22 7 million in 2011-12 to provide 7,500 additional training places inareas of critical skill shortages, and a further $10 7 million in 2011-12 to provide4,546 additional training places to increase workforce participation. This growthmeans that the number of training places will rise from 134,000 in 2008 to 168,000in 2011; and
additional expenditure of $33 million over two years, as part of the RJR SkillsTraining Initiative, to develop skills and training initiatives in regionalWestern Australia.
In addition, the Government has launched the Western Australian Skilled MigrationStrategy to provide a strategic and coordinated plan for attracting migrants to the State,and will contribute $4 million over four years for the operation of SkilledMigration WA (within DTWD).
Events Funding
To expand Western Australia's events calendar, Tourism WA will receive an additional$60 million over the next four years to spend on sporting, arts and cultural, and uniquelyWestern Australian events. This includes $40 million from RJR for regional events.
106

General Government Expenses
Kimberley Science and Conservation Strategy
Recurrent expenditure totalling $37.4 million over four years% including $8 4 million in2011-12, has been approved for the Kimberley Science and ConservationStrategy (KSCS), to implement a suite of initiatives aimed at preserving the uniqueenvironmental and cultural values of the Kimberley. Key initiatives include:
$10 2 million over four years, including $3 million in 2011-12, in support funding tothe Western Australian Marine Science Institute for the study of the Kimberley'smarine environment and to the Integrated Marine Observation System for thedevelopment of data gathering moorings and related infrastructure in Kimberleywaters;
$9 million over four years, including $1.5 million in 2011-12, for the creation andmanagement of conservation reserve corridors linking key national parks, islands andlands through partnerships with pastoralists, non-government organisations andtraditional land owners;
$7 7 million over four years for the establishment and ongoing management of theCamden Sound and Eighty Mile Beach Marine Parks in the Kimberley;
$4 2 million over four years from RJR for the development and promotion of tourismcorridors across the Kimberley region including the upgrade and development of newcamping facilities;
$3 3 million over four years for two new recreational fishing initiatives in theKimberley and to monitor progress of the KSCS; and
$3 million over three years to enable baseline geochemical and geophysical surveysto be undertaken in the Kimberley basin.
Major Expense Changes by Portfolio
Summary
The following tables provide details of major changes in general government expenses byagency since the 2010-11 Mid-year Review was released in December 2010.This includes policy decisions made between the cut-off date for the mid-year review(1 December 2010) and the cut-off date for this budget (20 April 2011), and parameterchanges of a material nature affecting agency expenses (including issues such asvariations to Commonwealth-funded programs, higher cost and demand for governmentservices, depreciation, and the settlement of Enterprise Bargaining Agreements).
A further $4.1 million is to be used for infrastructure provision, discussed in Chapter 6: Asset Investment, with total spending onthis initiative totalling $41.4 million over four years.
107

2011-12 Economic and Fiscal Outlook
Changes related purely to timing are not included in this chapter as they are broadly netdebt neutral across the forward estimates period. Any material timing changes arediscussed in Chapter 3: Financial Projections and Fiscal Strategy. Changes in totalpublic sector infrastructure spending (i.e. the Asset Investment Program) are outlined inChapter 6: Asset Investment.
108

General Government Expenses
PREMIER; MINISTER FOR STATE DEVELOPMENT
Table 1
POLICY DECISIONS AND OTHER MAJOR CHANGES SINCE2010-11 MID-YEAR REVIEW
2010-11$m
2011-12$m
2012-13$m
2013-14$m
2014-15$m
Premier and CabinetIncreased Policy Capacity 2.3 2.7 2.7 2.7Community Development Investment Fund 10.0Donations and Support to Disaster Victims 1.2Kimberley Science and Conservation
Strategy 0.3 0.4 0.4 0.5Conservation Council of Western Australia 0.1
Public Sector CommissionAccountability, Governance and Integrity
Programs 1.1 1.1 0.8 0.8Western Australian Leadership Program 1.3 1.0 0.5 0.7Public Sector Improvement Initiatives 1.2 1.2 0.8 0.8Indigenous Employment Strategy 1.6 2.4 2.0 2.6Royalties for Regions Public Sector
Regional Leadership 0.7 0.7 1.0
State DevelopmentTransfer of Assets Associated with the
Royalties for Regions Ord-EastKimberley Expansion Project 71.1 77.1
Ashburton North Strategic Industrial Area 4.5 0.6 0.6 0.3Anketell Strategic Industrial Area 2.3 0.6 0.6 0.4CHOGM Investment Promotion Material 0.1 0.1
Premier and Cabinet
Increased Policy Capacity
A total of $10 5 million will be spent over four years to assist with the implementation ofthe Government's reform agenda as outlined in the Economic Audit Committeerecommendations and perform strategic reviews of the activities of key agencies.Strategic reviews are aimed at ensuring that agencies' service delivery is aligned with theGovernment's priorities. These contrast with value for money reviews, which are focusedon the efficiency of agencies' service delivery and the effectiveness of the outcomesachieved.
Community Development Investment Fund
A total of $10 million will be spent in 2011-12 to assist NFP sector organisations to buildfinancial sustainability and improve the delivery of human services in Western Australia.
109

2011-12 Economic and Fiscal Outlook
Donations and Support to Disaster Victims
In 2010-11, $1 2 million will be paid to the victims of a number of natural disasters inWestern Australia and Queensland. This includes a donation of $1 million to theQueensland Premier's Disaster Relief Appeal, $100,000 for the Carnarvon-Gascoynefloods, and $70,000 for the Lake Clifton bushfire.
Kimberley Science and Conservation Strategy
A total of $1 5 million will be spent over four years to progress the KSCS in conjunctionwith other agencies. The strategy is designed to protect the region's natural and culturalheritage while allowing the region to fulfil its economic potential. The additionalexpenditure will support cross-sector coordination projects, ensuring that opportunitiesfrom a coordinated approach to the challenges of economic development in a
`biodiversity hotspot' are realised, and that agencies work together to achieve optimumoutcomes.
Conservation Council of Western Australia
A grant of $100,000 will be paid in 2011-12 to assist the Conservation Council in itsadvocacy role on conservation issues and a sustainable Western Australia.
Public Sector Commission
Accountability, Governance and Integrity Programs
A total of $3 9 million will be spent over four years to assist with the implementation ofpublic sector reform processes. This incorporates the development of strategic policies,supporting guidelines and training for employing authorities and their employees onaccountability and integrity issues, including disciplinary investigations and publicinterest disclosures.
Western Australian Leadership Program
The Public Sector Commission will directly spend $3 5 million over four years tocontinue high quality leadership and management learning and development opportunitiesfor mid-level managers and Senior Executive Officers. Enhancements will be made toreporting capabilities of key systems to improve agency workforce management, identifyemerging leaders in the public sector and assist in creating a more flexible public sector tomeet government priorities.
110
General Government Expenses
Public Sector Improvement Initiatives
A total of $4 million will be spent over four years to expand workforce planning in thepublic sector, address critical workforce issues, and to better position the sector to meetemerging needs and challenges. This will be achieved through training of agency staff,development of guidelines and programs to assist agencies to respond to workforceattraction and retention issues, and implementation of an improved workforce datagathering and reporting system to support agency workforce planning
Indigenous Employment Strategy
A total of $8 6 million will be spent over four years on this strategy, which aims toincrease the representation of Indigenous Australians in the public sector workforce.A target for the employment of Indigenous people in the public sector to reach 3.2% ofthe total workforce by 2015 has been set for Western Australia. The expenditure will seean additional 163 trainees in the workforce. The strategy will be implemented through theestablishment of a centrally coordinated and funded traineeship program available to allage groups, which encompasses an integrated employment, training, support andplacement service.
Royalties for Regions Public Sector Regional Leadership
A total of $2.4 million will be spent from 2011-12 to 2013-14 on initiatives to expand thePublic Sector Commission's interaction with public sector bodies in regionalWestern Australia. This will be achieved through the provision of a range of learning anddevelopment opportunities, business and workforce planning initiatives, and employmentservices to regional Western Australia.
State Development
Transfer of Assets Associated with the Royalties for Regions Ord-EastKimberley Expansion Project
Operating expenses incurred by the Department will increase by a total of $148 2 millionbetween 2011-12 and 2012-13, representing the transfer of road and irrigation assetsassociated with the RJR Ord-East Kimberley Expansion Project from the Department ofState Development to a non-government cooperative and the Shire of Wyndham EastKimberley.
Ashburton North Strategic Industrial Area
A total of $6 million will be spent over four years to facilitate the development ofcommon user infrastructure at the proposed Ashburton North Strategic Industrial Areaand port, including negotiation of State Development Agreements and native titlearrangements, land planning and environmental studies and the development of socialinfrastructure proposals.
111
2011-12 Economic and Fiscal Outlook
Anketell Strategic Industrial Area
A total of $3 8 million will be spent over four years to facilitate the development ofcommon user infrastructure at the proposed Anketell Strategic Industrial Area and port.The expenditure will cover the development of a social management plan, legal expensesfor the negotiation of State Development Agreements, land planning and environmentalstudies.
Commonwealth Heads of Government Meeting Investment PromotionMaterial
Additional expenditure totalling $160,000 over two years, commencing in 2010-11, willbe incurred to develop a suite of publication materials to promote Western Australia'sattractiveness as an investment destination, potential trading partner and base forcorporate operations.
112
General Government Expenses
DEPUTY PREMIER; MINISTER FOR HEALTH; TOURISM
Table 2POLICY DECISIONS AND OTHER MAJOR CHANGES SINCE
2010-11 MID-YEAR REVIEW
WA Health
2010-11$m
2011-12$m
2012-13$m
2013-14$m
2014-15$m
Junior Doctors Training 2.8 11.5 15.0 22.6 22.3National Partnership Agreement on
Improving Public Hospital Services 60.7 52.7 73.1 90.7Royalties for Regions Southern Inland
Health Initiative 42.4 55.3 69.8 72.6Cost and Activity Increases 20.0 57.9 49.0 114.5 121.3Fresh Start Recovery Program 0.5 1.0Community Living Support Services 0.2 0.5 0.5 0.5Prospect Lodge Rehabilitation Treatment
Facility 0.2 0.3 0.3 0.3Royalties for Regions Addressing Alcohol
and Drug Related Harm in the Kimberleyand Pi lbara 2.2 4.6 4.7 4.9
Royalties for Regions Dual PurposeAlcohol and Drug Centre in Carnarvon 0.6 0.6 0.6 0.6
Neurosciences Research Institute Grant 5.0CHOGM Provision of Health Services 0.2 1.2Seniors Card Eligibility (a) (a) (a) (a)
Western Australian Tourism CommissionAviation and Market Development in China 1.3 1.3 1.3 1.3New Golf Tournament 2.4 2.4 2.4Event Tourism 15.0 15.0 15.0 15.0Royalties for Regions Kimberley Science
and Conservation Strategy 1.0 1.4 1.2 0.7CHOGM Marketing Western Australia 0.2 0.8
Rottnest Island Authority (b)
Maintenance of Rottnest Island's Naturaland Cultural Heritage Assets 1.0 2.0 3.0 3.0
(a) Amount less than $50,000.
(b) Represented in general government expenses as grants and subsidies from the Consolidated Account, paid through theDepartment of Treasury.
WA Health
Junior Doctors Training
Additional spending of $74 2 million from 2010-11 to 2014-15 has been provided as partof the Government's commitment to employ all graduating domestic junior doctors inWestern Australia. This expenditure also includes additional capacity for supervision ofjunior doctors and the targeted expansion of 14 simulated learning facilities and mobilesimulation training units across the State.
113

2011-12 Economic and Fiscal Outlook
National Partnership Agreement on Improving Public Hospital Services
As part of the total $351 6 million, including capital, that the Commonwealth will providethrough a new National Partnership Agreement on Improving Public Hospital Services,$277.1 million will be allocated from 2010-11 to 2013-14 to:
increase the capacity of hospitals to perform medical services through the provisionof additional sub-acute beds;
ensure a higher proportion of emergency department patients are admitted to hospital,referred for treatment or discharged within a four-hour period (where clinicallyappropriate); and
enable a higher proportion of elective surgery patients to be seen within clinicallyrecommended times.
Royalties for Regions Southern Inland Health Initiative
As part of the $538 million RJR Southern Inland Health Initiative package (to 2014-15),$240 million will be spent over four years to address the shortfall of General Practitionersin regional Western Australia by providing General Practitioners with incentives to retainand/or attract them into the regions, improving the level of Telehealth services, andincreasing the number of primary health care staff associated with the redevelopment ofsix integrated district health services across the State.
Cost and Activity Increases
The State Government will spend an additional $363 million from 2010-11 to 2014-15reflecting the predicted population increase and corresponding take up of health servicesacross Western Australia and the increasing cost of delivering those services. This buildson the substantial increase of $1.1 billion over five years provided in the 2010-11 Budgetto accommodate increased levels of health service activity, and retains the Health systemon a financially sustainable setting through the continued implementation ofactivity-based funding and management.
Fresh Start Recovery Program
A total of $1 5 million will be spent over two years from 2010-11 for 244 treatments to beprovided by the Fresh Start Recovery Program to assist patients with alcohol and drugaddiction using naltrexone implants.
Community Living Support Services
A total of $1 5 million will be spent over four years to provide treatment and support topeople with alcohol and other drug (AOD) problems and their families in short-termsocial housing. This initiative is linked to the provision of an additional 15 homes by theDepartment of Housing to provide transitional accommodation to individuals exitingresidential AOD treatment services.
114
General Government Expenses
Prospect Lodge Rehabilitation Treatment Facility
A total of $1 million will be spent over four years to expand the Prospect Lodgeresidential rehabilitation service in the Goldfields. This will allow the facility to operateat its full 10 bed capacity and improve access to culturally secure AOD services forresidents in the Goldfields region.
Royalties for Regions Addressing Alcohol and Drug Related Harm in theKimberley and Pilbara
A total of $16.4 million will be spent over four years to increase the capacity of AODprevention and treatment services in the Kimberley ($11 million) andPilbara ($5.4 million) regions. This initiative will expand the level of resources inexisting service hubs and double the number of service hubs from four to eight.
Royalties for Regions Dual Purpose Alcohol and Drug Centre in Carnarvon
A total of $2 4 million will be spent over four years to operate a dual purpose counsellingand sobering-up centre in Carnarvon that reduces harm related to alcohol use for both theindividual and the community.
Neurosciences Research Institute Grant
A grant of $5 million will be provided in 2011-12 as the State Government's contributiontowards the construction of the new state of the art Neurosciences Research Institute onthe Queen Elizabeth II Medical Centre. Once completed in 2014, the new facility willbring together key areas of related neurosciences research that will enhance thecollaborative links between the various research organisations.
Commonwealth Heads of Government Meeting Provision of HealthServices
A total of $1 4 million will be spent over two years from 2010-11 to provide health andfirst aid services for all CHOGM events. This includes the provision of ambulanceservices, doctors and nurses for all meetings, dinners and functions attended by ForeignMinisters and Leaders.
Seniors Card Eligibility
A further $0 2 million will be spent over four years to meet additional costs resulting fromthe extension of the Seniors Card working hours criterion from an average 20 hours perweek to 25 hours per week. This will result in an estimated additional 4,500 seniorsbecoming eligible for the Seniors Card and Seniors rebates.
115
2011-12 Economic and Fiscal Outlook
Western Australian Tourism Commission
Aviation and Market Development in China
An additional $5 2 million will be spent over four years on the implementation of anaviation and marketing development strategy in China to attract and capture a greatershare of its growing outbound visitor market.
New Golf Tournament
A total of $7 2 million will be spent from 2011-12 to 2013-14 to enable Western Australiato secure a major international golf event.
Event Tourism
An additional $60 million will be spent over four years (including $40 million from RJR)on the development of a State-wide events calendar that will enhance the vibrancy ofPerth and the regions. This expenditure will enable major new metropolitan and regionalevents to be developed and facilitate enhancements to existing events. It will also providea boost to the existing regional events scheme which supports and encourages growth ofsmaller events held throughout the State.
Royalties for Regions Kimberley Science and Conservation Strategy
A total of $4 2 million will be spent over four years to implement the tourism initiativesand components of the KSCS. This will include the development of Indigenous tourismproducts, and development and promotion of tourism corridors across the region.
Commonwealth Heads of Government Meeting MarketingWestern Australia
A total of $990,000 will be spent over two years from 2010-11 to promoteWestern Australia to CHOGM delegates and to create awareness of the event amongst theWestern Australian public.
Rottnest Island Authority
Maintenance of Rottnest Island's Natural and Cultural Heritage Assets
An additional $9 million will be spent over four years on maintaining the marine andterrestrial environment and heritage management of Rottnest Island, to protect the Island'snatural and cultural heritage assets.
116

General Government Expenses
MINISTER FOR MINES AND PETROLEUM; FISHERIES;ELECTORAL AFFAIRS
Table 3POLICY DECISIONS AND OTHER MAJOR CHANGES SINCE
2010-11 MID-YEAR REVIEW
2010-11$m
2011-12$m
2012-13$m
2013-14$m
2014-15$m
Mines and PetroleumAccelerating Reinvestment in
Western Australian Mine Sites 1.0 1.8 2.4Sustaining Reduction in Mineral Titles
Application Processing 0.5 0.5 0.5 0.5Government Contribution to Mines and
Petroleum Safety Regulation 1.0 1.0 1.0 1.0 1.0Royalties for Regions Exploration
Incentive Scheme Regional AlternativeEnergy Mobilisation Project 3.6 13.5 3.5
Kimberley Science and ConservationStrategy Baseline Geochemical andGeophysical Surveys 0.7 1.1 1.1
Implementation of Oil and Gas RegulationReform 1.0 1.0
Mining Tenement Refunds 8.1 8.0Regulation of the Resources Industry 6.9 5.9 7.5 9.1Delayed Roll-in into Shared Services 0.6 1.8 1.8 0.1
FisheriesAquatic Biosecurity Functions 4.7 4.7Aquatic Biosecurity Port Inspections 2.4Royalties for Regions Establishment and
Management of Capes Marine Park 0.8 0.8 0.8 0.8Royalties for Regions Fisheries Research
and Attraction 0.5 0.5 0.5 0.5Kimberley Science and Conservation
Strategy Establishment andManagement of Eighty Mile BeachMarine Park 0.3 0.6 0.6 0.6
Abrolhos Islands Upgrade of PublicAirstrips 0.5 0.5
Northern Fisheries ProtectionRecreational Fishing Compliance in thePilbara and Gascoyne 0.2
Kimberley Science and ConservationStrategy Kimberley Marine EducationProgram 0.2 0.4 0.3 0.2
Kimberley Science and ConservationStrategy Barramundi Stocking in LakeKununurra 0.2 0.2 0.2 0.1
Mines and Petroleum
Accelerating Reinvestment in Western Australian Mine Sites
An additional $5 2 million will be spent from 2011-12 to 2013-14 on regulation andcontrol of mine sites rehabilitation to enable faster bond and tenement relinquishment,thereby increasing opportunities for companies to reinvest in new mining developments.
117

2011-12 Economic and Fiscal Outlook
Sustaining Reduction in Mineral Titles Application Processing
An additional $500,000 per annum from 2011-12 will be spent on retaining a specialisedteam dealing with the processing of exploration and mineral titles applications.
Government Contribution to Mines and Petroleum Safety Regulation
An additional $1 million per annum from 2010-11 will be spent on the 'public good'component of the Department's mines and petroleum safety regulation activities.These activities are predominantly funded from industry, but it is appropriate that theGovernment also makes a direct contribution in recognition of the broader communitybenefits of safety regulation.
Royalties for Regions Exploration Incentive Scheme Regional AlternativeEnergy Mobilisation Project
An additional $20 6 million will be spent from 2011-12 to 2013-14 on mobilising drillingrigs and fracturing equipment into Western Australia in order to support exploration andproduction of unconventional energy resources including shale gas, tight gas andgeothermal energy.
Kimberley Science and Conservation Strategy Baseline Geochemical andGeophysical Surveys
An additional $3 million will be spent from 2011-12 to 2013-14 on baseline geochemicaland geophysical surveys in the Kimberley Basin. This spending will enable a completegeological mapping of the region and support other scientific and conservation programsundertaken as part of the KSCS.
Implementation of Oil and Gas Regulation Reform
An additional $2 million will be spent over two years from 2011-12 on theimplementation of oil and gas regulation reform as part of the National PartnershipAgreement to Deliver a Seamless National Economy.
Mining Tenement Refunds
An additional $16 1 million will be spent from 2010-11 to 2011-12 to cover an anticipatedincrease in mining tenement refunds. The increase brings the expenditure up to $9 millionper annum in 2010-11 and 2011-12 and reflects variables such as the backlog of tenementapplications, mineral commodity prices, the level of mineral exploration expenditure andnative title factors.
Regulation of the Resources Industry
An additional $29 4 million will be spent over four years on regulation of the resourcesindustry, with the cost of the additional regulation to be fully recovered from industry.
118
General Government Expenses
Delayed Roll-in into Shared Services
A total savings of $4 4 million previously harvested will be returned to the Departmentdue to a delayed roll-in into Shared Services. This is discussed later in this chapter(see Department of Finance).
Fisheries
Aquatic Biosecurity Functions
A total of $9.4 million will be spent over two years from 2011-12 to meet State,Commonwealth and international aquatic biosecurity obligations, particularly in relationto monitoring activities at key Western Australian ports. The Department is the leadagency for the administration and management of a number of Acts and agreements,aiming to minimise and control the introduction of aquatic pests.
Aquatic Biosecurity Port Inspections
An additional $2 4 million will be spent in 2010-11 to carry out immediate inspections ofnationally significant ports at Fremantle, Dampier and Port Hedland to identify potentialmarine pest incursions. The additional expenditure will also cover the development ofcost effective methods of in-water inspection and cleaning of vessels, in partnership withindustry.
Royalties for Regions Establishment and Management of Capes MarinePark
A total of $3.3 million will be spent over four years, from 2011-12 to facilitate theestablishment and ongoing management of the Capes Marine Park. The additionalexpenditure will enable the Department to plan and implement research, compliance andeducation activities within the proposed Park.
Royalties for Regions Fisheries Research and Attraction
Additional expenditure of $1 9 million will be incurred over four years to fund researchand activities which aim to promote a sustained increase in the abundance and diversity ofexisting fish stocks in Western Australian waters.
Kimberley Science and Conservation Strategy Establishment andManagement of Eighty Mile Beach Marine Park
A total of $2 million will be spent over four years to facilitate the establishment andongoing management of the Eighty Mile Beach Marine Park, south of Broome.The additional expenditure will primarily cover an increase in recreational andcommercial compliance activities by the Department within the new marine park.
119
2011-12 Economic and Fiscal Outlook
Abrolhos Islands Upgrade of Public Airstrips
An additional $1 million will be spent from 2010-11 to 2011-12 to enable gravel sheetingmaintenance works to be carried out on the East Wallabi and Rat Island airstrip surfacesin the Abrolhos Islands.
Northern Fisheries Protection Recreational Fishing Compliance in thePilbara and Gascoyne
A total of $200,000 will be spent in 2011-12 to cover the costs of increased complianceand education services in the Pilbara and Gascoyne in recognition of the increased levelsof recreational fishing activity being experienced in these regions.
Kimberley Science and Conservation Strategy Kimberley MarineEducation Program
An additional $1 1 million will be spent over four years as part of the KSCS initiative toimplement a Kimberley marine education program for recreational fishers and tour charteroperators, to promote the unique features of the Kimberley marine environment and howthey can be protected through sustainable fishing and tourism practices.
Kimberley Science and Conservation Strategy Barramundi Stocking inLake Kununurra
A total of $695,000 will be spent over four years as part of the KSCS initiative to restockLake Kununurra with barramundi fingerlings to form the basis of a still-water recreationalfishery in the Kimberley.
120
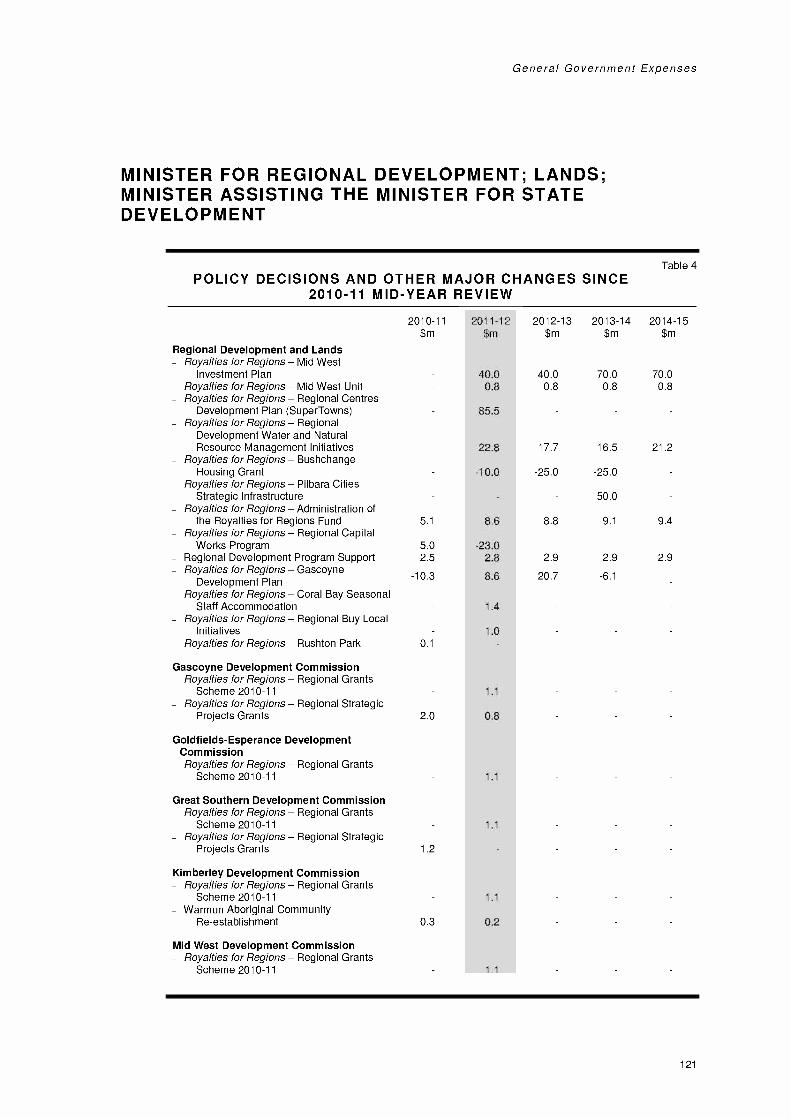
General Government Expenses
MINISTER FOR REGIONAL DEVELOPMENT; LANDS;MINISTER ASSISTING THE MINISTER FOR STATEDEVELOPMENT
Table 4POLICY DECISIONS AND OTHER MAJOR CHANGES SINCE
2010-11 MID-YEAR REVIEW
Regional Development and LandsRoyalties for Regions Mid West
2010-11$m
2011-12$m
2012-13$m
2013-14$m
2014-15$m
Investment Plan 40.0 40.0 70.0 70.0Royalties for Regions Mid West Unit 0.8 0.8 0.8 0.8Royalties for Regions Regional Centres
Development Plan (Super Towns) 85.5Royalties for Regions Regional
Development Water and NaturalResource Management Initiatives 22.8 17.7 16.5 21.2
Royalties for Regions BushchangeHousing Grant -10.0 -25.0 -25.0
Royalties for Regions Pi lbara CitiesStrategic Infrastructure 50.0
Royalties for Regions Administration ofthe Royalties for Regions Fund 5.1 8.6 8.8 9.1 9.4
Royalties for Regions Regional CapitalWorks Program -5.0 -23.0
Regional Development Program Support 2.5 2.8 2.9 2.9 2.9Royalties for Regions Gascoyne
Development Plan -10.3 8.6 20.7 -6.1
Royalties for Regions Coral Bay SeasonalStaff Accommodation 1.4
Royalties for Regions Regional Buy LocalInitiatives 1.0
Royalties for Regions Rushton Park 0.1
Gascoyne Development CommissionRoyalties for Regions Regional Grants
Scheme 2010-11 1.1
Royalties for Regions Regional StrategicProjects Grants 2.0 0.8
Goldfields-Esperance DevelopmentCommissionRoyalties for Regions Regional Grants
Scheme 2010-11 1.1
Great Southern Development CommissionRoyalties for Regions Regional Grants
Scheme 2010-11 1.1
Royalties for Regions Regional StrategicProjects Grants 1.2
Kimberley Development CommissionRoyalties for Regions Regional Grants
Scheme 2010-11 1.1
Warmun Aboriginal CommunityRe-establishment 0.3 0.2
Mid West Development CommissionRoyalties for Regions Regional Grants
Scheme 2010-11 1.1
121

2011-12 Economic and Fiscal Outlook
Table 4 (cont.)POLICY DECISIONS AND OTHER MAJOR CHANGES SINCE
2010-11 MID-YEAR REVIEW
2010-11$m
2011-12$m
2012-13$m
2013-14$m
2014-15$m
Peel Development CommissionRoyalties for Regions Regional Grants
Scheme 2010-11 1.1
Royalties for Regions Regional StrategicProjects Grants 1.0
Pilbara Development CommissionRoyalties for Regions Regional Grants
Scheme 2010-11 1.1
South West Development CommissionRoyalties for Regions Regional Grants
Scheme 2010-11 1.1
Royalties for Regions Regional StrategicProjects Grants 0.7 0.2
Wheatbelt Development CommissionRoyalties for Regions Regional Grants
Scheme 2010-11 1.1
Western Australian Land Authority (a)Shotts Industrial Park Collie Infrastructure
Upgrades 1.1 11.6 1.4 0.4 0.2
Western Australian Land InformationAuthority (Landgate)Strategic Development Plan 2011-12 to
2014-15 -5.9 -4.2 2.1 1.6 4.4
(a) Represented in general government expenses as grants and subsidies from the Consolidated Account, paid through theDepartment of Treasury.
Regional Development and Lands
Royalties for Regions Mid West Investment Plan
A total of $220 million will be spent over four years to implement major infrastructureprojects and initiatives in the Mid West region and enable a more sustainable social andeconomic base. Projects will relate to a broad range of infrastructure across a number ofareas, such as transport, health, education, town revitalisation and recreation facilities.
Royalties for Regions Mid West Unit
A total of $3 million will be spent to provide administration and project management tosupport the delivery of Mid West Investment Plan.
Royalties for Regions Regional Centres Development Plan (SuperTowns)
A total of $80 million will be spent on this initiative in 2011-12 providing an opportunityto promote growth and development of regional towns and communities. This expenditurewill deliver four initial Pilot Towns, in which a broad range of town developmentinitiatives will be undertaken to improve amenity of residents and enhance economicopportunities. An amount of $5 5 million will also be spent in 2011-12 to facilitate thedevelopment of master plans and a planning framework.
122

General Government Expenses
Royalties for Regions Regional Development Water and Natural ResourceManagement Initiatives
A total of $78 2 million will be spent over four years on a series of strategic initiatives todeliver greater access to information about water availability and supply options inregional Western Australia. This will assist in the management of demand and supply ofwater needs for the regional economic development priorities of government.
Royalties for Regions Bushchange Housing Grant
A reduction in planned expenditure of $60 million from 2011-12 to 2013-14 associatedwith this program has been approved. Alternative options for delivery of the grant will beinvestigated through the RJR Regional Housing for Workers and SuperTowns initiatives.
Royalties for Regions Pilbara Cities Strategic Infrastructure
Planned expenditure of $50 million has been transferred from the capital component ofthis initiative, and will now be spent in 2013-14 to reflect the intention of theinfrastructure under this program to be built and owned by entities outside the State publicsector.
Royalties for Regions Administration of the Royalties for Regions Fund
A total of $41 million will be spent from 2010-11 to 2014-15 to provide additionalresources to the Department to administer and implement the RJR program. This includesadditional officers to implement and manage the substantially increased number ofprojects funded by RJR and other support staff to deliver the program.
Royalties for Regions Regional Capital Works Program
A reduction of expenditure of $28 million has been approved due to the reallocation ofthese funds to other RJR initiatives.
Regional Development Program Support
An additional $14 million will be spent from 2010-11 to 2014-15 to increase the capacityof the Department to deliver better regional development outcomes for the State.This will ensure adequate expenditure on central agency functions that support thedelivery of regional development policy and projects, including RJR.
Royalties for Regions Gascoyne Development Plan
A total of $12 8 million will be spent from 2010-11 to 2013-14 to increase the capacity ofthe Gascoyne Development Plan, with the objective of enhancing the Gascoyne regionthrough a variety of projects.
123
2011-12 Economic and Fiscal Outlook
Royalties for Regions Coral Bay Seasonal Staff Accommodation
A total of $1 4 million will be spent in 2011-12 to provide an Indigenous employmentpackage to enhance the outcomes achieved in relation to the Coral Bay Seasonal StaffAccommodation project.
Royalties for Regions Regional Buy Local Initiatives
A total of $1 million will be spent in 2011-12 to establish programs to promote localsuppliers in regional Western Australia.
Royalties for Regions Rushton Park
A total of $125,000 will be spent in 2010-11 to provide financial assistance to theredevelopment of Rushton Park, Mandurah, and allow for completion of the grandstandupgrade.
Development Commissions All
Royalties for Regions Regional Grants Scheme 2010-11
An additional $1 1 million will be spent by each of the Development Commissions in2011-12 ($10.1 million in total) on the 2010-11 round of the Regional Grants Scheme.Individuals and organisations are eligible to apply for funding to improve economic andcommunity infrastructure in the regions through this contestable grants scheme.
Gascoyne Development Commission
Royalties for Regions Regional Strategic Projects Grants
An additional $2.8 million will be spent from 2010-11 to 2011-12 on various communityinfrastructure projects, such as building the Carnarvon One Mile Jetty InterpretativeCentre and a new Gascoyne Regional Library and Art Gallery, under the RegionalStrategic Projects Grants scheme.
Great Southern Development Commission
Royalties for Regions Regional Strategic Projects Grants
An additional $1 2 million will be spent in 2010-11 on community infrastructure projectsunder the Regional Strategic Projects Grants scheme.
124
General Government Expenses
Kimberley Development Commission
Warmun Aboriginal Community Re-establishment
An additional $500,000 will be spent from 2010-11 to 2011-12 by the WarmunAboriginal Community Re-establishment Taskforce on the coordination of the recoveryof the Warmun community in the East Kimberley.
Peel Development Commission
Royalties for Regions Regional Strategic Projects Grants
An additional $1 million will be spent in 2010-11 on various community infrastructureprojects under the Regional Strategic Projects Grants scheme.
South West Development Commission
Royalties for Regions Regional Strategic Projects Grants
An additional $0.9 million will be spent from 2010-11 to 2011-12 on communityinfrastructure projects under the Regional Strategic Projects Grants scheme.
Western Australian Land Authority
Shotts Industrial Park Collie Infrastructure Upgrades
An additional $14 7 million subsidy, over the period from 2010-11 to 2014-15, will beprovided for the relocation of communications, road and water infrastructure that crossesthe site area within the Shotts Industrial Park to be occupied by the proponent PerdamanChemicals and Fertilisers'. Also included is a component to meet rental shortfalls andestate holding costs during Perdaman' s pre-construction, construction and commissioningperiod.
This is a significant manufacturing project for the South West region, requiring aninvestment of around $3.5 billion, a construction workforce of approximately1,500 people and a permanent operational workforce of around 200 to be located in theCollie/Bunbury area. The urea plant will utilise environmentally-friendly technologies totransform sub-bituminous coal into urea for use in chemical and fertiliser applicationsusing innovative and clean coal gasification processes.
125

2011-12 Economic and Fiscal Outlook
Western Australian Land Information Authority (Landgate)
Strategic Development Plan 2011-12 to 2014-15
Adjustments relating to the Strategic Development Plan reflect Landgate's forecastexpenditures and revenues and the resultant impact on cashflows to and from government.Expenditures decreased in 2010-11 and are expected to remain below previous estimatesin 2011-12 due to the downturn in the property market. An additional $8 1 million will bespent from 2012-13 to 2014-15 reflecting the peak of the three-year valuation cycle and aprojected improvement in the property market.
126

General Government Expenses
TREASURER; ATTORNEY GENERAL
Table 5POLICY DECISIONS AND OTHER MAJOR CHANGES SINCE
2010-11 MID-YEAR REVIEW
Treasury
2010-11$m
2011-12$m
2012-13$m
2013-14$m
2014-15$m
Enhanced Cost and Demand Modelling 0.5 0.5 0.5 0.5Performance Management and Evaluation 0.3 0.3 0.3 0.3Value for Money Reviews 0.5 0.5 0.6 0.6Government Trading Enterprises
Umbrella Legislation 0.3Government Trading Enterprises
Monitoring 0.8 0.8 0.8 0.8Delivering Community Services in
Partnership Policy 0.3 0.2 0.2 0.2First Home Owners' Scheme Grant -12.5Refunds of State Taxes 15.1Grants to Local Government 45.0Grants to Non-government Schools 123.0
Economic Regulation AuthorityBuilding In-house Capacity and Expertise 2.1 2.5
Attorney GeneralRetrospective Remuneration Agreement
with Copyright Agency Limited 3.1Ex-gratia Payment to Constable Butcher 3.3Establishment of the Building Disputes
Tribunal 0.8 4.0 3.2 3.3 3.4Reduce Backlog of Mining Tenement
Objections 0.4 0.4 0.4 0.4Royalties for Regions Aboriginal Justice
Education Program4.0 2.3 2.3
Criminal Injuries Compensation Act 2003 6.5 6.7 6.9 7.1 7.3Office of Shared Services Revised Roll-in
Date 6.3 1.9
Office of the Director of PublicProsecutionsSpecialised Appeals Team 1.2 1.2
Office of the Information CommissionerAdministration of the Freedom of
Information Act 0.3 0.3 0.3 0.3
Legal Aid Commission ofWestern AustraliaDuty Lawyer Service 1.2 1.3 1.3 1.3Grants of Aid 1.6 1.6 1.7 1.7
127
2011-12 Economic and Fiscal Outlook
Treasury
Enhanced Cost and Demand Modelling
In line with the recommendations of the Economic Audit Committee (EAC), a total of$2 million will be spent over four years to allow the Department to assist agenciesdevelop robust cost and demand models to strengthen the budget process and develop amore in-depth understanding of the cost and demand drivers in key service deliveryagencies.
Performance Management and Evaluation
In line with the recommendations of the EAC, a total of $1 2 million will be spent overfour years to build program evaluation capacity and enhance the quality and usefulness ofperformance management information. This will assist in identifying savings fromprograms that are no longer achieving desired outcomes or delivering value for money.
Value for Money Reviews
In line with the recommendations of the EAC, a total of $2 2 million will be spent overfour years for the conduct of value for money reviews of key government agencies.These reviews are aimed at ensuring that agencies are delivering services as efficientlyand effectively as possible.
Government Trading Enterprises Umbrella Legislation
A total of $300,000 will be spent in 2011-12 to facilitate the development of umbrellalegislation for the State's Government Trading Enterprises (GTEs), in line with therecommendations of the EAC.
Government Trading Enterprises Monitoring
In line with the recommendations of the EAC, a total of $3 2 million will be spent overfour years to provide increased oversight of the State's GTEs and strengthen governancearrangements. This will include monitoring the implementation of the efficiency dividendannounced in this budget, to ensure that costs are reduced and GTEs are operating asefficiently as possible as utility tariffs move to cost-reflective levels over coming years.
Delivering Community Services in Partnership Policy
As part of the significant funding boost in this budget for the NFP sector, $1 1 millionwill be spent over four years to support and monitor the roll-out of the additional fundingand associated contracting reforms. Further expenditure has also been approved for theDepartment of Finance for the provision of appropriate education, training and support tothe public and NFP sectors (see Department of Finance later in this chapter).
First Home Owners' Scheme Grant
Expenses associated with the First Home Owners' Scheme have been revised down by$12.5 million in 2010-11, in line with reduced activity.
128

General Government Expenses
Refunds of State Taxes
Higher than expected claims for refunds of State taxes (up $15 1 million) have beenrecorded in 2010-11.
Grants to Local Government
Local government grants have been revised up by $45 million in 2010-11. This money isreceived from the Commonwealth and on-passed to local governments (i.e. there is noimpact on the State's net operating balance). The grant increases are for general purposes($27 million) and roads ($18 million).
Grants to Non-government Schools
Commonwealth grants on-passed to non-government schools by the State have beenrevised up by $123 million in 2010-11. Similar to the local government grants, thesegrants have no effect on Western Australia's net operating position.
Economic Regulation Authority
Building In-house Capacity and Expertise
An additional $4 7 million will be spent from 2010-11 to 2011-12 to allow the EconomicRegulation Authority to carry out more work in-house, build staff expertise and reduce itsreliance on external consultants, responding to the complexity of its functions andlegislative obligations.
Attorney General
Retrospective Remuneration Agreement with Copyright Agency Limited
A total of $3 1 million will be spent in 2010-11 to extinguish the State's retrospectivecopyright liability for the period 1 July 2001 to 30 June 2010.
Ex-gratia Payment to Constable Butcher
An ex-gratia payment of $3 3 million has been made in 2010-11 to ConstableMatthew Butcher.
Establishment of the Building Disputes Tribunal
An additional $14 7 million will be spent from 2010-11 to 2014-15 to enable the StateAdministrative Tribunal to resolve building complaints in accordance with the BuildingServices (Complaint Resolution and Administration) Bill 2010.
129
2011-12 Economic and Fiscal Outlook
Reduce Backlog of Mining Tenement Objections
An additional $435,000 per annum will be spent from 2011-12 to help reduce the backlogof mining tenement objections dealt with by the Magistrate's Court.
Royalties for Regions Aboriginal Justice Education Program
A total of $8 5 million will be spent from 2011-12 to 2013-14 to enable the delivery oftwo projects within the Aboriginal Justice Education Program, being Enhancement ofVictims of Crime Services ($3 million) and Enhanced Driver Training for RegionalAboriginal Communities ($5.5 million). This is expected to reduce incarceration rates,victimisation rates and lead to safer communities.
Criminal Injuries Compensation Act 2003
An additional $34 6 million will be spent from 2010-11 to 2014-15 to enable theDepartment of the Attorney General to meet the anticipated increased costs of awardpayments made in accordance with the Criminal Injuries Compensation Act 2003.The estimated total cost of award payments in 2011-12 is $26.2 million
Office of Shared Services Revised Roll-in Date
A total savings of $8.1 million harvested from the Department will be returned over twoyears from 2011-12 due to the delayed roll-in to the Office of Shared Services. This isdiscussed further under the Department of Finance.
Office of the Director of Public Prosecutions
Specialised Appeals Team
A total of $1 2 million per annum will be spent in 2011-12 and 2012-13 to establish a newspecialised Appeals Team to conduct criminal appeals. This Team will initially beengaged on a two year basis, and its results will be assessed to determine futureresourcing requirements.
Office of the Information Commissioner
Administration of the Freedom of Information Act
A total of $1 2 million will be spent over four years to enable the Office of theInformation Commissioner to clear the current backlog of appeals, and to addressincreases in costs and demand for Freedom of Information training and assistance.
130

General Government Expenses
Legal Aid Commission of Western Australia
Duty Lawyer Service
An additional $5 1 million will be spent over four years to enable the Legal AidCommission to expand its duty lawyer service throughout the State, thereby reducing thenumber of unrepresented persons appearing in the Magistrate's and Children's Courtsprior to entering a plea.
Grants of Aid
An additional $6 6 million will be spent over four years to enable the Legal AidCommission to provide additional grants of aid primarily for people defending criminalcharges in the Magistrate's Court.
131
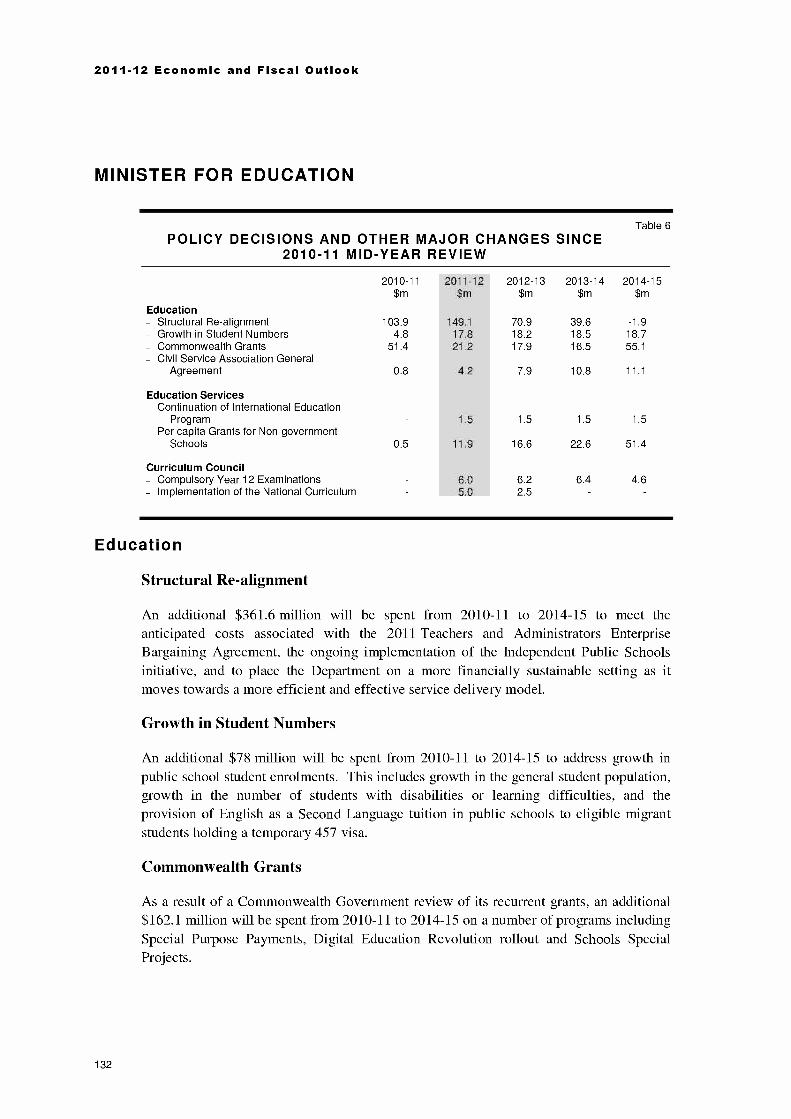
2011-12 Economic and Fiscal Outlook
MINISTER FOR EDUCATION
Table 6POLICY DECISIONS AND OTHER MAJOR CHANGES SINCE
2010-11 MID-YEAR REVIEW
Education
2010-11$m
2011-12$m
2012-13$m
2013-14$m
2014-15$m
Structural Re-alignment 103.9 149.1 70.9 39.6 -1.9Growth in Student Numbers 4.8 17.8 18.2 18.5 18.7Commonwealth Grants 51.4 21.2 17.9 16.5 55.1Civil Service Association General
Agreement 0.8 4.2 7.9 10.8 11.1
Education ServicesContinuation of International Education
Program 1.5 1.5 1.5 1.5Per capita Grants for Non-government
Schools 0.5 11.9 16.6 22.6 51.4
Curriculum CouncilCompulsory Year 12 Examinations 6.0 6.2 6.4 4.6Implementation of the National Curriculum 5.0 2.5
Education
Structural Re-alignment
An additional $361 6 million will be spent from 2010-11 to 2014-15 to meet theanticipated costs associated with the 2011 Teachers and Administrators EnterpriseBargaining Agreement, the ongoing implementation of the Independent Public Schoolsinitiative, and to place the Department on a more financially sustainable setting as itmoves towards a more efficient and effective service delivery model.
Growth in Student Numbers
An additional $78 million will be spent from 2010-11 to 2014-15 to address growth inpublic school student enrolments. This includes growth in the general student population,growth in the number of students with disabilities or learning difficulties, and theprovision of English as a Second Language tuition in public schools to eligible migrantstudents holding a temporary 457 visa.
Commonwealth Grants
As a result of a Commonwealth Government review of its recurrent grants, an additional$162 1 million will be spent from 2010-11 to 2014-15 on a number of programs includingSpecial Purpose Payments, Digital Education Revolution rollout and Schools SpecialProjects.
132

General Government Expenses
Civil Service Association General Agreement
An additional $34 8 million will be spent from 2010-11 to 2014-15 to meet costs relatedto the Civil Service Association General Agreement.
Education Services
Continuation of International Education Program
An amount of $1 5 million per annum will be spent over four years to support thecoordinated marketing of Western Australian international education.
Per capita Grants for Non-government Schools
Additional administered funding of $103 million over five years from 2011-12 has beenprovided for per capita grant payments to non-government schools. This funding reflectsthe most recent forecasts of future enrolment growth and indexation for thenon-government school sector and, in accordance with usual practice, updates forecastsmade as part of the previous budget.
Curriculum Council
Compulsory Year 12 Examinations
An additional $23 2 million will be spent over four years to support compulsory Year 12examinations in Western Australia due to a projected increase in the number ofexaminations, higher numbers of students taking those examinations and associatedadministration costs.
Implementation of the National Curriculum
An additional $7 5 million will be spent over two years from 2011-12 for the ongoingimplementation of the National Curriculum in Western Australia.
133

2011-12 Economic and Fiscal Outlook
MINISTER FOR FINANCE; COMMERCE; SMALL BUSINESS
Table 7POLICY DECISIONS AND OTHER MAJOR CHANGES SINCE
2010-11 MID-YEAR REVIEW
FinanceGovernment Office Accommodation Master
2010-11$m
2011-12$m
2012-13$m
2013-14$m
2014-15$m
Plan 19.6 20.2 13.6 13.9 13.9Funding of Key Corporate Positions for the
Department of Finance 1.0 1.0 1.0 1.0Delivering Community Services in
Partnership Policy 0.4 3.3 3.4 4.5 5.1Shared Services Corporate Reform Project 5.9 18.2 23.0 8.9 5.5Improved Contract Management and
Vocational Education 1.1 1.1 1.2 1.2Tax Administration Measures 1.6 1.6 1.6 1.7Duty Assessments Valuations 0.9WA Seniors Card 0.5 0.5 0.5 0.5Relocation of the Department of Education 0.3 1.2
CommerceBuilding Regulation Reform 2.2 8.6 9.8 10.2 10.5Value for Money Audit -1.3 -1.4 -1.9 -1.9 -1.9
Small Business Development CorporationBusiness Migration Program 0.5Small Business Commissioner 0.3
Finance
Government Office Accommodation Master Plan
Depreciation expenses totalling $50 8 million will be recognised by the BuildingManagement and Works business unit from 2010-11 to 2014-15 in relation to$230 6 million of capital assets associated with the Government Office AccommodationMaster Plan (Plan).
An estimated $30.4 million will be spent from 2010-11 to 2011-12 to meet the liability forthe payment of rent on new premises. There is an unavoidable timing disparity betweenthe commencement of leases earmarked as part of the Plan and the expiry of currentleases.
Funding of Key Corporate Positions for the Department of Finance
Following the decision to split the Department of Treasury and Finance into two separatedepartments from 1 July 2011, a total of $4 million will be spent over four years to fundfour new positions for the new Department of Finance, being the Director General, ChiefFinance Officer and two internal auditors.
134
General Government Expenses
Delivering Community Services in Partnership Policy
As part of the significant funding boost for the NFP sector in this budget, $16 7 millionwill be spent from 2010-11 to 2014-15 to provide appropriate education, training andsupport to the public and NFP sectors for the roll-out of the additional funding and theimplementation of contracting reforms.
Shared Services Corporate Reform Project
An additional $61 5 million from 2010-11 to 2014-15 has been approved to offset the lossof funding as a consequence of delayed agency roll-ins to the Office of Shared Services,pending the outcome of the Economic Regulation Authority review of the SharedServices Corporate Reform project.
Improved Contract Management and Vocational Education
In line with the recommendations of the EAC, a total of $4 6 million will be spent overfour years to build the procurement and contracting skills of the public sector throughvarious contract management and vocational education programs.
Tax Administration Measures
A total of $6 5 million will be spent over four years to improve administration of theState's tax system and ensure that taxpayers meet their statutory responsibilities in atimely manner.
Duty Assessments Valuations
A total of $900,000 will be spent in 2010-11 to conduct valuations on high value fixturesand machinery on mining tenements and petroleum licences for duty assessmentpurposes.
WA Seniors Card
An extra $1 9 million will be spent over 2011-12 to 2014-15 to meet additional costsresulting from the extension of the working hours criterion for holders of Seniors cards.
Relocation of the Department of Education
An additional $1 4 million will be spent over two years, from 2010-11 to relocate theDepartment of Education from existing accommodation at Hale House.
135
2011-12 Economic and Fiscal Outlook
Commerce
Building Regulation Reform
Expenditure of $41 3 million over five years has been approved to reflect the reform tothe building regulation system, including the transfer of the functions of multipleindependent boards to the Building Commission Division (BCD) within the Department,and the implementation of the Building Services Levy which will provide a source offunding to the BCD.
Value for Money Audit
Reduced expenditure of $8 4 million from 2010-11 to 2014-15 has been approved toreflect savings achieved through implementation of recommendations arising from avalue for money audit of the Department. These savings are comprised of a reduction infull-time equivalent staff and accompanying expenses.
Small Business Development Corporation
Business Migration Program
A total of $500,000 will be spent in 2011-12 for the continuation of the BusinessMigration Program. This program is an investment attraction initiative promotingWestern Australia as a preferred destination for business migrants, marketing the State'seconomic opportunities, and supporting business migrants through the State Sponsorshipprocess.
Small Business Commissioner
A total of $300,000 will be spent in 2011-12 on the establishment of a Small BusinessCommissioner in Western Australia. The Commissioner is expected to enhance thecompetitive and fair operating environment for small business in Western Australia andprovide an effective means of resolving business disputes.
136
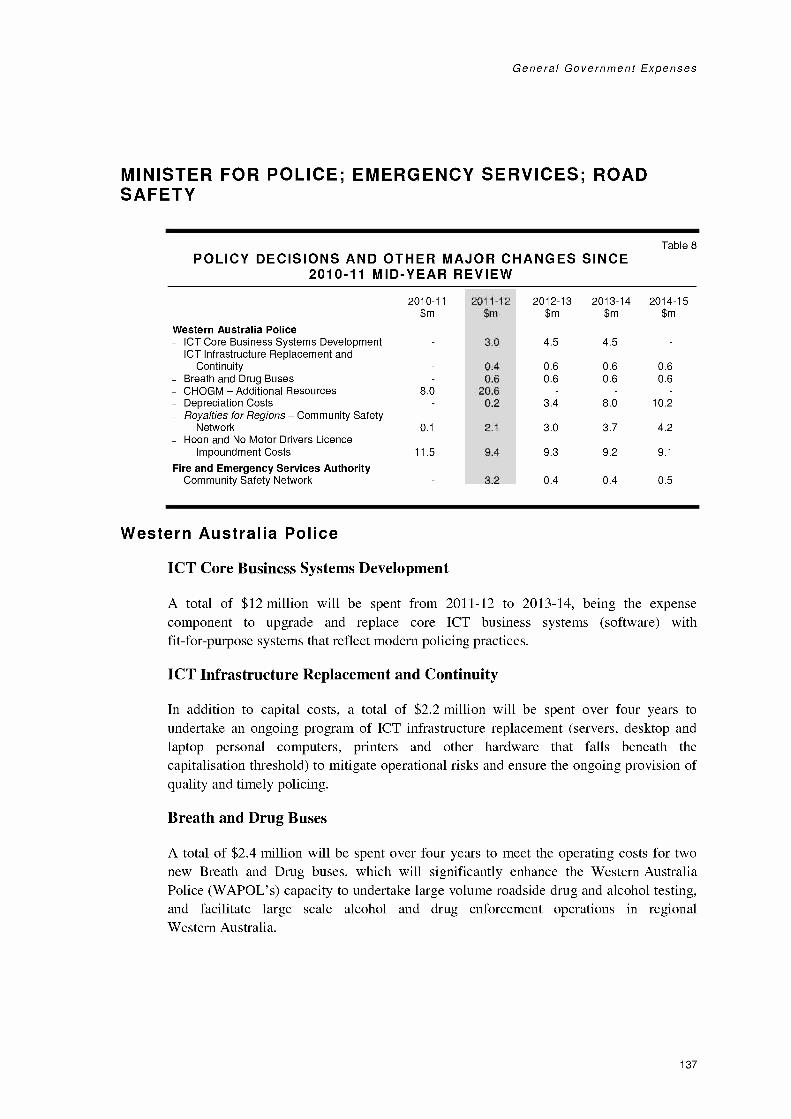
General Government Expenses
MINISTER FOR POLICE; EMERGENCY SERVICES; ROADSAFETY
Table 8POLICY DECISIONS AND OTHER MAJOR CHANGES SINCE
2010-11 MID-YEAR REVIEW
2010-11$m
2011-12$m
2012-13$m
2013-14$m
2014-15$m
Western Australia PoliceICT Core Business Systems Development 3.0 4.5 4.5ICT Infrastructure Replacement and
Continuity 0.4 0.6 0.6 0.6Breath and Drug Buses 0.6 0.6 0.6 0.6CHOGM Additional Resources 8.0 20.6Depreciation Costs 0.2 3.4 8.0 10.2Royalties for Regions Community Safety
Network 0.1 2.1 3.0 3.7 4.2Hoon and No Motor Drivers Licence
Impoundment Costs 11.5 9.4 9.3 9.2 9.1
Fire and Emergency Services AuthorityCommunity Safety Network 3.2 0.4 0.4 0.5
Western Australia Police
ICT Core Business Systems Development
A total of $12 million will be spent from 2011-12 to 2013-14, being the expensecomponent to upgrade and replace core ICT business systems (software) withfit-for-purpose systems that reflect modern policing practices.
ICT Infrastructure Replacement and Continuity
In addition to capital costs, a total of $2 2 million will be spent over four years toundertake an ongoing program of ICT infrastructure replacement (servers, desktop andlaptop personal computers, printers and other hardware that falls beneath thecapitalisation threshold) to mitigate operational risks and ensure the ongoing provision ofquality and timely policing.
Breath and Drug Buses
A total of $2 4 million will be spent over four years to meet the operating costs for twonew Breath and Drug buses, which will significantly enhance the Western AustraliaPolice (WAPOL' s) capacity to undertake large volume roadside drug and alcohol testing,and facilitate large scale alcohol and drug enforcement operations in regionalWestern Australia.
137

2011-12 Economic and Fiscal Outlook
Commonwealth Heads of Government Meeting Additional Resources
An additional $28 6 million will be spent from 2010-11 to 2011-12 to meet the costsassociated with hosting CHOGM. This includes officer accommodation and air travel,catering for operational officers, air support, operational equipment, training, trafficmanagement and the establishment of staging areas and command posts.
Depreciation Costs
Depreciation costs of $21 8 million will be incurred from 2011-12 to 2014-15 in relationto the Community Safety Network ($13.2 million), ICT business systems ($7 8 million)and the two new Breath and Drug Buses ($0.9 million).
Royalties for Regions Community Safety Network
A total of $13 1 million will be spent from 2011-12 to 2014-15 to cover running costs ofthe Community Safety Network, such as staffing costs, site leasing, licensing and utilitycharges.
Hoon and No Motor Drivers Licence Impoundment Costs
A total of $48 5 million will be spent from 2010-11 to 2014-15 to meet increased vehicleimpoundment costs associated with changes to Hoon and No Motor Drivers Licencelegislation. This expenditure is expected to be significantly offset by the generation of$44.5 million in revenue from cost recovery processes.
Fire and Emergency Services Authority
Community Safety Network
A total of $4 5 million will be spent over four years on operational costs for theCommunity Safety Network. The Network will provide the Fire and Emergency ServicesAuthority access to the WAPOL' s existing communication network and a more stable andsecure communication platform across the greater metropolitan area and major regionalcentres.
138
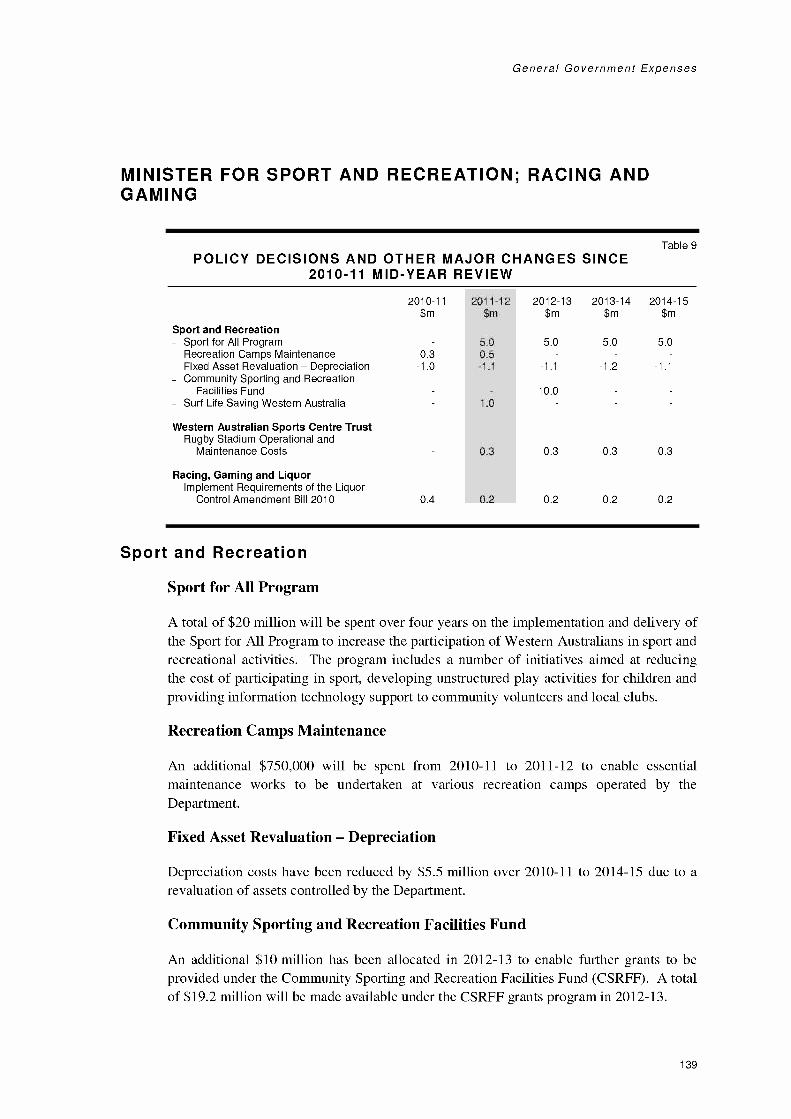
General Government Expenses
MINISTER FOR SPORT AND RECREATION; RACING ANDGAMING
Table 9POLICY DECISIONS AND OTHER MAJOR CHANGES SINCE
2010-11 MID-YEAR REVIEW
Sport and Recreation
2010-11$m
2011-12$m
2012-13$m
2013-14$m
2014-15$m
Sport for All Program 5.0 5.0 5.0 5.0Recreation Camps Maintenance 0.3 0.5Fixed Asset Revaluation Depreciation -1.0 -1.1 -1.1 -1.2 -1.1Community Sporting and Recreation
Facilities Fund 10.0Surf Life Saving Western Australia 1.0
Western Australian Sports Centre TrustRugby Stadium Operational and
Maintenance Costs 0.3 0.3 0.3 0.3
Racing, Gaming and LiquorImplement Requirements of the Liquor
Control Amendment Bill 2010 0.4 0.2 0.2 0.2 0.2
Sport and Recreation
Sport for All Program
A total of $20 million will be spent over four years on the implementation and delivery ofthe Sport for All Program to increase the participation of Western Australians in sport andrecreational activities. The program includes a number of initiatives aimed at reducingthe cost of participating in sport, developing unstructured play activities for children andproviding information technology support to community volunteers and local clubs.
Recreation Camps Maintenance
An additional $750,000 will be spent from 2010-11 to 2011-12 to enable essentialmaintenance works to be undertaken at various recreation camps operated by theDepartment.
Fixed Asset Revaluation Depreciation
Depreciation costs have been reduced by $5 5 million over 2010-11 to 2014-15 due to arevaluation of assets controlled by the Department.
Community Sporting and Recreation Facilities Fund
An additional $10 million has been allocated in 2012-13 to enable further grants to beprovided under the Community Sporting and Recreation Facilities Fund (CSRFF). A totalof $19.2 million will be made available under the CSRFF grants program in 2012-13.
139

2011-12 Economic and Fiscal Outlook
Surf Life Saving Western Australia
A $1 million grant will be provided in 2011-12 to assist Surf Life SavingWestern Australia develop a new administration building.
Western Australian Sports Centre Trust
Rugby Stadium Operational and Maintenance Costs
A total of $1 2 million will be spent over four years on the maintenance and operatingcosts of the new Rugby facility at AK Reserve, Mount Claremont, which will becompleted in mid-2011.
Racing, Gaming and Liquor
Implement Requirements of the Liquor Control Amendment Bill 2010
A total of $1 2 million will be spent from 2010-11 to 2014-15 on the implementation ofinitiatives contained in the Liquor Control Amendment Bill 2010. These initiatives,primarily dealing with liquor licensing and prohibition legislation, aim to enhance theDepartment's ability to address alcohol-related harm and anti-social behaviour.
140
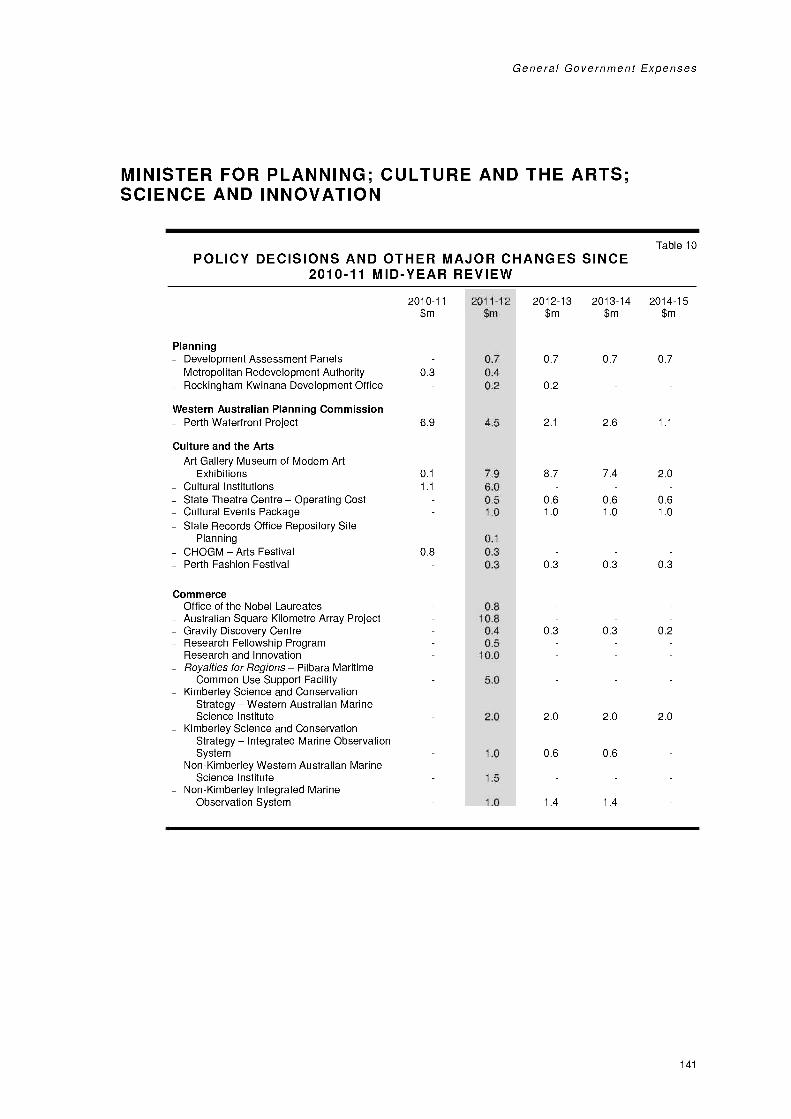
General Government Expenses
MINISTER FOR PLANNING; CULTURE AND THE ARTS;SCIENCE AND INNOVATION
Table 10POLICY DECISIONS AND OTHER MAJOR CHANGES SINCE
2010-11 MID-YEAR REVIEW
Planning
2010-11$m
2011-12$m
2012-13$m
2013-14$m
2014-15$m
Development Assessment Panels 0.7 0.7 0.7 0.7Metropolitan Redevelopment Authority 0.3 0.4Rockingham Kwinana Development Office 0.2 0.2
Western Australian Planning CommissionPerth Waterfront Project 6.9 4.5 2.1 2.6 1.1
Culture and the ArtsArt Gallery Museum of Modern Art
Exhibitions 0.1 7.9 8.7 7.4 2.0Cultural Institutions 1.1 6.0State Theatre Centre Operating Cost 0.5 0.6 0.6 0.6Cultural Events Package 1.0 1.0 1.0 1.0State Records Office Repository Site
Planning 0.1
CHOGM Arts Festival 0.8 0.3Perth Fashion Festival 0.3 0.3 0.3 0.3
CommerceOffice of the Nobel Laureates 0.8Australian Square Kilometre Array Project 10.8Gravity Discovery Centre 0.4 0.3 0.3 0.2Research Fellowship Program 0.5Research and Innovation 10.0Royalties for Regions Pi lbara Maritime
Common Use Support Facility 5.0Kimberley Science and Conservation
Strategy Western Australian MarineScience Institute 2.0 2.0 2.0 2.0
Kimberley Science and ConservationStrategy Integrated Marine ObservationSystem 1.0 0.6 0.6
Non-Kimberley Western Australian MarineScience Institute 1.5
Non-Kimberley Integrated MarineObservation System 1.0 1.4 1.4
141
2011-12 Economic and Fiscal Outlook
Planning
Development Assessment Panels
A total of $2 8 million will be spent over four years to meet the operational costs of thenewly established Development Assessment Panels (DAPs). The DAPs will comprise aChairman, two technical experts and two elected local government representatives, whichwill consider development applications over $3 million outside the City of Perth and$10 million within the City of Perth, rather than the local council. This mix of expertiseand knowledge will help balance the technical aspects of development with local concernsand interests and provide a more efficient and transparent approval process.
Metropolitan Redevelopment Authority
A total of $710,000 will be spent from 2010-11 to 2011-12 to fund the establishment costsof the new Metropolitan Redevelopment Authority, which combines the East Perth,Midland, Armada le and Subiaco Redevelopment Authorities into a single agency.
Rockingham Kwinana Development Office
A total of $200,000 per annum will be spent in 2011-12 and 2012-13 for the operatingcosts of the Rockingham Kwinana Development Office.
Western Australian Planning Commission
Perth Waterfront Project
A total of $17 2 million will be spent from 2010-11 to 2014-15 on the Perth WaterfrontProject to meet the costs of completing the detailed design and documentation, statutoryapprovals and contractor procurement processes.
Culture and the Arts
Art Gallery Museum of Modern Art Exhibitions
A total of $26 1 million will be spent from 2010-11 to 2014-15 to meet the cost ofpresenting a series of exhibitions from New York's Museum of Modern Art. The cost ofpresenting the exhibitions will be offset by ticket sales and sponsorships to the estimatedvalue of $20.1 million
Cultural Institutions
An additional $1.1 million in 2010-11 and $6 0 million in 2011-12 will be spent to meetthe increased operating costs of institutions within the Culture and the Arts portfolio.The Department of the Premier and Cabinet will undertake a strategic review of theportfolio during 2011-12 to clarify its governance structure and desired outcomes.
142

General Government Expenses
State Theatre Centre Operating Cost
A total of $2 2 million will be spent over four years to meet the operating costs of the newState Theatre Centre which opened in January 2011.
Cultural Events Package
The Government has committed $1 million per annum over four years to provide supportto a number of high profile events that add to the cultural vibrancy of the State.
State Records Office Repository Site Planning
Expenditure of $100,000 in 2011-12 will be undertaken to identify a suitable site for thelocation of a proposed new State Records Office Repository.
Commonwealth Heads of Government Meeting Arts Festival
A total of $1 million will be spent in 2010-11 and 2011-12 on the Arts Festival to be runin conjunction with CHOGM.
Perth Fashion Festival
The Government has committed $250,000 per annum over four years to fund the annualPerth Fashion Festival.
Commerce
Office of the Nobel Laureates
A total of $800,000 in 2011-12 has been committed as a contribution to the activities ofthe Office of the Nobel Laureates, which includes participation in advisory committees,promoting the work and impact of high level scientific research, and leveragingCommonwealth Government funding.
Australian Square Kilometre Array Project
A total of $10 8 million has been committed for the provision of infrastructure via a fibreoptic link from the Murchison Radio-astronomy Observatory to Geraldton, and theearthing and shielding of power and optic fibre connections between the project'santennas by the CSIRO.
Gravity Discovery Centre
A total of $1 1 million will be spent over four years in accordance with the outcomes of areview undertaken by independent consultants for the continuation of the GravityDiscovery Centre's operations whilst it pursues self-sustainability through partnershipswith industry.
143
2011-12 Economic and Fiscal Outlook
Research Fellowship Program
A total of $500,000 will be spent in 2011-12 on the Western Australian ResearchFellowship program which seeks to attract quality researchers to Western Australia frominterstate or overseas to conduct scientific research that is of specific benefit to the State.
Research and Innovation
A further $10 million has been committed to the Research and Innovation Fundingprogram in 2011-12 to support the development of, and innovation in, key industrysectors in Western Australia, as recommended by the Technology Industry AdvisoryCouncil.
Royalties for Regions Pilbara Maritime Common Use Support Facility
At a cost of $5 million in 2011-12, RJR will fund full feasibility, planning design andengineering studies for the development of a maritime common use facility at potentialsite locations in the Pilbara region.
Kimberley Science and Conservation Strategy Western Australian MarineScience Institute
The Government has committed $12 million over six years (of which $8 million will bespent by 2014-15) to the Western Australian Marine Science Institute to conduct marineresearch in the Kimberley region. This research will seek to address the challenge ofmanaging investment and natural resource decisions.
Kimberley Science and Conservation Strategy Integrated MarineObservation System
A total of $2 2 million will be spent from 2011-12 to 2013-14 on the delivery of theIntegrated Marine Observation System in the Kimberley region, which will capture datato improve the understanding of ocean currents, model the role of oceans in climatechange, assist to predict seasonal climate change variations, and assist in the managementof marine resources.
Non-Kimberley Western Australian Marine Science Institute
A total of $1 5 million will be spent in 2011-12 on the development of a science planincluding key performance indicators, for marine research to inform policy developmentand management of the State's marine environment in non-Kimberley regions includingthe Pilbara, Ningaloo and Shark Bay areas.
Non-Kimberley Integrated Marine Observation System
A total of $3 8 million will be spent from 2011-12 to 2013-14 on the delivery of thenon-Kimberley components of the Integrated Marine Observation System.
144

General Government Expenses
MINISTER FOR ENERGY; TRAINING AND WORKFORCEDEVELOPMENT; INDIGENOUS AFFAIRS
Table 11
POLICY DECISIONS AND OTHER MAJOR CHANGES SINCE2010-11 MID-YEAR REVIEW
Office of Energy
2010-11$m
2011-12$m
2012-13$m
2013-14$m
2014-15$m
State Underground Power Program -5.0
Horizon Power (a)
Operating Subsidy 16.9 27.7 17.4 9.5Community Service Obligations -2.4 -2.8 -2.4 -2.8
Synergy (a)
Operating Subsidy 131.0 349.6 346.5 194.6 101.9Community Service Obligations 2.7 -6.2 -7.3 -4.8 -1.4Feed-In-Tariff -5.9 -6.5 -12.6 -24.1 30.3
Training and Workforce DevelopmentAdditional Training Places Critical Skills
Shortage 22.7Additional Training Places Workforce
Participation 10.7Royalties for Regions Skills Training
Initiatives 30.5 2.5
Indigenous AffairsAboriginal Community Patrols 0.8 1.3Clontarf Hostel Expansion 2.0Royalties for Regions Aboriginal
Community Emergency Response Fund 0.8 2.5 2.5 2.5Royalties for Regions Governance and
Leadership Development Program 1.6 0.7
(a) Represented in general government expenses as grants and subsidies from the Consolidated Account, paid through theDepartment of Treasury.
Office of Energy
State Underground Power Program
Expenditure on the State Underground Power Program in 2014-15 will be reviewedpending the outcome of the Economic Regulation Authority's inquiry into the costs andbenefits of the Program. Spending of $29 3 million is currently funded from 2010-11 to2013-14.
Horizon Power
Operating Subsidy
Additional expenditure of $71 5 million over 2010-11 to 2014-15 has been approved tofund the operating costs of Horizon Power that are not covered by tariffs due to thesecontinuing to remain below cost-reflective levels. Further details are provided inAppendix 9: Tariffs, Fees and Charges.
145

2011-12 Economic and Fiscal Outlook
Community Service Obligations
Reduced expenditure of $10 4 million over 2010-11 to 2014-15 is due to lower rates forrebates and concessions as a consequence of lower electricity tariff increases thanpreviously assumed in the forward estimates.
Synergy
Operating Subsidy
Additional expenditure of $1.12 billion over 2010-11 to 2014-15 has been approved tofund a revenue shortfall for Synergy due to electricity tariffs continuing to remain belowcost-reflective levels. Further details are provided in Appendix 9: Tariffs, Fees andCharges. Without this subsidy from general government revenue, Synergy wouldexperience an operating loss estimated at around $287 million in 2011-12 (at the EarningBefore Interest Tax level).
Community Service Obligations
Reduced expenditure of $17 million over 2010-11 to 2014-15 is due to lower rates forrebates and concessions as a consequence of lower electricity tariff increases thanpreviously forecast.
Feed-in-Tariff
To ensure the feed-in-tariff scheme remains sustainable in the long-term, the Governmenthas reduced the feed-in-tariff rate from 40 cents to 20 cents per kilowatt hour. Combinedwith higher than previously forecast uptake of the scheme, this decision will reduceexpenditure by a net $18.8 million over the five years to 2014-15.
Training and Workforce Development
Additional Training Places Critical Skills Shortage
An additional $22 7 million will be spent in 2011-12 to provide 7,500 additional trainingplaces in areas of critical skills shortage. These places are targeted at critical occupationsin demand as identified in the State priority occupation list, and annually produced list ofjobs that are in high demand or considered industry-critical.
Additional Training Places Workforce Participation
An additional $10 7 million will be spent in 2011-12 to provide 4,546 additional trainingplaces to increase workforce participation, including $1 9 million for 480 Indigenousworkforce participation places. This training is expected to assist groups with lowworkforce participation rates enter or return to the workforce, including women withyoung children, older workers, Indigenous people, rural and remote residents andmigrants from culturally and linguistically diverse background.
146
General Government Expenses
Collectively, these initiatives will result in an increase in the total number of trainingplaces from 134,000 in 2008 to 168,000 in 2011, providing the skills required to meetindustry demand as the State's economy expands.
Royalties for Regions Skills Training Initiative
A total of $33 million will be spent over two years from 2011-12 to develop skills andtraining initiatives in regional Western Australia. This includes an allocation for thefuture development of Muresk and student accommodation in Kalgoorlie.
Indigenous Affairs
Aboriginal Community Patrols
An additional $2.1 million will be spent from 2010-11 to 2011-12 to provide metropolitancommunity patrols and additional community patrols in several key regional areas.The patrols provide support to Aboriginal people by minimising and/or preventingconflicts.
Clontarf Hostel Expansion
A grant of $2 million in 2011-12 has been provided to the Indigenous Land Corporation.This grant will increase the number of beds from 80 to 120 in the new facility underconstruction for the Clontarf Aboriginal Academy Hostel. This will allow moreIndigenous students from across the State to continue their secondary education in a moreconducive and constructive environment.
Royalties for Regions Aboriginal Community Emergency Response Fund
An additional $10 million will be set aside in 2011-12 to establish a fund, administered bythe Aboriginal Affairs Coordinating Committee. Over the period to 2014-15, an amountof $8 1 million will be spent to enable 'time critical' responses to emerging crises andcritical infrastructure needs in regional and remote communities.
Royalties for Regions Governance and Leadership Development Program
An additional $2 3 million will be spent over two years from 2011-12 for the developmentof a program to improve corporate and community governance and leadership, including areview of regional governance models for the Kimberley and Pilbara.
147

2011-12 Economic and Fiscal Outlook
MINISTER FOR TRANSPORT; HOUSING
Table 12POLICY DECISIONS AND OTHER MAJOR CHANGES SINCE
2010-11 MID-YEAR REVIEW
Main Roads
2010-11$m
2011-12$m
2012-13$m
2013-14$m
2014-15$m
CHOGM Traffic Support 1.5Road Asset Improvements 6.0Royalties for Regions Karratha
Wickham Coast Road 2.5Mitchell Freeway Widening (Hepburn
Avenue to Hodges Drive) 0.1 0.1Murdoch Drive Intersection Upgrade 0.1Road Maintenance 21.6Local Government Grants 8.0Road Trauma Trust Fund (RTTF) -21.5 -8.8 -4.3 -1.7 -1.7
TransportTransit Concept and Feasibility
Studies -0.3 3.6 2.3Perth Parking Fund Central Area
Transit (CAT) Services 1.0 1.2 1.6 2.1 2.1Transport Network Planning 0.6 0.8Infrastructure and Communications
Technology Delivery to OtherAgencies 1.3 1.3 1.3 1.3 1.3
Accommodation Leasing Costs 1.2 1.3 1.3 1.4Royalties for Regions Country Aged
Pension Fuel Card 2.6Port links Project Planning 5.0
Public Transport Authority (a)
Additional Bus Service Kilometres 7.2 16.5 26.3 36.9Additional Bus Service Kilometres
Parameter Adjustment -3.9 -8.6 -12.3 -15.7Bus Service to Austin Cove Baptist
College (b) 0.2 0.2 0.2 0.2Transit Concept and Feasibility
Studies 1.5 4.0Ellenbrook Public Transport Master
Plan -10.0Depreciation Associated with the
Freight Network -7.1 -12.4 -14.8 -14.8 -14.8Additional Depreciation -0.2 4.0 5.2 11.5 15.0Seniors Card Entitlements 0.3 0.3 0.3 0.4CHOGM Additional Services 0.3
Housing Authority (a)
Remote Area Essential ServicesProgram 25.3
Town Reserves RegularisationProgram 6.0
Royalties for Regions ImprovingWater Quality in RemoteIndigenous Communities 2.4 9.8
(a) Represented in general government expenses as grants and subsidies from the Consolidated Account, paid through theDepartment of Treasury.
(b) Amount less than $50,000.
148
General Government Expenses
Main Roads
Commonwealth Heads of Government Meeting Traffic Support
A total of $1 5 million will be spent in 2011-12 on activities, such as traffic operations,required to support CHOGM.
Road Asset Improvements
An additional $6 million will be spent in 2010-11 on road improvements and bridgeimprovement works funded from local government and private sector user third partycontributions.
Royalties for Regions Karratha Wickham Coast Road
A total of $2 5 million will be spent in 2011-12 on planning works associated with theKarratha Wickham Coast Road.
Mitchell Freeway Widening (Hepburn Avenue to Hodges Drive)
Spending of $100,000 in 2013-14 and $125,000 in 2014-15 has been allocated formaintenance works associated with the recently approved widening of the northboundcarriageway of the Mitchell Freeway between Hepburn Avenue and Hodges Drive.
Murdoch Drive Intersection Upgrade
Maintenance works costing $100,000 will be undertaken in 2014-15, associated with therecently approved intersection upgrades at South Street and Murdoch Drive.
Road Maintenance
In 2014-15, $21 6 million will be spent to address maintenance associated with roadnetwork expansions, and roads transferred from local government to State ownership, forwhich such expenditure had not been allocated previously.
Local Government Grants
In 2014-15, $8 million will be spent on local government roads under the State RoadFunds to Local Government Agreement.
Road Trauma Trust Fund
Estimated speed and red light camera infringement revenue has been revised down acrossthe forward estimates. Consequently, the estimated funds automatically transferred to theRoad Trauma Trust Fund (RTTF) will reduce, together with RTTF expenditure of$21.5 million in 2010-11, $8.8 million in 2011-12, $4 3 million in 2012-13 and$1.7 million per annum in 2013-14 and 2014-15.
149
2011-12 Economic and Fiscal Outlook
Importantly however, the Government has decided to increase the proportion of speed andred light camera infringement revenue that is automatically allocated to the RTTF, fromthe current one-third proportion to two-thirds in 2011-12 and to 100% from 2012-13.This will significantly increase the funding for road safety programs, police trafficenforcement, road building and maintenance, community education programs, andschool-based programs in coming years.
Transport
Transit Concept and Feasibility Studies
A total of $5.5 million will be spent to undertake planning for public transit initiatives,including light rail options, bus priority in the North East corridor/Ellenbrook and in thePerth central business district. This will be carried out in conjunction with the PublicTransport Authority (PTA).
Perth Parking Fund CAT Services
An additional $8 million will be spent from 2010-11 to 2014-15 to deliver CAT servicesin the Central Business District, funded from the Perth Parking Fund.
Transport Network Planning
A total of $1 4 million will be spent in 2010-11 and 2011-12 to deliver the RegionalFreight, Metropolitan Transport Network, and Metropolitan Freight and Intermodal Plans.
Infrastructure and Communications Technology Delivery to OtherAgencies
A total of $1 3 million per annum will be spent from 2010-11 to 2014-15 to provide ICTservices to the Department of Planning ($898,000) and the Department of RegionalDevelopment and Lands ($442,000).
Accommodation Leasing Costs
A total of $5 2 million will be spent over four years to meet additional maintenance andfacilities management costs of new premises as part of the implementation of theDepartment's move to 140 William Street.
Royalties for Regions Country Aged Pension Fuel Card
An additional $2 6 million will be spent in 2011-12 to provide benefits of the CountryAged Pension Fuel Card Scheme to a wider population due to an expansion in eligibilityacross demographic categories and post code boundaries.
Port links Project Planning
A total of $5 million will be spent in 2011-12 to investigate a proposal to augmenttransport corridors linking the Goldfields region to regional ports.
150

General Government Expenses
Public Transport Authority
Additional Bus Service Kilometres
An additional $87 million will be spent over four years from 2011-12 on operating costsassociated with providing additional bus services in the Perth metropolitan area (bringingtotal spending on this initiative by the PTA to $133.6 million).
Additional Bus Service Kilometres Parameter Adjustment
The PTA's appropriation will be reduced by $40 5 million over four years from 2011-12due to additional revenue from new and existing services, partially offset by interest anddepreciation costs associated with the purchase of additional buses.
Bus Service to Austin Cove Baptist College
A total of $868,000 will be spent from 2010-11 to 2014-15 on a dedicated school specialbus service from Mandurah Station to Austin Cove Baptist College in South Yunderup.
Transit Concept and Feasibility Studies
A total of $5 5 million will be spent over two years from 2011-12 to deliver the NorthernSuburbs Railway and North East corridor/Ellenbrook railway reservation plans, inconjunction with the Department of Transport.
Ellenbrook Public Transport Master Plan
Expenditure of $10 million allocated in 2012-13 for planning of the Ellenbrook Railwayline will be reallocated to transit concept and feasibility studies associated with the PublicTransport Master Plan.
Depreciation Associated with the Freight Network
The Authority's appropriation will be reduced by $63 8 million from 2010-11 to 2014-15as funding will no longer be provided for depreciation associated with the FreightNetwork leased by West Net Rail. Under the network lease arrangements, the asset mustbe returned to the PTA in fit-for-purpose condition. Therefore, it is unlikely that this assetwill need to be completely replaced. Accordingly, there is no need to provide thesignificant accrual appropriation that would otherwise fund the depreciation associatedwith this asset. On this basis, funding previously allocated for rail freight networkdepreciation has been withdrawn. The Department of Treasury is currently reviewingrelated depreciation Holding Account issues from a whole-of-government perspective.
Additional Depreciation
Additional appropriation totalling $35 5 million over five years from 2010-11 will beprovided to fund increases in depreciation for all non-Freight Network assets.
151
2011-12 Economic and Fiscal Outlook
Seniors Card Entitlements
Due to the expanded eligibility for the Seniors Card, there will be a reduction in transportfare revenue. Additional appropriation of $1 2 million over four years from 2011-12 willbe provided to meet the revenue foregone.
Commonwealth Heads of Government Meeting Additional Services
Additional appropriation of $333,000 will be provided in 2011-12 for costs associatedwith providing additional public transport services during CHOGM, and to meet the costof providing free public transport on 28 October 2011.
Housing Authority
Remote Area Essential Services Program
Additional expenditure of $25 3 million in 2011-12 has been budgeted to continue theprovision of power, water and wastewater services to 91 remote Indigenous communitiesunder the Remote Area Essential Services Program.
Town Reserves Regularisation Program
An additional $6 million will be spent in 2011-12 to continue the upgrade of essentialservices (power, water and wastewater) infrastructure to appropriate standards, includingthe provision of a level of essential services to approximately 54 town-servicedIndigenous communities, equivalent to that which would be applied to any othercommunity of similar size and location.
Royalties for Regions Improving Water Quality in Remote IndigenousCommunities
An additional $12 2 million will be spent over two years from 2011-12 to upgrade andexpand existing water infrastructure in up to 16 Indigenous communities.
152

General Government Expenses
MINISTER FOR CHILD PROTECTION; COMMUNITYSERVICES; SENIORS AND VOLUNTEERING; WOMEN'SINTERESTS; YOUTH
Table 13POLICY DECISIONS AND OTHER MAJOR CHANGES SINCE
2010-11 MID-YEAR REVIEW
Child ProtectionGrowth in Demand for Child Protection
2010-11$m
2011-12$m
2012-13$m
2013-14$m
2014-15$m
Services 12.2 12.6 12.9 13.3Hardship Utility Grant Scheme and
Financial Counselling Services 6.1Indexation for Child Protection
Non-Government Human ServicesSector 1.9 2.4 2.9 5.4 8.0
Acute Homeless Night Shelter 0.2 0.6 0.6
CommunitiesSeniors Cost of Living Rebates 9.1 9.7 10.3 10.9Seniors Card Eligibility 0.1 1.4 2.8Upgrades to Child Care, Family and
Neighbourhood Centres 1.4Royalties for Regions Continuation of
Occasional Childcare Services 0.3 0.3 0.1
Child Protection
Growth in Demand for Child Protection Services
An additional $51 million will be spent over four years to enable the Department toadequately address forecast increases in demand for child protection services in 2011-12and beyond.
Hardship Utility Grants Scheme and Financial Counselling Services
An additional $6 1 million will be spent in 2011-12 for the Hardship Utility GrantScheme (HUGS) to continue to assist people in financial hardship to maintain connectionto essential services, including electricity, water and gas. This brings total spending onthe HUGS scheme in 2011-12 to $10.1 million
Indexation for Child Protection Non-Government Human Services Sector
An additional $20 5 million will be spent from 2010-11 to 2014-15 to enable NFPorganisations faced with rising costs to continue to deliver services to at-risk families andindividuals.
153
2011-12 Economic and Fiscal Outlook
Acute Homeless Night Shelter
An additional $1 4 million will be spent from 2012-13 to 2014-15 on the operation of anew acute homeless night shelter, primarily for men in Perth. This initiative includes$4 million in capital spending for the construction of the shelter (see Chapter 6: AssetInvestment).
Communities
Seniors Cost of Living Rebates
In recognition of the difficulties faced by seniors on low or fixed incomes in dealing withthe rising costs of living, the Seniors Cost of Living Rebate will be increased from$104.80 to $150 for singles and from $157.22 to $225 for couples (who both hold aSeniors Card) from 2011-12. This is estimated to cost $40 million over four years.
Seniors Card Eligibility
An additional $4 3 million will be spent from 2012-13 to 2014-15 to meet the cost ofextending the Seniors card working hours criterion from an average of 20 hours per weekto 25 hours per week. This will result in an estimated additional 4,500 seniors becomingeligible for the Seniors Card.
Upgrades to Child Care, Family and Neighbourhood Centres
An additional $1 4 million will be spent in 2011-12 to address urgent maintenancerequirements for the 71 childcare, family and neighbourhood centres and communityhouses managed by the Department.
Royalties for Regions Continuation of Occasional Childcare Services
An additional $0 7 million will be spent from 2010-11 to 2012-13 to enable thecontinuation of support to the Occasional Childcare Program in regionalWestern Australia, which provides families with a child aged up to six years with accessto flexible and inclusive early childhood education and childcare services.
154
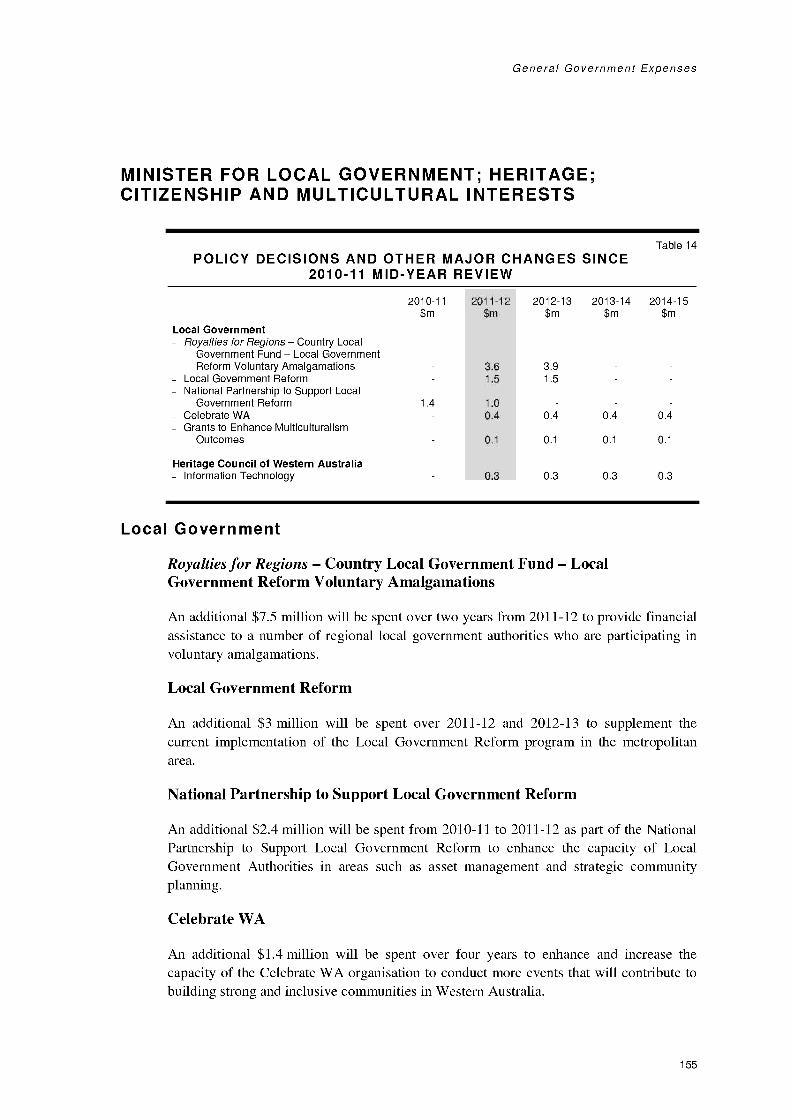
General Government Expenses
MINISTER FOR LOCAL GOVERNMENT; HERITAGE;CITIZENSHIP AND MULTICULTURAL INTERESTS
Table 14POLICY DECISIONS AND OTHER MAJOR CHANGES SINCE
2010-11 MID-YEAR REVIEW
2010-11 2011-12 2012-13 2013-14 2014-15$m $m $m $m $m
Local GovernmentRoyalties for Regions Country Local
Government Fund Local GovernmentReform Voluntary Amalgamations 3.6 3.9
Local Government Reform 1.5 1.5National Partnership to Support Local
Government Reform 1.4 1.0Celebrate WA 0.4 0.4 0.4 0.4Grants to Enhance Multiculturalism
Outcomes 0.1 0.1 0.1 0.1
Heritage Council of Western AustraliaInformation Technology 0.3 0.3 0.3 0.3
Local Government
Royalties for Regions Country Local Government Fund LocalGovernment Reform Voluntary Amalgamations
An additional $7 5 million will be spent over two years from 2011-12 to provide financialassistance to a number of regional local government authorities who are participating involuntary amalgamations.
Local Government Reform
An additional $3 million will be spent over 2011-12 and 2012-13 to supplement thecurrent implementation of the Local Government Reform program in the metropolitanarea.
National Partnership to Support Local Government Reform
An additional $2.4 million will be spent from 2010-11 to 2011-12 as part of the NationalPartnership to Support Local Government Reform to enhance the capacity of LocalGovernment Authorities in areas such as asset management and strategic communityplanning
Celebrate WA
An additional $1 4 million will be spent over four years to enhance and increase thecapacity of the Celebrate WA organisation to conduct more events that will contribute tobuilding strong and inclusive communities in Western Australia.
155

2011-12 Economic and Fiscal Outlook
Grants to Enhance Multiculturalism Outcomes
A total of $400,000 will be spent over four years to support the peak multicultural bodiesto act on behalf of multicultural communities in Western Australia on all aspects ofmulticulturalism and ethnic affairs.
Heritage Council of Western Australia
Information Technology
A total of $1 1 million will be spent over four years on the recurrent costs associated withthe replacement of the Heritage Council's core business system and essential informationtechnology equipment.
156
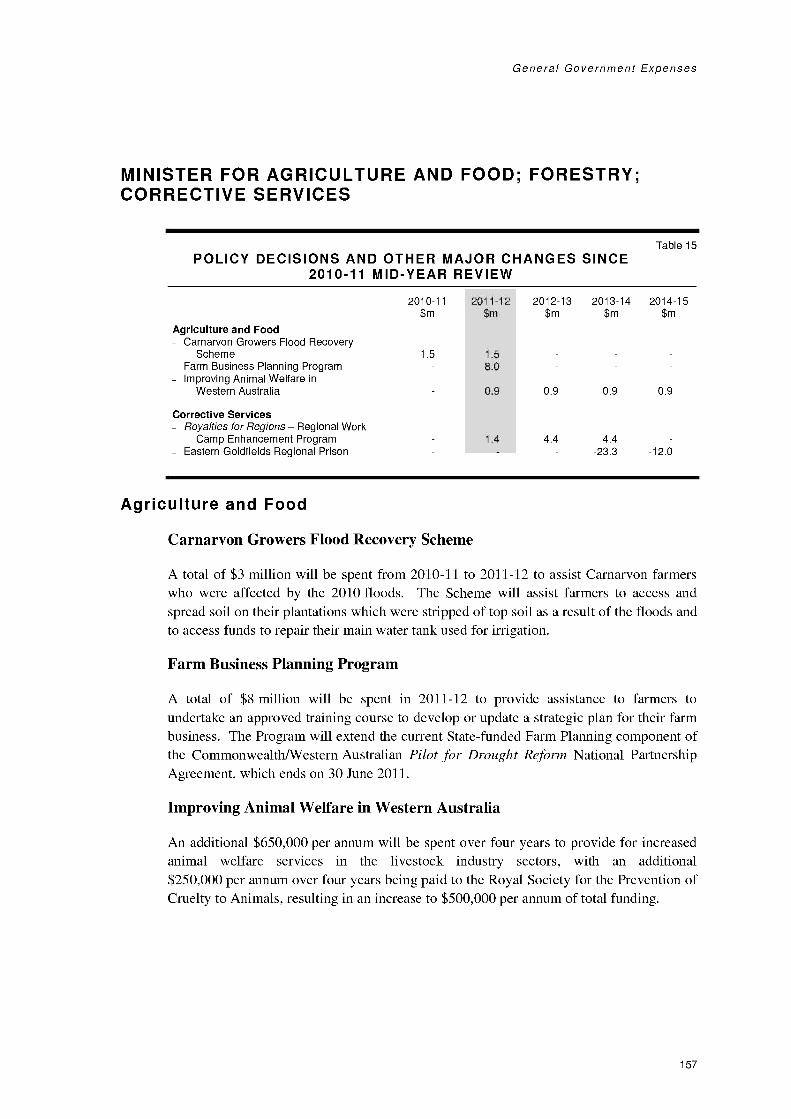
General Government Expenses
MINISTER FOR AGRICULTURE AND FOOD; FORESTRY;CORRECTIVE SERVICES
Table 15POLICY DECISIONS AND OTHER MAJOR CHANGES SINCE
2010-11 MID-YEAR REVIEW
2010-11 2011-12 2012-13 2013-14 2014-15$m $m $m $m $m
Agriculture and FoodCarnarvon Growers Flood Recovery
Scheme 1.5 1.5Farm Business Planning Program 8.0Improving Animal Welfare in
Western Australia 0.9 0.9 0.9 0.9
Corrective ServicesRoyalties for Regions Regional Work
Camp Enhancement Program 1.4 4.4 4.4Eastern Goldfields Regional Prison -23.3 -12.0
Agriculture and Food
Carnarvon Growers Flood Recovery Scheme
A total of $3 million will be spent from 2010-11 to 2011-12 to assist Carnarvon farmerswho were affected by the 2010 floods. The Scheme will assist farmers to access andspread soil on their plantations which were stripped of top soil as a result of the floods andto access funds to repair their main water tank used for irrigation.
Farm Business Planning Program
A total of $8 million will be spent in 2011-12 to provide assistance to farmers toundertake an approved training course to develop or update a strategic plan for their farmbusiness. The Program will extend the current State-funded Farm Planning component ofthe Commonwealth/Western Australian Pilot for Drought Reform National PartnershipAgreement, which ends on 30 June 2011.
Improving Animal Welfare in Western Australia
An additional $650,000 per annum will be spent over four years to provide for increasedanimal welfare services in the livestock industry sectors, with an additional$250,000 per annum over four years being paid to the Royal Society for the Prevention ofCruelty to Animals, resulting in an increase to $500,000 per annum of total funding.
157
2011-12 Economic and Fiscal Outlook
Corrective Services
Royalties for Regions Regional Work Camp Enhancement Program
A total of $10 2 million will be spent from 2011-12 to 2013-14 on the operation of newwork camps at Roebourne and Gnowangerup to provide appropriate offenderaccommodation in the Pilbara and to provide opportunities for prisoners to undertakereparative activities in regional locations across the State.
Eastern Goldfields Regional Prison
The recurrent cashflows for the Custodial Infrastructure Program have been aligned withthe decision to proceed with procuring the Eastern Goldfields Regional Prison as aDesign, Build, Finance, and Maintain model of a Public Private Partnership.
158

General Government Expenses
MINISTER FOR ENVIRONMENT; WATER
Table 16POLICY DECISIONS AND OTHER MAJOR CHANGES SINCE
2010-11 MID-YEAR REVIEW
Environment and ConservationKimberley Science and Conservation
Strategy Establishment andManagement of Camden Sound and
2010-11$m
2011-12$m
2012-13$m
2013-14$m
2014-15$m
Eighty Mile Beach Marine Parks 1.2 1.5 1.5 1.5Kimberley Science and Conservation
Strategy Expanding Partnerships in theKimberley 1.5 1.9 2.5 3.0
Royalties for Regions Establishment andManagement of Capes and DampierMarine Parks 2.6 3.1 3.3 2.0
Threatened Species 0.3 0.3 0.3 0.3Turning the Tide with Phytophthora Dieback 0.3 0.3 0.3 0.3
Swan River TrustNutrient Intervention Systems 0.5 0.9 1.2 0.6
WaterProjects Funded from External Revenue 14.9 4.7 2.6 0.6
Water Corporation (a)West Pi lbara Desalination Plant -0.2 -4.4 -29.8 -47.0 -47.5Seniors Card 0.2 0.2 0.2 0.3
(a) Represented in general government expenses as grants and subsidies from the Consolidated Account, paid through theDepartment of Treasury.
Environment and Conservation
Kimberley Science and Conservation Strategy - Establishment andManagement of Camden Sound and Eighty Mile Beach Marine Parks
A total of $5 7 million will be spent over four years to establish and manage new marineparks in the Kimberley at Camden Sound and Eighty Mile Beach. These marine parksaim to conserve Western Australia's key marine, coastal and intertidal environments inthe Kimberley and provide opportunities for Indigenous training and employment in theregion.
Kimberley Science and Conservation Strategy - Expanding Partnerships inthe Kimberley
A total of $9 million will be spent over four years to enable the Department to engage inon-land conservation activities, in partnership with local Indigenous communities,pastoralists and non-government organisations.
159

2011-12 Economic and Fiscal Outlook
Royalties for Regions Establishment and Management of Capes andDampier Marine Parks
A total of $11 million will be spent over four years to establish and manage new marineparks at the Capes and Dampier sites. These marine parks aim to conserveWestern Australia's key marine, coastal and intertidal environments and provideopportunities for Indigenous training and employment in the regions.
Threatened Species
An additional $1 million will be spent over four years to continue and expand existingconservation programs for threatened flora and fauna in Western Australia.
Turning the Tide with Phytophthora Dieback
An additional $1 million will be spent over four years to manage the impact and spread ofPhytophthora Dieback in the South West region of Western Australia.
Swan River Trust
Nutrient Intervention Systems
A total of $3 2 million will be spent over four years to implement nutrient interventionstrategies, including establishing artificial wetlands at the Bayswater and Ellen BrookCatchments, to reduce the flow of nitrogen and phosphorous into the Swan-Canning riversystem.
Water
Projects Funded from External Revenue
An additional $22 8 million will be spent from 2010-11 to 2013-14 relating to an agreedwork plan in accordance with signed contracts with external parties such as the Bureau ofMeteorology and other State Government agencies.
Water Corporation
West Pilbara Desalination Plant
Recent heavy rainfall in the region has provided the Government with the opportunity todefer the development of the West Pilbara Desalination Plant and consider alternativeoptions for meeting future demand for water in the Pilbara, including provision by theprivate sector. Accordingly, the Government will not be providing the projectedoperating subsidy payment to the Water Corporation for the supply of desalinated water inthe region.
160
General Government Expenses
Seniors Card
Western Australian Seniors Card holders are eligible for concessions on their fixed watersupply charge and may be eligible for concessions on their water usage charges.Amendments to the Seniors Card eligibility criteria, which increase the working hoursallowance from 20 hours to 25 hours per week, is estimated to broaden eligibility by afurther 4,500 people. The increase in the number of customers eligible for a concessionwill lead to a reduction in the Water Corporation's revenue received from customers.A subsidy will be paid to the Water Corporation to reimburse it for the shortfall.
161

2011-12 Economic and Fiscal Outlook
MINISTER FOR MENTAL HEALTH; DISABILITY SERVICES
Table 17POLICY DECISIONS AND OTHER MAJOR CHANGES SINCE
2010-11 MID-YEAR REVIEW
Mental Health Commission
2010-11$m
2011-12$m
2012-13$m
2013-14$m
2014-15$m
Community Living Support Services 2.7 7.4 7.5 7.5Joondalup/Rockingham Intermediate Care
Units -12.8Lifeline WA 0.5Youth Focus 0.3 0.3 0.3 0.3
Disability Services CommissionGrowth Funding Accommodation Support
Services 6.0 6.2 6.5Growth Funding Other Services 2.0 12.5 13.0 13.5Western Australian Motor Industry
Foundation Vehicles Fitted WithWheelchair Hoists 0.4 0.4 0.4 0.4
Additional Indexation to the DisabilityNon-Government Human ServicesSector 1.7 3.0 7.2 18.0 29.6
Mental Health Commission
Community Living Support Services
A total of $25 2 million will be spent over four years to provide individualised support to100 mental health clients transitioning from inpatient mental health facilities intocommunity living. This initiative will facilitate the sustained recovery of people with amental illness and is linked to the provision of 100 additional community-based homes forpeople with a mental illness.
Joondalup/Rockingham Intermediate Care Units
An amount of $12.8 million will be reallocated from the Mental Health Commission'srecurrent funding in 2010-11 to the Department of Housing in 2011-12 for theconstruction of intermediate care units in Joondalup and Rockingham. These units willassist the transition of mental health clients from inpatient facilities in public hospitalsinto community living.
Lifeline WA
A one-off grant of $500,000 in 2011-12 will be provided to Lifeline WA to train anadditional 60 telephone counsellors to expand the delivery of suicide telephone crisissupport.
162

General Government Expenses
Youth Focus
A total of $1 2 million will be spent over four years on Youth Focus to expand its team ofpsychologists and social workers and allow an additional 210 young people experiencingmental illness to be provided with early intervention and prevention services.
Disability Services Commission
Growth Funding Accommodation Support Services
An additional $18.7 million will be spent from 2012-13 to 2014-15 to provideaccommodation support services for an increase in the number of high need disabilityservices clients to be accommodated in social housing and other forms of supportedliving. These services will provide the care and support that is needed to achieveindependent living and community and social inclusion, and supplement the provision ofcapital funding for the Housing Authority to provide an additional 169 dwellings fordisability services clients.
Growth Funding Other Services
An additional $40 9 million will be spent over four years to meet the expected growth indemand for preventative and other disability services, and to ensure a continuation of theNeurodegenerative Conditions Coordinated Care Program. This expenditure will allow afurther 1,297 people with a disability to receive an additional range of new and improvedservices, such as respite options, therapy, access to aids and equipment, and carer supportservices.
Western Australian Motor Industry Foundation Vehicles Fitted WithWheelchair Hoists
An additional $1 6 million will be spent over four years to fund the purchase andmaintenance of 40 modified vehicles with wheelchair hoists by the Western AustralianMotor Industry Foundation, for loaning to families with children with severe or profounddisabilities.
Additional Indexation to the Disability Non-Government Human ServicesSector
An additional $59 5 million will be spent from 2010-11 to 2014-15 to disability NFPorganisations to offset the impact of increases in wage and inflationary cost pressures.This expenditure will ensure the sustainability and capacity of disability NFPorganisations engaged by the Disability Services Commission for the provision ofessential disability services.
163
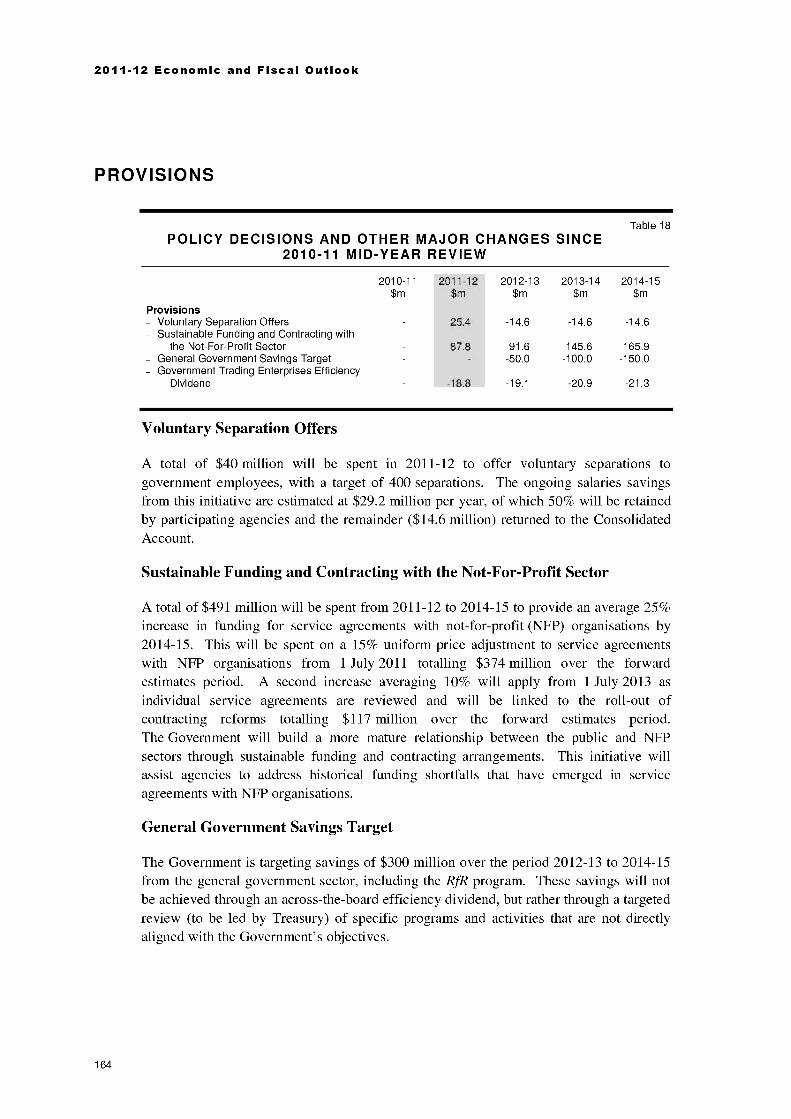
2011-12 Economic and Fiscal Outlook
PROVISIONS
Table 18POLICY DECISIONS AND OTHER MAJOR CHANGES SINCE
2010-11 MID-YEAR REVIEW
2010-11$m
Provisions
2011-12$m
2012-13$m
2013-14$m
2014-15$m
Voluntary Separation Offers 25.4 -14.6 -14.6 -14.6Sustainable Funding and Contracting with
the Not-For-Profit Sector 87.8 91.6 145.6 165.9General Government Savings Target -50.0 -100.0 -150.0Government Trading Enterprises Efficiency
Dividend -18.8 -19.1 -20.9 -21.3
Voluntary Separation Offers
A total of $40 million will be spent in 2011-12 to offer voluntary separations togovernment employees, with a target of 400 separations. The ongoing salaries savingsfrom this initiative are estimated at $29 2 million per year, of which 50% will be retainedby participating agencies and the remainder ($14 6 million) returned to the ConsolidatedAccount.
Sustainable Funding and Contracting with the Not-For-Profit Sector
A total of $491 million will be spent from 2011-12 to 2014-15 to provide an average 25%increase in funding for service agreements with not-for-profit (NFP) organisations by2014-15. This will be spent on a 15% uniform price adjustment to service agreementswith NFP organisations from 1 July 2011 totalling $374 million over the forwardestimates period. A second increase averaging 10% will apply from 1 July 2013 asindividual service agreements are reviewed and will be linked to the roll-out ofcontracting reforms totalling $117 million over the forward estimates period.The Government will build a more mature relationship between the public and NFPsectors through sustainable funding and contracting arrangements. This initiative willassist agencies to address historical funding shortfalls that have emerged in serviceagreements with NFP organisations.
General Government Savings Target
The Government is targeting savings of $300 million over the period 2012-13 to 2014-15from the general government sector, including the RJR program. These savings will notbe achieved through an across-the-board efficiency dividend, but rather through a targetedreview (to be led by Treasury) of specific programs and activities that are not directlyaligned with the Government's objectives.
164
General Government Expenses
Government Trading Enterprises Efficiency Dividend
An annual 5% efficiency dividend applied to the discretionary operating expenditure ofGovernment Trading Enterprises (GTEs) from 2011-12 is expected to reduce net debt by$515 million by 30 June 2015. Where these corporations pay tax equivalents anddividends, the increase in profitability is expected to improve revenue flows togovernment. For those agencies that do not provide a return to government, namely thePTA and Housing Authority, there will be a reduction in subsidy appropriationsequivalent to the savings. This is expected to reduce general government sector expensesby $80.2 million over four years. A detailed overview of revenue from, and expenses to,individual public corporations can be found in Appendix 8: Public Corporations Impacton General Government Revenue and Expenses.
165

2011-12 Economic and Fiscal Outlook
166
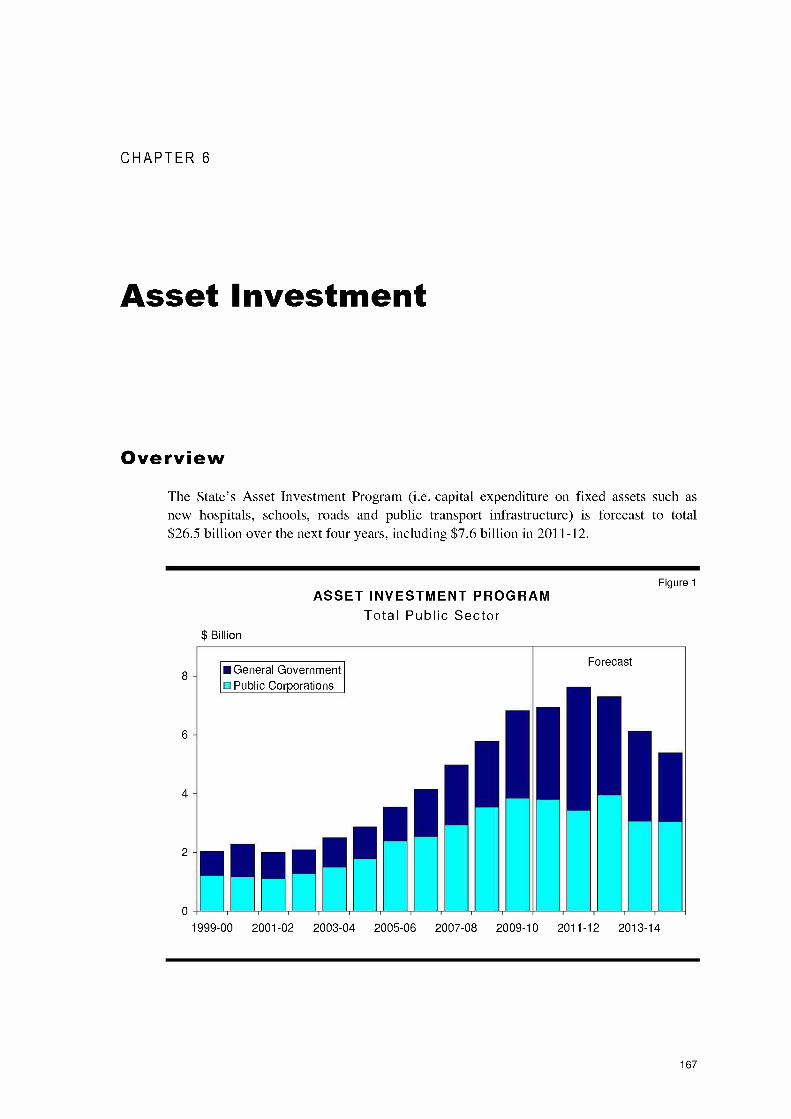
CHAPTER 6
Asset Investment
Overview
The State's Asset Investment Program (i.e. capital expenditure on fixed assets such asnew hospitals, schools, roads and public transport infrastructure) is forecast to total$26.5 billion over the next four years, including $7.6 billion in 2011-12.
ASSET INVESTMENT PROGRAMTotal Public Sector
$ Billion
Figure 1
2-
0
General GovernmentPublic Corporations
p!I
Forecast
1999-00 2001-02 2003-04 2005-06 2007-08 2009-10 2011-12 2013-14
167

2011-12 Economic and Fiscal Outlook
The Asset Investment Program balances the need to support the community through thedelivery of social infrastructure with the provision of economic infrastructure necessary tosustain the State's growth.
Supporting our Community Delivering Major SocialInfrastructure for Future Generations
Perth Waterfront Project
Planning for the Perth Waterfront Project is well underway, with earthworks scheduled tocommence in early 2012 and the project due to be completed in mid-2014. Net of landsales revenue, the State Government will invest $270 million to deliver this project.
Perth City Link
Across the forward estimates period (2011-12 to 2014-15), the State Government willprovide $57 million towards the Perth City Link project, which will go towardsaccelerating the development of the City Square. This is in addition to State-fundedspending of $226 million for the sinking of the Perth to Fremantle railway line (betweenPerth Station and Milligan Street) and the construction of a new underground WellingtonStreet Bus Station.
Health
Across the budget projection period (2011-12 to 2014-15), the Department of Health willspend $4.5 billion on health infrastructure. In 2011-12, $1.6 billion will be spent,including:
$542 million for the Fiona Stanley Hospital project and $107 million for the StateRehabilitation Service at the Fiona Stanley Hospital site. These projects are on timeand on budget and due to open in 2014;
$92 million to commence construction on the New Children's Hospital at the QueenElizabeth II Medical Centre (QEIIMC) site;
$64 million for the continuation and expansion of the privately operated JoondalupHealth Campus development;
$26 million to continue the planning for the construction of the new Midland HealthCampus;
the redevelopment of facilities at the QEIIMC site, including $161 million for theCentral Plant project, $28 million for the PathWest facility, $21 million for theSir Charles Gairdner Hospital (SCGH) Cancer Centre stage 2, $14 million for theWestern Australian Institute for Medical Research, and $7 million for the SCGHinpatient Mental Health Unit; and
168
Asset Investment
the ongoing redevelopment and expansion of country hospitals and medical facilities,including $94 million on the Albany Health Campus, $34 million for theEast Kimberley Development Package, $20 million for the Kalgoorlie HealthCampus, and $9 million for the commencement of the Busselton Health Campus.
Education
Across the budget forecast period (2011-12 to 2014-15), the Department of Education willinvest $1.6 billion in schools infrastructure throughout the state with an amount of$850 million to be spent in 2011-12. Overall, the Asset Investment Program will see:
the commencement of construction of four new primary schools at East Dalyellup,Pearsall, Baynton West (Karratha) and West Byford at a total cost of $69 million,with all to open in 2013;
construction on Stage Two of Karratha Senior High School ($46 million), theredevelopment of Dongara District High School ($30 million), Bullsbrook DistrictHigh School ($20 million) and Exmouth District High School ($15 million), additionsand improvements to Harvey Agricultural College ($25 million), and upgrades forstudent and staff accommodation at Narrogin, Cunderdin, Morawa and DenmarkAgricultural Colleges ($18 million); and
$52 million for the expansion of air-conditioning to schools that were previouslyoutside the nominated air-cooling zones.
Law and Order
This budget includes a significant new investment in information and communicationstechnology (ICT) for the Western Australia Police, including:
$48 million, from 2011-12 to 2014-15, on the replacement of core police ICTbusiness systems; and
$42 5 million, over the period 2011-12 to 2013-14, on a program of ICT infrastructurereplacement to mitigate operational risks and support the delivery of services byfrontline police and operational staff.
A further $10 million over three years (from 2011-12 to 2013-14) has been allocated forthe replacement of old and increasingly unsupported technology to enable the courts toprovide contemporary, high quality services to the community. This includes completionof the Integrated Courts Management System, which will underpin the efficientmanagement of all court processes.
169
2011-12 Economic and Fiscal Outlook
Housing
This budget allocates $150.7 million over three years to provide an additional 284 homesacross the State for people who are impaired significantly by a disability, living withmental illness, or with significant alcohol and drug-related difficulties. This includesexpenditure in 2011-12 of:
$44 million for 83 dwellings to house 167 people with disabilities;
$46 million for construction of 100 dwellings for people with mental illness; and
$8 million to build 15 dwellings for high need clients of the Drug and Alcohol Office.
Sporting Infrastructure
This budget allocates $13 million over two years for planning and design work for a newmajor stadium, and $2 million for planning of a new purpose-built centre for theWestern Australian Institute of Sport.
New Museum
In 2011-12, $5 million will be spent to progress further planning for a new museum thatdefines its architectural requirements and integrates some of the Western AustralianMuseum's existing displays and heritage buildings, with a view to contributing to therevitalisation of the Perth Cultural Centre.
Building the State Investing Now to Keep the Growth GoingInto the Future
Energy
Investment in energy infrastructure will total $4.2 billion over the next four years,including $1.3 billion in 2011-12. Key initiatives include:
over $1 billion on transmission and distribution capacity within the Western Powerand Horizon Power networks to support growth and improve reliability and safety.This includes the ongoing State and Pilbara Underground Power projects;
continuation of construction of a new power station at Carnarvon, at a total cost of$80 million, with completion scheduled for 2013-14. $56 million will be spent onthis project in 2011-12; and
completion of construction at the Kwinana Power Station of two high efficiency gasturbines with total capacity of 200 MW at a cost of $263 million, with $22 million tobe spent in 2011-12.
170
Asset Investment
Water
Investment in water and wastewater infrastructure will total $3.6 billion over the next fouryears, including $860.7 million in 2011-12. Significant projects include:
$113 million in 2011-12 on completing construction of the Southern SeawaterDesalination Plant at Binningup;
$140 6 million over two years to facilitate the provision of water and wastewaterdistribution infrastructure to meet Perth's rapidly growing land developmentrequirements; and
$3 5 million on the East Rockingham Wastewater Treatment scheme in 2011-12, aspart of a total investment of $244.2 million over the next four years.
Public Transport
The major areas of investment in public transport in this budget include:
the addition of 158 buses to the bus fleet between 2011-12 and 2017-18, at a cost of$88 million;
the acquisition of an additional 15 three-car train sets at a cost of $164 million, with$137 million to be outlaid over the forward estimates to 2014-15; and
construction of the 7.5 km extension of the Joondalup line to Butler, at an estimatedcost of $240.7 million, including expenditure in 2011-12 of $46.5 million
Roads
The Main Roads Asset Investment Program (2011-12 to 2014-15) includes expenditure of$2.2 billion on Western Australia's road system. An amount of $646 3 million will bespent in 2011-12, including:
$82 9 million for the Great Eastern Highway (Kooyong Road to Tonkin Highway) forthe construction of a dual carriageway due to be completed in 2014-15;
$60 9 million for the Great Eastern Highway interchange at Roe Highway due to becompleted in 2012-13;
$52 6 million for Kwinana Freeway widening between Leach Highway andRoe Highway due to be completed in 2012-13;
$50 million to extend the dual carriageway on Dampier Highway from Karrathatowards the Burrup Peninsula Road due to be completed in 2013-14;
$49 9 million for Great Northern Highway upgrade works in Port Hedland due to becompleted in 2013-14;
171
2011-12 Economic and Fiscal Outlook
$37 6 million for the Bunbury Port Access Project due to be completed in 2014-15;
$24 5 million for the Reid Highway, Mirrabooka Avenue interchange due to becompleted in 2012-13; and
$6 million for widening the northbound carriageway of Mitchell Freeway from two tothree lanes from Hepburn Avenue to Hodges Drive (the total cost of this project isestimated at $30 million over 2011-12 and 2012-13) due to be completed in 2012-13.
Industrial Land
A total of $84 million has been allocated over the next four years to secure land at theShotts Industrial Park near Collie and upgrade vital water and road infrastructure.The industrial estate is a strategic project providing industrial land to the coal industry fordownstream processing, and will become a major economic contributor to the region.
Major Infrastructure Spending Changesby PortfolioSummary
The following tables provide details of major changes in total public sector infrastructurespending by agency since the 2010-11 Mid-year Review was released in December 2010.These include all policy decisions made between the cut-off date for the2010-11 Mid-year Review (1 December 2010) and the cut-off date for this budget(20 April 2011), and other changes of a material nature affecting agency infrastructurespending over the forward estimates period (e.g. variations to Commonwealth-fundedprograms, revisions to costs for existing infrastructure, etc.).
The timing of cashflows for some previously announced projects may have also beenrevised but are not included in this chapter as they are broadly net debt neutral across theforward estimates period. Further details on individual projects are contained inBudget Paper No. 2: Budget Statements. Any material timing changes are discussed inChapter 3: Financial Projections and Fiscal Strategy.
1 72
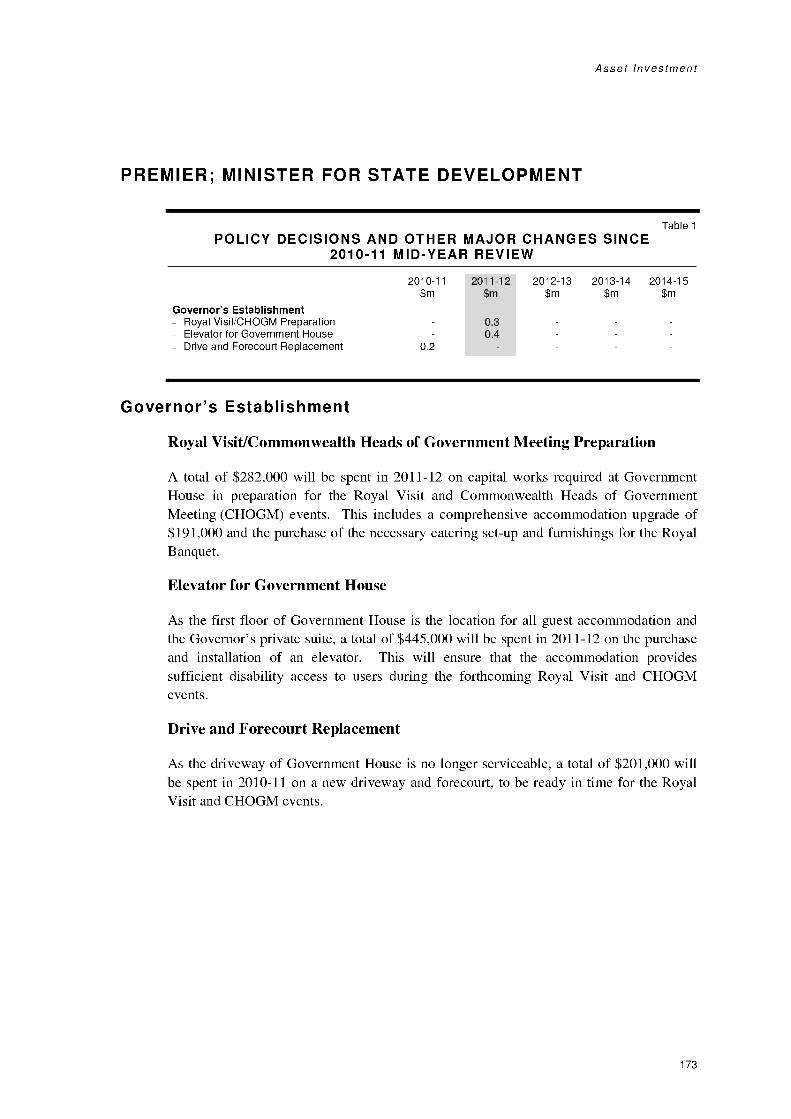
Asset Investment
PREMIER; MINISTER FOR STATE DEVELOPMENT
Table 1
POLICY DECISIONS AND OTHER MAJOR CHANGES SINCE2010-11 MID-YEAR REVIEW
2010-11 2011-12 2012-13 2013-14 2014-15$m $m $m $m $m
Governor's EstablishmentRoyal Visit/CHOGM Preparation 0.3Elevator for Government House 0.4Drive and Forecourt Replacement 0.2
Governor's Establishment
Royal Visit/Commonwealth Heads of Government Meeting Preparation
A total of $282,000 will be spent in 2011-12 on capital works required at GovernmentHouse in preparation for the Royal Visit and Commonwealth Heads of GovernmentMeeting (CHOGM) events. This includes a comprehensive accommodation upgrade of$191,000 and the purchase of the necessary catering set-up and furnishings for the RoyalBanquet.
Elevator for Government House
As the first floor of Government House is the location for all guest accommodation andthe Governor's private suite, a total of $445,000 will be spent in 2011-12 on the purchaseand installation of an elevator. This will ensure that the accommodation providessufficient disability access to users during the forthcoming Royal Visit and CHOGMevents.
Drive and Forecourt Replacement
As the driveway of Government House is no longer serviceable, a total of $201,000 willbe spent in 2010-11 on a new driveway and forecourt, to be ready in time for the RoyalVisit and CHOGM events.
173
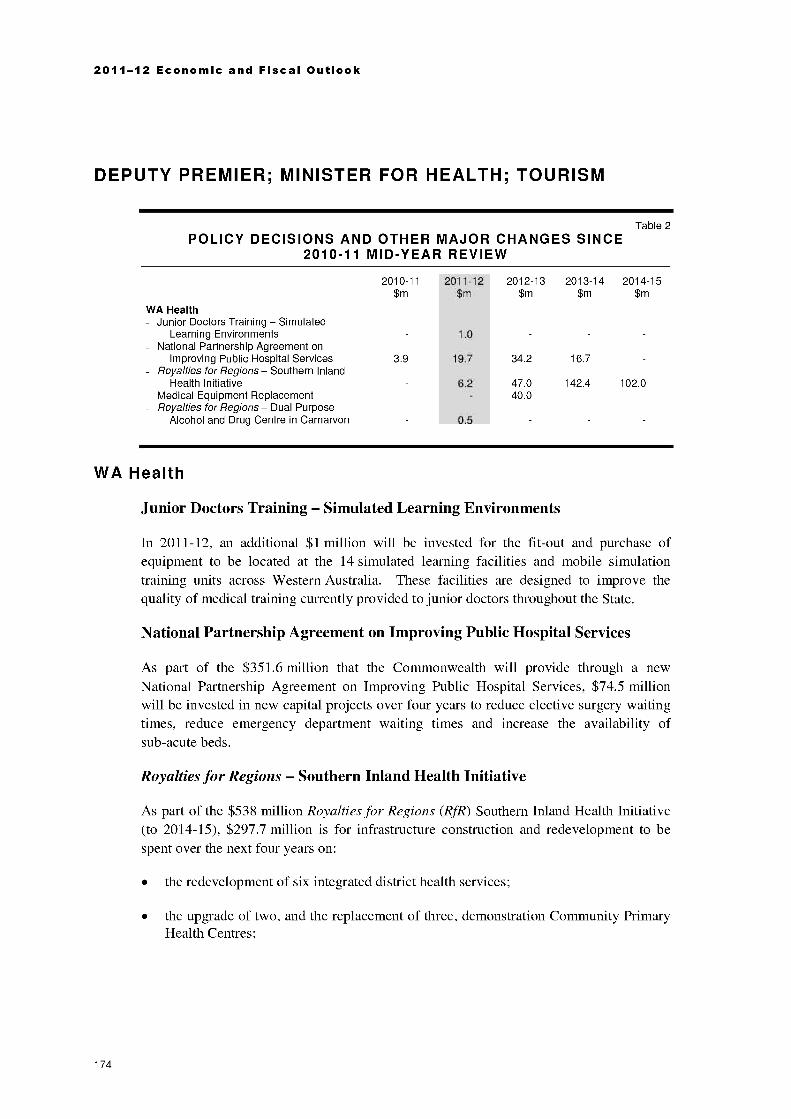
2011-12 Economic and Fiscal Outlook
DEPUTY PREMIER; MINISTER FOR HEALTH; TOURISM
Table 2POLICY DECISIONS AND OTHER MAJOR CHANGES SINCE
2010-11 MID-YEAR REVIEW
2010-11 2011-12 2012-13 2013-14 2014-15$m $m $m $m $m
WA HealthJunior Doctors Training Simulated
Learning Environments 1.0National Partnership Agreement on
Improving Public Hospital Services 3.9 19.7 34.2 16.7Royalties for Regions Southern Inland
Health Initiative 6.2 47.0 142.4 102.0Medical Equipment Replacement 40.0Royalties for Regions Dual Purpose
Alcohol and Drug Centre in Carnarvon 0.5
WA Health
Junior Doctors Training Simulated Learning Environments
In 2011-12, an additional $1 million will be invested for the fit-out and purchase ofequipment to be located at the 14 simulated learning facilities and mobile simulationtraining units across Western Australia. These facilities are designed to improve thequality of medical training currently provided to junior doctors throughout the State.
National Partnership Agreement on Improving Public Hospital Services
As part of the $351 6 million that the Commonwealth will provide through a newNational Partnership Agreement on Improving Public Hospital Services, $74 5 millionwill be invested in new capital projects over four years to reduce elective surgery waitingtimes, reduce emergency department waiting times and increase the availability ofsub-acute beds.
Royalties for Regions Southern Inland Health Initiative
As part of the $538 million Royalties for Regions (RJR) Southern Inland Health Initiative(to 2014-15), $297 7 million is for infrastructure construction and redevelopment to bespent over the next four years on:
the redevelopment of six integrated district health services;
the upgrade of two, and the replacement of three, demonstration Community PrimaryHealth Centres;
174

Asset Investment
refurbishment of 16 health facilities, two small hospital replacements, two nursingpost replacements, and the purchase of land at Jurien Bay for a future health facilitydevelopment; and
expanding the capacity and availability of Telehealth technology to maximise thedelivery of health services across the catchment area.
Medical Equipment Replacement
The medical equipment replacement program will be boosted with additional spending of$40 million in 2012-13 taking the total spend for 2011-12 to 2012-13 to $98.5 million
Royalties for Regions Dual Purpose Alcohol and Drug Centre in Carnarvon
In 2011-12, an additional $500,000 will be spent by the Drug and Alcohol Office tosupport the construction of a dual purpose counselling and sobering-up centre inCarnarvon that reduces harm related to alcohol use.
1 75

2011-12 Economic and Fiscal Outlook
MINISTER FOR MINES AND PETROLEUM; FISHERIES;ELECTORAL AFFAIRS
Table 3POLICY DECISIONS AND OTHER MAJOR CHANGES SINCE
2010-11 MID-YEAR REVIEW
2010-11 2011-12 2012-13 2013-14 2014-15$m $m $m $m $m
FisheriesEntitlements Management System 7.4 3.3 0.7Abrolhos Islands Upgrade of Public
Moorings and Jetties 0.3 1.5Kimberley Science and Conservation
Strategy Establishment andManagement of Eighty Mile BeachMarine Park 0.3
Fisheries
Entitlements Management System
Expenditure totalling $11.4 million will be incurred over three years, commencing in2011-12, for the development of an Entitlements Management System (EMS) to providean interactive web portal for the management of the State's commercial fisheries.The EMS will feature centralised data input and storage capacity, streamlined licensingservices, and e-business and quota trading capability.
Abrolhos Islands Upgrade of Public Moorings and Jetties
Additional expenditure of $250,000 in 2010-11 will be incurred to construct fifteen publicmoorings at popular safe anchorage points in the Abrolhos Islands for use by recreationaland charter vessels. A total of $1 5 million will also be spent in 2012-13 to replace theBeacon Island public jetty.
Kimberley Science and Conservation Strategy Establishment andManagement of Eighty Mile Beach Marine Park
A total of $300,000 will be spent in 2011-12 to procure an inshore patrol vessel to be usedby the Department to conduct compliance patrols at the proposed Eighty Mile BeachMarine Park, south of Broome.
176

Asset Investment
MINISTER FOR REGIONAL DEVELOPMENT; LANDS;MINISTER ASSISTING THE MINISTER FOR STATEDEVELOPMENT
Table 4POLICY DECISIONS AND OTHER MAJOR CHANGES SINCE
2010-11 MID-YEAR REVIEW
Regional Development and LandsRoyalties for Regions Pi lbara Cities
2010-11$m
2011-12$m
2012-13$m
2013-14$m
2014-15$m
Strategic Infrastructure -50.0Royalties for Regions Seasonal Staff
Accommodation in Coral Bay 6.9 6.9
Western Australian Land AuthorityShotts Industrial Park Collie Infrastructure
Upgrades 1.1 11.6 1.4 0.4 0.2Royalties for Regions Seasonal Staff
Accommodation in Coral Bay 0.7Strategic Development Plan -12.0 34.5 106.1 -23.5 -46.7
Western Australian Land InformationAuthority (Landgate)Electronic Conveyancing Enterprise 2.8 2.4
Regional Development and Lands
Royalties for Regions Pilbara Cities Strategic Infrastructure
A reduction in capital expenditure of $50 million on this project has been approved, andreallocated to the recurrent component of the initiative to reflect the likelihood that someof the infrastructure provided under this program is to be built and owned by entitiesoutside the State public sector.
Royalties for Regions Seasonal Staff Accommodation in Coral Bay
In 2010-11 and 2011-12, $13 9 million will be spent from RJR to deliver the second stageof this project, which will provide affordable and appropriate accommodation for seasonalstaff workers at Coral Bay. The first stage, which related to the delivery of headworks forthe site, was previously allocated $2.1 million in the 2010-11 Budget.
177

2011-12 Economic and Fiscal Outlook
Western Australian Land Authority
Shotts Industrial Park Collie Infrastructure Upgrades
An additional $14 7 million from 2010-11 to 2014-15 will be spent on the relocation ofcommunications, road and water infrastructure that crosses the site area within the ShottsIndustrial Park to be occupied by the proponent Perdaman Chemicals and Fertilisers'.Also included is a component to meet rental shortfalls and estate holding costs duringPerdaman's pre-construction, construction and commissioning period.
Royalties for Regions Seasonal Staff Accommodation in Coral Bay
In 2010-11, $705,000 will be spent to assist with the preliminary work required for thepreparation and construction of the seasonal staff accommodation facility in Coral Bay inconjunction with the Baiyungu Aboriginal Corporation.
Strategic Development Plan
The Strategic Development Plan (SDP) reflects the Western Australian Land Authority'sstrategic direction in terms of land sales, acquisitions and development expenditure.The 2011-12 to 2014-15 SDP reflects increased activity based on the response to newpriority projects in the metropolitan region such as the Claremont North East Precinct andaccelerated land delivery programs in areas such as Alkimos, Broome, Karratha andKununurra.
Western Australian Land Information Authority (Landgate)
Electronic Conveyancing Enterprise
Expenditure of $5 2 million over two years from 2010-11 has been approved forWestern Australia's equity share in the proposed Electronic ConveyancingEnterprise (ECE). The ECE is a partnership between the New South Wales, Queensland,Victorian and Western Australian Governments and the major four banks, which willbuild, implement and operate the Electronic Conveyancing System. The System willmove the property conveyancing and land titling industry from paper based to electronicprocesses.
178
Asset Investment
TREASURER; ATTORNEY GENERAL
Table 5POLICY DECISIONS AND OTHER MAJOR CHANGES SINCE
2010-11 MID-YEAR REVIEW
2010-11 2011-12 2012-13 2013-14 2014-15$m $m $m $m $m
Attorney Generale-Courts/Completion of Integrated Courts
Management System 3.3 3.3 3.3
TreasuryICT Separation of Building Management
and Works 3.2ICT Equipment Replacement 2.2 2.1
Attorney General
e-Courts/Completion of Integrated Courts Management System
From 2011-12, the Government will invest $10 million over three years to upgrade andreplace core business systems, extend the Integrated Courts Management System to thecriminal jurisdiction, and extend services across court jurisdictions.
Treasury
ICT Separation of Building Management and Works
In 2009, the Building Management and Works (BMW) business unit was transferred fromthe Department of Housing (DoH). A total of $3 2 million will be spent in 2011-12 toallow the department to deliver a complete technical separation of all linked ICT servicesand data held between BMW and DoH.
ICT Equipment Replacement
An amount of $4 4 million will be spent over 2011-12 and 2012-13 to replace existingICT equipment that is reaching or exceeding its capacity. This equipment supports keywhole-of-government systems, including Treasury's budget management system and theRevenue Collection Information System.
179
2011-12 Economic and Fiscal Outlook
MINISTER FOR EDUCATION
Table 6POLICY DECISIONS AND OTHER MAJOR CHANGES SINCE
2010-11 MID-YEAR REVIEW
2010-11 2011-12 2012-13 2013-14 2014-15$m $m $m $m $m
EducationInvestment in School Infrastructure 20.0 36.0 21.0 40.0Expansion of Air Conditioning Policy 11.0 11.0 15.0 15.0
Education
Investment in School Infrastructure
An additional $77 million will be spent over four years from 2011-12 for thecommencement of planning and construction of two new high schools (opening in 2017and 2018), four new primary schools (opening in 2016), increased capacity at DalyellupSecondary College. A further $40 million will be spent over two years on preventativemaintenance commencing in 2011-12.
Expansion of Air Conditioning Policy
The Government will spend $52 million over four years from 2011-12 to expand theGovernment' s School Air Conditioning policy to around 480 schools in Western Australiathat were previously outside the nominated air-cooling zones.
180
Asset Investment
MINISTER FOR FINANCE; COMMERCE; SMALL BUSINESS
Table 7POLICY DECISIONS AND OTHER MAJOR CHANGES SINCE
2010-11 MID-YEAR REVIEW
2010-11 2011-12 2012-13 2013-14 2014-15$m $m $m $m $m
CommerceInformation and Communications
Technology 1.7 3.4 2.2
FinanceOffice of the Premier and Cabinet Services
Accommodation 2.7 22.8Government Office Accommodation Master
Plan 55.2 43.4Shared Services Corporate Reform Project 8.0 12.0 5.5
Commerce
Information and Communications Technology
A total of $7 3 million will be spent over three years for the continuation of the ICTprogram. The program consists of the ongoing replacement and development ofoperational hardware and software, addressing system stability risk and improving servicedelivery to internal and external stakeholders.
Finance
Office of the Premier and Cabinet Services Accommodation
To accommodate the relocation of the Office of the Premier and Cabinet Services, theGovernment will spend $17 million from 2010-11 to 2011-12 on Hale House forconstruction and site costs and some fit-out costs, and up to $8 5 million for planning andcontingency fees and remaining fit-out costs.
Government Office Accommodation Master Plan
A total of $42 7 million will be spent in 2011-12 to undertake the complete buildingrefurbishment of Dumas House and Albert Facey House and to remediate the externalfacade of Dumas House.
In addition, $12.5 million will be spent in 2011-12 to fit-out new premises for theDepartment of Indigenous Affairs and the Western Australia Police.
A further $43 4 million will be spent in 2014-15 for the fit-out of the Old TreasuryBuilding Redevelopment.
181
2011-12 Economic and Fiscal Outlook
Shared Services Corporate Reform Project
An amount of $25 5 million has been provisionally allocated, pending completion of thereview by the Economic Regulation Authority of the Shared Services Corporate Reformproject, to enable the retention of staff in the short and medium term. These costs arecapitalised against the project.
182
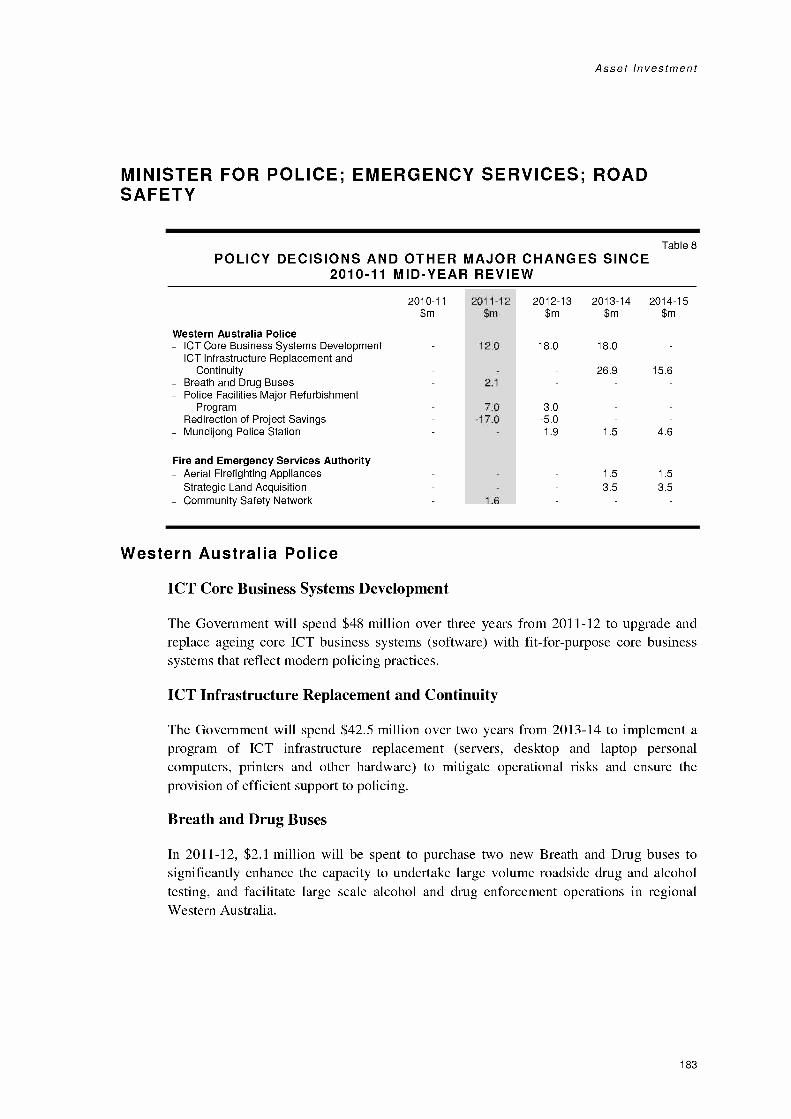
Asset Investment
MINISTER FOR POLICE; EMERGENCY SERVICES; ROADSAFETY
Table 8POLICY DECISIONS AND OTHER MAJOR CHANGES SINCE
2010-11 MID-YEAR REVIEW
2010-11$m
Western Australia Police
2011-12$m
2012-13$m
2013-14$m
2014-15$m
ICT Core Business Systems Development 12.0 18.0 18.0ICT Infrastructure Replacement and
Continuity 26.9 15.6Breath and Drug Buses 2.1Police Facilities Major Refurbishment
Program 7.0 3.0Redirection of Project Savings -17.0 -5.0Mundijong Police Station 1.9 1.5 4.6
Fire and Emergency Services AuthorityAerial Firefighting Appliances 1.5 1.5Strategic Land Acquisition 3.5 3.5Community Safety Network 1.6
Western Australia Police
ICT Core Business Systems Development
The Government will spend $48 million over three years from 2011-12 to upgrade andreplace ageing core ICT business systems (software) with fit-for-purpose core businesssystems that reflect modern policing practices.
ICT Infrastructure Replacement and Continuity
The Government will spend $42 5 million over two years from 2013-14 to implement aprogram of ICT infrastructure replacement (servers, desktop and laptop personalcomputers, printers and other hardware) to mitigate operational risks and ensure theprovision of efficient support to policing.
Breath and Drug Buses
In 2011-12, $2 1 million will be spent to purchase two new Breath and Drug buses tosignificantly enhance the capacity to undertake large volume roadside drug and alcoholtesting, and facilitate large scale alcohol and drug enforcement operations in regionalWestern Australia.
183

2011-12 Economic and Fiscal Outlook
Police Facilities Major Refurbishment Program
A further $10 million will be spent over two years from 2011-12 to enhance a program ofprogressively restoring and refurbishing ageing police facilities to a fit-for-purposestandard.
Redirection of Project Savings
Due to a better than expected tender result for the new Perth Police Complex, and afavourable exchange rate for the purchase of an additional helicopter, the Government hasbeen able to redirect $22 million over 2011-12 and 2012-13 to address other priorities:
ICT Core Business Systems Development ($10 million);
Police Facilities Major Refurbishment Program ($10 million); and
Breath and Drug buses ($2 million).
Mundijong Police Station
The Government has committed $8 million over three years from 2012-13 to construct apolice station in Mundijong to replace the current facility, which is more than 50 yearsold.
Fire and Emergency Services Authority
Aerial Firefighting Appliances
A total of $3 million will be spent over 2013-14 and 2014-15 on the replacement of twoaerial firefighting appliances to provide elevated rescue and water tower capability tomeet emergency response requirements in the major metropolitan areas of Perth andFremantle.
Strategic Land Acquisition
A total of $7 million will be spent over 2013-14 and 2014-15 for strategic landacquisitions to facilitate the construction of new and replacement career and volunteer firestations in the metropolitan and country regions.
Community Safety Network
An amount of $1.6 million will be spent in 2011-12 on digital radio equipment in firestations to provide a stable and secure communication network across the greatermetropolitan area and major regional centres.
184
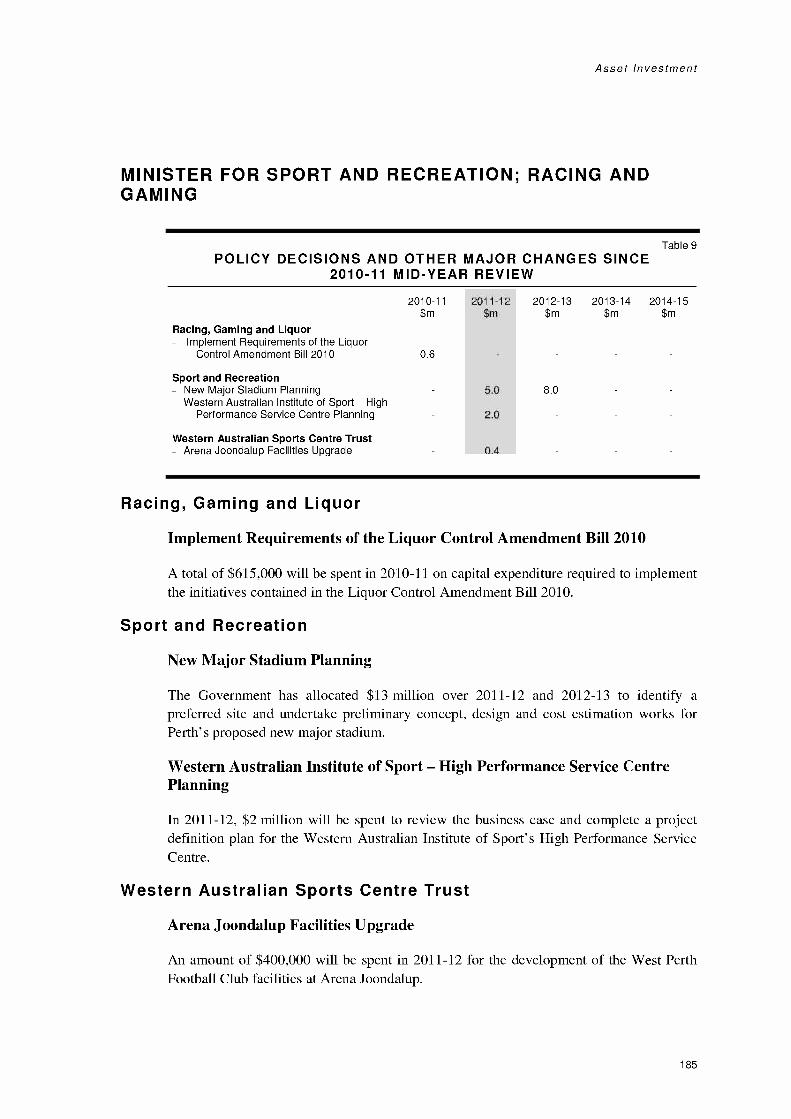
Asset Investment
MINISTER FOR SPORT AND RECREATION; RACING ANDGAMING
Table 9POLICY DECISIONS AND OTHER MAJOR CHANGES SINCE
2010-11 MID-YEAR REVIEW
2010-11 2011-12 2012-13 2013-14 2014-15$m $m $m $m $m
Racing, Gaming and LiquorImplement Requirements of the Liquor
Control Amendment Bill 2010 0.6
Sport and RecreationNew Major Stadium Planning 5.0 8.0Western Australian Institute of Sport High
Performance Service Centre Planning 2.0
Western Australian Sports Centre TrustArena Joondalup Facilities Upgrade 0.4
Racing, Gaming and Liquor
Implement Requirements of the Liquor Control Amendment Bill 2010
A total of $615,000 will be spent in 2010-11 on capital expenditure required to implementthe initiatives contained in the Liquor Control Amendment Bill 2010.
Sport and Recreation
New Major Stadium Planning
The Government has allocated $13 million over 2011-12 and 2012-13 to identify apreferred site and undertake preliminary concept, design and cost estimation works forPerth's proposed new major stadium.
Western Australian Institute of Sport High Performance Service CentrePlanning
In 2011-12, $2 million will be spent to review the business case and complete a projectdefinition plan for the Western Australian Institute of Sport's High Performance ServiceCentre.
Western Australian Sports Centre Trust
Arena Joondalup Facilities Upgrade
An amount of $400,000 will be spent in 2011-12 for the development of the West PerthFootball Club facilities at Arena Joondalup.
185

2011-12 Economic and Fiscal Outlook
MINISTER FOR PLANNING; CULTURE AND THE ARTS;SCIENCE AND INNOVATION
Table 10POLICY DECISIONS AND OTHER MAJOR CHANGES SINCE
2010-11 MID-YEAR REVIEW
East Perth Redevelopment Authority
2010-11$m
2011-12$m
2012-13$m
2013-14$m
2014-15$m
Business Plan -4.8 5.7 14.6 -7.6 7.9Perth City Link -1.7 6.6 4.8 4.9 30.1
Culture and the ArtsState Theatre Centre 13.0New Museum Planning 5.0
Western Australian Planning CommissionPerth Waterfront Project 0.4 48.0 162.2 135.9 22.3
East Perth Redevelopment Authority
Business Plan
The Business Plan for the Authority mainly reflects revised financial forecasts for all ofits key projects, such as Riverside, the Perth Cultural Centre redevelopment, and theEast Perth Power Station (excluding the Perth City Link). These revised forecasts reflectfactors such as the acceleration of planned works within the Perth Cultural Centre toensure the area is ready for CHOGM and revised costs, including those related to landacquisition.
Perth City Link
This represents the revised financial forecasts for the accelerated delivery of City Squareto coincide with the completion of the sinking of the Perth to Fremantle railway line(between the Perth Station and Milligan Street) and the construction of a newunderground Wellington Street Bus Station.
City Square will be a dynamic central destination featuring a public open place to housemajor events, alfresco dining, landscaping, water features, public art and street stalls, aswell as a new landmark civic and cultural building. City Square will also house a portalto the new underground bus station and Perth Train Station.
The increases are predominantly for increased development costs for City Square, andhigher costs for headworks such as water, sewerage and drainage services, remediationand linkage roads.
186

Asset Investment
Culture and the Arts
State Theatre Centre
An amount of $13 million will be provided in 2011-12 to meet the final contractualpayments and settlement of contractual disputes related to the new State Theatre Centrethat opened in January 2011. This brings the total cost of the project to $104 million
New Museum Planning
The Government has allocated $5 million in 2011-12 to continue planning worksassociated with a new Museum in the Perth Cultural Centre on the top of the $5 millionpreviously allocated.
Western Australian Planning Commission
Perth Waterfront Project
Expenditure of $368 8 million over five years commencing in 2010-11 has been approvedto commence the Perth Waterfront Project. Construction works including the new inlet,public realm, roads, services and infrastructure and the creation of development sites arescheduled to commence in early 2012, and be completed in mid-2014. Revenue fromland sales will offset the above outlays, and spending beyond 2014-15, by $169 1 million,with a total net cost of $270 million
187
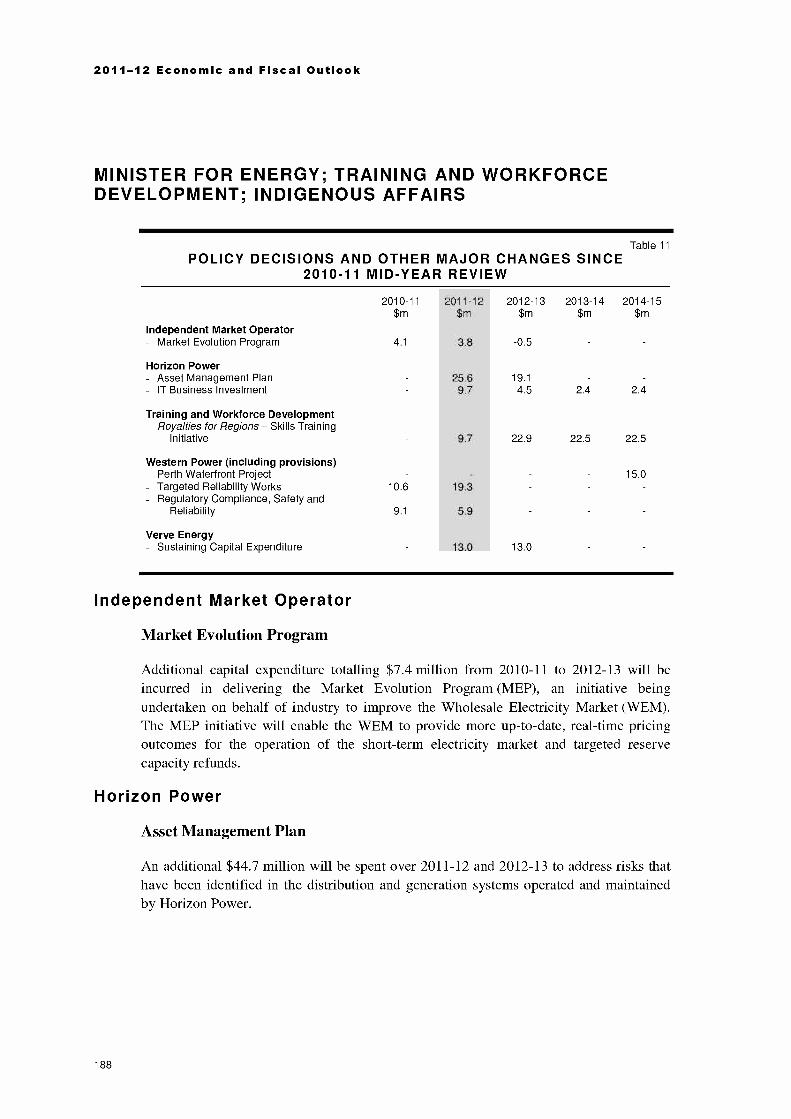
2011-12 Economic and Fiscal Outlook
MINISTER FOR ENERGY; TRAINING AND WORKFORCEDEVELOPMENT; INDIGENOUS AFFAIRS
Table 11
POLICY DECISIONS AND OTHER MAJOR CHANGES SINCE2010-11 MID-YEAR REVIEW
2010-11$m
2011-12$m
2012-13$m
2013-14$m
2014-15$m
Independent Market OperatorMarket Evolution Program 4.1 3.8 -0.5
Horizon PowerAsset Management Plan 25.6 19.1IT Business Investment 9.7 4.5 2.4 2.4
Training and Workforce DevelopmentRoyalties for Regions Skills Training
Initiative 9.7 22.9 22.5 22.5
Western Power (including provisions)Perth Waterfront Project 15.0Targeted Reliability Works 10.6 19.3Regulatory Compliance, Safety and
Reliability 9.1 5.9
Verve EnergySustaining Capital Expenditure 13.0 13.0
Independent Market Operator
Market Evolution Program
Additional capital expenditure totalling $7 4 million from 2010-11 to 2012-13 will beincurred in delivering the Market Evolution Program (MEP), an initiative beingundertaken on behalf of industry to improve the Wholesale Electricity Market (WEM).The MEP initiative will enable the WEM to provide more up-to-date, real-time pricingoutcomes for the operation of the short-term electricity market and targeted reservecapacity refunds.
Horizon Power
Asset Management Plan
An additional $44 7 million will be spent over 2011-12 and 2012-13 to address risks thathave been identified in the distribution and generation systems operated and maintainedby Horizon Power.
188
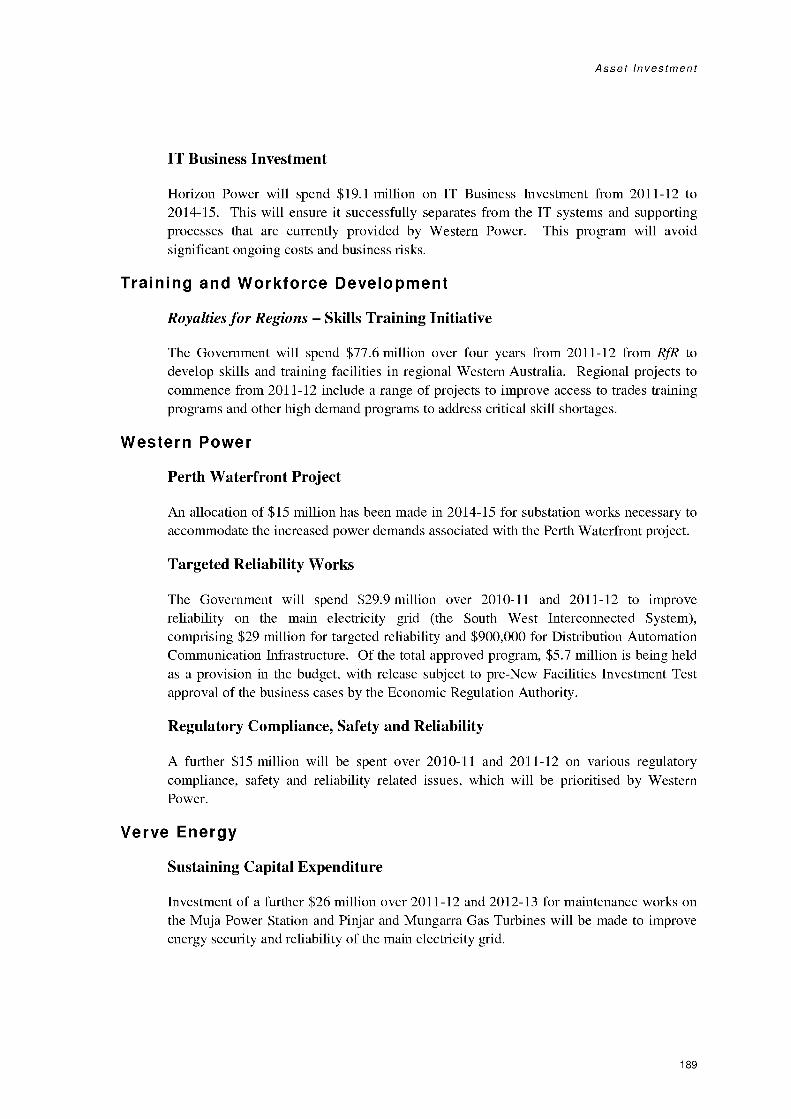
Asset Investment
IT Business Investment
Horizon Power will spend $19 1 million on IT Business Investment from 2011-12 to2014-15. This will ensure it successfully separates from the IT systems and supportingprocesses that are currently provided by Western Power. This program will avoidsignificant ongoing costs and business risks.
Training and Workforce Development
Royalties for Regions Skills Training Initiative
The Government will spend $77 6 million over four years from 2011-12 from RJR todevelop skills and training facilities in regional Western Australia. Regional projects tocommence from 2011-12 include a range of projects to improve access to trades trainingprograms and other high demand programs to address critical skill shortages.
Western Power
Perth Waterfront Project
An allocation of $15 million has been made in 2014-15 for substation works necessary toaccommodate the increased power demands associated with the Perth Waterfront project.
Targeted Reliability Works
The Government will spend $29 9 million over 2010-11 and 2011-12 to improvereliability on the main electricity grid (the South West Interconnected System),comprising $29 million for targeted reliability and $900,000 for Distribution AutomationCommunication Infrastructure. Of the total approved program, $5 7 million is being heldas a provision in the budget, with release subject to pre-New Facilities Investment Testapproval of the business cases by the Economic Regulation Authority.
Regulatory Compliance, Safety and Reliability
A further $15 million will be spent over 2010-11 and 2011-12 on various regulatorycompliance, safety and reliability related issues, which will be prioritised by WesternPower.
Verve Energy
Sustaining Capital Expenditure
Investment of a further $26 million over 2011-12 and 2012-13 for maintenance works onthe Muja Power Station and Pinjar and Mungarra Gas Turbines will be made to improveenergy security and reliability of the main electricity grid.
189

2011-12 Economic and Fiscal Outlook
MINISTER FOR TRANSPORT; HOUSING
Table 12POLICY DECISIONS AND OTHER MAJOR CHANGES SINCE
2010-11 MID-YEAR REVIEW
2010-11$m
2011-12$m
2012-13$m
2013-14$m
2014-15$m
Broome Port AuthorityLand Development Activities 2.4Purchase of Crane 1.8Occupational Health and Safety Works 3.2 1.3
Main RoadsShotts Industrial Park Collie Bridge
Improvements 3.9Coalfields Highway 10.6Great Eastern Highway 11.0 16.5 12.5 60.0Local Transport Initiative Fund 5.0 5.0 5.0 5.0Mitchell Freeway Widening (Hepburn
Avenue to Hodges Drive) 6.0 24.0Murdoch Drive Intersection Upgrade 2.5 10.0 2.5Nation Building Program 1 6.5 50.8 66.7Great Northern Highway Enhancement
Program 1.0 3.0 4.0
Dampier Port AuthorityTruck Arrestor Bed 1.4Minor Works 3.0 3.0 2.0 2.0
Housing AuthoritySpecial Needs Housing 98.5 37.8 14.4Land Acquisition 20.0Workers' Accommodation in Derby 33.2Joondalup/Rockingham Intermediate Care
Units 12.8Royalties for Regions Non-Government
Organisation Housing 25.0
Public Transport AuthorityPurchase of Additional Train Sets 16.0 42.0 49.0 30.0Bus Replacement Program -11.5 -12.7 -12.4 -13.0Additional Bus Service Kilometres 9.0 9.6 10.4 11.1
TransportNation Building Program 2 Joint
Commonwealth/State Projects 458.0
Broome Port Authority
Land Development Activities
An amount of $2 4 million will be spent in 2010-11 to undertake land developmentactivities such as installing water mains and communication lines to meet conditionsunder an option agreement to lease land.
190
Asset Investment
Purchase of Crane
An amount of $1 8 million will be spent to purchase a 100 tonne crane in 2012-13 to meetincreased loading volumes.
Occupational Health and Safety Works
An additional $3.2 million in 2011-12 and $1 3 million in 2012-13 will be spent toundertake occupational health and safety improvements works at the port.
Main Roads
Shotts Industrial Park Collie Bridge Improvements
An amount of $3 9 million will be spent in 2011-12 to undertake bridge improvementupgrade works. Along with the existing allocation of $2.2 million, a total of $6 1 millionwill be spent in 2011-12 to undertake improvement works on six bridges between theBunbury Port and the Shotts Industrial Park at Collie.
Coalfields Highway
An additional $10.6 million will be spent in 2012-13 to upgrade the Coalfields Highway.The proposed expenditure includes improvements to road safety and will complete a1.7 km section from Wellington Dam turnoff west which contains a series of tight reversecurves.
Great Eastern Highway
An additional $100 million will be spent between 2011-12 and 2014-15 to completewidening the Great Eastern Highway between Kooyong Road and Tonkin Highway.
Local Transport Initiative Fund
Additional expenditure of $20 million has been allocated between 2011-12 and 2014-15on low cost capital works to support road safety, road improvements and infrastructure forcommunity access. It is also anticipated that the additional expenditure will enableprojects unforeseen at the time of developing the annual program, and that become urgentand a priority, to be completed.
Mitchell Freeway Widening (Hepburn Avenue to Hodges Drive)
An additional $30 million will be spent between 2011-12 and 2012-13 to widen thenorthbound carriageway of the Mitchell Freeway between Hepburn Avenue and HodgesDrive from two to three lanes.
191

2011-12 Economic and Fiscal Outlook
Murdoch Drive Intersection Upgrade
An additional $15 million will be spent between 2011-12 and 2013-14 to modify theintersection of South Street and Murdoch Drive to manage the expected increases intraffic volumes mainly associated with the Fiona Stanley Hospital.
Nation Building Program 1
State matching funding, totalling $124 million, will be spent between 2011-12 and2013-14 on Perth Urban and Freight Corridor Upgrade Initiatives, subject to
Commonwealth agreement of proposed projects under the Nation Building Program 1, tocomplement Commonwealth contributions.
Great Northern Highway Enhancement Program
Project development works will commence for the proposed Great Northern HighwayEnhancement Program with $8 million to be spent between 2011-12 and 2013-14.
Dampier Port Authority
Truck Arrestor Bed
Expenditure of $1 4 million in 2010-11 has been approved to construct a truck arrestorbed in order to improve the safety of port access for heavily laden vehicles.
Minor Works
An additional $10 million will be spent over four years from 2011-12 on the Dampier PortAuthority's minor capital works, including a range of safety upgrades on roads and portentry, maintenance to improve port operations and the safe movement of vessels, andreplace outdated ICT equipment.
Housing Authority
Special Needs Housing
The Housing Authority will spend $150.7 million over three years for the provision of284 new dwellings for the high need clients of the Disability Services Commission,Mental Health Commission and Drug and Alcohol Office.
Land Acquisition
The Housing Authority will spend an additional $20 million in 2011-12 for strategicpurchases of development land in order to maintain the continuity of supply of affordablehousing lots.
192
Asset Investment
Workers' Accommodation in Derby
The Housing Authority will spend $33.2 million in 2011-12 to provide 53 additionaldwellings for Corrective Services employees in Derby resulting from the opening of thenew prison.
Joondalup/Rockingham Intermediate Care Units
An amount of $12 8 million will be reallocated in 2011-12 from the Mental HealthCommission to the Housing Authority for the construction of intermediate care units inJoondalup and Rockingham. These units will assist the transition of mental health clientsfrom inpatient facilities in public hospitals into community living.
Royalties for Regions Non-Government Organisation Housing
RJR is providing $25 million to the Housing Authority in 2010-11 to build 39 houses inregional locations for use by non-government organisations.
Public Transport Authority
Purchase of Additional Train Sets
An additional $137 million will be spent over four years from 2011-12 on the purchase ofadditional rolling stock. The total project will deliver 15 three-car train sets at a total costof $164 million, with ten of the trains to be delivered by the end of 2014-15.
Bus Replacement Program
Savings of $49 6 million on the Bus Replacement Program will be achieved overfour years from 2011-12, reflecting a decision to purchase Euro 5 'clean' diesel ratherthan compressed natural gas fuelled buses. These savings will be used to fund thepurchase of additional buses required for the Additional Bus Service Kilometres project(see below).
Additional Bus Service Kilometres
An additional $40 1 million will be spent over four years from 2011-12 on the purchase of78 additional buses to provide new services and improvements to existing services.The total project will deliver an additional 158 buses over seven years at a total cost of$88 million The Additional Bus Service Kilometres program will see bus servicekilometres increase by 3.3 million (or 6.3%) in 2011-12, and by 2015-16 onwards, busservice kilometres will have increased by 15.2 million (or 29.1%) per annum.
193
2011-12 Economic and Fiscal Outlook
Transport
Nation Building Program 2 Joint Commonwealth/State Projects
An estimated additional $458 million is expected to be spent by agencies within theTransport portfolio on transport infrastructure in 2014-15. This spending is jointly fundedby $340 million from the Commonwealth Government's Nation Building Program 2,
which is subject to Commonwealth approval, and $118 million in State-matched funding.
194
Asset Investment
MINISTER FOR CHILD PROTECTION; COMMUNITYSERVICES; SENIORS AND VOLUNTEERING; WOMEN'SINTERESTS; YOUTH
Table 13POLICY DECISIONS AND OTHER MAJOR CHANGES SINCE
2010-11 MID-YEAR REVIEW
2010-11 2011-12 2012-13 2013-14 2014-15$m $m $m $m $m
Child ProtectionAcute Homeless Night Shelter 2.0 2.0
Child Protection
Acute Homeless Night Shelter
A total of $4 million will be spent over two years from 2011-12 for the construction of anovernight shelter primarily for acute homeless men in Perth.
195
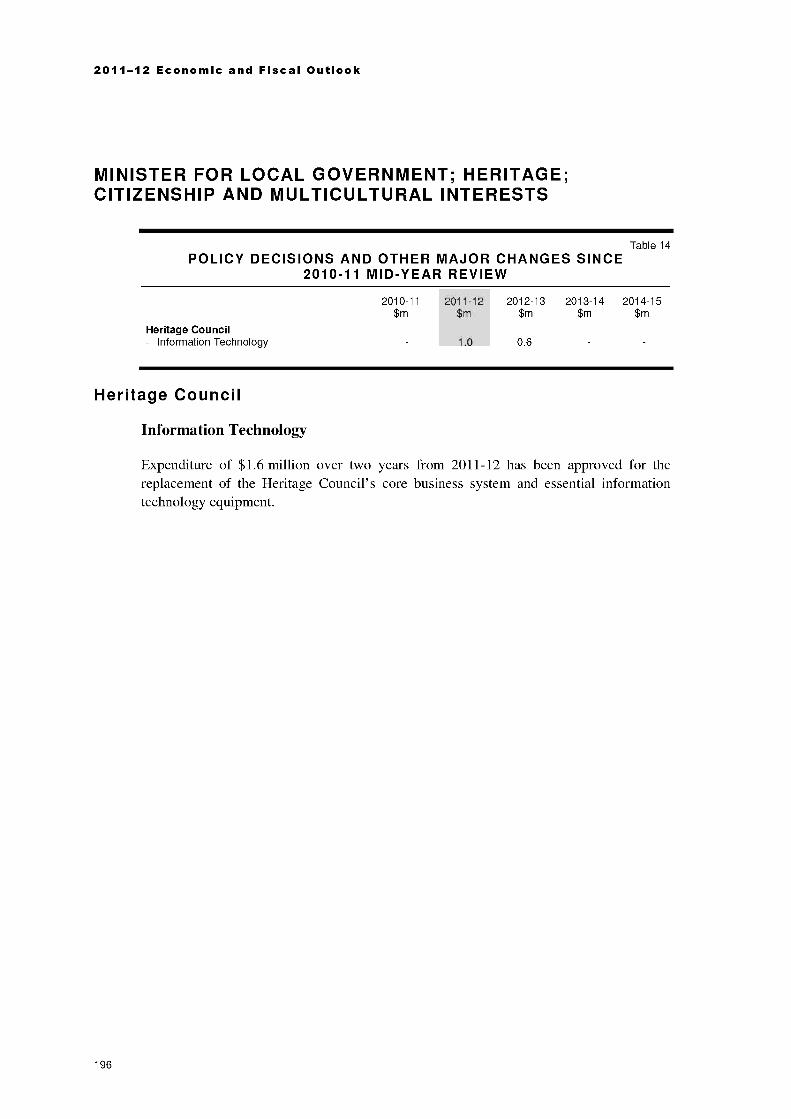
2011-12 Economic and Fiscal Outlook
MINISTER FOR LOCAL GOVERNMENT; HERITAGE;CITIZENSHIP AND MULTICULTURAL INTERESTS
Table 14POLICY DECISIONS AND OTHER MAJOR CHANGES SINCE
2010-11 MID-YEAR REVIEW
2010-11 2011-12 2012-13 2013-14 2014-15$m $m $m $m $m
Heritage CouncilInformation Technology 1.0 0.6
Heritage Council
Information Technology
Expenditure of $1 6 million over two years from 2011-12 has been approved for thereplacement of the Heritage Council's core business system and essential informationtechnology equipment.
196

Asset Investment
MINISTER FOR AGRICULTURE AND FOOD; FORESTRY;CORRECTIVE SERVICES
Table 15POLICY DECISIONS AND OTHER MAJOR CHANGES SINCE
2010-11 MID-YEAR REVIEW
Corrective ServicesEastern Goldfields Regional PrisonRoyalties for Regions Regional Work
Camp Enhancement ProgramCommunity Safety NetworkPerimeter Security ObsolescenceInfrastructure Upgrade and Maintenance
Program
Perth Market AuthorityCentral Trading Area Fire Risk Mitigation
2010-11$m
-53.7
2011-12$m
-76.7
12.24.5
16.5
8.6
5.6
2012-13$m
-28.8
3.0
4.7
2013-14$m
62.7
2014-15$m
89.5
Corrective Services
Eastern Goldfields Regional Prison
The forecast cashflows for the Eastern Goldfields Regional Prison have been adjusted toalign with the Government's decision to proceed with the procurement of the prison as adesign, build, finance, and maintain model of a Public Private Partnership.
Royalties for Regions Regional Work Camp Enhancement Program
A total of $15 2 million will be spent across two years from 2011-12 from RJR for theestablishment of the Roebourne and Gnowangerup work camps and upgrades to otherexisting regional work camps.
Community Safety Network
A total of $4 5 million will be spent in 2011-12 on capital costs for the Community SafetyNetwork. The Network will provide the Department of Corrective Services access to theexisting Western Australia Police communication network and a more stable and securecommunication platform across the greater metropolitan area and major regional centres.
Perimeter Security Obsolescence
An additional $16 5 million will be spent in 2011-12 on targeted security infrastructureupgrades designed to ensure the infrastructure continues to meet contemporary custodialstandards, including upgrade/replacement projects at the Banksia Hill Detention Centre,Bandyup and Greenough prisons.
197
2011-12 Economic and Fiscal Outlook
Infrastructure Upgrade and Maintenance Program
Additional expenditure of $8 6 million will be undertaken in 2011-12 to upgrade, replaceand maintain existing critical infrastructure at prisons and other sites across the State.
Perth Market Authority
Central Trading Area Fire Risk Mitigation
Expenditure of $10 4 million over two years from 2011-12 will be incurred for theinstallation of fire sprinklers and fire mitigation infrastructure to comply with currentBuilding Code of Australia standards in the Perth Market Authority's Central TradingArea.
198
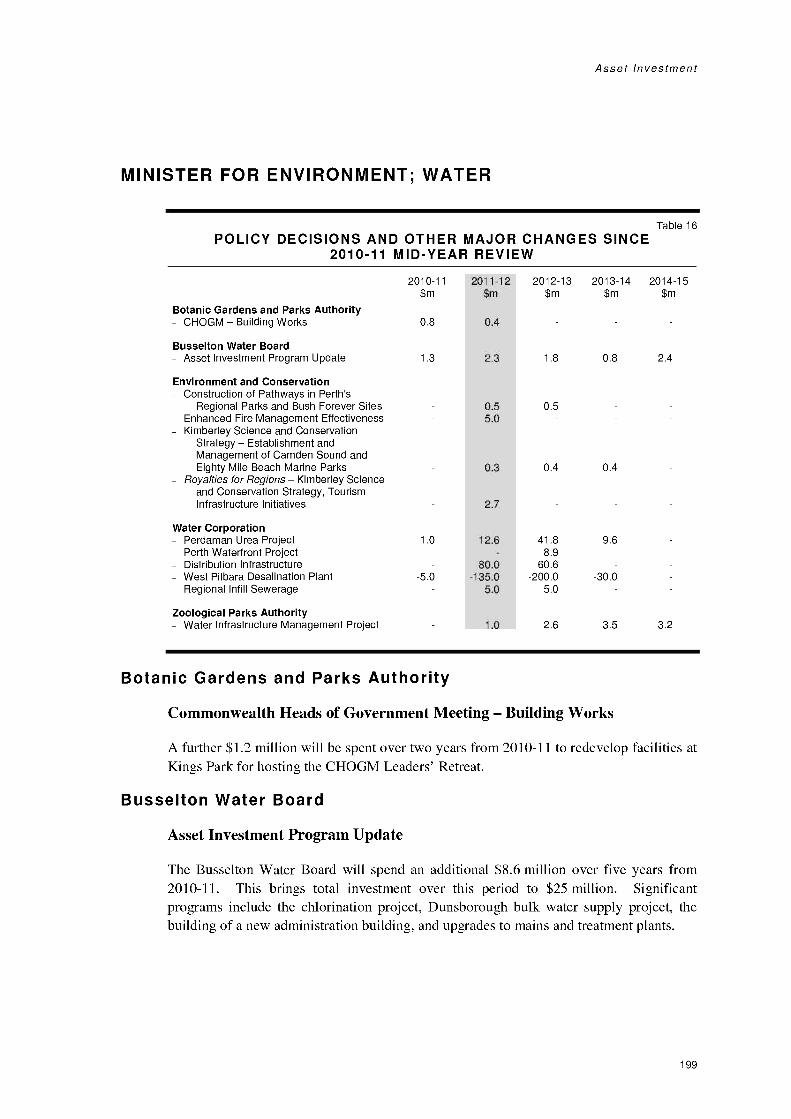
Asset Investment
MINISTER FOR ENVIRONMENT; WATER
Table 16POLICY DECISIONS AND OTHER MAJOR CHANGES SINCE
2010-11 MID-YEAR REVIEW
2010-11$m
2011-12$m
2012-13$m
2013-14$m
2014-15$m
Botanic Gardens and Parks AuthorityCHOGM Building Works 0.8 0.4
Busselton Water BoardAsset Investment Program Update 1.3 2.3 1.8 0.8 2.4
Environment and ConservationConstruction of Pathways in Perth's
Regional Parks and Bush Forever Sites 0.5 0.5Enhanced Fire Management Effectiveness 5.0Kimberley Science and Conservation
Strategy Establishment andManagement of Camden Sound andEighty Mile Beach Marine Parks 0.3 0.4 0.4
Royalties for Regions Kimberley Scienceand Conservation Strategy, TourismInfrastructure Initiatives 2.7
Water CorporationPerdaman Urea Project 1.0 12.6 41.8 9.6Perth Waterfront Project 8.9Distribution Infrastructure 80.0 60.6West Pi lbara Desalination Plant -5.0 -135.0 -200.0 -30.0Regional Infill Sewerage 5.0 5.0
Zoological Parks AuthorityWater Infrastructure Management Project 1.0 2.6 3.5 3.2
Botanic Gardens and Parks Authority
Commonwealth Heads of Government Meeting - Building Works
A further $1 2 million will be spent over two years from 2010-11 to redevelop facilities atKings Park for hosting the CHOGM Leaders' Retreat.
Busselton Water Board
Asset Investment Program Update
The Busse lton Water Board will spend an additional $8 6 million over five years from2010-11. This brings total investment over this period to $25 million Significantprograms include the chlorination project, Dunsborough bulk water supply project, thebuilding of a new administration building, and upgrades to mains and treatment plants.
199
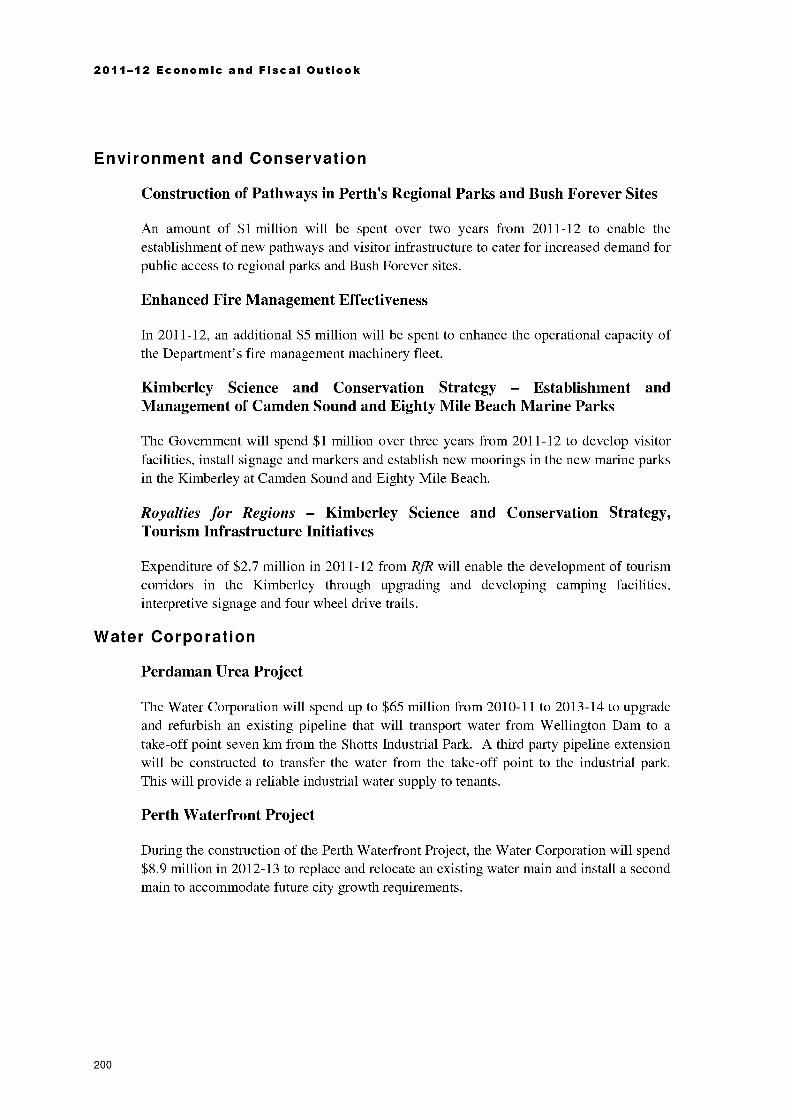
2011-12 Economic and Fiscal Outlook
Environment and Conservation
Construction of Pathways in Perth's Regional Parks and Bush Forever Sites
An amount of $1 million will be spent over two years from 2011-12 to enable theestablishment of new pathways and visitor infrastructure to cater for increased demand forpublic access to regional parks and Bush Forever sites.
Enhanced Fire Management Effectiveness
In 2011-12, an additional $5 million will be spent to enhance the operational capacity ofthe Department's fire management machinery fleet.
Kimberley Science and Conservation Strategy Establishment andManagement of Camden Sound and Eighty Mile Beach Marine Parks
The Government will spend $1 million over three years from 2011-12 to develop visitorfacilities, install signage and markers and establish new moorings in the new marine parksin the Kimberley at Camden Sound and Eighty Mile Beach.
Royalties for Regions Kimberley Science and Conservation Strategy,Tourism Infrastructure Initiatives
Expenditure of $2 7 million in 2011-12 from RJR will enable the development of tourismcorridors in the Kimberley through upgrading and developing camping facilities,interpretive signage and four wheel drive trails.
Water Corporation
Perdaman Urea Project
The Water Corporation will spend up to $65 million from 2010-11 to 2013-14 to upgradeand refurbish an existing pipeline that will transport water from Wellington Dam to atake-off point seven km from the Shotts Industrial Park. A third party pipeline extensionwill be constructed to transfer the water from the take-off point to the industrial park.This will provide a reliable industrial water supply to tenants.
Perth Waterfront Project
During the construction of the Perth Waterfront Project, the Water Corporation will spend$8 9 million in 2012-13 to replace and relocate an existing water main and install a secondmain to accommodate future city growth requirements.
200

Asset Investment
Distribution Infrastructure
The Water Corporation will spend $140 6 million from 2011-12 to 2012-13 to provide forthe timely construction of water and wastewater infrastructure. This will support futureurban residential land development in Perth, the South West, Mid West andGreat Southern, with the majority being spent in Perth where the demand is highest.
West Pilbara Desalination Plant
Recent heavy rainfall in the Pilbara region has provided the Government with theopportunity to defer the development of the West Pilbara Desalination Plant.Accordingly, the Water Corporation's Asset Investment Plan has been reduced by$370 million while the alternative water sources are re-evaluated for the West PilbaraWater Supply Scheme.
Regional Infill Sewerage
The Water Corporation will spend $5 million in each of 2011-12 and 2012-13 to extendthe infill sewerage program in regional areas.
Zoological Parks Authority
Water Infrastructure Management Project
The Government will spend $11 9 million over six years from 2011-12 to replace the agedwater infrastructure at the Perth Zoo with an effective and sustainable water managementsystem.
201

2011-12 Economic and Fiscal Outlook
202

CHAPTER 7
Royalties for Regions
Overview
The Royalties for Regions Act 2009 was proclaimed on 27 March 2010 to provide for theoperation of the Royalties for Regions Fund. The objective of the Act is to promote andfacilitate economic, business and social development in regional Western Australia.
The annual contribution to the Royalties for Regions Fund reflects the royalty incomeforecast for the budget year. Each financial year the Treasurer is to credit to the Fund anamount equal to 25% of the forecast royalty income for the budget year.
The amount to be appropriated to the Fund in 2011-12 is $1,199 million (i.e. 25% offorecast royalty revenue of $4,794 million for 2011-12). Total spending from the Fund isexpected to be $1,493 million in 2011-12 (see Table 1 at the end of this chapter).The anticipated expenditure in 2011-12 includes a $294 million withdrawal from theFund's balance that has been accumulated as a result of money appropriated to the Fundin prior years but not spent.
The Royalties for Regions (RJR) program continues to provide a framework to support andmaintain strong and vibrant regions through improved infrastructure, strategic regionaland community services projects, and the provision of contestable grant funding.
Key InitiativesA major component of the RJR program in 2011-12 is to deliver improved socialinfrastructure. This year's initiatives are in the key theme areas of investment in regionalhealth, education, skills training, water and Natural Resource Management initiatives,Aboriginal initiatives and the Regional Centres Development Plan (SuperTowns).Another major component of the RJR program is the funding of the Mid West InvestmentPlan, and continued support of Pilbara Cities, the Gascoyne Revitalisation Plan and theKimberley Revitalisation Plan.
203

2011-12 Economic and Fiscal Outlook
Regional Health Investment
The RJR contribution to health for the period 2010-11 to 2014-15 is over $1 billion, with a$133.9 million investment planned in 2011-12.
The new Southern Inland Health Initiative (SIHI) package, totalling $538 million over theforward estimates period, will provide health resources to areas of the State that have notyet received significant levels of investment through the RJR program. The initiative willdramatically improve all levels of clinical services across the Southern inland area of theWA Country Health Services. The SIHI includes $48 5 million in 2011-12 andencompasses:
District Medical Workforce Investment Program;
District Hospital Investment Program;
Primary Health Centres Demonstration Program;
Small Hospital and Nursing Post Refurbishment Program;
Telehealth Investment Program; and
Regional Residential Aged and Dementia Care Investment Program.
The SIHI seeks to improve medical access and services in the Great Southern, Mid West,Goldfields, South West and Wheatbelt regions. It includes addressing the shortfall ofgeneral practitioners in regional Western Australia by providing incentives to retainand/or attract them into the regions. It also addresses the shortfall of primary health carestaff in the relevant regions and will provide purpose-built demonstration CommunityPrimary Health Centres by upgrading and replacing existing small hospitals.
The SIHI will also redevelop six integrated district hospitals, refurbish 16 small hospitals,replace two small hospitals, replace two nursing posts, and purchase land at Jurien Bayfor a future health facility development. The capacity and availability of Telehealthtechnology will also be expanded to maximise the delivery of health services.
Also, an amount of $41.4 million is provided in 2011-12 to continue funding for thedevelopment of Kalgoorlie, Albany, and Esperance Hospitals, and the Busselton HealthCampus.
Funding for projects under the Gascoyne Revitalisation and Pilbara Cities initiatives,including the Carnarvon and Nickol Bay Hospitals, Exmouth Clinic and the new KarrathaHealth Campus, continues in 2011-12 with an allocation of $12.8 million
An amount of $20 3 million is provided in 2011-12 to continue the delivery of improvedservices through the Patient Assisted Travel Scheme, the Royal Flying Doctor Service,St John Ambulance and the Rural Generalist Pathways program.
204
Royalties for Regions
Regional Schools
A Regional Schools Plan, totalling $100 5 million over four years, commenced in2010-11 to provide new and upgraded buildings and facilities for schools in regionalWestern Australia. An amount of $44 8 million has been allocated to this plan in2011-12.
The Regional Schools Plan includes Esperance Primary, Derby and Denmark DistrictHigh Schools, and Broome, Carnarvon, Hedland, Karratha, Pinjarra, Collie, Merredin,Northam, Narrogin and Katanning Senior High Schools.
A further $51 9 million over four years from 2010-11 will provide for upgrades atregional residential colleges. Of this, $19 4 million will be spent in 2011-12 to upgradethe Esperance and Merredin Residential Colleges.
Regional Skills and Training
A total of $136 0 million has been allocated for this new initiative across four years todevelop skills and training facilities in regional Western Australia, including$53.8 million in 2011-12.
Of this, $110.6 million will be spent on a range of initiatives including:
the future development of the Muresk education precinct;
student accommodation in Kalgoorlie;
skills development for Indigenous trainees;
trade workshops;
improving access to trades training programs; and
other high demand programs to address critical skills shortages.
The remaining $25 4 million will be used to establish work camps, including one atGnowangerup and the upgrade of existing regional work camps in other locations.
Water and Natural Resource Management Initiatives
A total of $78 2 million across the forward estimates period is allocated for Water andNatural Resource Management initiatives, including $22.8 million in 2011-12.This funding will contribute to improving outcomes in water supply and management thatwill assist industry and support economic development. The program of works will havea strategic focus to deliver greater access to information around water availability andsupply options and to manage water supply for future developments. Another key focuswill be the Gascoyne Food Bowl initiative, including funding towards a flood mitigationresponse.
205

2011-12 Economic and Fiscal Outlook
Regional Centres Development Plan (Super Towns)
This is a RJR initiative to encourage regional communities generally located in thesouthern half of Western Australia to plan and prepare for a predicted doubling of theState's population over the next 40 years, with $85.5 million being allocated in 2011-12.This funding will be used to encourage regional communities to plan and implementprojects that cater for and drive population expansion and stimulate economic growth.
Towns will be nominated for the program through Regional Development Commissionsin conjunction with local government, and will be guided through a steering group andlocal community reference groups. Planning and implementation of the program willalign with the Western Australian Planning Commission's State and regional planningframeworks.
Aboriginal Initiatives
The RJR program has allocated $58.4 million in 2011-12 and a total of $162 9 millionover the period 2010-11 to 2014-15 to a range of initiatives for Indigenous people.Projects include:
Regional Youth Justice Strategy Kimberley and Pilbara Expansion;
support for Clontarf Colleges to maximise school attendance and prospectiveemployment and sporting opportunities;
funding to support the transition of the Western Australian Indigenous TourismOperators Committee to a new self-sustaining model;
funding for the Aboriginal Justice Education Program to enhance Victims of CrimeServices and Driver Training for remote Aboriginal communities;
funding to establish a $10 million Aboriginal Community Emergency Response Fundfor crisis response;
Northwest Drug and Alcohol Support Program funding for additional staff and analcohol and drug centre in Carnarvon;
improving water quality in 16 remote Aboriginal communities;
Governance and Leadership Development Program;
funding to establish Indigenous Visitor Hostels in Kalgoorlie and Broome;
provision of power and water services to the Jigalong community; and
provision of six new Remote Indigenous Health Clinics.
206
Royalties for Regions
Mid West
The Mid West Investment Plan is a new initiative delivering $220 million of RJR fundingover four years (2011-12 to 2014-15) to implement major infrastructure projects andinitiatives in the Mid West region.
An amount of $40 million is allocated in 2011-12 to commence projects across theMid West identified through local government, community, stakeholder groups, theMid West Development Commission and the Department of Regional Development andLands. The program includes key infrastructure and housing initiatives, townenhancement/revitalisation and community development.
Pilbara Cities
The aim of the Pilbara Cities program is to help facilitate the transformation ofcommunities across the Pilbara region and to encourage and underpin private sectorinvestment that results in Karratha and Port Hedland reaching sustainable permanentpopulations of 50,000 residents.
The program is investing in land release innovation, affordable housing options andeconomic partnerships with traditional owner groups. A primary focus is to unlock landdevelopment opportunities for the private sector across the region. A total of$146.9 million of RJR funding will be allocated to the region in 2011-12. By the end of2014-15, more than $1 billion would have been committed directly to the Pilbara Citiesproject.
Two new projects to commence in 2011-12 include funding of $2 5 million to undertakeinvestigations and planning work for the Karratha to Wickham Coast road, and $5 milliontowards planning for a Pilbara Maritime Common Use Support Facility.
Gascoyne
Through RJR, the Government has committed $174 9 million from 2010-11 to 2014-15 toinitiatives under the Gascoyne Revitalisation Plan, of which $67.9 million is allocated in2011-12.
The Gascoyne Revitalisation Plan includes 20 flagship initiatives, including:
Exmouth CBD and Foreshore Revitalisation;
Gascoyne Junction Town Centre and Tourism Facilities;
Shark Bay Community Sport and Recreation Centre;
Carnarvon Fascine Redevelopment planning;
Carnarvon Library and Art Centre;
Carnarvon Police and Justice Complex;
207

2011-12 Economic and Fiscal Outlook
a new community and primary health care clinic at Exmouth;
Tantabiddi Boat Ramp Upgrade;
Carnarvon Hospital redevelopment;
Carnarvon Boat Ramp Construction;
Waterfront Development Planning;
Coral Bay Seasonal Staff Accommodation; and
Gascoyne Irrigation Pipeline.
Kimberley
The Ord-East Kimberley Expansion Project is a major State Government electioncommitment. Phase 1 of the project includes infrastructure consisting of 19 km ofirrigation channel and 14 km of road to support up to 8,000 hectares of new irrigated farmland, which was brought to near completion during 2010-11.
The project commenced in 2008-09, funded by $220 million from RJR and $195 millionfrom the Commonwealth Government. These contributions form the East KimberleyDevelopment Package which supports education, housing, health and communityservices.
RJR funding for this project in 2011-12 amounts to $121.5 million
The RJR commitment to other key projects in the Kimberley continues with $18 8 millionbeing provided to the Broome Small Boat Facility in 2011-12 from a total allocation of$35 million Also, funding of $8 2 million in 2011-12 is provided for the KununurraCourthouse project out of a total commitment of $43 million to 2013-14.
Country Local Government Fund
In 2011-12, RfR has allocated $152 3 million to the Country Local Government Fund andhas also extended the program for a further year to 2014-15. An amount of $91 7 millionhas been allocated to individual country local governments towards the cost ofimplementing their forward capital works plans, and $54 million will be allocated togroups of country local governments to invest in regionally significant infrastructureprojects, developed with the support of Regional Development Commissions.
An amount of $2.4 million will be provided to the Department of Local Government todeliver complementary capacity building initiatives, with a particular focus on strategicand asset management planning, and $3 6 million for assistance to those localgovernments who have elected to amalgamate.
Exploration Incentive Scheme
RJR is providing additional funding to the Exploration Incentive Scheme (EIS).
208
Royalties for Regions
New funding totalling $20.7 million has been allocated over three years (with $3 6 millionin 2011-12) to the EIS to allow for the expansion of the scheme to include a new projectto encourage exploration and production of unconventional energy sources includingshale gas, tight gas and geothermal energy.
This brings total RJR funding of the EIS over the period 2009-10 to 2013-14 to$98.7 million
Country Age Pension Fuel Card
RJR funding of the Country Age Pension Fuel Card continues in 2011-12 with anallocation of $26 million Following expansion of the eligibility categories in 2010-11,43,000 fuel cards have now been issued to support country pensioners with travel costsand improve their quality of life.
Regional Events Program
RJR has allocated $10 million in 2011-12, as part of a $40 million allocation over theforward estimates period, to facilitate and raise the profile of regional events throughoutthe regions. The funding will assist regional communities to develop, attract and marketmajor events.
Regional Workers Incentive
RJR has allocated $137 9 million from 2010-11 to 2014-15 to this program, including anadditional $30.9 million provided in 2014-15.
This will provide increased district allowances for public sector workers in regionalWestern Australia as part of the process to attract and retain those workers who provideessential government services.
Kimberley Science and Conservation Strategy
RJR funding of $6 9 million is being provided towards the implementation of the tourisminitiatives identified in the Kimberley Science and Conservation Strategy. Specifically,the initiatives aim to:
identify and develop nature based and cultural tourism;
develop and promote tourism corridors; and
expand and promote the Ibis aerial highway, secure international air routes toBroome, and develop and promote four wheel drive trails.
209

2011-12 Economic and Fiscal Outlook
Marine Parks Management
An amount of $16 1 million has been allocated over four years for the establishment oftwo new marine parks, one in the South West (Capes Marine Park) and the other in thePilbara (Dampier Archipelago). The funding will be provided to the Department ofEnvironment and Conservation ($11 million) and the Department of Fisheries($5.1 million).
The funding will allow for:
the establishment of the two new parks and a new management area and theirassociated management plans by the end of 2011-12;
protection and conservation of high natural and cultural values, while providingopportunities for recreational and commercial uses; and
establishment of visitor facilities and management arrangements to contribute tonature based recreation and tourism in the reserves, provide education andinformation to visitors, and opportunities for Indigenous engagement.
Living Lakes
The Living Lakes initiative will transform selected inland lake and degraded creek andriver systems into permanent waterways for recreation, tourism and commercial purposes.
In 2010-11 an initial allocation of $200,000 was made to identify suitable water bodieswith potential to attract investment for the creation of eco-tourism and lifestyledevelopments and recreational pursuits. RJR will allocate a further $1 4 million in2011-12 to support the development of identified water bodies.
210

Royalties for Regions
Table 1ROYALTIES FOR REGIONS EXPENDITURE
INITIATIVE
2009-10
Actual
$m
2010-11Estimated
Actual
$m
2011-12Budget
Estimate
$m
2012-13ForwardEstimate
$m
2013-14Forward
Estimate
$m
2014-15 TotalForward 2009-10 to
Estimate 2014-15
$m $m
COUNTRY LOCAL GOVERNMENT FUNDLocal Government Local Infrastructure
Asset Renewal and New Assets 3.9 23.8 91.7 54.0 173.4
Administration of funds 0.1 0.7 0.6 0.6 0.6 0.6 3.0Regional Groupings of Local Governments
Governments 0.9 33.1 54.0 54.0 108.1 97.1 347.2Capacity Building Regional Governance
Services and Asset Management Tools 1.0 10.6 6.0 6.3 2.4 2.4 28.7
TOTAL - COUNTRY LOCALGOVERNMENT FUND 5.9 68.2 152.3 114.9 111.0 100.0 552.2
REGIONAL COMMUNITY SERVICESFUND
Regional Community Programs andSchemes
Country Age Pension Fuel Card 14.3 24.8 26.0 23.7 23.6 23.2 135.6Regional Workers Incentives 25.7 26.0 27.3 27.9 30.9 137.9
Boarding Away From Home 1.7 1.9 2.0 2.5 2.5 2.6 13.1
Community Resource Centres 5.9 12.0 13.0 14.0 14.0 14.0 72.9Wild Dogs Management Plan 1.0 5.9 1.2 0.7 8.8Performing Arts Regional Tours Boost 0.5 0.3 0.3 0.3 1.3
Foodbank ''' 0.2 0.2 0.2 0.2 0.8Better Beginnings Early Literacy ta) 0.6 0.7 0.7 0.8 2.8Responsible Parenting Support Services 2.8 6.5 9.3 9.3 10.2 38.1
Rangelands Reform Program 0.6 0.8 0.8 2.3'Orange' school bus initiatives ta) 2.1 3.9 2.3 2.7 10.9
Exploration Incentive Scheme ta) 17.3 24.6 26.9 26.4 3.5 98.7Public Sector Regional Leadership 0.7 0.7 1.0 2.4Regional Buy Local Initiatives 1.0 1.0
Regional Events Program 10.0 10.0 10.0 10.0 40.0Kimberley Science and Conservation
Strategy (Asset Investment) 2.7 2.7Kimberley Science and Conservation
Strategy (Operating) 1.0 1.4 1.2 0.7 4.2Marine Parks Management 3.9 4.4 4.6 3.3 16.1
Regional Community Programs andSchemes Subtotal 39.2 96.2 131.5 125.3 102.3 95.1 589.5
Regional Health ProgramsPatient Assisted Travel Scheme 8.7 9.0 8.9 9.3 9.7 10.1 55.7Royal Flying Doctor Service 9.2 8.5 3.9 5.7 4.1 4.2 35.5Rural Generalist Pathways 1.0 1.5 2.0 2.0 2.0 8.5St John Ambulance Services in Country
WA (Asset Investment) 0.9 0.5 0.3 0.2 1.9
St John Ambulance Services in CountryWA (Operating) 4.4 5.6 6.6 7.6 6.2 30.4
Pilbara Cardiovascular Screen Program 0.6 0.3 0.3 1.2
Regional Men's Health 0.2 0.6 1.0 0.9 2.8Regional Health Programs Subtotal 18.0 24.6 22.0 25.1 23.9 22.5 136.0
211
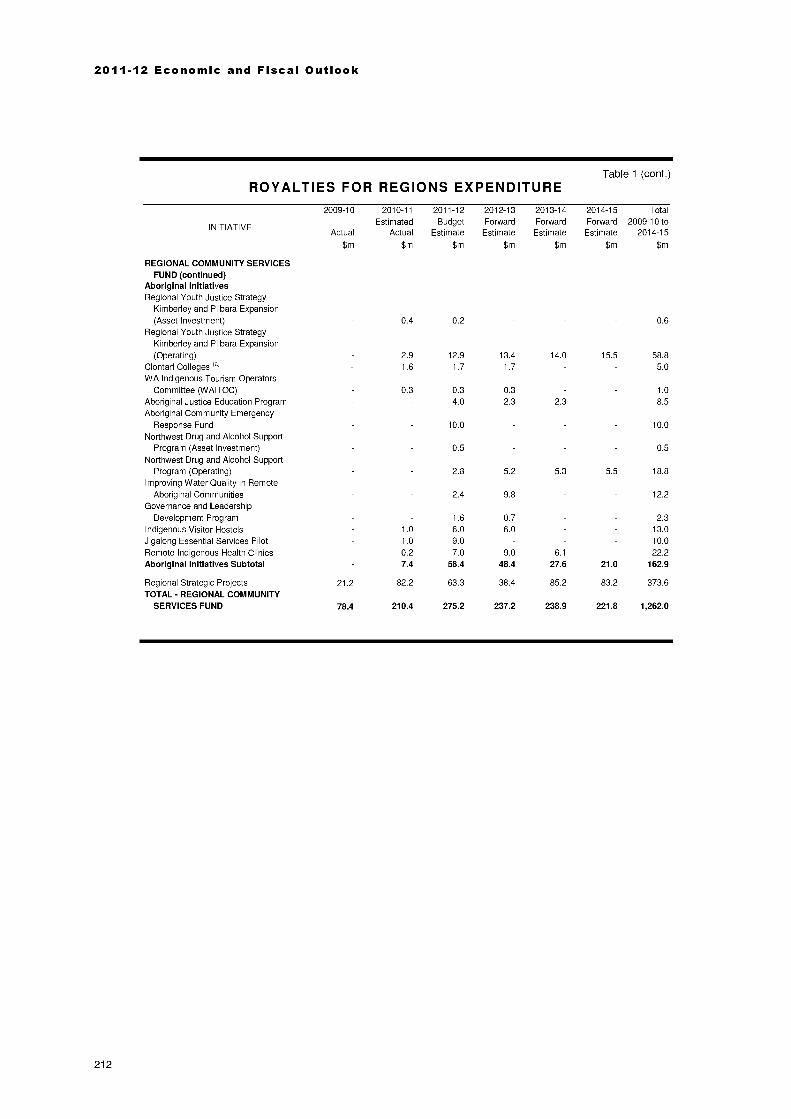
2011-12 Economic and Fiscal Outlook
Table 1 (cont.)ROYALTIES FOR REGIONS EXPENDITURE
INITIATIVE
2009-10
Actual
$m
2010-11Estimated
Actual
$m
2011-12Budget
Estimate
$m
2012-13Forward
Estimate
$m
2013-14Forward
Estimate
$m
2014-15 TotalForward 2009-10 to
Estimate 2014-15
$m $m
REGIONAL COMMUNITY SERVICESFUND (continued)
Aboriginal InitiativesRegional Youth Justice Strategy
Kimberley and Pilbara Expansion(Asset Investment) 0.4 0.2 0.6
Regional Youth Justice StrategyKimberley and Pilbara Expansion(Operating) 2.9 12.9 13.4 14.0 15.5 58.8
Clontarf Colleges ta) 1.6 1.7 1.7 5.0WA Indigenous Tourism Operators
Committee (WAITOC) 0.3 0.3 0.3 1.0
Aboriginal Justice Education Program 4.0 2.3 2.3 8.5Aboriginal Community Emergency
Response Fund 10.0 10.0
Northwest Drug and Alcohol SupportProgram (Asset Investment) 0.5 0.5
Northwest Drug and Alcohol SupportProgram (Operating) 2.8 5.2 5.3 5.5 18.8
Improving Water Quality in RemoteAboriginal Communities 2.4 9.8 12.2
Governance and LeadershipDevelopment Program 1.6 0.7 2.3
Indigenous Visitor Hostels 1.0 6.0 6.0 13.0
Jigalong Essential Services Pilot 1.0 9.0 10.0
Remote Indigenous Health Clinics 0.2 7.0 9.0 6.1 22.2Aboriginal Initiatives Subtotal 7.4 58.4 48.4 27.6 21.0 162.9
Regional Strategic Projects 21.2 82.2 63.3 38.4 85.2 83.2 373.6TOTAL - REGIONAL COMMUNITY
SERVICES FUND 78.4 210.4 275.2 237.2 238.9 221.8 1,262.0
212

Royalties for Regions
Table 1 (cont.)ROYALTIES FOR REGIONS EXPENDITURE
INITIATIVE
2009-10
Actual
$m
2010-11Estimated
Actual
$m
2011-12Budget
Estimate
$m
2012-13ForwardEstimate
$m
2013-14Forward
Estimate
$m
2014-15 TotalForward 2009-10 to
Estimate 2014-15
$m $m
REGIONAL INFRASTRUCTURE ANDHEADWORKS FUND
Pilbara Cities InitiativeNickol Bay Hospital Upgrade (Asset
Investment) 2.3 3.4 2.2 8.0Nickol Bay Hospital Upgrade (Operating) 1.0 1.0 2.0
Karratha Health Campus 0.2 1.5 15.0 45.0 68.3 130.0
Pilbara Health Partnership (AssetInvestment) 1.5 1.6 3.2
Pilbara Health Partnership (Operating) 0.5 1.8 4.0 12.0 11.5 29.8Pilbara Health Equipment Upgrade 2.4 0.1 2.5Pilbara Cities Office 1.0 0.5 0.5 0.5 0.5 3.0Pilbara Underground Power (Asset
Investment) 7.9 49.3 42.8 100.0Pilbara Underground Power (Operating) 0.3 0.6 0.6 0.6 2.0Karratha Service Workers
Accommodation 2.0 28.4 30.4South Hedland Town Centre Revitalisation 2.6 20.6 23.2Pilbara Water Opportunities 0.4 2.5 2.9West Pilbara Water 4.5 4.5NASH (Ngarluma Aboriginal Sustainable
Housing) Roebourne 0.2 4.8 5.0Roebourne Housing Initiatives 5.0 5.0Northern Towns Development Fund 8.5 10.8 8.5 10.3 1.9 40.0
Pilbara Cities Strategic Infrastructure(Asset Investment) 14.9 15.0 60.3 100.0 190.2
Pilbara Cities Strategic Infrastructure
(Operating) 5.1 25.0 39.7 50.0 150.0 269.8Pilbara Cities Community Projects (Asset
Investment) 0.8 3.5 4.3Pilbara Cities Community Projects
(Operating) 5.0 69.7 32.4 10.0 40.0 40.0 197.1
Karratha-Wickham Coast Road 2.5 2.5Pilbara Maritime Common Use Support
Facility 5.0 5.0
Pilbara Cities Subtotal 25.2 223.8 146.9 146.6 257.3 260.7 1,060.3
Kimberley RevitalisationOrd-East Kimberley Expansion Project 15.1 45.0 117.5 31.4 208.9
(Asset Investment)Ord-East Kimberley Expansion Project 1.4 4.6 4.0 10.0
(Operating)Aboriginal Housing Kimberley 15.0 15.0Broome Small Boat Facility Stage 1 1.3 18.8 15.0 35.0Kununurra Courthouse 1.0 8.2 27.4 6.4 43.0Broome Courthouse Site Selection 0.4 0.2 0.5Kimberley Revitalisation Subtotal 31.4 52.2 148.6 73.8 6.4 312.4
213
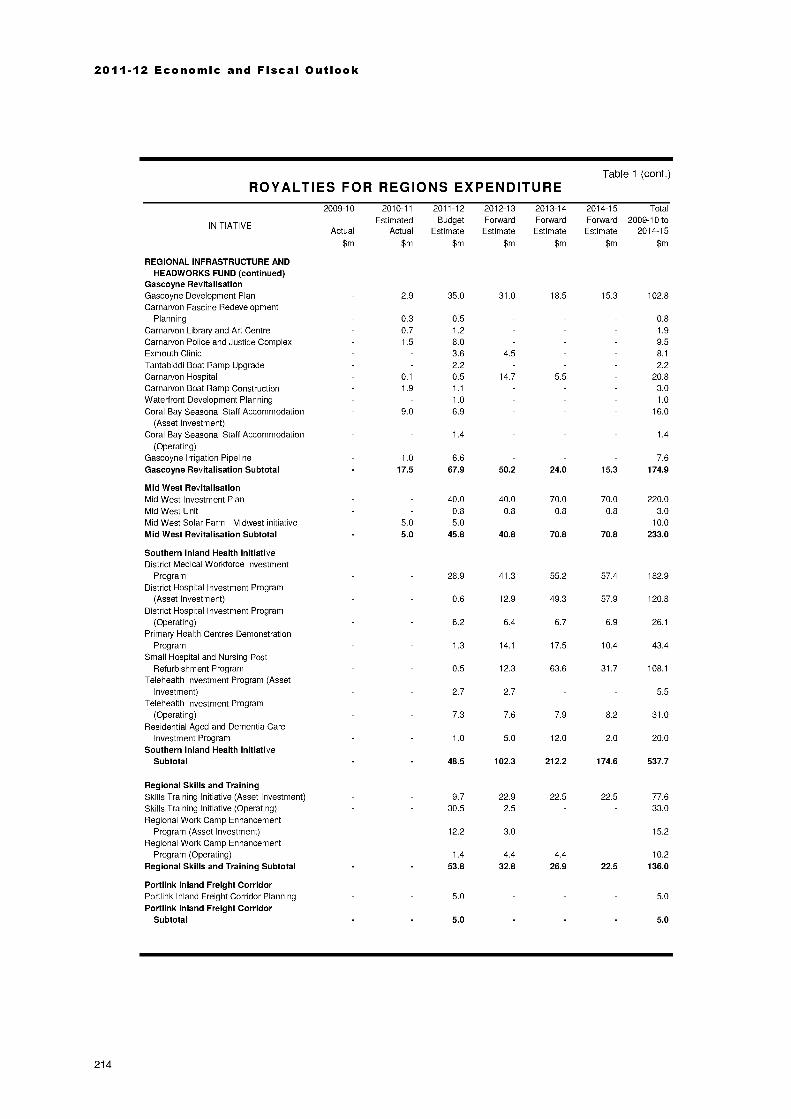
2011-12 Economic and Fiscal Outlook
Table 1 (cont.)ROYALTIES FOR REGIONS EXPENDITURE
2009-10
INITIATIVEActual
$m
2010-11Estimated
Actual
$m
2011-12Budget
Estimate
$m
2012-13Forward
Estimate
$m
2013-14Forward
Estimate
$m
2014-15 TotalForward 2009-10 to
Estimate 2014-15
$m $m
REGIONAL INFRASTRUCTURE ANDHEADWORKS FUND (continued)
Gascoyne RevitalisationGascoyne Development Plan 2.9 35.0 31.0 18.5 15.3 102.8Carnarvon Fascine Redevelopment
Planning 0.3 0.5 0.8
Carnarvon Library and Art Centre 0.7 1.2 1.9
Carnarvon Police and Justice Complex 1.5 8.0 9.5Exmouth Clinic 3.6 4.5 8.1
Tantabiddi Boat Ramp Upgrade 2.2 2.2Carnarvon Hospital 0.1 0.5 14.7 5.5 20.8Carnarvon Boat Ramp Construction 1.9 1.1 3.0Waterfront Development Planning 1.0 1.0
Coral Bay Seasonal Staff Accommodation 9.0 6.9 16.0
(Asset Investment)Coral Bay Seasonal Staff Accommodation 1.4 1.4
(Operating)Gascoyne Irrigation Pipeline 1.0 6.6 7.6
Gascoyne Revitalisation Subtotal 17.5 67.9 50.2 24.0 15.3 174.9
Mid West RevitalisationMid West Investment Plan 40.0 40.0 70.0 70.0 220.0Mid West Unit 0.8 0.8 0.8 0.8 3.0Mid West Solar Farm Midwest initiative 5.0 5.0 10.0
Mid West Revitalisation Subtotal 5.0 45.8 40.8 70.8 70.8 233.0
Southern Inland Health InitiativeDistrict Medical Workforce Investment
Program 28.9 41.3 55.2 57.4 182.9District Hospital Investment Program
(Asset Investment) 0.6 12.9 49.3 57.9 120.8
District Hospital Investment Program(Operating) 6.2 6.4 6.7 6.9 26.1
Primary Health Centres DemonstrationProgram 1.3 14.1 17.5 10.4 43.4
Small Hospital and Nursing PostRefurbishment Program 0.5 12.3 63.6 31.7 108.1
Telehealth Investment Program (AssetInvestment) 2.7 2.7 5.5
Telehealth Investment Program(Operating) 7.3 7.6 7.9 8.2 31.0
Residential Aged and Dementia CareInvestment Program 1.0 5.0 12.0 2.0 20.0
Southern Inland Health InitiativeSubtotal 48.5 102.3 212.2 174.6 537.7
Regional Skills and TrainingSkills Training Initiative (Asset Investment) 9.7 22.9 22.5 22.5 77.6Skills Training Initiative (Operating) 30.5 2.5 33.0Regional Work Camp Enhancement
Program (Asset Investment) 12.2 3.0 15.2
Regional Work Camp EnhancementProgram (Operating) 1.4 4.4 4.4 10.2
Regional Skills and Training Subtotal 53.8 32.8 26.9 22.5 136.0
Portlink Inland Freight CorridorPortlink Inland Freight Corridor Planning 5.0 5.0
Portlink Inland Freight CorridorSubtotal 5.0 5.0
214

Royalties for Regions
Table 1 (cont.)ROYALTIES FOR REGIONS EXPENDITURE
INITIATIVE
2009-10
Actual
$m
2010-11Estimated
Actual
$m
2011-12Budget
Estimate
$m
2012-13ForwardEstimate
$m
2013-14Forward
Estimate
$m
2014-15 TotalForward 2009-10 to
Estimate 2014-15
$m $m
REGIONAL INFRASTRUCTURE ANDHEADWORKS FUND (continued)
Regional Health InfrastructureKalgoorlie Hospital 6.7 9.1 15.8Albany Hospital 20.3 20.3 20.3 60.9Esperance Hospital 0.4 8.0 10.4 18.8Busselton Health Campus 1.3 4.0 26.0 9.2 40.5Regional Health Infrastructure
Subtotal 28.7 41.4 56.7 9.2 136.0
Regional Development - Water andNRM Initiatives
Regional Development Water and NRMInitiatives 22.8 17.7 16.5 21.2 78.2
Regional Development - Water andNRM Initiatives Subtotal 22.8 17.7 16.5 21.2 78.2
Regional Centres Development Plan(SuperTowns)
Super Towns Development Project Fund 80.0 80.0Super Towns Development Planning Fund 5.5 5.5Regional Centres Development Plan
(SuperTowns) Subtotal 85.5 85.5
Regional Infrastructure ProjectsRegional Mobile Communications Project 0.2 8.0 20.0 11.8 40.0Community Emergency Communications 0.6 0.6 1.2Community Safety Network (Asset
Investment) 6.7 42.1 31.5 80.3Community Safety Network (Operating) 0.2 2.4 3.2 3.9 4.5 14.2Housing for Workers 103.0 76.0 127.4 100.0 100.0 55.5 562.0Non-Government Organisation Housing 25.0 25.0Headworks Rebate 7.3 7.3Recreational Boating Facilities Scheme 1.7 8.3 5.0 5.0 20.0Regional Airports Development Scheme 5.3 3.1 8.1 5.0 5.0 26.5Conservation Parks Infrastructure and
Roads 2.5 7.5 5.0 5.0 20.0Bunbury to Albany Gas Pipeline 0.3 9.8 10.0 20.0Pre-Feasibility Pilbara/Gascoyne 0.2 0.2Rushton Park 0.1 0.1
Living Lakes 0.2 1.4 1.6Regional Schools Plan Esperance
Primary School 7.0 3.0 10.0Regional Schools Plan Derby District
High School 7.0 5.0 3.0 15.0Regional Schools Plan Broome Senior
High School 5.0 3.0 2.0 10.0Regional Schools Plan Carnarvon Senior
High School 2.0 5.0 7.0Regional Schools Plan Hed land Senior
High School 6.0 6.0Regional Schools Plan Karratha Senior
High School 9.5 9.5Regional Schools Plan Pinjarra Senior
High School 3.0 4.0 7.0Regional Schools Plan Collie Senior
High School 1.0 2.0 3.0Regional Schools Plan Merredin Senior
High School 5.0 1.0 6.0
215
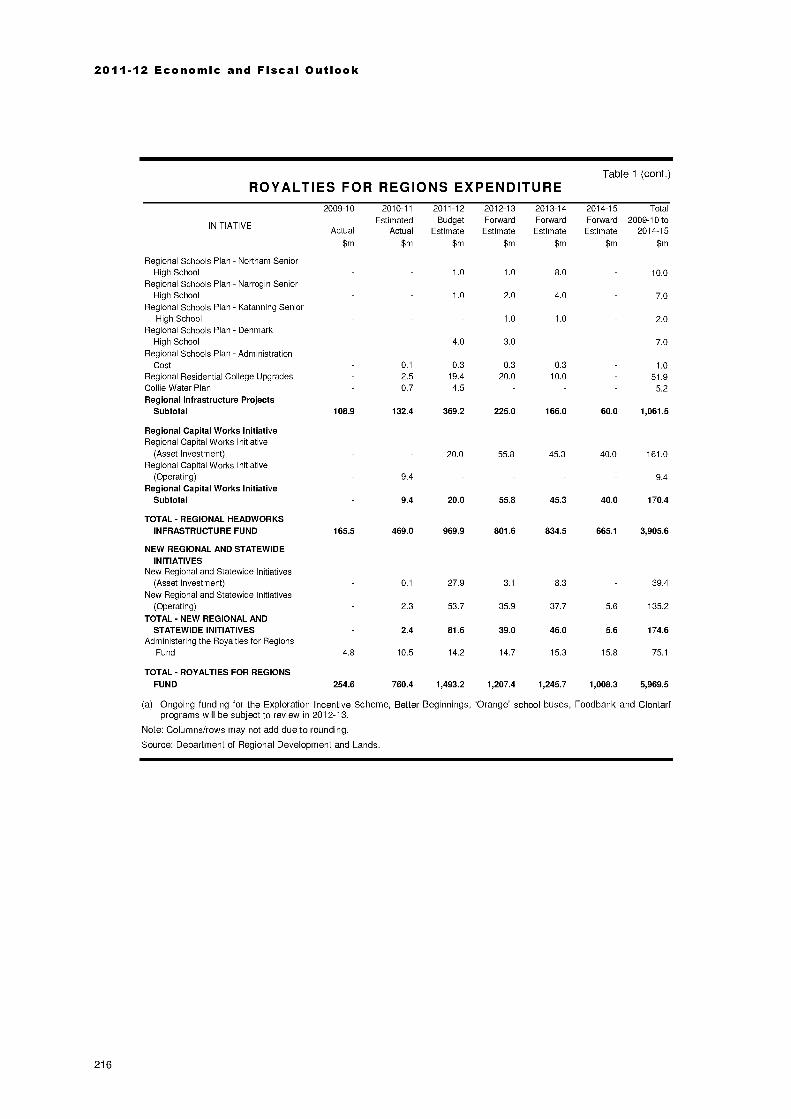
2011-12 Economic and Fiscal Outlook
Table 1 (cont.)ROYALTIES FOR REGIONS EXPENDITURE
INITIATIVE
2009-10
Actual
$m
2010-11Estimated
Actual
$m
2011-12Budget
Estimate
$m
2012-13Forward
Estimate
$m
2013-14Forward
Estimate
$m
2014-15Forward
Estimate
$m
Total2009-10 to
2014-15
$m
Regional Schools Plan Northam SeniorHigh School 1.0 1.0 8.0 10.0
Regional Schools Plan Narrogin SeniorHigh School 1.0 2.0 4.0 7.0
Regional Schools Plan Katanning SeniorHigh School 1.0 1.0 2.0
Regional Schools Plan DenmarkHigh School 4.0 3.0 7.0
Regional Schools Plan AdministrationCost 0.1 0.3 0.3 0.3 1.0
Regional Residential College Upgrades 2.5 19.4 20.0 10.0 51.9Collie Water Plan 0.7 4.5 5.2Regional Infrastructure Projects
Subtotal 108.9 132.4 369.2 225.0 166.0 60.0 1,061.5
Regional Capital Works InitiativeRegional Capital Works Initiative
(Asset Investment) 20.0 55.8 45.3 40.0 161.0Regional Capital Works Initiative
(Operating) 9.4 9.4Regional Capital Works Initiative
Subtotal 9.4 20.0 55.8 45.3 40.0 170.4
TOTAL - REGIONAL HEADWORKSINFRASTRUCTURE FUND 165.5 469.0 969.9 801.6 834.5 665.1 3,905.6
NEW REGIONAL AND STATEWIDEINITIATIVES
New Regional and Statewide Initiatives(Asset Investment) 0.1 27.9 3.1 8.3 39.4
New Regional and Statewide Initiatives(Operating) 2.3 53.7 35.9 37.7 5.6 135.2
TOTAL - NEW REGIONAL ANDSTATEWIDE INITIATIVES 2.4 81.6 39.0 46.0 5.6 174.6
Administering the Royalties for RegionsFund 4.8 10.5 14.2 14.7 15.3 15.8 75.1
TOTAL - ROYALTIES FOR REGIONSFUND 254.6 760.4 1,493.2 1,207.4 1,245.7 1,008.3 5,969.5
(a) Ongoing funding for the Exploration Incentive Scheme, Better Beginnings, Orange' school buses, Foodbank and Clontarfprograms will be subject to review in 2012-13.
Note: Columns/rows may not add due to rounding.
Source: Department of Regional Development and Lands.
216

APPENDIX 1
Detailed Financial Projections
This appendix contains detailed financial projections for the various sectors of the totalpublic sector defined by the Government Finance Statistics (GFS) framework. The tablesin this section also satisfy Uniform Presentation Framework (UPF) requirements and arealso consistent with Australian Accounting Standards, in particular,AASB 1049: Whole of Government and General Government Sector Financial Reporting.
217
2011-12 Economic and Fiscal Outlook
Contents
Financial Projections
General GovernmentTable 1: Operating Statement 219
Table 2: Balance Sheet at 30 June 220
Table 3: Cashflow Statement 221
Public Non-Financial CorporationsTable 4: Operating Statement 222
Table 5: Balance Sheet at 30 June 223
Table 6: Cashflow Statement 224
Total Non-Financial Public SectorTable 7: Operating Statement 225
Table 8: Balance Sheet at 30 June 226
Table 9: Cashflow Statement 227
Public Financial CorporationsTable 10: Operating Statement 228
Table 11: Balance Sheet at 30 June 229
Table 12: Cashflow Statement 230
Total Public SectorTable 13: Operating Statement 231
Table 14: Balance Sheet at 30 June 232
Table 15: Cashflow Statement 233
Notes To The Financial ProjectionsNote 1: Statement of Compliance 234
Note 2: Summary of Significant Accounting Policies 234
Note 3: General Government Operating Revenue 235
Note 4: General Government Transfer Expenses 235
Note 5: General Government Expenses and Spending on the Purchase ofNon-Financial Assets by Government Purpose Classification 236
Note 6: Convergence Differences 236
Note 7: Loan Council Allocations 241
Note 8: Composition of Sectors 242
218

Appendix 1
Table 1.1
GENERAL GOVERNMENTOperating Statement
Results from Transactions
REVENUE
Note 2009-10
Actual
$m
2010-11Estimated
Actual
$m
Taxation 6,324 6,662Current grants and subsidies 8,228 8,032Capital grants 1,978 1,406Sales of goods and services 1,635 1,718Interest income 227 309Revenue from public corporations
Dividends from other sector entities 570 696Tax equivalent income 350 359
Royalty income 2,324 4,159Other 405 422Total 3 22,039 23,764
EXPENSESSalaries 8,284 8,913Superannuation
Concurrent costs 793 851
Superannuation interest cost 338 400Other employee costs 323 359Depreciation and amortisation 848 906Services and contracts 1,523 1,826Other gross operating expenses 2,959 3,571Other interest 187 334Other property expensesCurrent transfers 4 4,882 5,090Capital transfers 4 1,071 729Total 5 21,208 22,980
NET OPERATING BALANCE 6 831 784
Other economic flowsNet gains on assets/liabilities 228 21
Net actuarial gains superannuation -169 57Provision for doubtful debts -32All otherTotal other economic flows 27 77
OPERATING RESULT 858 861
All other movements in equityRevaluations -2,055 1,567Gains recognised directly in equity -5 -1
Changes in accounting policy/correction of prior period errors 117 -225Change in net worth of the public corporations sectors 1,768 1,218All otherTotal all other movements in equity -176 2,560
TOTAL CHANGE IN NET WORTH 682 3,421
KEY FISCAL AGGREGATES
NET OPERATING BALANCE 6 831 784
Less Net acquisition of non-financial assetsPurchase of non-financial assets 5 2,974 3,131Changes in inventories -4 -2Other movement in non-financial assetsless:
-72 -10
Sales of non-financial assets 161 214Depreciation 848 906Total net acquisition of non-financial assets 1,889 1,999
NET LENDING/-BORROWING 6 -1,058 -1,215
Note: Columns may not add due to rounding.
2011-12 2012-13 2013-14 2014-15Budget Forward Forward Forward
Estimate Estimate Estimate Estimate$m $m $m $m
6,9658,806
9561,815
355
69950
,794393
25,233
9,642
917412366936
2,0653,874
421
24,
1,622-1
-421,130
2,710
3,203
0
7,697 8,499 9,4148,625 8,116 7,936
822 609 721
1,905 2,000 2,101354 353 309
806 1,050 1,188620 721 781
4,998 5,447 5,336407 415 418
26,232 27,209 28,202
10,227 10,739 11,385
971 1,017 1,075413 422 431
383 400 4291,041 1,180 1,1751,938 2,047 2,1123,963 3,933 4,212
549 603 640
5,291 5,492 5,665687 588 608
25,464 26,422 27,732
768 787 471
70 -2 -13-185 -186 -187
-115 -189 -201
654 598 270
2,091 2,098 2,216-1 -1 -1
-24 -6 8
1,065 617 1,415
3,132 2,709 3,638
3,785 3,307 3,908
768 787 471
3,343 3,054 2,357
-147
259 295 146
1,041 1,180 1,1751,896 1,579 1,036
-1,127 -792 -565
219
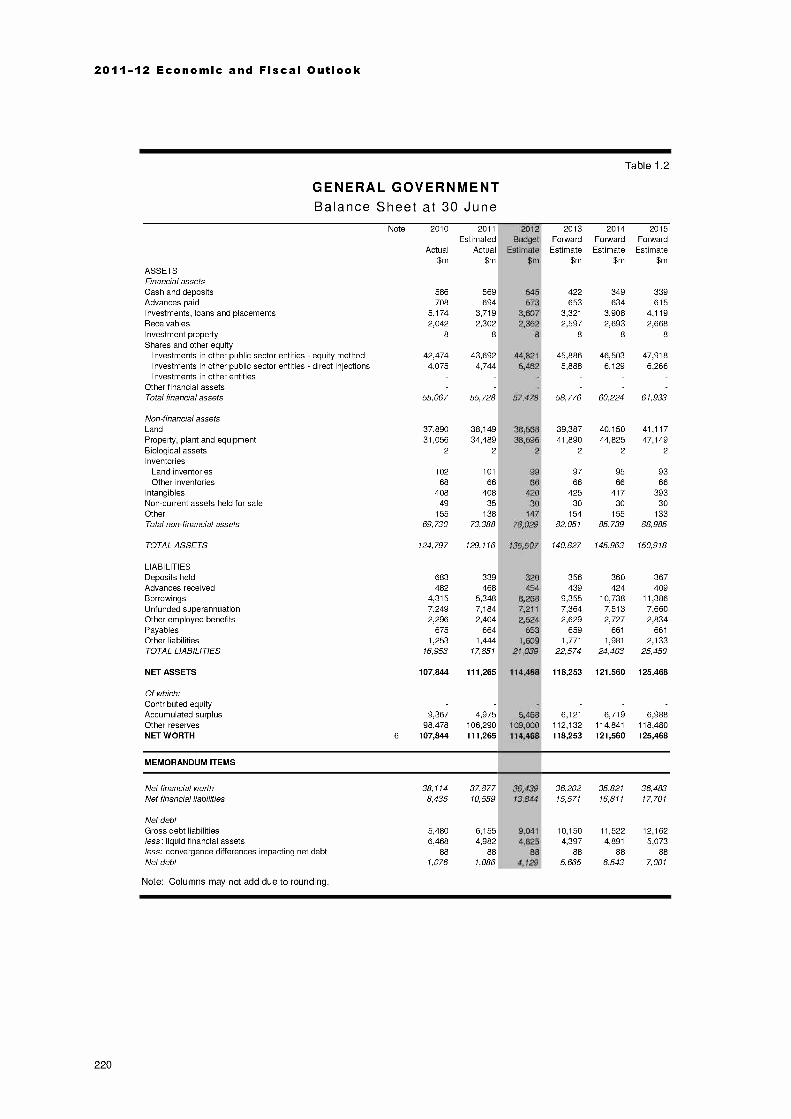
2011-12 Economic and Fiscal Outlook
Table 1.2
GENERAL GOVERNMENTBalance Sheet at 30 June
Note 2010 2011 201 2013 2014 2015Estimated Budge Forward Forward Forward
Actual Actual Estimat Estimate Estimate Estimate$m $m $m $m $m
ASSETSFinancial assetsCash and deposits 586Advances paid 708Investments, loans and placements 5,174Receivables 2,042Investment property 8
Shares and other equityInvestments in other public sector entities equity method 42,474Investments in other public sector entities direct injections 4,075Investments in other entities
Other financial assetsTotal financial assets 55,067
Non-financial assetsLand 37,890Property, plant and equipment 31,056Biological assets 2
InventoriesLand inventories 102Other inventories 68
Intangibles 408Non-current assets held for sale 49Other 155Total non-financial assets 69,730
TOTAL ASSETS 124,797
LIABILITIESDeposits held 683Advances received 482Borrowings 4,315Unfunded superannuation 7,249Other employee benefits 2,296Payables 675Other liabilities 1,253TOTAL LIABILITIES 16,953
NET ASSETS 107,844
Of which:Contributed equityAccumulated surplus 9,367Other reserves 98,478NET WORTH 6 107,844
MEMORANDUM ITEMS
Net financial worth 38,114Net financial liabilities 8,435
Net debtGross debt liabilities 5,480less: liquid financial assets 6,468less: convergence differences impacting net debt 88Net debt -1,076
Note: Columns may not add due to rounding.
220
569694
3,7192,302
8 8
43,6924,744
55,728
38,14934,489
2
101
66 6
408 42035 30
138 14773,388 78,029
129,116 35,507
339 341468 4
5,348 8,2687,184 7,2112,404 2,524
664 6531,444 1,609
17,851 1,039
111,265 14,46J
4,975106,290111,265
37,877 6,43910,559 13,844
6,155 9,0414,982 4,825
88 881,086 129
422 349 339653 634 615
3,321 3,908 4,1192,597 2,693 2,668
8 8 8
45,886 46,503 47,9185,888 6,129 6,266
58,776 60,224 61,933
39,387 40,150 41,11741,890 44,825 47,149
2 2 2
97 95 9366 66 66
425 417 39330 30 30
154 155 13382,051 85,739 88,985
140,827 145,963 150,918
356 360 367439 424 409
9,355 10,738 11,3867,364 7,513 7,6602,629 2,727 2,834
659 661 661
1,771 1,981 2,13322,574 24,403 25,450
118,253 121,560 125,468
6,121 6,719 6,988112,132 114,841 118,480118,253 121,560 125,468
36,202 35,821 36,48315,571 16,811 17,701
10,150 11,522 12,1624,397 4,891 5,073
88 88 885,665 6,543 7,001

Appendix 1
Table 1.3
GENERAL GOVERNMENTCashflow Statement
CASHFLOWS FROM OPERATING ACTIVITES
Cash received
Note 2009-10
Actual
$m
2010-11Estimated
Actual
$m
Taxes received 6,329 6,667Grants and subsidies received 10,113 9,485Receipts from sales of goods and services 1,767 1,762Interest receipts 203 303Dividends and tax equivalents 882 1,086Other receipts 3,558 5,200Total cash received 22,853 24,503
Cash PaidWages, salaries and supplements, and superannuation -9,221 -10,067Payments for goods and services -4,594 -5,964Interest paid -146 -323Grants and subsidies paid -5,364 -5,481Dividends and tax equivalentsOther payments -1,582 -1,215Total cash paid -20,907 -23,049
NET CASHFLOWS FROM OPERATING ACTIVITIES 1,946 1,454
CASHFLOWS FROM INVESTING ACTIVITES
Cashflows from investments in non-financial assetsPurchase of non-financial assets -2,974 -3,131Sales of non-financial assets 161 214Total cashflows from investments in non-financial assets -2,813 -2,917
Cashflows from investments in financial assetsCash receivedFor policy purposes 19
For liquidity purposes 83Cash paidFor policy purposes -659 -811
For liquidity purposes -2 -5Total cashflows from investments in financial assets -559 -816
NET CASHFLOWS FROM INVESTING ACTIVITIES -3,371 -3,732
CASHFLOWS FROM FINANCING ACTIVITIES
Cash receivedAdvances received 14 14
Borrowings 2,754 1,100Deposits receivedOther financing receipts 32 31
Total cash receipts from financing activities 2,799 1,145
Cash paidAdvances paid -14 -14Borrowings repaid -299 -48Deposits paidOther financing payments -49 -82Total payments for financing activities -362 -145
NET CASHFLOWS FROM FINANCING ACTIVITIES 2,438 1,001
Net increase in cash and cash equivalents 1,012 -1,278Cash and cash equivalents at the beginning of the year 4,334 5,346Cash and cash equivalents at the end of the year 5,346 4,068
KEY FISCAL AGGREGATES
Net cashflows from operating activities 1,946 1,454Net cashflows from investing in non-financial assets -2,813 -2,917
Cash surplus/-deficit 6 -867 -1,462
Note: Columns may not add due to rounding.
2011-12 2012-13 2013-14 2014-15Budget Forward Forward Forward
Estimate Estimate Estimate Estimate$m $m $m $m
9,
1,8
3471,1096,114
26,119
-10,858-6,275
-380-5,721
-1,204-24,438
1,681
3
8
14
6
-1224,0683,947
7,701 8,502 9,4189,445 8,709 8,6621,933 2,018 2,132
346 346 301
1,284 1,811 1,9796,290 6,583 6,725
26,998 27,969 29,218
-11,543 -12,122 -12,824-6,250 -6,330 -6,716
-538 -599 -642-5,456 -5,681 -5,860
-1,214 -1,119 -1,228-25,000 -25,850 -27,270
1,999 2,118 1,947
-3,343 -3,054 -2,357259 295 146
-3,084 -2,759 -2,211
-416 -241 -142
-416 -242 -142
-3,500 -3,001 -2,353
15 15 15
1,136 1,466 811
33 85 331,184 1,567 859
-15 -15 -15-47 -77 -157
-84 -82 -82-145 -174 -254
1,039 1,393 605
-463 510 1993,947 3,484 3,9943,484 3,994 4,193
1,999 2,118 1,947-3,084 -2,759 -2,211
-1,086 -641 -263
221

2011-12 Economic and Fiscal Outlook
Table 1.4
PUBLIC NON-FINANCIAL CORPORATIONSOperating Statement
Results from Transactions
REVENUECurrent grants and subsidiesCapital grantsSales of goods and servicesInterest incomeOtherTotal
EXPENSESSalariesSuperannuation
Concurrent costsSuperannuation interest cost
Other employee costsDepreciation and amortisationServices and contractsOther gross operating expensesOther interestTax equivalentsCurrent transfersCapital transfersTotal
NET OPERATING BALANCE
Other economic flowsNet gains on assets/liabilitiesNet actuarial gains superannuationProvision for doubtful debtsAll otherTotal other economic flows
OPERATING RESULT
All other movements in non-owner equityRevaluationsGains recognised directly in equityChanges in accounting policy/correction of prior period errorsCapital injections from general governmentAll otherTotal all other movements in non-owner equity
Movements in owner equityDividendsCapital injectionsTotal movements in owner equity
TOTAL CHANGE IN NET WORTH
Note
6
2009-10
Actual
$m
1,861
17713,057
203421
15,720
883
82
431,430
59810,201
790306779
2
15,113
606
173-25-25
122
728
805307186
1,298
-558665106
2,133
2010-11Estimated
Actual
$m
1,942105
13,814293515
16,668
998.095032
1,580594
10,8191,053
349691
23416,445
223
186
177
399
1,211
-43258
1,425
-693669-24
1,800
2,135109
14,727345459
17,774
160
689
27
1,035
-69371825
1,749
2012-13ForwardEstimate
$m
2,104143
16,148419447
19,261
1,082
103
371,699
641
12,2671,369
589790
18,576
684
422
-11
412
1,096
655-4731
639
-801
426-375
1,360
2013-14Forward
Estimate$m
2,027196
17,691454487
20,855
1,120
106
371,767
71513,245
1,455685840
19,970
885
390
-11
379
1,264
265-51
51
265
-1,044241
-802
727
2014-15Forward
Estimate$m
2,018196
19,660430490
22,795
1,155
109
41
1,831
73914,7621,487
743884
21,749
1,046
360
-12
348
1,394
1,064-5657
1,065
-1,181137
-1,044
1,415
KEY FISCAL AGGREGATES
NET OPERATING BALANCE
Less Net acquisition of non-financial assetsPurchase of non-financial assetsChanges in inventoriesOther movement in non-financial assetsless:Sales of non-financial assetsDepreciationTotal net acquisition of non-financial assets
NET LENDING/-BORROWING
6
6
606
3,8551,335
85
6371,430
3,207
-2,601
223
3,829-27
-292
6291,5801,302
-1,079
5
-40
8201,651
947
-419
684
3,9887
-44
1,1221,6991,131
-446
885
3,121-3
-52
1,121
1,767178
708
1,046
3,074-7
-56
1,0371,831
143
903
Note: Columns may not add due to rounding.
222
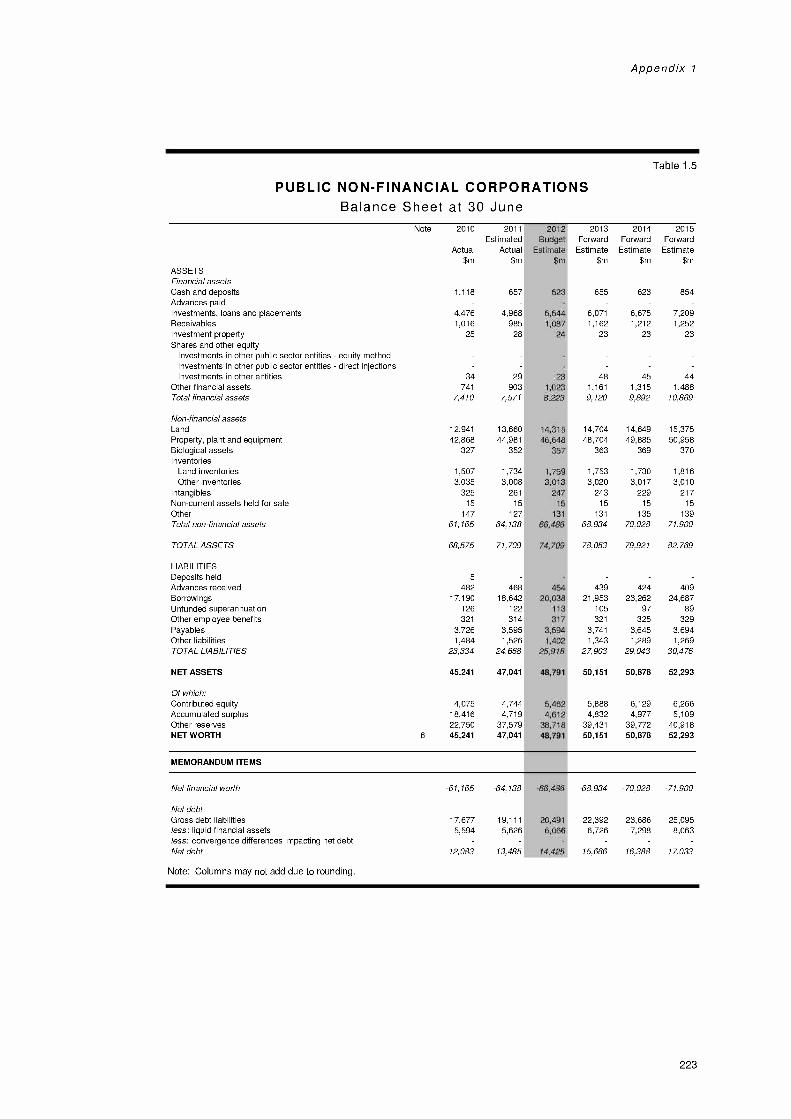
Appendix 1
Table 1.5
PUBLIC NON-FINANCIAL CORPORATIONSBalance Sheet at 30 June
ASSETSFinancial assets
Note 2010
Actual
$m
2011Estimated
Actual
$m
Cash and deposits 1,118 657Advances paidInvestments, loans and placements 4,476 4,968Receivables 1,016 985Investment property 25 28
Shares and other equityInvestments in other public sector entities equity methodInvestments in other public sector entities direct injectionsInvestments in other entities 34 29
Other financial assets 741 903Total financial assets 7410 7571
Non-financial assetsLand 12,941 13,660Property, plant and equipment 42,868 44,981Biological assets 327 352Inventories
Land inventories 1,507 1,734Other inventories 3,035 3,008
Intangibles 325 261
Non-current assets held for sale 15 15
Other 147 127Total non-financial assets 61,165 64,138
TOTAL ASSETS 68,575 71,709
LIABILITIESDeposits held 5
Advances received 482 468Borrowings 17,190 18,642Unfunded superannuation 126 122Other employee benefits 321 314Payables 3,726 3,595Other liabilities 1,484 1,526TOTAL LIABILITIES 23,334 24,668
NET ASSETS 45,241 47,041
Of which:Contributed equity 4,075 4,744Accumulated surplus 18,416 4,719Other reserves 22,750 37,579NET WORTH 6 45,241 47,041
MEMORANDUM ITEMS
Net financial worth -61,165 -64,138
Net debtGross debt liabilities 17,677 19,111less: liquid financial assetsless: convergence differences impacting net debt
5,594 5,626
Net debt 12,083 13,485
Note: Columns may not add due to rounding.
2012Budget
Estimate$m
5
5,51 r
14,31546,648
357
1,7593,013
24715
131
66,486
74,709
45420,038
113317
3,5941,402
25,918
48,791
5,4624,612
38,71848,791
20,46,066
14,425
2013Forward
Estimate$m
2014Forward
Estimate$m
2015Forward
Estimate$m
655 623 854
6,071 6,675 7,2091,162 1,212 1,252
23 23 23
48 45 441,161 1,315 1,4889,120 9,892 10,869
14,704 14,649 15,37548,704 49,885 50,958
363 369 370
1,753 1,730 1,8163,020 3,017 3,010
243 229 21715 15 15
131 135 13968,934 70,028 71,900
78,053 79,921 82,769
439 424 40921,953 23,262 24,687
105 97 89321 325 329
3,741 3,645 3,6941,343 1,289 1,269
27,903 29,043 30,476
50,151 50,878 52,293
5,888 6,129 6,2664,832 4,977 5,109
39,431 39,772 40,91850,151 50,878 52,293
-68,934 -70,028 -71,900
22,392 23,686 25,0956,726 7,298 8,063
15,666 16,388 17,033
223
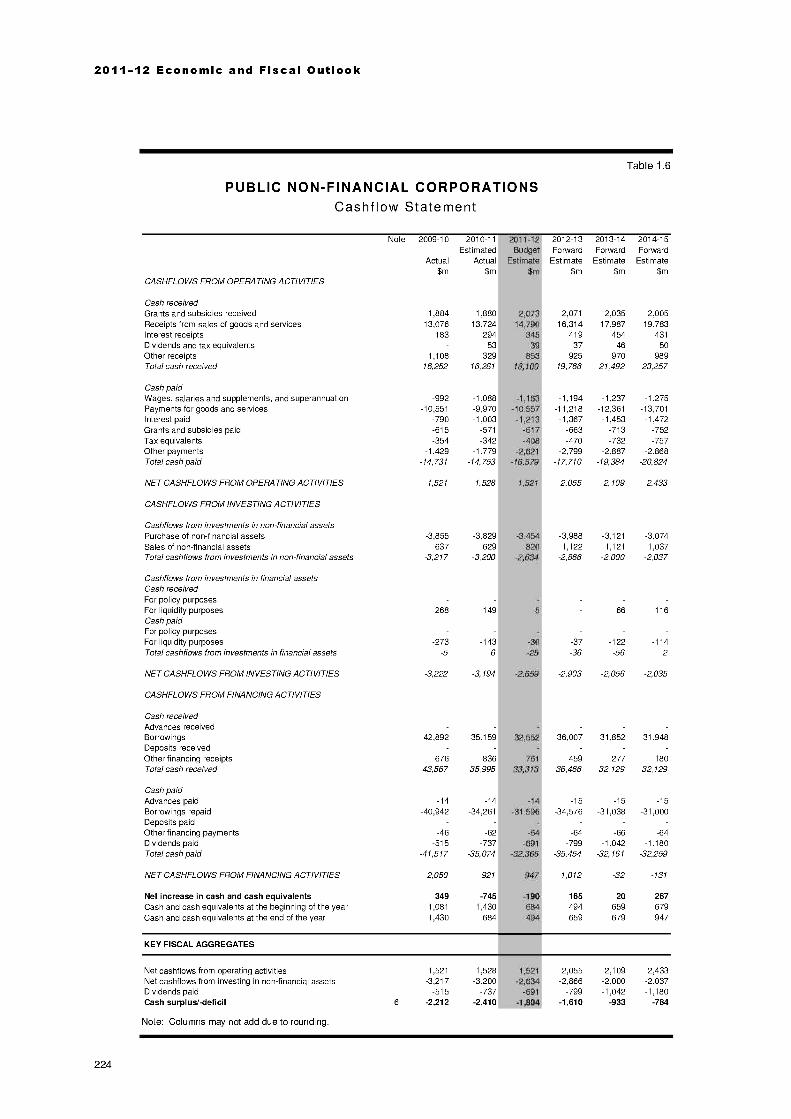
2011-12 Economic and Fiscal Outlook
Table 1.6
PUBLIC NON-FINANCIAL CORPORATIONSCashflow Statement
CASHFLOWS FROM OPERATING ACTIVITIES
Cash received
Note 2009-10
Actual
$m
Grants and subsidies received 1,884Receipts from sales of goods and services 13,076Interest receipts 183Dividends and tax equivalentsOther receipts 1,108Total cash received 16,252
Cash paidWages, salaries and supplements, and superannuation -992Payments for goods and services -10,551Interest paid -790Grants and subsidies paid -615Tax equivalents -354Other payments -1,429Total cash paid -14,731
NET CASHFLOWS FROM OPERATING ACTIVITIES 1,521
CASHFLOWS FROM INVESTING ACTIVITIES
Cashflows from investments in non-financial assetsPurchase of non-financial assets -3,855Sales of non-financial assets 637Total cashflows from investments in non-financial assets -3,217
Cashflows from investments in financial assetsCash receivedFor policy purposesFor liquidity purposes 268Cash paidFor policy purposesFor liquidity purposes -273Total cashflows from investments in financial assets -5
NET CASHFLOWS FROM INVESTING ACTIVITIES -3,222
CASHFLOWS FROM FINANCING ACTIVITIES
Cash receivedAdvances receivedBorrowings 42,892Deposits receivedOther financing receipts 676Total cash received 43,567
Cash paidAdvances paid -14Borrowings repaid -40,942Deposits paidOther financing payments -46Dividends paid -515Total cash paid -41,517
NET CASHFLOWS FROM FINANCING ACTIVITIES 2,050
Net increase in cash and cash equivalents 349Cash and cash equivalents at the beginning of the year 1,081
Cash and cash equivalents at the end of the year 1,430
KEY FISCAL AGGREGATES
Net cashflows from operating activities 1,521
Net cashflows from investing in non-financial assets -3,217Dividends paid -515Cash surplus /- deficit 6 -2,212
Note: Columns may not add due to rounding.
2010-11 2011-12 2012-13 2013-14 2014-15Estimated Budget Forward Forward Forward
Actual Estimate Estimate Estimate Estimate
$m $m $m $m $m
1,880 2,07313,724 14,790
294 34553 39
329 85316,281 18,100
-1,088 -1,163-9,970 10,557-1,003 -1,213
-571 -617-342 -408
-1,779 -2,621-14,753 16,579
1,528 1,521
-3,829629
-3,200
149
-143 -306 -25
-3,194 -2,659
35,159 32,552
836 761
35,995 3,313
-14-34,261
-62 -64-737 -691
-35,074 2,366
921 947
-745 -1901,430 684
684 494
1,528-3,200
-737-2,410
2,071 2,035 2,00516,314 17,987 19,783
419 454 431
37 46 50925 970 989
19,766 21,492 23,257
-1,194 -1,237 -1,275-11,218 -12,361 -13,701-1,367 -1,453 -1,472
-663 -713 -752-470 -732 -757
-2,799 -2,887 -2,868-17,710 -19,384 -20,824
2,055 2,109 2,433
-3,988 -3,121 -3,0741,122 1,121 1,037
-2,866 -2,000 -2,037
66 116
-37 -122 -114-36 -56 2
-2,903 -2,056 -2,035
36,007 31,852 31,948
459 277 18036,466 32,129 32,129
-15 -15 -15-34,576 -31,038 -31,000
-64 -66 -64-799 -1,042 -1,180
-35,454 -32,161 -32,259
1,012 -32 -131
165 20 267494 659 679659 679 947
2,055 2,109 2,433-2,866 -2,000 -2,037
-799 -1,042 -1,180-1,610 -933 -784
224
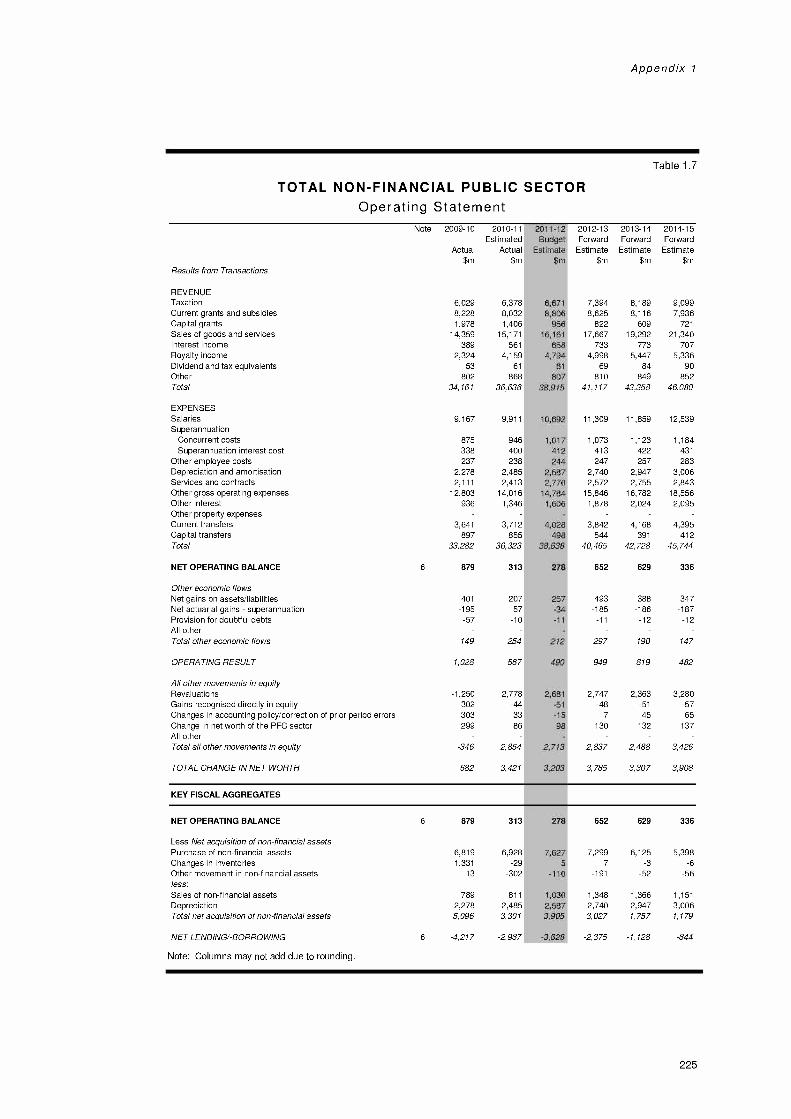
Appendix 1
Table 1.7
TOTAL NON-FINANCIAL PUBLIC SECTOROperating Statement
Results from Transactions
REVENUETaxationCurrent grants and subsidiesCapital grantsSales of goods and servicesInterest incomeRoyalty incomeDividend and tax equivalentsOtherTotal
EXPENSESSalariesSuperannuation
Concurrent costsSuperannuation interest cost
Other employee costsDepreciation and amortisationServices and contractsOther gross operating expensesOther interestOther property expensesCurrent transfersCapital transfersTotal
NET OPERATING BALANCE
Other economic flowsNet gains on assets/liabilitiesNet actuarial gains superannuationProvision for doubtful debtsAll otherTotal other economic flows
OPERATING RESULT
All other movements in equityRevaluationsGains recognised directly in equityChanges in accounting policy/correction of prior period errorsChange in net worth of the PFC sectorAll otherTotal all other movements in equity
TOTAL CHANGE IN NET WORTH
Note
6
2009-10
Actual
$m
6,0298,2281,978
14,359389
2,32453
80234,161
9,167
875338237
2,2782,111
12,803936
3,641897
33,282
879
401
-195-57
149
1,028
-1,250302303299
-346
682
2010-11Estimated
Actual
$m
6,3788,0321,406
15,171561
4,15961
86836,636
9,911
946400238
2,4852,413
14,0161,346
3,712855
36,323
313
20757
-10
254
567
2,778-4433
86
2,854
3,421
KEY FISCAL AGGREGATES
NET OPERATING BALANCE
Less Net acquisition of non-financial assetsPurchase of non-financial assetsChanges in inventoriesOther movement in non-financial assetsless:Sales of non-financial assetsDepreciationTotal net acquisition of non-financial assets
NET LENDING/-BORROWING
6
6
879
6,8191,331
13
7892,2785,096
-4,217
313
6,928-29
-302
811
2,4853,301
-2,987
Note: Columns may not add due to rounding.
2011-12 2012-13 2013-14 2014-15Budget Forward Forward Forward
Estimate Estimate Estimate Estimate$m $m $m $m
6,6718,806
95616,161
6584,794
61
80738,915
10,692
1,017412244
2,5872,770
14,7841,606
4,028498
38,638
278
2
90
,681
-51
-1598
2,713
3,203
1
2,5873,905
-3,628
7,394 8,189 9,0998,625 8,116 7,936
822 609 721
17,667 19,292 21,340733 773 707
4,998 5,447 5,33669 84 90
810 849 85241,117 43,358 46,080
11,309 11,859 12,539
1,073 1,123 1,184413 422 431
247 257 2832,740 2,947 3,0062,572 2,755 2,843
15,846 16,782 18,5561,878 2,024 2,095
3,842 4,168 4,395544 391 412
40,465 42,728 45,744
652 629 336
493 388 347-185 -186 -187
-11 -12 -12
297 190 147
949 819 482
2,747 2,363 3,280-48 -51 -57
7 45 65130 132 137
2,837 2,488 3,426
3,785 3,307 3,908
652 629 336
7,299 6,125 5,3987 -3 -6
-191 -52 -56
1,348 1,366 1,1512,740 2,947 3,0063,027 1,757 1,179
-2,375 -1,128 -844
225
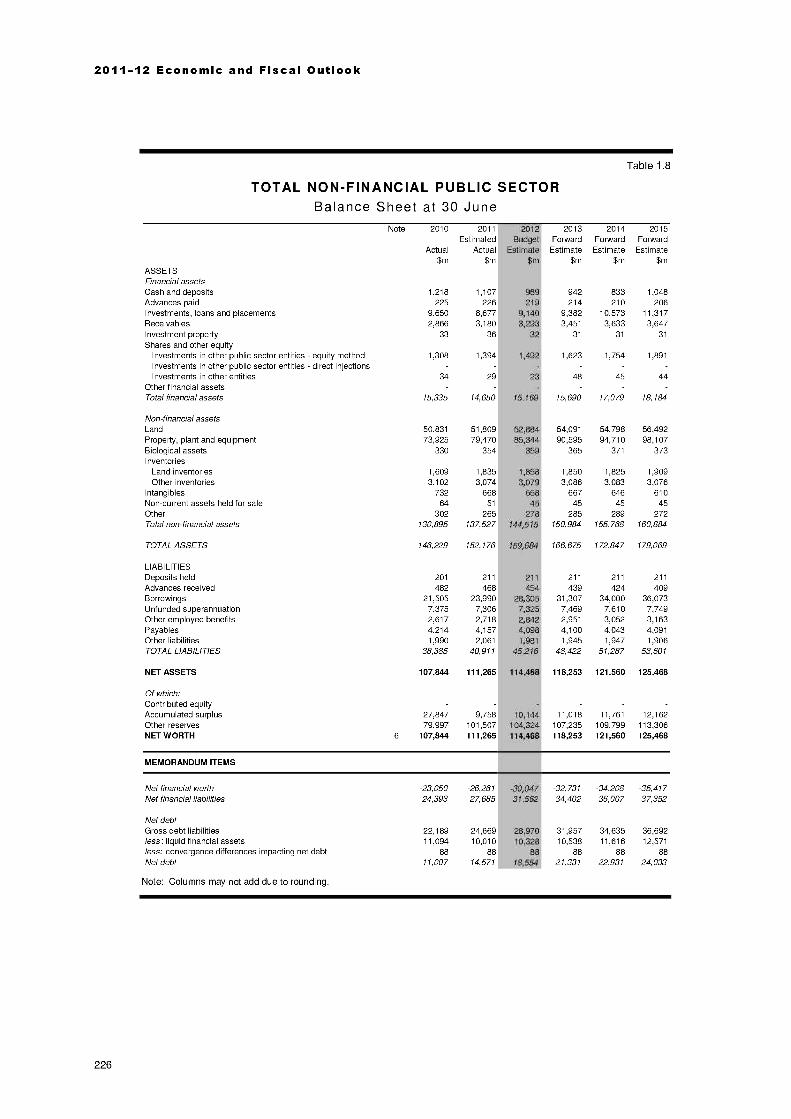
2011-12 Economic and Fiscal Outlook
Table 1.8
TOTAL NON-FINANCIAL PUBLIC SECTORBalance Sheet at 30 June
Note 2010 2011 201
Estimated BudgeActual Estimat
$m $
Actual
$mASSETSFinancial assetsCash and depositsAdvances paidInvestments, loans and placementsReceivablesInvestment propertyShares and other equity
Investments in other public sector entities equity methodInvestments in other public sector entities direct injectionsInvestments in other entities
Other financial assetsTotal financial assets
Non-financial assetsLandProperty, plant and equipmentBiological assetsInventories
Land inventoriesOther inventories
IntangiblesNon-current assets held for saleOtherTotal non-financial assets
TOTAL ASSETS
LIABILITIESDeposits heldAdvances receivedBorrowingsUnfunded superannuationOther employee benefitsPayablesOther liabilitiesTOTAL LIABILITIES
NET ASSETS
Of which:Contributed equityAccumulated surplusOther reservesNET WORTH 6
1,218225
9,6502,866
33
1,308
34
15,335
50,83173,925
330
1,6093,102
73264
302130,895
146,229
201
48221,505
7,3752,6174,2141,990
38,385
107,844
27,84779,997
107,844
MEMORANDUM ITEMS
1,107 969226 219
8,677 9,1403,180 3,293
36 32
1,394
29
14,650
23
51,809 52,88479,470 85,344
354 359
1,835 1,8583,074 3,079
668 66851 45
265 278137,527 4,515
152,176 .9,684
211 211
468 45423,990 28,305
7,306 7,3252,718 2,8424,157 4,0982,061 1,981
40,911 5,216
111,265 14,46
9,758 10,14101,507 104,32111,265 114,46:
2013ForwardEstimate
$m
2014Forward
Estimate$m
2015Forward
Estimate$m
942 833 1,048214 210 206
9,382 10,573 11,3173,451 3,633 3,647
31 31 31
1,623 1,754 1,891
48 45 44
15,690 17,079 18,184
54,091 54,798 56,49290,595 94,710 98,107
365 371 373
1,850 1,825 1,9093,086 3,083 3,076
667 646 61045 45 45
285 289 272150,984 155,768 160,884
166,675 172,847 179,069
211 211 211
439 424 40931,307 34,000 36,0737,469 7,610 7,7492,951 3,052 3,1634,100 4,043 4,0911,945 1,947 1,906
48,422 51,287 53,601
118,253 121,560 125,468
11,018 11,761 12,162107,235 109,799 113,306118,253 121,560 125,468
Net financial worth -23,050 -26,261 0,047 -32,731 -34,208 -35,417Net financial liabilities 24,393 27,685 1,562 34,402 36,007 37,352
Net debtGross debt liabilities 22,189 24,669 28,970 31,957 34,635 36,692less: liquid financial assets 11,094 10,010 10,328 10,538 11,616 12,571less: convergence differences impacting net debt 88 88 88 88 88 88Net debt 11,007 14,571 18,554 21,331 22,931 24,033
Note: Columns may not add due to rounding.
226
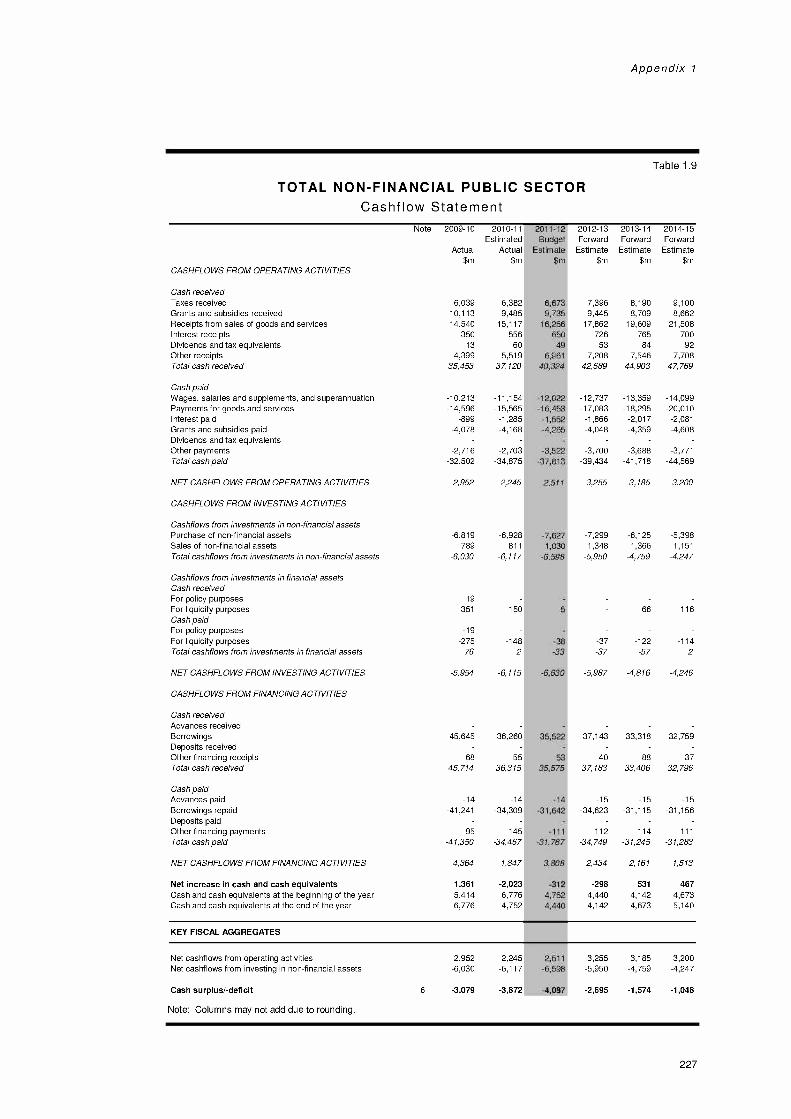
Appendix 1
TOTAL NON-FINANCIAL PUBLIC SECTORCashflow Statement
CASHFLOWS FROM OPERATING ACTIVITIES
Cash received
Note 2009-10
Actual
$m
Taxes received 6,039Grants and subsidies received 10,113Receipts from sales of goods and services 14,540Interest receipts 350Dividends and tax equivalents 13
Other receipts 4,399Total cash received 35,453
Cash paidWages, salaries and supplements, and superannuation -10,213Payments for goods and services -14,596I nte rest paid -899Grants and subsidies paid -4,078Dividends and tax equivalentsOther payments -2,716Total cash paid -32,502
NET CASHFLOWS FROM OPERATING ACTIVITIES 2,952
CASHFLOWS FROM INVESTING ACTIVITIES
Cashflows from investments in non-financial assetsPurchase of non-financial assets -6,819Sales of non-financial assets 789Total cashflows from investments in non-financial assets -6,030
Cashflows from investments in financial assetsCash receivedFor policy purposes 19
For liquidity purposes 351
Cash paidFor policy purposes -19For liquidity purposes -275Total cashflows from investments in financial assets 76
NET CASHFLOWS FROM INVESTING ACTIVITIES -5,954
CASHFLOWS FROM FINANCING ACTIVITIES
Cash receivedAdvances receivedBorrowings 45,645Deposits receivedOther financing receipts 68Total cash received 45,714
Cash paidAdvances paid -14Borrowings repaid -41,241Deposits paidOther financing payments -95Total cash paid -41,350
NET CASHFLOWS FROM FINANCING ACTIVITIES 4,364
Net increase in cash and cash equivalents 1,361Cash and cash equivalents at the beginning of the year 5,414Cash and cash equivalents at the end of the year 6,776
KEY FISCAL AGGREGATES
Net cashflows from operating activities 2,952Net cashflows from investing in non-financial assets -6,030
Cash surplus/-deficit 6 -3,079
Note: Columns may not add due to rounding.
Table 1.9
2010-11 2011-12 2012-13 2013-14 2014-15Estimated Budget Forward Forward Forward
Actual Estimate Estimate Estimate Estimate$m $m $m $m $m
6,382 6,6739,485 9,735
15,117 16,256556 65060 49
5,519 6,96137,120 40,324
-11,154 -12,022-15,565 -16,453-1,285 -1,552-4,168 -4,265
-2,703 -3,522-34,875 -37,813
2,245 1 2,511
-6,928 -7,627811 1,030
-6,117 -6,598
150
-1482
-6,115
36,260 k 35,522
55 5336,315 35,575
-14-34,309
-145 -111
-34,467 -31,767
1,847 3,808
-2,023 -3126,776 4,7524,752 4,440
2,245-6,117
-3,872
7,396 8,190 9,1009,445 8,709 8,662
17,862 19,609 21,508726 765 70053 84 92
7,208 7,546 7,70842,689 44,903 47,769
-12,737 -13,359 -14,099-17,083 -18,295 -20,010
-1,866 -2,017 -2,081-4,048 -4,359 -4,608
-3,700 -3,688 -3,771-39,434 -41,718 -44,569
3,255 3,185 3,200
-7,299 -6,125 -5,3981,348 1,366 1,151
-5,950 -4,759 -4,247
66 116
-37 -122 -114-37 -57 2
-5,987 -4,816 -4,246
37,143 33,318 32,759
40 88 3737,183 33,406 32,796
-15 -15 -15-34,623 -31,115 -31,156
-112 -114 -111-34,749 -31,245 -31,283
2,434 2,161 1,513
-298 531 4674,440 4,142 4,6734,142 4,673 5,140
3,255 3,185 3,200-5,950 -4,759 -4,247
-2,695 -1,574 -1,048
227
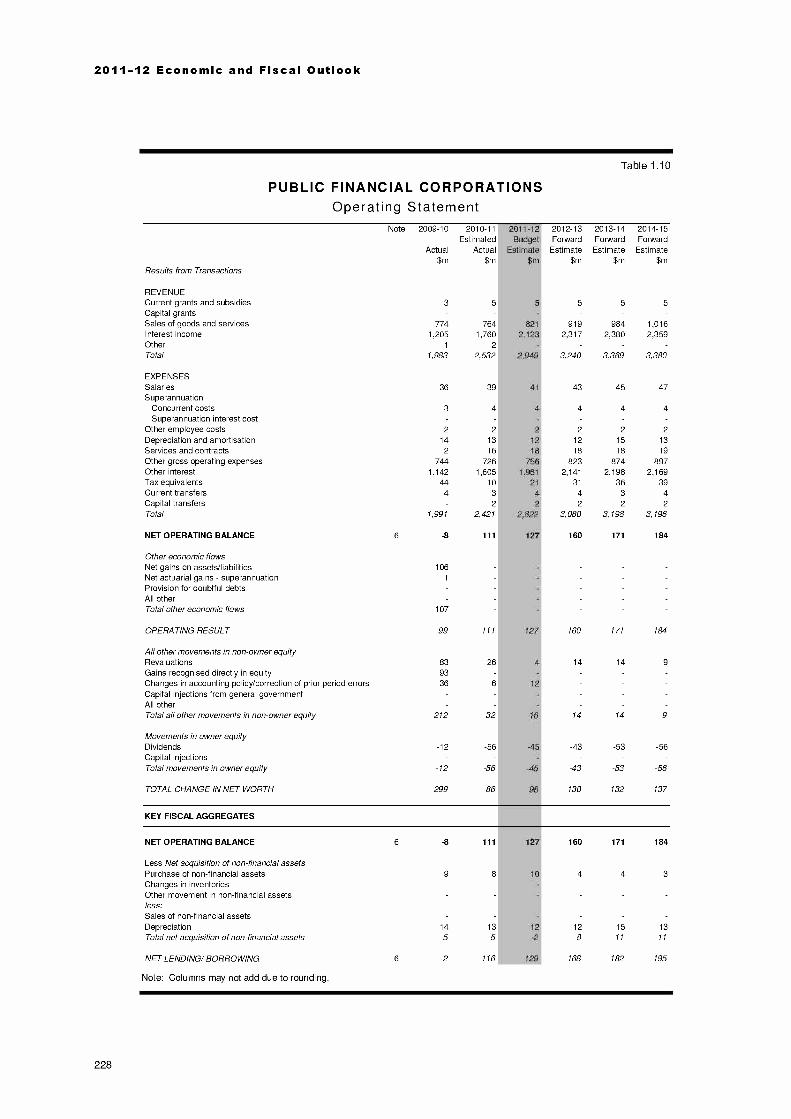
2011-12 Economic and Fiscal Outlook
Table 1.10
PUBLIC FINANCIAL CORPORATIONSOperating Statement
Note 2009-10 2010-11 2012-13 2013-14 2014-15Estimated Forward Forward Forward
Actual Actual Estimate Estimate Estimate$m $m $m $m $m
Results from Transactions
REVENUECurrent grants and subsidies 3
Capital grantsSales of goods and services 774Interest income 1,205Other 1
Total 1,983
EXPENSESSalaries 36Superannuation
Concurrent costs 3
Superannuation interest costOther employee costs 2
Depreciation and amortisation 14
Services and contracts 2
Other gross operating expenses 744Other interest 1,142Tax equivalents 44Current transfers 4Capital transfersTotal 1,991
NET OPERATING BALANCE 6
Other economic flowsNet gains on assets/liabilities 106Net actuarial gains superannuation 1
Provision for doubtful debtsAll otherTotal other economic flows 107
OPERATING RESULT 99
All other movements in non-owner equityRevaluations 83Gains recognised directly in equity 93Changes in accounting policy/correction of prior period errors 36
Capital injections from general governmentAll otherTotal all other movements in non-owner equity 212
Movements in owner equityDividends -12Capital injectionsTotal movements in owner equity -12
TOTAL CHANGE IN NET WORTH 299
KEY FISCAL AGGREGATES
NET OPERATING BALANCE 6 111 w
5 5
764 821
1,760 2,1232
2,532 2,949
39 41412
13 12
16 18
726 6
1,60510
3 42
2,421
111
111
26
32 16
-56 -45
-56
86
5 5 5
919 984 1,0162,317 2,380 2,359
3,240 3,369 3,380
43 45 47
4 4 4
2 2 2
12 15 13
18 18 19
823 874 8972,141 2,198 2,169
31 36 394 3 42 2 2
3,080 3,198 3,196
160 171 184
160 171 184
14 14 9
14 14 9
-43 -53 -56
-43 -53 -56
130 132 137
Less Net acquisition of non-financial assetsPurchase of non-financial assetsChanges in inventoriesOther movement in non-financial assetsless:Sales of non-financial assetsDepreciationTotal net acquisition of non-financial assets
9 8
14 13
-5 -5
NET LENDING/-BORROWING 6 -2 116
Note: Columns may not add due to rounding.
127 160 171 184
10 4 4 3
12 12 15 13
-2 -8 -11 -11
129 168 182 195
228
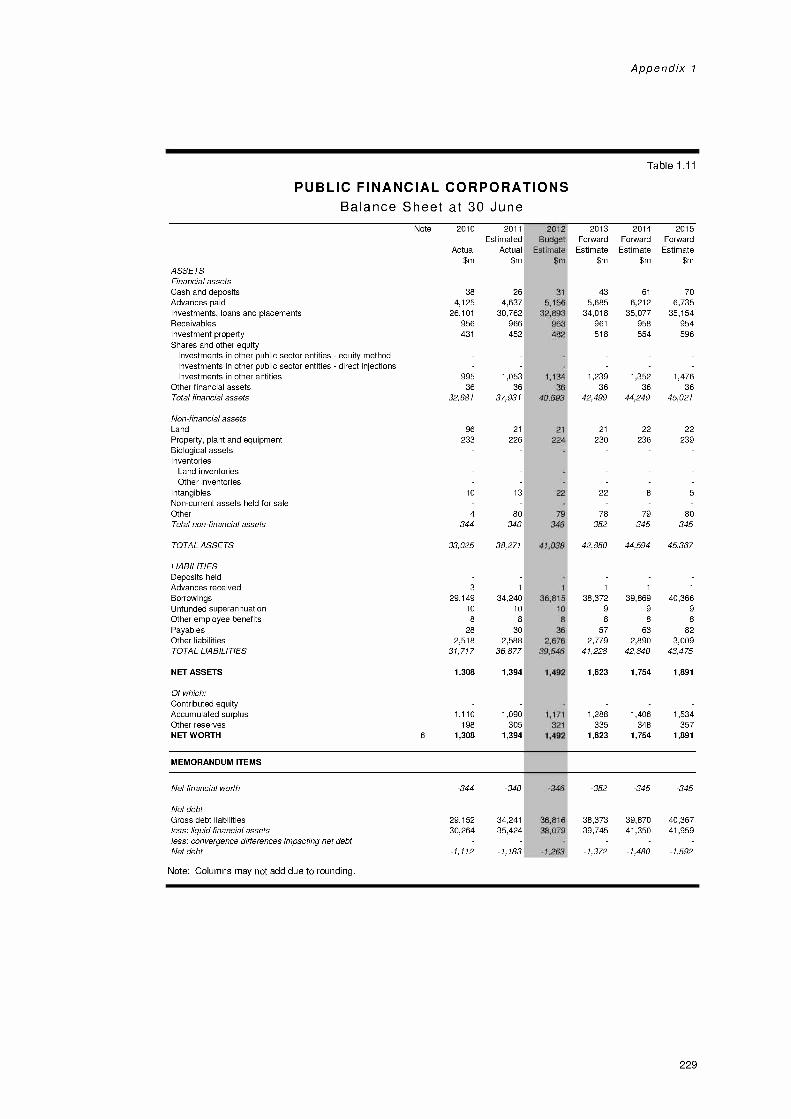
Appendix 1
Table 1.11
PUBLIC FINANCIAL CORPORATIONSBalance Sheet at 30 June
ASSETSFinancial assets
Note 2010
Actual
$m
Cash and deposits 38Advances paid 4,125Investments, loans and placements 26,101Receivables 956Investment property 431
Shares and other equityInvestments in other public sector entities equity methodInvestments in other public sector entities direct injectionsInvestments in other entities 995
Other financial assets 36Total financial assets 32,681
Non-financial assetsLand 96Property, plant and equipment 233Biological assetsInventories
Land inventoriesOther inventories
Intangibles 10
Non-current assets held for saleOther 4Total non-financial assets 344
TOTAL ASSETS 33,025
LIABILITIESDeposits heldAdvances received 3
Borrowings 29,149Unfunded superannuation 10
Other employee benefits 8
Payables 28Other liabilities 2,518TOTAL LIABILITIES 31,717
NET ASSETS 1,308
Of which:Contributed equityAccumulated surplus 1,110Other reserves 198NET WORTH 6 1,308
MEMORANDUM ITEMS
Net financial worth -344
Net debtGross debt liabilities 29,152less: liquid financial assetsless: convergence differences impacting net debt
30,264
Net debt -1,112
Note: Columns may not add due to rounding.
2011 2012Estimated Budget
Actual Estimate$m $m
26 31
4,637 5,15630,762 32,893
966 963452 482
1,053 1,13436 36
37,931 40,693
21 21
226 224
13
80340
38,271
1
34,24010
8
302,588
36,877
1,394
8
362,676
39,546
1,492
1,090 1,171305 321
1,394 1,492
-340 I -346
34,241 36,81635,424 38,079
-1,183 -1,263
2013Forward
Estimate$m
2014Forward
Estimate$m
2015Forward
Estimate$m
43 61 705,685 6,212 6,735
34,018 35,077 35,154961 958 954518 554 596
1,239 1,352 1,47636 36 36
42,499 44,249 45,021
21 22 22230 236 239
22 8 5
78 79 80352 345 345
42,850 44,594 45,367
1 1 1
38,372 39,869 40,3669 9 9
8 8 8
57 63 822,779 2,890 3,009
41,228 42,840 43,475
1,623 1,754 1,891
1,288 1,406 1,534335 348 357
1,623 1,754 1,891
-352 -345 -345
38,373 39,870 40,36739,745 41,350 41,959
-1,372 -1,480 -1,592
229
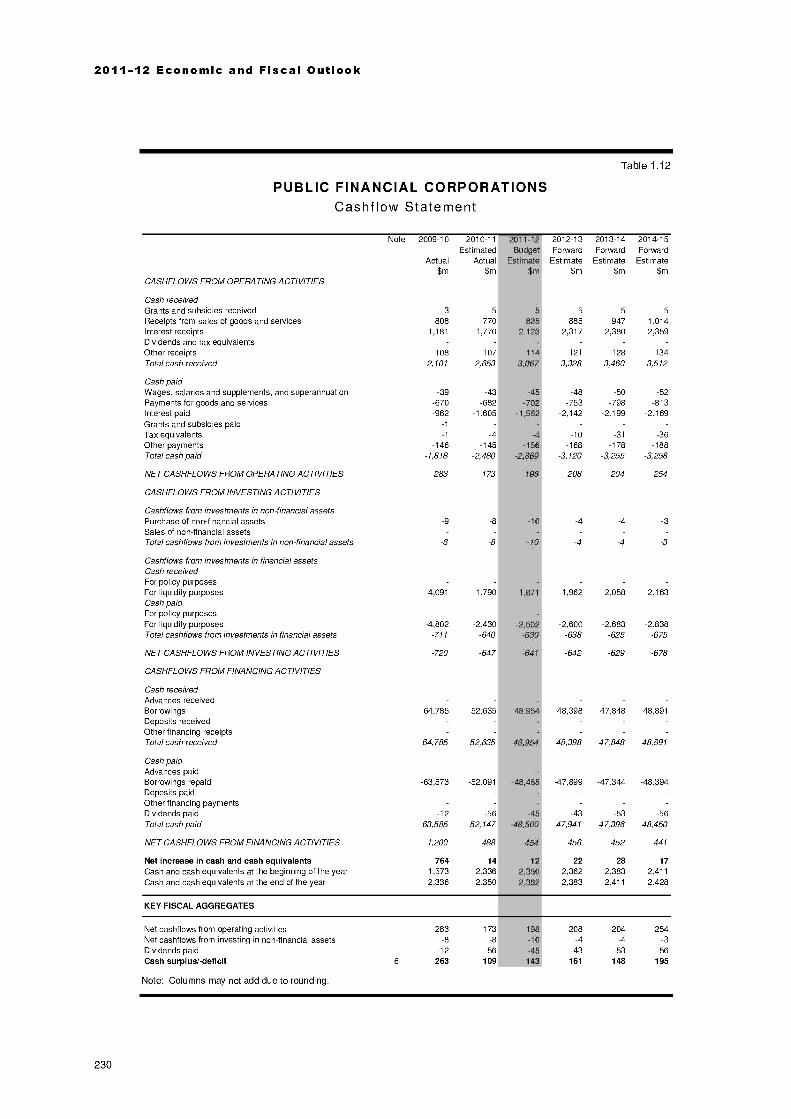
2011-12 Economic and Fiscal Outlook
Table 1.12
PUBLIC FINANCIAL CORPORATIONSCashflow Statement
Note 2009-10 2010-11 2011-12 2012-13 2013-14 2014-15Estimated Budget Forward Forward Forward
Actual Actual Estimate Estimate Estimate Estimate$m $m $m $m $m $m
CASHFLOWS FROM OPERATING ACTIVITIES
Cash receivedGrants and subsidies received 3 5 5
Receipts from sales of goods and services 808 770 825Interest receipts 1,181 1,770 2,123Dividends and tax equivalentsOther receipts 108 107 114Total cash received Z101 2,653 3,067
Cash paidWages, salaries and supplements, and superannuation -39 -43 -45Payments for goods and services -670 -682 -702Interest paid -962 -1,605 -1,962Grants and subsidies paid -1
Tax equivalents -1 -4 -4Other payments -146 -145 -156Total cash paid -1,818 -2,480 -2,869
NET CASHFLOWS FROM OPERATING ACTIVITIES 283 173 198
CASHFLOWS FROM INVESTING ACTIVITIES
Cashflows from investments in non-financial assetsPurchase of non-financial assets -9Sales of non-financial assetsTotal cashflows from investments in non-financial assets -8 -10
Cashflows from investments in financial assetsCash receivedFor policy purposesFor liquidity purposesCash paidFor policy purposesFor liquidity purposesTotal cashflows from investments in financial assets
NET CASHFLOWS FROM INVESTING ACTIVITIES
CASHFLOWS FROM FINANCING ACTIVITIES
Cash receivedAdvances receivedBorrowingsDeposits receivedOther financing receiptsTotal cash received
Cash paidAdvances paidBorrowings repaidDeposits paidOther financing paymentsDividends paidTotal cash paid
NET CASHFLOWS FROM FINANCING ACTIVITIES
4,091 1,790 1,871
-4,802 -2,430 -2,502-711 -640 -630
-720 -647 -641
64,785 52,635 48,954
64,785 52,635
-63,573 -52,091
-12 -56-63,585 -52,147
1,200 488
Net increase in cash and cash equivalents 764 14Cash and cash equivalents at the beginning of the year 1,573 2,336Cash and cash equivalents at the end of the year 2,336 2,350
KEY FISCAL AGGREGATES
Net cashflows from operating activities 283 173 198Net cashflows from investing in non-financial assets -8 -8 -10Dividends paid -12 -56 -45Cash surplus/-deficit 6 263 109 143
Note: Columns may not add due to rounding.
5 5 5
885 947 1,0142,317 2,380 2,359
121 128 1343,328 3,460 3,512
-48 -50 -52-753 -798 -813
-2,142 -2,199 -2,169
-10 -31 -36-168 -178 -188
-3,120 -3,255 -3,258
208 204 254
-4 -4 -3
-4 -4 -3
1,962 2,058 2,163
-2,600 -2,683 -2,838-638 -625 -675
-642 -629 -678
48,398 47,848 48,891
48,398 47,848 48,891
-47,899 -47,344 -48,394
-43 -53 -56-47,941 -47,396 -48,450
456 452 441
22 28 172,362 2,383 2,4112,383 2,411 2,428
208 204 254-4 -4 -3
-43 -53 -56161 148 195
230
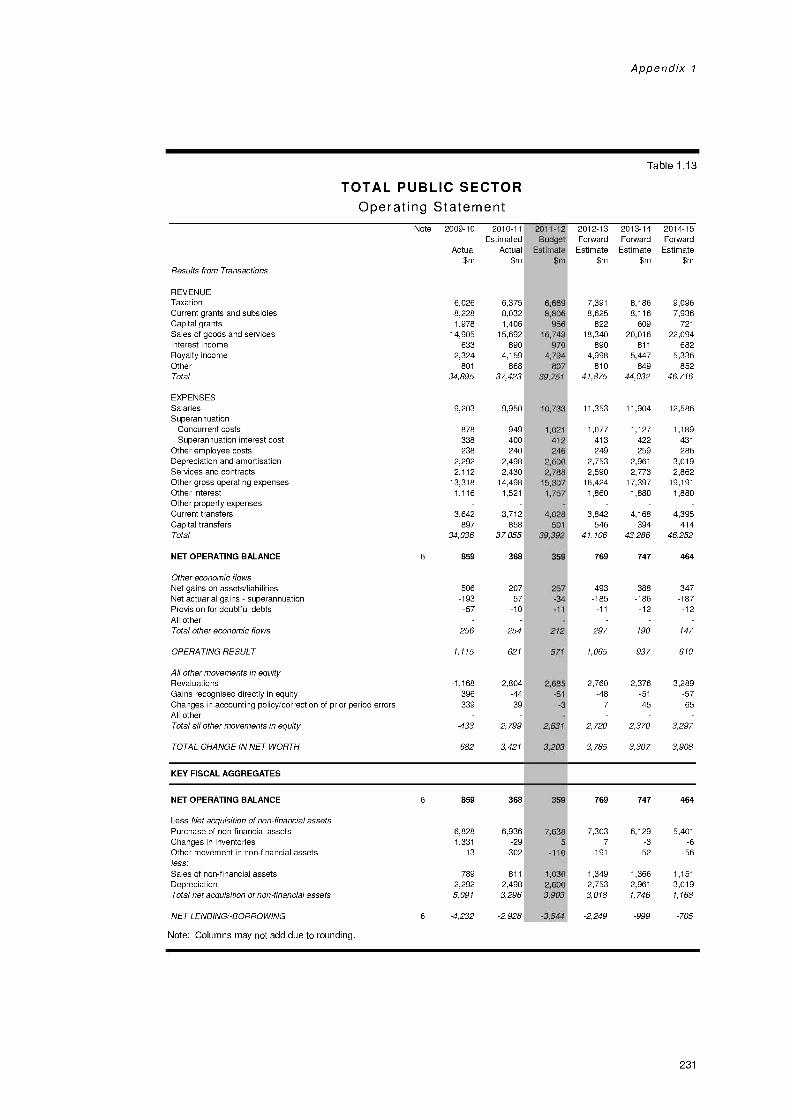
Appendix 1
Table 1.13
TOTAL PUBLIC SECTOROperating Statement
Note 2009-10 2010-11 2011-12 2012-13 2013-14 2014-15Estimated Budget Forward Forward Forward
Actual Actual Estimate Estimate Estimate Estimate$m $m $m $m $m $m
Results from Transactions
REVENUETaxationCurrent grants and subsidiesCapital grantsSales of goods and servicesInterest incomeRoyalty incomeOtherTotal
EXPENSESSalariesSuperannuation
Concurrent costsSuperannuation interest cost
Other employee costsDepreciation and amortisationServices and contractsOther gross operating expensesOther interestOther property expensesCurrent transfersCapital transfersTotal
NET OPERATING BALANCE
Other economic flowsNet gains on assets/liabilitiesNet actuarial gains superannuationProvision for doubtful debtsAll otherTotal other economic flows
OPERATING RESULT
All other movements in equityRevaluationsGains recognised directly in equityChanges in accounting policy/correction of prior period errorsAll otherTotal all other movements in equity
TOTAL CHANGE IN NET WORTH
6
6,0268,2281,978
14,905633
2,324801
34,895
9,203
878338238
2,2922,112
13,3181,116
3,642897
34,036
859
506-193-57
256
1,115
-1,168396339
-433
682
6,3758,0321,406
15,692890
4,159868
37,423
9,950
949400240
2,4982,430
14,4981,521
3,712858
37,055
368
20757
-10
254
621
2,804-4439 1
2,799
3,421
KEY FISCAL AGGREGATES
NET OPERATING BALANCE 6 859
Less Net acquisition of non-financial assetsPurchase of non-financial assets 6,828Changes in inventories 1,331
Other movement in non-financial assetsless:
13
Sales of non-financial assets 789Depreciation 2,292Total net acquisition of non-financial assets 5,091
NET LENDING/-BORROWING 6 -4,232
Note: Columns may not add due to rounding.
368
6,936-29
-302
,806956749970794807r51
,733
1,021
412246
2,6002,788
15,3071,757
4,028501
41
2
2,6
2,631
3,203
7,391 8,186 9,0968,625 8,116 7,936
822 609 721
18,340 20,016 22,094890 811 682
4,998 5,447 5,336810 849 852
41,875 44,032 46,716
11,353 11,904 12,586
1,077 1,127 1,189413 422 431
249 259 2862,753 2,961 3,0192,590 2,773 2,862
16,424 17,397 19,1911,860 1,880 1,880
3,842 4,168 4,395546 394 414
41,106 43,286 46,252
769 747 464
493 388 347-185 -186 -187
-11 -12 -12
297 190 147
1,065 937 610
2,760 2,376 3,289-48 -51 -57
7 45 65
2,720 2,370 3,297
3,785 3,307 3,908
811
2,4983,296
-2,928 1
769 747 464
7,303 6,129 5,4017 -3 -6
-191 -52 -56
1,030 1,349 1,366 1,1512,600 2,753 2,961 3,0193,903 3,018 1,746 1,168
-3,544 -2,249 -999 -705
231
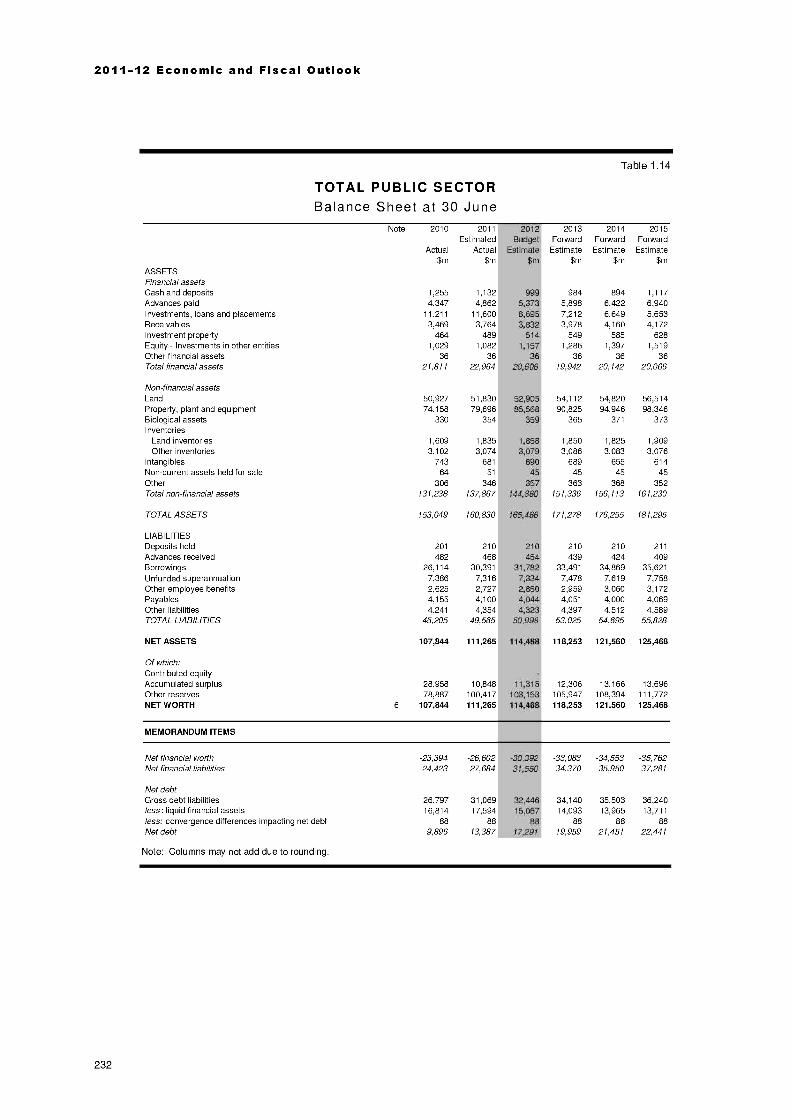
2011-12 Economic and Fiscal Outlook
Table 1.14
TOTAL PUBLIC SECTORBalance Sheet at 30 June
ASSETSFinancial assets
Note 2010
Actual
$m
2011 201
Estimated BudgeActual Estimat
$m $
2013ForwardEstimate
$m
2014Forward
Estimate$m
2015Forward
Estimate$m
Cash and deposits 1,255 1,132 999 984 894 1,117Advances paid 4,347 4,862 5,373 5,898 6,422 6,940Investments, loans and placements 11,211 11,600 8,695 7,212 6,649 5,653Receivables 3,469 3,764 3,832 3,978 4,160 4,172Investment property 464 489 514 549 585 628Equity Investments in other entities 1,029 1,082 1,157 1,286 1,397 1,519Other financial assets 36 36 36 36 36 36Total financial assets 21,811 22,964 0,606 19,942 20,142 20,066
Non-financial assetsLand 50,927 51,830 52,905 54,112 54,820 56,514Property, plant and equipment 74,158 79,696 85,568 90,825 94,946 98,346Biological assets 330 354 359 365 371 373Inventories
Land inventories 1,609 1,835 1,858 1,850 1,825 1,909Other inventories 3,102 3,074 3,079 3,086 3,083 3,076
Intangibles 743 681 690 689 655 614Non-current assets held for sale 64 51 45 45 45 45Other 306 346 357 363 368 352Total non-financial assets 131,238 137,867 44,860 151,336 156,113 161,230
TOTAL ASSETS 153,049 160,830 X165,466 171,278 176,255 181,295
LIABILITIESDeposits held 201 210 210 210 210 211
Advances received 482 468 439 424 409Borrowings 26,114 30,391 33,491 34,869 35,621Unfunded superannuation 7,386 7,316 7,478 7,619 7,758Other employee benefits 2,625 2,727 2,959 3,060 3,172Payables 4,155 4,100 4,051 4,000 4,069Other liabilities 4,241 4,354 4,397 4,512 4,589TOTAL LIABILITIES 45,205 49,565 53,025 54,695 55,828
NET ASSETS 107,844 111,265 118,253 121,560 125,468
Of which:Contributed equityAccumulated surplus 28,958 10,848 12,306 13,166 13,696Other reserves 78,887 100,417 105,947 108,394 111,772NET WORTH 6 107,844 111,265 118,253 121,560 125,468
MEMORANDUM ITEMS
Net financial worth -23,394 -26,602 -33,083 -34,553 -35,762Net financial liabilities 24,423 27,684 34,370 35,950 37,281
Net debtGross debt liabilities 26,797 31,069 32,446 34,140 35,503 36,240less: liquid financial assets 16,814 17,594 15,067 14,093 13,965 13,711less: convergence differences impacting net debt 88 88 88 88 88 88Net debt 9,896 13,387 17,291 19,959 21,451 22,441
Note: Columns may not add due to rounding.
232
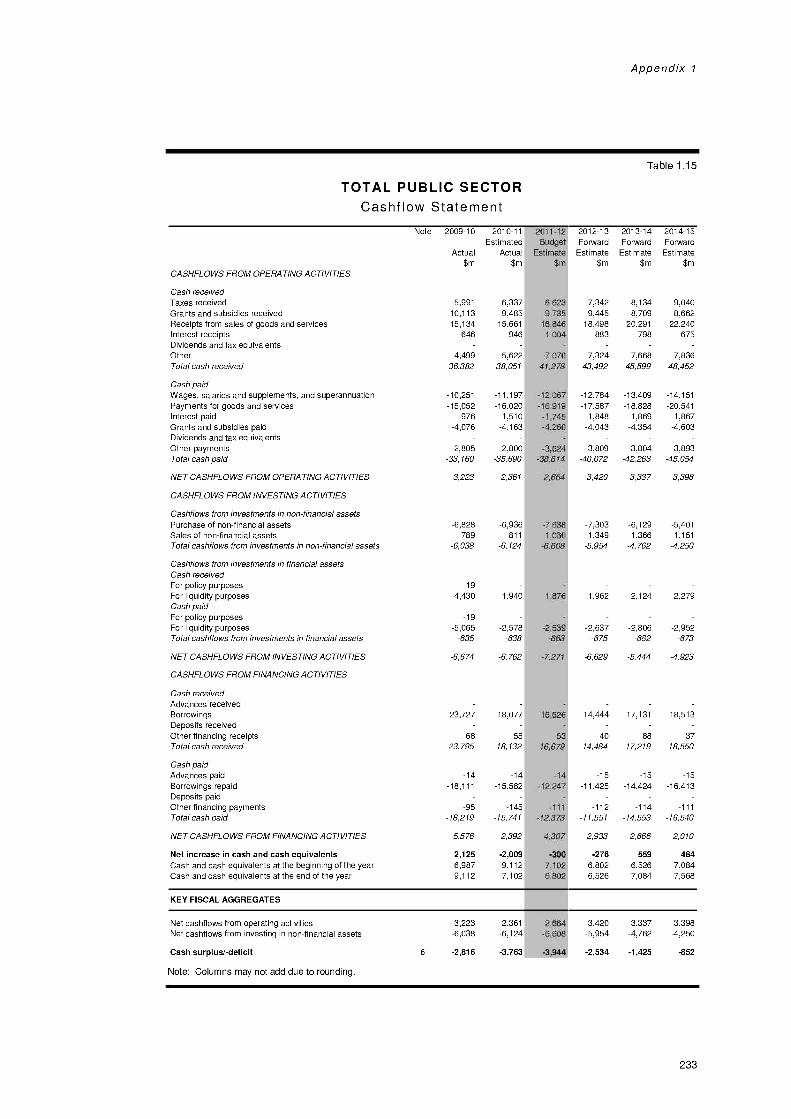
Appendix 1
Table 1.15
TOTAL PUBLIC SECTORCashflow Statement
CASHFLOWS FROM OPERATING ACTIVITIES
Cash received
Note 2009-10
Actual$m
2010-11Estimated
Actual
$m
Taxes received 5,991 6,337Grants and subsidies received 10,113 9,485Receipts from sales of goods and services 15,134 15,661Interest receipts 646 946Dividends and tax equivalentsOther 4,499 5,622Total cash received 36,382 38,051
Cash paidWages, salaries and supplements, and superannuation -10,251 -11,197Payments for goods and services -15,052 -16,020Interest paid -976 -1,510Grants and subsidies paid -4,076 -4,163Dividends and tax equivalentsOther payments -2,805 -2,800Total cash paid -33,160 -35,690
NET CASHFLOWS FROM OPERATING ACTIVITIES 3,223 2,361
CASHFLOWS FROM INVESTING ACTIVITIES
Cashflows from investments in non-financial assetsPurchase of non-financial assets -6,828 -6,936Sales of non-financial assets 789 811
Total cashflows from investments in non-financial assets -6,038 -6,124
Cashflows from investments in financial assetsCash receivedFor policy purposes 19
For liquidity purposes 4,430 1,940Cash paidFor policy purposes -19For liquidity purposes -5,065 -2,578Total cashflows from investments in financial assets -635 -638
NET CASHFLOWS FROM INVESTING ACTIVITIES -6,674 -6,762
CASHFLOWS FROM FINANCING ACTIVITIES
Cash receivedAdvances receivedBorrowings 23,727 18,077Deposits receivedOther financing receipts 68 55Total cash received 23,795 18,132
Cash paidAdvances paid -14 -14Borrowings repaid -18,111 -15,582Deposits paidOther financing payments -95 -145Total cash paid -18,219 -15,741
NET CASHFLOWS FROM FINANCING ACTIVITIES 5,576 2,392
Net increase in cash and cash equivalents 2,125 -2,009Cash and cash equivalents at the beginning of the year 6,987 9,112Cash and cash equivalents at the end of the year 9,112 7,102
KEY FISCAL AGGREGATES
Net cashflows from operating activities 3,223 2,361Net cashflows from investing in non-financial assets -6,038 -6,124
Cash surplus/-deficit 6 -2,816 -3,763
Note: Columns may not add due to rounding.
2011-12 2012-13 2013-14 2014-15Budget Forward Forward Forward
Estimate Estimate Estimate Estimate$m $m $m $m
,6239,4
16,8al,1,004
7,07041,278
12,06716,919-1,745-4,260
-3,62438,614
2,664
-7,6381,030
-6,608
1,876
-2,539-663
16,626
5316,679
7,342 8,134 9,0409,445 8,709 8,662
18,498 20,291 22,240883 798 675
7,324 7,668 7,83643,492 45,599 48,452
-12,784 -13,409 -14,151-17,587 -18,828 -20,541-1,848 -1,869 -1,867-4,043 -4,354 -4,603
-3,809 -3,804 -3,893-40,072 -42,263 -45,054
3,420 3,337 3,398
-7,303 -6,129 -5,4011,349 1,366 1,151
-5,954 -4,762 -4,250
1,962 2,124 2,279
-2,637 -2,806 -2,952-675 -682 -673
-6,629 -5,444 -4,923
14,444 17,131 18,513
40 88 3714,484 17,219 18,550
-15 -15 -15-11,425 -14,424 -16,413
-112 -114 -111
-11,551 -14,553 -16,540
2,933 2,666 2,010
-276 559 4846,802 6,526 7,0846,526 7,084 7,568
3,420 3,337 3,398-5,954 -4,762 -4,250
-2,534 -1,425 -852
233

2011-12 Economic and Fiscal Outlook
NOTE 1: STATEMENT OF COMPLIANCE
The projected public sector financial statements presented in this appendix have beenprepared in accordance with Australian Accounting Standards and the Australian Bureauof Statistics' Government Finance Statistics Concepts, Sources and Methods 2005.
The presentation in this appendix is consistent with AASB 1049: Whole of Governmentand General Government Sector Financial Reporting.
NOTE 2: SUMMARY OF SIGNIFICANT ACCOUNTING POLICIES
The financial statements constitute general purpose financial reports for the total publicsector (also known as the whole-of-government), general government sector, and each ofthe subsidiary public corporations sectors. The financial projections of the non-financialpublic sector (i.e. general government and the public non-financial corporations such aswater and electricity utilities, and the ports) are also presented as the total non-financialpublic sector.
The financial projections are a requirement of the Government Financial ResponsibilityAct 2000.
(a) The reporting entity
The reporting entity is the Government of Western Australia (the public sector) andincludes entities under its control.
(b) Basis of preparation
These financial projections do not include all the notes of the type normally included in anannual financial report. The accounting policies adopted in this publication are consistentwith those outlined in the 2009-10 Annual Report on State Finances (ARSF), which aredescribed in detail in Note 3: Summary of Significant Accounting Policies in Appendix 1of the 2009-10 ARSF.
The projections are presented in Australian dollars and all amounts are rounded to thenearest million dollars ($m).
(c) Unaudited data
These financial projections are not subject to audit.
(d) Comparative figures
Comparative information has been restated where necessary to match the adoption ofAASB 1049 presentation formats.
234

Appendix 1
NOTE 3: GENERAL GOVERNMENT OPERATING REVENUE
A detailed dissection of general government revenue (which includes the UniformPresentation Framework taxation disclosure) is included at Appendix 2: GeneralGovernment Operating Revenue.
A comparison of estimated out-turn to previous projected operating revenue for 2010-11is shown at Appendix 3: 2010-11 General Government Operating Revenue.
NOTE 4: GENERAL GOVERNMENT TRANSFER EXPENSES
Transfer expenses are defined as the provision of something of value for no specificreturn or consideration and include grants, subsidies, donations, transfers of assets free ofcharge, etc.
The following table provides detail of current and capital transfer expenses of the generalgovernment sector, in line with Uniform Presentation Framework disclosurerequirements.
TRANSFER EXPENSES (a)
General Government
CURRENT TRANSFERS
2009-10
Actual$m
2010-11Estimated
Actual$m
2011-12Budget
Estimate$m
2012-13Forward
Estimate$m
2013-14Forward
Estimate$m
2014-15Forward
Estimate$m
Local Government 154 205 452 309 381 554Local Government on-passing 136 137 156 163 170 181
Private and Not-for-profit sector 1,934 1,907 2,017 1,847 1,965 1,879Private and Not-for-profit sector on-passing 769 770 770 848 928 1,012Other sectors of Government 1,889 2,070 2,157 2,125 2,048 2,039Total Current Transfers 4,882 5,090 5,551 5,291 5,492 5,665
CAPITAL TRANSFERSLocal Government 64 113 185 220 111 122Local Government on-passing 90 90 101 106 110 112Private and Not-for-profit sector 422 141 173 194 144 147Private and Not-for-profit sector on-passing 309 280 40 24 26 31
Other sectors of Government 186 105 109 143 196 196Total Capital Transfers 1,071 729 607 687 588 608
(a) Includes grants, subsidies and other transfer expenses.
235

2011-12 Economic and Fiscal Outlook
NOTE 5: GENERAL GOVERNMENT EXPENSES AND SPENDING ONTHE PURCHASE OF NON-FINANCIAL ASSETS BY GOVERNMENT
PURPOSE CLASSIFICATION (a)
Expenses
2009-10
Actual
$m
2010-11Estimated
Actual
$m
2011-12Budget
Estimate
$m
2012-13Forward
Estimate
$m
2013-14Forward
Estimate
$m
2014-15Forward
Estimate
$m
General public services 428 584 683 866 1,087 1,537Public order and safety 2,459 2,647 2,739 2,799 24 62Education 5,651 5,716 5,744 5,839 5,980 6,221Health 5,028 5,593 6,073 6,508 6,843 7,092Social security and welfare 1,263 1,465 1,649 1,727 1,869 1,962Housing and community amenities 1,982 1,730 2,113 1,856 2,029 2,155Recreation and culture 695 738 774 838 757 764Fuel and energy 312 459 554 565 404 313Agriculture, forestry, fishing and hunting 354 394 365 352 321 328Mining and mineral resources other than fuels; manufacturing;and construction 161 193 211 210 192 188
Transport and communications 1,535 1,673 1,829 1,939 2,048 2,165Other economic affairs 678 912 1,066 838 759 719Other purposes 662 875 991 1,128 1,210 1,255
Total General Government Expenses 21,208 22,980 '4,79U 25,464 26,422 27,732
Purchases of new non-financial assetsGeneral public services 193 310 336 191 174 207Public order and safety 209 358 401 317 271 177Education 916 647 847 297 302 183Health 471 885 1,497 1,103 1,036 730Social security and welfare 55 76 78 53 47 33Housing and community amenities 126 181 311 406 421 357Recreation and culture 210 206 196 113 78 43Fuel and energy 2 9 7 2 1 1
Agriculture, forestry, fishing and hunting 13 24 31 24 25 61
Mining and mineral resources other than fuels; manufacturing;and construction 1 1 1 1 1 1
Transport and communications 621 440 674 745 639 521
Other economic affairs 157 120 200 90 59 43
Other purposes -125 -375
Total Purchases of Non-financial Assets 2,974 3,131 4,206 3,343 3,054 2,357
(a) Data in this table are for consolidated general government aggregates and exclude internal transactions within the sector.In relation to purchases of non-financial assets, the information in this table represents spending by function on fixedassets by general government agencies, which may be different to agency totals in the Asset Investment Program.
NOTE 6: CONVERGENCE DIFFERENCES
Where possible, AASB 1049 harmonises GFS and accounting concepts into a singlepresentation. Where harmonisation cannot be achieved (e.g. the recognition of a doubtfuldebts provision is excluded from GFS net worth), a convergence difference arises.
The following tables detail all convergence differences in the forward estimates.
236

Appendix 1
AASB 1049 TO GFS CONVERGENCE DIFFERENCES
Net Operating Balance2009-10 2010-11 2011-12 2012-13 2013-14 2014-15
Estimated Budget Forward Forward ForwardActual Actual Estimate Estimate Estimate Estimate
$m $m $m $m $m $m
General government
AASB1049 net operating balance 831 784 I 442 768 787 471
Plus GFS revenue adjustmentsCapital grants prepaid AusLink road grants 3
Goods and services revenue intersector equity/asset transfers recordedas revenue
Total GFS revenue adjustments
Total GFS adjustments to AASB 1049 net operating balance
GFS net operating balance
Public non-financial corporations
AASB1049 net operating balance 606 223 529 1
Less GFS expense adjustmentsCapitalised interest 51 62 461
Dividends 558 693 693Total GFS expense adjustments 609 756 739
Total GFS adjustments to AASB 1049 net operating balance -609 -756 -739
3
3
834 784
GFS net operating balance -3 -533 -210
Total non-financial public sector
AASB1049 net operating balance
Plus GFS revenue adjustmentsCapital grants prepaid AusLink road grants 3Goods and services revenue intersector equity/asset transfers recorded
as revenueTotal GFS revenue adjustments
Less GFS expense adjustmentsCapitalised interest 51 62 46Total GFS expense adjustments 51 62 46
879 313 278
3
Total GFS adjustments to AASB 1049 net operating balance -48 -62 -46
GFS net operating balance
Public financial corporations
AASB1049 net operating balance
830 251 232
-8 111 127
Less GFS expense adjustmentsDividends 12 56 45Total GFS expense adjustments 12 56 45
Total GFS adjustments to AASB 1049 net operating balance -12 -56 -45
GFS net operating balance -20 54 82
Total public sector
AASB1049 net operating balance 859 368 359
Plus GFS revenue adjustmentsCapital grants prepaid AusLink road grants 3
Goods and services revenue intersector equity/asset transfers recordedas revenue
Total GFS revenue adjustments 3
Less GFS expense adjustmentsCapitalised interest 51 62 46Total GFS expense adjustments 51 62 46
Total GFS adjustments to AASB 1049 net operating balance -48 -62 -46
GFS net operating balance 811 305 313
768 787 471
684 885 1,046
44 52 57801 1,044 1,181
845 1,096 1,238
-845 -1,096 -1,238
-160 -210 -192
652 629 336
44 52 5744 52 57
-44 -52 -57
608 577 279
160 171 184
43 53 5643 53 56
-43 -53 -56
117 118 128
769 747 464
44 52 5744 52 57
-44 -52 -57
725 695 407
237

2011-12 Economic and Fiscal Outlook
AASB 1049 TO GFS CONVERGENCE DIFFERENCES (CONT.)
Net Lending
General government
2009-10
Actual$m
AASB1049 net lending/-borrowing -1,058
Plus Net operating balance convergence difference (noted above) 3
GFS net lending/-borrowing -1,055
Public non-financial corporations
AASB1049 net lending/-borrowing -2,601
Plus Net operating balance convergence difference (noted above) -609
GFS net lending/-borrowing -3,210
Total non-financial public sector
AASB1049 net lending/-borrowing -4,217
Plus Net operating balance convergence difference (noted above) -48
GFS net lending/-borrowing -4,266
Public financial corporations
AASB1049 net lending/-borrowing -2
Plus Net operating balance convergence difference (noted above) -12
GFS net lending/-borrowing -14
Total public sector
AASB1049 net lending/-borrowing -4,232
Plus Net operating balance convergence difference (noted above) -48
GFS net lending/-borrowing -4,280
2010-11 011-12 2012-13 2013-14 2014-15Estimated Budget Forward Forward Forward
Actual Estimate Estimate Estimate Estimate$m $m $m $m $m
1,2151 -2,517
-1,215 -2,517
-1,079 -419
-756 -739
-1,835 -1,157
-2,987
-62
-3,050
116
-56
59
-2,928
-62
-2,990
-1,127 -792 -565
-1,127 -792 -565
-446 708 903
-845 -1,096 -1,238
-1,291 -388 -335
-2,375 -1,128 -844
-44 -52 -57
-2,418 -1,180 -900
168 182 195
-43 -53 -56
125 129 139
-2,249 -999 -705
-44 -52 -57
-2,293 -1,051 -761
238
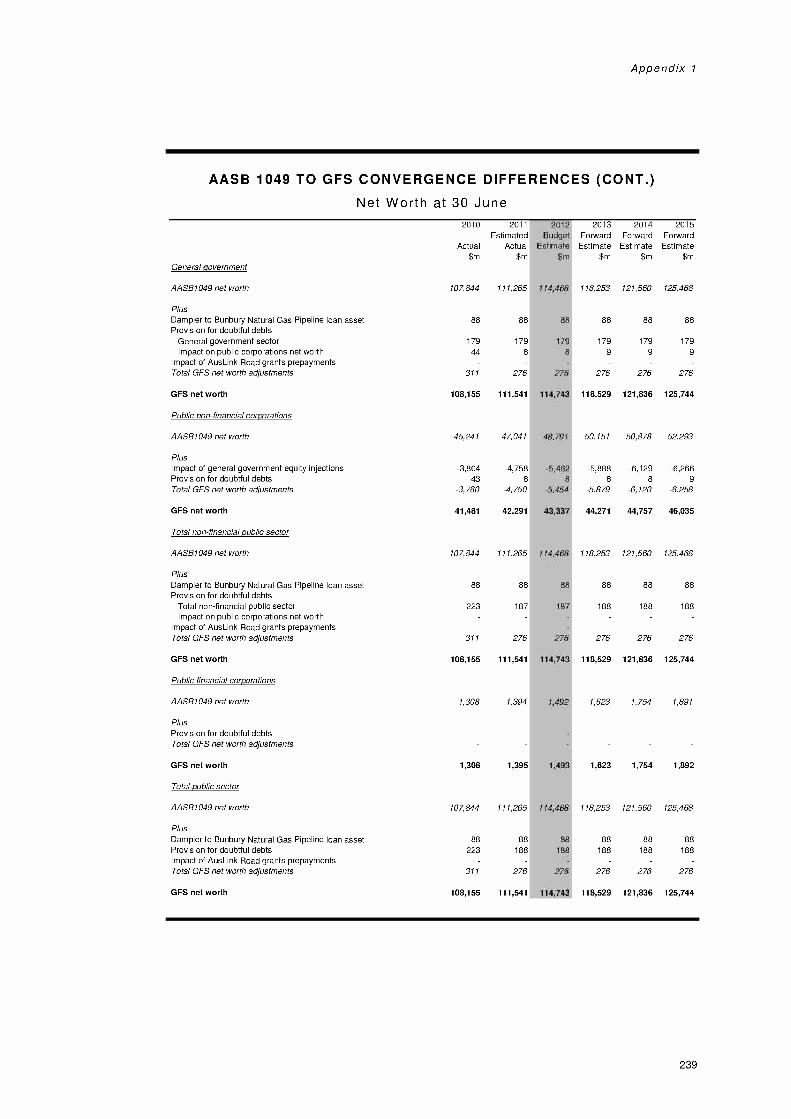
Appendix 1
AASB 1049 TO GFS CONVERGENCE DIFFERENCES (CONT.)
Net Worth at 30 June
General government
AASB1049 net worth
PlusDampier to Bunbury Natural Gas Pipeline loan assetProvision for doubtful debts
General government sectorImpact on public corporations net worth
Impact of AusLink Road grants prepaymentsTotal GFS net worth adjustments
GFS net worth
Public non-financial corporations
AASB1049 net worth
PlusImpact of general government equity injectionsProvision for doubtful debtsTotal GFS net worth adjustments
GFS net worth
Total non-financial public sector
AASB1049 net worth
PlusDampier to Bunbury Natural Gas Pipeline loan assetProvision for doubtful debts
Total non-financial public sectorImpact on public corporations net worth
Impact of AusLink Road grants prepaymentsTotal GFS net worth adjustments
GFS net worth
Public financial corporations
AASB1049 net worth
PlusProvision for doubtful debtsTotal GFS net worth adjustments
GFS net worth
Total public sector
AASB1049 net worth
PlusDampier to Bunbury Natural Gas Pipeline loan assetProvision for doubtful debtsImpact of AusLink Road grants prepaymentsTotal GFS net worth adjustments
GFS net worth
2010 2011 2012 2013 2014 2015Estimated Budget Forward Forward Forward
Actual Actual Estimate Estimate Estimate Estimate
$m $m $m $m $m $m
107844 111,265
88 88
179 179
44 8
311 276
108,155 111,541
45,241 47041
-3,804 -4,75843 8
-3,760 -4,750
41,481 42,291
107,844 111,265
88 88
223 187
311 276
108,155 111,541
1,308 1,394
4681
88
179
8
276
743
X791
5,4628
-5,454
3,337
468.
88
187
118,253 121,560 125,468
88 88 88
179 179 1799 9 9
276 276 276
118,529 121,836 125,744
50,151 50,878 52,293
-5,888 -6,129 -6,2668 8 9
-5,879 -6,120 -6,258
44,271 44,757 46,035
118,253 121,560 125,468
88 88 88
188 188 188
276 276 276
118,529 121,836 125,744
1,623 1,754 1,891
1,308 1,395 1,493 1,623 1,754 1,892
107,844 111,265 114,468 118,253 121,560 125,468
88 88 88 88 88 88223 188 188 188 188 188
311 276 276 276 276 276
108,155 111,541 6743 118,529 121,836 125,744
239

2011-12 Economic and Fiscal Outlook
AASB 1049 TO GFS CONVERGENCE DIFFERENCES (CONT.)
Cash Surplus/-Deficit
General government
2009-10
Actual
$m
2010-11Estimated
Actual
$m
2011-12Budget
Estimate$m
2012-13ForwardEstimate
$m
2013-14Forward
Estimate$m
2014-15Forward
Estimate$m
AASB1049 cash surplus/-deficit -867 -1,462 -2,283 -1,086 -641 -263
Less Acquisitions under finance leases and similar arrangements 8 1
GFS cash surplus/-deficit -875 -1,462 -2,285 -1,086 -641 -263
Public non-financial corporations
AASB1049 cash surplus/-deficit -2,212 -2,410 ,804 -1,610 -933 -784
Less Acquisitions under finance leases and similar arrangements 136 1 6
GFS cash surplus/-deficit -2,347 -2,410 -1,810 -1,610 -933 -784
Total non-financial public sector
AASB1049 cash surplus/-deficit -3,079 -3,872 -4,087 -2,695 -1,574 -1,048
Less Acquisitions under finance leases and similar arrangements 144 1 8
GFS cash surplus/-deficit -3,222 -3,873 -4,095 -2,695 -1,574 -1,048
Public financial corporations
AASB1049 cash surplus/-deficit 263 109 143 161 148 195
Less Acquisitions under finance leases and similar arrangements
GFS cash surplus/-deficit 263 109 143 161 148 195
Total public sector
AASB1049 cash surplus/-deficit -2,816 -3,763 -3,944 -2,534 -1,425 -852
Less Acquisitions under finance leases and similar arrangements 144 1 8
GFS cash surplus/-deficit -2,960 -3,764 -3,952 -2,535 -1,426 -853
240
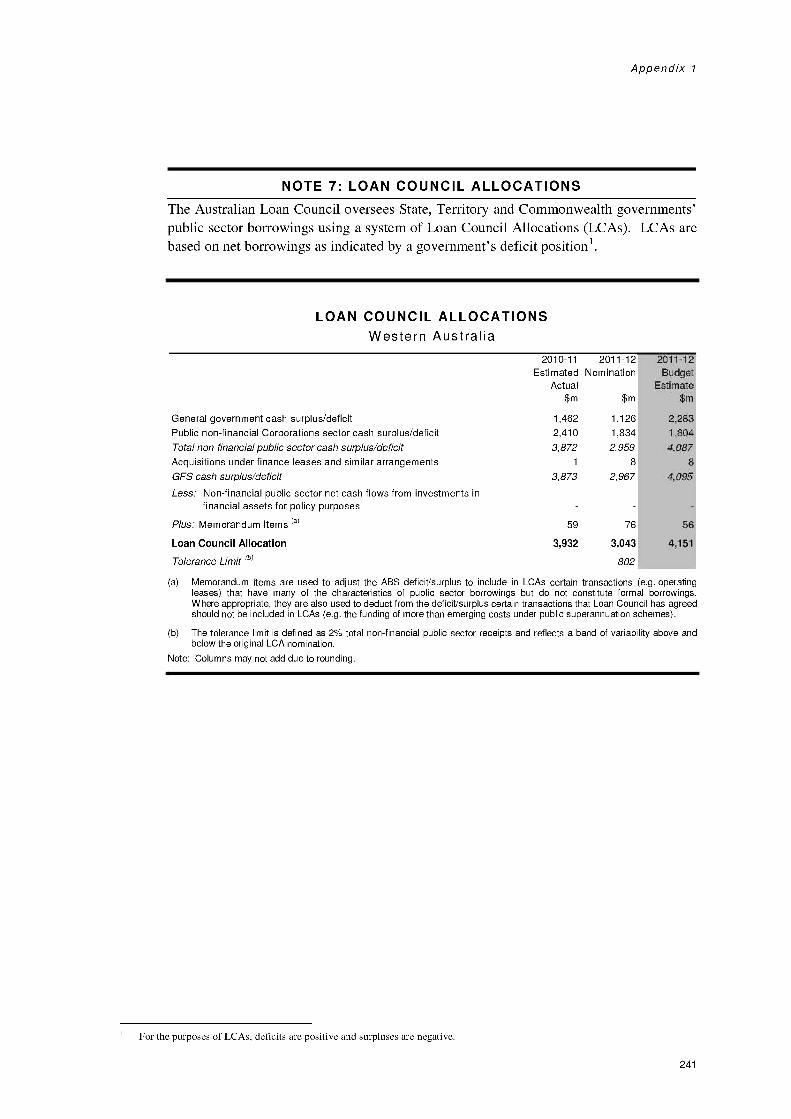
Appendix 1
NOTE 7: LOAN COUNCIL ALLOCATIONS
The Australian Loan Council oversees State, Territory and Commonwealth governments'public sector borrowings using a system of Loan Council Allocations (LCAs). LCAs arebased on net borrowings as indicated by a government's deficit positions.
LOAN COUNCIL ALLOCATIONSWestern Australia
2010-11Estimated
Actual$m
2011 -12Nomination
$m
General government cash surplus/deficit 1,462 1,126
Public non-financial Corporations sector cash surplus/deficit 2,410 1,834
Total non-financial public sector cash surplus/deficit 3,872 2,959Acquisitions under finance leases and similar arrangements 1 8
GFS cash surplus/deficit 3,873 2,967
Less: Non-financial public sector net cash flows from investments infinancial assets for policy purposes
Plus: Memorandum items (a) 59 76
Loan Council Allocation 3,932 3,043
Tolerance Limit (b) 802
2011-12Budget
Estimate$m
2,283
1,804
4,0878
4,095
(a) Memorandum items are used to adjust the ABS deficit/surplus to include in LCAs certain transactions (e.g. operatingleases) that have many of the characteristics of public sector borrowings but do not constitute formal borrowings.Where appropriate, they are also used to deduct from the deficit/surplus certain transactions that Loan Council has agreedshould not be included in LCAs (e.g. the funding of more than emerging costs under public superannuation schemes).
(b) The tolerance limit is defined as 2% total non-financial public sector receipts and reflects a band of variability above andbelow the original LCA nomination.
Note: Columns may not add due to rounding.
For the purposes of LCAs, deficits are positive and surpluses are negative.
241

2011-12 Economic and Fiscal Outlook
NOTE 8: COMPOSITION OF SECTORS
The following diagram shows the sectors within which public sector agencies areclassified by the Government Finance Statistics framework, and which are all included inthe consolidated whole-of-government.
TOTAL PUBLIC SECTOR
General Government Sector Public Non-Financial Corporations
*4---
Consolidated Account
t :
+ 4*
+
:
.
Public Financial Corporations
All public sector-controlled agencies, regardless of funding source or sector classification,have been included in these financial projections.
The agencies included within each sector are listed below.
This list differs from the portfolio list that appears in Budget Paper No. 2. The listing inthat budget paper covers only those agencies that receive appropriations and/or have anAsset Investment Program.
242

General Government
Agricultural Practices Board of Western AustraliaAgricultural Produce CommissionBotanic Gardens and Parks AuthorityBuilding and Construction Industry Training BoardCentral Institute of TechnologyChallenger Institute of TechnologyChemistry Centre (WA.)Commissioner for Children and Young PeopleCommissioner for Equal OpportunityCommissioner for Public Sector StandardsCommissioner of Main RoadsCorruption and Crime CommissionCountry High School Hostels AuthorityCurriculum CouncilC.Y. O'Connor InstituteDepartment for Child ProtectionDepartment for CommunitiesDepartment for PlanningDepartment of Agriculture and FoodDepartment of CommerceDepartment of Corrective ServicesDepartment of Culture and the ArtsDepartment of EducationDepartment of Education ServicesDepartment of Environment and ConservationDepartment of Finance(a)
Department of FisheriesDepartment of HousingDepartment of Indigenous AffairsDepartment of Local GovernmentDepartment of Mines and PetroleumDepartment of Racing, Gaming and LiquorDepartment of Regional Development and LandsDepartment of Sport and RecreationDepartment of State DevelopmentDepartment of Training and Workforce DevelopmentDepartment of TransportDepartment of the Legislative AssemblyDepartment of the Legislative CouncilDepartment of the Premier and CabinetDepartment of the Attorney GeneralDepartment of the Registrar, Western Australian
Industrial Relations CommissionDepartment of Treasury(a)
Department of WaterDisability Services CommissionDurack Institute of TechnologyEconomic Regulation AuthorityFire and Emergency Services Authority of
Western AustraliaGaming and Wagering Commission of
Western AustraliaGascoyne Development CommissionGoldfields-Esperance Development CommissionGovernor's EstablishmentGreat Southern Development Commission
Appendix 1
Great Southern Institute of TechnologyHeritage Council of Western AustraliaIndependent Market OperatorKeep Australia Beautiful Council (W.A.)Kimberley TAFEKimberley Development CommissionLaw Reform Commission of Western AustraliaLegal Aid Commission of Western AustraliaLegal Costs CommitteeLocal Health Authorities Analytical CommitteeMental Health Commission (a)
Mid-West Development CommissionMinerals and Energy Research Institute of
Western AustraliaOffice of EnergyOffice of Health ReviewOffice of the Auditor GeneralOffice of the Director of Public ProsecutionsOffice of the Environmental Protection AuthorityOffice of the Information CommissionerOffice of the Inspector of Custodial ServicesParliamentary Commissioner for Administrative
InvestigationsParliamentary Inspector of the Corruption and Crime
CommissionParliamentary Services DepartmentPeel Development CommissionPerth Theatre TrustPilbara Development CommissionPilbara TAFEPolytechnic West (a)
Professional Combat Sports CommissionProfessional Standards CouncilPublic Sector CommissionRacing Penalties Appeal Tribunal of Western AustraliaRural Business Development CorporationSalaries and Allowances TribunalScreen West (Inc.)Small Business Development CorporationSouth West Development CommissionSouth West Institute of TechnologyState Supply CommissionSwan River TrustThe Aboriginal Affairs Planning AuthorityThe Agriculture Protection Board of Western AustraliaThe Anzac Day TrustThe Board of the Art Gallery of Western AustraliaThe Burswood Park BoardThe Coal Miners' Welfare Board of Western AustraliaThe Library Board of Western AustraliaThe National Trust of Australia (W.A.)The Queen Elizabeth II Medical Centre TrustThe Western Australian MuseumTrustees of the Public Education EndowmentWA HealthWest Coast Institute of Training (a)
(a) Agency which has been either created, abolished, amalgamated or renamed since the 20 May 2010 presentation of the 2010-11 Budget.
243

2011-12 Economic and Fiscal Outlook
General Government (cont.)
Western Australian Alcohol and Drug AuthorityWestern Australian Building Management AuthorityWestern Australian Electoral CommissionWestern Australian Energy Disputes ArbitratorWestern Australian Greyhound Racing AssociationWestern Australian Health Promotion FoundationWestern Australian Institute of SportWestern Australian Land Information Authority (b)
Public Non-Financial Corporations
Albany Port Authority (b)Animal Resources AuthorityArmadale Redevelopment AuthorityBroome Port Authority (b)
Bunbury Port Authority (b)Bunbury Water Board (b)Busselton Water Board (b)
Dampier Port Authority (b)
East Perth Redevelopment AuthorityElectricity Generation Corporation (Verve Energy) (b)Electricity Networks Corporation (Western Power) (b)Electricity Retail Corporation (Synergy) (b)Esperance Port Authority (b)
Forest Products Commission (b)Fremantle Port Authority (b)
Geraldton Port Authority (b)
Public Financial Corporations
Country Housing AuthorityInsurance Commission of Western Australia (andsubsidiary State Government Insurance Corporation) (b)Keystart Housing Scheme, comprising
Keystart Bonds LtdKeystart Loans LtdKeystart Support Pty LtdKeystart Support (Subsidiary) Pty LtdKeystart Housing Scheme TrustKeystart Support Trust
RiskCoverWestern Australian Treasury Corporation (b)
Western Australian Meat Industry AuthorityWestern Australian Planning CommissionWestern Australia PoliceWestern Australian Sports Centre TrustWestern Australian Tourism CommissionWheatbelt Development CommissionWorkCover WAZoological Parks Authority
Gold Corporation and its subsidiaries (b)Housing Authority (b)
Lotteries CommissionMetropolitan Cemeteries BoardMidland Redevelopment AuthorityPerth Market Authority (b)Port Hedland Port Authority (b)
Potato Marketing Corporation of Western AustraliaPublic Transport Authority of Western Australia (b)Racing and Wagering Western AustraliaRegional Power Corporation (Horizon Power) (b)Rottnest Island AuthoritySubiaco Redevelopment AuthorityWater Corporation (b)Western Australian Coastal Shipping CommissionWestern Australian Land Authority (b)
(a) Agency which has been either created, abolished, amalgamated or renamed since the 20 May 2010 presentation of the 2010-11 Budget.
(b) Also know as a Government Trading Enterprise for the purposes of the Government's 5% efficiency dividend.
244
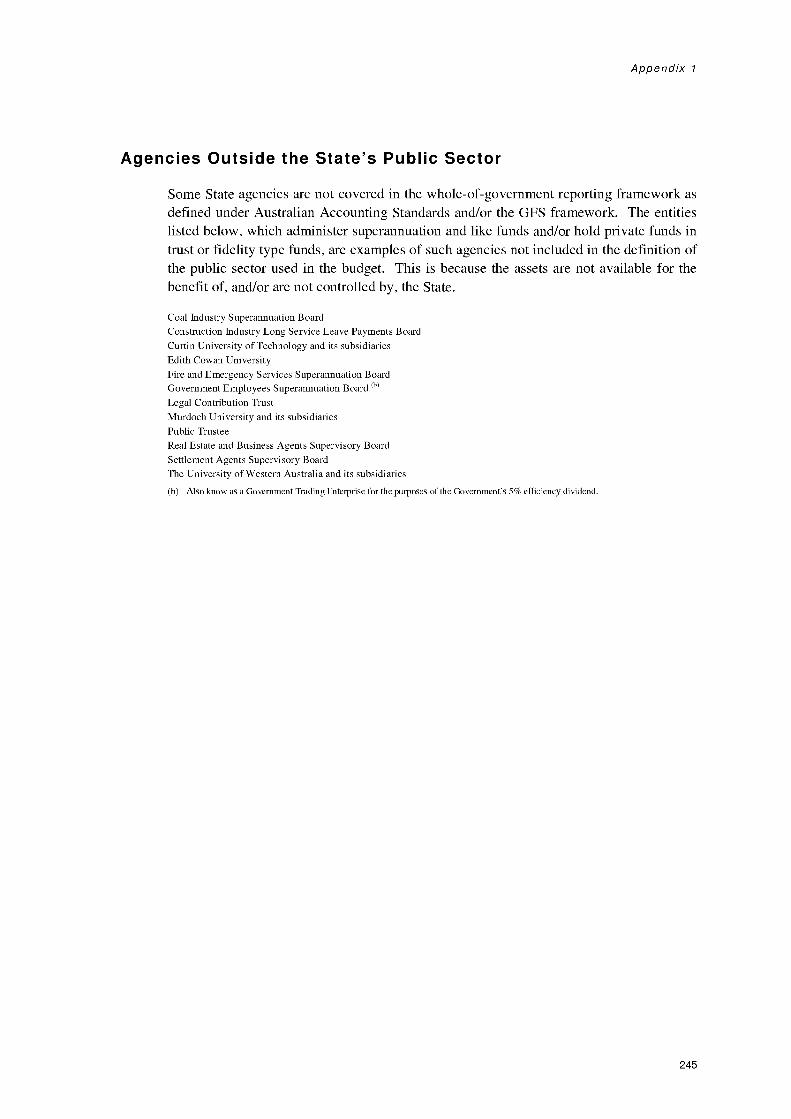
Appendix 1
Agencies Outside the State's Public Sector
Some State agencies are not covered in the whole-of-government reporting framework asdefined under Australian Accounting Standards and/or the GFS framework. The entitieslisted below, which administer superannuation and like funds and/or hold private funds intrust or fidelity type funds, are examples of such agencies not included in the definition ofthe public sector used in the budget. This is because the assets are not available for thebenefit of, and/or are not controlled by, the State.
Coal Industry Superannuation BoardConstruction Industry Long Service Leave Payments BoardCurtin University of Technology and its subsidiariesEdith Cowan UniversityFire and Emergency Services Superannuation BoardGovernment Employees Superannuation Board (b)Legal Contribution TrustMurdoch University and its subsidiariesPublic TrusteeReal Estate and Business Agents Supervisory BoardSettlement Agents Supervisory BoardThe University of Western Australia and its subsidiaries
(b) Also know as a Government Trading Enterprise for the purposes of the Government's 5% efficiency dividend.
245

2011-12 Economic and Fiscal Outlook
246
APPENDIX 2
General Government OperatingRevenue
This appendix contains general government revenue estimates prepared on an accrualbasis consistent with Australian Accounting Standards and Government Finance Statisticsframeworks.
247
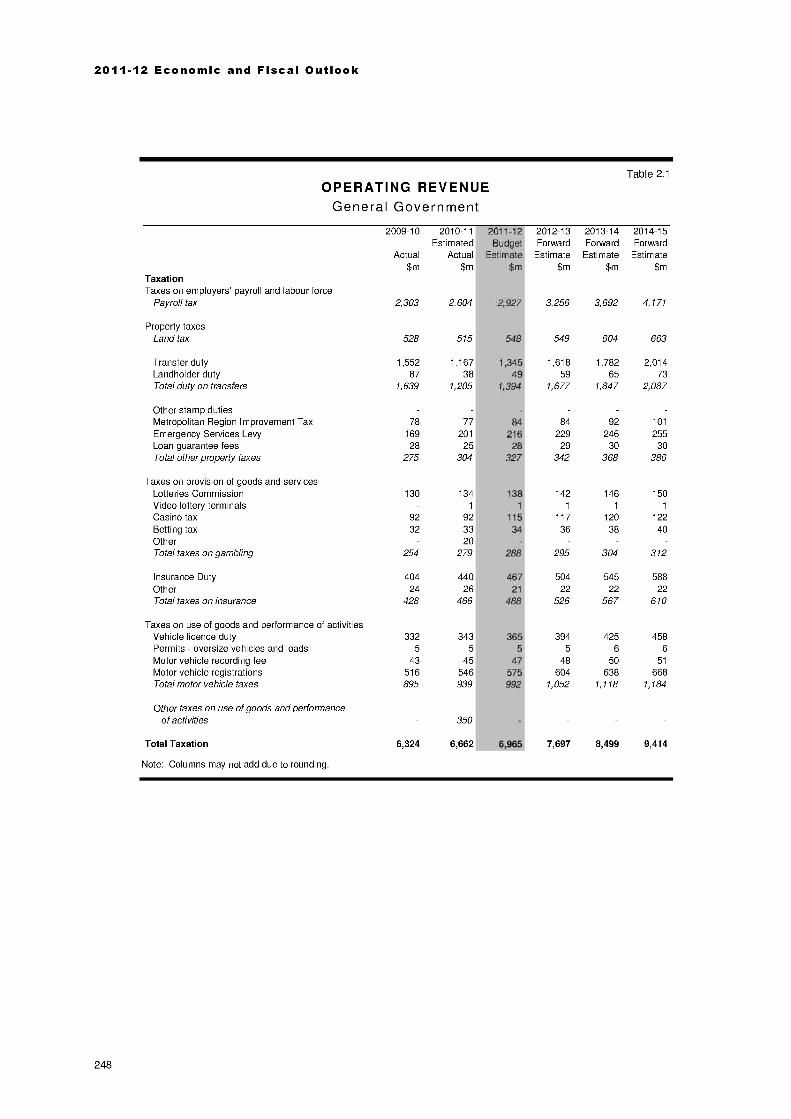
2011-12 Economic and Fiscal Outlook
Table 2.1
OPERATING REVENUEGeneral Government
TaxationTaxes on employers' payroll and labour force
2009-10
Actual$m
2010-11Estimated
Actual$m
Payroll tax 2,303 2,604
Property taxesLand tax 528 515
Transfer duty 1,552 1,167Landholder duty 87 38Total duty on transfers 1,639 1,205
Other stamp dutiesMetropolitan Region Improvement TaxEmergency Services Levy
78169
77201
Loan guarantee fees 28 25Total other property taxes 275 304
Taxes on provision of goods and servicesLotteries Commission 130 134Video lottery terminals 1
Casino tax 92 92Betting tax 32 33Other 20Total taxes on gambling 254 279
Insurance Duty 404 440Other 24 26Total taxes on insurance 428 466
Taxes on use of goods and performance of activitiesVehicle licence duty 332 343Permits oversize vehicles and loads 5 5
Motor vehicle recording fee 43 45Motor vehicle registrations 516 546Total motor vehicle taxes 895 939
Other taxes on use of goods and performanceof activities 350
Total Taxation 6,324 6,662
Note: Columns may not add due to rounding.
2011-12 2012-13 2013-14 2014-15Budget Forward Forward Forward
Estimate Estimate Estimate Estimate$m $m $m $m
548
491,394
21628
327
3,256 3,692 4,171
549 604 663
1,618 1,782 2,01459 65 73
1,677 1,847 2,087
84 92 101
229 246 25529 30 30
342 368 386
142 146 1501 1 1
117 120 12236 38 40
295 304 312
504 545 58822 22 22
526 567 610
394 425 4585 6 6
48 50 51
604 638 6681,052 1,118 1,184
7,697 8,499 9,414
248

Appendix 2
Table 2.1 (cont.)OPERATING REVENUE
General Government
Current Grants and SubsidiesGeneral Purpose Grants
GST grants 3,590 3,165 7
North West Shelf grants 897 898Compensation for Commonwealth crude oil excise
arrangements 50 49 57
2009-10 2010-11 2011-12 2012-13 2013-14 2014-15Estimated Budget Forward Forward Forward
Actual Actual Estimate Estimate Estimate Estimate
$m $m $m $m $m $m
Grants Through the StateSchools assistance non-government schools 769 770Local government financial assistance grants 136 137Local government roads 90 90First Home Owners' Boost 168 30Other
National Specific Purpose Payment Agreement GrantsNational Healthcare 1,136 1,230National Schools 329 353National Agreement for Skills and Workforce
Development 132 135National Disability Services 78 95National Affordable Housing 125 127
Nation Building and Jobs PlanSchools 70Housing 20Transport 5
Other Grants/National PartnershipsHealth 318 460Housing 23 16
Transport 3 84Other 290 394
Total Current Grants and Subsidies 8,228 8,032
Capital GrantsGrants Through the StateSchools assistance non-government schools 309 280
Nation Building and Jobs PlanSchools 651 443Housing 368 155
Transport 5
Other Grants/National PartnershipsHousing 180 96 '6Transport a 239 156 346Other 'al 226 275 403
Total Capital Grants
Note: Columns may not add due to rounding.
1,978 1,406 956
3,233 2,497 1,9971,099 1,193 1,270
61 66 70
848 928 1,012163 170 181
106 110 112
25 25 25
1,433 1,547 1,732410 449 491
143 147 152124 137 151
132 135 138
469 501 41915 15 15
66 66 52300 130 120
8,625 8,116 7,936
24 26 31
139 191 191
488 270 400171 122 99
822 609 721
249
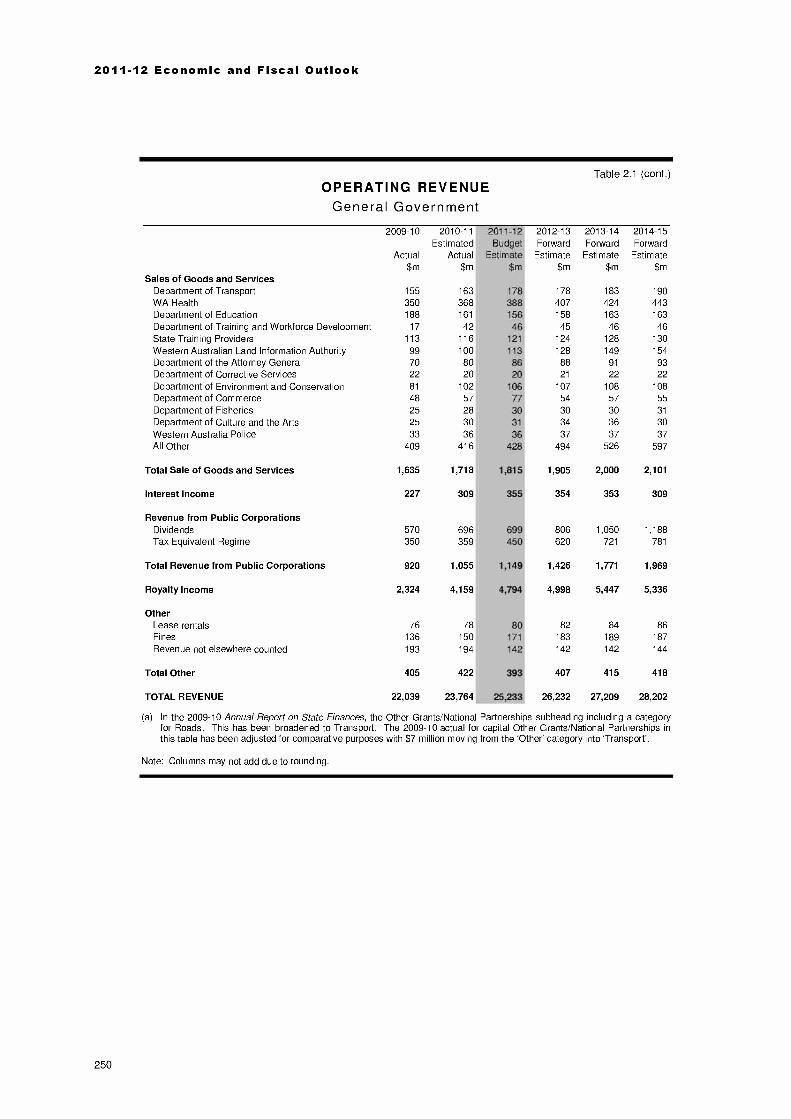
2011-12 Economic and Fiscal Outlook
Table 2.1 (cont.)OPERATING REVENUE
General Government
Sales of Goods and Services
2009-10
Actual
$m
2010-11Estimated
Actual
$m
2011-12Budget
Estimate
$m
2012-13Forward
Estimate
$m
2013-14Forward
Estimate
$m
2014-15Forward
Estimate
$m
Department of Transport 155 163 178 178 183 190WA Health 350 368 388 407 424 443Department of Education 188 161 156 158 163 163Department of Training and Workforce Development 17 42 46 45 46 46State Training Providers 113 116 121 124 128 130Western Australian Land Information Authority 99 100 113 128 149 154Department of the Attorney General 70 80 86 88 91 93Department of Corrective Services 22 20 20 21 22 22Department of Environment and Conservation 81 102 106 107 108 108Department of Commerce 48 57 77 54 57 55Department of Fisheries 25 28 30 30 30 31
Department of Culture and the Arts 25 30 1 1 34 36 30Western Australia Police 33 36 37 37 37All Other 409 416 494 526 597
Total Sale of Goods and Services 1,635 1,718 1,815 1,905 2,000 2,101
Interest Income 227 309 355 354 353 309
Revenue from Public CorporationsDividends 570 696 806 1,050 1,188Tax Equivalent Regime 350 359 S 620 721 781
Total Revenue from Public Corporations 920 1,055 1,149 1,426 1,771 1,969
Royalty Income 2,324 4,159 4,794 4,998 5,447 5,336
OtherLease rentals 76 78 82 84 86Fines 136 150 183 189 187Revenue not elsewhere counted 193 194 142 142 144
Total Other 405 422 407 415 418
TOTAL REVENUE 22,039 23,764 c3 26,232 27,209 28,202
(a) In the 2009-10 Annual Report on State Finances, the Other Grants/National Partnerships subheading including a categoryfor Roads. This has been broadened to Transport. The 2009-10 actual for capital Other Grants/National Partnerships inthis table has been adjusted for comparative purposes with $7 million moving from the Other' category into 'Transport'.
Note: Columns may not add due to rounding.
250
APPENDIX 3
2010-11 General GovernmentOperating Revenue
This appendix contains general government revenue estimates for the 2010-11 financialyear comparing the original 2010-11 Budget estimates, mid-year review revisions and thecurrent estimated outturn.
251
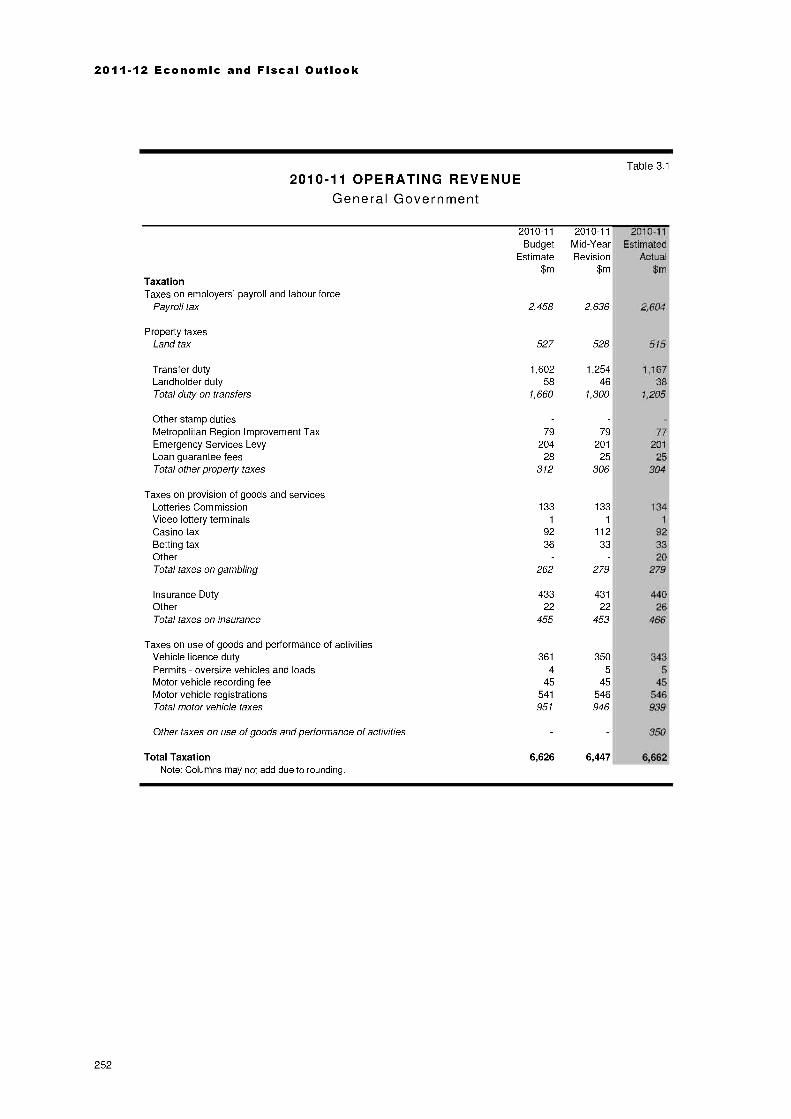
2011-12 Economic and Fiscal Outlook
Table 3.1
2010-11 OPERATING REVENUEGeneral Government
2010-11 2010-11 2010-11Budget Mid -Year Estimated
Estimate Revision Actual$m $m $m
TaxationTaxes on employers' payroll and labour force
Payroll tax 2,458 2,636
Property taxesLand tax 527 528
Transfer duty 1,602 1,254Landholder duty 58 46Total duty on transfers 1,660 1,300
Other stamp dutiesMetropolitan Region Improvement Tax 79 79Emergency Services Levy 204 201Loan guarantee fees 28 25Total other property taxes 312 306
Taxes on provision of goods and servicesLotteries Commission 133 133Video lottery terminals 1 1
Casino tax 92 112Betting tax 36 33OtherTotal taxes on gambling 262 279
Insurance Duty 433 431Other 22 22Total taxes on insurance 455 453
Taxes on use of goods and performance of activitiesVehicle licence duty 361 350Permits oversize vehicles and loads 4 5Motor vehicle recording fee 45 45Motor vehicle registrations 541 546Total motor vehicle taxes 951 946
Other taxes on use of goods and performance of activities
2,604
515
1,16738
1,205
77201
25304
1341
45546939
350
Total Taxation 6,626 6,447 6,662Note: Columns may not add due to rounding.
252
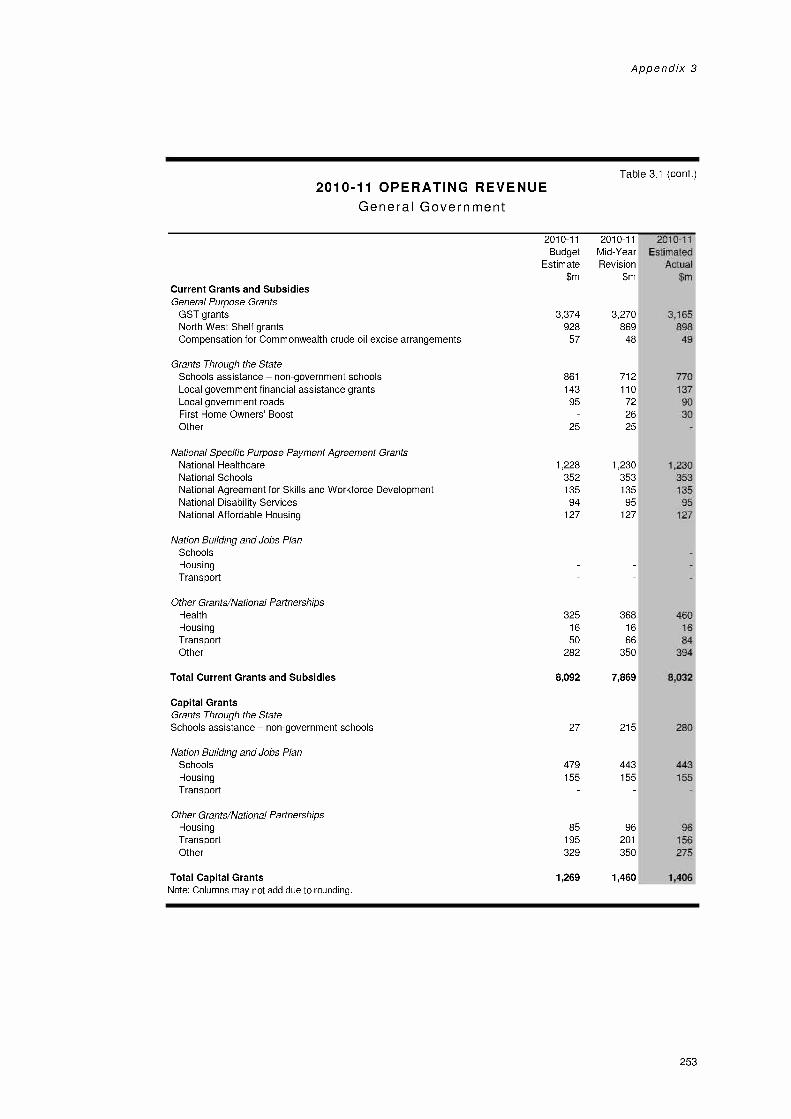
Appendix 3
Table 3.1 (cont.)2010-11 OPERATING REVENUE
General Government
Current Grants and SubsidiesGeneral Purpose Grants
2010-11Budget
Estimate$m
2010-11Mid-YearRevision
$m
GST grants 3,374 3,270North West Shelf grants 928 869Compensation for Commonwealth crude oil excise arrangements 57 48
Grants Through the StateSchools assistance non-government schools 861 712Local government financial assistance grants 143 110Local government roads 95 72First Home Owners' Boost 26Other 25 25
National Specific Purpose Payment Agreement GrantsNational Healthcare 1,228 1,230National Schools 352 353National Agreement for Skills and Workforce Development 135 135National Disability Services 94 95National Affordable Housing 127 127
Nation Building and Jobs PlanSchoolsHousingTransport
Other Grants/National PartnershipsHealth 325 368Housing 16 16Transport 50 66Other 282 350
Total Current Grants and Subsidies 8,092 7,869
Capital GrantsGrants Through the StateSchools assistance non-government schools 27 215
Nation Building and Jobs PlanSchools 479 443Housing 155 155Transport
Other Grants/National PartnershipsHousing 85 96Transport 195 201
Other 329 350
Total Capital Grants 1,269 1,460Note: Columns may not add due to rounding.
2010-11Estimated
Actual$m
165898
49
770137
9030
46016
84394
8,032
280
443155
96156275
1,406
253

2011-12 Economic and Fiscal Outlook
Table 3.1 (cont.)2010-11 OPERATING REVENUE
General Government
Sales of Goods and Services
2010-11Budget
Estimate$m
2010-11Mid-YearRevision
$m
2010-11Estimated
Actual$m
Department of Transport 163 163 163WA Health 358 368 368Department of Education 159 161 161
Department of Training and Workforce Development 43 43 42State Training Providers 116 114 116Western Australian Land Information Authority 124 110 100Department of the Attorney General 82 79 80Department of Corrective Services 21 21 20Department of Environment and Conservation 103 101 102Department of Commerce 47 55 57Department of Fisheries 28 28 28Department of Culture and the Arts 27 29 30Western Australia Police 26 28 36All Other 359 457 416
Total Sale of Goods and Services 1,656 1,756 1,718
Interest Income 253 288 309
Revenue from Public CorporationsDividends 661 720 696Tax Equivalent Regime 377 337 359
Total Revenue from Public Corporations 1,038 1,057 1,055
Royalty Income 3,271 4,045 4,159
OtherLease rentals 67 67 78Fines 179 194 150Revenue not elsewhere counted 139 187 194
Total Other 386 448 422
TOTAL REVENUE 22,591 23,373 23,764
Note: Columns may not add due to rounding.
254

APPENDIX 4
Policy Decisions AffectingSpending
This appendix outlines the agency impact of policy decisions on general governmentexpenses and total public sector infrastructure spending since the 2010-11 Mid-yearReview was released in December 2010.
255

2011-12 Economic and Fiscal Outlook
Table 4.1
POLICY DECISIONS SINCE THE 2010-11 MID-YEAR REVIEWGeneral Government Expenses
2010-11 2011-12 2012-13 2013-14 2014-15 Total$m $m $m $m $m $m
Premier and CabinetPublic Sector Commission
1.2 12.75.9
3.1
6.53.1
5.1
3.24.9
23.322.3
Governor's Establishment - (a) - (a)
State Development 0.1 6.9 1.1 1.1 0.7 9.9WA Health 3.5 64.2 76.3 98.4 101.2 343.6Western Australian Tourism Commission 0.2 20.4 20.1 19.9 17.0 77.6
Rottnest Island Authority (b) 1.0 2.0 3.0 3.0 9.0Mines and Petroleum 1.0 7.8 19.0 8.5 1.5 37.8Fisheries 2.4 6.9 7.1 2.4 2.2 20.9Regional Development and Lands 7.7 162.8 70.1 99.3 104.3 444.2Gascoyne Development Commission 2.0 1.9 3.9Goldfields-Esperance Development Commission 1.1 1.1
Great Southern Development Commission 1.2 1.1 2.3Kimberley Development Commission 0.3 1.3 1.6Mid West Development Commission 1.1 1.1
Peel Development Commission 1.0 1.1 2.1
Pilbara Development Commission -la) 1.1 1.1
South West Development Commission 0.7 1.3 2.1
Wheatbelt Development Commission 1.1 1.1
Western Australian Land Authority (b) 1.1 11.6 1.4 0.4 0.2 14.7Treasury 2.7 2.4 2.4 2.5 10.0Economic Regulation Authority 2.1 2.5 4.7Attorney General 7.2 8.4 5.9 6.0 3.9 31.4Office of the Director of Public Prosecutions 1.2 1.2 2.4Office of the Information Commissioner 0.3 0.3 0.3 0.3 1.1
Legal Aid Commission of Western Australia 2.8 2.9 3.0 3.0 11.6Education Services 1.5 1.5 1.5 1.5 6.0Finance 0.6 8.5 7.6 8.8 9.6 35.1Commerce 0.9 40.2 12.2 12.5 10.8 76.6Small Business Development Corporation 0.8 0.8Western Australia Police 8.0 24.6 5.7 5.7 1.3 45.3Fire and Emergency Services Authority 3.1 3.1
Sport and Recreation 6.0 15.0 5.0 5.0 31.0Western Australian Sports Centre Trust 0.3 0.3 0.3 0.3 1.2Racing, Gaming and Liquor 0.4 0.2 0.2 0.2 0.2 1.2Planning 0.3 1.3 0.9 0.7 0.7 4.0Western Australian Planning Commission 6.9 4.5 2.1 2.6 1.1 17.2Culture and the Arts 0.8 9.5 9.9 8.7 3.2 32.2Office of Energy -5.0 -5.0
Synergy (b) -5.9 -6.5 -12.6 -24.1 30.3 -18.8Training and Workforce Development 63.9 2.5 66.4Indigenous Affairs 4.3 3.2 2.5 2.5 12.4Main Roads 4.0 0.1 0.2 4.3Transport 0.3 9.4 2.3 0.1 0.1 12.1
Public Transport Authority (b) (a) 9.5 11.0 26.8 37.5 84.9Housing Authority (b) 33.7 9.8 43.4Child Protection 0.2 0.6 0.6 1.4Communities 0.3 9.3 10.0 11.7 13.7 45.0Local Government 5.6 5.8 0.5 0.5 12.3Agriculture and Food 1.5 9.5 11.0Corrective Services 1.4 4.4 -18.9 -12.0 -25.1Environment and Conservation 5.8 7.0 7.9 7.0 27.7Swan River Trust 0.5 0.9 1.2 0.6 3.2
Water Corporation (b) -0.2 -4.1 -29.5 -46.8 -47.2 -127.8
Note: Columns may not add due to rounding.
256

Appendix 4
Table 4.1 (cont.)POLICY DECISIONS SINCE THE 2010-11 MID-YEAR REVIEW
General Government Expenses
2010-11 2011-12 2012-13 2013-14 2014-15$m $m $m $m $m
Mental Health Commission -12.8 3.5 7.7 7.8 7.8Disability Services Commission 0.4 6.4 6.6 6.9Voluntary Severance Offers 25.4 -14.6 -14.6 -14.6General Government Savings Target -50.0 -100.0 -150.0Sustainable Funding and Contracting with the
Not-For-Profit Sector 87.8 91.6 145.6 165.9
Government Trading Enterprises Efficiency Dividend (b) -18.8 -19.1 -20.9 -21.3
TOTAL 32.8 674.5 311.4 284.9 304.8
(a) Amount less than $50,000.
(b) Represented in general government expenses as grants and subsidies from the Consolidated Account, paid through theDepartment of Treasury.
Note: Columns may not add due to rounding.
Total
$m
14.1
20.318.400.0
X90.9
Further details on the items above, together with other changes of a material nature, areavailable in Chapter 5: General Government Expenses. The following table summarisesinfrastructure spending policy decisions, discussed with other material Asset InvestmentProgram changes in Chapter 6: Asset Investment.
257

2011-12 Economic and Fiscal Outlook
POLICY DECISIONS SINCE THE 2010-11 MID-YEAR REVIEWTotal Public Sector Infrastructure Spending
Table 4.2
2010-11 2011-12 2012-13 2013-14 2014-15 Total
$m $m $m $m $m
Governor's Establishment 0.2 0.7 0.9WA Health 7.7 47.0 142.4 102.0 299.2Fisheries 7.7 3.3 0.7 11.7Regional Development and Lands 6.9 6.9 13.9Western Australian Land Authority 1.8 11.6 1.4 0.4 0.2 15.4Attorney General 3.3 3.3 3.3 10.0Education 31.0 47.0 36.0 55.0 169.0Finance 2.7 78.0 43.4 124.1
Western Australia Police 21.1 22.9 46.5 20.2 110.6Fire and Emergency Services Authority 1.6 1.6Racing, Gaming and Liquor 0.6 0.6Sport and Recreation 7.0 8.0 15.0Western Australian Sports Centre Trust 0.4 0.4Western Australian Planning Commission 0.4 48.0 162.2 135.9 22.3 368.8Independent Market Operator 4.1 3.8 -0.5 7.4Horizon Power 35.3 23.6 2.4 2.4 63.9Training and Workforce Development 9.7 22.9 22.5 22.5 77.6Western Power (including Provisions) 19.7 25.2 15.0 59.9Verve Energy 13.0 13.0 26.0Broome Port Authority 2.4 3.2 3.1 8.6Main Roads 24.9 103.4 78.2 5.0 211.5Dampier Port Authority 1.4 3.0 3.0 2.0 2.0 11.4Housing Authority 25.0 164.5 37.8 14.4 241.7Public Transport Authority 25.0 51.6 59.4 41.1 177.1
Child Protection 2.0 2.0 4.0Corrective Services -53.7 -60.0 -25.8 62.7 89.5 12.7Perth Market Authority 5.6 4.7 10.4Environment and Conservation 8.5 0.9 0.4 9.8Water Corporation -4.0 -37.4 -83.7 -20.4 -145.5
TOTAL 7.6 451.4 451.1 586.6 420.7 1,917.5
Note: Columns may not add due to rounding.
258

APPENDIX 5
The Treasurer's Advance
Under the Financial Management Act 2006 (FMA), the Treasurer is authorised, throughthe Treasurer' s Advance, to make recoverable advances for the temporary financing ofworks and services (referred to as 'recoverable advances') and to provide new orsupplementary funding during the year for extraordinary or unforeseen matters (known as`excesses and new items').
The Treasurer's Advance is limited by the FMA and all of the amounts drawn againstrecoverable advances, excesses and new items must remain within this limit The FMAauthorised a limit of $555.5 million on the Treasurer's Advance for 2010-11.
Table 5.1 shows the projected position of the Treasurer's Advance at 30 June 2011.
Table 5.1TREASURER'S ADVANCE AT 30 JUNE
2009-10Actual (a)
$m
2010-11Projection (b)
$m
AUTHORISED LIMIT 1,150.0 555.5
Total Drawn Against Treasurer's Advance authorisation 929.2 394.7Comprising:
Net recoverable advances as at 30 June 7.6 15.0Overdrawn Special Purpose Account (e) 6.8Excesses and New Items
recurrent 820.4 373.2capital 94.4 6.5
(a) The final outcome for 2009-10 detailed in the 2009-10 Annual Report on State Finances was amended for updatedinformation for the Department of Training and Workforce Development after the report was finalised. This amendmentadds $1.1 million to the actual reported at the time.
(b) Detailed disclosure of the final audited outcome for 2010-11 will be available in the 2010-11 Annual Report on StateFinances, to be released by 28 September 2011.
(c) The Treasurer gave approval to the Department of Mines and Petroleum to overdraw a Special Purpose Account (SPA).Any overdrawn SPA is taken to be an advance to be charged in the relevant financial year to the Treasurer's AdvanceAccount.
Note: Columns may not add due to rounding.
259
2011-12 Economic and Fiscal Outlook
Transfers, Excesses and New Items
A number of appropriations that were originally allocated in the 2010-11 Budget havebeen transferred to other agencies. Transfers of appropriation funds are for the provisionof an approved service that is now to be delivered by the alternative agency. Thesetransfers are authorised under section 25 of the FMA and have no impact on theTreasurer's Advance. In 2010-11, appropriation transfers include:
$7 5 million from the Department of Transport to the Department of Planning for thetransfer of corporate services;
$5 million from the Department of the Attorney General to the Department of thePremier and Cabinet for the transfer of Office of Native Title functions;
$5 million from the Public Transport Authority to the Department of Transport for thetransfer of the multi-modal planning of public transport function;
$2 6 million from the Office of the Public Sector Standards Commissioner to thePublic Sector Commission for the transfer of all functions and operations of theOffice;
$2 2 million transferred from the Disability Services Commission to WA Health tomeet the operational cost of rehabilitation and support services provided by theBrightwater Care Group;
$2 1 million from the Department of the Premier and Cabinet to the Department forCommunities for the Social Innovation Grants Program;
$0 5 million of Western Australia Police funding to the Department of IndigenousAffairs for the transfer of the Aboriginal Wardens Scheme;
$0 4 million from the Department of Planning to the Department of Transport foroffice refurbishment and sustainability initiatives;
$0 4 million transferred from the Department for Communities to the Department forChild Protection for the Ngala overnight stay service;
$0 3 million from the then Department of Treasury and Finance to the Department ofEducation for the transfer of the i-procurement function;
$0 1 million from the Legislative Council to the Parliamentary Services Departmentfor the transfer of responsibility for the Electronic Document Records ManagementSystem Project Manager function;
$0 1 million from the Department for Child Protection to the Department of theAttorney General for the Burial of Unclaimed Bodies Under the BereavementAssistance Program; and
$0 1 million from the Department of the Premier and Cabinet to the Department of theAttorney General for the transfer of the non-government legislative drafting servicesfunction.
260
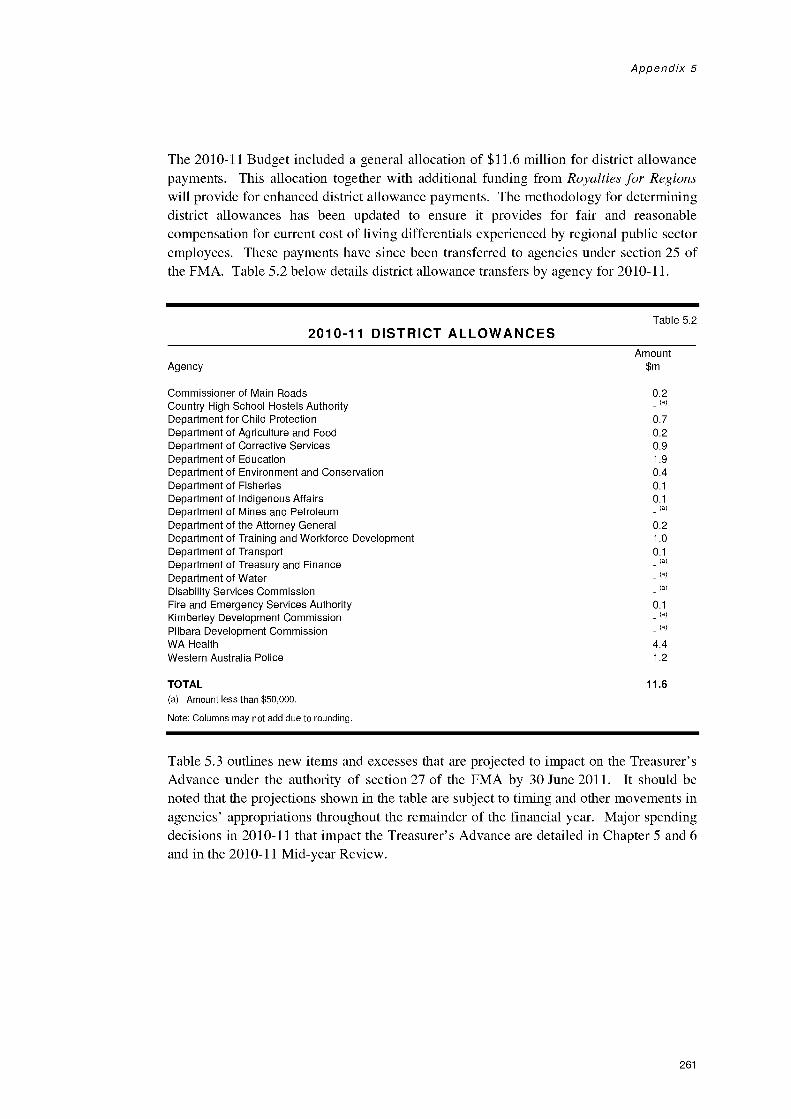
Appendix 5
The 2010-11 Budget included a general allocation of $11 6 million for district allowancepayments. This allocation together with additional funding from Royalties for Regionswill provide for enhanced district allowance payments. The methodology for determiningdistrict allowances has been updated to ensure it provides for fair and reasonablecompensation for current cost of living differentials experienced by regional public sectoremployees. These payments have since been transferred to agencies under section 25 ofthe FMA. Table 5.2 below details district allowance transfers by agency for 2010-11.
2010-11 DISTRICT ALLOWANCESTable 5.2
AmountAgency $m
Commissioner of Main Roads 0.2Country High School Hostels AuthorityDepartment for Child Protection 0.7Department of Agriculture and Food 0.2Department of Corrective Services 0.9Department of Education 1.9Department of Environment and Conservation 0.4Department of Fisheries 0.1
Department of Indigenous Affairs 0.1
Department of Mines and Petroleum (a)
Department of the Attorney General 0.2Department of Training and Workforce Development 1.0Department of Transport 0.1
Department of Treasury and Finance (a)
Department of Water (a)
Disability Services Commission (a)
Fire and Emergency Services Authority 0.1
Kimberley Development Commission (a)
Pi lbara Development Commission (a)
WA Health 4.4Western Australia Police 1.2
TOTAL(a) Amount less than $50,000.
11.6
Note: Columns may not add due to rounding.
Table 5.3 outlines new items and excesses that are projected to impact on the Treasurer'sAdvance under the authority of section 27 of the FMA by 30 June 2011. It should benoted that the projections shown in the table are subject to timing and other movements inagencies' appropriations throughout the remainder of the financial year. Major spendingdecisions in 2010-11 that impact the Treasurer's Advance are detailed in Chapter 5 and 6and in the 2010-11 Mid-year Review.
261

2011-12 Economic and Fiscal Outlook
Table 5.3TRANSFERS, EXCESSES AND NEW ITEMS
Treasurers Advance
Draw onTreasurers
New Advance toTransfers (a) Items Excesses date (b)
Item Appropriation $m $m $m $m
Recurrent Appropriations
Parliament1 Delivery of Services Legislative Council3 Delivery of Services Parliamentary Services
-0.1
0.1
0.2
Parliamentary Commissioner for Administrative Investigations4 Delivery of Services 0.9
Department of the Premier and Cabinet5 Delivery of Services 2.9 0.3
Public Sector Commission6 Delivery of Services 2.6
Office of the Public Sector Standards Commissioner8 Delivery of Services -2.6
Department of Treasury and Finance11 Delivery of Services -0.2 27.412 Electricity Retail Corporation (Synergy) 136.823 Pay-roll Tax Rebate 2.024 Pensioners Concessions Emergency Services
Levy 0.525 Pensioners Concessions Local Government and
Water Rates 2.926 Provision for District Allowances -11.629 Refund of Past Years Revenue Collections All
Other 15.1
32 State Property Emergency Services Levy 0.734 All Other Grants, Subsidies and Transfer Payments 7.8 4.1
WA Health39 Delivery of Services 2.240 Contribution to Hospital Fund 4.4 25.7
Department of Indigenous Affairs41 Delivery of Services 0.6 0.8
Department of Mines and Petroleum42 Delivery of Services (c)
Department of Fisheries44 Delivery of Services 0.1 2.0
Western Australian Electoral Commission45 Delivery of Services 1.6 0.3
Kimberley Development Commission50 Delivery of Services (e) 0.3
Pilbara Development Commission53 Delivery of Services (C)
Western Australian Land Information Authority56 Delivery of Services 7.7
Department of Education57 Delivery of Services 2.2 79.0
Department of Education Services58 Delivery of Services 0.459 Administered Grants, Subsidies and Other Transfer
Payments 0.3
Note: Columns may not add due to rounding.
262

Appendix 5
Table 5.3 (cont.)TRANSFERS, EXCESSES AND NEW ITEMS
Treasurers AdvanceDraw on
TreasurersNew Advance to
Transfers (a) Items Excesses date (b)
Item Appropriation $m $m $m $m
Country High School Hostels Authority61 Delivery of Services
Department of Transport
(c)
63 Delivery of Services -2.4 1.0
Commissioner of Main Roads65 Delivery of Services 0.2
Public Transport Authority of Western Australia66 Delivery of Services -5.0
Disability Services Commission67 Delivery of Services -2.2 0.4
Western Australia Police68 Delivery of Services 0.7 1.2
Fire and Emergency Services Authority of Western Australia69 Delivery of Services 0.1
Department of Sport and Recreation70 Delivery of Services 4.0
Department of Racing, Gaming and Liquor73 Delivery of services 0.574 Administered Grants, Subsidies and Other
Transfer Payments 20.2
Department of Planning75 Delivery of Services 7.5
Department of Culture and the Arts78 Art Gallery of Western Australia 0.8 (c)
80 Perth Theatre Trust 1.981 Western Australian Museum 3.0
Department of Training and Workforce Development83 Delivery of Services 1.0
Department of the Attorney General84 Delivery of Services -4.7 13.4
Equal Opportunity Commission86 Delivery of Services 0.2
Department of Corrective Services91 Delivery of Services 1.0 8.8
Department for Child Protection93 Delivery of Services 1.0 0.4
Department for Communities94 Delivery of Services 1.6
Department of Water96 Delivery of Services97 Administered Grants, Subsidies and Other
Transfer Payments
Department of Agriculture and Food103 Delivery of Services 0.2
Rural Business Development Corporation105 Delivery of Services 4.5 4.5
Department of Environment and Conservation106 Delivery of Services 0.4
(c)
(c)
Note: Columns may not add due to rounding.
263

2011-12 Economic and Fiscal Outlook
Table 5.3 (cont.)
TRANSFERS, EXCESSES AND NEW ITEMSTreasurer's Advance
Draw onTreasurer's
New Advance toTransfers (a) Items Excesses date (b)
Item Appropriation $m $m $m $m
Office of the Environmental Protection Authority108 Delivery of Services
Total Recurrent
Capital Appropriations
Department of Treasury and Finance
0.3
373.2 8.9
118 Capital Contribution 2.7123 Forest Products Commission 2.9
Department of Transport138 Capital Contribution 0.4
Department of Planning145 Capital Contribution -0.4
The National Trust of Australia (WA.)158 Capital Contribution 1.0 0.6
Total Capital 6.5 0.6
TOTAL 379.7 9.4
(a) Authorised under section 25 of the FMA.
(b) Budget cut-off date, 20 April 2011.
(c) Amount less than $50,000.
Note: Columns may not add due to rounding.
264

APPENDIX 6
State Government SocialConcessions ExpenditureStatement
Overview
The State Government provides social concessions in the form of rebates, discounts andwaivers to improve the affordability of services and the quality of life for eligibleindividuals and families Eligibility is based on income, age, service to country orcommunity and/or special needs or disadvantage.
In many cases, eligibility for a concession is evidenced by possession of a social securitycard issued by the Commonwealth, or other cards issued by the State Government.A synopsis of these cards is provided below.
The information in this Statement is mainly compiled from survey forms (developed withthe assistance of the Australian Bureau of Statistics) that have been returned to theDepartment of Treasury by 31 agencies that provide social concessions. It should benoted that the following information is not a definitive guide to all available concessionsprovided by State agencies, nor their associated eligibility criteria.
In 2009-10, the State provided social concessions with an estimated value of$610.4 million across a range of service areas, up from $549.3 million in 2008-09.The cost of concessions to the State in 2009-10 was partly offset by a $20 2 millioncontribution from the Commonwealth, in respect of certain concessions for pensionersand Seniors Card holders.
265
2011-12 Economic and Fiscal Outlook
The method of estimating the value of concessions varies. For example, in some cases theestimates reflect the amount of a good or service consumed at the concessional price orfare, and is the difference between the concession and the otherwise applicable price orfare. In others, such as those involving a fixed annual charge, the estimates reflect therebate or subsidy paid.
Eligibility Criteria for Concession Cards
Pensioner Concession Card
The Commonwealth issues a Pensioner Concession Card (PCC) to Australian residentsreceiving pensions, carer payments, parenting payments (single), Newstart Allowance orYouth Allowance (as a job seeker). In addition, those aged over 60 who have receivedcertain payments continuously for at least nine months are eligible for the PCC.
Eligibility for these long-term benefits is generally subject to a means test, based on therecipient's income and the value of their assets.
Health Care Card
The Commonwealth issues the Health Care Card (HCC) to Australian residents receivingcertain qualifying payments such as the Family Tax Benefit Part A (maximum rate),Newstart Allowance or Mobility Allowance. The HCC may also be issued to those whocare for foster children or receive Carer Allowances (for the child in care).
Eligibility for the HCC is generally subject to a means test, based on the recipient'sincome and the value of their assets.
Commonwealth Seniors Health Card
The Commonwealth issues the Commonwealth Seniors Health Card (CSHC) toself-funded retirees, Australian residents living in Australia for at least 104 weeks andsenior Australians who are of Age Pension age but do not qualify for the Age Pension.
The CSHC is subject to annual income tests.
WA Seniors Card
The State government issues the WA Seniors Card (WASC) to permanent residents whoare over 60 years of age and work less than 20 hours per week. From 1 July 2011, seniorswho work up to 25 hours per week (averaged over a 12 month period) and seniors onretirement visas will also be eligible to apply. Other than these criteria, no furtherconditions of eligibility apply.
State Concession Card
The Department for Child Protection issues the State Concession Card (SCC) to specificVeterans' Affairs pensioners who are not eligible for a Commonwealth PCC.
266
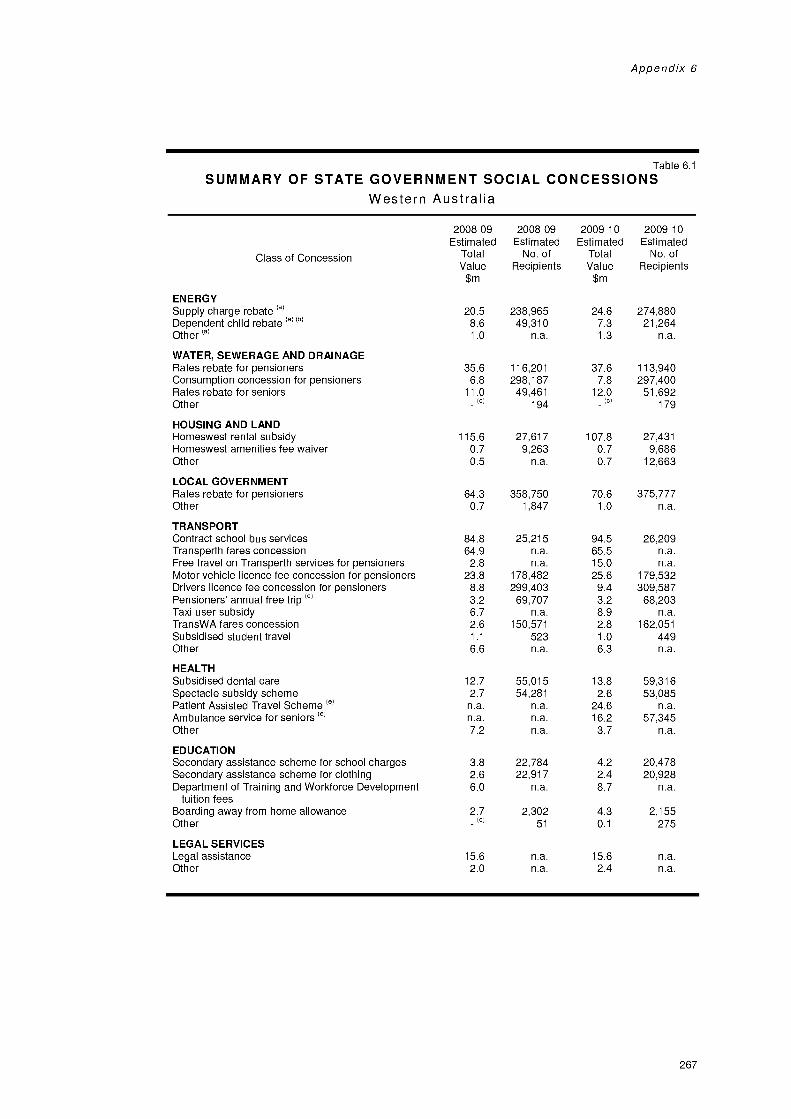
Appendix 6
Table 6.1
SUMMARY OF STATE GOVERNMENT SOCIAL CONCESSIONSWestern Australia
Class of Concession
ENERGY
2008-09Estimated
TotalValue$m
2008-09Estimated
No. ofRecipients
2009-10Estimated
TotalValue
$m
2009-10Estimated
No. ofRecipients
Supply charge rebate (a) 20.5 238,965 24.6 274,880Dependent child rebate (a) (b) 8.6 49,310 7.3 21,264Other (a) 1.0 n.a. 1.3 n.a.
WATER, SEWERAGE AND DRAINAGERates rebate for pensioners 35.6 116,201 37.6 113,940Consumption concession for pensioners 6.8 298,187 7.8 297,400Rates rebate for seniors 11.0 49,461 12.0 51,692Other (C) 194 (C) 179
HOUSING AND LANDHomeswest rental subsidy 115.6 27,617 107.8 27,431Homeswest amenities fee waiver 0.7 9,263 0.7 9,686Other 0.5 n.a. 0.7 12,663
LOCAL GOVERNMENTRates rebate for pensioners 64.3 358,750 70.6 375,777Other 0.7 1,847 1.0 n.a.
TRANSPORTContract school bus services 84.8 25,215 94.5 26,209Transperth fares concession 64.9 n.a. 65.5 n.a.Free travel on Transperth services for pensioners 2.8 n.a. 15.0 n.a.Motor vehicle licence fee concession for pensioners 23.8 178,482 25.6 179,532Drivers licence fee concession for pensioners 8.8 299,403 9.4 309,587Pensioners' annual free trip (a) 3.2 69,707 3.2 68,203Taxi user subsidy 6.7 n.a. 8.9 n.a.TransWA fares concession 2.6 150,571 2.8 162,051Subsidised student travel 1.1 523 1.0 449Other 6.6 n.a. 6.3 n.a.
HEALTHSubsidised dental care 12.7 55,015 13.8 59,316Spectacle subsidy scheme 2.7 54,281 2.6 53,085Patient Assisted Travel Scheme (a) n.a. n.a. 24.6 n.a.Ambulance service for seniors (a) n.a. n.a. 16.2 57,345Other 7.2 n.a. 3.7 n.a.
EDUCATIONSecondary assistance scheme for school charges 3.8 22,784 4.2 20,478Secondary assistance scheme for clothing 2.6 22,917 2.4 20,928Department of Training and Workforce Development
tuition fees6.0 n.a. 8.7 n.a.
Boarding away from home allowance 2.7 2,302 4.3 2,155Other (C) 51 0.1 275
LEGAL SERVICESLegal assistance 15.6 n.a. 15.6 n.a.Other 2.0 n.a. 2.4 n.a.
267
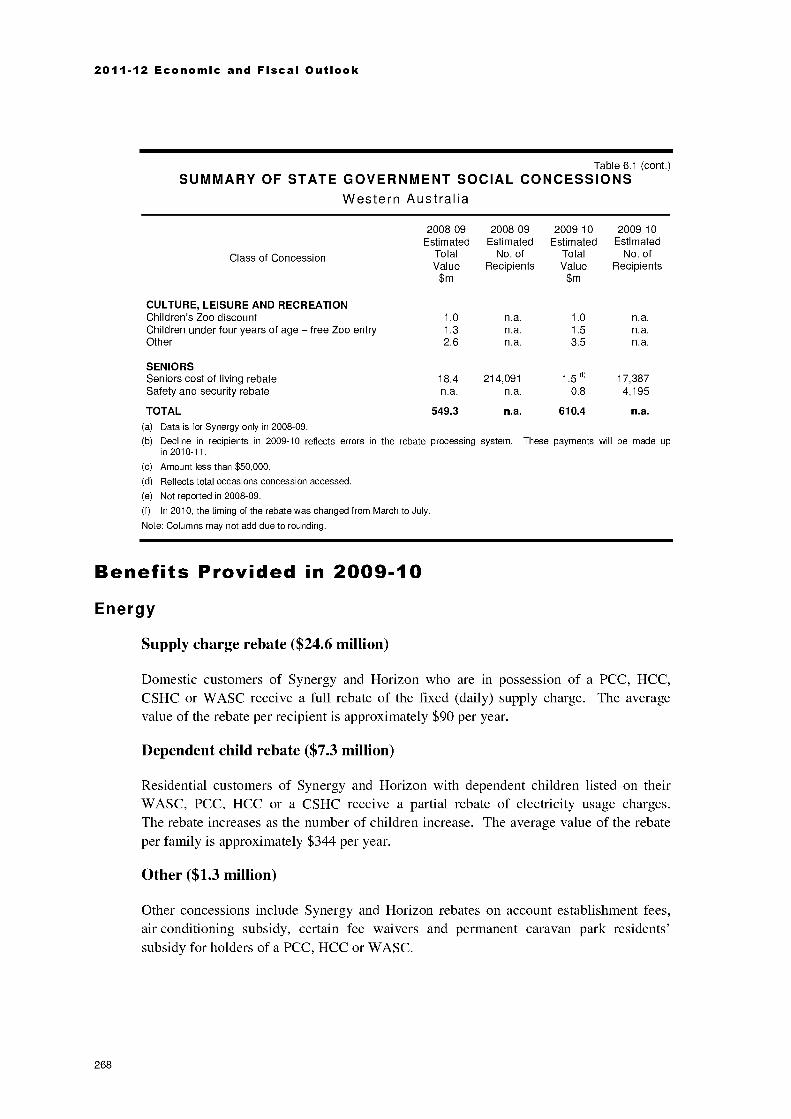
2011-12 Economic and Fiscal Outlook
Table 6.1 (cont.)
SUMMARY OF STATE GOVERNMENT SOCIAL CONCESSIONSWestern Australia
Class of Concession
CULTURE, LEISURE AND RECREATION
2008-09Estimated
TotalValue$m
2008-09Estimated
No. ofRecipients
2009-10Estimated
TotalValue
$m
2009-10Estimated
No. ofRecipients
Children's Zoo discount 1.0 n.a. 1.0 n.a.Children under four years of age free Zoo entry 1.3 n.a. 1.5 n.a.Other 2.6 n.a. 3.5 n.a.
SENIORSSeniors cost of living rebate 18.4 214,091 1.5 (" 17,387Safety and security rebate n.a. n.a. 0.8 4,195
TOTAL 549.3 n.a. 610.4 n.a.
(a) Data is for Synergy only in 2008-09.
(b) Decline in recipients in 2009-10 reflects errors in the rebate processing system. These payments will be made upin 2010-11.
(c) Amount less than $50,000.
(d) Reflects total occasions concession accessed.
(e) Not reported in 2008-09.
(f) In 2010, the timing of the rebate was changed from March to July.
Note: Columns may not add due to rounding.
Benefits Provided in 2009-10Energy
Supply charge rebate ($24.6 million)
Domestic customers of Synergy and Horizon who are in possession of a PCC, HCC,CSHC or WASC receive a full rebate of the fixed (daily) supply charge. The averagevalue of the rebate per recipient is approximately $90 per year.
Dependent child rebate ($7.3 million)
Residential customers of Synergy and Horizon with dependent children listed on theirWASC, PCC, HCC or a CSHC receive a partial rebate of electricity usage charges.The rebate increases as the number of children increase. The average value of the rebateper family is approximately $344 per year.
Other ($1.3 million)
Other concessions include Synergy and Horizon rebates on account establishment fees,air conditioning subsidy, certain fee waivers and permanent caravan park residents'subsidy for holders of a PCC, HCC or WASC.
268
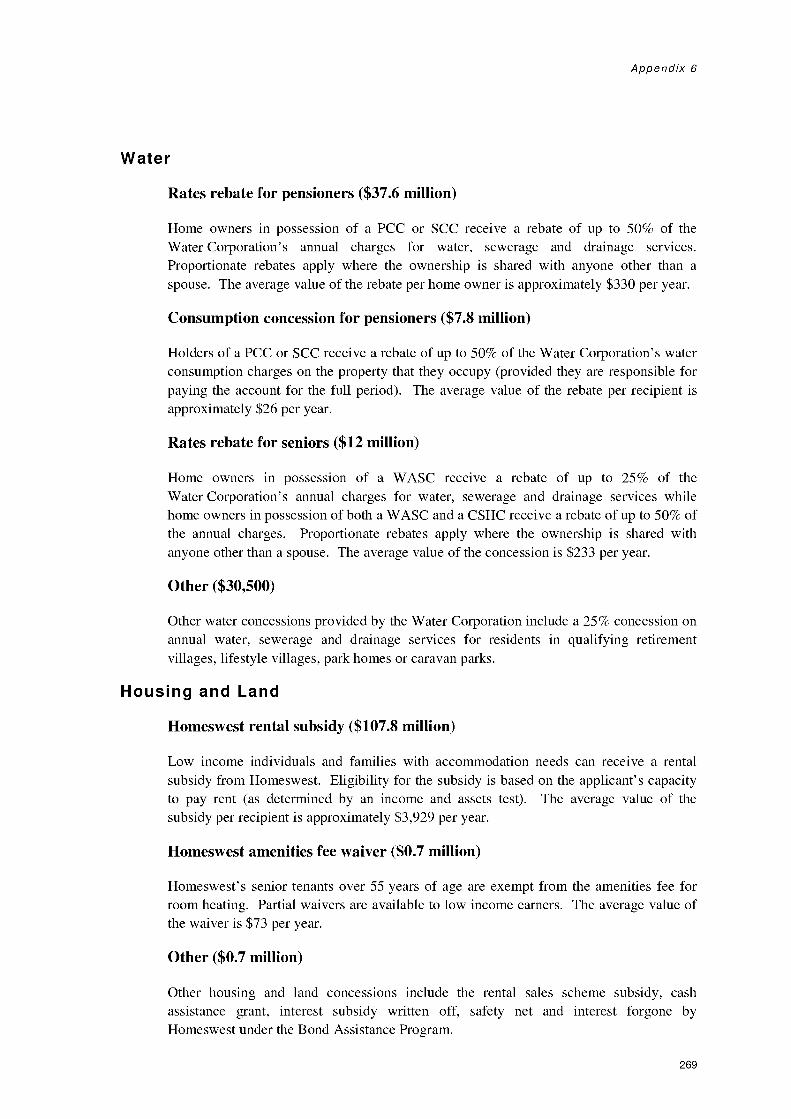
Appendix 6
Water
Rates rebate for pensioners ($37.6 million)
Home owners in possession of a PCC or SCC receive a rebate of up to 50% of theWater Corporation's annual charges for water, sewerage and drainage services.Proportionate rebates apply where the ownership is shared with anyone other than aspouse. The average value of the rebate per home owner is approximately $330 per year.
Consumption concession for pensioners ($7.8 million)
Holders of a PCC or SCC receive a rebate of up to 50% of the Water Corporation's waterconsumption charges on the property that they occupy (provided they are responsible forpaying the account for the full period). The average value of the rebate per recipient isapproximately $26 per year.
Rates rebate for seniors ($12 million)
Home owners in possession of a WASC receive a rebate of up to 25% of theWater Corporation's annual charges for water, sewerage and drainage services whilehome owners in possession of both a WASC and a CSHC receive a rebate of up to 50% ofthe annual charges. Proportionate rebates apply where the ownership is shared withanyone other than a spouse. The average value of the concession is $233 per year.
Other ($30,500)
Other water concessions provided by the Water Corporation include a 25% concession onannual water, sewerage and drainage services for residents in qualifying retirementvillages, lifestyle villages, park homes or caravan parks.
Housing and Land
Homeswest rental subsidy ($107.8 million)
Low income individuals and families with accommodation needs can receive a rentalsubsidy from Homeswest. Eligibility for the subsidy is based on the applicant's capacityto pay rent (as determined by an income and assets test). The average value of thesubsidy per recipient is approximately $3,929 per year.
Homeswest amenities fee waiver ($0.7 million)
Homeswest's senior tenants over 55 years of age are exempt from the amenities fee forroom heating. Partial waivers are available to low income earners. The average value ofthe waiver is $73 per year.
Other ($0.7 million)
Other housing and land concessions include the rental sales scheme subsidy, cashassistance grant, interest subsidy written off, safety net and interest forgone byHomeswest under the Bond Assistance Program.
269
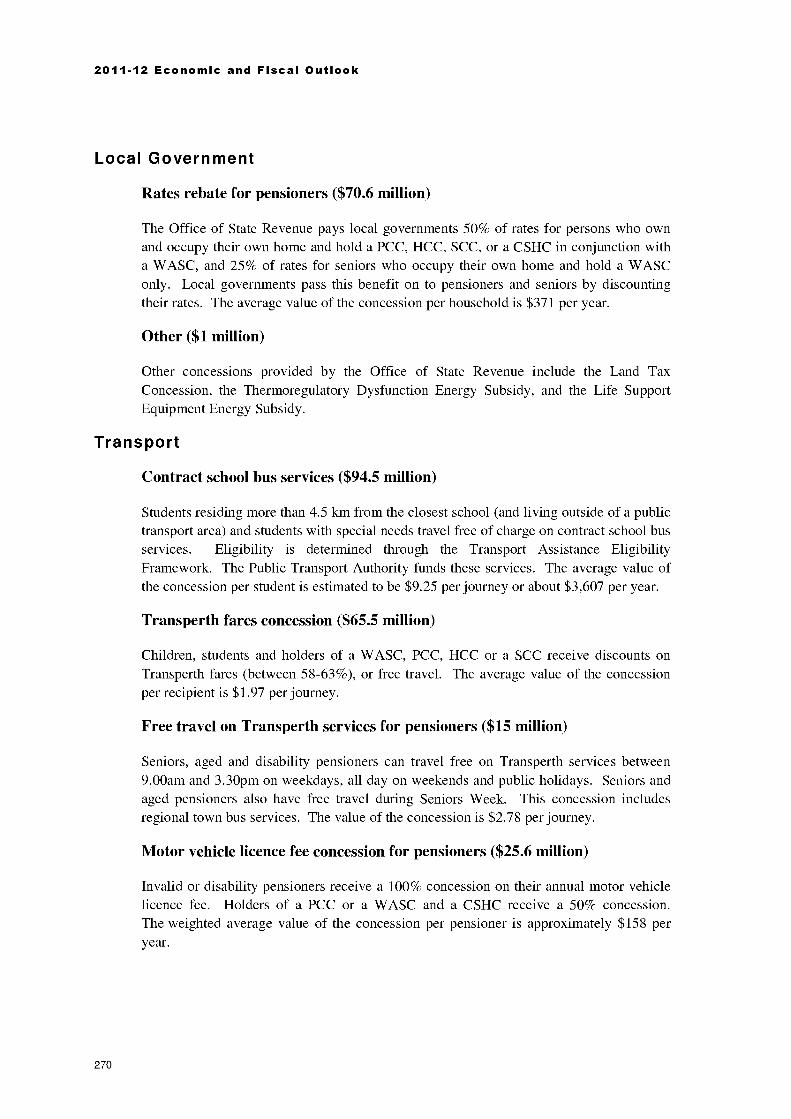
2011-12 Economic and Fiscal Outlook
Local Government
Rates rebate for pensioners ($70.6 million)
The Office of State Revenue pays local governments 50% of rates for persons who ownand occupy their own home and hold a PCC, HCC, SCC, or a CSHC in conjunction witha WASC, and 25% of rates for seniors who occupy their own home and hold a WASConly. Local governments pass this benefit on to pensioners and seniors by discountingtheir rates. The average value of the concession per household is $371 per year.
Other ($1 million)
Other concessions provided by the Office of State Revenue include the Land TaxConcession, the Thermoregulatory Dysfunction Energy Subsidy, and the Life SupportEquipment Energy Subsidy.
Transport
Contract school bus services ($94.5 million)
Students residing more than 4.5 km from the closest school (and living outside of a publictransport area) and students with special needs travel free of charge on contract school busservices. Eligibility is determined through the Transport Assistance EligibilityFramework. The Public Transport Authority funds these services. The average value ofthe concession per student is estimated to be $9.25 per journey or about $3,607 per year.
Transperth fares concession ($65.5 million)
Children, students and holders of a WASC, PCC, HCC or a SCC receive discounts onTransperth fares (between 58-63%), or free travel. The average value of the concessionper recipient is $1.97 per journey.
Free travel on Transperth services for pensioners ($15 million)
Seniors, aged and disability pensioners can travel free on Transperth services between9.00am and 3.30pm on weekdays, all day on weekends and public holidays. Seniors andaged pensioners also have free travel during Seniors Week. This concession includesregional town bus services. The value of the concession is $2.78 per journey.
Motor vehicle licence fee concession for pensioners ($25.6 million)
Invalid or disability pensioners receive a 100% concession on their annual motor vehiclelicence fee. Holders of a PCC or a WASC and a CSHC receive a 50% concession.The weighted average value of the concession per pensioner is approximately $158 peryear.
270
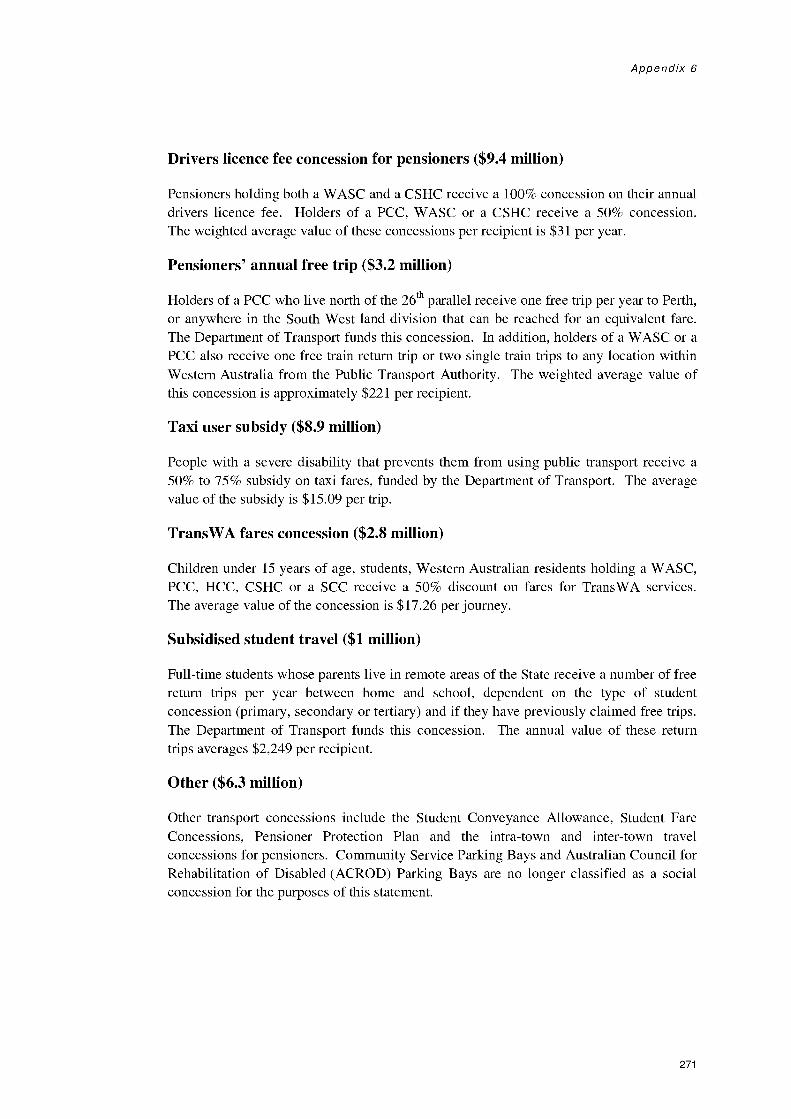
Appendix 6
Drivers licence fee concession for pensioners ($9.4 million)
Pensioners holding both a WASC and a CSHC receive a 100% concession on their annualdrivers licence fee. Holders of a PCC, WASC or a CSHC receive a 50% concession.The weighted average value of these concessions per recipient is $31 per year.
Pensioners' annual free trip ($3.2 million)
Holders of a PCC who live north of the 26th parallel receive one free trip per year to Perth,or anywhere in the South West land division that can be reached for an equivalent fare.The Department of Transport funds this concession. In addition, holders of a WASC or aPCC also receive one free train return trip or two single train trips to any location withinWestern Australia from the Public Transport Authority. The weighted average value ofthis concession is approximately $221 per recipient.
Taxi user subsidy ($8.9 million)
People with a severe disability that prevents them from using public transport receive a50% to 75% subsidy on taxi fares, funded by the Department of Transport. The averagevalue of the subsidy is $15.09 per trip.
TransWA fares concession ($2.8 million)
Children under 15 years of age, students, Western Australian residents holding a WASC,PCC, HCC, CSHC or a SCC receive a 50% discount on fares for TransWA services.The average value of the concession is $17.26 per journey.
Subsidised student travel ($1 million)
Full-time students whose parents live in remote areas of the State receive a number of freereturn trips per year between home and school, dependent on the type of studentconcession (primary, secondary or tertiary) and if they have previously claimed free trips.The Department of Transport funds this concession. The annual value of these returntrips averages $2,249 per recipient.
Other ($6.3 million)
Other transport concessions include the Student Conveyance Allowance, Student FareConcessions, Pensioner Protection Plan and the intra-town and inter-town travelconcessions for pensioners. Community Service Parking Bays and Australian Council forRehabilitation of Disabled (ACROD) Parking Bays are no longer classified as a socialconcession for the purposes of this statement.
271
2011-12 Economic and Fiscal Outlook
Health
Subsidised dental care ($13.8 million)
Most holders of a PCC, HCC or SCC and persons who receive a full/near full pension orallowance from Centre link receive a discount on dental work provided by Governmentdental clinics. The discount is generally between 50% and 75% of standard fees. Theaverage value of the concession is $171 per treatment based on 80,693 treatments during2009-10.
Spectacle subsidy scheme ($2.6 million)
Age pensioners, disability pensioners and holders of a WASC receive a subsidy from theDepartment of Health to acquire spectacles or contact lenses. The average value of thesubsidy per recipient is $49.50.
Patient Assisted Travel Scheme ($24.6 million)
Permanent country residents in the WA Country Health Service region that need to travelmore than 100 km to access the nearest eligible medical specialist service (includingTelehealth) can apply for a subsidy to assist with the cost of travel and accommodation.The average value of the concession is $389 per journey based on a total of63,159 subsidised journeys in 2009-10.
Ambulance Service for Seniors ($16.2 million)
Aged pensioners receive primary ambulance services free of charge and all seniors overthe age of 65 receive a 50% rebate on the cost of both emergency and non-urgentambulance transport. The average value of the concession is $283 based on57,345 applications.
Other ($3.7 million)
Other health concessions include the country patients' dental subsidy scheme, themetropolitan patients' dental subsidy scheme, and home haemodialysis.
Education
Secondary assistance scheme for school charges ($4.2 million)
The Department of Education provides assistance to low income families with secondaryschool children to meet school charges, which average $206 per recipient. Recipientsmust hold a family PCC or HCC or be a sole parent or carer.
Secondary assistance scheme for clothing ($2.4 million)
The Department of Education provides assistance of $115 per annum to low incomefamilies with secondary school children to meet clothing costs associated with schooling.Recipients must hold a family PCC or HCC.
272
Appendix 6
Department of Training and Workforce Development tuition fees($8.7 million)
Holders of a PCC, HCC or persons who receive AUSTUDY, ABSTUDY or YouthAllowance subsidies, prisoners and persons between 15 and 17 years who will not reach18 years in the enrolling calendar year, pay reduced tuition fees for Vocational Educationand Training (VET) courses offered by various colleges. The average value of theconcession is $0.81 per hour of tuition for VET courses. Holders of a PCC or WASCreceive concessions of 25% of the tuition fees for non-VET courses. The average valueof the concession is $42.31 per recipient for non-VET.
Boarding away from home allowance ($4.3 million)
Families with geographically isolated students received up to $2,000 as an annualconcession from the Department of Education to help meet costs associated with boardingaway from home.
Other ($89,000)
Other education concessions include the Secondary Assistance Scheme ABSTUDYSupplement Allowance and the City Beach Residential College GATE Payment.
Legal Services
Legal assistance ($15.6 million)
Concessions include the provision of subsidised legal assistance by Legal AidWestern Australia to low income persons. Eligibility is means tested, and the value of theconcession varies with the type of legal services provided.
Other ($2.4 million)
Other legal service concessions include a reduction or waiver of court fees in the StateAdministrative Tribunal, Supreme Court, District Court, Family Court and theMagistrates Court for those experiencing financial hardship or in the interests of justice.Legal Aid also provides minor assistance, legal advice and a duty lawyer to thecommunity.
Culture, Leisure and Recreation
Children's Zoo discount ($1 million)
Children between four and 14 years of age receive a discount on the entry fee for thePerth Zoo. The value of the discount is $10 per child for each visit.
Children under four years of age free Zoo entry ($1.5 million)
Children under four years of age receive free entry to the Perth Zoo. The value of thediscount is $20 per child for each visit.
273
2011-12 Economic and Fiscal Outlook
Other ($3.5 million)
Concessional fees apply to students and various rebate card holders in a range of culture,leisure and recreation areas, including admission to National Parks, exhibitions at theArt Gallery and Western Australian Maritime Museum, performances arranged by thePerth Theatre Trust, and activities administered by the Rottnest Island Authority.
Seniors
Seniors cost of living rebate ($1.5 million)
Holders of the WASC are eligible to apply for this concession. In 2009-10, single WASCholders were eligible for a rebate of $104.80 and couples (where both hold a WASC) for arebate of $157.22. These amounts are being increased to $150 and $225 respectivelyfrom 1 July 2011. In 2010, the timing of the payment of the rebate was changed fromMarch to July. As a result, payments made in 2009-10 reflect back payments to Seniorsrelating to the previous financial year. The rebate is indexed annually by the PerthConsumer Price Index.
Safety and Security Rebate ($0.8 million)
Holders of the WASC can claim up to $200 per household towards buying and/orinstalling eligible security devices whether in their own or a rental home. A further$200 per household is available for the purchase and installation of electrical and firesafety items. The scheme started on 1 July 2009 and ends on 30 June 2012.
274

APPENDIX 7
Asset Investment ProgramSummary of Expenditure andSource of Funds
This appendix summarises asset investment expenditure by agency within portfoliogroups, and the sources of funds for the aggregate Asset Investment Program by year.
275
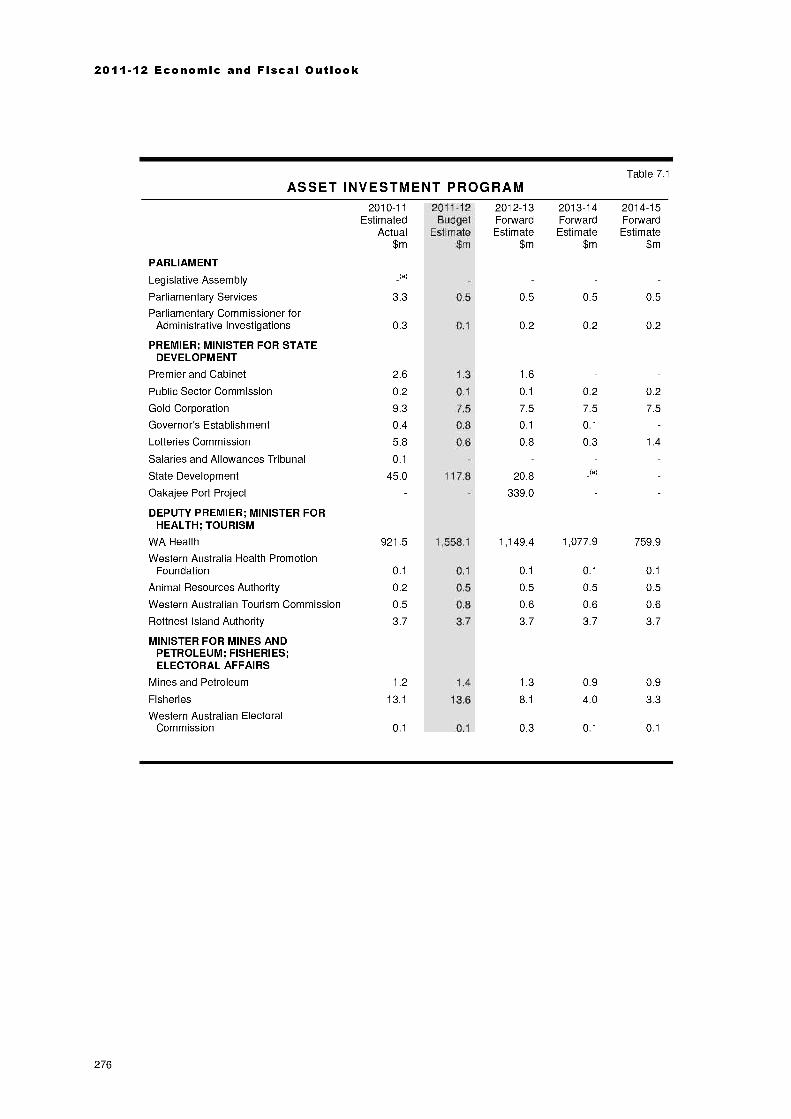
2011-12 Economic and Fiscal Outlook
ASSET INVESTMENT PROGRAMTable 7.1
PARLIAMENT
Legislative Assembly
2010-11Estimated
Actual$m
_iai
2011-12Budget
Estimate$m
2012-13ForwardEstimate
$m
2013-14ForwardEstimate
$m
2014-15ForwardEstimate
$m
Parliamentary Services 3.3 0.5 0.5 0.5 0.5
Parliamentary Commissioner forAdministrative Investigations 0.3 0.1 0.2 0.2 0.2
PREMIER; MINISTER FOR STATEDEVELOPMENT
Premier and Cabinet 2.6 1.3 1.6
Public Sector Commission 0.2 0.1 0.1 0.2 0.2
Gold Corporation 9.3 7.5 7.5 7.5 7.5
Governor's Establishment 0.4 0.8 0.1 0.1
Lotteries Commission 5.8 0.6 0.8 0.3 1.4
Salaries and Allowances Tribunal 0.1
State Development 45.0 117.8 20.8 -(a)
Oakajee Port Project 339.0
DEPUTY PREMIER; MINISTER FORHEALTH; TOURISM
WA Health 921.5 1,558.1 1,149.4 1,077.9 759.9
Western Australia Health PromotionFoundation 0.1 0.1 0.1 0.1 0.1
Animal Resources Authority 0.2 0.5 0.5 0.5 0.5
Western Australian Tourism Commission 0.5 0.8 0.6 0.6 0.6
Rottnest Island Authority 3.7 3.7 3.7 3.7 3.7
MINISTER FOR MINES ANDPETROLEUM; FISHERIES;ELECTORAL AFFAIRS
Mines and Petroleum 1.2 1.4 1.3 0.9 0.9
Fisheries 13.1 13.6 8.1 4.0 3.3
Western Australian ElectoralCommission 0.1 0.1 0.3 0.1 0.1
276
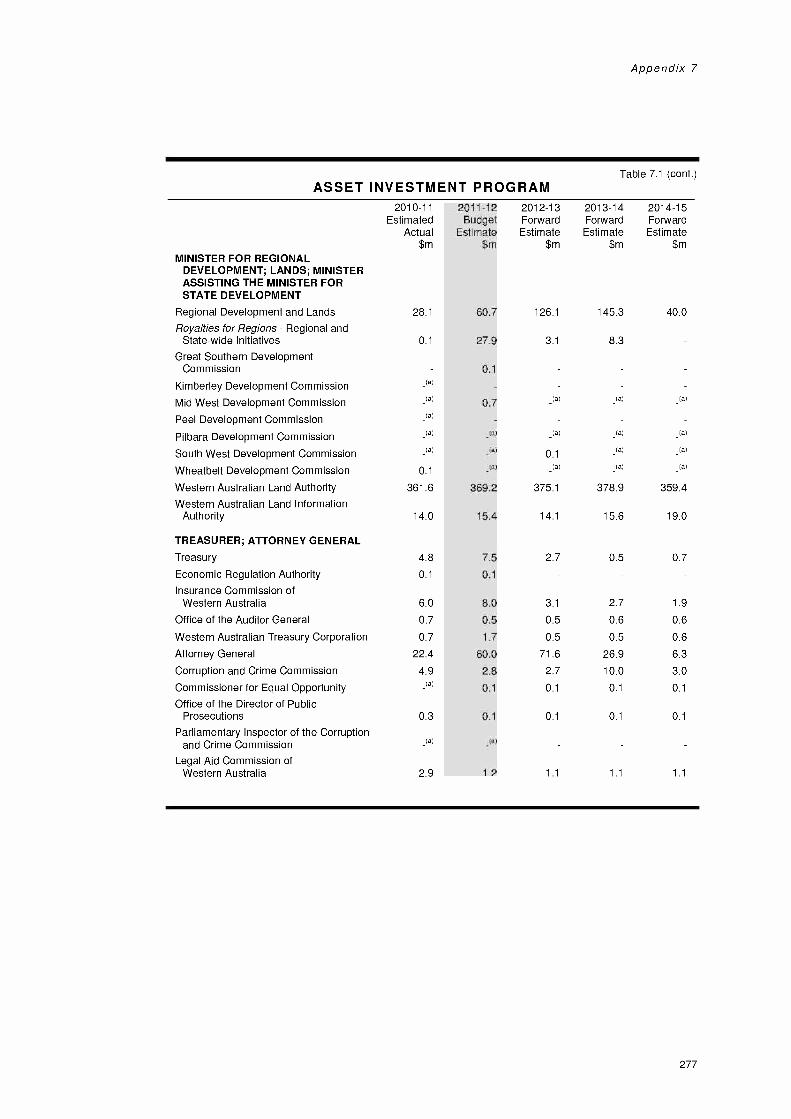
Appendix 7
Table 7.1 (cont.)ASSET INVESTMENT PROGRAM
2010-11 2011-12 2012-13 2013-14 2014-15Estimated Budget Forward Forward Forward
Actual Estimate Estimate Estimate Estimate$m $m $m $m $m
MINISTER FOR REGIONALDEVELOPMENT; LANDS; MINISTERASSISTING THE MINISTER FORSTATE DEVELOPMENT
Regional Development and Lands 28.1 60.7 126.1 145.3 40.0
Royalties for Regions Regional andState-wide Initiatives 0.1 27.9 3.1 8.3
Great Southern DevelopmentCommission 0.1
Kimberley Development Commission a)
Mid West Development Commission _(a) 0.7 _(a) _(a) _(a)
Peel Development Commission a)
Pi lbara Development Commission (a) (a) (a) (a) (a)
South West Development Commission _(a) _(a) 0.1 _(a) _(a)
Wheatbelt Development Commission 0.1 _(a) _(a) _(a) _(a)
Western Australian Land Authority 361.6 369.2 375.1 378.9 359.4
Western Australian Land InformationAuthority 14.0 15.4 14.1 15.6 19.0
TREASURER; ATTORNEY GENERAL
Treasury 4.8 7.5 2.7 0.5 0.7
Economic Regulation Authority 0.1 0.1
Insurance Commission ofWestern Australia 6.0 8.0 3.1 2.7 1.9
Office of the Auditor General 0.7 0.5 0.5 0.6 0.6
Western Australian Treasury Corporation 0.7 1.7 0.5 0.5 0.6
Attorney General 22.4 60.0 71.6 26.9 6.3
Corruption and Crime Commission 4.9 2.8 2.7 10.0 3.0
Commissioner for Equal Opportunity a) 0.1 0.1 0.1 0.1
Office of the Director of PublicProsecutions 0.3 0.1 0.1 0.1 0.1
Parliamentary Inspector of the Corruptionand Crime Commission (a) (a)
Legal Aid Commission ofWestern Australia 2.9 1.2 1.1 1.1 1.1
277
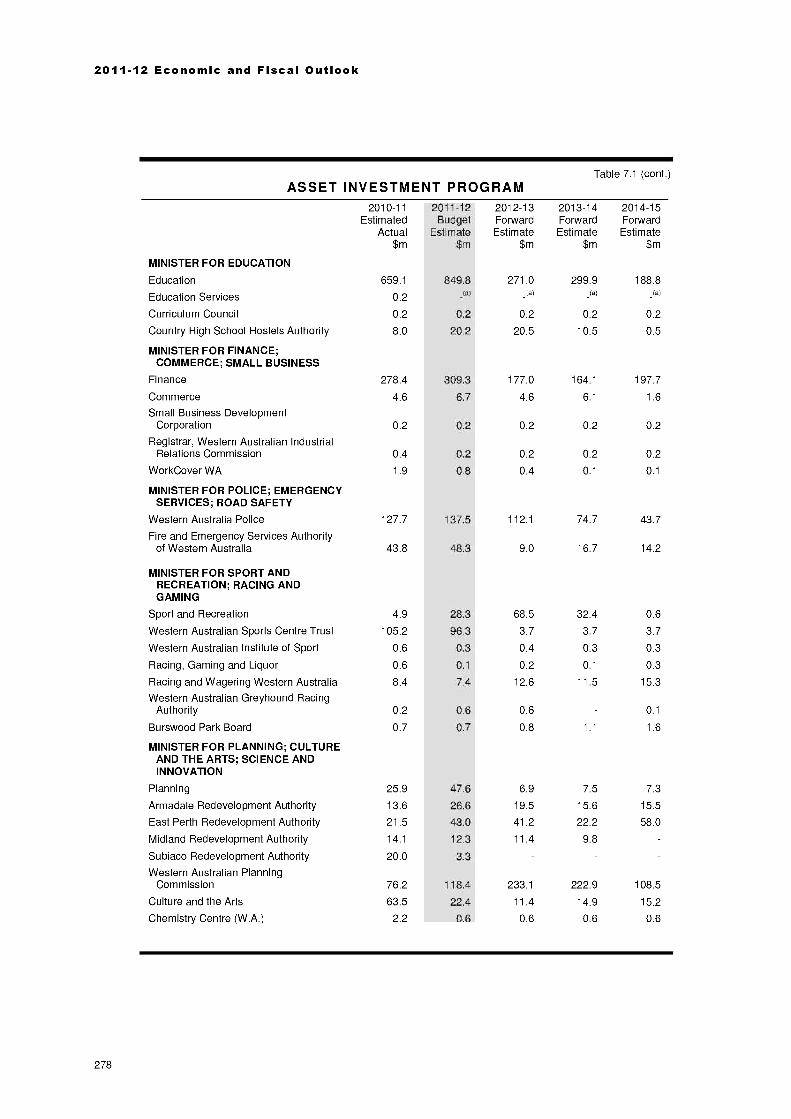
2011-12 Economic and Fiscal Outlook
ASSET INVESTMENT PROGRAMTable 7.1 (cont.)
2010-11Estimated
Actual$m
2011-12Budget
Estimate$m
2012-13ForwardEstimate
$m
2013-14ForwardEstimate
$m
2014-15ForwardEstimate
$m
MINISTER FOR EDUCATION
Education 659.1 849.8 271.0 299.9 188.8
Education Services 0.2 _iai _(a) _(a) _(a)
Curriculum Council 0.2 0.2 0.2 0.2 0.2
Country High School Hostels Authority 8.0 20.2 20.5 10.5 0.5
MINISTER FOR FINANCE;COMMERCE; SMALL BUSINESS
Finance 278.4 309.3 177.0 164.1 197.7
Commerce 4.6 6.7 4.6 6.1 1.6
Small Business DevelopmentCorporation 0.2 0.2 0.2 0.2 0.2
Registrar, Western Australian IndustrialRelations Commission 0.4 0.2 0.2 0.2 0.2
WorkCover WA 1.9 0.8 0.4 0.1 0.1
MINISTER FOR POLICE; EMERGENCYSERVICES; ROAD SAFETY
Western Australia Police 127.7 137.5 112.1 74.7 43.7
Fire and Emergency Services Authorityof Western Australia 43.8 48.3 9.0 16.7 14.2
MINISTER FOR SPORT ANDRECREATION; RACING ANDGAMING
Sport and Recreation 4.9 28.3 68.5 32.4 0.6
Western Australian Sports Centre Trust 105.2 96.3 3.7 3.7 3.7
Western Australian Institute of Sport 0.6 0.3 0.4 0.3 0.3
Racing, Gaming and Liquor 0.6 0.1 0.2 0.1 0.3
Racing and Wagering Western Australia 8.4 7.4 12.6 11.5 15.3
Western Australian Greyhound RacingAuthority 0.2 0.6 0.6 0.1
Burswood Park Board 0.7 0.7 0.8 1.1 1.6
MINISTER FOR PLANNING; CULTUREAND THE ARTS; SCIENCE ANDINNOVATION
Planning 25.9 47.6 6.9 7.5 7.3
Armadale Redevelopment Authority 13.6 26.6 19.5 15.6 15.5
East Perth Redevelopment Authority 21.5 43.0 41.2 22.2 58.0
Midland Redevelopment Authority 14.1 12.3 11.4 9.8
Subiaco Redevelopment Authority 20.0 3.3
Western Australian PlanningCommission 76.2 118.4 233.1 222.9 108.5
Culture and the Arts 63.5 22.4 11.4 14.9 15.2
Chemistry Centre (W.A.) 2.2 0.6 0.6 0.6 0.6
278

Appendix 7
Table 7.1 (cont.)ASSET INVESTMENT PROGRAM
2010-11 2011-12 2012-13 2013-14 2014-15Estimated Budget Forward Forward Forward
Actual Estimate Estimate Estimate Estimate$m $m $m $m $m
MINISTER FOR ENERGY; TRAININGAND WORKFORCE DEVELOPMENT;INDIGENOUS AFFAIRS
Office of Energy 0.3 0.3 0.2 0.2 0.3
Independent Market Operator 6.5 6.6 1.1 0.2 0.4
Horizon Power 150.9 210.1 75.8 29.8 24.2
Synergy 11.6 8.6 7.3 5.5 5.5
Verve Energy 242.2 126.5 48.8 47.4 54.1
Western Power 741.3 838.3 752.3 742.5 776.7
Western Power Provisions (b) 153.3 235.3 53.4 3.7
Training and Workforce Development 46.2 43.8 53.7 41.3 33.6
State Training Providers 16.0 17.8 20.6 9.9 6.0
Indigenous Affairs 0.4 0.5 0.4 0.5 0.4
MINISTER FOR TRANSPORT;HOUSING
Transport 28.4 42.6 21.6 10.4 474.7
Commissioner of Main Roads 421.9 646.3 730.7 632.3 217.4
Public Transport Authority ofWestern Australia 200.9 345.9 488.3 301.0 266.7
Albany Port Authority 5.8 2.8 1.0 1.0 1.0
Broome Port Authority 3.0 3.8 3.7 0.7 1.6
Bunbury Port Authority 5.2 1.5 1.6 2.4 2.4
Dampier Port Authority 5.0 4.4 5.0 5.0 5.0
Esperance Port Authority 9.0 3.0 3.0 3.0 3.0
Fremantle Port Authority 111.0 106.6 53.2 99.3 137.9
Geraldton Port Authority 6.7 4.6 5.4 6.3 2.5
Port Hed land Port Authority 71.9 7.0 7.0 7.0 7.0
Housing Authority 949.6 653.9 496.1 458.1 416.8
Keystart Housing Scheme Trust 1.2 0.7 0.5 0.5 0.5
MINISTER FOR CHILD PROTECTION;COMMUNITY SERVICES; SENIORSAND VOLUNTEERING; WOMEN'SINTERESTS; YOUTH
Child Protection 35.7 11.8 5.0 1.6
Communities 1.7
279

2011-12 Economic and Fiscal Outlook
Table 7.1 (cont.)ASSET INVESTMENT PROGRAM
2010-11 2011-12 2012-13 2013-14 2014-15Estimated Budget Forward Forward Forward
Actual Estimate Estimate Estimate Estimate$m $m $m $m $m
MINISTER FOR LOCALGOVERNMENT; HERITAGE;CITIZENSHIP AND MULTICULTURALINTERESTS
Local Government 0.1 0.1 0.1 0.1 0.1
Metropolitan Cemeteries Board 7.7 7.6 4.7 7.2 10.5
Heritage Council of Western Australia 1.0 0.6 _iai _(a)
The National Trust of Australia (W.A.) 1.7 2.2 0.7 0.7 0.7
MINISTER FOR AGRICULTURE ANDFOOD; FORESTRY; CORRECTIVESERVICES
Agriculture and Food 12.2 18.2 16.3 19.0 56.2
Rural Business DevelopmentCorporation
Western Australian Meat IndustryAuthority
Perth Market Authority 1.1 8.2 7.4 0.7 0.7
Forest Products Commission 0.6 0.6 0.6 0.6 0.6
Corrective Services 159.1 154.4 120.4 141.9 108.4
Office of the Inspector of CustodialServices 0.1 0.1 (a) (a) (a)
MINISTER FOR ENVIRONMENT;WATER
Environment and Conservation 25.0 35.1 24.0 23.3 18.4
Botanic Gardens and Parks Authority 3.9 12.0 1.0 1.0 1.0
Office of the Environmental ProtectionAuthority 0.4 0.1 0.1 0.1 0.1
Swan River Trust 0.4 0.1 0.2 0.3 0.1
Zoological Parks Authority 2.8 3.3 5.8 5.8 5.5
Water 21.2 20.1 11.0 13.3 8.7
Water Corporation 958.6 860.7 967.6 892.3 888.8
Bunbury Water Board 6.2 2.4 5.0 4.7 1.5
Busselton Water Board 7.2 5.0 7.7 2.7 2.4
280
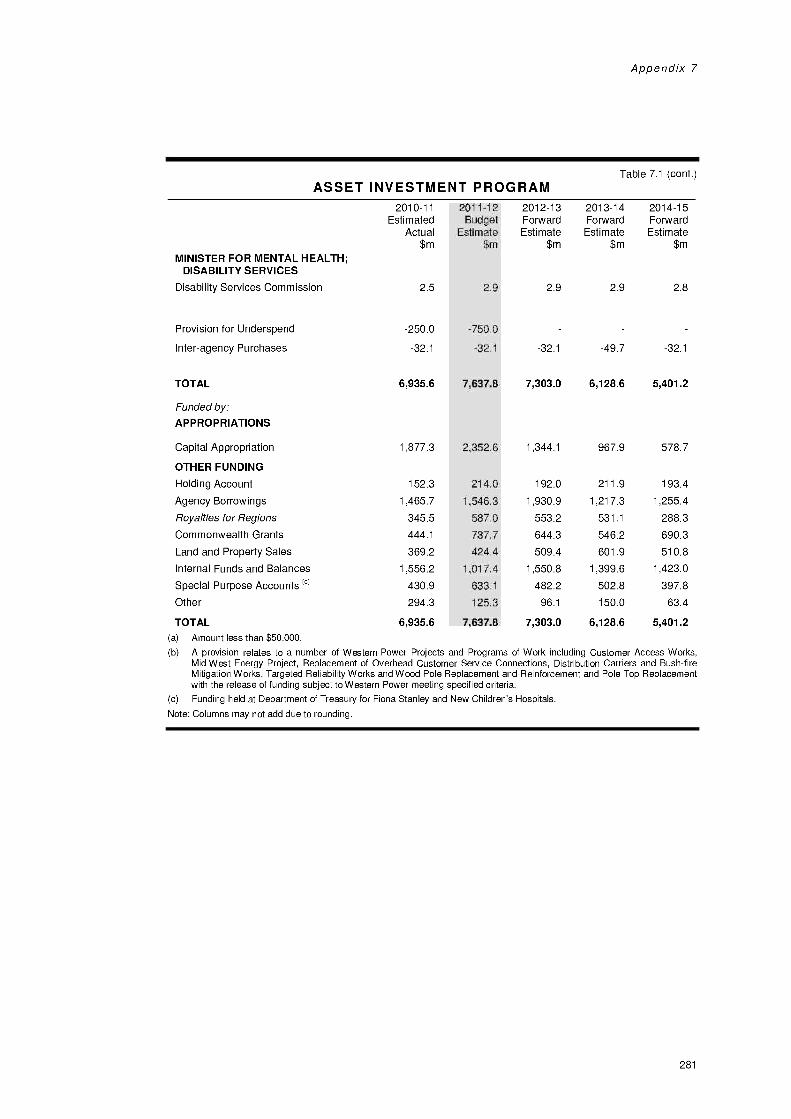
Appendix 7
Table 7.1 (cont.)ASSET INVESTMENT PROGRAM
MINISTER FOR MENTAL HEALTH;DISABILITY SERVICES
2010-11Estimated
Actual$m
2011-12Budget
Estimate$m
2012-13ForwardEstimate
$m
2013-14ForwardEstimate
$m
2014-15ForwardEstimate
$m
Disability Services Commission 2.5 2.9 2.9 2.9 2.8
Provision for Underspend -250.0 -750.0
Inter-agency Purchases -32.1 -32.1 -32.1 -49.7 -32.1
TOTAL 6,935.6 7,637.8 7,303.0 6,128.6 5,401.2
Funded by:
APPROPRIATIONS
Capital Appropriation 1,877.3 2,352.6 1,344.1 967.9 578.7
OTHER FUNDING
Holding Account 152.3 214.0 192.0 211.9 193.4
Agency Borrowings 1,465.7 1,546.3 1,930.9 1,217.3 1,255.4
Royalties for Regions 345.5 587.0 553.2 531.1 288.3
Commonwealth Grants 444.1 737.7 644.3 546.2 690.3
Land and Property Sales 369.2 424.4 509.4 601.9 510.8
Internal Funds and Balances 1,556.2 1,017.4 1,550.8 1,399.6 1,423.0
Special Purpose Accounts (e) 430.9 633.1 482.2 502.8 397.8
Other 294.3 125.3 96.1 150.0 63.4
TOTAL 6,935.6 7,637.8 7,303.0 6,128.6 5,401.2
(a) Amount less than $50,000.
(b) A provision relates to a number of Western Power Projects and Programs of Work including Customer Access Works,Mid West Energy Project, Replacement of Overhead Customer Service Connections, Distribution Carriers and Bush-fireMitigation Works, Targeted Reliability Works and Wood Pole Replacement and Reinforcement and Pole Top Replacementwith the release of funding subject to Western Power meeting specified criteria.
(c) Funding held at Department of Treasury for Fiona Stanley and New Children's Hospitals.
Note: Columns may not add due to rounding.
281

2011-12 Economic and Fiscal Outlook
282
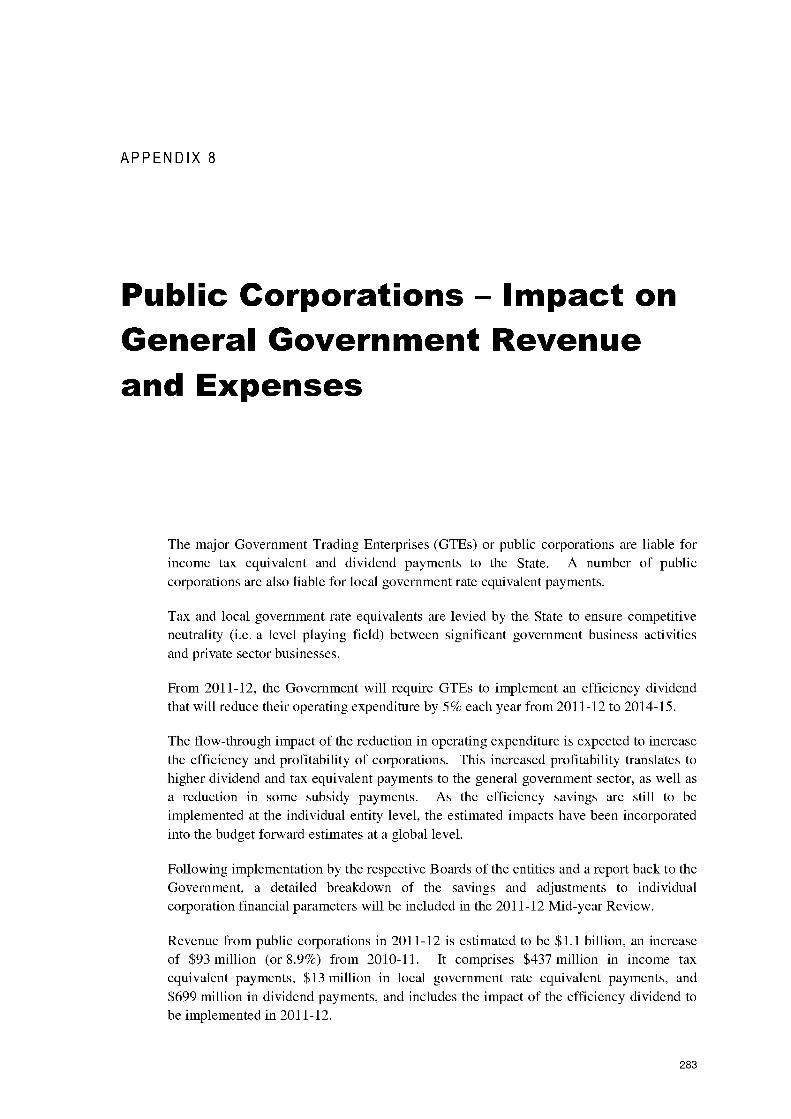
APPENDIX 8
Public Corporations Impact onGeneral Government Revenueand Expenses
The major Government Trading Enterprises (GTEs) or public corporations are liable forincome tax equivalent and dividend payments to the State. A number of publiccorporations are also liable for local government rate equivalent payments.
Tax and local government rate equivalents are levied by the State to ensure competitiveneutrality (i.e. a level playing field) between significant government business activitiesand private sector businesses.
From 2011-12, the Government will require GTEs to implement an efficiency dividendthat will reduce their operating expenditure by 5% each year from 2011-12 to 2014-15.
The flow-through impact of the reduction in operating expenditure is expected to increasethe efficiency and profitability of corporations. This increased profitability translates tohigher dividend and tax equivalent payments to the general government sector, as well asa reduction in some subsidy payments. As the efficiency savings are still to beimplemented at the individual entity level, the estimated impacts have been incorporatedinto the budget forward estimates at a global level.
Following implementation by the respective Boards of the entities and a report back to theGovernment, a detailed breakdown of the savings and adjustments to individualcorporation financial parameters will be included in the 2011-12 Mid-year Review.
Revenue from public corporations in 2011-12 is estimated to be $1.1 billion, an increaseof $93 million (or 8.9%) from 2010-11. It comprises $437 million in income taxequivalent payments, $13 million in local government rate equivalent payments, and$699 million in dividend payments, and includes the impact of the efficiency dividend tobe implemented in 2011-12.
283

2011-12 Economic and Fiscal Outlook
The increase in revenue in 2011-12 is largely a result of projected increases in paymentsfrom Verve Energy, Western Power, the Western Australian Treasury Corporation, theInsurance Commission of Western Australia and the Fremantle Port Authority, partiallyoffset by a projected decrease in payments from Synergy, the Water Corporation, and theWestern Australian Land Authority (Land Corp).
In this regard:
the forecast increase in payments to Government from Verve Energy are due toincreased prices under contracts for sale of electricity, lower production costs due tonew coal supply arrangements, and lower interest costs as a result of repayment ofdebt. Verve Energy is also forecasting income tax equivalent payments from 2011-12as it expects to utilise its accumulated deferred tax losses in this year;
the forecast increase in payments to Government from Western Power is a result oflower operating expenses compared to network tariff revenue set by the EconomicRegulation Authority (ERA) under the second Access Arrangement;
the projected increase in the Western Australian Treasury Corporation's dividend for2011-12 (from $3.1 million to $5 9 million) reflects revised profitability, drivenmainly by lower funding costs and higher levels of borrowings by clients;
the increase in income tax equivalent revenue in 2011-12 from the InsuranceCommission of Western Australia is due to deferred tax losses being extinguished anda forecast improvement in profitability;
the increase in income tax equivalent revenue from the Fremantle Port Authority in2011-12 is mainly due to tax associated with customer contributions for upgrades tobulk business facilities;
Synergy's payments to Government are forecast to reduce between 2010-11 and2011-12 due to lower margins in its electricity and gas business, and higher operatingcosts in relation to customer service demands;
the decrease in the Water Corporation's income tax equivalent and dividend revenuein 2011-12 is attributable to higher operating expenditure and reduced growthforecasts for the year; and
the decrease in income tax equivalent revenue in 2011-12 from Land Corp is mainlydue to lower margins associated with a higher percentage of overall land sales beingbased on regional projects.
A detailed listing of revenue received from individual public corporations and informationon dividend payout ratios are provided later in the appendix (see Table 8.4 and 8.5).
284

Appendix 8
There are also significant payments from the general government sector to publiccorporations. Such payments include operating subsidies for non-commercial servicesprovided by public corporations on behalf of the Government. An example is rebateconcessions relating to electricity and water services. The Water Corporation is a majorrecipient of such payments. For example, the provision of household water andwastewater services in country areas at prices set by the Government (to matchmetropolitan water prices) is subsidised by a payment to the Water Corporation.
A detailed list of general government sector expenses arising from payments to individualpublic corporations is provided in Table 8.6.
Electricity TariffsBudget Planning Assumptions
The Government has approved the following increases to electricity tariffs from1 July 2011:
residential tariffs 5%;
small business tariffs 5%; and
other business tariffs 9% to 30%, depending on the tariff.
Despite these increases, the majority of electricity tariffs are still below the cost ofproduction and supply. In this regard, even after these increases, the Government isexpecting to provide an operating subsidy to Synergy and Horizon Power (to compensatethese corporations for below-cost reflective tariffs) of $366 4 million in 2011-12, with afurther subsidy estimated at $697 6 million over the outyears, assuming the tariffincreases outlined in Table 8.1.
The following tables detail the assumed electricity tariff paths reflected in the2011-12 Budget and forward estimates. They are based on assumptions around the costof producing and supplying electricity. Risks around the future costs of electricityproduction include:
the Commonwealth Government's proposed carbon tax, which has not been includedin the assumptions;
network costs for 2012-13 onwards are still to be determined by the ERA andtherefore are subject to change; and
fuel costs are likely to change as current long-term contracts expire.
In addition, the Government has not explicitly taken decisions on electricity tariffincreases beyond 2011-12. It will make decisions in relation to the actual level ofelectricity tariffs for the forward years during the budget formulation process for therelevant financial year. Therefore, the increases outlined in Table 8.1 for 2012-13onwards represent budget planning assumptions only.
285

2011-12 Economic and Fiscal Outlook
ASSUMED NON-CONTESTABLE TARIFF GLIDE PATHTable 8.1
Tariff 2011-12 2012-13 2013-14 2014-15Residential (A1/A2) 5.0% 5.0% 12.0% 12.0%Residential Hot Water (B1) 5.0% 5.0% 12.0% 7.8%Community and Charitable Organisations
(C1/C2) 5.0% 5.0% 12.0% 12.0%Charitable Organistion providing
Residential Accommodation (D1/D2) 5.0% 5.0% 12.0% 12.0%Combined Residential/Business (K1/K2) 5.0% 5.0% 12.0% 12.0%Small Business (L1/L2) 5.0% 5.0% 12.0% 12.0%Small Business Time of Use (R1) 5.0% 5.0% 12.0% 12.0%
ASSUMED CONTESTABLE TARIFF GLIDE PATH
Tariff 2011-12 2012-13 2013-14 2014-15Medium Business (L3/L4) 29.8% 6.7% 1.9% 6.8%Medium Business Time of Use (R3) 19.7% 2.9% 1.2% 5.6%Large Business (M1/M2) 19.6% 3.2% 4.7% 6.2%Large Business Low Voltage (S1) 12.5% 3.9% 1.0% 5.6%Large Business High Voltage (T1) 13.9% 5.1% 0.7% 5.5%Traffic Lighting (W1/W2) 9.3% 9.1% 2.5% 5.1%Street Lighting (Z) 29.8% -4.7% 7.9% 7.4%
286
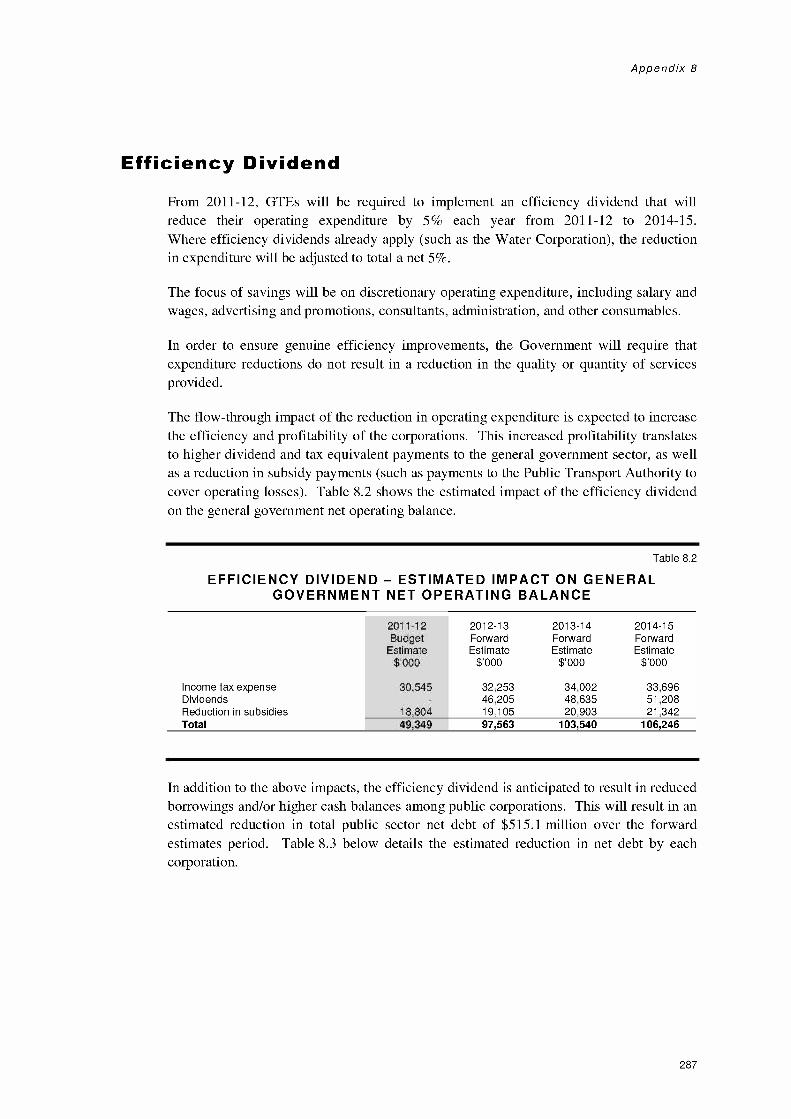
Appendix 8
Efficiency DividendFrom 2011-12, GTEs will be required to implement an efficiency dividend that willreduce their operating expenditure by 5% each year from 2011-12 to 2014-15.Where efficiency dividends already apply (such as the Water Corporation), the reductionin expenditure will be adjusted to total a net 5%.
The focus of savings will be on discretionary operating expenditure, including salary andwages, advertising and promotions, consultants, administration, and other consumables.
In order to ensure genuine efficiency improvements, the Government will require thatexpenditure reductions do not result in a reduction in the quality or quantity of servicesprovided.
The flow-through impact of the reduction in operating expenditure is expected to increasethe efficiency and profitability of the corporations. This increased profitability translatesto higher dividend and tax equivalent payments to the general government sector, as wellas a reduction in subsidy payments (such as payments to the Public Transport Authority tocover operating losses). Table 8.2 shows the estimated impact of the efficiency dividendon the general government net operating balance.
Table 8.2
EFFICIENCY DIVIDEND ESTIMATED IMPACT ON GENERALGOVERNMENT NET OPERATING BALANCE
2011-12Budget
Estimate
2012-13ForwardEstimate
2013-14ForwardEstimate
2014-15ForwardEstimate
$'000 $'000 $'000 $'000
Income tax expense 30,545 32,253 34,002 33,696Dividends 46,205 48,635 51,208Reduction in subsidies 18,804 19,105 20,903 21,342Total 49,349 97,563 103,540 106,246
In addition to the above impacts, the efficiency dividend is anticipated to result in reducedborrowings and/or higher cash balances among public corporations. This will result in anestimated reduction in total public sector net debt of $515 1 million over the forwardestimates period. Table 8.3 below details the estimated reduction in net debt by eachcorporation.
287
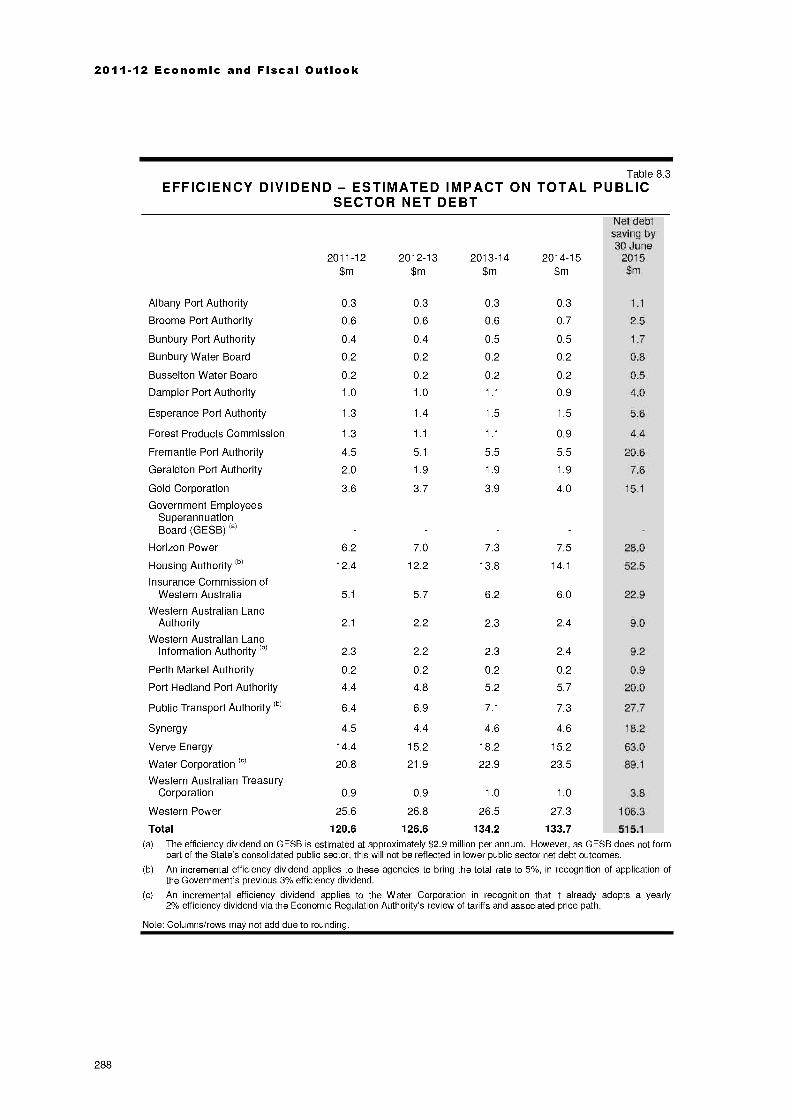
2011-12 Economic and Fiscal Outlook
Table 8.3EFFICIENCY DIVIDEND - ESTIMATED IMPACT ON TOTAL PUBLIC
SECTOR NET DEBT
2011-12
$m
2012-13
$m
2013-14$m
2014-15
$m
Net debtsaving by30 June
2015$m
Albany Port Authority 0.3 0.3 0.3 0.3 1.1
Broome Port Authority 0.6 0.6 0.6 0.7 2.5
Bunbury Port Authority 0.4 0.4 0.5 0.5 1.7
Bunbury Water Board 0.2 0.2 0.2 0.2 0.8
Busselton Water Board 0.2 0.2 0.2 0.2 0.5
Dampier Port Authority 1.0 1.0 1.1 0.9 4.0
Esperance Port Authority 1.3 1.4 1.5 1.5 5.6
Forest Products Commission 1.3 1.1 1.1 0.9 4.4
Fremantle Port Authority 4.5 5.1 5.5 5.5 20.6
Geraldton Port Authority 2.0 1.9 1.9 1.9 7.6
Gold Corporation 3.6 3.7 3.9 4.0 15.1
Government EmployeesSuperannuationBoard (GESB) (a)
Horizon Power 6.2 7.0 7.3 7.5 28.0
Housing Authority (b) 12.4 12.2 13.8 14.1 52.5
Insurance Commission ofWestern Australia 5.1 5.7 6.2 6.0 22.9
Western Australian LandAuthority 2.1 2.2 2.3 2.4 9.0
Western Australian LandInformation Authority (b) 2.3 2.2 2.3 2.4 9.2
Perth Market Authority 0.2 0.2 0.2 0.2 0.9
Port Hed land Port Authority 4.4 4.8 5.2 5.7 20.0
Public Transport Authority (b) 6.4 6.9 7.1 7.3 27.7
Synergy 4.5 4.4 4.6 4.6 18.2
Verve Energy 14.4 15.2 18.2 15.2 63.0
Water Corporation (e) 20.8 21.9 22.9 23.5 89.1
Western Australian TreasuryCorporation 0.9 0.9 1.0 1.0 3.8
Western Power 25.6 26.8 26.5 27.3 106.3
Total 120.6 126.6 134.2 133.7 515.1
(a) The efficiency dividend on GESB is estimated at approximately $2.9 million per annum. However, as GESB does not formpart of the State's consolidated public sector, this will not be reflected in lower public sector net debt outcomes.
(b) An incremental efficiency dividend applies to these agencies to bring the total rate to 5%, in recognition of application ofthe Government's previous 3% efficiency dividend.
(c) An incremental efficiency dividend applies to the Water Corporation in recognition that it already adopts a yearly2% efficiency dividend via the Economic Regulation Authority's review of tariffs and associated price path.
Note: Columns/rows may not add due to rounding.
288

Appendix 8
Table 8.4REVENUE TO GOVERNMENT FROM PUBLIC CORPORATIONS
Details of Payment
Horizon Power
2010-11Estimated
Actual$'000
2011-12BudgetEstimate
$'000
2012-13ForwardEstimate
$'000
2013-14ForwardEstimate
$'000
2014-15ForwardEstimate
$'000
Income tax expense 19,837 26,141 19,788 18,399 18,186Local Government Rates expense 123 130 141 156 177Dividends 20,399 49,887 43,044 44,430Subtotal 19,960 46,670 69,816 61,599 62,793
SynergyIncome tax expense 23,749 18,646 22,114 27,890 22,495Dividends 73,291 41,560 32,630 38,699 48,807Subtotal 97,040 60,206 54,744 66,589 71,302
Verve EnergyIncome tax expense 20,200 88,900 97,900 101,300Local Government Rates expense 501 501 501 501 501Dividends 63,398 102,602 56,824 115,452 128,246Subtotal 63,899 123,303 146,225 213,853 230,047
Western PowerIncome tax expense 6,143 40,681 84,347 113,387 140,707Local Government Rates expense 1,105 1,133 1,161 1,190 1,220Dividends 63,236 79,956 114,402 180,692 225,774Subtotal 70,484 121,770 199,910 295,269 367,701
Water CorporationIncome tax expense 207,279 205,255 230,100 274,505 310,297Local Government Rates expense 4,049 4,701 4,854 5,012 5,174Dividends 415,156 371,252 413,794 489,605 569,002Subtotal 626,484 581,208 648,748 769,122 884,473
Bun bu ry Water BoardIncome tax expense 327 551 663 606 652Subtotal 327 551 663 606 652
Busselton Water BoardIncome tax expense 1,065 1,073 1,129 1,123 1,216Subtotal 1,065 1,073 1,129 1,123 1,216
Western Australian Land Authority(LandCorp)Income tax expense 45,946 31,624 49,533 52,993 42,332Local Government Rates expense 3,578 4,524 4,839 4,874 4,350Dividends 31,096 31,096 31,096 49,440 30,540Subtotal 80,620 67,244 85,468 107,307 77,222
289

2011-12 Economic and Fiscal Outlook
Table 8.4 (cont.)REVENUE TO GOVERNMENT FROM PUBLIC CORPORATIONS
Details of Payment
Albany Port Authority
2010-11Estimated
Actual$'000
2011-12Budget
Estimate$'000
2012-13ForwardEstimate
$'000
2013-14ForwardEstimate
$'000
2014-15ForwardEstimate
$'000
Income tax expense 1,938 2,038 2,202 1,836 1,836Local Government Rates expense 104 108 120 120 120Dividends 1,988 2,331 2,452 2,652 2,652Subtotal 4,030 4,477 4,774 4,608 4,608
Broome Port AuthorityIncome tax expense 337 169 444 421 503Local Government Rates expense 34 35 37 38 39Dividends 692 140 656 699 665Subtotal 1,063 344 1,137 1,158 1,207
Bunbury Port AuthorityIncome tax expense 2,420 2,418 2,413 2,872 2,872Local Government Rates expense 220 220 220 220 220Dividends 3,670 3,667 3,660 4,355 4,355Subtotal 6,310 6,305 6,293 7,447 7,447
Dampier Port AuthorityIncome tax expense 3,185 3,490 4,070 4,167 4,004Local Government Rates expense 110 110 110 110 110Dividends 3,716 4,072 4,748 4,861 4,672Subtotal 7,011 7,672 8,928 9,138 8,786
Esperance Port AuthorityIncome tax expense 484 96 785 785Local Government Rates expense 330 335 335 340 340Dividends 96 429 96 96 96Subtotal 910 764 527 1,221 1,221
Fremantle Port AuthorityIncome tax expense 3,481 12,976 4,722 4,947 5,677Local Government Rates expense 354 372 390 410 430Dividends 9,532 4,591 4,602 6,498 6,845Subtotal 13,367 17,939 9,714 11,855 12,952
Geraldton Port AuthorityIncome tax expense 9,190 9,190 9,190 9,190 9,190Local Government Rates expense 160 160 160 160 160Dividends 17,603 17,493 18,960 18,960 18,960Subtotal 26,953 26,843 28,310 28,310 28,310
Port Hedland Port AuthorityIncome tax expense 6,646 3,601 15,538 18,442 24,985Local Government Rates expense 243 220 231 243 255Dividends 1,117 5,462 23,566 27,971Subtotal 6,889 4,938 21,231 42,251 53,211
290

Appendix 8
Table 8.4 (cont.)REVENUE TO GOVERNMENT FROM PUBLIC CORPORATIONS
Details of Payment
Gold Corporation
2010-11Estimated
Actual$'000
2011-12Budget
Estimate$'000
2012-13ForwardEstimate
$'000
2013-14ForwardEstimate
$'000
2014-15ForwardEstimate
$'000
Income tax expense 6,006 7,666 8,143 8,497 8,766Local Government Rates expense 110 115 120 125 130Dividends 9,772 10,511 13,416 14,251 14,869Subtotal 15,888 18,292 21,679 22,873 23,765
Western Australian TreasuryCorporationIncome tax expense 3,918 3,617 4,168 4,241 4,117Dividends 3,080 5,943 5,485 6,322 6,432Subtotal 6,998 9,560 9,653 10,563 10,549
Insurance Commission ofWestern AustraliaIncome tax expense 5,953 17,543 26,627 31,486 34,619Subtotal 5,953 17,543 26,627 31,486 34,619
Forest Products CommissionDividends 1,500 2,000 2,000 2,000Subtotal 1,500 2,000 2,000 2,000
Subtotal AmountsIncome tax expense 347,904 406,879 574,187 673,687 734,539Local Government Rates expense 11,021 12,664 13,219 13,499 13,226Dividends 696,326 698,659 760,170 1,001,192 1,136,316Subtotal 1,055,251 1,118,202 1,347,576 1,688,378 1,884,081
Efficiency DividendEstimated Impact (a)
Income tax expense 30,545 32,253 34,002 33,696Dividends 46,205 48,635 51,208Subtotal 30,545 78,458 82,637 84,904
Total 1,055,251 1,148,747 1,426,034 1,771,015 1,968,985
(a) Excludes reductions in operating subsidies.
Note: Columns may not add due to rounding.
291
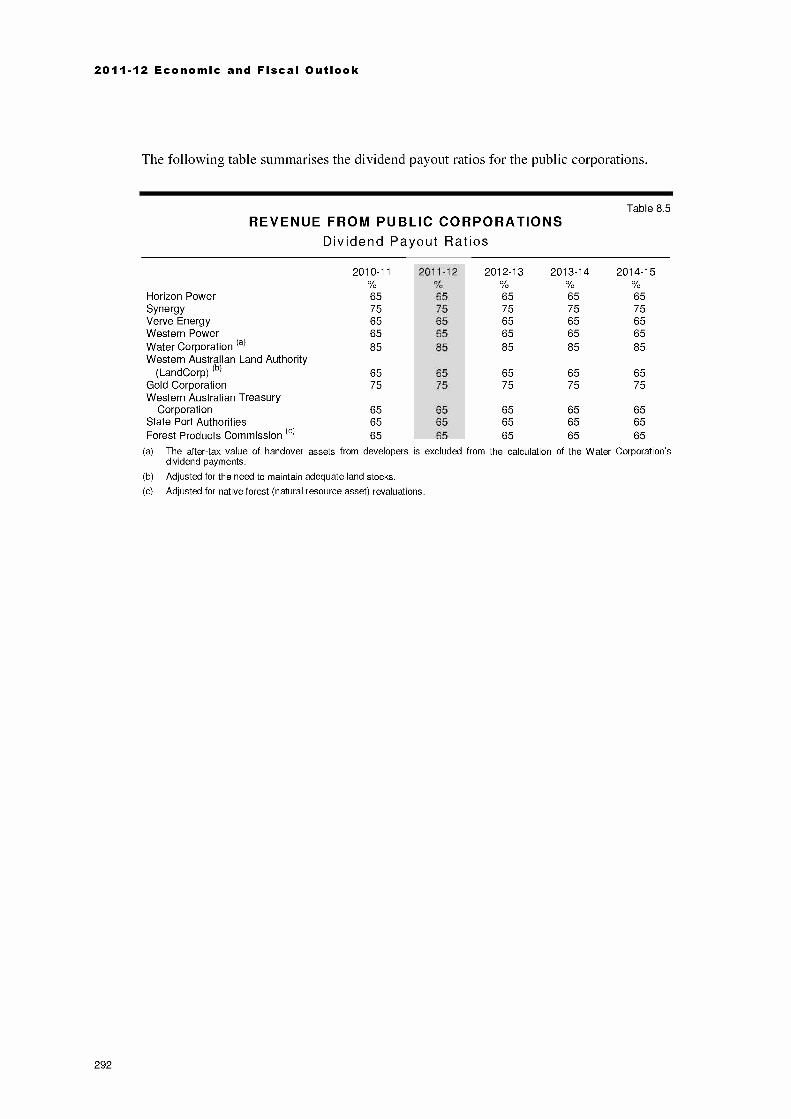
2011-12 Economic and Fiscal Outlook
The following table summarises the dividend payout ratios for the public corporations.
Table 8.5REVENUE FROM PUBLIC CORPORATIONS
Dividend Payout Ratios
2010-11°/0
2011-12`3/0
2012-13cY0
2013-14cY0
2014-15cY0
Horizon Power 65 65 65 65 65Synergy 75 75 75 75 75Verve Energy 65 65 65 65 65Western Power 65 65 65 65 65Water Corporation (a) 85 85 85 85 85Western Australian Land Authority
(Land Corp) (b) 65 65 65 65 65Gold Corporation 75 75 75 75 75Western Australian Treasury
Corporation 65 65 65 65 65State Port Authorities 65 65 65 65 65Forest Products Commission (c) 65 65 65 65 65
(a) The after-tax value of handover assets from developers is excluded from the calculation of the Water Corporation'sdividend payments.
(b) Adjusted for the need to maintain adequate land stocks.
(c) Adjusted for native forest (natural resource asset) revaluations.
292
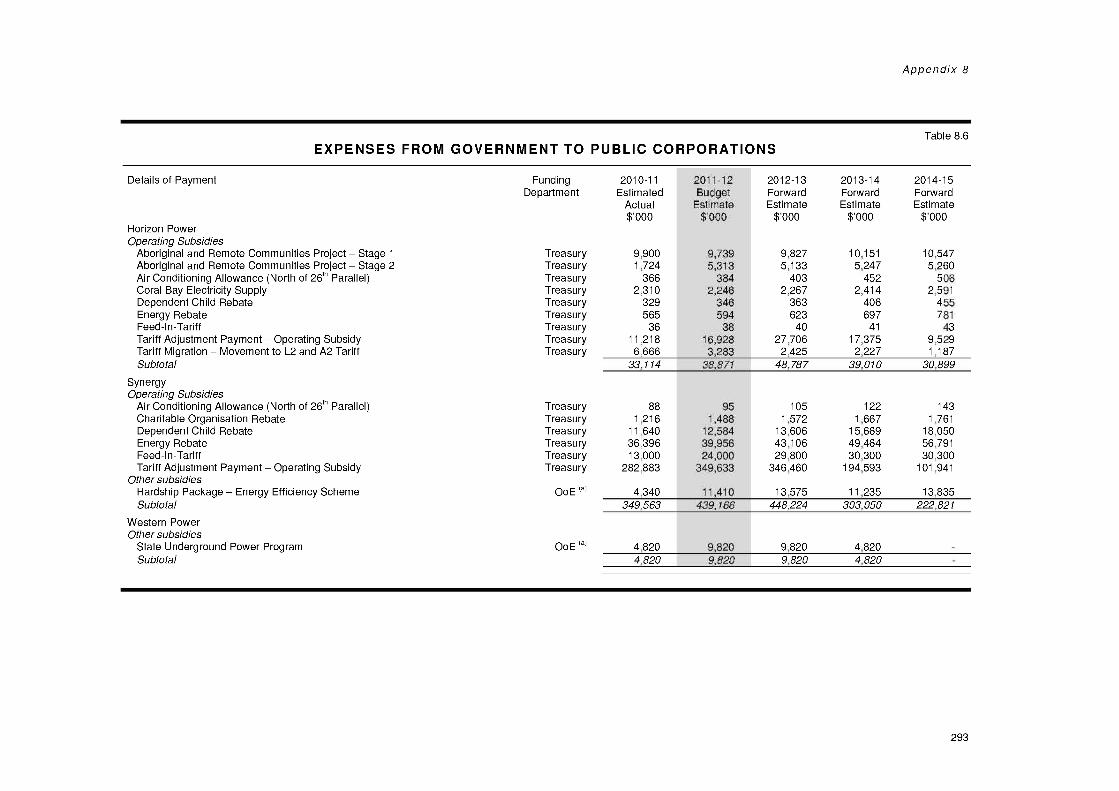
Appendix 8
Table 8.6EXPENSES FROM GOVERNMENT TO PUBLIC CORPORATIONS
Details of Payment
Horizon PowerOperating Subsidies
FundingDepartment
2010-11Estimated
Actual$'000
2011-12BudgetEstimate
$'000
2012-13ForwardEstimate
$'000
2013-14ForwardEstimate
$'000
2014-15ForwardEstimate
$'000
Aboriginal and Remote Communities Project Stage 1 Treasury 9,900 9,739 9,827 10,151 10,547Aboriginal and Remote Communities Project Stage 2 Treasury 1,724 5,313 5,133 5,247 5,260Air Conditioning Allowance (North of 261" Parallel) Treasury 366 384 403 452 506Coral Bay Electricity Supply Treasury 2,310 2,246 2,267 2,414 2,591Dependent Child Rebate Treasury 329 346 363 406 455Energy Rebate Treasury 565 594 623 697 781Feed-In-Tariff Treasury 36 38 40 41 43Tariff Adjustment Payment Operating Subsidy Treasury 11,218 16,928 27,706 17,375 9,529Tariff Migration Movement to L2 and A2 Tariff Treasury 6,666 3,283 2,425 2,227 1,187Subtotal 33,114 38,871 48,787 39,010 30,899
SynergyOperating Subsidies
Air Conditioning Allowance (North of 2e Parallel) Treasury 88 95 105 122 143Charitable Organisation Rebate Treasury 1,216 1,488 1,572 1,667 1,761Dependent Child Rebate Treasury 11,640 12,584 13,606 15,669 18,050Energy Rebate Treasury 36,396 39,956 43,106 49,464 56,791Feed-In-Tariff Treasury 13,000 24,000 29,800 30,300 30,300Tariff Adjustment Payment Operating Subsidy Treasury 282,883 349,633 346,460 194,593 101,941
Other subsidiesHardship Package Energy Efficiency Scheme OoE (a) 4,340 11,410 13,575 11,235 13,835Subtotal 349,563 439,166 448,224 303,050 222,821
Western PowerOther subsidies
State Underground Power Program OoE (a) 4,820 9,820 9,820 4,820Subtotal 4,820 9,820 9,820 4,820
293

2011-12 Economic and Fiscal Outlook
Table 8.6 (cont.)EXPENSES FROM GOVERNMENT TO PUBLIC CORPORATIONS
Details of Payment
Water CorporationOperating Subsidies
FundingDepartment
2010-11Estimated
Actual$'000
2011-12BudgetEstimate
$'000
2012-13ForwardEstimate
$'000
2013-14ForwardEstimate
$'000
2014-15ForwardEstimate
$'000
Country Water, Sewerage and Drainage Operations Treasury 324,971 299,596 288,255 289,208 306,461!nth! Sewerage Program Treasury 42,899 39,835 40,962 43,202 45,428Pensioner and Senior Concessions Treasury 111,776 112,811 120,668 131,384 140,607Rural Irrigation Schemes Treasury 12,665 11,748 11,804 11,981 12,157
Other subsidiesBurrup Water Supply System DSD (b) 8,482 8,694 8,694 8,694 8,694Port Hedland Waste Water Treatment Plant Royalties for Regions Treasury 5,000 18,000 19,000Reimbursement of Land Sales Treasury 200 200 200 200 200Statewide Water Efficiency Measures Water 262 262 262 262 262Subtotal 501,255 478,146 488,845 503,931 513,809
Western Australian Land Authority (LandCorp)Operating Subsidies
Australian Marine Complex Rate of Return Stage 1 and 2 Treasury 18,985 18,985 18,985 18,985 18,985Australian Marine Complex Technology Precinct Treasury 324 334 344 355 366Bunbury Timber Jetty Rate of Return Treasury 329 329Collie Shotts Industrial Park Treasury 4,600Collie Shotts Industrial Park Infrastructure Upgrades Treasury 1,108 11,642 1,352 363 188Forrestdale Rate of Return (Armadale Redevelopment Authority) Treasury 200Halls Creek Residential Land Requirements Treasury 2,900 4,400Hope Valley/Wattleup Redevelopment Land Acquisition Treasury 6,610 6,625 6,640 6,655 6,670Kalgoorlie North West Sector Treasury 3,500Karratha/Burrup Service Corridor Treasury 2,316 2,316 2,316 2,316 2,316Kemerton Core Land Acquisition Treasury 1,977Kwinana Land Holding Costs Treasury 1,159 1,194 1,229 1,266 1,304Strategic Asset Management Treasury 1,000 1,000 1,000 1,000 1,000Townsite Development Program Treasury 4,000 4,000 4,000 4,000 4,000
Other subsidiesCarnarvon Waterfront Development Planning Project Royalties for Regions Treasury 1,000Karratha Service Workers Accommodation Royalties for Regions Treasury 28,400North West Planning Program RDL (e) 1,000 500Perth Waterfront Project Planning WA PC (d) 600Project Ready Heavy Use Industrial Land DSD (b) 865 250 1,250Rockingham Kwinana Development Office Planning 200 200South Hedland Town Centre Revitalisation Royalties for Regions Treasury 15,495Subtotal 84,962 62,852 37,645 34,940 34,829
294
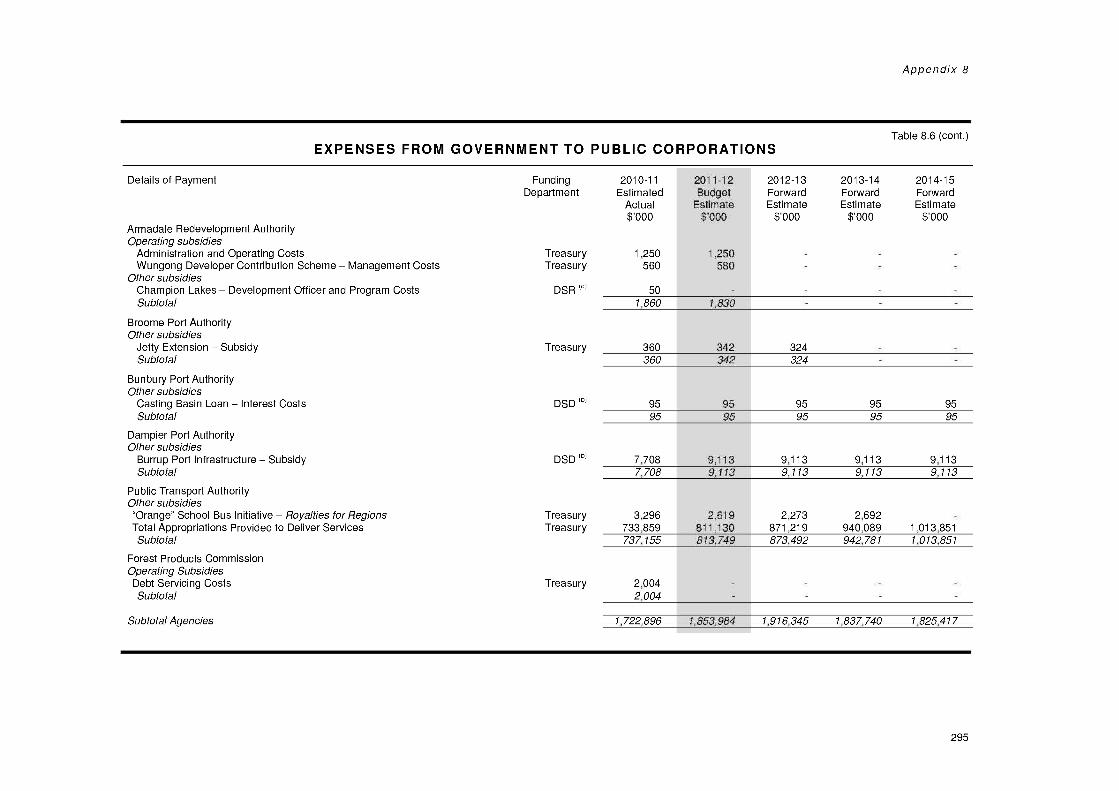
Appendix 8
Table 8.6 (cont.)EXPENSES FROM GOVERNMENT TO PUBLIC CORPORATIONS
Details of Payment Funding 2010-11 2011-12 2012-13 2013-14 2014-15Department Estimated Budget Forward Forward Forward
Actual Estimate Estimate Estimate Estimate$'000 $'000 $'000 $'000 $'000
Armada le Redevelopment AuthorityOperating subsidies
Administration and Operating Costs Treasury 1,250 1,250Wungong Developer Contribution Scheme Management Costs Treasury 560 580
Other subsidiesChampion Lakes Development Officer and Program Costs DSR (e) 50Subtotal 1,860 1,830
Broome Port AuthorityOther subsidies
Jetty Extension Subsidy Treasury 360 342 324Subtotal 360 342 324
Bunbury Port AuthorityOther subsidies
Casting Basin Loan Interest Costs DSD (b) 95 95 95 95 95Subtotal 95 95 95 95 95
Dampier Port AuthorityOther subsidies
Burrup Port Infrastructure Subsidy DSD (b) 7,708 9,113 9,113 9,113 9,113Subtotal 7,708 9,113 9,113 9,113 9,113
Public Transport AuthorityOther subsidies"Orange" School Bus Initiative Royalties for Regions Treasury 3,296 2,619 2,273 2,692Total Appropriations Provided to Deliver Services Treasury 733,859 811,130 871,219 940,089 1,013,851Subtotal 737,155 813,749 873,492 942,781 1,013,851
Forest Products CommissionOperating SubsidiesDebt Servicing Costs Treasury 2,004Subtotal 2,004
Subtotal Agencies 1,722,896 1,853,984 1,916,345 1,837,740 1,825,417
295

2011-12 Economic and Fiscal Outlook
Table 8.6 (cont.)EXPENSES FROM GOVERNMENT TO PUBLIC CORPORATIONS
Details of Payment Funding 2010-11 2011-12 2012-13 2013-14 2014-15Department Estimated Budget Forward Forward Forward
Actual Estimate Estimate Estimate Estimate$'000 $'000 $'000 $'000 $'000
Efficiency DividendOperating SubsidiesEstimated impact on general government net operating balance Treasury -18,804 -19,105 -20,903 -21,342Subtotal -18,804 -19,105 -20,903 -21,342
Total 1,722,896 1,835,180 1,897,240 1,816,837 1,804,075
(a) Office of Energy
(b) Department of State Development
(c) Department of Regional Development and Lands
(d) Western Australian Planning Commission
(e) Department of Sport and Recreation
Note: Columns may not add due to rounding.
296

APPENDIX 9
Tariffs, Fees and Charges
For a number of years, the Department of Treasury has produced a model that estimatesthe costs incurred by a 'representative' household through the consumption of certainState government goods and services. The model's parameters are outlined in thisappendix.
It should be noted that calculating the effects of changes in State government tariffs, feesand charges for a single 'representative' household can never capture the enormousdiversity in household structures or the widely differing patterns of usage of Stategovernment goods and services.
The model seeks to highlight the impact of changes in major State government tariffs,fees and charges on a particular hypothetical household reflecting current averageelectricity and water consumption, an assumed level of public transport use, and specifiedconsumption of a range of other State government goods and services (including somespecific taxes).
While the 'representative' household model is not used as a decision making tool, it isincluded here for comparative purposes.
297
2011-12 Economic and Fiscal Outlook
Key Government Charges Affecting Households
The model covers the following annual State government charges affecting the`representative' household:
water, including both consumption and annual supply charges;
sewerage;
drainage;
electricity, including both consumption and annual supply charges;
public transport;
compulsory third party motor vehicle insurance;
motor vehicle licence fees;
drivers licence fees;
stamp duty on both compulsory third party insurance and general insurance; and
the Emergency Services Levy (ESL).
It should be noted that the model excludes State government charges relating to one-offevents such as property transfer duty.
Results
Table 9.1 shows the impact of the changes in State government tariffs, fees and chargeson the 'representative' household in 2011-12.
298

Appendix 9
Table 9.1
ESTIMATED IMPACT ON THE STANDARD 'REPRESENTATIVE'HOUSEHOLD
Motor Vehicles
2010-11$ level % change $ change
2011-12$ level
Motor vehicle licence fee (a) $213.92 2.88% $6.16 $220.08Recording fee $13.05 0.00% $0.00 $13.05CTP insurance $245.01 0.00% $0.00 $245.01Drivers licence (b) $73.20 0.00% $0.00 $73.20Total $545.18 1.13% $6.16 $551.34
Utility Charges (C)
Electricity $1,442.90 5.00% $72.14 $1,515.05Water, Sewerage and Drainage $1,156.74 8.50% $97.86 $1,254.60Total $2,599.64 6.54% $170.00 $2, 769.65
Public Transport
Student fares $260.00 0.00% $0.00 $260.00Full fares (2 zones) $721.50 2.70% $19.50 $741.00Total $981.50 1.99% $19.50 $1,001.00
Emergency Services Levy (d) $179.00 5.59% $10.00 $189.00
Stamp DutyStamp duty on general insurance $138.27 0.00% $0.00 $138.27Stamp duty on CTP insurance $24.50 0.00% $0.00 $24.50Total $162.77 0.00% $0.00 $162.77
Total Expenditure (Nominal) $4,468.10 4.60% $205.66 $4,673.76
(a) The effective increase in motor vehicle licence expenditure for the 'representative' household is 2.88% taking into accountthe $67 discount available to family vehicles.
(b) Drivers licence expenditure is for two drivers.
(c) Assumes no access to the Hardship Utilities Grants Scheme.
(d) The actual impact of the Emergency Services Levy (ESL) on household charges is to be confirmed by the Fire andEmergency Services Authority in June 2011, after property valuation data is finalised. A shift in the ESL impact mayeventuate as a result of movements in the Perth property market and the triennial revaluation of the metropolitan area byLandgate which will take effect on 1 July 2011.
Note: Columns may not add due to rounding.
On the basis of the assumptions below and the 2011-12 levels of State government tariffs,fees and charges, the total expenditure of the 'representative' household on this basket ofState government goods and services is $4,673.76. This represents an increase of $205.66(or 4.60%) on 2010-11 levels.
Assumptions
The 'representative' household model is based on a household with a single income(full-time work), two adults and two children. The characteristics of the 'representative'household are updated annually and it is assumed that the household:
consumes:
6,259 kW hours of electricity per annum, based on the 2009-10 average level ofconsumption for a household provided by Synergy; and
299
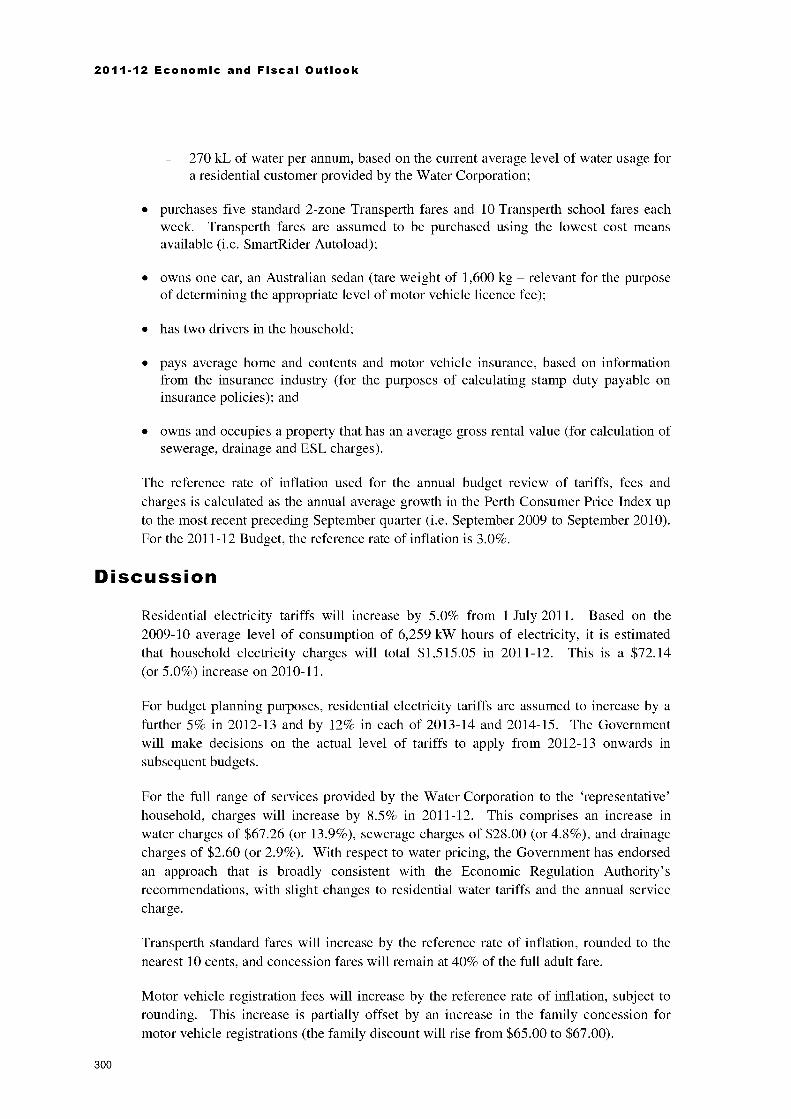
2011-12 Economic and Fiscal Outlook
270 kL of water per annum, based on the current average level of water usage fora residential customer provided by the Water Corporation;
purchases five standard 2-zone Transperth fares and 10 Transperth school fares eachweek. Transperth fares are assumed to be purchased using the lowest cost meansavailable (i.e. Smart Rider Auto load);
owns one car, an Australian sedan (tare weight of 1,600 kg relevant for the purposeof determining the appropriate level of motor vehicle licence fee);
has two drivers in the household;
pays average home and contents and motor vehicle insurance, based on informationfrom the insurance industry (for the purposes of calculating stamp duty payable oninsurance policies); and
owns and occupies a property that has an average gross rental value (for calculation ofsewerage, drainage and ESL charges).
The reference rate of inflation used for the annual budget review of tariffs, fees andcharges is calculated as the annual average growth in the Perth Consumer Price Index upto the most recent preceding September quarter (i.e. September 2009 to September 2010).For the 2011-12 Budget, the reference rate of inflation is 3.0%.
Discussion
Residential electricity tariffs will increase by 5.0% from 1 July 2011. Based on the2009-10 average level of consumption of 6,259 kW hours of electricity, it is estimatedthat household electricity charges will total $1,515.05 in 2011-12. This is a $72.14(or 5.0%) increase on 2010-11.
For budget planning purposes, residential electricity tariffs are assumed to increase by afurther 5% in 2012-13 and by 12% in each of 2013-14 and 2014-15. The Governmentwill make decisions on the actual level of tariffs to apply from 2012-13 onwards insubsequent budgets.
For the full range of services provided by the Water Corporation to the 'representative'household, charges will increase by 8.5% in 2011-12. This comprises an increase inwater charges of $67.26 (or 13.9%), sewerage charges of $28.00 (or 4.8%), and drainagecharges of $2.60 (or 2.9%). With respect to water pricing, the Government has endorsedan approach that is broadly consistent with the Economic Regulation Authority'srecommendations, with slight changes to residential water tariffs and the annual servicecharge.
Transperth standard fares will increase by the reference rate of inflation, rounded to thenearest 10 cents, and concession fares will remain at 40% of the full adult fare.
Motor vehicle registration fees will increase by the reference rate of inflation, subject torounding. This increase is partially offset by an increase in the family concession formotor vehicle registrations (the family discount will rise from $65.00 to $67.00).
300
Appendix 9
It is estimated that the average metropolitan residential ESL will increase by $10.00(or 5.6%), with the actual impact to be confirmed in June 2011 after property valuationdata is finalised. A shift in the ESL impacts may eventuate as a result of movements inthe Perth property market and the triennial revaluation of the metropolitan area byLandgate which will take effect on 1 July 2011.
Fees and charges that remain unchanged in 2011-12 include:
drivers licence fees;
compulsory third party insurance premiums, which remain the lowest in the nation;
motor vehicle recording fees;
Transperth 50 cent student fares; and
stamp duty rates on insurance policies.
Other Charges'
Following are a number of fees and charges that are either new or involve increases inexcess of the reference rate of inflation (3.0%).
Department of Education Services
Various accreditation, registration and re-registration fees for education courses in boththe Higher Education and International Education sectors will increase by between 5.2%to 5.6%. For accreditation of higher education courses, increases will range between$230.00 and $365.00 per course while authorisations of higher education courses willincrease by between $190.00 and $400.00.
Department of Environment and Conservation
Existing fees associated with parks and other land uses will rise by between $1.00 and$3.00 for concession and family entry respectively.
In addition Perth observatory star viewing and day guided tour fees will increase bybetween $1.50 and $3.00, for individual entry while star adoption will increase by $15.00or (5.6%).
Department of Fisheries
Various transaction-based licence, application, annual, authorisation and transfer fees willincrease by between 5.0% and 6.1%.
This section provides commentary on several key changes but does not cover all tariffs, fees and charges increases.
301
2011-12 Economic and Fiscal Outlook
Department of Health
Existing hospital service fees will increase by 6.7% to maintain consistency with theHealth Cost Index for Western Australian Hospital Patients Fees and Charges, with theexception that compensable ventilated dependant and ineligible patient rates are not fullyrecovered.
Department of Mines and Petroleum
Mine Safety and Inspection fees will increase from $0.125 to $0.180 per hour worked, tomaintain cost recovery.
Department of Racing, Gaming and Liquor
A new fee of $140.00 per application will be introduced for the background checks thatthe Department of Racing, Gaming and Liquor seeks from the Western Australia Policefor each party to the application for a protection order under the Liquor Control Act 1988.
Department of Sport and Recreation
New recreational camp fees will be introduced to allow the private sector to conductindustry training and service delivery at the camps on a fee for service basis. In addition,various existing fees will rise to ensure camps are competitively neutral vis a vis privateoperators.
Rottnest Island Authority
Two new fees will be introduced to meet the administrative cost of providing services:
a boat mooring licence transfer fee at $250.00 per transfer; and
a lost mooring sticker replacement fee at $20.00 per replacement.
In addition, the existing aerodrome usage fees 'per landing' are to increase by $16.50 andthe 'annual fee' by $13.00, to reflect the inclusion of the Rottnest Island Admission Feeinto air visitors' Island entry charge.
Western Australian Land Information Authority
To maintain current service levels and recover costs the following fees will increase:
document registration: $135.00 to $160.00;
search activity: $19.00 to $24.00;
production fee: $67.50 to $80.00;
plan lodgement general fee: $213.00 to $227.00; and
plan lodgement lot fee: $58.00 to $62.00.
302
Appendix 9
Western Australian Planning Commission
Various land development application and development fees will rise by between $3.00and $104.10 (10%) to move towards cost recovery.
Western Australian Sports Centre Trust
New sports and recreation equipment and facility hire fees will be introduced on1 July 2011. In addition, a new $2.00 per person entry fee for Water Polo spectators willbe introduced from 1 July 2011.
Western Australia Police
Various existing Police service and administration fees will increase by between3.4% and 8.0% to maintain or move towards cost recovery.
Zoological Parks Authority
Entry fees to Perth Zoo will increase by 5.0% in 2011-12 to keep pace with increasingcosts. The entry fee for an adult will rise from $21.00 to $22.00 from 1 July 2011.
303

2011-12 Economic and Fiscal Outlook
304