
2010 - AnnualReports.com · · 2016-11-07better risk definition of new prospects and leads....
92
ANNUAL REPORT 20 10
Transcript of 2010 - AnnualReports.com · · 2016-11-07better risk definition of new prospects and leads....

AnnuAl report
2010

Karoon’s exploration and appraisal assets in australia, Brazil and peru provide great opportunities and set the stage for a very exciting upcoming financial year.

Karoon Gas Australia Ltd Annual Report 2010 01
03 2009-2010 Highlights Summary
04 Chairman’s Report
07 2009-2010 Operations
12 Directors’ Report
27 Auditor’s Independence Declaration
28 Financial Statements
73 Directors’ Declaration
74 Independent Auditor’s Report
76 Statement of Corporate Governance
84 Additional Securities Exchange Information
86 Glossary of Terms
89 Corporate Directory
Contents

Karoon Gas Australia Ltd Annual Report 201002
It has been a very aCtIve year for Karoon wIth the drIllIng of three wells and aCquIsItIon of three large 3d seIsmIC data sets.

Karoon Gas Australia Ltd Annual Report 2010 03
During the financial year drilling and seismic work continued in the Browse Basin – Western Australia and geotechnical work was conducted in the Santos Basin – Brazil and the Tumbes Basin – Peru. Preparation for future works was also conducted in the Maranon Basin – Peru, and the Bonaparte Basin – Australia.
Australia
Following the Poseidon-1 success in 2009, Poseidon-2 was spudded in October 2009 and this well confirmed the presence of Plover sands in a down-dip location as anticipated. The well also penetrated what appears to be a reservoir quality Montara sand with possible indications of gas indicating a potential new shallower reservoir level. The Plover production test gave a low flow in Poseidon-2.
Concurrent with the drilling of the Poseidon-2 well in the Greater Poseidon structure, the Karoon/ConocoPhillips joint venture acquired a 2,828 square kilometre 3D seismic survey over the whole of the Greater Poseidon structure and surrounds. The seismic acquisition was completed early in 2010, and this, together with the data obtained from the three wells drilled to date, will be used to further evaluate the Poseidon structure and assist in planning further well locations in this structural complex.
Kronos-1 was drilled to 5,329mRT and production tested over the interval 4,999-5,052mRT. The maximum sustainable flow rate obtained during a multi-phase test was 26 million standard cubic feet per day (“mmscf/d”) through a 32/64 inch choke, with flowing well head pressure of 3,900psia.
Kontiki-1 exploration well was completed in October 2009 on a separate play and while logs gave some indications of hydrocarbons only low quality reservoir was penetrated at this location.
During August 2010 Karoon completed a Controlled Source Electro Magnetic (“CSEM”) geophysical survey on AC/P8. This survey was designed to test for indications of hydrocarbons by measuring the electrical resistivity of the subsurface remotely focusing on the leads within the acreage. Interpretation work is ongoing and expected to be completed later in 2010.
Peru
Early in 2010 a 1,500 square kilometre 3D seismic acquisition was conducted over Karoon’s Tumbes Basin Z-38 Block. The acquisition, using the CGG Veritas vessel ‘Geowave Endeavour’ is now being processed and early work on a fast track 3D seismic data set has confirmed the presence of a number of encouraging prospects. Interpretation is expected to be completed later in 2010.
Seabed Drop Cores in Karoon’s Tumbes Basin Z-38 Block were also acquired in July 2010. The seabed samples taken have been found to contain live oil from hydrocarbon seeps thought to migrate to surface though faults in the geological features.
Brazil
In early 2010 Karoon completed a 750 square kilometre wide azimuth 3D seismic acquisition program over its wholly owned Brazilian Blocks. The 3D seismic acquisition was completed by the WesternGeco vessel the ‘Western Patriot’. This seismic acquisition program, which covered all of the defined prospects and leads within the Blocks, is expected, once processed and interpreted, to allow vastly superior definition of structures beside and underneath salt bodies thereby allowing identification and better risk definition of new prospects and leads.
During August 2010, Karoon executed a farm-in Agreement with Petróleo Brasileiro SA (“Petrobras”) to acquire a 20% interest in Blocks BM-S-41/ S-M 1352 (Maruja Prospect) and BM-S-41/ S-M 1354 (Quasi Prospect) located in the offshore Santos Basin, Brazil. Subject to obtaining regulatory approvals in Brazil (including from the Brazilian Petroleum agency), Karoon will earn a 20% interest in both Blocks by funding 35% of a well in the Maruja Prospect, as part of a two well drilling program. Karoon will also pay its equity share of continued work and reimburse Petrobras for sunk costs.
2009-2010 hIghlIghts summary

Karoon Gas Australia Ltd Annual Report 201004
It has been a very active year for Karoon with the drilling of three wells and acquisition of three large 3D seismic data sets. Results from this work have contributed to the legitimacy of the Poseidon field in the Browse Basin and aided Karoon in its preparation for the commencement of drilling in Brazil and Peru in the coming financial year.
Karoon was delighted with the results of the Kronos-1 production test of 26mmscf/d through a 32/64 inch choke. The test indicates another culmination in the Greater Poseidon structure and this information will be crucial in future planning for drilling in 2011.
The Kronos-1 well followed the drilling of Poseidon-2 where a new reservoir was discovered over the target Plover reservoir and the Poseidon structure perimeter was confirmed. The Poseidon-2 test was, however, disappointing from the perspective of providing information about the quality of the reservoir at the Poseidon-2 location.
Karoon is looking forward to the re-commencement of exploration drilling on the Greater Poseidon structure, scheduled to begin in the first half of 2011. The objective of the new program is to explore untested fault block culminations within the Greater Poseidon structure, minimise risks in decision making on the development of the area, obtain information to assist with gas marketing and establish future financing.
Following the drilling of three wells in the past 12 months and commencement of seismic data interpretation, Karoon is satisfied with current results and maintains its most likely contingent resource estimate or P50 of 7TCF, with the potential for resource expansion.
The acquisition of seismic data in Brazil and Peru will provide Karoon with the data needed to prepare for future drilling campaigns. The seismic data has been structured to give Karoon optimal use of existing information, which will enable us to create an excellent geotechnical model of the source rocks, structures, leads and prospects along with direct comparisons to existing fields in the region. As more data is acquired and interpreted, Karoon will build greater knowledge of, and confidence in, the acreage acquired in South America.
Early data cubes from the Brazilian seismic acquisitions have provided further evidence of the prospectivity of Karoon’s South American portfolio. In addition, continued discoveries in the Santos Basin by other companies is encouraging as shallow water regions have become a target area for good sized discoveries (for example, the Piracuca Discovery which has 550 million boe in place, and is just five kilometres from the border of our Blocks). Karoon has now identified six prospects and one lead around three geological structures, all with prospective resource estimates of between 100 and 300 million boe in place.
Peruvian 3D seismic has provided additional clarity to the existing 2D data set acquired in early 2009. Karoon has further identified prospects and direct hydrocarbon indicators are present in the processed seismic. The work completed over this financial year provides Karoon with confidence in the prospectivity of its Tumbes Basin assets.
The Way ForwardDespite these positive results and strategic use of shareholder capital to conduct drilling and seismic acquisitions, Karoon, like all companies, has suffered at the hands of a turbulent year with volatile markets and fearful investors. While I was encouraged to see many new shareholders of all sizes entering the register, Karoon has traded below its previous high market capitalisation. This provided an opportunity for those with capital to invest and lament from others who had invested at higher prices. The Directors and management of Karoon are working diligently to capitalise on the Company’s prospective value and prepare the Company for its significant global drilling campaign. The Company’s goal is to grow into a serious LNG player and global production company. I am confident the work completed in 2009-2010 will put Karoon in a commanding position and provide for significant growth in the upcoming financial years.
Karoon’s exploration and appraisal assets in Australia, Brazil and Peru provide great opportunities and set the stage for a very exciting upcoming financial year.
On behalf of the Board, I would like to thank all Karoon shareholders for their continued support.
Mr Robert HoskingExecutive Chairman
ChaIrman’s report

Karoon Gas Australia Ltd Annual Report 2010 05
the suCCess of poseIdon and Kronos wIll help defIne the sIze and produCtIve CapaCIty of the greater poseIdon struCture and form the basIs for any future development deCIsIon.

Karoon Gas Australia Ltd Annual Report 201006
ChaIrman’s report conTInueD
Mar
ket
cap
ital
isat
ion
$ m
illio
n
150
600
300
1,200
2,400
4,800
9,600
19,200
38,400
Woo
dsid
e P
etro
leum
Ltd
Orig
in E
nerg
y Lt
d
San
tos
Ltd
Oil
Sea
rch
Ltd
Arr
ow E
nerg
y Lt
d
Kar
oon
AW
E L
imite
d
Bea
ch E
nerg
y Lt
d
Eas
tern
Sta
r G
as L
td
New
Zea
land
Oil
& G
as L
td
Hor
izon
Oil
Ltd
Bow
Ene
rgy
Ltd
Mol
opo
Ene
rgy
Ltd
Nex
us E
nerg
y Lt
d
Car
narv
on P
etro
leum
Ltd
RO
C O
il C
ompa
ny L
td
Aur
ora
Oil
& G
as L
td
Ant
ares
Ene
rgy
Ltd
Cue
Ene
rgy
Res
ourc
es L
td
Nid
o P
etro
leum
Ltd
39.73%
28.86%
8.67%
22.74%
Mar
ket
cap
ital
isat
ion
$ m
illio
n
150
600
300
1,200
2,400
4,800
9,600
19,200
38,400
Woo
dsid
e P
etro
leum
Ltd
Orig
in E
nerg
y Lt
d
San
tos
Ltd
Oil
Sea
rch
Ltd
Arr
ow E
nerg
y Lt
d
Kar
oon
AW
E L
imite
d
Bea
ch E
nerg
y Lt
d
Eas
tern
Sta
r G
as L
td
New
Zea
land
Oil
& G
as L
td
Hor
izon
Oil
Ltd
Bow
Ene
rgy
Ltd
Mol
opo
Ene
rgy
Ltd
Nex
us E
nerg
y Lt
d
Car
narv
on P
etro
leum
Ltd
RO
C O
il C
ompa
ny L
td
Aur
ora
Oil
& G
as L
td
Ant
ares
Ene
rgy
Ltd
Cue
Ene
rgy
Res
ourc
es L
td
Nid
o P
etro
leum
Ltd
Institutional investors
Private investors outside top 50
Directors of KAR
Private investors inside top 50
39.73
28.86
8.67
22.74
Institutional investors
Private investors outside top 50
Directors of KAR
Private investors inside top 50
Mar
ket
cap
ital
isat
ion
$ m
illio
n
150
600
300
1,200
2,400
4,800
9,600
19,200
38,400
Woo
dsid
e P
etro
leum
Ltd
Orig
in E
nerg
y Lt
d
San
tos
Ltd
Oil
Sea
rch
Ltd
Arr
ow E
nerg
y Lt
d
Kar
oon
AW
E L
imite
d
Bea
ch E
nerg
y Lt
d
Eas
tern
Sta
r G
as L
td
New
Zea
land
Oil
& G
as L
td
Hor
izon
Oil
Ltd
Bow
Ene
rgy
Ltd
Mol
opo
Ene
rgy
Ltd
Nex
us E
nerg
y Lt
d
Car
narv
on P
etro
leum
Ltd
RO
C O
il C
ompa
ny L
td
Aur
ora
Oil
& G
as L
td
Ant
ares
Ene
rgy
Ltd
Cue
Ene
rgy
Res
ourc
es L
td
Nid
o P
etro
leum
Ltd
39.73%
28.86%
8.67%
22.74%
Mar
ket
cap
ital
isat
ion
$ m
illio
n
150
600
300
1,200
2,400
4,800
9,600
19,200
38,400
Woo
dsid
e P
etro
leum
Ltd
Orig
in E
nerg
y Lt
d
San
tos
Ltd
Oil
Sea
rch
Ltd
Arr
ow E
nerg
y Lt
d
Kar
oon
AW
E L
imite
d
Bea
ch E
nerg
y Lt
d
Eas
tern
Sta
r G
as L
td
New
Zea
land
Oil
& G
as L
td
Hor
izon
Oil
Ltd
Bow
Ene
rgy
Ltd
Mol
opo
Ene
rgy
Ltd
Nex
us E
nerg
y Lt
d
Car
narv
on P
etro
leum
Ltd
RO
C O
il C
ompa
ny L
td
Aur
ora
Oil
& G
as L
td
Ant
ares
Ene
rgy
Ltd
Cue
Ene
rgy
Res
ourc
es L
td
Nid
o P
etro
leum
Ltd
Institutional investors
Private investors outside top 50
Directors of KAR
Private investors inside top 50
39.73
28.86
8.67
22.74
Institutional investors
Private investors outside top 50
Directors of KAR
Private investors inside top 50
Top 20 Australian Oil and Gas Companies by Market Capitalisation as at 30 June 2010
Karoon Register by Investor Type as at 7 July 2010

Karoon Gas Australia Ltd Annual Report 2010 07
2009-2010 operatIonsFoR THe FInAncIAL YeAR enDeD 30 June 2010
Australia
Browse Basin Permits WA-314-P, WA-315-P and WA-398-P
Karoon secured its Browse Basin permits, located 350km offshore from the north western Australian coastline during 2005. Including the Poseidon and Kronos discoveries, the Browse Basin cumulatively has the potential to contain up to six billion barrels of oil equivalent in condensate and gas. Together with our joint venture partner, ConocoPhillips, we are in the exploration phase of our Browse development with more drilling due to commence in 2011.
During the financial year, Karoon continued drilling in the Browse Basin with the drilling of the Kontiki-1 exploration well, the completion of the drilling, coring and testing of the Poseidon-2 exploration well, and the drilling, coring and testing of the Kronos-1 exploration well. These wells form part of a multiple exploration well program, which is designed to test prospects within the WA-314-P, WA-315-P and WA-315-P exploration permits.
The success of Poseidon and Kronos will help define the size and productive capacity of the Greater Poseidon structure and form the basis for any future development decision. The exploration program included wells designed to test the down dip extremities of the field, as was the case with Poseidon-2, and to test a structural high in the south with Kronos-1. The short-term forward program involves the completion of the processing and interpretation of the 2,828 square kilometre Poseidon 3D seismic survey, undertaken late in 2009 over the Greater Poseidon structure and surrounding prospective areas.
The new seismic data will form the basis for the planning of the next drilling program, which is expected to include a minimum of four wells with options for additional wells to commence in the first half of 2011.
The highlight of the financial year was the completion of the final exploration well in the first phase drilling campaign, Kronos-1. The Kronos-1 well was located on the south western high of the Greater Poseidon structure. Kronos-1 was spudded during February 2010, 15 kilometres to the south west of the Poseidon-1 exploration well and was drilled to 5,329mRT. This well was designed to test and evaluate the Plover reservoirs located high on a separate culmination of the Greater Poseidon structure. A key Kronos-1 objective was to define potential commercial production rates and gas composition on the crest of the Greater Poseidon structure.
Kronos-1 was production tested over the interval 4,999-5,052mRT. The maximum sustainable flow rate attained during a multi-phase test was 26mmscf/d through a 32/64 inch choke, with flowing well head pressure of 3,900psia. Significantly, the flow rate achieved was downhole equipment constrained. A condensate-gas ratio of 9.5bbl/mmscf was measured at the surface, along with a 10% carbon dioxide content taken from the gas flow on a volume basis.
Ichthys
Poseidon-1 gas discovery
Poseidon-2 exploration well
Kronos-1 exploration well
Kontiki-1 exploration well
Rubicon
Torosa
100km0
Karoon Permit WA-314-P
Karoon Permit WA-315-P
Karoon Permit WA-398-P
Australia
Location: Browse Basin, close to Torosa, Brecknock and Ichthys gas/condensate fields.
Potential: Poseidon discovery with contingent resource range of 3 TCF at P90, 7TCF at P50 and 15TCF at P10.
Three additional prospect/leads with a prospective resource range of 2-7TCF and 20-400mmbbls of condensate and LPG each.
Interest: 40% equity WA-314-P, WA-315-P and WA-398-P.
Work Program: 3D seismic and drilling program to continue through calendar years 2010 and 2011.

Karoon Gas Australia Ltd Annual Report 201008
2009-2010 operatIons conTInueD
FoR THe FInAncIAL YeAR enDeD 30 June 2010
Based on the analysis of the well test data, Karoon believes that future possible production wells drilled adjacent to the Kronos-1 location could have the potential to flow at commercial rates well in excess of 100mmscf/d.
As planned, Kronos-1 was plugged and abandoned during early June 2010 following final well evaluation and production testing. The Kronos-1 exploration well also fulfilled one of the primary term well commitments for WA-398-P.
Early in the financial year, the Kontiki-1 exploration well was also drilled by the Transocean ‘Legend’. The Kontiki-1 exploration well in exploration permit WA-314-P was drilled to a total depth of 4,600mRT. Karoon’s interpretation is that the well penetrated approximately 40 metres of interbedded sands with complex lithologies over a gross interval of approximately 460 metres. Interpretation of mudlogging and petrophysical data indicated some possible gas saturation in poorly developed sands. This Kontiki-1 exploration well provided a greater understanding of the geology in WA-314-P and was plugged and abandoned.
The Poseidon-2 exploration well was spudded during October 2009 with the objective to test the extent, presence and quality of Plover reservoirs down-dip from the Poseidon-1 exploration well where the Plover formation was interpreted to thicken. Poseidon-2 was located in WA-398-P, on the southern flank of a north east trending structural high of the Greater Poseidon structure.
Prior to intersecting the Plover formation, Poseidon-2 penetrated a 20 metre gross hydrocarbon bearing sand interval in the Montara Formation not seen in Poseidon-1. This interval offers the potential for significant additional reserves and will be evaluated during the 2011 and 2012 drilling campaign.
After an initial Plover formation level Drill Stem Test (“DST”) encountered technical difficulties, a subsequent DST was completed with a flow rate of 850 standard cubic feet per day on a 1 inch choke. Liquids volumes were not measured due to the low gas rates and a gas-liquids separator was not used.
Overall, the Poseidon-2 exploration well provided much needed data about the Greater Poseidon structure. Key highlights of Poseidon-2 were the discovery of a potential gas reservoir in the Montara sands above the targeted Plover formations, the penetration of three Plover formation sands as seen in Poseidon-1 and overall the confirmation of movable gas in this down-dip location on the perimeter of the Poseidon structure as previously mapped.
Poseidon-2 was drilled by the Transocean ‘Legend’ to a total depth of 5,356mRT and was plugged and abandoned as planned during February 2010. The Poseidon-2 exploration well fulfilled one of the primary term well commitments in WA-398-P.
During December 2009, subsequent to the completion of Poseidon-2, ConocoPhillips exercised its right to acquire an additional 9% equity in exploration permits WA-314-P and WA-315-P. To fulfil the exercise of the option, ConocoPhillips will pay 80% of the next US$125 million in joint venture expenditure within exploration permits WA-314-P and WA-315-P.
Well data from the three wells to-date drilled over the Greater Poseidon structure is being analysed, integrating the interpretation of the new Poseidon 3D seismic data that is currently being processed. From this, further well locations will be identified in preparation for a second phase drilling program planned in the first half of 2011. That drilling program will run for at least one year. Karoon’s assessment of the contingent and prospective resources of the Browse Basin permits will be independently verified when a full analysis of the drilled wells and the recent 3D seismic is completed.
Permit interests of the participants in WA-314-P, WA-315-P and WA-398-P are:
Karoon Gas (Browse Basin) Pty Ltd 40.00%ConocoPhillips (Browse Basin) Pty Ltd (Operator) 60.00%
Karoon Gas Australia Ltd Annual Report 2010 09
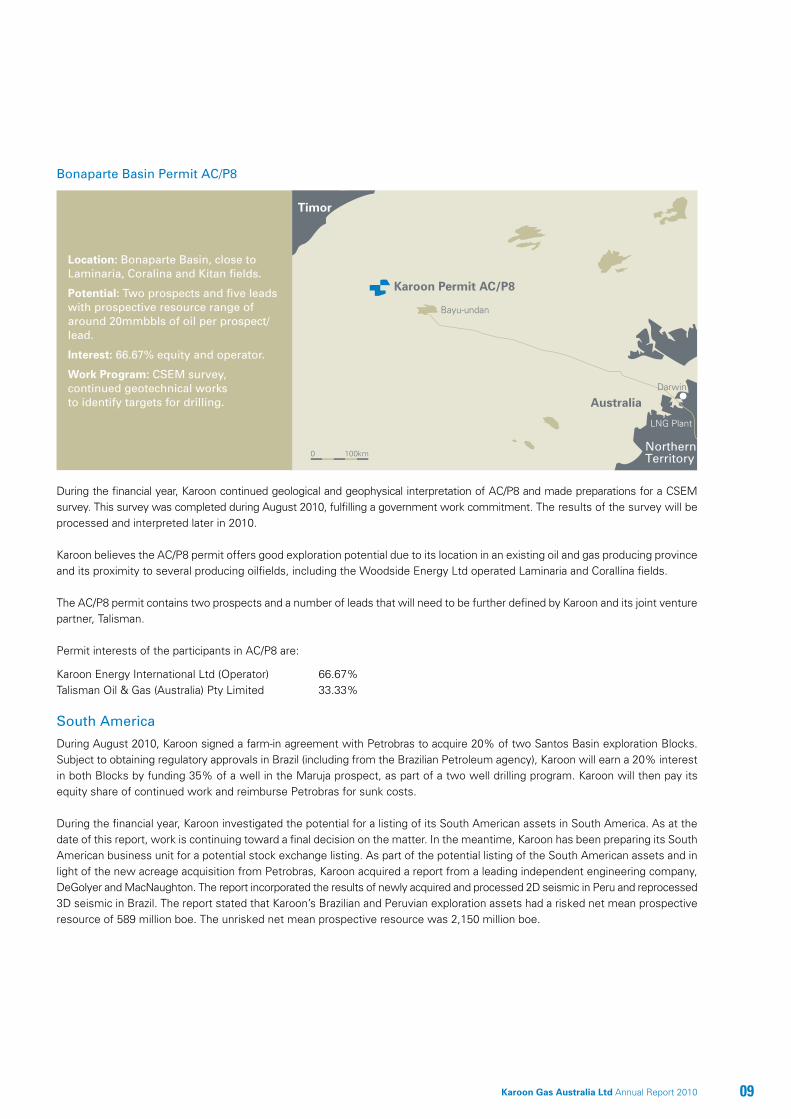
Bonaparte Basin Permit AC/P8
During the financial year, Karoon continued geological and geophysical interpretation of AC/P8 and made preparations for a CSEM survey. This survey was completed during August 2010, fulfilling a government work commitment. The results of the survey will be processed and interpreted later in 2010.
Karoon believes the AC/P8 permit offers good exploration potential due to its location in an existing oil and gas producing province and its proximity to several producing oilfields, including the Woodside Energy Ltd operated Laminaria and Corallina fields.
The AC/P8 permit contains two prospects and a number of leads that will need to be further defined by Karoon and its joint venture partner, Talisman.
Permit interests of the participants in AC/P8 are:
Karoon Energy International Ltd (Operator) 66.67%Talisman Oil & Gas (Australia) Pty Limited 33.33% South America
During August 2010, Karoon signed a farm-in agreement with Petrobras to acquire 20% of two Santos Basin exploration Blocks. Subject to obtaining regulatory approvals in Brazil (including from the Brazilian Petroleum agency), Karoon will earn a 20% interest in both Blocks by funding 35% of a well in the Maruja prospect, as part of a two well drilling program. Karoon will then pay its equity share of continued work and reimburse Petrobras for sunk costs.
During the financial year, Karoon investigated the potential for a listing of its South American assets in South America. As at the date of this report, work is continuing toward a final decision on the matter. In the meantime, Karoon has been preparing its South American business unit for a potential stock exchange listing. As part of the potential listing of the South American assets and in light of the new acreage acquisition from Petrobras, Karoon acquired a report from a leading independent engineering company, DeGolyer and MacNaughton. The report incorporated the results of newly acquired and processed 2D seismic in Peru and reprocessed 3D seismic in Brazil. The report stated that Karoon’s Brazilian and Peruvian exploration assets had a risked net mean prospective resource of 589 million boe. The unrisked net mean prospective resource was 2,150 million boe.
Bayu-undan
100km0
Karoon Permit AC/P8
Timor
Darwin
Australia
NorthernTerritory
LNG Plant
Location: Bonaparte Basin, close to Laminaria, Coralina and Kitan fields.
Potential: Two prospects and five leads with prospective resource range of around 20mmbbls of oil per prospect/lead.
Interest: 66.67% equity and operator.
Work Program: CSEM survey, continued geotechnical works to identify targets for drilling.

Karoon Gas Australia Ltd Annual Report 201010
2009-2010 operatIons conTInueD
FoR THe FInAncIAL YeAR enDeD 30 June 2010
Brazil Blocks 1037, 1101, 1102, 1165 and 1166
During March 2008, Karoon was awarded offshore exploration Blocks 1037, 1101, 1102, 1165 and 1166. During August 2010 and as outlined above, Karoon agreed to acquire from Petrobras an interest in Blocks 1352 and 1354.
Karoon considers its Brazilian Blocks highly prospective and interpretation work to date has indicated the presence of several leads/prospects with a total DeGolyer and MacNaughton certified risked prospective resource estimate of 456 million barrels of oil and associated gas. There is currently one prospect, Pico de Jaragua, that is drill ready, and as work progresses it is expected that at least two more of these leads/prospects will mature to be drillable. Karoon’s economic assessment of its Blocks indicate that this area could be rapidly brought into production due to the relatively shallow water depths and proximity to existing oil and gas infrastructure.
The Santos Basin Blocks are 220 kilometres off the coast from the Santa Catarina region of Brazil, just south of Rio de Janeiro, which has recently yielded multiple oil discoveries. Recent discoveries in the Santos Basin include the Tupi and Carioca oil fields, the Newton oil discovery, the Caravela and Coral fields and the Merluza field.
Most recently Petrobras announced the discovery of a 550 million boe in place resource at the Piracuca field, just five kilometres to the north-east of Karoon’s Blocks. Karoon is currently evaluating the technical information available from this discovery.
During the financial year, Karoon completed a 750 square kilometre wide azimuth 3D seismic acquisition program. The 3D seismic acquisition was completed by WesternGeco. This seismic acquisition program, which covered all of the defined prospects and leads within the Blocks, is expected, once processed and interpreted, to allow vastly superior definition of structures beside and underneath salt bodies thereby allowing identification and better risk definition of new prospects and leads. To the best of Karoon’s knowledge, this was the first application of a wide azimuth 3D seismic acquisition in Brazil. WesternGeco has commenced processing of the survey, with results expected later in 2010. This seismic will fulfil the first period work program commitments for the Blocks and prepares Karoon for its future drilling campaign.
Initial research and planning for a drilling program also commenced during the financial year, with the environmental and regulatory approval process for future drilling operations underway. Drilling is expected to commence in late 2011 or early 2012.
Karoon also continued its geotechnical work in its Santos Basin Blocks. Recent discoveries in the area immediately around Karoon’s Blocks provided Karoon with additional information assisting with the delineation of prospects and leads.
Karoon is a 100% interest holder in Santos Basin Blocks 1037, 1101, 1102, 1165 and 1166.
Block interests of the participants in Santos Basin Blocks 1352 and 1354 are (subject to regulatory approvals):
Petroleo Brasileiro SA (Operator) 80%Karoon Petróleo & Gas Ltda 20%
50km0
Sao Paulo
UruguáMexilhão
Merluza
Piracuoá
Tubarão
CaravelaCaravela Sul
TupiCarioca
Brazil
Karoon Brazil Blocks
Location: Santos Basin, on trend with Piracuca, Merluza and Caravela fields.
Potential: Six prospects and one lead with a total DeGolyer and MacNaughton certified unrisked net mean prospective resource potential of 1,368 million boe.
Interest: 100% equity and operator.
Work Program: 3D seismic acquisition during the 2010 financial year followed by drilling during the 2012 financial year.

Karoon Gas Australia Ltd Annual Report 2010 11
Peru Block Z-38
During 2008, Karoon signed a farm-in agreement to acquire an initial 20% interest in Block Z-38. Block Z-38 is located in the Tumbes Basin, offshore in the northwest of Peru. It is a region that is experiencing renewed activity after a series of successful exploration programs by BPZ Energy, the operator of Z1 Block which is adjacent to Block Z-38. The Talara Basin, to the south of the Tumbes Basin, has produced more than one billion barrels of oil.
Subject to obtaining relevant regulatory approvals and completion and funding of second and third year work commitments, including drilling two exploration wells, Karoon’s ownership interest will increase to 75%.
Environmental impact assessment preparation and related approval applications commenced during the financial year for future drilling campaigns. Drilling in the Block is expected to commence during the 2012 financial year.
Interpretation of new 2D seismic data acquired earlier during 2009 was completed and subsequently a new 1,500 square kilometre 3D seismic acquisition program was completed.
Karoon contracted CGG Veritas for the use of the ‘M/V Geowave Endeavour’ for the 3D seismic survey. CGG Veritas was also contracted for the processing of the data. Processing will continue through to the end of 2010. Early work on a fast track 3D seismic data set has confirmed the presence of a number of encouraging leads. Prospect and lead evaluation work is ongoing and needs to be completed before drillable prospects can be firmed up.
Karoon also began preparations for carrying out a sea bed coring program, in order to investigate the presence and characteristics of any hydrocarbon seeps. The survey was successfully completed in July 2010 and the results are expected in the first quarter of 2011.
After completion of third year work commitments and subject to regulatory approvals, equity interests in Block Z-38 will be:
KEI (Peru Z38) Pty Ltd, Sucursal del Peru (Operator) 75.00%*Vietnam American Exploration Company LLC 25.00%
* Equity interests stated are based on the post farm-in ownership.
Peru Block 144Block 144 in Peru is located within the onshore Maranon Basin, on the eastern side of the Andes mountain range. The Block was awarded during April 2009.
Karoon continued its geotechnical, social and environmental work in the Block and has now completed the reprocessing of 1,000 kilometres of existing 2D seismic data. Geophysical interpretation using the reprocessed data has identified the presence of a four way dip closed structure in the southern portion of the Block. This prospect is considered substantial with a prospective resource potential of 120 million barrels. The prospect is located in proximity to a navigable river and an underutilised oil export pipeline from the Maranon Basin to the Pacific Ocean, offering potential lower cost development opportunities. Karoon has a 100% equity interest in Block 144.
Machala
Talara
Tumbes
Peru
Ecuador
Corvina
Piedra Redonda
Zapotal
Albacora
Armistad
CarrizoLobitos
Pena Negra
Organos
Block area4,875 sq.km
Karoon Block Z-38
50km0
Location: Offshore Peru close to existing production fields and infrastructure.
Potential: Two main leads with a prospective resource range in the hundreds of mmbls of oil and/or multi-TCF of gas range.
Interest: 75% equity and operator.
Work Program: 3D seismic processing and interpretation during the 2011 financial year followed by drilling during the 2012 financial year.

Karoon Gas Australia Ltd Annual Report 201012
Directors’ report
The Board of Directors submits its Directors’ Report on Karoon Gas Australia Ltd and its subsidiaries (the “Group”) for the financial year ended 30 June 2010 (the “financial year”).
Board of DirectorsUnder the Company’s Constitution, the minimum number of Directors that may comprise the Board of Directors is currently three and the maximum number of Directors is 10. Directors are elected and re-elected at annual general meetings of the Company.
The names of the Directors of Karoon Gas Australia Ltd (the “Company”) during the financial year and up to the date of this Directors’ Report are set out below:
Mr Robert M HoskingExecutive ChairmanAppointed 11 November 2003.
Robert is the founding Director of the Company and has more than 30 years of commercial experience in the administration of several companies. Robert has been involved in the oil and gas industry for 14 years and was the founding Director/Shareholder of Nexus Energy Limited.
Robert also has a background of more than 17 years commercial experience in the steel industry. He jointly owned and managed businesses involved in the transglobal sourcing, shipping and distribution of steel-related products, with particular expertise gained in Europe and the Asia/ Pacific Rim.
Member of the Audit Committee.
Mr Mark A Smith Dip. App. Geol, Bsc. (Geology)
Executive Director and Exploration ManagerAppointed 20 November 2003.
Mark has 30 years experience as a geologist and exploration manager in petroleum exploration and development in Australia, South East Asia and North America. The bulk of this experience was gained while working with BHP Petroleum. Mark has been directly involved with 11 economic oil and gas discoveries.
Mark has geosciences skills in regional basin and tectonic studies, petroleum systems fairway assessments, prospect evaluations, risking and volumetrics, fault seal prediction and well-site operations. His management skills cover general and human resources management, acreage evaluation and acquisition projects, farm-ins/farm-outs, well site operations management and management of onshore and offshore drilling operations.
Member of the Remuneration Committee.
Mr Geoff Atkins FIE Aust. RMIT Dip. Civ Eng.
Independent Non-Executive DirectorAppointed 22 February 2005.
Geoff has over 40 years experience in investigation, planning, design, documentation and project management of numerous significant port, harbour and maritime projects, including container terminals, LNG jetties, heavy lift wharves, cement, coal, bauxite, iron ore and other bulk terminals and naval bases.
Geoff has gained substantial overseas experience completing marine projects in Indonesia, Malaysia, Thailand, Vietnam, Sri Lanka, India, South Africa, Namibia, New Zealand and the United Kingdom. LNG, oil, gas, bulk ports and other large maritime infrastructure projects that Geoff has been involved in have included the design of Woodside’s LNG Jetty, tender design of ConocoPhillips Darwin LNG Jetty and concept designs for the Sunrise LNG Jetty. Geoff has also been involved in investigations of proposed LNG marine terminals in Taiwan, Iran and Israel for BHP Petroleum and the West Kingfish and Cobia oil drilling platforms for ESSO/BHP in Bass Strait.
Chairman of the Audit Committee. Chairman of the Remuneration

Karoon Gas Australia Ltd Annual Report 2010 13
Committee.Mr Stephen Power B. Juris LLB
Non-Executive DirectorAppointed 28 June 2005.
Stephen is a commercial lawyer who has spent over 20 years providing advice to participants in the resources industry in Australia and overseas. Stephen is a partner in a boutique law firm that provides commercial advice to its predominantly listed client base. Stephen has extensive experience in all facets of commercial and resources law, including the oil and gas sector, both in an Australian and International context. Stephen regularly advises on farm-in arrangements, joint ventures, production agreements and other facets of resources-related commercial transactions. In addition to Stephen’s experience in the resources area, Stephen has a significant practice advising on capital raisings, including the drafting of prospectuses, underwritings and related work, listing advice and the planning and implementation of mergers and acquisitions.
Member of the Audit Committee and Remuneration Committee.
Company SecretaryMr Scott Hosking B. Commerce
Appointed as Company Secretary of the Company on 10 March 2006.
Scott has a significant international financial and commercial management background with expertise in equity capital raisings. He has been involved with several commercial ventures over the past 12 years with experience in international trade, finance and internal corporate management. He has previously held support positions to Company Secretaries of listed companies and was involved in the listing of Karoon Gas Australia Ltd.

Karoon Gas Australia Ltd Annual Report 201014
dIreCtors’ report conTInueD
Meetings
The number of Directors’ meetings (including meetings of committees of Directors) and number of meetings attended by each Director of the Company during the financial year were:
Audit Remuneration Board Committee Committee Director Meetings Meetings Meetings
A B A B A B
Mr Robert Hosking 7 7 4 3 - -Mr Mark Smith 7 7 - - 1 1Mr Geoff Atkins 7 7 4 4 1 1Mr Stephen Power 7 7 4 4 1 1
A. The number of meetings held during the time the Director held office during the financial year.
B. The number of meetings attended during the time the Director held office during the financial year.
Directors’ Interests in the Company’s Shares and Options
As at the date of this Directors’ Report, the Directors held the following number of ordinary shares and options over unissued ordinary shares in the Company as follows:
Director Ordinary Shares, Fully Paid Unlisted Other Share Options
Mr Robert Hosking 12,102,320 1,750,000Mr Mark Smith 2,572,037 1,500,000Mr Geoff Atkins 412,500 1,000,000Mr Stephen Power 300,000 1,000,000
Principal Activities
The principal activity of the Company during the course of the financial year continued to be investment in hydrocarbon exploration and evaluation in Australia, Brazil and Peru.
Significant Changes in State of Affairs
During the financial year, the Company successfully completed $34,104,259 in new equity capital raisings:
• 3,514,367ordinaryshareswereissuedduringJuly2009toshareholdersviaaSharePurchasePlanat$6.70perordinarysharethat raised gross proceeds of $23,546,259; and
• 2,730,000unlistedoptionswereexercisedduringthefinancialyearthatraisedgrossproceedsof$10,558,000.
Results
The consolidated result of the Group for the financial year was a loss after income tax of $14,893,839 (2009: profit after income tax of $4,452,766).
Financial Position
The net assets of the Group increased by $27,044,732 from 30 June 2009 to $361,703,571 during the financial year. This net increase was largely due to the following factor:
• Grossproceedsof$34,104,259raisedfromtheissueoffullypaidordinarysharesintheCompany.
The Group’s working capital, being current assets less current liabilities, has decreased from $223,326,426 as at 30 June 2009 to $91,010,773 as at 30 June 2010. Review of Operations
Information on the operations of the Group is set out in the 2009-2010 Operations review on pages 7 to 11 of this Annual Report.

Karoon Gas Australia Ltd Annual Report 2010 15
Future Developments, Business Strategies and Prospects, and Expected Results of Operations
Other than the matters included in this Directors’ Report or elsewhere in the Annual Report, future developments, business strategies and prospects of the Company and the expected results of those operations have not been disclosed as the Directors believe that their inclusion would most likely result in unreasonable prejudice to the Company and/or the Group.
Dividends
No dividend has been paid or declared by the Company to shareholders since the end of the previous financial year. The Company intends to pay future dividends during financial periods when appropriate to do so.
Options
As at the date of this Directors’ Report, the details of options over unissued ordinary shares in the Company were as follows:
Type of Option Grant Date Date of ExpiryExercise Price
Per OptionNumber Under
Option
ESOP options 27 November 2007 31 October 2010 $2.95 205,000
Other share options 27 November 2007 31 October 2010 $2.95 500,000
Other share options 22 January 2008 31 October 2010 $2.95 500,000
Other share options 27 November 2008 30 April 2011 $4.00 250,000
Other share options 1 August 2008 30 April 2011 $4.50 750,000
Other share options 1 August 2008 30 April 2011 $5.00 750,000
ESOP options 3 November 2008 30 October 2010 $4.00 90,000
ESOP options 3 November 2008 30 April 2011 $5.00 905,000
Other share options 27 November 2008 30 April 2011 $4.50 750,000
Other share options 27 November 2008 30 April 2011 $5.00 750,000
ESOP options 28 November 2008 30 April 2011 $5.00 100,000
ESOP options 29 June 2009 30 October 2011 $6.84 200,000
Other share options 23 November 2009 12 November 2013 $14.07 1,000,000
ESOP options 23 November 2009 12 November 2013 $14.07 530,000
ESOP options 9 December 2009 18 November 2013 $11.50 1,700,000
ESOP options 25 March 2010 18 November 2013 $11.50 100,000
9,080,000
During the financial year, the following ordinary shares of the Company were issued on the exercise of options granted. No amounts are unpaid on any of the ordinary shares issued:
Type of Option Grant DateAmount Paid Per
Ordinary ShareNumber of Ordinary
Shares IssuedOther share options 1 August 2008 $4.00 750,000
Other share options 27 November 2008 $4.00 500,000
ESOP options 27 November 2007 $2.95 440,000
ESOP options 20 August 2008 $4.00 100,000
ESOP options 3 November 2008 $4.00 640,000
ESOP options 28 November 2008 $4.00 200,000
ESOP options 28 November 2008 $5.00 100,000
2,730,000
No fully paid ordinary shares have been issued since 30 June 2010 as a result of the exercise of Employee Share Option Plan (“ESOP”) options or other share options since that date.

Karoon Gas Australia Ltd Annual Report 201016
dIreCtors’ report conTInueD
For details of options issued to Directors and other key management personnel as remuneration, refer to the Remuneration Report in this Directors’ Report.
Information relating to the Company’s ESOP and other share options, including details of options granted, exercised, cancelled, forfeited and expired during the financial year and options outstanding at the end of the financial year, is set out in Note 28 of the consolidated financial statements.
No option holder has any right under the options to participate in any other share issue of the Company or any other entity.
Indemnification of Directors and Officers
An indemnity agreement has been entered into between an insurance company and the Directors of the Company named earlier in this Directors’ Report and with the full time Executive Officers, Directors and Secretaries of all Australian subsidiaries. Under this agreement, the insurance company has agreed to indemnify these Directors, full time Executive Officers, Directors and Secretaries against any claim or for any expenses or costs which may arise as a result of work performed in their respective capacities. The contract of insurance prohibits disclosure of the nature of the liability and the amount of the premium.
As approved by shareholders at the Annual General Meeting held on 12 November 2009, the Company will continue to pay those Director insurance premiums for a period of 10 years following termination of their directorships of the Company and will provide each Director with access, upon ceasing for any reason to be a Director of the Company and for a period of 10 years following cessation, to any Company records which are either prepared or provided to the Director during the time period they were a Director of the Company.
Proceedings on Behalf of the Company
No person has applied to the Court under Section 237 of the Corporations Act 2001 for leave to bring proceedings on behalf of the Company, or to intervene in any proceedings to which the Company is a party, for the purpose of taking responsibility on behalf of the Company for all or part of those proceedings.
The Company was not a party to any such proceeding during the financial year.
Corporate Governance
In recognising the need for the highest standards of corporate governance and accountability, the Directors support the principles of good corporate governance. The Company’s Statement of Corporate Governance is set out on pages 76 to 83 of this Annual Report.
Environmental Regulation
The Company and its subsidiaries are subject to a range of relevant Commonwealth, State and International environmental laws including:
• Petroleum(SubmergedLands)Act1967(Cth);
• Petroleum(SubmergedLands)(ManagementofEnvironment)Regulations1999(Cth);
• EnvironmentProtectionandBiodiversityConservationAct1999(Cth);
• TheAboriginalandTorresStraitIslanderHeritageandProtectionAct1994(Cth);
• TheBrazilianFederalConstitution(Brazil);
• TheBrazilianPetroleumLaw(LawNo.9,478,ofAugust6,1997)(Brazil);
• TheBrazilianCivilCode(LawNo.10,406,ofJanuary19,2002)(Brazil);
• TheBrazilianCorporationsLaw(LawNo.6,404,ofDecember15,1976)(Brazil);
• TheBrazilianBidLaw(LawNo.8,666,ofJune21,1993)(Brazil);
• TheBrazilianFederalEnvironmentalLaw(LawNo.6,938,ofAugust31,1981)(Brazil);
• National–MinistryofEnergyandMines–SupremeDecreeNo.042-2005-EM–UniqueComprisedTextoftheOrganicLawofHydrocarbons (which text of the law was approved by Law No. 26221) (Peru);
• National–CongressoftheRepublic–LawNo.28611–GeneralEnvironmentalLaw(Peru);

Karoon Gas Australia Ltd Annual Report 2010 17
• National–MinistryofEnergyandMines–SupremeDecreeNo.015-2006-EM–RegulationsforEnvironmentalProtectioninHydrocarbon Activities (Peru);
• National–MinistryofEnergyandMines–SupremeDecreeNo.043-2007-EM–SafetyRulesforHydrocarbonActivities(Peru);
• National–MinistryofEnergyandMines–SupremeDecreeNo.032-2004-EMRulesofHydrocarbonExplorationandExploitationActivities (Peru); and
• National–MinistryofEnergyandMines–SupremeDecreeNo.052-93-EM–SafetyRulesforHydrocarbonStorage(Peru).
The Board of Directors believes the Company has adequate systems in place for managing its environmental obligations and is not aware of any breach of those environmental obligations as they apply to the Company and/or Group. No circumstances arose during the financial year that required an incident to be reported by the Company and/or Group under environmental legislation.
Greenhouse Gas and Energy Data Reporting Requirements
A Carbon Pollution Reduction Scheme (“CPRS”), or similar regime, has not yet been introduced by the Australian Federal Government. However, greenhouse gas emissions, energy consumption and energy production reporting obligations under the National Greenhouse and Energy Reporting Act 2007 (“NGER Act”) apply.
The Group was not required to register and report greenhouse gas emissions, energy consumption and energy production under the NGER Act for this financial year as it did not meet any of the relevant thresholds from activities conducted within the specified Australian territory between 1 July 2009 and 30 June 2010.
Similarly, the Group’s current exploration, as the operator of AC/P8, is not expected to result in it meeting one of the thresholds under the NGER Act for the next reporting period and, therefore, it is not expected that it will be required to register and report under the NGER Act for the next reporting period.
However, the Company is in the process of assessing a cost effective, reliable and environmentally efficient method of dealing with its future greenhouse gas emissions, energy consumption and energy production reporting obligations.
Non-Audit Services
The Company may decide to engage its external auditor, PricewaterhouseCoopers, on assignments additional to its statutory audit duties where the external auditor’s expertise and experience with the Company and/or Group are important.
Details of the amounts paid or payable to the external auditor for non-audit services provided during the financial year are set out in Note 7 of the consolidated financial statements.
The Board of Directors has considered the position and, in accordance with written advice received from the Audit Committee, is satisfied that the provision of non-audit services is compatible with the general standard of independence for external auditors imposed by the Corporations Act 2001. The Board of Directors is satisfied that the provision of non-audit services by the external auditor did not compromise the external auditor independence requirements of the Corporations Act 2001 for the following reasons:
(a) all non-audit services have been reviewed by the Audit Committee to ensure they do not impact the impartiality and objectivity of the external auditor; and
(b) none of the services undermine the general principles relating to external auditor independence as set out in APES 110 ‘Code of Ethics for Professional Accountants’, including reviewing or auditing the external auditor’s own work, acting in a management or a decision making capacity for the Group, acting as advocate for the Group or jointly sharing economic risk and reward.
External Auditor’s Independence Declaration
A copy of the external Auditor’s Independence Declaration for the financial year, as required under Section 307C of the Corporations Act 2001, is set out on page 27.
No officer of the Company has previously belonged to an audit practice auditing the Company during the financial year.

Karoon Gas Australia Ltd Annual Report 201018
dIreCtors’ report conTInueD
Matters Arising Subsequent to the End of the Financial Year
Other than the matters disclosed in Note 32 of the consolidated financial statements, there has not been any matter or circumstance which has arisen since 30 June 2010 that has significantly affected, or may significantly affect:
(a) the Group’s operations in future financial years;
(b) the results of those operations in future financial years; or
(c) the Group’s state of affairs in future financial years. Remuneration Report (Audited)
The Remuneration Report forms part of this Directors’ Report. The information provided in the Remuneration Report has been audited by the external auditor as required by Section 308(3C) of the Corporations Law 2001.
The Remuneration Report is set out under the following main headings:
A. Remuneration policy (used to determine the nature and amount of remuneration).
B. Details of remuneration.
C. Service agreements.
D. Share-based remuneration.
E. Additional information.
Where appropriate, information which is included in other parts of the consolidated financial statements is included in this Directors’ Report by reference.
A. Remuneration PolicyThe Board of Directors annually reviews remuneration of its Directors and employees aided by the Remuneration Committee. Remuneration includes base salaries and equity-based bonuses and incentive schemes.
The Board of Directors has established a Remuneration Committee which provides overview and recommendations on recruitment, retention and termination policies and procedures for senior executives and the remuneration framework for Directors. The Statement of Corporate Governance provides further information on the role of this committee.
Non-Executive Directors’ fees are determined within an aggregate Directors’ fee pool limit, which is periodically recommended for approval by shareholders. The maximum currently stands at $200,000p.a., including superannuation contribution, and was approved by shareholders at the Annual General Meeting held on 3 November 2006.
Non-Executive Directors do not receive any performance-related remuneration.
The remuneration structure is based on a number of factors including length of service, particular experience, responsibilities of the individual and the overall performance of the Company. Remuneration involves a balance between fixed and incentive pay, reflecting short and long-term performance objectives appropriate to the Company’s circumstances and objectives. A proportion of senior executive remuneration is structured in a manner designed to align the success of the Company with the employees who contributed.

Karoon Gas Australia Ltd Annual Report 2010 19
This is done by considering the following remuneration components:
• fixedbaseremuneration;and
• equity-basedremunerationwithinlimitssetbytheBoardofDirectors.
Options are issued under either the Company’s ESOP (to employees) or via other share options (to Directors).
The Directors and other key management personnel receive a superannuation contribution as required by the Australian Federal Government, which is currently 9%p.a., and do not receive any other retirement benefits. Individuals, however, may choose to sacrifice part of their salary to increase payments towards superannuation. It is at their discretion to seek individual financial advice concerning each of their own personal superannuation funds.
Upon retirement, executives are paid employee benefit entitlements accrued to date of retirement.
Relationship Between the Remuneration Policy and Company PerformanceNotwithstanding that the Group is still in the exploration and evaluation phase of activities and is still incurring operating losses (excluding net foreign currency gains), the Company believes this policy was effective in increasing shareholder wealth over the past five years through share price appreciation.
The tables below set out summary information about the Group’s earnings and movements in shareholder wealth to 30 June 2010:
30 June 2006 30 June 2007 30 June 2008 30 June 2009 30 June 2010Financial Year Ended $ $ $ $ $
Revenue 931,762 2,878,695 5,320,930 4,868,541 6,459,623Profit (loss) before income tax (2,835,982) (14,642,257) (6,055,339) 4,452,766 (14,893,839)Profit (loss) for financial year (2,835,982) (14,642,257) (6,055,339) 4,452,766 (14,893,839)Net assets at end of financial year 33,109,886 81,136,721 130,742,056 334,658,839 361,703,571
30 June 2006 30 June 2007 30 June 2008 30 June 2009 30 June 2010Financial Year Ended $ $ $ $ $
Share price at beginning of financial year 1.71 1.45 2.38 4.54 9.09Share price at end of financial year 1.45 2.38 4.54 9.09 5.95Basic profit (loss) per ordinary share (0.0564) (0.2035) (0.0485) 0.0302 (0.0842)Diluted profit (loss) per ordinary share (0.0564) (0.2035) (0.0485) 0.0300 (0.0842)

Karoon Gas Australia Ltd Annual Report 201020
dIreCtors’ report conTInueD
Remuneration Report (Audited) (continued)
B. Details of RemunerationThis section of the Remuneration Report provides specific disclosures in relation to remuneration for the Directors and other key management personnel listed below. In addition to the Directors of the Company, key management personnel are identified in accordance with AASB 124 ‘Related Party Disclosures’ as those who had authority for planning, directing and controlling the Group and/or Company activities during the financial year.
The remuneration for each Director and other key management personnel during the financial year and previous financial year was as follows:
Share- Post- Long- Based Employment Term Payments Ended 30 June 2010 Short-Term Benefits Benefits Benefits Expense
Long Cash Non- Service Remuneration Salary Monetary Superannuation Leave Consisting of Total and Fees Benefits Contributions Provision Options Options* Remuneration Name $ $ $ $ $ % $
Executive Directors Mr Robert Hosking 400,000 9,925 - - 305,607 42.7 715,532Mr Mark Smith 366,972 5,780 33,027 - 281,778 41.0 687,557
Non-Executive Directors Mr Geoff Atkins 55,000 - 4,950 - 263,836 81.5 323,786Mr Stephen Power 55,000 - 4,950 - 263,836 81.5 323,786
Total Directors’ remuneration 876,972 15,705 42,927 - 1,115,057 2,050,661
Other key management personnel Mr Scott Hosking 229,358 3,934 20,642 - 720,000 73.9 973,934Mr Tim Hosking 201,835 3,141 18,165 - 552,000 71.2 775,141Mr Lino Barro 275,229 - 24,771 - 324,611 52.0 624,611Mr David Ormerod 247,706 - 22,294 - 167,020 38.2 437,020Mr Jorg Bein 243,119 - 21,881 - 324,611 55.1 589,611
Total other key management personnel remuneration 1,197,247 7,075 107,753 - 2,088,242 3,400,317
Total key management personnel remuneration 2,074,219 22,780 150,680 - 3,203,299 5,450,978

Karoon Gas Australia Ltd Annual Report 2010 21
Share- Post- Long- Based Employment Term Payments Ended 30 June 2009 Short-Term Benefits Benefits Benefits Expense
Long Cash Non- Service Remuneration Salary Monetary Superannuation Leave Consisting of Total and Fees Benefits Contributions Provision Options Options* Remuneration Name $ $ $ $ $ % $
Executive Directors Mr Robert Hosking 403,030 7,300 - - 1,374,393 77.0 1,784,723Mr Mark Smith 366,972 10,509 33,027 16,454 1,810,722 80.9 2,237,684
Non-Executive Directors Mr Geoff Atkins 54,800 - 3,600 - - - 58,400Mr Stephen Power 40,000 - 3,600 - - - 43,600
Total Directors’ remuneration 864,802 17,809 40,227 16,454 3,185,115 4,124,407
Other key management personnel Mr Scott Hosking 202,447 3,934 18,220 22,763 212,000 46.2 459,364Mr Lino Barro 252,294 - 22,706 11,737 77,710 21.3 364,447Mr David Ormerod 240,826 - 21,674 8,862 155,420 36.4 426,782Mr Jorg Bein 228,593 - 20,573 9,715 77,710 23.1 336,591
Total other key management personnel remuneration 924,160 3,934 83,173 53,077 522,840 1,587,184
Total key management personnel remuneration 1,788,962 21,743 123,400 69,531 3,707,955 5,711,591
* The percentage of total remuneration consisting of options, based on the value of options expensed in the consolidated statement of comprehensive income during the financial year.
The amounts disclosed for the remuneration of Directors and other key management personnel include the assessed fair values of options granted during the financial year, at the date they were granted. The value attributable to options is allocated to particular financial periods in accordance with AASB 2 ‘Share-based Payment’, which requires the value of an option at grant date to be allocated equally over the period from grant date to vesting date, adjusted for not meeting the vesting condition. For options that vest immediately, the value is disclosed as remuneration immediately, in accordance with the accounting policy described in Note 1(p) of the consolidated financial statements.
Fair values of options are assessed under the Black-Scholes option pricing model. The Black-Scholes option pricing model takes into account the exercise price, the term of the option, the vesting criteria, the impact of dilution, the non-tradeable nature of the option, the share price at grant date and expected price volatility of the underlying share, the expected dividend yield and the risk-free interest rate for the term of the option.
The options have been granted subject to continued employment with the Company but are not subject to the individual meeting pre-determined performance criteria (for example, profitability and sales targets), given the Company is still in the exploration and evaluation phase of activities.
Options have vesting periods of zero to four years, dependent upon the tranche of options being granted and the time elapsed between formal approval and issue of options.
Further information on options is set out in Note 28 of the consolidated financial statements.
Karoon Gas Australia Ltd Annual Report 201022
dIreCtors’ report conTInueD
Remuneration Report (Audited) (continued)
The Board has prepared a policy in relation to an individual limiting his or her exposure to risk in relation to securities (including options).
Amounts disclosed for remuneration of Directors and other key management personnel exclude insurance premiums paid by the Company in respect of Directors’ and officers’ liability insurance contracts, as the contracts do not specify premiums paid in respect of individual Directors and officers. Information relating to insurance contracts is set out in this Directors’ Report.
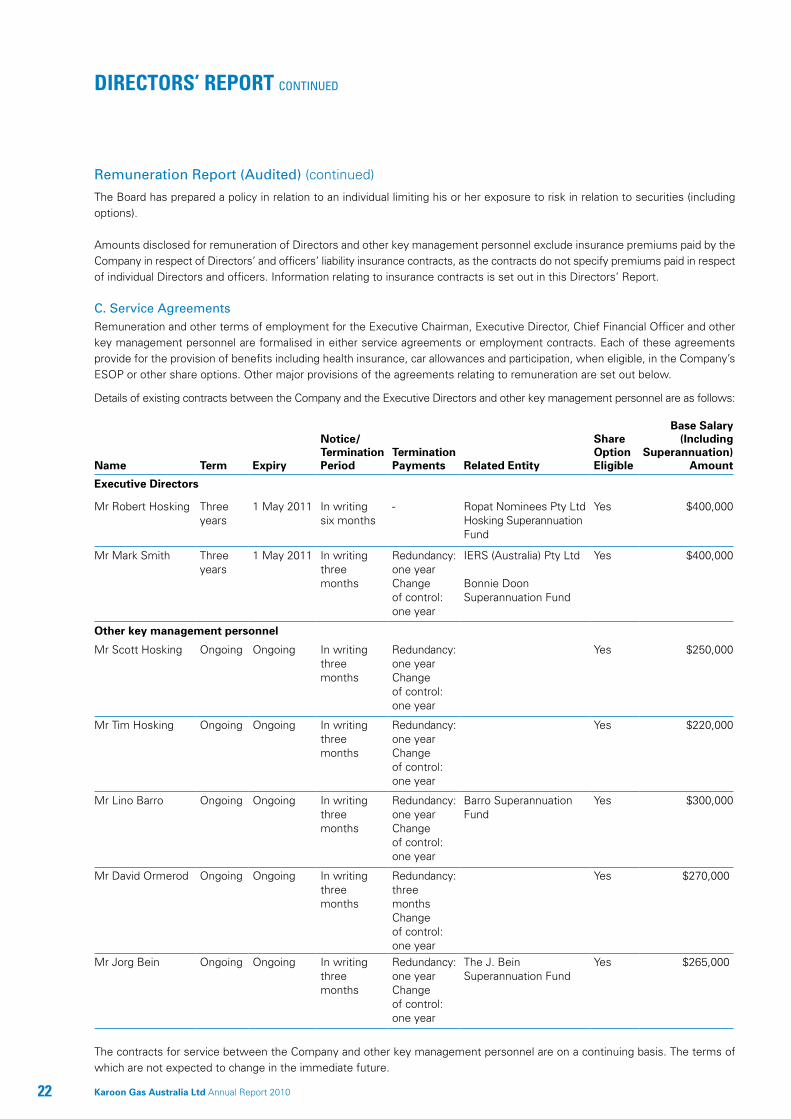
C. Service AgreementsRemuneration and other terms of employment for the Executive Chairman, Executive Director, Chief Financial Officer and other key management personnel are formalised in either service agreements or employment contracts. Each of these agreements provide for the provision of benefits including health insurance, car allowances and participation, when eligible, in the Company’s ESOP or other share options. Other major provisions of the agreements relating to remuneration are set out below.
Details of existing contracts between the Company and the Executive Directors and other key management personnel are as follows:
Name Term Expiry
Notice/ Termination Period
Termination Payments
Related Entity
Share Option Eligible
Base Salary (Including
Superannuation) Amount
Executive Directors
Mr Robert Hosking Three years
1 May 2011 In writing six months
- Ropat Nominees Pty LtdHosking Superannuation Fund
Yes $400,000
Mr Mark Smith Three years
1 May 2011 In writing three months
Redundancy: one yearChange of control: one year
IERS (Australia) Pty Ltd
Bonnie Doon Superannuation Fund
Yes $400,000
Other key management personnel
Mr Scott Hosking Ongoing Ongoing In writing three months
Redundancy: one yearChange of control: one year
Yes $250,000
Mr Tim Hosking Ongoing Ongoing In writing three months
Redundancy: one yearChange of control: one year
Yes $220,000
Mr Lino Barro Ongoing Ongoing In writing three months
Redundancy: one yearChange of control: one year
Barro Superannuation Fund
Yes $300,000
Mr David Ormerod Ongoing Ongoing In writing three months
Redundancy: three monthsChange of control: one year
Yes $270,000
Mr Jorg Bein Ongoing Ongoing In writing three months
Redundancy: one yearChange of control: one year
The J. Bein Superannuation Fund
Yes $265,000
The contracts for service between the Company and other key management personnel are on a continuing basis. The terms of which are not expected to change in the immediate future.

Karoon Gas Australia Ltd Annual Report 2010 23
D. Share-based RemunerationThe Company has one ESOP, which was approved by shareholders at the 2009 Annual General Meeting.
Options are issued to other key management personnel as part of their remuneration to increase goal congruence between senior executives and shareholders in accordance with the Senior Executive Remuneration Policy.
The Company also grants other share options to Directors. Options issued to Directors are approved on a case-by-case basis by shareholders at relevant general meetings.
During the financial year 2,230,000 options over unissued ordinary shares of the Company were issued to Directors and other key management personnel (refer to Note 29(c) of the consolidated financial statements).
The terms and conditions of each grant of options over unissued ordinary shares in the Company affecting remuneration in the current or a future financial year are as follows:
Fair Value Exercise Per Option Date Vested Price Per at Grant Grant Date and Exercisable Expiry Date Option Date % Vested
ESOP options 3 November 2008 30 April 2010 30 April 2011 $5.00 $0.63 100.029 June 2009 30 June 2010 30 October 2011 $6.84 $4.33 100.023 November 2009 23 November 2009 12 November 2013 $14.07 $2.40 100.09 December 2009 13 September 2011 18 November 2013 $11.50 $3.32 - Other share options 1 August 2008 1 May 2010 30 April 2011 $5.00 $0.79 100.027 November 2008 1 May 2010 30 April 2011 $5.00 $0.69 100.023 November 2009 12 November 2012 12 November 2013 $14.07 $2.40 -
Options are granted for no consideration. When exercisable, each option is convertible into one ordinary share of the Company.
ESOP options expire between two and a half and four years after they are granted. The exercise price of ESOP options, issued during the financial year, was based on the volume weighted average price at which the Company’s ordinary shares traded on the ASX during the 20 days of trading before the ESOP options were granted.
The exercise price of other share options is based on the weighted average price at which the Company’s ordinary shares traded on the ASX during the twenty days of trading before the options were granted.
If there is a change of control in the Company, all unexercised options become immediately exercisable.
The option exercise prices are subject to adjustment in certain circumstances as per the ASX Listing Rule 6.22.2.
Options granted carry no dividend or voting rights.
Further information on options is set out in Note 28 of the consolidated financial statements.

Karoon Gas Australia Ltd Annual Report 201024
dIreCtors’ report conTInueD
Remuneration Report (Audited) (continued) Number of Options Provided as Remuneration During the Financial YearDetails of options over unissued ordinary shares in the Company provided as remuneration to each Director and each of the other key management personnel are set out below:
Number of Options Number of Options Granted During Value of Options Vested During Name Financial Year at Grant Date* Financial Year
Executive DirectorsMr Robert Hosking - - -Mr Mark Smith - - -Non-Executive Directors Mr Geoff Atkins 500,000 $1,200,000 -Mr Stephen Power 500,000 $1,200,000 -
Other key management personnel Mr Scott Hosking 300,000 $720,000 300,000Mr Tim Hosking 230,000 $552,000 230,000Mr Lino Barro 300,000 $996,000 -Mr David Ormerod 100,000 $332,000 -Mr Jorg Bein 300,000 $996,000 -
Total key management personnel 2,230,000 $5,996,000 530,000
* The value at grant date, calculated in accordance with AASB 2, of options granted during the financial year as part of their remuneration.
No options over unissued ordinary shares in the Company lapsed during the financial year. Shares Issued on the Exercise of Options Provided as RemunerationDetails of fully paid ordinary shares in the Company issued as a result of the exercise of remuneration options to each Director and other key management personnel during the financial year are set out below:
Number of Amount Date of Ordinary Value at Paid Per Grant Date Exercise Shares Exercise Ordinary Name of Option of Options Issued Date* Share
Executive Directors Mr Robert Hosking 27 November 2008 10 August 2009 500,000 $3,300,000 $4.00Mr Mark Smith 1 August 2008 10 August 2009 750,000 $4,950,000 $4.00
Non-Executive Directors Mr Geoff Atkins - - - - -Mr Stephen Power - - - - -
Other key management personnel Mr Scott Hosking 28 November 2008 23 March 2010 100,000 $431,000 $4.00Mr Tim Hosking 20 August 2008 27 July 2009 200,000 $1,424,000 $4.00 28 November 2008 27 July 2009 100,000 $612,000 $5.00Mr Lino Barro 27 November 2007 14 July 2009 100,000 $652,000 $2.95 3 November 2008 28 October 2009 100,000 $373,000 $4.00Mr David Ormerod 3 November 2008 7 July 2009 50,000 $223,000 $4.00 3 November 2008 14 July 2009 100,000 $547,000 $4.00Mr Jorg Bein 27 November 2007 21 July 2009 100,000 $725,000 $2.95 3 November 2008 21 July 2009 100,000 $620,000 $4.00* The value at exercise date of options that were granted as part of their remuneration and were exercised during the financial year has been
determined as the intrinsic value of the options at that date.
No amounts are unpaid on any ordinary shares issued on the exercise of the above options.

Karoon Gas Australia Ltd Annual Report 2010 25
E. Additional InformationDetailsofRemuneration–OptionsFor each grant of options in current or previous financial years which results in an amount being disclosed in the Remuneration Report as a share-based payment expense in the financial year to Directors and other key management personnel, the percentage of the grant that vested in the financial year and the percentage that was forfeited because the individual did not meet the service criteria is set out below: Maximum Financial Total Years in Value of Financial Year Vested Forfeited Which Options Grant Yet Name End Granted % % May Vest to Vest
Executive Directors Mr Robert Hosking 2009 100.0 - - -Mr Mark Smith 2009 100.0 - - -Non-Executive Directors Mr Geoff Atkins 2010 - - 30 June 2013 $936,164Mr Stephen Power 2010 - - 30 June 2013 $936,164Other key management personnel Mr Scott Hosking 2010 100.0 - - -Mr Tim Hosking 2010 100.0 - - -Mr Lino Barro 2009 100.0 - - - 2010 - - 30 June 2012 $706,679Mr David Ormerod 2009 100.0 - - - 2010 - - 30 June 2012 $235,560Mr Jorg Bein 2009 100.0 - - - 2010 - - 30 June 2012 $706,679
No options will vest if the service criteria conditions are not met, therefore the minimum value of the option yet to vest is $Nil.
The maximum value of options yet to vest was determined as the amount of the grant date fair value of the options that is yet to be expensed in the consolidated statement of comprehensive income. Loans to Directors and Other Key Management Personnel
There were no loans to Directors or other key management personnel during the financial year.
Other Transactions with Directors and Other Key Management Personnel
Refer to Note 30 of the consolidated financial statements for other transactions with Directors and other key management personnel during the financial year.
This Directors’ Report, incorporating the Remuneration Report, is made in accordance with a resolution of the Board of Directors.
On behalf of the Directors:
Mr Robert HoskingExecutive Chairman
17 September 2010Melbourne

Karoon Gas Australia Ltd Annual Report 201026
Karoon was delIghted wIth the results of the Kronos-1 exploratIon well produCtIon test, IndICatIng another CulmInatIon In the greater poseIdon struCture.

Karoon Gas Australia Ltd Annual Report 2010 27
PricewaterhouseCoopersABN 52 780 433 757
Freshwater Place2 Southbank BoulevardSOUTHBANK VIC 3006GPO Box 1331MELBOURNE VIC 3001DX 77Telephone 61 3 8603 1000Facsimile 61 3 8603 1999Direct Phone +61 (3) 8603 3130Direct Fax +61 (3) 8613 2059Website: www.pwc.com/au
audItor’s IndependenCe deClaratIon
As lead auditor for the audit of Karoon Gas Australia Ltd for the financial year ended 30 June 2010, I declare that to the best of my knowledge and belief, there have been:
(a) no contraventions of the auditor independence requirements of the Corporations Act 2001 in relation to the audit; and
(b) no contraventions of any applicable code of professional conduct in relation to the audit.
This declaration is in respect of Karoon Gas Australia Ltd and the subsidiaries it controlled during the financial year.
Charles Christie MelbournePartner 17 September 2010PricewaterhouseCoopers
Liability limited by a scheme approved under Professional Standards Legislation

Karoon Gas Australia Ltd Annual Report 201028
29 Consolidated Statement of Comprehensive Income
30 Consolidated Statement of Financial Position
31 Consolidated Statement of Changes in Equity
32 Consolidated Statement of Cash Flows
33 Notes to the Financial Statements
fInanCIal statementsFoR THe FInAncIAL YeAR enDeD 30 June 2010

Karoon Gas Australia Ltd Annual Report 2010 29
Consolidated statement of Comprehensive inComeFor the Financial Year ended 30 June 2010
Consolidated
2010 2009 Note $ $
Revenue 4 6,459,623 4,868,541Other income 4 914 9,787,639
Total revenue and other income 6,460,537 14,656,180
Computer support (489,646) (367,657)Consulting fees (822,971) (929,587)Corporate promotion and annual report (28,810) (70,853)Depreciation and amortisation expense 5 (415,667) (396,488)Employee benefits expense (net) (6,719,729) (5,431,983)Exploration and evaluation expenditure expensed or written off 5 (136,812) (1,075,643)Finance costs 5 (244,275) (218,173)Legal fees (452,202) (164,223)Net foreign currency losses 5 (8,514,337) -Property costs (321,221) (237,873)Share registry and listing fees (485,285) (334,559)Travel and accommodation expenses (842,774) (331,606)Other expenses (1,651,825) (644,769)
Total expenses (21,125,554) (10,203,414)
Profit (loss) before income tax (14,665,017) 4,452,766Income tax expense 6 (228,822) -
Profit (loss) for financial year (14,893,839) 4,452,766
Other comprehensive income (loss): Exchange differences arising from the translation of financial statements of foreign subsidiaries 2,833,583 (845,891)Income tax relating to components of other comprehensive income (loss) - -
Other comprehensive income (loss) for financial year, net of tax 2,833,583 (845,891)
Total comprehensive income (loss) for financial year (12,060,256) 3,606,875
Earnings per share for profit (loss) attributable to equity holders of the Company: Basic profit (loss) per ordinary share 9 (0.0842) 0.0302Diluted profit (loss) per ordinary share 9 (0.0842) 0.0300
The above consolidated statement of comprehensive income should be read in conjunction with the accompanying notes.

Karoon Gas Australia Ltd Annual Report 201030
Consolidated statement of finanCial positionas at 30 June 2010
Consolidated
2010 2009 Note $ $
Current assets Cash and cash equivalents 10 87,122,836 228,238,280Receivables 11 4,873,578 1,785,266Inventories 12 360,081 1,448,793Security deposits 13 12,091,872 3,172,610Other assets 14 710,376 299,002
Total current assets 105,158,743 234,943,951
Non-current assets Plant and equipment 15 607,552 618,562Intangible assets 16 354,922 240,689Exploration and evaluation expenditure carried forward 17 265,243,372 100,235,662Security deposits 13 4,547,690 10,331,455
Total non-current assets 270,753,536 111,426,368
Total assets 375,912,279 346,370,319
Current liabilities Trade and other payables 18 13,912,243 7,105,297Funds held in escrow 19 - 4,512,228Income tax liability 6 235,727 -
Total current liabilities 14,147,970 11,617,525
Non-current liabilitiesProvisions 20 60,738 93,955
Total non-current liabilities 60,738 93,955
Total liabilities 14,208,708 11,711,480
Net assets 361,703,571 334,658,839
Equity Issued capital 21 381,147,212 347,331,271Accumulated losses (34,710,440) (19,816,601)Share-based payments reserve 13,279,107 7,990,060Foreign currency translation reserve 1,987,692 (845,891)
Total equity 361,703,571 334,658,839
The above consolidated statement of financial position should be read in conjunction with the accompanying notes.

Karoon Gas Australia Ltd Annual Report 2010 31
Consolidated statement of Changes in equityFor the Financial Year ended 30 June 2010
Consolidated
Foreign Share-based Currency Issued Accumulated Payments Translation Total Capital Losses Reserve Reserve Equity $ $ $ $ $
Balance as at 1 July 2008 151,335,352 (24,269,367) 3,676,071 - 130,742,056 Profit for financial year - 4,452,766 - - 4,452,766Exchange differences arising from the translation of financial statements of foreign subsidiaries - - - (845,891) (845,891)
Total comprehensive income for financial year - 4,452,766 - (845,891) 3,606,875
Transactions with owners in their capacity as owners: Ordinary shares issued 204,795,308 - - - 204,795,308Transaction costs arising on ordinary shares issued (8,799,389) - - - (8,799,389)Share-based payments expense - - 4,313,989 - 4,313,989
195,995,919 - 4,313,989 - 200,309,908
Balance as at 30 June 2009 347,331,271 (19,816,601) 7,990,060 (845,891) 334,658,839
Loss for financial year - (14,893,839) - - (14,893,839)Exchange differences arising from the translation of financial statements of foreign subsidiaries - - - 2,833,583 2,833,583
Total comprehensive loss for financial year - (14,893,839) - 2,833,583 (12,060,256)
Transactions with owners in their capacity as owners: Ordinary shares issued 34,104,259 - - - 34,104,259Transaction costs arising on ordinary shares issued (288,318) - - - (288,318)Share-based payments expense - - 5,289,047 - 5,289,047
33,815,941 - 5,289,047 - 39,104,988
Balance as at 30 June 2010 381,147,212 (34,710,440) 13,279,107 1,987,692 361,703,571
The above consolidated statement of changes in equity should be read in conjunction with the accompanying notes.

Karoon Gas Australia Ltd Annual Report 201032
Consolidated statement of Cash flowsFor the Financial Year ended 30 June 2010
Consolidated
2010 2009 Note $ $
Cash flows from operating activities Receipts from customers (inclusive of GST refunds) 571,428 526,211Payments to suppliers and employees (inclusive of GST) (6,951,002) (5,525,364)Interest received 4,954,195 4,627,077Interest and other costs of finance paid (244,275) (218,173)
Net cash flows used in operating activities 27(a) (1,669,654) (590,249)
Cash flows from investing activities Purchase of plant and equipment (235,204) (562,020)Purchase of computer software (283,677) (195,470)Payments for exploration and evaluation expenditure (157,556,856) (52,086,188)Payment of security deposits (1,767,942) (3,905,681)
Net cash flows used in investing activities (159,843,679) (56,749,359)
Cash flows from financing activities Funds held in escrow 19 - 4,512,228Proceeds from issue of ordinary shares 29,592,031 202,170,307Payments for transaction costs arising on ordinary shares issued (800,819) (8,298,410)
Net cash flows provided by financing activities 28,791,212 198,384,125
Net increase (decrease) in cash and cash equivalents (132,722,121) 141,044,517Cash and cash equivalents at beginning of financial year 228,238,280 77,423,254Effect of exchange rate changes on the balance of cash and cash equivalents held in foreign currencies (8,393,323) 9,770,509
Cash and cash equivalents at end of financial year 10 87,122,836 228,238,280
The above consolidated statement of cash flows should be read in conjunction with the accompanying notes.

Karoon Gas Australia Ltd Annual Report 2010 33
notes to the finanCial statementsFor the Financial Year ended 30 June 2010
Note 1. Summary of Significant Accounting Policies
Karoon Gas Australia Ltd (the “Company”) is a public company limited by shares and is listed on the ASX. It is incorporated and domiciled in Australia. The registered office of Karoon Gas Australia Ltd and the principal place of business is Office 7A, 34-38 Lochiel Avenue, Mount Martha, VIC, 3934. The technical office is located at 406 Collins Street, Melbourne, VIC, 3000.
The financial statements are for the consolidated entity consisting of Karoon Gas Australia Ltd and its subsidiaries (the “Group”).
The nature of the operations and principal activities of the Group are described in the Directors’ Report.
The following is a summary of significant accounting policies adopted by the Group in the preparation of these consolidated financial statements. The accounting policies have been consistently applied, unless otherwise stated.
(a) Basis of PreparationThese general purpose consolidated financial statements have been prepared in accordance with the requirements of the Corporations Act 2001, relevant Australian Accounting Standards, Urgent Issues Group Interpretations and other authoritative pronouncements of the Australian Accounting Standards Board (“AASB”).
The consolidated financial statements have been prepared on an accrual basis under the historical cost convention as modified, when relevant, by the revaluation of selected financial assets and financial liabilities for which the fair value basis of accounting has been applied.
Compliance with International Financial Reporting StandardsThe consolidated financial statements comply with International Financial Reporting Standards as issued by the International Accounting Standards Board.
Going ConcernOn the basis of the present level of operations and after consideration of the Group’s ability to:
(i) farm-out its interests in exploration permits/blocks in order to fund future exploration expenditure commitments;
(ii) raise capital through the issue of new ordinary shares in the Company to meet working capital requirements and/or shortfalls in exploration expenditure commitments; and
(iii) manage its existing cash and future cash flows to meet its current obligations and future plans,
the Directors are of the opinion that for the next 12 month period from the date of signing the Directors’ Declaration, the Group and Company will have sufficient liquidity to meet their existing commitments and accordingly present the consolidated financial statements on a going concern basis.
Significant Accounting Estimates, Assumptions and JudgementsThe preparation of financial statements requires the use of certain significant accounting estimates. It also requires management to exercise its judgement in the process of applying Group accounting policies. The areas involving a high degree of judgement or complexity, or areas where assumptions and estimates are significant to the consolidated financial statements are disclosed in Note 2.
Financial Statement PresentationThe Group has applied the revised AASB 101 ‘Presentation of Financial Statements’, which became effective on 1 January 2009. The revised standard requires the separate presentation of a statement of comprehensive income and a statement of changes in equity. All non-owner changes in equity must now be presented in the statement of comprehensive income. As a consequence, the Group had to change the presentation of its consolidated financial statements.
Where necessary, comparative information has been reclassified to achieve consistency in disclosure with financial year amounts and other disclosures.

Karoon Gas Australia Ltd Annual Report 201034
notes to the finanCial statements continued
For the Financial Year ended 30 June 2010
Note 1. Summary of Significant Accounting Policies (continued)
(b) Principles of ConsolidationA subsidiary is any entity controlled by Karoon Gas Australia Ltd whereby it has the power to control the financial and operating policies of an entity so as to obtain benefits from its activities. The existence and effect of potential voting rights that are currently exercisable or convertible are considered when assessing whether the Group controls another entity.
Interests in subsidiaries are set out in Note 22.
The acquisition of subsidiaries is accounted for using the acquisition method of accounting. The acquisition method of accounting involves allocating the cost of the business combination to the fair value of the assets acquired, liabilities and contingent liabilities assumed at the date of acquisition. Acquisition related costs are expensed as incurred.
All subsidiaries have a financial year end of June, with the exception of: Karoon Petróleo & Gas Ltda; KEI (Peru 112) Pty Ltd, Sucursal del Peru; and KEI (Peru Z38) Pty Ltd, Sucursal del Peru. These subsidiaries and branches have a financial year end of December in accordance with relevant Brazilian and Peruvian tax and accounting regulations respectively.
Accounting policies of subsidiaries have been changed, where necessary, to ensure consistency with the policies applied by the Group.
Intercompany transactions, balances and unrealised gains on transactions between Group companies are eliminated on consolidation. Unrealised losses are also eliminated, unless the transaction provides evidence of the impairment of the asset transferred.
Where subsidiaries have entered or left the Group during the financial year, their operating results are included or excluded from the date control was obtained or until the date control ceased respectively.
(c) Segment InformationThe Group has applied AASB 8 ‘Operating Segments’ from 1 July 2009. AASB 8 requires a ‘management approach’ under which segment information is presented on the same basis as that used for internal reporting purposes. Previously, operating segments were determined and presented in accordance with AASB 114 ‘Segment Reporting’ that required the Group to identify two sets of segments (geographical and business), using a risk and rewards approach, with the Group’s system of internal reporting only the starting point of such segments.
As a result, following the adoption of AASB 8, the identification of the Group’s reportable segments has changed to be in a manner consistent with the internal reporting provided to the chief operating decision maker. Reconciliations of such internal reporting information to the statutory information contained in the consolidated financial statements have been included in Note 23.
Comparative segment information has been re-presented in conformity with the transitional requirements of AASB 8. Since the change in accounting policy only impacts presentation and disclosure aspects, there is no impact on earnings per share.
(d) RevenueRevenue is recognised and measured at the fair value of the consideration received or receivable to the extent it is probable that economic benefits will flow to the Group and the revenue can be reliably measured. The following specific recognition criteria must also be met before revenue is recognised:
Sales RevenueRevenue from the sale of goods is recognised upon the delivery of goods to the buyer and all significant risks and rewards of ownership are transferred. Revenue from the rendering of a service is recognised upon the delivery of the service. All revenue is stated net of the amount of GST.
Dividend RevenueDividend revenue is recognised when the right to receive a dividend has been established.
Karoon Gas Australia Ltd Annual Report 2010 35
Interest IncomeInterest income is recognised using the effective interest rate method, which, for floating rate financial assets, is the rate inherent in the relevant financial asset.
(e) Foreign Currency Transactions and BalancesFunctional and Presentation CurrencyItems included in the financial statements of each of the Group’s subsidiaries are measured using the currency of the primary economic environment in which the subsidiary or branch operates (the “functional currency”). The consolidated financial statements are presented in Australian dollars, which is the Company’s functional and presentation currency.
Transactions and BalancesForeign currency transactions are translated into the functional currency using the foreign exchange rates prevailing at the dates of the transactions. Foreign currency gains and losses resulting from the settlement of such transactions and from the translation at financial year end exchange rates of monetary assets and liabilities denominated in foreign currencies are recognised in the consolidated statement of comprehensive income.
Non-monetary items measured at historical cost continue to be carried at the foreign exchange rate at the date of transaction. Foreign exchange differences arising on the translation of non-monetary items are recognised directly in equity to the extent that the gain or loss is directly recognised in equity, otherwise foreign exchange differences are recognised in the consolidated statement of comprehensive income.
Group CompaniesThe results and financial position of foreign subsidiaries that have a functional currency different from the presentation currency are translated into the presentation currency as follows:
• assetsandliabilitiesaretranslatedatendofreportingperiodforeignexchangeratesprevailingattheendofeachreportingperiod;
• incomeandexpensesaretranslatedataverageforeignexchangeratesforthefinancialperiod;and
• allresultingforeignexchangedifferencesarerecognisedinothercomprehensiveincome.
On consolidation, foreign exchange differences arising on translation of foreign subsidiary financial statements are transferred directly to the foreign currency translation reserve in the consolidated statement of financial position. The relevant differences are recognised in the consolidated statement of comprehensive income during the financial period when the investment in a foreign subsidiary is disposed.
(f) Income Taxes and Other TaxesCurrent TaxCurrent income tax expense is calculated by reference to the amount of income taxes payable or recoverable in respect of the taxable profit or loss for the financial period. It is calculated using tax rates that have been enacted or are substantively enacted by the end of each reporting period. Current tax for current and prior financial periods is recognised as a liability (or asset) to the extent that it is unpaid (or refundable).
Deferred TaxDeferred tax is accounted for using the statement of financial position liability method in respect of temporary differences arising between the tax bases of assets and liabilities and their carrying amounts for financial reporting purposes. The tax base of an asset or liability is the amount attributed to that asset or liability for tax purposes.
No deferred tax will be recognised from the initial recognition of an asset or liability, excluding a business combination, where there is no effect on accounting or taxable profit or loss.
Deferred tax is calculated at the tax rates that are expected to apply to the financial period when the asset is realised or liability is settled. Deferred tax is credited in the consolidated statement of comprehensive income except where it relates to items that may be credited directly to equity, in which case the deferred tax is adjusted directly against equity.

Karoon Gas Australia Ltd Annual Report 201036
notes to the finanCial statements continued
For the Financial Year ended 30 June 2010
Note 1. Summary of Significant Accounting Policies (continued)
Deferred tax assets are recognised to the extent that it is probable that sufficient taxable amounts will be available against which deductible temporary tax differences or unused tax losses and tax offsets can be utilised.
Deferred tax assets and tax liabilities are offset when there is a legally enforceable right to offset current tax assets and tax liabilities and when the deferred tax balances relate to the same taxation authority. Current tax assets and tax liabilities are offset where the Group has a legally enforceable right to offset and intends either to settle on a net basis, or to realise the asset and settle the liability simultaneously.
The amount of benefits brought to account or which may be realised in the future is based on the assumption that no adverse change will occur in income taxation legislation and the anticipation that the Group will derive sufficient future assessable income to enable the benefit to be realised and comply with the conditions of deductibility imposed by law.
Goods and Services Tax (“GST”)Revenues, expenses and assets are recognised net of the amount of GST, except where the amount of GST incurred is not recoverable from the ATO. In these circumstances, the GST is recognised as part of the cost of acquisition of the asset or equity or as part of an item of expense.
Receivables and payables in the consolidated statement of financial position are shown inclusive of GST.
The net amount of GST recoverable from, or payable to, the ATO is included as current other receivables or sundry payables respectively in the consolidated statement of financial position.
Cash flows are included on a gross basis in the consolidated statement of cash flows. The GST components of cash flows arising from investing and financing activities, which are recoverable from, or payable to, the ATO, are classified as operating cash flows.
Commitments and contingencies are disclosed net of the amount of GST recoverable from, or payable to, the ATO.
(g) Cash and Cash EquivalentsCash and cash equivalents in the consolidated statement of financial position comprise cash at banks and on hand (including share of joint venture operation cash balances) and short term bank deposits that are readily convertible to known amounts of cash and which are subject to insignificant risk of changes in value.
(h) ReceivablesReceivables, which generally have 30 day terms, are recognised initially at fair value and subsequently measured at amortised cost using the effective interest method, less any accumulated impairment losses. They are included in current assets, except for those with maturities greater than one year after the end of the reporting period which are classified as non-current assets.
Cash flows relating to receivables are not discounted if the effect of discounting would be immaterial.
Collectability of receivables is reviewed on an ongoing basis. Individual receivables that are known to be uncollectible are written off when identified.
Receivables are tested for impairment in accordance with the accounting policy described in Note 1(n). An impairment provision is recognised when there is objective evidence that the Group will not be able to collect the receivable. The amount of the impairment loss is the receivable’s carrying amount compared to the present value of estimated future cash flows, discounted when material, at the original effective interest rate.
(i) InventoriesInventories are measured at the lower of cost and net realisable value. Inventories are represented by assets acquired from third parties, in the form of casing and other drilling inventory to be consumed or used in exploration and evaluation activities.
The cost of casing and other drilling inventory includes direct materials, direct labour and transportation costs.

Karoon Gas Australia Ltd Annual Report 2010 37
(j) Security DepositsCertain financial assets have been pledged as security for performance guarantees, performance bonds and bank guarantees related to exploration permits and operating lease rental agreements and their realisation may be restricted subject to terms and conditions attached to the relevant exploration permit agreements or operating lease rental agreements.
Security deposits are non-derivative financial assets that are not quoted in an active market. Security deposits are initially recognised at cost. Such assets are subsequently carried at amortised cost using the effective interest method. They are included in current assets, except for those with maturities greater than one year after the end of the reporting period which are classified as non-current assets.
Security deposits are derecognised when the terms and conditions attached to the relevant exploration permit agreements or operating rental lease agreements have expired or been transferred.
Security deposits are tested for impairment in accordance with the accounting policy described in Note 1(n).
(k) Plant and EquipmentPlant and equipment is stated at cost less accumulated depreciation and any accumulated impairment losses. Such cost includes the cost of replacing parts that are eligible for capitalisation when the cost of replacing the parts is incurred. Similarly, when each major inspection is performed, its cost is recognised in the carrying amount of the plant and equipment as a replacement only if it is eligible for capitalisation. All other repairs and maintenance are recognised as an expense in the consolidated statement of comprehensive income as incurred.
Commencing from the time the plant and equipment is held ready for use, depreciation expense is calculated on a straight-line basis to allocate their cost amount, net of their residual values, over their estimated useful lives ranging from two to 10 years.
Plant and equipment residual values, useful lives and depreciation methods are reviewed, and adjusted if appropriate, at the end of each reporting period.
Gains and losses on disposals are determined by comparing proceeds with the net carrying amount. These gains and losses are included in the consolidated statement of comprehensive income.
Plant and equipment are tested for impairment in accordance with the accounting policy described in Note 1(n).
(l) IntangiblesComputer SoftwareComputer software is stated at cost less accumulated amortisation and any accumulated impairment losses. Computer software costs have a finite life.
Commencing from the time the computer software is held ready for use, amortisation expense is calculated on a straight-line basis to allocate their cost amount, net of their residual values, over their estimated useful lives ranging from two to two and half years.
The assets’ residual values, useful lives and amortisation methods are reviewed, and adjusted if appropriate, at the end of each reporting period.
Computer software is tested for impairment in accordance with the accounting policy described in Note 1(n).
GoodwillGoodwill recognised in a business combination is initially measured at cost, being the excess of the cost of the business combination over the Group’s interest in the net fair value of the acquiree’s identifiable assets, liabilities and contingent liabilities.
Following initial recognition, goodwill is measured at cost less any accumulated impairment losses. Goodwill is not amortised.

Karoon Gas Australia Ltd Annual Report 201038
notes to the finanCial statements continued
For the Financial Year ended 30 June 2010
Note 1. Summary of Significant Accounting Policies (continued)
Impairment of GoodwillFor the purpose of impairment testing at the end of each reporting period, goodwill recognised in a business combination is, from the acquisition date, allocated to each of the Group’s cash-generating units, or groups of cash-generating units, that are expected to benefit from the synergies of the combination, irrespective of whether other assets or liabilities of the Group are assigned to those units or groups of units.
Impairment is determined by assessing the recoverable amount of the cash-generating unit (group of cash-generating units) to which the goodwill relates.
An impairment loss is recognised as an expense in the consolidated statement of comprehensive income for the amount by which the asset’s carrying amount exceeds its estimated recoverable amount.
Any impairment loss recognised for goodwill is not subsequently reversed.
(m) Exploration and Evaluation ExpenditureExpenditure on exploration and evaluation activities is accounted for in accordance with the ‘area of interest’ method of AASB 6 ‘Exploration for and Evaluation of Mineral Resources’. Exploration and evaluation expenditure is capitalised at cost, as an intangible, provided the right to tenure of the area of interest is current and either:
• theexplorationandevaluationactivitiesareexpectedtoberecoupedthroughsuccessfuldevelopmentandexploitationofthearea of interest or, alternatively, by its sale; or
• explorationandevaluationactivitiesintheareaofinteresthavenotattheendofthereportingperiodreachedastagethatpermits a reasonable assessment of the existence or otherwise of economically recoverable reserves, and active and significant operations in, or in relation to, the area of interest are continuing.
Otherwise, exploration and evaluation expenditure is expensed as incurred.
Accumulated costs in relation to an abandoned area are written off in full in the consolidated statement of comprehensive income during the financial period in which the decision to abandon the area of interest is made.
As capitalised exploration and evaluation expenditure is not available for use, it is not amortised.
Cash flows associated with exploration and evaluation expenditure (comprising both amounts expensed and amounts capitalised) are classified as investing activities in the consolidated statement of cash flows.
When the technical feasibility and commercial viability of extracting economically recoverable reserves have been demonstrated, any related capitalised exploration and evaluation expenditure is reclassified as development expenditure in the consolidated statement of financial position. Prior to reclassification, capitalised exploration and evaluation expenditure is assessed for impairment.
Farm-outThe Group does not record any exploration and evaluation expenditure made by a farmee. It also does not recognise any gain or loss on its exploration and evaluation farm-out arrangements but redesignates any exploration and evaluation expenditure previously capitalised in relation to the whole area of interest as relating to the partial interest retained.
Any cash consideration received on sale or farm-out of an area within an exploration area of interest is offset against the carrying value of the particular area involved. Where the total carrying value of an area of interest has been recouped in this manner, the balance of the proceeds is brought to account in the consolidated statement of comprehensive income as a gain on disposal.
Impairment of Capitalised Exploration and Evaluation ExpenditureThe carrying value of capitalised exploration and evaluation expenditure is assessed for impairment at the asset or cash-generating unit level (which usually is represented by an exploration permit) whenever facts and circumstances (as defined in AASB 6) suggest that the carrying amount of the asset may exceed its recoverable amount. If any indication of impairment exists, an estimate of the asset’s recoverable amount is calculated.

Karoon Gas Australia Ltd Annual Report 2010 39
An impairment loss exists when the carrying amount of an asset or cash-generating unit exceeds its estimated recoverable amount. The asset or cash-generating unit is then written-down to its recoverable amount. Impairment losses are recognised as an expense in the consolidated statement of comprehensive income.
Capitalised exploration and evaluation expenditure that suffered impairment are tested for possible reversal of the impairment loss whenever facts or changes in circumstances indicate that the impairment may have reversed.
(n) Impairment of Assets (Other than Goodwill and Capitalised Exploration and Evaluation Expenditure)All other current and non-current assets (other than inventories and deferred tax assets) are tested for impairment whenever events or changes in circumstances indicate that the carrying amount may not be recoverable.
At the end of each reporting period, the Group conducts an internal review of asset values, which is used as a source of information to assess for any indicators of impairment. External factors, such as changes in economic conditions, are also monitored to assess for indicators of impairment. If any indication of impairment exists, an estimate of the asset’s recoverable amount is calculated.
An impairment loss exists when the carrying amount of an asset or cash-generating unit exceeds its estimated recoverable amount. The asset is then written-down to its recoverable amount. Recoverable amount is the higher of an asset’s fair value less costs to sell and value in use. For the purposes of assessing impairment, assets are grouped at the lowest levels for which there are separately identifiable cash inflows that are largely independent of the cash inflows from other assets or groups of assets (cash-generating units).
Impairment losses are recognised as an expense in the consolidated statement of comprehensive income.
Assets that suffered impairment are tested for possible reversal of the impairment loss whenever events or changes in circumstances indicate that the impairment may have reversed.
(o) Trade and Other PayablesTrade and other payables are carried at amortised cost. Due to their short-term nature they are not discounted. They represent liabilities for goods and services provided to the Group prior to the end of the reporting period that are unpaid and arise when the Group becomes obliged to make future payments in respect of the purchase of goods and services. The amounts are unsecured and are usually paid within 30 days of recognition. They are included in current liabilities, except for those with maturities greater than one year after the end of the reporting period which are classified as non-current liabilities.
(p) Employee BenefitsWages, Salaries, Annual Leave and Personal LeaveLiabilities for wages and salaries, including non-monetary benefits, annual leave and accumulating personal leave expected to be settled within one year after the end of the reporting period in which the employees render the related services are recognised in respect of employees’ services up to the end of the reporting period. They are measured at the amounts expected to be paid when the liabilities are settled plus related on-costs. Expenses for non-accumulating personal leave are recognised when the leave is taken and are measured at the rates paid or payable.
Share-based PaymentsShare-based remuneration benefits are provided to employees via the Company’s ESOP and Directors via other share options (refer Note 28).
The fair value of options granted is recognised as a share-based payments expense in the consolidated statement of comprehensive income with a corresponding increase in the share-based payments reserve in equity. The total amount to be expensed is determined by reference to the fair value of the options granted, which includes any market performance conditions but excludes the impact of any service and non-market performance vesting conditions and the impact of any non-vesting conditions. Non-market performance vesting conditions are included in assumptions about the number of options that are expected to vest.

Karoon Gas Australia Ltd Annual Report 201040
notes to the finanCial statements continued
For the Financial Year ended 30 June 2010
Note 1. Summary of Significant Accounting Policies (continued)
The fair value is measured at grant date. The total expense is recognised over the vesting period, which is the period over which all of the specified vesting conditions are to be satisfied. At the end of each reporting period, the Group revises its estimates of the number of options that are expected to vest based on the non-market performance vesting conditions. It recognises the impact of the revision to original estimates, if any, in the consolidated statement of comprehensive income, with a corresponding adjustment to equity. For options that vest immediately, the value is expensed immediately.
The fair value at grant date is independently determined using a Black-Scholes option pricing model that takes into account the exercise price, the term of the option, the impact of dilution, the non-tradeable nature of the option, the share price at grant date and expected price volatility of the underlying share, the expected dividend yield and the risk-free interest rate for the term of the option.
The Group has elected to retain any amounts originally recognised in the share-based payments reserve, regardless of whether the associated options are exercised or lapse unexercised.
(q) ProvisionsProvisions are recognised when the Group has a present obligation (legal or constructive) as a result of a past event, it is probable that an outflow of resources embodying economic benefits will be required to settle the obligation and a reliable estimate can be made of the amount of the obligation. Provisions are not recognised for future operating losses.
When it is expected that some or all of a provision is to be reimbursed, for example under an insurance contract, the reimbursement is recognised as a separate asset but only when the reimbursement is virtually certain. The expense relating to any provision is included in the consolidated statement of comprehensive income, net of any reimbursement.
Provisions are measured at the present value of management’s best estimate of the expenditure required to settle the present obligation at the end of the reporting period using a discounted cash flow methodology. If the effect of the time value of money is material, provisions are discounted using a pre-tax rate that reflects the time value of money and the risks specific to the obligation. The increase in the provision resulting from the passage of time is recognised as finance costs in the consolidated statement of comprehensive income.
Long Service LeaveThe provision for long service leave is recognised and measured as the present value of expected future payments to be made in respect of services provided by employees up to the end of the reporting period using the projected unit credit method. Consideration is given to expected future wage and salary levels, related on-costs, experience of employee departures and periods of service. Expected future payments are discounted using market yields at the end of the reporting period on Australian government bonds with terms to maturity and currency that match, as closely as possible, the estimated future cash outflows.
RestorationRestoration costs incurred during exploration and evaluation activities are provided when the obligation to incur such costs arises, a corresponding restoration asset (included in exploration and evaluation expenditure carried forward) of an amount equivalent to the provision is also created. The amount recognised is the estimated cost of restoration, discounted to its present value, and is reassessed at the end of each reporting period in accordance with local conditions and requirements. Expected future payments are discounted using market yields at the end of each reporting period on Australian government bonds with terms to maturity and currency that match, as closely as possible, the estimated future cash outflows. Changes in the estimates of restoration costs are dealt with prospectively by recording an adjustment to the provision and a corresponding adjustment to the restoration asset. The unwinding of the discount on the restoration provision is included within finance costs in the consolidated statement of comprehensive income.
(r) Issued CapitalOrdinary shares are classified as equity.
Cash received from shareholders and investors at the end of the reporting period, pending allotment and issue of fully paid ordinary shares, is held as funds in escrow in the consolidated statement of financial position.

Karoon Gas Australia Ltd Annual Report 2010 41
Transaction costs directly attributable to the issue of new ordinary shares or options are shown in equity as a deduction, net of any related income tax benefit, from the proceeds. Transaction costs are the costs that are incurred directly in connection with the issue of new ordinary shares and which would not have been incurred had those ordinary shares not been issued. These directly attributable transaction costs include registration and other regulatory fees, amounts paid to legal, accounting and other professional advisers, printing costs and marketing costs.
The costs of an equity raising that is abandoned are recognised as an expense in the consolidated statement of comprehensive income.
(s) Interests in Joint Venture OperationsThe proportionate interests in the assets, liabilities, revenue and expenses of a joint venture operation are incorporated in the consolidated financial statements under the appropriate headings.
The Group’s share of assets and liabilities employed in joint venture operations is set out in Note 24.
(t) LeasesThe determination of whether an arrangement is or contains a lease is based on the substance of the arrangement and requires an assessment of whether the fulfilment of the arrangement is dependent on the use of a specific asset or assets and the arrangement conveys a right to use the asset.
Group as a LesseeLeases in which a significant portion of the risks and rewards of ownership are not transferred to the Group as lessee are classified as operating leases. Operating lease payments (net of any incentives received from the lessor) are recognised as an expense in the consolidated statement of comprehensive income on a straight-line basis over the financial period of the lease.
(u) Earnings Per ShareBasic Earnings Per ShareBasic earnings per ordinary share is calculated by dividing the profit or loss attributable to owners of the Company, excluding any costs of servicing equity other than ordinary shares, by the weighted average number of ordinary shares outstanding during the financial year, adjusted for bonus elements in ordinary shares issued during the financial year.
Diluted Earnings Per ShareDiluted earnings per ordinary share adjusts the figures used in the determination of basic earnings per share to take into account the after income tax effect of interest and other financing costs associated with dilutive potential ordinary shares and the weighted average number of ordinary shares assumed to have been issued for no consideration in relation to dilutive potential ordinary shares.
(v) Parent Company Financial InformationThe financial information for the Parent Company, Karoon Gas Australia Ltd, disclosed in Note 31 has been prepared on the same basis as the consolidated financial statements, except as set out below:
Investments in SubsidiariesInvestments in subsidiaries are accounted for at cost in the financial statements of Karoon Gas Australia Ltd.
The Parent Company does not designate any investments in subsidiaries as being subject to the requirements of Australian Accounting Standards specifically applicable to financial instruments. They are held for strategic and not trading purposes.
Investments in subsidiaries and receivables from subsidiaries are tested for impairment in accordance with the accounting policy described in Note 1(n).

Karoon Gas Australia Ltd Annual Report 201042
notes to the finanCial statements continued
For the Financial Year ended 30 June 2010
Note 1. Summary of Significant Accounting Policies (continued)
Tax ConsolidationThe Parent Company and its wholly owned Australian subsidiaries are part of an income tax-consolidated group under Australian taxation law. Karoon Gas Australia Ltd is the head entity in the income tax-consolidated group. Tax expense/income, deferred liabilities and deferred assets arising from temporary tax differences of the members of the income tax-consolidated group are recognised in the separate financial statements of the members of the income tax-consolidated group using the ‘stand alone taxpayer’ approach by reference to the carrying amounts in the separate financial statements of each company and the tax values applying under tax consolidation. Current tax liabilities and tax assets and deferred tax assets arising from unused tax losses and tax credits of members of the income tax-consolidated group are recognised by the Parent Company (as head entity of the income tax-consolidated group).
Due to the existence of a tax funding agreement between the companies in the income tax-consolidated group, each company contributes to the income tax payable or receivable in proportion to their contribution to the income tax-consolidated group’s taxable income. Differences between the amounts of net tax assets and tax liabilities derecognised and the net amounts recognised pursuant to the funding agreement are recognised as either a contribution by, or distribution to, the head entity.
(w) New Australian Accounting Standards and Interpretations for Application in Future Financial YearsCertain new Australian Accounting Standards and Interpretations have been published that are not mandatory for this financial year. The Group’s assessment of the impact of the relevant new Australian Accounting Standards and Interpretations is set out below:
(i) AASB 2009-8 ‘Amendments to Australian Accounting Standards – Group Cash-Settled Share-based Payment Transactions [AASB 2]’ (effective from 1 January 2010)The amendments made by the AASB to AASB 2 confirm that an entity receiving goods or services in a Group share-based payment arrangement must recognise an expense for those goods or services regardless of which subsidiary in the Group settles the transaction or whether the transaction is settled in shares or cash. They also clarify how the Group share-based payment arrangement should be measured, that is, whether it is measured as an equity or a cash-settled transaction. The Group will apply these amendments retrospectively for the reporting period commencing on 1 July 2010. There will be no impact on the Group’s financial statements.
(ii) AASB 9 ‘Financial Instruments’ and AASB 2009-11 ‘Amendments to Australian Accounting Standards Arising from AASB 9’ (effective from 1 January 2013)AASB 9 ‘Financial Instruments’ addresses the classification and measurement of financial assets and may affect the Group’s accounting for its financial assets. The Group will apply the amendments from 1 July 2013 but is available for early adoption. The Group is yet to assess its full impact. However, initial indications are that it will have limited impact as equity investments are not held for trading. The Group will not early adopt AASB 9.
(iii) AASB 2009-5 ‘Further Amendments to Australian Accounting Standards Arising from the Annual Improvements Project’ (effective from 1 January 2010)The AASB made a number of amendments to Australian Accounting Standards as a result of the International Accounting Standard Board’s annual improvements project. The Group will apply the amendments from 1 July 2010. The Group is yet to assess its full impact. However, initial indications are that transaction costs related to business combinations will, prospectively, be classified as operating cash flows in the consolidated statement of cash flows. In addition, only exploration and evaluation expenditure that is capitalised may be presented as cash flows from investing activities. Under the Group’s current policy all cash flows associated with exploration and evaluation expenditure (comprising both amounts expensed and capitalised) are classified as cash flows from investing activities. The change in accounting policy would increase net cash outflows from operating activities and decrease net cash outflows from investing activities by $136,812 (2009: $1,049,943).
(iv) Revised AASB 124 ‘Related Party Disclosures’ and AASB 2009-12 ‘Amendments to Australian Accounting Standards’ (effective from 1 January 2011)During December 2009, the AASB issued a revised AASB 124 ‘Related Party Disclosures’. It is effective for accounting periods beginning on or after 1 January 2011 and must be applied retrospectively. The Group will apply the amended standard from 1 July 2011. When the amendments are applied, the Group will need to disclose all transactions between its subsidiaries, including commitments. The Group is yet to assess its full impact. However, initial indications are that it will have limited impact.

Karoon Gas Australia Ltd Annual Report 2010 43
(v) AASB 1053 ‘Application of Tiers of Australian Accounting Standards’ and AASB 2010-2 ‘Amendments to Australian Accounting Standards Arising from Reduced Disclosure Requirements’ (effective 1 July 2013)On 30 June 2010, the AASB officially introduced a revised differential reporting framework in Australia. Under this framework, a two-tier differential reporting regime applies to all entities that prepare general purpose financial statements. Karoon Gas Australia Ltd is listed on the ASX, as such it is ineligible to adopt these two new Australian Accounting Standards. As a consequence, there will be no impact on the consolidated financial statements.
(vi) AASB 2010-3 ‘Amendments to Australian Accounting Standards Arising from the Annual Improvements Project’ and AASB 2010-4 ‘Further Amendments to Australian Accounting Standards Arising from the Annual Improvements Project’ (effective from 1 July 2010)During June 2010, the AASB made a number of amendments to Australian Accounting Standards as a result of the International Accounting Standard Board’s annual improvements project. The Group does not expect that any adjustments will be necessary as the result of applying the revised rules.
The Group has not early adopted any of the above reporting requirements.
Note 2. Significant Accounting Estimates, Assumptions and Judgements
Revenues and expenses and the carrying amounts of certain assets and liabilities are often determined based on estimates and assumptions of future events. In applying the Group’s accounting policies, the Board of Directors and management evaluate estimates and judgements based on historical knowledge and best available current information. Estimates assume a reasonable expectation of future events and are based on current trends and economic data obtained both externally and within the Group.
Significant estimates, assumptions and/or judgements made by the Board of Directors and management in the preparation of the consolidated financial statements were:
(a) Capitalised Exploration and Evaluation ExpenditureThe future recoverability of capitalised exploration and evaluation expenditure is dependent on a number of factors, including whether the Group decides to exploit the related exploration permit itself or, if not, whether it successfully recovers the related exploration and evaluation asset through sale. Factors that could affect the future recoverability include the level of economically recoverable reserves, future technological changes which could impact the cost of development, future legal changes (including changes to environmental and restoration obligations) and changes to commodity prices. To the extent that capitalised exploration and evaluation expenditure is determined not to be recoverable in the future, financial results and net assets will be reduced during the financial period in which this determination is made.
In addition, exploration and evaluation expenditure is carried forward on the basis that exploration and evaluation activities in the areas of interest have not at the end of the reporting period reached a stage that permits a reasonable assessment of the existence or otherwise of economically recoverable reserves, and active and significant operations in, or in relation to, the areas of interest are continuing. To the extent it is determined in the future this capitalised expenditure should be written off, financial results and net assets will be reduced during the financial period in which this determination is made.
Information on the reasonable existence or otherwise of economically recoverable reserves is progressively gained through geological analysis and interpretation, drilling activity and prospect evaluation during a normal permit term. A reasonable assessment of the existence or otherwise of economically recoverable reserves can generally only be made, therefore, at the conclusion of those exploration and evaluation activities.
(b) Share-based PaymentsThe Group measures the cost of share-based payment transactions with Directors and employees by reference to the fair value of the options at the date they were granted. The fair value is ascertained using the Black-Scholes option pricing model taking into account the terms and conditions upon which the options were granted. The accounting estimates and assumptions relating to share-based payments would have no impact on the carrying amounts of assets and liabilities within the next reporting period but may impact expense and equity.

Karoon Gas Australia Ltd Annual Report 201044
notes to the finanCial statements continued
For the Financial Year ended 30 June 2010
Note 2. Significant Accounting Estimates, Assumptions and Judgements (continued)
(c) Income TaxThe Group is subject to income taxes in Australia and jurisdictions where it has foreign operations. There are many transactions and calculations undertaken during the ordinary course of business for which the ultimate tax determination is uncertain. The Group estimates its tax liabilities based on the Group’s understanding of the tax law. Where the final tax outcome of these matters is different from the amounts that were initially recorded, such differences will impact the current and deferred tax balances in the financial period in which such determination is made.
The Group has not recognised deferred tax assets in respect of tax losses and temporary tax differences as the future utilisation of these losses and temporary tax differences is not considered probable at this point in time. Assessing the future utilisation of tax losses and temporary tax differences requires the Group to make significant estimates related to expectations of future taxable income. Estimates of future taxable income are based on forecast cash flows from operations and the application of existing tax laws. To the extent that future utilisation of these tax losses and temporary tax differences becomes probable, this could result in significant changes to deferred tax assets recognised, which would in turn impact future financial results.
Note 3. Financial Risk Management
The Group’s activities expose it to a variety of financial risks: market risk (including foreign exchange risk and interest rate risk); credit risk and liquidity risk. The Group’s overall financial risk management program focuses on the unpredictability of financial markets and seeks to minimise potential adverse effects on the financial performance of the Group. The Group uses different methods to measure the different types of financial risk to which it is exposed. These methods include sensitivity analysis in the case of foreign exchange and interest rates.
The overall financial risk management strategy of the Group is governed by the Board of Directors and is primarily focused on ensuring that the Group is able to finance its business plans, while minimising potential adverse effects on financial performance. The Board of Directors provides written principles for overall financial risk management, as well as written policies covering specific areas, such as mitigating foreign exchange, interest rate and credit risks, use of derivative financial instruments and investment of excess cash. Financial risk management is carried out by the Company’s finance function under policies approved by the Board of Directors. The finance function identifies, evaluates and if necessary hedges financial risks in close cooperation with the Executive Chairman. Risk management policies and systems are reviewed regularly to reflect changes in market conditions and Group activities.
Details of the significant accounting policies and methods adopted, including the criteria for recognition, the basis of measurement and the basis on which income and expenses are recognised in respect of each class of financial asset and financial liability are disclosed in Note 1.
The Group’s financial instruments consist of cash and cash equivalents, receivables, security deposits, trade and other payables and funds held in escrow.
The Group had no off-statement of financial position financial assets or financial liabilities at either 30 June 2010 or 30 June 2009.

Karoon Gas Australia Ltd Annual Report 2010 45
The totals for each category of financial instruments in the consolidated statement of financial position are as follows:
Consolidated
2010 2009 Note $ $
Financial assets Cash and cash equivalents 10 87,122,836 228,238,280Receivables 11 4,873,578 1,785,266Security deposits 13 16,639,562 13,504,065
Total financial assets 108,635,976 243,527,611
Financial liabilities Trade and other payables (refer Note (a) below) 13,672,624 7,023,179Funds held in escrow 19 - 4,512,228
Total financial liabilities 13,672,624 11,535,407
Note:
(a) Trade and other payables above exclude amounts relating to leave liabilities, which are not considered a financial instrument. The reconciliation to the amount in the consolidated statement of financial position is as follows:
Trade and other payables 18 13,912,243 7,105,297Less: leave liabilities (239,619) (82,118)
13,672,624 7,023,179
(a) Market Risk(i) Foreign Exchange RiskForeign exchange risk is the risk that the fair value or future cash flows of a financial instrument will fluctuate because of changes in foreign exchange rates. Foreign exchange risk arises when future commercial transactions and recognised financial assets and financial liabilities are denominated in a currency that is not the Company’s functional currency.
The Group operates internationally and is exposed to foreign exchange risk arising from currency exposures to predominately United States dollar expenditures and cash and deposits held in United States dollars. The Group manages foreign exchange risk at the corporate level by monitoring forecast cash flows in currencies other than Australian dollars and ensuring that adequate United States dollar cash balances are maintained.
United States dollars are bought on the spot market in excess of immediate requirements. Where currencies are purchased in advance of requirements, these balances do not exceed three months requirements.
Regular sensitivity analysis is conducted to evaluate the potential impact of unfavourable exchange rates on the Group’s future financial position. The results of this evaluation are used to determine the most appropriate risk mitigation tool to be used. The Group will hedge when it is deemed the most appropriate risk mitigation tool to be used.
Foreign currency hedging transactions were not entered into during the financial year or previous financial year.

Karoon Gas Australia Ltd Annual Report 201046
notes to the finanCial statements continued
For the Financial Year ended 30 June 2010
Note 3. Financial Risk Management (continued)
An analysis of the Group’s exposure to foreign exchange risk for financial instruments, expressed in Australian dollars, at the end of the financial year is set out below: 2010 2009
AUD USD REAL Total AUD USD REAL TotalConsolidated $ $ $ $ $ $ $ $
Financial assets Cash and cash equivalents 63,389,400 22,987,761 745,675 87,122,836 156,124,409 71,399,811 714,060 228,238,280Receivables 735,344 4,138,234 - 4,873,578 913,587 871,679 - 1,785,266Security deposits 93,727 4,810,814 11,735,021 16,639,562 89,858 3,130,591 10,283,616 13,504,065
64,218,471 31,936,809 12,480,696 108,635,976 157,127,854 75,402,081 10,997,676 243,527,611
Financial liabilities Trade and other payables 1,175,245 12,127,933 369,446 13,672,624 1,915,909 4,173,026 934,244 7,023,179Funds held in escrow - - - - 4,512,228 - - 4,512,228
1,175,245 12,127,933 369,446 13,672,624 6,428,137 4,173,026 934,244 11,535,407
Foreign Exchange Sensitivity AnalysisThe following table details the Group’s sensitivity to a 10.0% increase or decrease in the Australian dollar against the United States dollar, with all other variables held constant. The sensitivity analysis includes only outstanding foreign currency denominated amounts at the end of the financial year and adjusts their translation for a 10.0% change in the relevant foreign exchange rate.
The sensitivity analysis is not fully representative of the inherent foreign exchange risk, as the financial year end exposure does not necessarily reflect the exposure during the course of a financial year. These sensitivities should not be used to forecast the future effect of movements in United States dollar exchange rates on future cash flows.
Consolidated 2010 2009 $ $
Change in profit (loss) - Improvement in AUD to USD by 10.0% (2,737,438) (6,405,963)- Decline in AUD to USD by 10.0% 3,345,757 7,829,510Change in financial assets - Improvement in AUD to USD by 10.0% (4,037,382) (6,854,735)- Decline in AUD to USD by 10.0% 4,934,578 8,378,009Change in financial liabilities - Improvement in AUD to USD by 10.0% 1,102,539 379,366- Decline in AUD to USD by 10.0% (1,347,548) (463,670)Change in foreign currency translation reserve - Improvement in AUD to USD by 10.0% 197,405 69,406- Decline in AUD to USD by 10.0% (241,273) (84,829)
(ii) Interest Rate Risk Interest rate risk is the risk that the fair value of future cash flows of financial assets and financial liabilities will fluctuate because of changes in market interest rates. Interest rate risk is managed on a Group basis at the corporate level.
As at 30 June 2010 and 30 June 2009, there was no borrowing outstanding and there was no interest rate hedging in place.
The Group’s interest rate risk arises from relevant financial assets, primarily cash and cash equivalents deposited at variable rates of interest. Surplus cash is invested in short term bank deposits due to uncertainty of timing of major cash outflows. Whilst some of the invested cash is in United States dollars, the primary exposure is to Australian interest rates.

Karoon Gas Australia Ltd Annual Report 2010 47
An analysis of the Group’s exposure to interest rate risk for financial assets and financial liabilities at the end of the financial year is set out below:
Consolidated
Weighted Floating Fixed Average Interest Interest Non-interest Carrying Interest Rate Rate Rate Bearing Fair Value Amount2010 % P.A. $ $ $ $ $
Financial assets Cash and cash equivalents 4.0 24,894,805 61,171,587 1,056,444 87,122,836 87,122,836Receivables - - - 4,873,578 4,873,578 4,873,578Security deposits 8.2 4,100 16,635,462 - 16,639,562 16,639,562
24,898,905 77,807,049 5,930,022 108,635,976 108,635,976
Financial liabilities Trade and other payables - - - 13,672,624 13,672,624 13,672,624
- - 13,672,624 13,672,624 13,672,624
Consolidated Weighted Floating Fixed Average Interest Interest Non-interest Carrying Interest Rate Rate Rate Bearing Fair Value Amount2009 % P.A. $ $ $ $ $
Financial assets Cash and cash equivalents 3.0 38,117,425 183,081,923 7,038,932 228,238,280 228,238,280Receivables - - - 1,785,266 1,785,266 1,785,266Security deposits 8.9 3,231 13,500,834 - 13,504,065 13,504,065
38,120,656 196,582,757 8,824,198 243,527,611 243,527,611
Financial liabilities Trade and other payables - - - 7,023,179 7,023,179 7,023,179Funds held in escrow - - - 4,512,228 4,512,228 4,512,228
- - 11,535,407 11,535,407 11,535,407
Interest Rate Sensitivity AnalysisThe following table details the Group’s sensitivity to a 1.0% p.a. increase or decrease in interest rates, with all other variables held constant. The sensitivity analysis is based on the balance of floating interest rate amounts held at the end of the financial year.
The sensitivity analysis is not fully representative of the inherent interest rate risk, as the financial year end exposure does not necessarily reflect the exposure during the course of a financial year. These sensitivities should not be used to forecast the future effect of movements in interest rates on future cash flows. Consolidated 2010 2009 $ $
Change in profit (loss) - Increase of interest rate by 1.0% p.a. 248,989 381,207- Decrease of interest rate by 1.0% p.a. (55,377) (108,531)Change in financial assets - Increase of interest rate by 1.0% p.a. 248,989 381,207- Decrease of interest rate by 1.0% p.a. (55,377) (108,531)
(b) Credit RiskCredit risk refers to the risk that a counterparty will default on its contractual obligations resulting in financial loss to the Group. Credit risk arises from cash and cash equivalents and security deposits held with banks, financial institutions and joint venture operators, as well as credit exposures to customers, including outstanding receivables.

Karoon Gas Australia Ltd Annual Report 201048
notes to the finanCial statements continued
For the Financial Year ended 30 June 2010
Note 3. Financial Risk Management (continued)
Credit risk is managed on a Group basis at the corporate level. Management monitors credit risk on an ongoing basis within the Group.
To minimise credit risk, the Group has adopted a policy of only dealing with recognised and creditworthy third parties. The Group does not have any material credit risk exposure to any single debtor or group of debtors entered into by the Group. Receivable balances are monitored on an ongoing basis with the result being the Group’s exposure to bad debts is minimised. The Group does not hold collateral, nor does it securitise its receivables.
The Group has policies in place to ensure that sales of products and services are made to customers with an appropriate credit history.
Cash and cash equivalents and security deposit counterparties are limited to high credit quality banks and financial institutions. For banks and financial institutions, only independently rated counterparties with a minimum rating of ‘AA-’ are accepted. Where commercially practical, the Group seeks to limit the amount of credit exposure to any one bank or financial institution. Cash and cash equivalents and security deposits are spread amongst a number of AA and AAA rated banks and financial institutions to minimise the risk of default of counterparties.
The maximum exposure to credit risk at the end of the financial year is the carrying amount of the financial assets as disclosed in the consolidated statement of financial position and notes to the consolidated financial statements.
As at 30 June 2010, there were $Nil (30 June 2009: $Nil) financial assets past due. (c) Liquidity Risk Liquidity risk is the risk that the Group will encounter difficulty in meeting obligations associated with financial liabilities.
At the end of the financial year, the Group held cash and cash equivalents at call of $25,951,249 (30 June 2009: $40,644,129) that are expected to readily generate cash inflows for managing liquidity risk.
The Group manages liquidity risk by ensuring that there are sufficient funds available to meet financial obligations on a day-to-day basis and to meet unexpected liquidity needs in the normal course of business. Emphasis is placed on ensuring there is sufficient funding in place to meet the ongoing requirements of the Group’s exploration and evaluation activities.
The following mechanisms are utilised:
• preparingandmaintainingrollingforecastcashflowsinrelationtooperational,investingandfinancingactivities;
• maintainingareputablecreditprofile;
• managingcreditriskrelatedtofinancialassets;
• investingsurpluscashonlyinhighcreditqualitybanksandfinancialinstitutions;and
• comparingthematurityprofileoffinancialliabilitieswiththerealisationprofileoffinancialassets.
An analysis of the Group’s financial liability maturities at the end of the financial year is set out below:
Consolidated
Less than 6-12 Between Between 2 Over 6 Months Months 1 and 2 Years and 5 Years 5 Years Total2010 $ $ $ $ $ $
Financial liabilities Trade and other payables 13,672,624 - - - - 13,672,624
13,672,624 - - - - 13,672,624

Karoon Gas Australia Ltd Annual Report 2010 49
Consolidated
Less than 6-12 Between Between 2 Over 6 Months Months 1 and 2 Years and 5 Years 5 Years Total2009 $ $ $ $ $ $
Financial liabilities Trade and other payables 7,023,179 - - - - 7,023,179Funds held in escrow 4,512,228 - - - - 4,512,228
11,535,407 - - - - 11,535,407
(d) Fair Value EstimationFor disclosure purposes only, the fair values of financial assets and financial liabilities as at 30 June 2010 are presented in the table under Note 3(a)(ii) and can be compared to their carrying values as presented in the consolidated statement of financial position. Fair values are those amounts at which an asset could be exchanged, or a liability settled, between knowledgeable, willing parties in an arm’s length transaction. Fair values estimated for disclosure purposes are based on information that is subject to judgement, where changes in assumptions may have a material impact on the amounts estimated.
The following summarises the significant methods and assumptions used in estimating fair values of financial assets and financial liabilities for disclosure purposes:
Cash and Cash EquivalentsThe carrying amount is fair value due to the liquid nature of these assets.
ReceivablesThe carrying amounts of receivables are assumed to approximate their fair values due to their short-term nature.
Security DepositsThe carrying amounts of security deposits are assumed to represent their fair values based on their likely realisability profile.
Trade and Other Payables/Funds Held in EscrowDue to the short-term nature of these financial liabilities, their carrying amounts are assumed to represent their fair values.
Consolidated
2010 2009 $ $
Note 4. Revenue
Interest income from unrelated entities 6,459,623 4,868,541
Total revenue 6,459,623 4,868,541
Net foreign currency gains - 9,770,509Sundry income 914 17,130
Total other income 914 9,787,639

Karoon Gas Australia Ltd Annual Report 201050
notes to the finanCial statements continued
For the Financial Year ended 30 June 2010
Consolidated
2010 2009 Note $ $
Note 5. Expenses
Profit (loss) before income tax includes the following specific expenses:Depreciation and amortisation expense:- depreciation of plant and equipment 15 246,223 277,317- amortisation of computer software 16 169,444 119,171
Total depreciation and amortisation expense 415,667 396,488
Exploration and evaluation expenditure expensed or written off:- exploration and evaluation expenditure expensed 136,812 1,049,943- exploration and evaluation expenditure written off 17 - 25,700
Total exploration and evaluation expenditure expensed or written off 136,812 1,075,643
Finance costs:- bank charges 244,275 218,173
Total finance costs 244,275 218,173
Net foreign currency losses 8,514,337 -Share-based payments expense 28(d) 5,289,047 4,313,989Costs associated with potential listing of South American assets 407,317 -Rental expense on operating leases – minimum lease payments 228,395 158,723
Consolidated 2010 2009 $ $
Note 6. Income Tax (a) Income Tax Recognised in the Consolidated Statement of Comprehensive Income Tax expense comprises:Current income tax 228,822 -Deferred income tax - -
Total income tax expense 228,822 -
The prima facie tax on profit (loss) before income tax is reconciled to income tax expense as follows:
Prima facie tax payable on profit (loss) before income tax, calculated at the Australian tax rate of 30% (2009: 30%) (4,399,505) 1,335,830 Add (subtract) tax effect of: Share-based payments expense 1,586,714 1,294,197Other non-deductible items 732,205 592,827Prior financial year’s income tax expense on foreign operations 228,822 -Tax losses and temporary tax differences not recognised 3,126,480 (2,042,078)Other items (1,045,894) (1,180,776)
Total income tax expense 228,822 -

Karoon Gas Australia Ltd Annual Report 2010 51
Consolidated
2010 2009 $ $
(b) Unrecognised Deferred Tax Assets A deferred tax asset has not been recognised in the consolidated statement of financial position as the benefits of which will only be realised if the conditions for deductibility set out in Note 1(f) occur:
- Unrecognised temporary tax differences relating to deferred tax assets 480,814 114,836- Tax losses: - operating losses 7,025,051 4,227,861
Potential tax benefit at the Australian tax rate of 30% (2009: 30%) 7,505,865 4,342,697
(c) Current Tax LiabilitiesIncome tax payable (235,727) -
Total current tax liabilities (235,727) -
(d) Deferred Tax LiabilitiesTemporary tax differences relating to deferred tax liabilities (57,200,549) (21,563,114)Offset by deferred tax assets relating to operating losses 57,200,549 21,563,114
Total deferred tax liabilities - -
Note 7. Remuneration of External Auditors
Remuneration received or due and receivable by the external auditor of Karoon Gas Australia Ltd for:
Audit and review of financial statements 144,228 100,909Non-audit services (review of accounting policy and procedure manual) - 900
Total remuneration of external auditors 144,228 101,809
Note 8. Dividends
There were no ordinary dividends declared or paid during the financial year by the Group (2009: $Nil).Dividend franking account
Balance of franking account at end of financial year - -

Karoon Gas Australia Ltd Annual Report 201052
notes to the finanCial statements continued
For the Financial Year ended 30 June 2010
Consolidated
2010 2009 $ $
Note 9. Earnings Per Share
Profit (loss) for financial year used to calculate basic and diluted profit (loss) per ordinary share: (14,893,839) 4,452,766(a) Basic profit (loss) per ordinary share (0.0842) 0.0302(b) Diluted profit (loss) per ordinary share (0.0842)* 0.0300
* Diluted loss per ordinary share equates to basic loss per ordinary share because a loss per share is not considered dilutive for the purposes of calculating earnings per share pursuant to AASB 133 ‘Earnings per Share’.
Weighted average number of ordinary shares on issue during the financial year used in calculating basic profit (loss) per ordinary share: 176,786,841 147,643,691
Weighted average number of potential ordinary shares: 2,991,254 679,956
Weighted average number of ordinary shares and potential ordinary shares used in calculating diluted profit per ordinary share (excluding anti-dilutive options outstanding): 179,778,095 148,323,647
Weighted average number of anti-dilutive options: 1,124,139 424,417
Potential ordinary sharesOptions over unissued ordinary shares of the Company outstanding at the end of the financial year are considered to be potential ordinary shares and have been included in the determination of diluted profit per ordinary share to the extent to which they are dilutive. The options have not been included in the determination of basic profit (loss) per ordinary share.
Note 10. Cash and Cash Equivalents
Cash at banks and on hand 25,951,249 45,156,356Short term bank deposits 61,171,587 183,081,924
Total cash and cash equivalents 87,122,836 228,238,280
(a) Cash at Banks and on HandCash at banks included funds held in escrow of $Nil (30 June 2009: $4,512,228). Refer to Note 19 for further details.
(b) Short Term Bank DepositsShort term bank deposits are made for varying periods of between one day and three months, depending on the immediate cash requirements of the Group, and earn interest at the respective short term bank deposit rates.
(c) Financial Risk ManagementInformation concerning the Group’s exposure to financial risks on cash and cash equivalents is set out in Note 3. Consolidated
2010 2009 $ $
Note 11. Receivables
CurrentOther receivables 4,873,578 1,785,266
Total current receivables 4,873,578 1,785,266
Financial Risk Management Information concerning the Group’s exposure to financial risks on receivables is set out in Note 3.

Karoon Gas Australia Ltd Annual Report 2010 53
Consolidated
2010 2009 $ $
Note 12. Inventories
CurrentCasing and other drilling inventory, at cost 360,081 1,448,793
Total current inventories 360,081 1,448,793
Note 13. Security Deposits
CurrentKaroon Gas Australia Ltd (refer Note (a) below) - 3,130,591Karoon Petróleo & Gas Ltda (refer Note (b) below) 11,723,326 -Karoon Gas Australia Ltd (refer Note (c) below) 40,107 42,019Karoon Gas Australia Ltd (refer Note (d) below) 293,324 -Karoon Gas Pty Ltd (refer Note (e) below) 35,115 -
Total current security deposits 12,091,872 3,172,610
Non-current Karoon Gas Australia Ltd (refer Note (a) below) 4,517,490 -Karoon Petróleo & Gas Ltda (refer Note (b) below) - 10,283,616Karoon Gas Australia Ltd (refer Note (c) below) 30,200 13,824Karoon Gas Pty Ltd (refer Note (e) below) - 34,015
Total non-current security deposits 4,547,690 10,331,455
(a) Performance GuaranteePerformance guarantees (via letters of credit) were provided to Peru Petro SA for Block Z-38 and Block 144 by the Group (refer Note 25) for first and second year work commitments (2009: for first year work commitments). The letters of credit are fully funded by way of payment of a security deposit, which will be released once the work commitments are met.
(b) Performance BondsThe Group has provided Agencia Nacional do Petroleo a letter of credit (refer Note 25) to carry out minimum work programs in relation to the Group’s exploration permits in the Santos Basin, Brazil (Santos Basin Blocks 1037, 1101, 1102, 1165 and 1166). The letter of credit is fully funded by way of payment of a security deposit to Banco BNP Paribas Brasil SA, which will be released once the work programs are met.
(c) Bank GuaranteesCash deposits are held as security against bank guarantee facilities for bank guarantees (refer Note 25) given to lessors for the Group’s compliance with its obligations in respect of operating lease rental agreements for office premises at Melbourne, Mount Martha and Rio de Janeiro.
(d) Performance GuaranteeA performance guarantee (via a letter of credit) was provided to a third party supplier by the Group for exploration work to be undertaken in Peru (refer Note 25). The letter of credit is fully funded by way of payment of a security deposit, which will be released once the Group’s obligation under the contract is satisfied.
(e) BondCash was held as security deposit for the relinquished exploration licence EL4537.
(f) Financial Risk ManagementInformation concerning the Group’s exposure to financial risks on security deposits is set out in Note 3.

Karoon Gas Australia Ltd Annual Report 201054
notes to the finanCial statements continued
For the Financial Year ended 30 June 2010
Consolidated
2010 2009 Note $ $
Note 14. Other AssetsCurrentPrepayments 710,376 299,002
Total current other assets 710,376 299,002
Note 15. Plant and EquipmentPlant and equipmentAt cost 1,591,884 1,359,531Accumulated depreciation (984,332) (740,969)
Total plant and equipment, at net book value 607,552 618,562
ReconciliationThe reconciliation of the carrying amount for plant and equipment is set out below:
Balance at beginning of financial year 618,562 333,859Additions 23 235,213 562,020Disposals (at cost) (2,860) -Disposals (accumulated depreciation) 2,860 -Depreciation expense 5 (246,223) (277,317)
Net carrying amount at end of financial year 607,552 618,562
Note 16. Intangible AssetsComputer softwareAt cost 825,904 542,227Accumulated amortisation (470,982) (301,538)
Total intangibles, at net book value 354,922 240,689
Reconciliation The reconciliation of the carrying amounts for computer software is set out below:
Balance at beginning of financial year 240,689 164,390Additions 23 283,677 195,470Amortisation expense 5 (169,444) (119,171)
Net carrying amount at end of financial year 354,922 240,689
Note 17. Exploration and Evaluation Expenditure Carried ForwardDeferred geological, geophysical, drilling and other exploration and evaluation expenditure, including directly attributable general administrative costs 265,243,372 100,235,662
Reconciliation The reconciliation of exploration and evaluation expenditure carried forward is set out below:
Balance at beginning of financial year 100,235,662 51,597,114Additions 23 165,145,066 49,785,695Net foreign currency difference on translation of financial statements of foreign subsidiaries (137,356) (1,121,447)Exploration and evaluation expenditure written off 5 - (25,700)
Total exploration and evaluation expenditure carried forward (refer Note (a) below) 265,243,372 100,235,662
Tangible - -Intangible 265,243,372 100,235,662
Total exploration and evaluation expenditure carried forward 265,243,372 100,235,662

Karoon Gas Australia Ltd Annual Report 2010 55
(a) Exploration and evaluation expenditure carried forward relates to areas of interest in the exploration and evaluation phase for exploration permits WA-314-P, WA-315-P, WA-398-P, Block 1037, Block 1101, Block 1102, Block 1165, Block 1166, Block Z-38, Block 144 and AC/P8 (30 June 2009: WA-314-P, WA-315-P, WA-398-P, Block 1037, Block 1101, Block 1102, Block 1165, Block 1166, Block Z-38, Block 144 and AC/P8).
The expenditure is carried forward on the basis that exploration and evaluation activities in the areas of interest have not reached a stage that permits reasonable assessment of the existence or otherwise of economically recoverable reserves and active and significant activity in, or in relation to, the areas is continuing. The future recoverability of the carrying amount of capitalised exploration and evaluation expenditure is dependent on successful development and commercial exploitation or, alternatively, the sale of the respective areas of interest.
Consolidated
2010 2009 $ $
Note 18. Trade and Other Payables
Current (unsecured)Trade payables 477,260 1,064,165Sundry payables and accrued expenditure 13,434,983 6,041,132
Total current trade and other payables 13,912,243 7,105,297
Financial Risk ManagementInformation concerning the Group’s exposure to financial risks on trade and other payables is set out in Note 3. Note 19. Funds Held in Escrow
Current (unsecured)Funds held in escrow - 4,512,228
Total current funds held in escrow - 4,512,228
(a) Share Purchase PlanFunds held in escrow in the previous financial year represented a Share Purchase Plan offered to eligible Australian and New Zealand shareholders registered as at the close of business on 10 June 2009. That offering, to all eligible shareholders to acquire ordinary shares in the Company at $6.70 each, closed on 17 July 2009. As at 30 June 2009, $4,512,228 had been paid by shareholders taking up the offer and held in an escrowed bank account pending close of the offer and issue of fully paid ordinary shares (refer Note 10).
(b) Financial Risk Management Information concerning the Group’s exposure to financial risks on funds held in escrow is set out in Note 3.
Consolidated
2010 2009 $ $
Note 20. Provisions
Non-currentProvision for long service leave 60,738 93,955
Total non-current provisions 60,738 93,955
Provision for Long Service LeaveA provision was recognised for employee entitlements relating to long service leave. The measurement and recognition criteria relating to long service leave entitlements are as described in Note 1(q).

Karoon Gas Australia Ltd Annual Report 201056
notes to the finanCial statements continued
For the Financial Year ended 30 June 2010
Consolidated Consolidated
2010 2009 2010 2009 Number Number $ $
Note 21. Issued Capital and Reserves Within Equity
(a) Share Capital
Ordinary shares, fully paid 177,546,198 171,301,831 381,147,212 347,331,271
Ordinary shares have no par value and the Company does not have a limited amount of authorised capital.
Voting rights of shareholders are governed by the Company’s Constitution. In summary, on a show of hands every holder of ordinary shares present at a meeting in person or by proxy is entitled to one vote, and upon a poll each such attending shareholder is entitled to one vote for every fully paid ordinary share held.
Ordinary shares participate in dividends as declared from time to time and the proceeds on winding up of the Company in proportion to the number of fully paid ordinary shares held.
(b) Movement in Ordinary Shares Issue Number of Price Per Ordinary Ordinary Date Details Note Shares Share $
1 July 2008 Opening balance in previous financial year 132,277,897 151,346,87416 July 2008 Exercise of ESOP options (i) 40,000 $2.03 81,20021 July 2008 Exercise of ESOP options (i) 20,000 $2.03 40,6007 August 2008 Share placement (ii) 14,000,000 $3.50 49,000,00019 August 2008 Exercise of ESOP options (i) 30,000 $2.03 60,90018 September 2008 Exercise of ESOP options (i) 75,000 $2.03 152,25019-25 September 2008 Exercise of other share options (i) 750,000 $2.00 1,500,00019-25 September 2008 Exercise of other share options (i) 1,500,000 $2.35 3,525,00031 October 2008 Exercise of ESOP options (i) 100,000 $2.03 203,0001 June 2009 Exercise of ESOP options (i) 100,000 $2.95 295,00016 June 2009 Share placement (ii) 22,333,934 $6.70 149,637,35829 June 2009 Exercise of ESOP options (i) 75,000 $4.00 300,000 Less: Transaction costs arising on ordinary shares issued during previous financial year (8,810,911)
30 June 2009 Balance at end of previous financial year 171,301,831 347,331,2712 July 2009 Exercise of ESOP options (i) 30,000 $2.95 88,5007 July 2009 Exercise of ESOP options (i) 50,000 $4.00 200,00014 July 2009 Exercise of ESOP options (i) 100,000 $2.95 295,00014 July 2009 Exercise of ESOP options (i) 100,000 $4.00 400,00017 July 2009 Exercise of ESOP options (i) 100,000 $2.95 295,00021 July 2009 Exercise of ESOP options (i) 100,000 $4.00 400,00021 July 2009 Exercise of ESOP options (i) 130,000 $2.95 383,50022 July 2009 Exercise of ESOP options (i) 30,000 $4.00 120,00024 July 2009 Share Purchase Plan (ii) 3,514,367 $6.70 23,546,25927 July 2009 Exercise of ESOP options (i) 200,000 $4.00 800,00027 July 2009 Exercise of ESOP options (i) 100,000 $5.00 500,00030 July 2009 Exercise of ESOP options (i) 10,000 $4.00 40,00010 August 2009 Exercise of other share options (i) 1,250,000 $4.00 5,000,00028 October 2009 Exercise of ESOP options (i) 100,000 $4.00 400,00016 February 2010 Exercise of ESOP options (i) 20,000 $2.95 59,00016 February 2010 Exercise of ESOP options (i) 42,500 $4.00 170,00011 March 2010 Exercise of ESOP options (i) 50,000 $4.00 200,000

Karoon Gas Australia Ltd Annual Report 2010 57
Issue Number of Price Per Ordinary Ordinary Date Details Note Shares Share $
16 March 2010 Exercise of ESOP options (i) 60,000 $2.95 177,00018 March 2010 Exercise of ESOP options (i) 85,000 $4.00 340,00023 March 2010 Exercise of ESOP options (i) 165,000 $4.00 660,00026 March 2010 Exercise of ESOP options (i) 7,500 $4.00 30,000 Less: Transaction costs arising on ordinary shares issued during financial year (288,318)
30 June 2010 Balance at end of financial year 177,546,198 381,147,212
(i) Employee Share Option Plan (“ESOP”) and Other Share OptionsInformation relating to the Company’s ESOP and other share options, including details of options granted, exercised, cancelled, forfeited and expired during the financial year and options outstanding at the end of the financial year, is set out in Note 28.
(ii) Share Placement and Share Purchase PlanThe purpose of the share placement to sophisticated and professional investors during June 2009 and the Share Purchase Plan during July 2009 was to provide the Group with a strong cash position for its continued exploration and appraisal program in the Browse Basin, along with upcoming exploration programs in Peru and Brazil.
Funds raised by the share placement to sophisticated and professional investors during August 2008 provided the Group with funds for its drilling program in the Browse Basin, along with exploration programs in Peru and Brazil.
(c) Capital ManagementThe Board of Directors controls the capital of the Company in order to ensure that the Group can fund its operations and continue as a going concern. The aim is to maintain a capital structure that ensures the lowest cost of capital to the Company.
The Executive Chairman manages the Company’s capital by monitoring future rolling cash flows and adjusting its capital structure, as required, in consultation with the Board of Directors to meet Group business objectives.
There were no externally imposed capital management restrictions on the Group during the financial year.
(d) Reserves Within Equity(i) Share-based Payments ReserveThe share-based payment reserve is used to recognise the fair value of share-based payments to Directors, other key management personnel and employees as part of their remuneration, as described in Note 1(p). The Group has elected to retain all amounts originally recognised in the share-based payments reserve, regardless of whether the associated options are exercised or lapse unexercised.
(ii) Foreign Currency Translation ReserveThe foreign currency translation reserve is used to recognise exchange differences arising from the translation of financial statements of foreign subsidiaries, as described in Note 1(e). The relevant amounts included in the foreign currency translation reserve will be recognised in the consolidated statement of comprehensive income when each relevant investment in foreign subsidiary is disposed.

Karoon Gas Australia Ltd Annual Report 201058
notes to the finanCial statements continued
For the Financial Year ended 30 June 2010
Note 22. Subsidiaries
The consolidated financial statements incorporate the assets, liabilities and results of the following subsidiaries in accordance with the accounting policy described in Note 1(b):
Percentage of Equity and Voting Interests Held
Country of Business Incorporation Activities 2010 2009Name or Registration Carried on in % %
Parent Company:Karoon Gas Australia Ltd Australia Australia
Unlisted subsidiaries of Karoon Gas Australia Ltd: Eastern Pacific Coal Pty Ltd Australia Australia 100.0 100.0Karoon Energy International Ltd Australia Australia 100.0 100.0Karoon Gas (Browse Basin) Pty Ltd Australia Australia 100.0 100.0Karoon Gas Pty Ltd Australia Australia 100.0 100.0 Unlisted subsidiaries of Karoon Energy International Ltd: KEI (Brazil Santos) Pty Ltd Australia Australia 100.0 100.0KEI (Peru 112) Pty Ltd Australia Australia 100.0 100.0KEI (Peru Z38) Pty Ltd Australia Australia 100.0 100.0 Jointly owned unlisted subsidiary of Karoon Energy International Ltd and KEI (Brazil Santos) Pty Ltd: Karoon Petróleo & Gas Ltda Brazil Brazil 100.0 100.0 Branch of KEI (Peru 112) Pty Ltd: KEI (Peru 112) Pty Ltd, Sucursal del Peru Peru Peru 100.0 100.0 Branch of KEI (Peru Z38) Pty Ltd: KEI (Peru Z38) Pty Ltd, Sucursal del Peru Peru Peru 100.0 100.0
Note 23. Segment Information
(a) Description of SegmentsThe Group has identified its operating segments based on the internal reports that are reviewed and used by the Executive Chairman and Executive Director/Exploration Manager (identified as the “chief operating decision maker”) in assessing performance and in determining the allocation of resources.
The operating segments identified are based on the Group’s equity interest in each individual exploration permit. Discrete financial information (including expenditure on exploration and evaluation assets) is provided to the chief operating decision maker on a regular basis. In certain circumstances, individual exploration permits are aggregated into a single operating segment where the economic characteristics and long term planning and operational considerations of the individual exploration permits are such that they are considered interdependent.
The Group has identified three operating segments:
(i) Australia exploration – the Group is currently involved in the exploration and evaluation of hydrocarbons in four offshore permit areas within the Browse Basin, Australia: WA-314-P, WA-315-P, WA-398-P and AC/P8;
(ii) Brazil exploration – the Group is currently involved in the exploration and evaluation of hydrocarbons in five offshore Blocks within the Santos Basin, Brazil: Block 1037, Block 1101, Block 1102, Block 1165 and Block 1166; and
(iii) Peru exploration – the Group is currently involved in the exploration and evaluation of hydrocarbons in two Blocks in Peru: Block 144 (onshore) and Block Z-38 (offshore).
‘All other segments’ include amounts of a corporate nature not specifically attributable to an operating segment.

Karoon Gas Australia Ltd Annual Report 2010 59
The following items and associated assets and liabilities are not allocated to operating segments as they are not considered part of the core operations of any segment but are reviewed by the chief operating decision maker on a monthly basis:
• interestincome;
• netforeigncurrencygains(losses);
• financecosts;
• netemployeebenefitsexpense(includingnon-cashshare-basedpaymentsexpenseof$5,289,047(2009:$4,313,989));
• administrationandotheroperatingexpenses;
• depreciationandamortisationexpense;
• propertycosts;and
• incometaxexpense.
Employee benefits expenses and other operating expenses, that are associated with the exploration and evaluation activities and specifically relate to an area of interest, are allocated to the area of interest and are capitalised as exploration and evaluation assets.
Segment revenues and results do not include transfers between segments as intercompany balances are eliminated on consolidation.
The amounts provided to the chief operating decision maker with respect to total assets are measured in a manner consistent with that of the consolidated financial statements. Reportable segment assets are equal to consolidated total assets.
(b) Operating Segments All Other Australia Brazil Peru Segments ConsolidatedSegment Performance $ $ $ $ $
Revenue for financial year ended 30 June 2010 Segment revenue - - - - -
Interest income from unrelated entities 6,459,623
Total revenue 6,459,623
Result for financial year ended 30 June 2010 Segment result (70,705) (12,207) (3,001) (49,985) (135,898)
Interest income from unrelated entities 6,459,623Net foreign currency losses (8,514,337)Finance costs (244,275)Employee benefits expense (net) (6,719,729)Administration and other operating expenses (4,773,513)Depreciation and amortisation expense (415,667)Property costs (321,221)
Loss before income tax (14,665,017)Income tax expense (228,822)
Loss for financial year (14,893,839)

Karoon Gas Australia Ltd Annual Report 201060
notes to the finanCial statements continued
For the Financial Year ended 30 June 2010
Note 23. Segment Information (continued) All Other Australia Brazil Peru Segments ConsolidatedSegment Performance $ $ $ $ $
Revenue for financial year ended 30 June 2009 Segment revenue - - - - -
Interest income from unrelated entities 4,868,541
Total revenue 4,868,541
Result for financial year ended 30 June 2009 Segment result (253,096) (64,990) (370,165) (370,262) (1,058,513)
Interest income from unrelated entities 4,868,541Net foreign currency gains 9,770,509Finance costs (218,173)Employee benefits expense (net) (5,431,983)Administration and other operating expenses (2,843,254)Depreciation and amortisation expense (396,488)Property costs (237,873)
Profit before income tax 4,452,766Income tax -
Profit for previous financial year 4,452,766
All Other Australia Brazil Peru Segments ConsolidatedSegment Assets $ $ $ $ $
As at 30 June 2010
Segment asset information Cash and cash equivalents 10,230,163 1,965,638 223,434 74,703,601 87,122,836Exploration and evaluation expenditure carried forward 190,077,406 52,024,240 23,141,726 - 265,243,372Security deposits 35,115 11,723,326 4,810,814 70,307 16,639,562Inventories 360,081 - - - 360,081Other 1,339,515 28,487 3,343,996 1,834,430 6,546,428
Segment assets 202,042,280 65,741,691 31,519,970 76,608,338 375,912,279
As at 30 June 2009
Segment asset information Cash and cash equivalents 1,657,233 752,041 40,890 225,788,116 228,238,280Exploration and evaluation expenditure carried forward 61,865,072 31,728,583 6,642,007 - 100,235,662Security deposits 34,015 10,283,616 3,130,591 55,843 13,504,065Inventories 1,448,793 - - - 1,448,793Other 147,381 8,277 896,076 1,891,785 2,943,519
Segment assets 65,152,494 42,772,517 10,709,564 227,735,744 346,370,319

Karoon Gas Australia Ltd Annual Report 2010 61
(c) Other Segment InformationAdditions to non-current assets, other than financial assets (refer Note 3), during the reporting periods were:
All Other Australia Brazil Peru Segments Consolidated $ $ $ $ $
Financial year ended 30 June 2010Plant and equipment - - - 235,213 235,213Intangible assets - - - 283,677 283,677Exploration and evaluation expenditure carried forward 128,212,334 20,525,118 16,407,614 - 165,145,066 Financial year ended 30 June 2009 Plant and equipment - - - 562,020 562,020Intangible assets - - - 195,470 195,470Exploration and evaluation expenditure carried forward 36,181,513 6,402,420 7,201,762 - 49,785,695
Note 24. Joint Venture Operations
The Group had an interest in the following joint venture operations as at 30 June 2010 as follows:
Unincorporated Unincorporated Interest Interest 2010 2009 Exploration Permit % % Principal Activities Operator of Joint Venture Operation
WA-314-P 40.00 49.00 Exploration and evaluation ConocoPhillipsWA-315-P 40.00 49.00 Exploration and evaluation ConocoPhillipsWA-398-P 40.00 40.00 Exploration and evaluation ConocoPhillipsAC/P8 66.67 66.67 Exploration and evaluation Karoon Energy International LtdBlock Z-38 75.00* 20.00 Exploration and evaluation KEI (Peru Z38) Pty Ltd, Sucursal del Peru
* The Group’s 75% ownership interest is subject to obtaining regulatory approvals and completion of second and third year work commitments.
The following amounts represented the Group’s share of assets and liabilities employed in joint venture operations. The amounts are included in the consolidated financial statements, in accordance with the accounting policy described in Note 1(s), under the following classifications: Consolidated 2010 2009 $ $
Cash and cash equivalents 10,217,259 1,655,114Other receivables 872,986 143,234Inventories 360,081 1,488,793
Total current assets 11,450,326 3,287,141
Exploration and evaluation expenditure carried forward 212,525,349 68,421,167
Total non-current assets 212,525,349 68,421,167
Trade payables 19,130 31,890Sundry payables and accrued expenditure 10,651,597 3,799,504
Total current liabilities 10,670,727 3,831,394
Share of net assets employed in joint venture operations 213,304,948 67,876,914
The future recoverability of the carrying amount of capitalised exploration and evaluation expenditure is dependent on successful development and commercial exploitation or, alternatively, the sale of the respective areas of interest.

Karoon Gas Australia Ltd Annual Report 201062
notes to the finanCial statements continued
For the Financial Year ended 30 June 2010
Note 24. Joint Venture Operations (continued)Contingent liabilities in respect of joint venture operations are set out in Note 25. Exploration expenditure commitments and capital commitments in respect of joint venture operations are set out in Note 26.
Parent Company guarantees have been provided to ConocoPhillips guaranteeing Karoon Gas (Browse Basin) Pty Ltd’s performance under the joint venture operating agreements covering the three Browse Basin permit interests. In addition, a deed of cross charge has been entered into with ConocoPhillips by Karoon Gas (Browse Basin) Pty Ltd covering its three Browse Basin permit interests. Consolidated
2010 2009 $ $
Note 25. Contingent Liabilities and Contingent Assets (a) Contingent Liabilities The Group had contingent liabilities as at 30 June 2010 that may become payable in respect of:
(i) The Group has provided Agencia Nacional do Petróleo a letter of credit to carry out minimum work programs in relation to the Group’s exploration permits in the Santos Basin, Brazil. The Directors are of the opinion that the work commitments will be satisfied. The letter of credit is fully funded by way of payment of a security deposit (refer Note 13) to Banco BNP Paribas Brasil SA, which will be released once the work programs are met. 11,723,326 10,283,616
(ii) Performance guarantees (via letters of credit) were provided to Peru Petro SA for Block Z-38 and Block 144 by the Group for first and second year work commitments (2009: first year work commitments). The Directors are of the opinion that the work commitments will be satisfied under both Blocks. The letters of credit are fully funded by way of payment of security deposits (refer Note 13), which will be released once the work commitments are met. 4,517,490 3,130,591
(iii) A performance guarantee (via a letter of credit) was provided to a third party supplier by the Group for exploration work to be undertaken in Peru. The Directors are of the opinion that the Group’s obligation under the contract will be satisfied. The letter of credit is fully funded by way of payment of a security deposit (refer Note 13), which will be released once the Group’s obligation under the contract is satisfied. 293,324 -
(iv) Bank guarantees were provided in respect of operating lease rental agreements for the Group. These guarantees may give rise to liabilities in the Group if obligations are not met under these guarantees. The bank guarantees given to lessors are fully funded by way of payment of security deposits (refer Note 13). 70,307 55,843
(v) Joint venture operations In accordance with normal industry practice, the Group has entered into joint venture operations with other parties for
the purpose of exploring and evaluating its permit interests. If a participant to a joint venture operation defaults and does not contribute its share of joint venture operation obligations, then the remaining joint venture participants are jointly and severally liable to meet the obligations of the defaulting participant. In this event, the interest in the exploration permit held by the defaulting participant may be redistributed to the remaining joint venture participants.
In the event of a default, a contingent liability exists in respect of expenditure commitments due to be met by the Group in respect of the defaulting joint venture participant.
No material losses are anticipated in respect of any of the above contingent liabilities.
(b) Contingent AssetsThe Group had no contingent assets as at 30 June 2010 (30 June 2009: $Nil).

Karoon Gas Australia Ltd Annual Report 2010 63
Consolidated
2010 2009 $ $
Note 26. Commitments
(a) Capital Expenditure CommitmentsContracts for capital expenditure in relation to assets not provided for in the consolidated financial statements and payable:
(i) Drilling operations (joint venture operations) Not later than one year - 19,837,934
- 19,837,934
(ii) Seismic (non-joint venture operations) Not later than one year - 926,978
- 926,978
Total capital expenditure commitments - 20,764,912
(b) Operating Lease Rental CommitmentsNon-cancellable operating lease rentals not provided for in the consolidated financial statements and payable:
Not later than one year 294,144 147,046Later than one year but not later than five years 443,945 69,213
Total operating lease rental commitments 738,089 216,259
The Group has an office lease for Office 6 & 7, 34-38 Lochiel Avenue, Mount Martha with a primary three year term that expires on 31 January 2013. Rent is payable monthly in advance. Annually from the commencement date, the rent is adjusted by reference to the consumer price index. There is an option to extend for one further term of three years.
The Group also has an office lease at Level 10, 406 Collins Street, Melbourne with a five year term that expires 31 May 2012 and a 4%p.a. rental increase. Rent is payable monthly in advance. There is an option for a five year extension.
Overseas, the Group has an office lease at R. Farme de Amoedo 56, s 501, Ipanema, Rio de Janeiro, Brazil with a primary three year term that expires on 31 July 2013. Rent is payable monthly in advance. There is an option to extend for a further term of three years, on essentially the same terms and conditions, except that a market review of rent will be triggered on renewal.
Also overseas, the Group has an office lease at Av. Victor Andres Belaunde 147 Via Principal 120, Edificio Real 6 Piso 6 Sam Isidro, Peru with a primary term that expires on 30 April 2011. Rent is payable monthly in advance. There is an option to extend for a further term of 12 months, on essentially the same terms and conditions, except that a market review of rent will be triggered on renewal.

Karoon Gas Australia Ltd Annual Report 201064
notes to the finanCial statements continued
For the Financial Year ended 30 June 2010
Consolidated
2010 2009 $ $
Note 26. Commitments (continued)
(c) Exploration Expenditure CommitmentsSome subsidiaries within the Group have commitments for exploration expenditure arising from obligations to government, to perform minimum exploration and evaluation work and expend minimum amounts of money pursuant to the award of exploration permits WA-314-P, WA-315-P, WA-398-P, Block 1037, Block 1101, Block 1102, Block 1165, Block 1166, Block Z-38, Block 144 and AC/P8 (30 June 2009: WA-314-P, WA-315-P, WA-398-P, Block 1037, Block 1101, Block 1102, Block 1165, Block 1166, Block Z-38, Block 144 and AC/P8) not provided for in the consolidated financial statements and payable. Included in exploration expenditure commitments are $175,918,961 (30 June 2009: $190,678,235) of commitments that relate to the non-guaranteed work commitments:
Not later than one year 40,061,235 84,419,775Later than one year but not later than five years 215,123,116 234,928,576
Total exploration expenditure commitments 255,184,351 319,348,351
The above commitments include exploration expenditure commitments relating to joint venture operations:
Not later than one year 40,061,235 84,173,287Later than one year but not later than five years 156,618,029 174,187,866
Total joint venture operation exploration expenditure commitments 196,679,264 258,361,153
Estimates for future exploration expenditure commitments to government are based on estimated well and seismic costs, which will change as actual drilling locations and seismic surveys are organised, and are determined in current dollars on an undiscounted basis. The exploration and evaluation obligations may vary significantly as a result of renegotiations with relevant parties.
The commitments may also be reduced by the Group entering into farm-out agreements, which are typical of the normal operating activities of the Group.
Where exploration and evaluation expenditure included in this category relates to an existing contract for expenditure, the amount will be included in both categories (a) and (c) above.

Karoon Gas Australia Ltd Annual Report 2010 65
Consolidated
2010 2009 $ $
Note 27. Notes to the Consolidated Statement of Cash Flows(a) Reconciliation of Profit (Loss) For Financial Year to Net Cash Flows Used in Operating ActivitiesProfit (loss) for financial year (14,893,839) 4,452,766 Add (subtract): Depreciation of plant and equipment and amortisation of computer software 415,667 396,488Net foreign currency losses (gains) 8,393,323 (9,770,509)Non-cash share-based payments expense 5,289,047 4,313,989 Items classified as investing/ financing activities: Exploration and evaluation expenditure expensed or written off 136,812 1,075,643Net foreign currency losses 121,005 -Change in operating assets and liabilities (Increase) decrease in assets: Receivables – current 93,443 (1,623,510)Other assets (1,594,174) (80,740) Increase (decrease) in liabilities: Trade and other payables – current 173,457 558,296Provisions (33,217) 87,328Income tax liability 228,822 -
Net cash flows used in operating activities (1,669,654) (590,249)
Note 28. Share-based Payments The share-based payments plan is described below. There has been no cancellation to the plan during the financial year. Amendments to the plan and its continuing operation were approved by shareholders at the 2009 Annual General Meeting.
(a) Employee Share Option PlanThe Group had an ESOP, which has been operating since the listing of the Company on the ASX. ESOP options expire two and a half and four years after they are granted. The exercise price of ESOP options, issued during the financial year, is based on the volume weighted average price at which the Company’s ordinary shares are traded on the ASX during the 20 trading days before the ESOP options are granted. ESOP options may be exercised after the date the option was granted. If there is a change of control in the Company, all unexercised ESOP options will become immediately exercisable. Options granted under the ESOP carry no dividend or voting rights. When exercisable, each ESOP option is convertible into one ordinary share of the Company.
The following summary reconciles the outstanding ESOP options over unissued ordinary shares in the Company at the beginning and end of the financial year:
Consolidated Consolidated
2010 2009 2010 Weighted Average 2009 Weighted Average Number Exercise Price Number Exercise Price
Balance at beginning of financial year 3,010,000 $4.36 1,220,000 $2.95Granted during financial year 2,330,000 $12.08 2,440,000 $4.72Exercised during financial year (1,480,000) $3.76 (440,000) $2.57Cancelled during financial year (30,000) $6.84 - -Forfeited during financial year - - - -Expired during financial year - - (210,000) $2.03
Balance at end of financial year 3,830,000 $9.27 3,010,000 $4.36
Exercisable at end of financial year 2,030,000 $7.30 1,475,000 $3.54

Karoon Gas Australia Ltd Annual Report 201066
notes to the finanCial statements continued
For the Financial Year ended 30 June 2010
Note 28. Share-based Payments (continued)
The weighted average fair value of ESOP options granted during the financial year was $3.31 (2009: $1.00).
The weighted average share price when the ESOP options were exercised during the financial year was $9.38 (2009: $4.98).
ESOP options outstanding as at 30 June 2010 had a range of exercise prices from $2.95 to $14.07 (30 June 2009: $2.95 to $6.84) with a weighted average remaining contractual life of 866 days (30 June 2009: 519 days).
Details of ESOP options outstanding at the end of the financial year are:
Grant Date Expiry Date Exercise Price Per Option Number
27 November 2007 31 October 2010 $2.95 205,0003 November 2008 30 October 2010 $4.00 90,0003 November 2008 30 April 2011 $5.00 905,00028 November 2008 30 April 2011 $5.00 100,00029 June 2009 30 October 2011 $6.84 200,00023 November 2009 12 November 2013 $14.07 530,0009 December 2009 18 November 2013 $11.50 1,700,00025 March 2010 18 November 2013 $11.50 100,000
Total 3,830,000
(b) Other Share OptionsThe Group had granted other share options over unissued ordinary shares in the Company during the financial year to Directors. The exercise price of other share options is based on the weighted average price at which the Company’s ordinary shares are traded on the ASX during the 20 trading days before the options are granted. Other share options may be exercised after the date the option was granted. If there is a change of control of the Company, all unexercised other share options will become immediately exercisable. Other share options granted carry no dividend or voting rights. When exercisable, each other share option is convertible into one ordinary share of the Company.
Options issued to Directors are approved on a case-by-case basis by shareholders at relevant general meetings.
The following summary reconciles the outstanding other share options over unissued ordinary shares in the Company at the beginning and end of the financial year:
Consolidated Consolidated
2010 2009 2010 Weighted Average 2009 Weighted Average Number Exercise Price Number Exercise Price
Balance at beginning of financial year 5,500,000 $4.22 3,250,000 $2.45Granted during financial year 1,000,000 $14.07 4,500,000 $4.50Exercised during financial year (1,250,000) $4.00 (2,250,000) $2.23Forfeited during financial year - - - -Expired during financial year - - - -
Balance at end of financial year 5,250,000 $6.15 5,500,000 $4.22
Exercisable at end of financial year 4,250,000 $4.28 4,000,000 $3.93
The weighted average fair value of other share options granted during the financial year was $2.40 (2009: $0.84).
The weighted average share price when other share options were exercised during the financial year was $10.60 (2009: $4.08).
Other share options outstanding as at 30 June 2010 had a range of exercise prices from $2.95 to $14.07 (30 June 2009: $2.95 to $5.00) with a weighted average remaining contractual life of 446 days (30 June 2009: 636 days).

Karoon Gas Australia Ltd Annual Report 2010 67
Details of other share options outstanding at the end of the financial year are:
Grant Date Expiry Date Exercise Price Per Option Number
27 November 2007 31 October 2010 $2.95 500,00022 January 2008 31 October 2010 $2.95 500,00027 November 2008 30 April 2011 $4.00 250,0001 August 2008 30 April 2011 $4.50 750,0001 August 2008 30 April 2011 $5.00 750,00027 November 2008 30 April 2011 $4.50 750,00027 November 2008 30 April 2011 $5.00 750,00023 November 2009 12 November 2013 $14.07 1,000,000
Total 5,250,000
(c) Fair Value of OptionsThe fair value of each option during the financial year was estimated on grant date using the Black-Scholes option pricing model. The Black-Scholes option pricing model takes into account the exercise price, the term of the option, the vesting and performance criteria, the impact of dilution, the non-tradeable nature of the option, the share price at grant date and expected price volatility of the underlying share, the expected dividend yield and the risk-free interest rate for the term of the option.
The Group applied the following assumptions and inputs in estimating the weighted average fair value:
2010 2009
Weighted average exercise price $12.98 $4.58Weighted average life of options 1,408 days 595 daysWeighted average share price $8.21 $2.95Expected share price volatility 55% 64%Risk free interest rate 5.44% 6.09%Weighted average option value $2.90 $0.90
Historical volatility was the basis for determining expected share price volatility as it is assumed that this is indicative of future trends, which may not eventuate.
(d) Share-based Payments ExpenseTotal expenses arising from share-based payment transactions recognised during the financial year, included as part of employee benefits expense in the consolidated statement of comprehensive income, was $5,289,047 (2009: $4,313,989).
Note 29. Remuneration of Key Management Personnel
Directors and other key management personnel of Karoon Gas Australia Ltd at any time during the financial year were as follows:
Name Position
Directors Mr Robert Hosking Executive ChairmanMr Mark Smith Executive Director and Exploration ManagerMr Geoff Atkins Independent Non-Executive DirectorMr Stephen Power Non-Executive DirectorOther key management personnelMr Scott Hosking Company Secretary and Chief Financial OfficerMr Tim Hosking South American General ManagerMr Lino Barro Engineering ManagerMr David Ormerod South America Exploration ManagerMr Jorg Bein Geophysical Manager
All of the above persons were also Directors or other key management personnel during the previous financial year, except for Mr Tim Hosking.

Karoon Gas Australia Ltd Annual Report 201068
notes to the finanCial statements continued
For the Financial Year ended 30 June 2010
Note 29. Remuneration of Key Management Personnel (continued)
(a) Directors and Other Key Management Personnel RemunerationDirectors and other key management personnel remuneration was summarised as follows: Consolidated
2010 2009 $ $
Short-term employee benefits 2,096,999 1,810,705Post-employment benefits 150,680 123,400Long-term employee benefits (non-cash) - 69,531Share-based payments expense (non-cash) 3,203,299 3,707,955
Total key management personnel remuneration 5,450,978 5,711,591
Detailed remuneration disclosures are provided in Sections A-D of the audited Remuneration Report on pages 18 to 24.
(b) Employee Share Option Plan and Other Share OptionsInformation relating to the Company’s ESOP and other share options, including details of options granted, exercised, cancelled, forfeited and expired during the financial year and options over unissued ordinary shares in the Company outstanding at the end of the financial year to Directors, other key management personnel and others, is set out in Note 28.
(c) Options Over Unissued Ordinary Shares in the CompanyDuring the financial year 2,230,000 (2009: 5,500,000) options over unissued ordinary shares in the Company were issued to Directors and other key management personnel.
The movement of options over unissued ordinary shares in the Company held by Directors and other key management personnel, including their personally-related entities, during the financial year and previous financial year was as follows:
Total Total Balance as Net Balance as Vested as Exercisable Unexercisable at 1 July Granted As Options Change at 30 June at 30 June as at 30 June as at 30 June 2009 Remuneration Exercised Other 2010 2010 2010 2010
Executive DirectorsMr Robert Hosking 2,250,000 - (500,000) - 1,750,000 1,750,000 1,750,000 -Mr Mark Smith 2,250,000 - (750,000) - 1,500,000 1,500,000 1,500,000 -
Non-Executive DirectorsMr Geoff Atkins 500,000 500,000 - - 1,000,000 500,000 500,000 500,000Mr Stephen Power 500,000 500,000 - - 1,000,000 500,000 500,000 500,000
Other key management personnelMr Scott Hosking 300,000 300,000 (100,000) - 500,000 500,000 500,000 -Mr Tim Hosking 300,000 230,000 (300,000) - 230,000 230,000 230,000 -Mr Lino Barro 300,000 300,000 (200,000) - 400,000 100,000 100,000 300,000Mr David Ormerod 350,000 100,000 (150,000) - 300,000 200,000 200,000 100,000Mr Jorg Bein 300,000 300,000 (200,000) - 400,000 100,000 100,000 300,000
Total key management personnel 7,050,000 2,230,000 (2,200,000) - 7,080,000 5,380,000 5,380,000 1,700,000

Karoon Gas Australia Ltd Annual Report 2010 69
Total Total Balance as Net Balance as Vested as Exercisable Unexercisable at 1 July Granted As Options Change at 30 June at 30 June as at 30 June as at 30 June 2008 Remuneration Exercised Other 2009 2009 2009 2009
Executive DirectorsMr Robert Hosking 1,125,000 2,250,000 (1,125,000) - 2,250,000 1,500,000 1,500,000 750,000Mr Mark Smith 1,125,000 2,250,000 (1,125,000) - 2,250,000 1,500,000 1,500,000 750,000
Non-Executive DirectorsMr Geoff Atkins 500,000 - - - 500,000 500,000 500,000 -Mr Stephen Power 500,000 - - - 500,000 500,000 500,000 -
Other key management personnelMr Scott Hosking 200,000 200,000 (100,000) - 300,000 300,000 300,000 -Mr Lino Barro 200,000 200,000 - (100,000) 300,000 200,000 200,000 100,000Mr David Ormerod 200,000 400,000 (200,000) (50,000) 350,000 150,000 150,000 200,000Mr Jorg Bein 100,000 200,000 - - 300,000 200,000 200,000 100,000
Total key management personnel 3,950,000 5,500,000 (2,550,000) (150,000) 6,750,000 4,850,000 4,850,000 1,900,000
(d) ShareholdingsThe number of ordinary shares held by Directors and other key management personnel, including their personally-related entities, as at 30 June 2010 and 30 June 2009 was as follows:
Balance Ordinary Balance as at 1 July Received as Options Shares Ordinary as at 30 June 2009 Remuneration Exercised Purchased Shares Sold Other 2010
Executive DirectorsMr Robert Hosking 12,388,820 - 500,000 - (811,500) 25,000 12,102,320Mr Mark Smith 2,405,000 - 750,000 - (600,000) 17,037 2,572,037
Non-Executive DirectorsMr Geoff Atkins 427,500 - - - (10,000) - 417,500Mr Stephen Power 300,000 - - - - - 300,000
Other key management personnelMr Scott Hosking 160,979 - 100,000 124,840 (218,469) - 167,350Mr Tim Hosking 149,943 - 300,000 38,070 (208,100) - 279,913Mr Lino Barro - - 200,000 - (200,000) - -Mr David Ormerod 25,000 - 150,000 - (175,000) - -Mr Jorg Bein 12,000 - 200,000 1,492 (210,746) - 2,746
Total key management personnel 15,869,242 - 2,200,000 164,402 (2,433,815) 42,037 15,841,866
Balance Ordinary Balance as at 1 July Received as Options Shares Ordinary as at 30 June 2008 Remuneration Exercised Purchased Shares Sold Other 2009
Executive DirectorsMr Robert Hosking 12,251,820 - 1,125,000 12,000 (1,000,000) - 12,388,820Mr Mark Smith 2,280,000 - 1,125,000 - (1,000,000) - 2,405,000
Non-Executive DirectorsMr Geoff Atkins 427,500 - - - - - 427,500Mr Stephen Power 300,000 - - - - - 300,000
Other key management personnelMr Scott Hosking 146,676 - 100,000 140,935 (226,632) - 160,979Mr Lino Barro - - - - - - -Mr David Ormerod - - 200,000 - (175,000) - 25,000Mr Jorg Bein 42,000 - - - (30,000) - 12,000
Total key management personnel 15,447,996 - 2,550,000 152,935 (2,431,632) - 15,719,299

Karoon Gas Australia Ltd Annual Report 201070
notes to the finanCial statements continued
For the Financial Year ended 30 June 2010
Note 29. Remuneration of Key Management Personnel (continued)
(e) Loans to Directors and Other Key Management PersonnelThere were no loans to Directors or other key management personnel during the financial year or previous financial year.
(f) Other Transactions with Directors and Other Key Management PersonnelRefer to Note 30 for other transactions with Directors and other key management personnel during the financial year. Note 30. Related Party Transactions
Transactions between related parties are on normal commercial terms and conditions no more favourable than those available to other parties, unless otherwise stated.
(a) Parent CompanyThe ultimate Parent Company within the Group is Karoon Gas Australia Ltd.
(b) SubsidiariesInterests in subsidiaries are set out in Note 22.
During the financial year, the Group provided accounting, administrative and technical services to subsidiaries at cost. This allocation was based on costs recharged on a relevant time allocation of employees and consultants and associated office charges.
Other transactions that occurred were advancement of intercompany loans at Nil% interest rate (2009: Nil%) and no fixed term for repayment as it was used for funding the intercompany operations and therefore will not be repaid within 12 months. Loans are unsecured and are repayable in cash.
The above transactions are eliminated on consolidation.
Parent Company guarantees provided to third parties guaranteeing a subsidiary’s performance under joint venture operating agreements are set out in Note 24.
A bank guarantee provided by the Parent Company to a third party, guaranteeing a subsidiary’s performance under an operating lease rental agreement, is set out in Note 25.
(c) Directors and Other Key Management PersonnelDisclosures relating to Directors and other key management personnel are set out in the Directors’ Report and Note 29.
Apart from the details disclosed in this note, no Director or other key management personnel has entered into a material contract with the Group since the end of the previous financial year and there were no material contracts involving Directors’ or other key management personnel interests subsisting as at 30 June 2010 other than as stated in the Directors’ Report (Remuneration Report, Section C).
(d) Superannuation ContributionsDuring the financial year, the Group contributed to accumulation type benefit funds administered by external fund managers. The funds cover all Australian domiciled employees and Directors of the Company. The current contribution is 9% p.a. (2009: 9% p.a.) of employee cash remuneration. Contributions to superannuation funds, on behalf of Directors and employees, during the financial year by the Group amounted to $284,771 (2009: $205,815).
(e) Other Related Party Transactions Within the GroupDuring the financial year, Mr Stephen Power, a Director, had an interest in Napier Legal Pty Ltd which provided legal services to the Group. The value of transactions during the financial year in the Group was $376,960 (2009: $181,386).
During the financial year and the previous financial year, Mr Mark Smith, a Director, had an interest in IERS (Australia) Pty Ltd, which has an ongoing agreement with the Group to provide geophysical fault seal analysis software. This contract had been negotiated at commercial terms and does not include monetary compensation. Instead, the Group provides testing and ongoing development of the geophysical fault seal analysis software in return for its use.

Karoon Gas Australia Ltd Annual Report 2010 71
Company
2010 2009 $ $
Note 31. Parent Company Financial Information
(a) Summary Financial InformationThe individual financial statements for Karoon Gas Australia Ltd show the following aggregate amounts:
Statement of financial position Current assets 75,836,959 223,890,905Non-current assets 283,387,194 115,560,501
Total assets 359,224,153 339,451,406
Current liabilities 750,024 5,781,787Non-current liabilities 60,738 93,955
Total liabilities 810,762 5,875,742
Net assets 358,413,391 333,575,664
Equity Issued capital 381,147,212 347,331,271 Accumulated losses (36,012,928) (21,745,667) Share-based payments reserve 13,279,107 7,990,060
Total equity 358,413,391 333,575,664
Loss for financial year (14,267,261) (12,781,663)
Total comprehensive loss for financial year (14,267,261) (12,781,663)
(b) Contingent Liabilities of Parent Company(i) Bank guarantees were provided in respect of operating lease rental agreements
at Melbourne and Mount Martha for the Company and a subsidiary. These guarantees may give rise to liabilities in the Parent Company if obligations are not met under these guarantees. The bank guarantees given to lessors are fully funded by way of payment of security deposits (refer Note 13). 58,612 55,843
(ii) Performance guarantees (via letters of credit) were provided to Peru Petro SA for Block Z-38 and Block 144 by the Company for first and second year work commitments (2009: first year work commitments). The Directors are of the opinion that the work commitments will be satisfied under both Blocks. The letters of credit are fully funded by way of payment of security deposits (refer Note 13), which will be released once the work commitments are met. 4,517,490 3,130,591
(iii) A performance guarantee (via a letter of credit) was provided to a third party supplier by the Parent Company for exploration work to be undertaken in Peru. The Directors are of the opinion that the obligation under the contract will be satisfied. The letter of credit is fully funded by way of payment of a security deposit (refer Note 13), which will be released once the obligation under the contract is satisfied. 293,324 -
(iv) The Company’s present intention is to provide the necessary financial support for all Australian incorporated subsidiaries, whilst they remain wholly owned subsidiaries, as is necessary for each company to pay all debts as and when they become due.

Karoon Gas Australia Ltd Annual Report 201072
notes to the finanCial statements continued
For the Financial Year ended 30 June 2010
Note 31. Parent Company Financial Information (continued)
(c) Guarantees Entered into by Parent Company Parent Company guarantees provided to third parties guaranteeing a subsidiary’s performance under joint venture operating agreements are set out in Note 24.
A bank guarantee provided by the Parent Company to a third party, guaranteeing a subsidiary’s performance under an operating lease rental agreement, is set out in Note 25.
Note 32. Subsequent Events
Since 30 June 2010, the following material events have occurred:
(a) Petrobras Farm-inDuring August 2010, Karoon Petróleo & Gas Ltda, a wholly owned subsidiary of the Company, executed a farm-in agreement with Petrobras to acquire a 20% interest in Blocks 1352 (Maruja Prospect) and 1354 (Quasi Prospect) located in the offshore Santos Basin, Brazil.
Subject to obtaining regulatory approvals, Karoon Petróleo Gas Ltda will earn a 20% interest in both blocks by funding 35% of the costs of drilling an exploration well in the Maruja Prospect and funding 20% of an exploration well in the Quasi Prospect, as part of a two well drilling program. Karoon Petróleo & Gas Ltda will then pay its equity share of continued work and reimburse Petrobras for sunk costs.
(b) Block 1354 Exploration WellDrilling the Quasi Prospect in Block 1354 commenced in August 2010 and the well reached a total depth of 2011 metres on 7 September 2010. Wireline tests were completed and no commercial hydrocarbons were encountered. The well is expected to be permanently plugged and abandoned and the rig released on or about 18 September 2010.
(c) Potential Brazilian Stock Exchange ListingOn 9 September 2010, Karoon Petróleo & Gas Ltda filed a draft prospectus and reference form with the Comissão de Valores Mobiliários (the “CVM”), the Brazilian securities regulator. This was the first step in the process to conduct an initial public offering of Karoon Petróleo & Gas Ltda’s common shares on the BM&FBOVESPA, in São Paulo, Brazil to the public. The prospectus and reference form are subject to a one month period of review by the CVM. The Group will assess the merits of a BM&FBOVESPA listing during this period but is under no obligation to proceed to list. In the event that the Group proceeds with the offering, the Company expects to retain an ownership interest of approximately 70% to 75% in Karoon Petróleo & Gas Ltda.
Unless otherwise indicated, the financial effect of these events has not been recognised in either the consolidated financial statements or notes for the financial year.
The Annual Report was authorised for issue by the Board of Directors on 17 September 2010. The Board of Directors has the power to amend and reissue the consolidated financial statements.
(d) Share Placement
On 16 September 2010, the Company completed a successful share placement to sophisticated and professional investors of 26,631,929 fully paid ordinary shares at $7 per share to raise total gross proceeds of $186,423,503.

Karoon Gas Australia Ltd Annual Report 2010 73
direCtors’ deClaration
In the Directors’ opinion:
(a) the consolidated financial statements and notes, set out on pages 29 to 72, are in accordance with the Corporations Act 2001, including:
(i) complying with relevant Australian Accounting Standards and the Corporations Regulations 2001; and
(ii) giving a true and fair view of the Group’s financial position as at 30 June 2010 and of its performance for the financial year ended on that date; and
(b) there are reasonable grounds to believe that the Company will be able to pay its debts as and when they become due and payable.
Note 1(a) confirms that the consolidated financial statements also comply with International Financial Reporting Standards as issued by the International Accounting Standards Board.
The Directors have been given the declarations by the Executive Chairman and Chief Financial Officer required by Section 295A of the Corporations Act 2001.
This declaration is made in accordance with a resolution of the Board of Directors.
On behalf of the Directors:
Mr Robert HoskingExecutive Chairman
17 September 2010Melbourne

Karoon Gas Australia Ltd Annual Report 201074
independent auditor’s report
Independent Auditor’s Report to the Members of Karoon Gas Australia Ltd
Report on the Financial ReportWe have audited the accompanying financial report of Karoon Gas Australia Ltd (the “Company”), which comprise the consolidated statement of financial position as at 30 June 2010, the consolidated statement of comprehensive income, the consolidated statement of changes in equity and the consolidated statement of cash flows for the financial year ended on that date, a summary of significant accounting policies, other explanatory notes and the Directors’ Declaration for the “consolidated entity”. The consolidated entity comprises the Company and the subsidiaries it controlled at the financial year’s end or from time to time during the financial year.
Directors’ Responsibility for the Financial Report The Directors of the Company are responsible for the preparation and fair presentation of the financial report in accordance with Australian Accounting Standards (including the Australian Accounting Interpretations) and the Corporations Act 2001. This responsibility includes establishing and maintaining internal controls relevant to the preparation and fair presentation of the financial report that is free from material misstatement, whether due to fraud or error; selecting and applying appropriate accounting policies; and making accounting estimates that are reasonable in the circumstances. In Note 1 the Directors also state, in accordance with Australian Accounting Standard AASB 101 Presentation of Financial Statements, that compliance with the Australian equivalents to International Financial Reporting Standards ensures that the financial report, comprising the consolidated financial statements and notes, complies with International Financial Reporting Standards.
Auditor’s Responsibility Our responsibility is to express an opinion on the financial report based on our audit. We conducted our audit in accordance with Australian Auditing Standards. These Auditing Standards require that we comply with relevant ethical requirements relating to audit engagements and plan and perform the audit to obtain reasonable assurance whether the financial report is free from material misstatement.
An audit involves performing procedures to obtain audit evidence about the amounts and disclosures in the financial report. The procedures selected depend on the auditor’s judgement, including the assessment of the risks of material misstatement of the financial report whether due to fraud or error. In making those risk assessments, the auditor considers internal control relevant to the Company’s preparation and fair presentation of the financial report in order to design audit procedures that are appropriate in the circumstances, but not for the purpose of expressing an opinion on the effectiveness of the Company’s internal control. An audit also includes evaluating the appropriateness of accounting policies used and the reasonableness of accounting estimates made by the Directors, as well as evaluating the overall presentation of the financial report.
Our procedures include reading the other information in the Annual Report to determine whether it contains any material inconsistencies with the financial report.
Our audit did not involve an analysis of the prudence of business decisions made by Directors or management.
We believe that the audit evidence we have obtained is sufficient and appropriate to provide a basis for our audit opinions.
PricewaterhouseCoopersABN 52 780 433 757
Freshwater Place2 Southbank BoulevardSOUTHBANK VIC 3006GPO Box 1331LMELBOURNE VIC 3001DX 77Website: www.pwc.com/auTelephone 61 3 8603 1000Facsimile 61 3 8603 1999
Liability limited by a scheme approved under Professional Standards Legislation

Karoon Gas Australia Ltd Annual Report 2010 75
IndependenceIn conducting our audit, we have complied with the independence requirements of the Corporations Act 2001.
Auditor’s OpinionIn our opinion:
(a) the financial report of Karoon Gas Australia Ltd is in accordance with the Corporations Act 2001, including:
(i) giving a true and fair view of the consolidated entity’s financial position as at 30 June 2010 and of its performance for the financial year ended on that date; and
(ii) complying with Australian Accounting Standards (including the Australian Accounting Interpretations) and the Corporations Regulations 2001; and
(b) the financial report also complies with International Financial Reporting Standards as disclosed in Note 1(a).
Matters Relating to the Electronic Presentation of the Audited Financial ReportThis auditor’s report relates to the financial report of the Company for the year ended 30 June 2010 included on the Company’s web site. The Company’s Directors are responsible for the integrity of the Company’s web site. We have not been engaged to report on the integrity of this web site. The auditor’s report refers only to the financial report named above. It does not provide an opinion on any other information which may have been hyperlinked to/from the financial report. If users of this report are concerned with the inherent risks arising from electronic data communications they are advised to refer to the hard copy of the audited financial report to confirm the information included in the audited financial report presented on this web site.
Report on the Remuneration ReportWe have audited the Remuneration Report included in pages 18 to 25 of the Directors’ Report for the financial year ended 30 June 2010. The Directors of the Company are responsible for the preparation and presentation of the Remuneration Report in accordance with Section 300A of the Corporations Act 2001. Our responsibility is to express an opinion on the Remuneration Report, based on our audit conducted in accordance with Australian Auditing Standards. Auditor’s Opinion In our opinion, the Remuneration Report of Karoon Gas Australia Ltd for the financial year ended 30 June 2010 complies with Section 300A of the Corporations Act 2001.
PricewaterhouseCoopers
Charles Christie MelbournePartner 17 September 2010
Karoon Gas Australia Ltd Annual Report 201076
statement of Corporate governanCe
The revised ASX Corporate Governance Council Principles and Recommendations published during August 2007 (revised Corporate Governance Council Principles) established the framework for how the Board of Directors oversees the Company and performs its functions on behalf of shareholders. The Company’s objective is to achieve best practice in corporate governance and the Company’s Directors, senior management and employees are committed to achieving this objective.
This statement summarises the Company’s main corporate governance principles and practices.
Role of the Board of Directors
The roles and responsibilities of the Board of Directors are to oversee and direct the senior management of the Company by:
• definingandmonitoringthestrategicdirectionoftheCompany;
• defining policies and procedures to ensure the Company operates within the legal, ethical and social requirements of its environment;
• establishingcontrolandaccountabilitysystemswithintheGroup’soperationstoconformtothelegalrequirementsandtheexpectations of shareholders and other stakeholders;
• definingandmonitoringthemanagementofaneffectiveriskassessmentstrategy;
• securingfundstodeveloptheCompany’sassets;
• drivingCompanyperformance;
• fromtimetotime,reviewingandmonitoringmanagementandCompanyperformance;
• appointingandappraisingtheExecutiveChairmanandanyotherExecutiveDirector;
• ensuringthatthereareadequateplansandproceduresforsuccessionplanning;
• reviewingandapprovingtheremunerationoftheExecutiveChairmanandseniormanagement;
• approvingandmonitoringtheprogressofmajorcapitalexpenditure,capitalmanagement,acquisitionsanddivestitures;and
• approvingandmonitoringfinancialandotherreporting.
The Company’s Board Charter can be found on the Company’s website at www.karoongas.com.au.
Composition of the Board of Directors
The Board of Directors is constituted by four Directors. The skills, experience and expertise relevant to the position of each Director who is in office at the date of the Annual Report and their term of office are detailed in the Directors’ Report.
The Non-Executive Directors of the Company are Mr Geoff Atkins and Mr Stephen Power. Mr Geoff Atkins is an Independent Director. The Company considers Mr Stephen Power to be a Non-Independent Director, due to Napier Legal Pty Ltd, a law firm in which Mr Power has an interest, providing legal services to the Company. These services are provided by Napier Legal Pty Ltd on normal commercial terms and conditions and at market rates.
Recommendation 2.1 of the revised Corporate Governance Council Principles provides that a majority of the Board of Directors should be Independent Directors. The Company does not currently comply with this Recommendation. The composition of the Board is reviewed on an ongoing basis having regard to the growth of the Company’s business, with a view to appointing a majority of Independent Directors.
A Non-Executive Director is independent under ASX Corporate Governance Principles and Recommendations if he or she does not fall within any of the following materiality thresholds:
• lessthan10%ofCompanysharesareheldbytheDirectorandanyentityorindividualdirectlyorindirectlyassociatedwiththeDirector; or
• noneoftheDirector’sincomeortheincomeofanindividualorentitydirectlyorindirectlyassociatedwiththeDirectorisderivedfrom a contract with the Company other than income derived as a Director of the Company.
Recommendation 2.2 of the revised Corporate Governance Council Principles provides that the Chairman should be an Independent Director. Also, Recommendation 2.3 of the revised Corporate Governance Council Principles provides that the roles of the Chairman and the Chief Executive Officer should not be exercised by the same individual. The Company’s Chairman also acts as its Chief

Karoon Gas Australia Ltd Annual Report 2010 77
Executive Officer and was also its founding Director and is one of the Company’s largest shareholders. Given the stage of the Company’s growth, the Board of Directors considers it acceptable for the Chairman to be an Executive Director and not independent.
Meeting Schedule
The Board of Directors meets at least every two months with additional committee meetings, if and when required, to discuss technical and specific matters.
Advice to Directors
Subject to the approval of the Board of Directors, an individual Director may engage an independent professional adviser at the expense of the Company in appropriate circumstances.
Board Committees
The Board of Directors may establish appropriate committees to assist in its roles and responsibilities at appropriate points in the Company’s evolution.
The Board of Directors has established an Audit Committee.
The Board of Directors has established a Remuneration Committee.
The Board of Directors has not established a nomination committee, but proposes to establish a nomination committee at the appropriate time.
Audit Committee
The role of the Audit Committee is to advise on the establishment and maintenance of a framework of internal control and the appropriate ethical standards for the management of the Group. The Company has formally adopted an Audit Committee Charter. A copy of the Audit Committee Charter can be found on the Company’s website at www.karoongas.com.au.
The Audit Committee also reviews the quality and reliability of financial information prepared for use by the Board of Directors in determining policies or for inclusion in financial statements.
The Audit Committee consists of:
Mr Geoff Atkins (Chairman)
Mr Robert Hosking
Mr Stephen Power
Recommendation 4 of the revised Corporate Governance Council Principles recommends that the Audit Committee be structured so that it:
• consistsonlyofNon-ExecutiveDirectors;
• consistsofamajorityofIndependentDirectors;
• ischairedbyanIndependentChairman,whoisnotChairmanoftheBoardofDirectors;and
• hasatleastthreemembers.
The recommendation is to ensure that the Audit Committee is of sufficient size, independence and technical expertise to discharge its mandate effectively. The Company has not fully complied with this recommendation. The Company has appointed two Non-Executive Directors to the Audit Committee, one of which acts as its Chairman. However, due to the current structure of the Board, the Company is unable to fully comply with Recommendation 4 in that an Executive Director sits on the Audit Committee. The Company proposes to replace the Executive Director of the Audit Committee with a Non-Executive Director when an additional Non-Executive Director is appointed to the Board of Directors.

Karoon Gas Australia Ltd Annual Report 201078
statement of Corporate governanCe continued
The responsibilities of the Audit Committee include:
• reviewingtheintegrityoftheCompany’sfinancialreportingandoverseeingtheindependenceofexternalauditors;
• liaisingwithexternalauditorsandensuringthattheannualstatutoryauditsandhalfyearauditorreviewsareconductedinaneffective manner;
• reviewinginternalcontrolsandrecommendingimprovements;
• reviewingthehalfyearfinancialreportpriortolodgementofthisdocumentwiththeASX,andanysignificantadjustmentsrequiredas a result of the review;
• reviewingthedraftannualfinancialreportandtheindependentauditor’sreportandmakingthenecessaryrecommendationstothe Board of Directors for approval of the annual financial report;
• reviewingtreasuryrecommendationsandmakingnecessaryrecommendationstotheBoardofDirectorsforapproval;and
• reviewingandreportingonanyspecialreviewsdeemednecessarybytheBoardofDirectors.
The Audit Committee reports to the Board of Directors after each Committee Meeting and relevant papers and minutes are provided to all Directors.
External Auditors
Recommendation 4.4 of the revised Corporate Governance Council Principles provides that the Company should make publicly available information on procedures for the selection and appointment of the external auditor and the rotation of external audit engagement partners.
The Company appointed the current external auditors, PricewaterhouseCoopers, during the financial year ended 30 June 2009.The Company has prepared a Selection and Appointment of External Auditor Policy, whereby the Company reviews every three years and assesses performance and potentially rotates the external auditor. The External Auditor Selection Policy is available on the Company’s website at www.karoongas.com.au.
Nomination Committee
Recommendation 2.4 of the revised Corporate Governance Council Principles provides that a Board of Directors should establish a nomination committee. Given the size of the Board of Directors, the Board of Directors considers that the same efficiencies that may be derived from a nomination committee with respect to a larger board may not, in the current circumstances, be derived from a formal nomination committee structure. However, the Board of Directors has processes in place which address the issues that would otherwise be considered by a nomination committee.
The Company’s Constitution provides that, at each Annual General Meeting of the shareholders, one third of the Directors (excluding the Managing Director) must resign, with Directors resigning by rotation based on the date of their appointment. Directors resigning by rotation may offer themselves for re-election. This procedure ensures that no Director can serve for more than three years without being re-elected.
No new Directors were appointed during the financial year. The Board of Directors proposes adopting a Selection and Appointment of Directors Policy prior to the appointment of any new Directors. Once adopted, the Selection and Appointment of Directors Policy will be made available on the Company’s website.
Remuneration CommitteeThe Remuneration Committee is responsible for the review of and recommendation to the Board of Directors on:
• theCompany’srecruitment,retentionandterminationpoliciesandproceduresforseniorexecutives;
• seniorexecutives’remunerationandincentives;
• superannuationarrangements;and
• theremunerationframeworkforDirectors.

Karoon Gas Australia Ltd Annual Report 2010 79
The Company’s remuneration policy is designed to ensure that:
• remunerationiskeptcompetitiveinordertoattractandretaintalentedandmotivatedemployeesandDirectorstoKaroon;
• thereisaclearrelationshipbetweenperformance,responsibilityandremuneration;and
• aperformanceevaluationprocessiscreatedtomonitortheBoardofDirectorsandseniorexecutives.
The Remuneration Committee consists of:
Mr Geoff Atkins (Chairman)
Mr Mark Smith
Mr Stephen Power
Recommendation 8.1 of the revised Corporate Governance Council Principles recommends that the Remuneration Committee be structured so that it:
• consistsofamajorityofIndependentDirectors;
• ischairedbyanIndependentDirector;and
• hasatleastthreemembers.
The Company does not fully comply with all of this Recommendation due to the current structure of the Board. However, the composition of the Remuneration Committee will be reviewed when new Directors are appointed to the Board of Directors.
A copy of the Remuneration Committee Charter can be found on the Company’s website at www.karoongas.com.au.
Remuneration Policy
As an overall policy, the Company will remunerate in such a way that it motivates Directors and employees to pursue the long-term growth and success of the Company within an appropriate control framework that demonstrates a clear relationship between key executive performance and remuneration. The Remuneration Committee is responsible for executive remuneration and making recommendations to the Board of Directors.
Executive remuneration is set by the Board of Directors and may contain salary, bonuses and ESOP options.
Non-Executive Directors are remunerated by way of Directors’ fees in the form of cash and superannuation contribution at market levels, as well as non-performance-related share option incentives.
The aggregate Directors’ fee pool to Non-Executive Directors is set and may not be increased without prior approval of the shareholders at a general meeting.
Options over unissued ordinary shares of the Company issued to Directors are approved on a case-by-case basis by shareholders at relevant general meetings.
The Company has prepared a policy restricting the hedging of ESOP options over unissued ordinary shares of the Company, including unvested entitlements, under the Company’s ESOP and other share options, and will make this available on the Company’s website once adopted.
The Company has not established any schemes for retirement benefits, other than superannuation, for Non-Executive Directors.
Further information on the remuneration of the Directors and other key management personnel can be found in the Remuneration Report section of the Directors’ Report.

Karoon Gas Australia Ltd Annual Report 201080
statement of Corporate governanCe continued
Performance Review
Recommendation 2.5 of the revised Corporate Governance Council Principles provides that companies should disclose the process for evaluating the performance of the Board of Directors, its committees and individual Directors.
During the financial year, performance evaluation of the Executive Directors was undertaken and submitted to the Remuneration Committee. Non-Executive Directors did not receive a formal evaluation. Due to the nature and stage of the Company’s operations and its evolution, the Board of Directors was of the view that a formal performance review of the Non-Executive Directors was not necessary.
The Board Performance Review Policy for senior executives and the Board of Directors is available on the Company’s website at www.karoongas.com.au.
Management Performance Review
Recommendation 1.2 of the revised Corporate Governance Council Principles provides that the performance of senior executives should be reviewed regularly against appropriate measures.
Performance evaluation for senior executives has taken place during the financial year.
Role of the Company Secretary
All Directors have access to the Company Secretary and the appointment and removal of the Company Secretary is a matter for decision by the Board of Directors as a whole.
The Company Secretary is accountable to the Board of Directors, through the Chairman, on all corporate governance matters.
The Company Secretary supports the effectiveness of the Board of Directors by monitoring compliance with Board policy and procedures and coordinating the completion and dispatch of the Board agenda and briefing materials.
Ethical Standards, Compliance with Obligations and Responsible Decision Making
The Directors, senior executives, employees and consultants are required to act with the utmost integrity and objectivity, striving at all times to enhance the reputation and performance of the Group. The Company also strives to comply with legal and other obligations to stakeholders.
The Company has developed a Code of Conduct for the Board of Directors, senior management and employees of the Company. The Company’s Code of Conduct can be found on the Company’s website at www.karoongas.com.au. The Code includes:
• thepracticesnecessarytomaintainconfidenceintheCompany’sintegrity;
• thepracticesnecessarytotakeintoaccounttheirlegalobligationsandthereasonableexpectationsofstakeholders;and
• theresponsibilityandaccountabilityofindividualsforreportingandinvestigatingreportsofunethicalpractices.
Fair Dealings and Related Party Transactions
A Director, or entities in which a Director has a significant interest and/or influence, who enters into a transaction with the Company must make full disclosure of all material elements of the transaction to the Chairman, or, if the Director involved is the Chairman, to the Board of Directors.
In addition, contracts with Directors, or entities in which Directors have a significant interest and/or influence, must be approved by the Audit Committee in advance of committing the Company to:
• contractsforthesupplyofgoodsand/orserviceswhichextendbeyondoneyear,orwherethetotalvalueofgoodsand/orservices supplied under the contract will, in any one year, exceed $25,000;
• allagreementstoleaseand/orleasesofproperty;and
• allagreementsforacquisitionordisposalofproperty,exceptbywayofpublicauction.

Karoon Gas Australia Ltd Annual Report 2010 81
Any Director who is a member of the Audit Committee and who has a significant interest and/or influence in relation to a contract to be approved by the Audit Committee must absent themself from the meeting and not participate in any vote to approve such contract.
Policy and Procedure for Share Trading
Directors and officers (including employees and consultants) are prohibited from dealing in securities of the Company if they are in possession of information concerning the Company which, if made public, a reasonable person would expect to have a material impact on the price or value of the Company’s securities (“price sensitive information”).
Directors, officers, employees and consultants are prohibited from dealing in securities of the Company during any embargo period declared by the Chairman or Company Secretary. Embargo periods may typically include the period of two weeks prior to the release of the Company’s half year results and final results to the ASX.
These restrictions in dealing in securities of the Company are subject to discretion exercised by the Chairman.
Prior to dealing in securities of the Company, Directors and officers (including employees and consultants) must:
• adviseaDirectorortheCompanySecretaryoftheproposeddealingtoensurethatthereisnotanyimminentASXannouncementthat contains price sensitive information; and
• confirmtotheDirectororCompanySecretarythatheorsheisnotawareofanypricesensitiveinformationthathasnotbeenreleased to the ASX.
Directors and officers (including employees and consultants) must advise the Company Secretary of any dealing in securities of the Company within two days of such dealing.
The Company’s Share Trading Policy can be found on the Company’s website at www.karoongas.com.au.
Environment
The Company has a Health, Safety and Environment Policy and is committed to conducting all its activities in an environmentally responsible manner.
The Company’s Health, Safety and Environment Policy can be found on the Company’s website at www.karoongas.com.au.
Disclosure of Information
The Company aims to provide honest and open disclosure of information in dealing with stakeholders, subject to appropriate commercial considerations associated with competitive and sensitive information.
The Company has developed a Continuous Disclosure Policy to ensure the compliance of the Company with the various laws and ASX Listing Rule obligations in relation to disclosure of information to the market and to ensure accountability at a senior executive level for that compliance.
The Company’s Continuous Disclosure Policy can be found at www.karoongas.com.au.
The Role of Shareholders
The Board of Directors aims to ensure that all shareholders are informed of all major developments affecting the Company’s state of affairs. Information is communicated to shareholders as follows:
• theAnnualReportisdistributedtoanyshareholderswhorequestacopy.TheBoardofDirectorsensuresthattheAnnualReportincludes relevant information about the operations of the Group during the financial year, changes in the state of affairs of the Group and other disclosures required by the Corporations Act 2001;
• thehalfyearfinancialreport,preparedinaccordancewiththerequirementsoftheCorporations Act 2001, is subject to an external auditor’s review. The half year financial report is sent to any shareholder who requests a copy;

Karoon Gas Australia Ltd Annual Report 201082
statement of Corporate governanCe continued
• proposedmajorchangesintheCompanywhichmayimpactonshareownershiprightsaresubmittedtoavoteofshareholders;and
• theCompanypostsallreports,ASXandmediareleasesandcopiesofsignificantpresentationsontheCompany’swebsite at www.karoongas.com.au.
In addition, news announcements and other information are sent by email to all persons who have requested their details be added to the Company’s electronic mailing list. If requested, the Company, where appropriate, will provide general information by email, facsimile or post.
The Company will ensure that the Annual General Meeting is held in a manner that enables as many shareholders as possible to attend and encourages effective participation by shareholders at the Annual General Meeting.
The Company will arrange to have its external auditor attend the Company’s Annual General Meeting and be available to answer shareholder questions about the conduct of the audit, preparation and content of the independent auditor’s report.
The Chairman of the Annual General Meeting will allow a reasonable opportunity for shareholders to ask questions about the Company’s performance and operations and ask questions of the external auditor concerning the conduct of the audit, preparation and content of the independent auditor’s report.
Risk Assessment and Management
Recommendation 7.1 of the revised Corporate Governance Council Principles provides that companies should establish policies for the oversight and management of material business risks and disclose a summary of those policies. The Board of Directors has overall responsibility for monitoring compliance and oversight of these policies along with ensuring that they are efficient and effective.
Currently, as part of the Group’s strategy to implement an integrated framework of control, the Board of Directors continually identifies and monitors the key business and financial risks that could jeopardise the Group achieving its objectives. The Board of Directors has and continues to develop appropriate controls to effectively manage those risks. These include:
• financialcontrolsaresetinplacebytheuseofanauthoritymatrix,generalpurchasingprinciplesandapprovalsprocedures.Allexpenditure is closely monitored by the Audit Committee on behalf of the Board of Directors and reported on a quarterly basis. The Chairman of the Audit Committee also works closely with the Company’s finance personnel prior to Board meetings in order to understand financial risks and report such risks to the Board of Directors. Management accounts are prepared monthly for the Board of Directors to ensure information congruence between management and the Board of Directors;
• theCompanyoffsetstheriskofoperationalfailuresusingappropriateinsurance,withcoversforthirdpartyliability,wellcontrol,day-to-day office and business insurance and operator’s extra expense;
• theCompanyprotectsitsemployeesthroughtheadoptionofaHealth,SafetyandEnvironmentPolicyandtravelinsuranceforperiods where employees are out of state or out of country, along with membership to emergency assistance and management for an employee overseas; and
• operationalreportingissubmittedtotheBoardofDirectorsateveryBoardmeetingtoensuredecisionsaremadeinanefficientand effective manner. Reports include reviews of current assets, potential acquisitions and general operational issues and/or opportunities.

Karoon Gas Australia Ltd Annual Report 2010 83
Management Accountability
In compliance with Recommendation 7.3, the Board of Directors encourages management accountability for the Company’s annual financial report by requiring the Executive Chairman and Chief Financial Officer to state in writing to the Board of Directors that:
• theCompany’sannualfinancialreportpresentsatrueandfairview,inallmaterialrespects,oftheCompany’sfinancialconditionand operational results and is in accordance with relevant Australian Accounting Standards; and
• theannualfinancialreportiscompiledinaccordancewithbestpracticeandisproperlymonitoredusingtheAuditCommitteeand the external auditors to ensure a sound system of risk management and control.
Recommendation 7.2 of the revised Corporate Governance Council Principles provides that the Board of Directors should require management to design and implement the risk management and internal control system to manage the Company’s material business risks and report to it on whether those risks are being managed effectively. Throughout the financial year, Karoon has reviewed and where required improved its risk management and internal compliance and control systems. The Company will continue to review and improve its risk management systems over the coming financial period.

Karoon Gas Australia Ltd Annual Report 201084
additional seCurities exChange information
Additional information required by ASX Listing Rules and not disclosed elsewhere in the Annual Report is set out below. The information was applicable for the Company as at 7 September 2010.
Distribution of ShareholdingThe number of shareholders ranked by size of holding is set out below:
Size of Holding Number of Holders Number of Ordinary Shares on Issue
Less than 1,000 3,973 2,026,8831,001 to 5,000 3,383 8,493,1555,001 to 10,000 888 6,596,18910,001 to 100,000 956 25,402,615More than 100,000 108 135,027,356
Total 9,308 177,546,198
There were 74 shareholders holding less than a marketable parcel of ordinary shares to the value of $500.
Substantial ShareholdersThe number of ordinary shares held by substantial shareholders and their associates (who held 5% or more of total fully paid ordinary shares on issue), as disclosed in substantial holder notices given to the Company, is set out below:
Fully Paid Ordinary Shares % of Issued Shareholder Number Held Ordinary Shares
Talbot Group Holdings Pty Ltd 26,317,356 14.82Wellington Management Group, LLP and its related bodies corporate 24,856,467 14.00Mr Robert Hosking 12,102,320 6.82
Total 63,276,143 35.64
Twenty Largest ShareholdersThe names of the 20 largest shareholders of the Company’s ordinary shares are listed below:
Fully Paid Ordinary Shares % of Issued Shareholder Number Held Ordinary Shares
1 HSBC Custody Nominees (Australia) Limited 33,478,308 18.862 Talbot Group Holdings Pty Ltd <Talbot Equities A/C> 15,317,043 8.633 ANZ Nominees Limited <Cash Income A/C> 11,894,302 6.704 Talbot Group Investments Pty Ltd 11,000,313 6.205 Ropat Nominees Pty Ltd 10,477,880 5.906 JP Morgan Nominees Australia Limited 8,649,990 4.877 Woodross Nominees Pty Ltd 5,124,564 2.898 National Nominees Limited 4,771,742 2.699 Citicorp Nominees Pty Limited 3,923,902 2.2110 IERS (Australia) Pty Ltd <Smith Family Investment A/C> 1,591,500 0.9011 HSBC Custody Nominees (Australia) Limited – GSCO ECA 1,165,946 0.6612 Mrs Mara Spong 1,125,746 0.6313 UBS Wealth Management Australia Nominees Pty Ltd 1,011,534 0.5714 Mr Donald James Erskine <Erskine Invest Super A/C> 1,000,000 0.5615 Warbont Nominees Pty Ltd <Settlement Entrepot A/C> 998,833 0.5616 Rose Burton Pty Ltd 815,000 0.4617 Mrs Pauline Frolley 765,746 0.4318 Mr Mark Smith 750,000 0.4219 Brian Dunn Investments Pty Ltd 704,258 0.4020 Penelope Baldick 702,912 0.40
Total 115,269,519 64.92

Karoon Gas Australia Ltd Annual Report 2010 85
Unlisted Equity Securities: Options
The following options over unissued ordinary shares of the Company were unquoted:
Number of Unlisted Number of Holders Options on Issue
Options issued pursuant to Company’s ESOP 30 3,830,000Other share options issued 4 5,250,000
Total 34 9,080,000
Voting Rights
(a) Ordinary Shares, Fully PaidVoting rights of shareholders are governed by the Company’s Constitution. In summary, on a show of hands every holder of ordinary shares present at a meeting in person or by proxy is entitled to one vote, and upon a poll each such attending shareholder is entitled to one vote for every fully paid ordinary share held.
(b) Unlisted OptionsNo voting rights.
Other informationThe Company was incorporated as a public company on 11 November 2003.
The Company was admitted to the ASX official list during June 2004 and quotation of its ordinary shares commenced on 8 June 2004.
The register of securities is held at Computershare Investor Services Pty Limited, Yarra Falls, 452 Johnston Street, Abbotsford VIC 3067 Australia. Investor enquiries can be made via telephone on 1300 850 505 (within Australia).
Schedule of InterestsExploration Permit Basin % Interest Held
AC/P8 Bonaparte, Australia 66.67WA-314-P Browse, Australia 40.00WA-315-P Browse, Australia 40.00*WA-398-P Browse, Australia 40.00*Block 1037 Santos, Brazil 100.00Block 1101 Santos, Brazil 100.00Block 1102 Santos, Brazil 100.00Block 1165 Santos, Brazil 100.00Block 1166 Santos, Brazil 100.00Block 1352 Santos, Brazil 20.00^
Block 1354 Santos, Brazil 20.00^
Block 144 Maranon, Peru 100.00Block Z-38 Tumbes, Peru 75.00#
* 1.5% ORR for first five years, going to 2% thereafter.# The Group’s 75% ownership interest is subject to obtaining regulatory approvals and completion of second and third year work commitments.^ The Group’s 20% ownership interest is subject to obtaining regulatory approvals and satisfying farm-in obligations.

Karoon Gas Australia Ltd Annual Report 201086
glossary of terms
Term Definition
2D seismic Two-dimensional seismic.
3D seismic Three-dimensional seismic.
$ or cents Units of Australian currency.
AASB Australian Accounting Standards Board.
appraisal well A well drilled to confirm the size or quality of a hydrocarbon discovery.
associated gas Natural gas found in association with oil, dissolved either in the oil or as a cap of free gas above the oil.
ASX Australian Securities Exchange or ASX Limited (ABN: 98 008 624 691).
ATO Australian Taxation Office.
AUD Australian currency.
barrel or bbl Barrel of oil, inclusive of condensate. A quantity of 42 United States gallons; equivalent to approximately 159 litres.
basin An ancient natural depression on the earth’s surface in which sediments, eroded from higher surrounding ground levels, accumulated and were preserved.
BCF Billion cubic feet (1,000,000,000 cubic feet); equivalent to approximately 28.3 million cubic metres.
Block A licence or concession area. It may be almost any size or shape, although usually part of a grid pattern.
boe Barrel of oil equivalent. The factor used to convert gas to oil equivalent is based upon an approximate energy value of 6,000 standard cubic feet per barrel and not price equivalence at the time.
BTU British Thermal Unit. The unit of measurement of the quantity of heat required to raise the temperature of one pound of water by one degree fahrenheit, equivalent to 1055.056 joules.
condensate Hydrocarbons which are predominantly pentane and heavier compounds which are in a gas phase in the reservoir and which separate out from natural gas at the well head and condense to liquid at lower pressures and temperatures.
ConocoPhillips ConocoPhillips (Browse Basin) Pty Ltd.
contingent resources Quantities of hydrocarbons which are estimated, on a given date, to be potentially recoverable from known accumulations, but which are not yet currently considered to be commercially recoverable for lack of market or suitable price.
CPRS Carbon Pollution Reduction Scheme.
CSEM Controlled Source Electro Magnetic (survey).
Director A Director of Karoon Gas Australia Ltd.
Discovery well The first successful well on a new prospect.
DST Drill stem test.
economically The estimated quantity of hydrocarbons in an area of interest that can be expected to be profitably recoverable reserves extracted, processed and sold under current and foreseeable economic conditions.
ESOP The Karoon Gas Australia Employee Share Option Plan.
exploration The process of identifying, discovering and testing prospective hydrocarbon regions and structures, mainly by interpreting regional and specific geochemical, geological, geophysical survey data and drilling.
farm-in and farm-out A commercial agreement in which an incoming joint venture participant (the “farmee”) earns an interest in an exploration permit by funding a proportion of exploration and evaluation expenditures, while the participant owning the interest in the exploration permit (the “farmor”) pays a reduced contribution. The interest received by a farmee is a farm-in while the interest transferred by the farmor is a farm-out.

Karoon Gas Australia Ltd Annual Report 2010 87
Term Definition
FBT Fringe Benefits Tax in Australia.
field An area consisting of a single reservoir or multiple reservoirs all grouped on or related to the same individual geological structural feature or stratigraphic condition. The field name refers to the surface area although it may refer to both the surface and underground productive formation.
financial year Financial year ended 30 June 2010.
Karoon or Group Karoon Gas Australia Ltd and its subsidiaries.
GST Goods and Services Tax in Australia.
hydrocarbon A compound of the elements hydrogen and carbon, in either liquid or gaseous form. Natural gas and petroleum are mixtures of hydrocarbons.
Company or Parent Company Karoon Gas Australia Ltd.
lead A potential hydrocarbon target which has been identified but requires further evaluation before it is drill ready, at which point it becomes a prospect.
LNG Liquefied natural gas.
LPG Liquid petroleum gas.
m Metres.
market capitalisation The product of the Company’s share price multiplied by the total number of ordinary shares issued by the Company.
migration Hydrocarbons are often found in formations other than those in which their organic source was deposited. This movement often covers considerable distances and is known as migration.
mm Million.
mmbbls Millions of barrels (1,000,000 barrels).
mmscf/d Millions of standard cubic feet per day; equivalent to 28,317 cubic metres per day.
Monte Carlo simulation Where there is uncertainty in the variables used in the calculation of economically recoverable reserves, the ranges of possible values of each variable can be incorporated in a Monte Carlo simulation calculation to produce a range of probabilistic outcomes that reflect that uncertainty. The “mean” is the expected outcome. The P10 (probability greater than 10%) is often used as the maximum case, the P50 (probability of 50%) the mid case and the P90 (probability greater than 90%) the minimum case.
mRT Metres rotary table.
NGER Act National Greenhouse and Energy Reporting Act 2007.
operator One joint venture participant that has been appointed to carry out all operations on behalf of all the joint venture participants.
ordinary shares The ordinary shares in the capital of Karoon Gas Australia Ltd.
ORR Over-riding royalty.
p.a. Per annum.
permit A hydrocarbon tenement, lease, licence, concession or Block.
Petrobras Petróleo Brasileiro SA.
play A trend within a prospective basin that has common geologic elements containing one or more fields, prospects or leads with common characteristics.
previous financial year Financial year ended 30 June 2009.

Karoon Gas Australia Ltd Annual Report 201088
glossary of terms continued
Term Definition
prospect A geological or geophysical anomaly that has been surveyed and defined, usually by seismic data, to the degree that its configuration is fairly well established, and on which further exploration such as drilling can be recommended.
prospectivity Referring to the likelihood of finding commercial hydrocarbons.
prospective resource The term used to describe undiscovered volumes in an exploration prospect yet to be drilled.
psia Pounds per square inch absolute.
REAL Brazilian currency.
recoverable gas An estimated measure of the total amount of gas which could be brought to surface from a given reservoir, in a good quality reservoir this is usually in the order of 70-80% of the estimated gas-in-place.
reserves Quantities of economically recoverable hydrocarbons estimated to be present within a trap.
reservoir A porous and permeable rock formation to store and transmit fluids such as hydrocarbons and water.
rig The equipment needed for drilling a well. It includes the onshore and offshore vehicles, mobile platforms or vessel on which the equipment is stored.
risk Prospect risk or geologic risk is the assessed chance that the drilling of the prospect will be successful in finding significant volumes of hydrocarbons. The risk is calculated by multiplying the chance of success of each of the petroleum system elements involved in the prospect.
seismic survey A type of geophysical survey where the travel times of artificially created seismic waves are measured as they are reflected in a near vertical plane back to the surface from subsurface boundaries. This data is typically used to determine the depths and form of stratigraphic units and in making subsurface structural contour maps and ultimately in delineating prospective structures.
spud To start drilling a new well.
Talisman Talisman Oil & Gas (Australia) Pty Limited.
TCF Trillion cubic feet (1,000,000,000,000 cubic feet).
unrisked A risk value has not been applied to an estimate of hydrocarbon volume either in place or recoverable.
USD United States dollars.
This report does not constitute an offer of securities for sale in the United States by the company or any of its affiliates, nor may the Company’s securities, or those of its affiliates, be offered or sold in the United States absent registration or an exemption from registration as provided in the US Securities Act of 1933, as amended, and the rules and regulations thereunder. Neither the company nor any of its affiliates has registered their respective securities in the United States, nor does the Company or any of its affiliates have any such intention to register their respective securities. The information contained in this report shall not constitute an offer to sell or the solicitation of an offer to buy, nor shall there be any sale of the company’s securities, or those of its affiliates, in any jurisdiction in which such offer, solicitation or sale would be unlawful prior to registration, exemption from registration or qualification under the securities laws of any such jurisdiction.
Karoon Gas Australia Ltd Annual Report 2010
CorporAte direCtory
89
Board of Directors
Mr Robert Hosking – Executive ChairmanMr Mark Smith – Executive DirectorMr Geoff Atkins – Independent Non-Executive DirectorMr Stephen Power – Non-Executive Director
Company Secretary
Mr Scott Hosking
Audit Committee Members
Mr Geoff Atkins (Chairman of Committee)Mr Robert HoskingMr Stephen Power
Remuneration Committee Members
Mr Geoff Atkins (Chairman of Committee)Mr Mark SmithMr Stephen Power
Registered Office and Head Office
Office 7A, 34-38 Lochiel AvenueMount Martha VIC 3934Australia
ACN 107 001 338ABN 53 107 001 338Telephone +61 3 5974 1044Facsimile +61 3 5974 1644Email [email protected] www.karoongas.com.au
External Auditor
PricewaterhouseCoopers AustraliaFreshwater Place2 Southbank BoulevardSouthbank VIC 3006Australia
Telephone +61 3 8603 1000Facsimile +61 3 8603 1999
Bankers
National Australia Bank Limited271 Collins StreetMelbourne VIC 3000Australia
HSBC Bank Australia LimitedLevel 12, 140 William StreetMelbourne VIC 3000Australia
Share Registrar
Computershare Investor Services Pty LimitedYarra Falls452 Johnston StreetAbbotsford VIC 3067Australia
Telephone 1300 850 505 (investors within Australia) +61 3 9415 4000Facsimile +61 3 9473 2500Website www.computershare.com
Securities Exchange Listing
The Company’s ordinary shares are listed on the ASX.The home exchange is Melbourne VIC.ASX Code KAR
Notice of Annual General Meeting
The Annual General Meeting of Karoon Gas Australia Ltdwill be held at:
River Room 3 at the Crown TowersLevel 1, Crown Towers, 8 Whiteman StreetSouthbank VIC 3006
Time 11am (registration from 10am)Date Thursday 18 November 2010

Karoon Gas Australia Ltd
ACN 107 001 338 | ABN 53 107 001 338Office 7A, 34-38 Lochiel Avenue, Mount Martha VIC 3934 AustraliaTelephone 61 3 5974 1044 | Facsimile 61 3 5974 [email protected] | www.karoongas.com.au


