2010 IBA Report.indd
24
Kenya’s Important Bird Areas - Status and Trends, 2010 1 Kenya’s Important Bird Areas Status and Trends 2010 Compiled by: Timothy Mwinami, Fred Barasa, Alex Ngari, John Musina, James Mwang’ombe, Erastus Kanga and Joseph Kiema Edited by: Fleur Ng’weno and Paul Matiku Illustrations by: Edwin Selempo, Nicholas Mwema & Andrew Kamiti Layout by: Ernest Mwongela Collaborating Organisations: Nature Kenya, NMK, KWS, KFS, NEMA and RSPB and BirdLife International
Transcript of 2010 IBA Report.indd

Kenya’s Important Bird Areas - Status and Trends, 2010 1
Kenya’sImportant Bird Areas
Status and Trends2010
Compiled by: Timothy Mwinami, Fred Barasa, Alex Ngari, John Musina,James Mwang’ombe, Erastus Kanga and Joseph Kiema
Edited by: Fleur Ng’weno and Paul Matiku
Illustrations by:Edwin Selempo, Nicholas Mwema & Andrew Kamiti
Layout by: Ernest Mwongela
Collaborating Organisations:Nature Kenya, NMK, KWS, KFS, NEMA and RSPB and BirdLife International

Kenya’s Important Bird Areas - Status and Trends, 20102
Copyright© Nature Kenya - the East Africa Natural History Society, 2012
ISBN 9966-761-06-19-5
Recommended citation: Mwinami, T., Barasa, F., Ngari, A., Musina, J., Mwango’mbe, J., Kanga, E., Kiema, J., Matiku, P., Ng’weno, F. (2012). Kenya’s Important Bird Areas: Status and Trends 2010. Nature Kenya, Nairobi.
Published by Nature Kenya - the East Africa Natural History Society P.O. Box 44486 GPO, Nairobi 00100, KenyaPhone (+254) (0) 20 3537568 or (+254) (0) 751624312, 771343138Fax (+254) (0) 20 3741049E-mail: offi [email protected]: www.naturekenya.org
Cover photo: Turner’s Eremomela Photo by Peter Steward
Turner’s Eremomela Eremomela turneri is a tiny, active bird of the treetops in Kakamega, South and North Nandi forests. It forages for insects in the canopy, and often joins mixed-species fl ocks. It is listed as globally endangered by the IUCN Red List of Threatened Species.
Turner’s Eremomela has a patchy distribution that is poorly known. In Kenya, it is only found in the western mid-altitude forests of Kakamega and North and South Nandi. An isolated population also occurs in parts of the Albertine Rift where the Democratic Republic of Congo (DRC) meets western Uganda.
Little information is available on the biology of this bird. Turner’s Eremomela is found mostly in the canopy of large forest trees but also along streams, at forest edges and in mature trees remaining in cleared areas. At South Nandi, more than half of sightings were of groups of four and it showed a strong preference for one large tree species, Croton megalocarpus. The population of Turner’s Eremomela in South Nandi Forest has been estimated at c.13,900 birds in 1998. Further documentation is required.
Kakamega, South and North Nandi Forests have experienced very serious threats from encroachment for cultivation, uncontrolled tree-felling and charcoal making. In Kakamega and North Nandi, intense grazing by cattle from small-scale farms affects forest structure and forest regeneration. In South Nandi, commercial logging has extracted large volumes of timber in a highly destructive manner. However, Nature Kenya, in partnership with government agencies and local communities, has mobilized resources to address threats in the three sites.
In South Nandi conservation investment has began to post forest improvement, with reduced reported cases of illegal logging. An integrated forest management plan has been developed through support from Department for International Development UK. Implementation of the management plan in South Nandi, and conservation work in Kakamega, will be supported through a biodiversity improvement project by GEF/UNDP.

Kenya’s Important Bird Areas - Status and Trends, 2010 3
CONTENTS
Acronyms
Executive summary Important Bird AreasMonitoring results: Status of habitats and species
Lesser Flamingo population trends on Lake Elmentaita for the period 1990 - 2010
Pressure: Threats to IBAsResponses: Conservation action in IBAsOverall recommendations
Recommendations for government and non-governmental organisationsAppendices
Appendix 1. Pressure and threats in IBAs in 2010Appendix 2. List of contributorsAppendix 3. Important Bird Areas Monitoring FrameworkSummary of trends in Status of Kenya’s IBAs in 2010
578
1112151819
21222324
ASFGA – Arabuko-Sokoke Forest Guides AssociationCFAs - Community Forest AssociationsEIA - Environmental Impact AssessmentIBAs – Important Bird AreasGEF - Global Environment FacilityIPM - Integrated Pest ManagementIUCN – World Conservation Union (International Union for Conservation of Nature)KENVO - Kijabe Environment VolunteersKFS - Kenya Forest ServiceKIEE - Kenya Institute of Environmental Experts
KWS - Kenya Wildlife ServiceNEMA - National Environment Management AuthorityNLC - National Liaison CommitteeNMK - National Museums of KenyaPA - Protected AreaPFM - Participatory Forest ManagementRSPB - Royal Society for the Protection of Birds (UK)SSG(s) - Site Support Group(s)TARDA - Tana and Athi River Development AuthorityUNDP - United Nations Development ProgrammeUK - United Kingdom

Kenya’s Important Bird Areas - Status and Trends, 20104
ACKNOWLEDGEMENTSOur appreciation goes to all donors for their fi nancial
support which enabled the production of this report. We are particularly grateful to the European Commission who provided most of the funds, through the Royal Society for Protection of Birds (RSPB), to produce this report. We especially wish to thank the project Consolidating Gains in Policy Making and Livelihood Improvement through Biodiversity Conservation and Sustainable Use of Natural Resources Project, supported by the Spanish Agency for International Cooperation through BirdLife International.
We extend our appreciation to all who fi lled the basic monitoring forms, without which this report would not have been compiled. Special thanks go to the National Liaison Committee (NLC) for the administrative and coordination support to IBA monitoring and production of this report. We are also thankful to reviewers at BirdLife African Partnership Secretariat (BLAPS), who helped to improve the quality of this report.
DisclaimerThe views and opinion in this report are not necessarily those of the European Union and other donors who have given their fi nancial support to produce this report.

Kenya’s Important Bird Areas - Status and Trends, 2010 5
EXECUTIVE SUMMARYThe 2010 IBA Status and Trends Report provides information on the conditions, pressures and responses
at 61 Important Bird Areas (IBAs) in Kenya. (See the inside back cover for the names and locations of IBAs in Kenya.) Some Important Bird Areas are protected areas, while others are on unprotected land.
This report is a result of excellent NGO-Government-Local community collaborative efforts to save species, conserve sites and habitats, promote ecological sustainability and engage people to take action for biodiversity conservation at the IBAs. The monitoring results enable the stakeholders to track the conditions, pressures and responses at IBAs. The recommendations contained in this report constitute a suite of corrective measures that should guide future decision making for the conservation of IBAs and key biodiversity areas.The 2010 report is a summary of analyses of information gathered for 37 representative IBAs from 59 basic monitoring forms and other secondary data. The data is extrapolated to cover the 61 IBAs in Kenya.
Nature Kenya, in collaboration with the National Museums of Kenya, Kenya Wildlife Service, Kenya Forest Service, National Environment Management Authority, other governmental and non-governmental organizations and Site Support Groups, working under the auspices of the IBA National Liaison Committee, have sustained the IBA monitoring programme, whose cumulative results since year 2004 are published in this report.
The analysis of data on the status of Kenyan IBAs indicated a positive trend, from a mean score of 0.97 in 2009, to a mean score of 1.11 in 2010. There was an increment in the proportion of IBAs under the “small improvement” category from 11% in 2009 to 22% in 2010. None of the assessed IBAs was noted to have undergone a large deterioration in 2010, unlike in 2009.
State: • There was a slight improvement in the status of the IBAs in 2010 as compared to 2009. The improvement in condition is partly attributable to enhanced responses.
Results
Bet
ter C
ondi
tion
Av. s
core
s
Examples include listing of several Rift Valley lakes under the World Heritage Convention, declaration of Lake Elmenteita as a wildlife sanctuary, gazettement of Lake Kanyaboli in Yala Swamp as a National Reserve and the purchase of more land for the conservation and protection of Sharpe’s Longclaw in Kinangop Grasslands. Recovery from the 2007/2008 post election impacts on the forests in western Kenya also allowed the implementation of forest conservation measures in Kakamega, South Nandi, North Nandi and Cherangani forest IBAs.

Kenya’s Important Bird Areas - Status and Trends, 20106
Pressure: • There was a slight decline in the pressures affecting IBAs in 2010 compared to 2009. Notably,NGO-Government-Local community partnerships for joint forest management increased joint planning, decision making and scouting, leading to reduced destruction of forest IBAs. Examples here include: Kakamega Forest, South and North Nandi forests, Cherangani Forest, Mt Kenya, Kereita, Taita Hills, Shimba Hills and Mau Forest Complex.
However, many threats recorded in 2009 continued into 2010, and new threats were recorded. These include proposed biofuel crop plantations in Tana River Delta and Dakatcha Woodland, which, should they be allowed to proceed, have huge potential to cause extensive damage to the sites’ biodiversity.
Gre
ater
Thr
eats
Av. s
core
s
Bet
ter C
onse
rvat
ion
Av. s
core
s
Responses• : Conservation interventions to counter threats within the IBAs improved in 2010 compared to 2009. Great efforts have been put in by the Government and local communities to rehabilitate degraded areas. Government agencies have implemented some previous recommendations; for example, the Kenya Forest Service (KFS) increased efforts in production of management plans and initiation of reforestation programmes in heavily degraded forest reserves.
There is also ongoing capacity strengthening within the National Environment Management
Authority (NEMA). The Kenya Wildlife Service and National Museums of Kenya, in collaboration with IUCN, were instrumental in the listing of Rift Valley Lakes under the World Heritage Convention.
Government efforts to fi nd homes for most of the internally displaced persons from the 2007/2008 post election violence may have paid off as reduced demand for timber and fuel wood, especially in the Rift Valley. Local community awareness and support from government agencies averted or delayed threats in South Nandi Forest, Dakatcha Woodland and the Tana River Delta.

Kenya’s Important Bird Areas - Status and Trends, 2010 7
Important Bird AreasImportant Bird Areas are priority sites for conservation,
identifi ed by using birds. A site qualifi es as an IBA when it hosts: (i) globally threatened species – birds threatened with extinction (ii) restricted-range species – birds that have highly restricted distributions (iii) biome-restricted species – a series of bird species characteristic of a particular biome (iv) exceptionally large numbers of congregatory (fl ocking) birds.
Some Important Bird Areas are protected areas, while others are on private or community lands. An IBA needs to be large enough to support self-sustaining populations of the bird species for which it was identifi ed, or, in the case of migrants, fulfi l their requirements for the duration of their presence. Although birds have been used to defi ne IBAs, conservation of these sites ensures continued survival of other forms of biodiversity.
Important Bird Areas cover all the key habitats types for Kenya: 22 forests (20 of them protected areas); 19 wetlands (only 5 protected); 12 semi-arid and arid areas (7 are protected); 6 moist grasslands (3 are protected); and 2 other unprotected sites. Of the 61 sites, 47 IBAs shelter globally threatened bird species, 29 are home to range-restricted birds, 32 contain biome-restricted bird species, and 13 IBAs hold large congregations of birds
The IBA programme Kenya began in 1995, and has been coordinated by Nature Kenya. The process of identifying IBAs, monitoring them, advocating for their conservation and working with local communities in capacity building, sustainable livelihoods, sound natural resource management and partnership building, has been supported by many partners and donors. Partners in implementing the IBA programme are represented at the National Liaison Committee (NLC), which brings together various governmental and non-governmental institutions in Kenya. The NLC provides an important link between key actors in conservation and natural resource management in Kenya.
Monitoring of sites is an important aspect of the IBA programme and has been ongoing since 2004. Monitoring fi ndings have been published annually as the IBA Status and Trends reports. Monitoring is modelled to track the “Pressure” or “Threats” to an IBA, the “Status” or “Condition” of sites, and “Responses” or “Interventions” to address threats within an IBA, by measuring a set of parameters as indicators. IBA monitoring therefore embraces PSR models adopted by the Convention on Biological Diversity (CBD) to which Kenya is a party. This makes it possible for results from IBA monitoring to contribute to the National Reporting to the CBD.
Approach to Monitoring of IBAs in Kenya
The state of an IBA is assessed based on the population of those birds for which the site is recognized as an
IBA, or the habitats they use. Using a ‘weakest link’ approach, the IBA is assigned a status score based on the habitat or species with the ‘worst’ status. The IBA condition status scores are: 3 = good; 2 = moderate; 1 = poor; 0 = very poor.
Pressures or threats are assessed by scoring information on time, scope and severity. Timing refers to the particular period a threat is occurring. Scope refers to the extent or scale of the threat; while severity refers to the extent of the impact of the threat. Using the weakest link, the threat that poses the highest risk is used to assign the score to the whole IBA. Timing, scope and severity scores are combined to give an impact score as follows: 3 = good; 2 = moderate; 1 = poor and 0 = very poor.
Response is assessed by scoring the protection status of the IBA; management planning; and conservation efforts at the site. Each of these is scored on a scale of 0-3, with the sum showing the overall site response status score: 3 = high; 2 = medium; 1 = low; and 0 = negligible. Each year, information and data on IBAs is contributed by community-based Site Support Groups (SSGs), Kenya Wildlife Service (KWS), Kenya Forest Service (KFS), National Museums of Kenya (NMK), fi eld researchers and scientists, birdwatchers and visitors to IBAs including tourists and tour guides. The media is also a source of useful information. The data generated from IBA monitoring is used to produce the graphs in this report. The current report is based on data from 59 basic monitoring forms, retrieved from 37 out of the 61 IBA sites. In the 24 sites where no data was received, the 2009 data was used.
See Table 3 on page 24 for a summary of IBA site status, and a map of Kenya’s IBA on the inside back cover.

Kenya’s Important Bird Areas - Status and Trends, 20108
The analysis of data on the status of Kenyan IBAs indicated a positive trend, from a mean score of
0.97 in 2009, to a mean score of 1.11 in 2010. There was an increment in the proportion of IBAs under the “small improvement” category from 11% in 2009 to 22% in 2010. None of the assessed IBAs was noted to have undergone a large deterioration in 2010, unlike in 2009. The status results shown in Figure 1 indicate a slight
Av. s
core
s
Figure 1 . Trends in the status of IBAs in Kenya(n = 61)
recovery from a dip that occurred in 2008 and 2009, primarily as a result of impacts of post election violence and prolonged drought. The year 2010 received, overall, better rains than the previous two years, helping to ease pressure on natural resources within IBAs. It is also likely that the conservation investments within IBAs are beginning to yield fruits.
The slight improvement in the condition of Kenyan IBAs is mainly attributable to a number of conservation actions. These include: Finalisation of 11 Forest Management Plans, including those for South and North Nandi Forests: increased rehabilitation of degraded sites within IBAs such as the Mau Forest Complex, Kikuyu Escarpment
Table 1. Comparison of the state of Kenya’s IBAs in 2009 and 2010
2009 (n=60) 2010 (n=61)
State All (%) Protected (%)
Unprotected (%)
All (%) Protected (%)
Unprotected (%)
0 0 0 0 0 05 5 0 5 5 011 8 3 22 20 23 0 3 2 0 2
58 38 20 44 21 2318 7 11 27 11 165 0 5 0 0 0
Large improvementModerate improvementSmall improvementNo changeSmall deteriorationModerate deteriorationLarge deterioration
Monitoring results: Status of habitats and species, 2010
Forest, Mt Kenya, Marenji Forest and Cherangani Hills; continued implementation of the Forest Policy and Forest Act of 2005; and enhanced community participation and involvement in decision making and management of forests resources. The partnership between Kenya Forest Service and the communities, as Community Forest Associations (CFAs), in the raising of seedlings has been an incentive for income generating activities as part of forest protection and rehabilitation. There has been a lot of awareness creation on alternative sources of fuel wood and usage of energy saving stoves by KFS and the Site Support Groups, which has led to a decrease in extraction of wood from some forests.
The improvement is also attributable to the efforts by Kenya Wildlife Service, including the declaration of Lake Elmenteita as a wildlife sanctuary and gazettement of Lake Kanyaboli in Yala Swamp as a National Reserve. The listing of the Rift Valley Lakes under the World Heritage Convention under the leadership of the National Museums of Kenya and Kenya Wildlife Service was a major policy response. Increased conservation awareness among local communities together with enhanced positive response by NEMA delayed proposed bio-energy developments in the Tana Delta and Dakatcha Woodland. The Kenya Constitution 2010 and the Land Policy, 2009, provided an excellent entry point for local communities as key rights holders in natural resources management.
These results may imply that the habitats and species within the IBAs are on a recovery path, but more effort is required to maintain the observed positive trend within IBAs.

Kenya’s Important Bird Areas - Status and Trends, 2010 9
Protected IBAsAmong the IBAs within the Protected Area system, 21% recorded a “small deterioration” while 20% recorded a “small improvement”. Eleven percent of protected IBAs underwent “moderate deterioration” while only 5% recorded a “moderate improvement”. The three Protected IBAs that recorded a “moderate improvement” in their status are Kakamega Forest, Mau Forest Complex and Marenji Forest. This is attributable to increased awareness and rehabilitation efforts.
Sites that recorded a small improvement include Mt Elgon, South Nandi, North Nandi, Cherangani Hills, Mt Kenya and Kikuyu Escarpment forests. The improvement is mainly due to the development and some implementation of management plans, coupled with community supported policing of illegal activities in these IBAs. Some of the protected IBAs that underwent “moderate deterioration” include Tsavo West and Amboseli National Parks. This was mainly attributed to increased drought with livestock incursions by herders during some periods of the year in search of water and pasture
Unprotected IBAsAmong unprotected IBAs, 23% recorded a “small deterioration” in their status, while 16% suffered “moderate deterioration”. Only 1% recorded a “small improvement” – the gazettement of Lake Elmenteita as a wildlife sanctuary. The IBAs that underwent a small deterioration in their status include Tana River Delta, Dandora Ponds, Koguta Swamp, Sabaki River Mouth and Lake Ol’ Bolossat. Most of these IBAs are however under threat from proposed or ongoing developments that could lead to change of land use including land subdivision, which will eventually make conservation more challenging.
Unprotected IBAs such as Kusa Swamp recorded a “moderate deterioration” because of encroachment by farmers and unsustainable harvesting of papyrus, which degrades the habitat for papyrus endemic bird species. Dakatcha Woodland suffered moderate deterioration mainly due to increased uncontrolled charcoal production. This was initially controlled in 2009, but because of the controversy over a proposed plantation of Jatropha curcas for biofuel in 2010, the pro-jatropha proponents caused diffi culties with regard to forest management by established Site Support Groups.
Forest IBAsIt is estimated that Kenya had 3.5 million ha of forests (indigenous forests, open woodlands, and plantations) and an additional 24.6 million ha of “bush-land” in 2009 (Source: State of the World’s Forests, 2009, FAO) . It is also estimated that Kenya loses about 54,000 hectares of forest annually (Global Forest Resources Assessment 2005, Kenya Country Report, FAO Country Report 180) through deforestation , degradation, land use change activities (primarily conversion of forests to agriculture or for public or private development projects), and legal and illegal logging (for charcoal and timber).
Deforestation and degradation is occurring in both the “water tower” forests and the arid and semi-arid lands that are IBAs. Destructive charcoal making practices are frequent, as a large number of charcoal makers compete to satisfy the demand for the commodity by many Kenyans, especially those living in peri-urban and urban areas, as they heavily depend on charcoal as a source of energy for cooking and heating.
However, considerable efforts are being made by the government, the private sector, development partners, local communities and civil society to conserve and restore degraded forest areas throughout the country. The water catchment forests, popularly known as “water towers”, have received improved attention due to their signifi cance in soil, water and biodiversity conservation and other environmental services such as amelioration of regional climatic conditions. Furthermore, these water catchment forests have been fl agged as important in supporting the realisation of Kenya’s long-term development agenda under Vision 2030.
There is also an unprecedented effort to implement the Forest Act 2005 through the setting up of Community Forest Associations (CFAs). The European Union Community Development Trust Fund (EU CDTF) supported local communities in a range of sites including Cherengani Hills, North Nandi, South Nandi, Taita Hills, Dakatcha Woodland, Arabuko-Sokoke Forest and Mt Kenya, among others. Nature Kenya delivered forest-linked conservation actions in the same sites, and Site Support Groups’ capacity in the target sites allowed improved setting up of CFAs and development of management plans and their implementation, reducing illegal activities in some cases.

Kenya’s Important Bird Areas - Status and Trends, 201010
Woodland and Dryland IBAsThe results of 2010 monitoring indicates that the status of woodland and dryland IBAs is getting worse. This can be attributed to increased habitat fragmentation and deforestation because of increased demand for fuel wood, charcoal and building materials as well as for agricultural land for the growing population.
Some woodland IBAs with low levels of human habitation have been labelled as idle land and large chunks have been proposed for agricultural use. A case in point are the proposed large-scale Jatropha plantations in Dakatcha Woodland and parts of Tana River Delta, aggressively promoted by the proponents despite the available evidence that such projects have serious negative environmental and social impacts and are in fact likely to fail. In Dida Galgalu Desert, the IBA has experienced overgrazing while extreme drought conditions are likely to negatively affect the entire ecosystem.
Grassland IBAsThe ever-increasing human population and demand for agricultural land is still impacting negatively on grassland and continue to reduce the condition of the IBAs. Most of the grassland IBAs underwent moderate deteroriation during the reporting period. This is also attributable to frequent fi res that were experienced during the drought, causing a lot of destruction to the habitat, for example in Ruma National Park. The unprotected status of some of the IBAs also makes their conservation a complex matter, given that the land resource is utilized without any framework taking into account biodiversity conservation.
There have been concerted efforts by Nature Kenya and other conservation partners to conserve such IBAs as the Kinangop Grasslands. The purchase of parcels of land by Nature Kenya which are to be managed as nature reserves promises to improve the condition of the IBA and secure some permanent refuge for the endemic grassland bird, Sharpe’s Longclaw.
Wetland IBAs The status of Kenyan wetlands IBAs underwent some notable negative changes during the 2010 reporting period. “Moderate deterioration” was recorded in 6 out of the 19 wetland IBAs; “small deterioration” was recorded in 10 out of the 19 wetland IBAs; while the remaining three had a “small improvement” in their status in 2010. Wetlands with “moderate deterioration” include Yala Swamp, Dunga Swamp and Lake Naivasha. Habitat deterioration in Yala Swamp is attributable to continued cultivation of the wetland by the Dominion Group of companies, and encroachment by the local community emulating the company. There is extensive burning of papyrus, both at Yala and Dunga swamps, as new farms are opened up. The continuing destruction of papyrus in Yala Swamp and abstraction of water from River Yala for farming is worsening the situation, and the objectives of protecting the gazetted part of the site are not likely to be met. Dominion Farms seem to have control over the volume of water entering the gazetted portion of Lake Kanyaboli wetland, putting the lake at risk.
Sites that recorded a “small deterioration” include lakes Turkana, Baringo and Magadi. Sites that had a “small improvement” include lakes Nakuru, Elmenteita and Bogoria. Despite some positive results, wetlands continued to be highly threatened ecosystems due to the increasing human population pressure coupled with high demand for more land for agricultural developments and other related land uses. If the hydro-electric dam and associated irrigation on the Ethiopian side of Lake Turkana continue, the future of Lake Turkana is uncertain.
In the Tana River Delta, the Tana and Athi River Development Authority (TARDA) have proposed a sugarcane plantation for producing sugar and ethanol, and Bedford Biofuels are planning large-scale Jatropha curcas plantations. Despite its sandy soil and unreliable rainfall, there is a belief that the Delta is fertile. Therefore there is increased pressure to use the Delta for the commercial production of jatropha and other oil crops for biofuel, in the absence of a management plan which would allow land zonation amenable with conservation.

Kenya’s Important Bird Areas - Status and Trends, 2010 11
The pink carpet of Lesser Flamingos, Phoeniconaias minor, has never ceased to amaze and inspire tourists
from all over the world. However, according to the IUCN Red List, the species remains Near Threatened. This is largely due to its dependence on a limited and narrow range of required breeding conditions that occur irregularly and infrequently (BirdLife International 2012). The National Museums of Kenya, Nature Kenya and Kenya Wildlife Service, supported by a dedicated volunteer base, have been conducting annual water bird censuses in the Rift Valley lakes of Nakuru, Bogoria, Elmenteita, Naivasha and Magadi for the last two decades. This continuous data collection on water birds has made it possible to observe trends, and therefore measure the condition or status of the Rift Valley lakes over the years.
It is however important to note that the movement of fl amingos, timing and patterns for individual lakes are unknown. The number of individuals in a particular lake can double or halve in just two weeks (Vareschi 1978, Tuite 1979, Githaiga 2003, Childress et al 2007). This creates possibilities of over or under counting when lakes are counted on different days, making population estimates accurate only to a limited scale.
In January 1994, 1997, 1999, and 2010, Lake Bogoria recorded high Lesser Flamingo populations. These population peaks were probably due to changes in food availability in this lake. Such a high concentration of fl amingos is a clear indication of high production of blue green algae Spirulina fusiformis, the staple food for the species.
Food abundance is one of the factors that contribute to population stability of the Lesser Flamingo on the Rift Valley lakes. Changes in weather conditions in different parts of the country is another factor infl uencing the population levels on the lakes and the fl amingos’ nomadic behaviour. An increase in precipitation has a negative effect on water pH, conductivity and temperature, which
Lesser Flamingo population trends on Lake Bogoria from 1991 to 2010
affects Spirulina production (Harper et al 2003). When food becomes scarce, fl amingo fl ocks move away. Apparently most of the birds from other lakes congregated in Lake Bogoria during the effects of the El Niño rains in 1998 and 1999 when most alkaline lakes turned fresh.
From fi gure (I) below left, in the years 1995 and especially 2004-9, the population of Lesser Flamingo was very low on Lake Bogoria. It is not known whether this was due to good conditions on other lakes or poor conditions in Bogoria.
The Trend-line on the graph shows that the overall population of Lesser Flamingo on the lake has been declining. It is possible that the population of Lesser Flamingo within the Rift Valley Lakes is on a downward trend. Such a situation demands a thorough review of conservation strategies and plans that have been put in place for the conservation of the bird and its habitats with a view to enhancing them.
References:
Childress, B., Harper, D., Hughes, B., Bossche, W., Berthold, P., and Querner, U. (2004). (2004). Satellite tracking of Lesser Flamingo movements in Rift Valley, East Africa; pilot study report. Ostrich75: (1&2) (Pg. 463-468).
Githaiga, J.M. (2003). Factors infl uencing inter lake movements and utilization patterns of the alkaline lakes in Kenya by lesser fl amingos. Ph.D. Thesis, University of Nairobi.
Harper, M.D., Childress, B., Harper, M.M., Boar, R.R., Hickley, P., Mills, S.C., Otieno, N., Drane, T., Vareschi, E., Nasirwa, O., Wanjiru, E., Mwatha, J., Darlington, P.E.C., & Escute-Gassula, X. (2003).Aquatic biodiversity and saline lakes ; Lake Bogoria, National Reserve, Kenya. Hydrobiologia 500:( Pg 259–276).
Morales-Roldan, H. L., Mwinami, T., and Harper, M. D., (2011). Is ground census of fl amingo lakes worthwhile? Bulletin of the IUCN-SSC/Wetland International NO.18: (Pg 42-44).
Tuite, C. H (1979).Population size, distribution and biomass density of the lesserPopulation size, distribution and biomass density of the Lesser Flamingo in Eastern Rift Valley (Work done in 1974-76) Journal of Applied Ecology. 16: (Pg.765-775).
Owino, A.O., Oyugi, J.O., Nasirwa O. & Bennun,L.A., (2001). Patterns of variation in waterbird numbers on four Rift Valley lakes in Kenya, 1991–1999 Hydrobiologia 458:( pg 45–53).
Vareschi, E., (1978).The ecology of Lake Nakuru Kenya.(Abundance and feeding of the lesser Flamingo). Oecologia (Berl.) 32 :( Pg11-35).
BirdLife International (2012) Species factsheet: Phoeniconaias minor. Downloaded from http://www.birdlife.org on 16/08/2012.
Figure (i) Population estimates of Lesser Flamingos in Lake Bogoria.

Kenya’s Important Bird Areas - Status and Trends, 201012
Pressure: Threats to IBAsIn 2010, pressures on IBAs continued unabated.
Human-induced pressures on IBAs resulted in habitat destruction, habitat fragmentation, habitat degradation, pollution, over-exploitation of species for human use, habitat change due to the introduction of exotic species, and wildlife poisoning.
Av. s
core
s
Figure 2 . Trends in the Pressure levels on Kenyan IBAs (n = 61)
The overall threat level affecting Kenyan IBAs has decreased slightly, from an average mean of 2.28 in 2009 to 2.15 in 2010. Although the number of reported threat incidences within IBAs increased, the overall trend when all IBAs are considered is on the decrease as indicated in Figure 2 below. This is because the impacts of some of the threats that were reported are yet to be felt by the threatened species or habitats within those sites. An example is the proposed large-scale Jatropha plantation in Dakatcha Woodland, a project likely to have disastrous impacts, but the severity could not be measured when it had not started. This also applies to various agricultural and oil exploration schemes in the Tana River Delta or the proposed construction of a multi-purpose dam within the South Nandi Forest. Sites that recorded the highest number of threat incidences include Lake Naivasha, Mt Kenya, Kikuyu Escarpment forest, Yala Swamp and Dakatcha Woodlands. Some of the major pressures are discussed on the following pages.
Threat % of IBAs
2004 2005 2006 2007 2008 2009 2010
Agricultural encroachment/Illegal cultivation 22 55 62 63 67 70 75
Overgrazing/illegal grazing 43 57 62 63 66 70 74
Uncontrolled fi rewood collection 32 43 58 62 64 72 72
Illegal logging/vegetation destruction 32 55 60 60 64 69 70
Human settlement/urbanization 47 53 58 62 72 79
Fires 43 43 45 56 59 66
Invasive exotic species 27 33 37 43 46 56
Charcoal production 32 28 32 33 41 52 57
Destructive tourism activities 35 35 35 39 44 46
Unsustainable water abstraction 28 30 36 54 54
Illegal hunting/poaching/trapping 27 28 30 34 52 62
Siltation/Soil erosion 27 28 34 54 61
Pollution 25 25 32 34 46 64
Illegal fi shing methods and over fi shing 27 28 27 30 30 30
Wetland drainage/fi lling 18 22 23 31 33
Infrastructure development 7 12 21 33 44
Natural events 15 17 20 51 59
Human wildlife confl icts 10 12 12 16 34 38
Destructive mining activities 8 12 15 23 31
Habitat degradation by wildlife 10 8 13 23 27
Medicinal plant collection (debarking and uprooting) 7 8 10 13 18
Blocking of migration corridors 7 7 7 11 16
Eutrophication 5 3 7 10 13
Egg collection 3 7 3 3 3
Diseases/toxins 3 3 3 11 13
Table 2. Trends in threats affecting the Kenyan IBAs
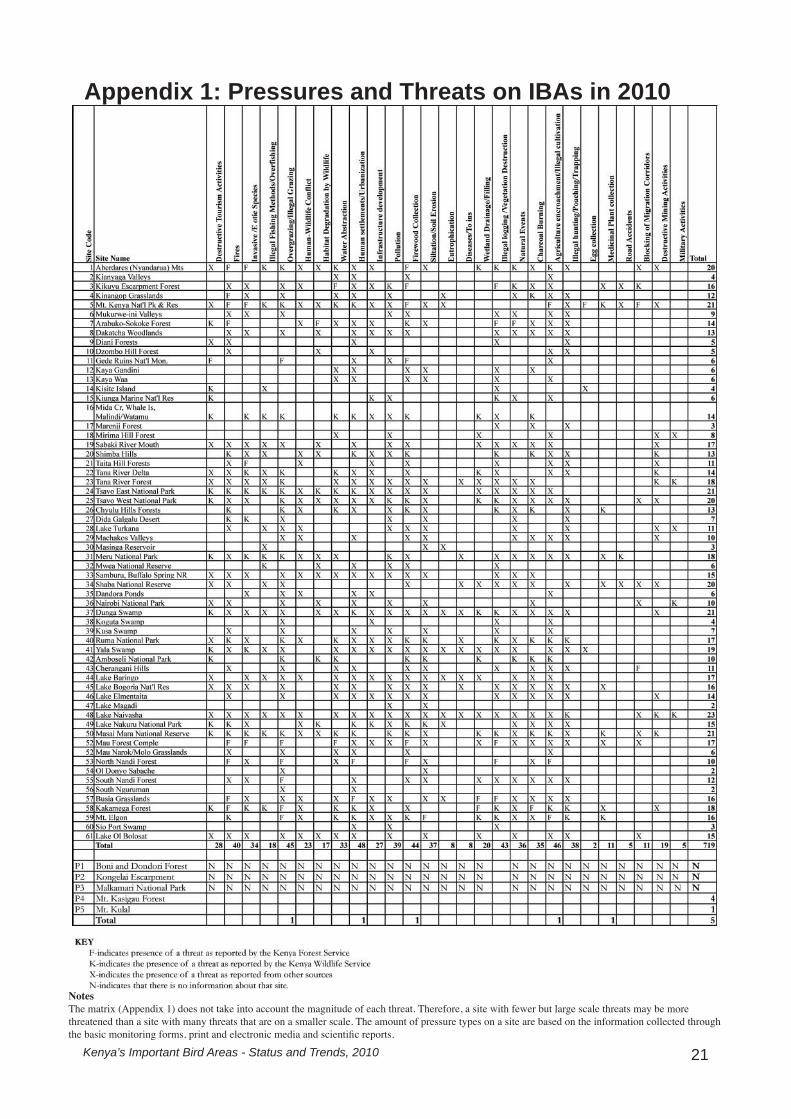
Note: Table 2 includes threats reported in 37 IBAs in 2010, and threats extrapolated from previous reports for the 24 IBAs for which no Basic Monitoring Forms were received in 2010.

Kenya’s Important Bird Areas - Status and Trends, 2010 13
Human settlement and urbanizationThis has remained the major threat affecting Kenyan IBAs, just like in 2009. This threat was reported in 24 out of the 37 sites whose monitoring data was received. This is due to the increasing population that needs more space for settlement and setting up of towns and market centres. This is happening in both protected and unprotected IBAs. For example, in Kikuyu Escarpment IBA, the District Administration Offi ces were constructed within forest reserve land.Usually, once there is human settlement in an area, unregulated development and expansion leads to, for example, clearing of natural vegetation for agriculture, discharge of waste into lakes and rivers and blockage of migratory corridors for wildlife, among other changes. With urbanization, the demand for forest products also increases, hence the threat levels to the affected habitats
Agricultural expansion and illegal cultivationThe threat was reported in 21 out of the 37 sites whose monitoring data was received. It has remained as one of the major threats to Kenyan IBAs for quite sometime, as more farms are being opened up and people expand their cultivation areas closer to the IBAs. An example is the extension of farms towards Masai Mara National Reserve, which is interfering with grazing and migration of ungulates within the reserve.
In Yala Swamp, Dominion Farms Ltd has embarked on an aggressive farming expansion plan to cover additional wetland areas, including construction of irrigation dykes and weirs, water drilling, construction of an airstrip and roads. Dominion has further proposed to undertake a number of new development projects within the Yala Swamp, under what is now being referred to as “an integrated project” that comprise a multipurpose dam, aquaculture and agro-based processing. To satisfy this expansion, the developer has proposed to take up 9,200 ha from the swamp area known as Area II, signifi cantly reducing the wetland area. Small scale farmers around Yala swamp are also clearing wetland vegetation, creating new farms within areas where water has receded.
Apart from human actions that directly impact on the wetland coverage, there are indirect impacts, including river deposits loaded with silt resulting from farming induced soil erosion upstream, that negatively affect the wetlands. An example is the Sabaki river mouth where the mudfl ats have been loaded with more and more silt and have been therefore been colonized by higher woody plants including mangroves. Water diversion to satisfy many small-scale irrigation projects, for instance within the Lake Naivasha catchment, has contributed to reducing lake level.
Increased clearing of natural grasslands has been noted in Kinangop Grasslands where farmers are expanding farmlands for wheat and potato growing. The Tana Delta will be completely destroyed if all proposed large-scale aricultural projects are implemented.
Overgrazing and illegal grazingThe threat was reported in 75% of IBAs whose data was analysed. Some of the IBAs where this threat was reported include Tsavo West National Park, South Nandi Forest, Chyulu Hills, Cherengani Hills and Shaba National Reserve. Much of the illegal grazing occurs during dry spells when pasture becomes limited. Due to the pastoralist lifestyles of the neighbouring communities, protected IBAs such as Masai Mara and Samburu and Buffalo Springs National Reserves are intruded upon as herders roam to graze their livestock. Whereas the gazettement status of such sites allows some level of extractive utilisation of resources, little or no regulation is done to ensure that grazing is kept within the carrying capacity of such resources. Invasion of wildlife reserves by grazing communities bring along with them other threats, such as burning of bushes to open up future grazing fi elds, to fi ght livestock pests and diseases and to minimise competition for grazing areas between livestock and wild animals. Overgrazing leads to exposure of land to agents of soil erosion.
Firewood collectionFirewood has remained a key source of energy that is affordable and readily available to most rural communities and enterprises. Firewood collection was recorded in 72% of sites whose monitoring data was received.
Illegal logging and vegetation destructionThis was reported as happening in 13 IBAs (35 % of the total number of IBAs monitored). Vegetation destruction often arises when land is cleared for cultivation, settlement, construction, commercial gains such as charcoal production and domestic use.
Overall, there has been a drop in the reported incidences of illegal logging, especially in South Nandi Forest. However, illegal logging and charcoal making has been severe in Dakatcha Woodland and the Mau Forest Complex. Continued illegal logging was reported in Arabuko-Sokoke forest. Selective logging of indigeneous vegetation, as well as indiscriminate destruction, affects the quantity and quality of habitats, as some forest birds, for example, are known to prefer some trees to others for nesting and foraging.

Kenya’s Important Bird Areas - Status and Trends, 201014
FireFire has been used for a long time as one of the tools to manage land. Due to the risks associated with using fi re, however, it remains a key threat that needs continued monitoring. Whether induced or natural, fi re remains a big challenge in some IBAs. Fire, as a threat, was reported in 13 IBAs during the reporting period, including Mt Kenya, Lake Nakuru, Yala Swamp and Chyulu Hills Forests. Fires were mostly started by local honey harvesters or farmers, or accidental as happened in Lake Nakuru National Park. Fire can have severe effect, especially on grazing animals and roosting or nesting birds, among other biota.
Invasive exotic speciesInvasive exotic species were reported as occurring in 16 of the IBAs during the reporting period. Invasive species are emerging to be among the serious threats affecting Kenyan IBAs. For example, Prosopis julifl ora has invaded and is expanding into areas around Lakes Bogoria and Baringo, and in the Tana River Delta the species is becoming of major conservation concern. In Masai Mara, an exotic weed commonly known as Feverfew (Parthenium hysterophorus), was detected during a survey along the banks of the Mara river. The weed has the ability to choke out other plants on which animals graze. Its growth presents a huge threat to the ecological integrity of the Masai Mara ecosystem.
PollutionPollution was reported in 64% of the sites monitored. Uncontrolled disposal of polluting agents is most critical in lakes and other water bodies. The threat has been reported in Lake Naivasha, Yala Swamp and Dunga Swamp. Pollution can be attributed to failure by various operators to follow the laid down regulations about waste disposal. Law enforcers also have a role to play if environmental pollution is to be contained.
Natural events/ Severe weather/ Climate changeFloods or drought were reported to be happening or having an impact in 15 out of 37 IBAs whose data was received. Some of the areas affected by fl ooding include: Budalangi in Western Kenya, along River Nzioa with the fl ood waters arising from the Cherengani Hills; Kano plain fl oods along River Nyando with the fl ood waters arising from Nandi Hills; and Tana River fl oods along the river with fl ood waters originating from the Aberdares and Mt Kenya catchments. The catchment forests for the rivers are IBAs. Well-managed forests are important in controlling fl ooding as they help to regulate water intake and release, vital ecosystem services. The recurrence of fl ooding signifi es that the catchment forests are continually losing this regulating role. This situation is aggravated by the destruction of other catchment areas, especially farmlands due to poor agricultural activities, that greatly accelerate surface run off.
Effects of drought were reported in Samburu and Buffalo Springs National Reserves, Shaba National Reserve and Masai Mara National Reserve. The magnitude of the impact arising from drought conditions is readily observed on large mammals, especially grazers and cats.
Illegal hunting, poaching and trappingThe number of sites where the threat has been recorded increased during this reporting period – to 16 of the 37 IBAs monitored. Illegal hunting of wild animals is largely driven by lack of legitimate and affordable sources of food and protein. It has had a big effect on many species within some IBAs. Poaching of small mammals in Arabuko-Sokoke Forest for meat has been a persistent problem that has direct negative impacts on animal populations and possibly ecotourism. In the Bunyala rice scheme, poachers are using the deadly pesticide Furadan to poison birds before slaughtering them and selling them to unsuspecting consumers. Furadan is widely used, misused and abused in Kenya for vermin control and can be found in pastoral and agricultural areas where it is primarily misused against predators, but this ends up killing non target wildlife too.

Kenya’s Important Bird Areas - Status and Trends, 2010 15
Responses: Conservation action in IBAsThe effort to mitigate pressures and threats affecting Kenya’s IBAs increased overall from a mean score of 1.66 in
2009 to 1.72 in 2010 as shown in fi gure 3. This is attributable to the great effort that has been put in by various government and non-government agencies, especially in the development of management plans and implementation of the Forest Act. Also, a lot of effort by local communities and the government has been directed to rehabilitation of degraded areas, and some of the recommendations presented in the previous report have been implemented.
The Kenya Constitution 2010, the Land Policy 2009 and their excellent empowerment of local communities to take charge of land use decisions helped communities in Tana River Delta and Dakatcha Woodland. The listing of the Rift Valley Lakes under the World Heritage Convention was a major policy response made possible by the National Museums of Kenya and Kenya Wildlife Service with support from Birdlife International and Nature Kenya. The EU-CDTF provided grants to local communities that helped in capacity building, livelihoods improvement and site management planning. Nature Kenya presence in 18 IBAs (30%), producing excellent Site Support Groups capacity building, monitoring, education and advocacy programmes, helped to put some pressures at bay. Increased will by the government to better manage the environment, albeit with limited resources, is to be acknowledged as a major response.
Below is a list of some major conservation responses recorded within the reporting period:
Listing of Rift Valley Lakes under the World Heritage • Convention by National Museums of Kenya and the Kenya Wildlife Service
Gazettement of Lake Elmenteita in the Rift Valley as • a Wildlife Sanctuary by the Kenya Wildlife Service (KWS) under Gazette notice 8077 of July 6, 2010
Efforts by KWS to propose listing the Tana River • Delta as a wetland of international importance under the Ramsar convention
Monitoring of the Rift Valley Lakes twice a year • through coordination of National Museums of Kenya (NMK) and KWS
Promotion of alternative sources of fuel and energy • saving devices by Kenya Forest Service (KFS), Nature Kenya and other institutions,
Figure 3 . Trends in conservation Responses in Kenyan IBAs (n = 61)
Increased efforts to rehabilitate the Mau Forest • Complex by various stakeholders, especially the planting of tree seedlings bought from farmers as an incentive for conservation.
Av. s
core
s

Kenya’s Important Bird Areas - Status and Trends, 201016
Development and launching of management plans • for 11 forest IBAs: Aberdare Mountains, Arabuko-Sokoke Forest, Cherengani Hills, Dzombo Hill Forest, Kakamega Forest, Kikuyu Escarpment forests, Mt Elgon, North and South Nandi Forests, Shimba Hills and Taita Hills
Deliberate efforts to implement and enforce the Forest • policy and the Forest Act of 2005, and strengthening of community participation in decision-making and management of forests and forest resources. Several Community Forest Associations have been formed and sensitized on the Forest Act 2005 and subsidiary legislation such as forest harvesting rules, Charcoal rules and guidelines on community participation in sustainable forest management.
Establishment of 5,900 ha of industrial plantations by • KFS; planting of 1,123,671 tree seedlings on farms; and rehabilitation of 290 ha through Nature Kenya support to Site Support Groups (SSGs).
Formation of a national task force by the Ministry • of Environment and Mineral Resources to develop a strategy to conserve Kenya’s wetlands
Efforts to improve on the quality and implementation • of EIAs noted as Kenya Institute of Environmental Experts (KIEE) is formed
Purchase of 50 ha of land to support conservation of • Sharpe’s Longclaw at Kinangop Grasslands by Nature Kenya
Winning of a court case against downgrading of • Amboseli from National Park to National Reserve status
Extensive media coverage of Nature Kenya and • other conservation organizations’ work supported awareness creation and advocacy against unsustainable development, especially in the Tana River Delta and Dakatcha Woodlands
Community mobilization by Nature Kenya to create • Community Conserved Areas in unprotected areas such as Tana River Delta, Yala and Dunga Swamps and Dakatcha Woodland. This has greatly improved local communities’ understanding of the importance of conservation
Studies conducted by NMK researchers to address • data gaps about other taxa in Important Bird Areas. Such studies led to re-discovery of the Giant Thicket Rat and the Mt. Kenya Mole Shrew, which are on the IUCN-Red List on Mount Kenya.
European Union continued funding of the Community • Development Trust Fund who then funded the communities for improved natural resource management and livelihood improvement

Kenya’s Important Bird Areas - Status and Trends, 2010 17
The Environment sector forms the bedrock for a clean, secure and sustainable development.
The country’s natural resources play a vital role in economic growth and poverty reduction. Prospects for Kenya’s long-term growth are dependent on effective management of these resources. It is estimated that 42% of GDP is derived from natural resources, in the form of: agriculture, forestry, wildlife tourism, mining, water and energy. The Environment sector also contributes to about 37% of wage employment and 49% of total export earnings. (Source: Republic of Kenya, 2010. Environment, Water and Irrigation Sector Report 2010: Medium Term Expenditure Framework 2011/12 – 2013/14. Final draft report for public consultation.) In addition, the sector provides a foundation for human survival and livelihood through provision of food, water, air, soil and other life support materials. The sustainable management of natural resources is, therefore, of priority in the country’s development process.
Kenya’s unique plants, animals, micro-organisms and ecosystems that together are called biodiversity are the main ingredients of the national development mix. Managing biodiversity sustainably will guarantee stable and sustained economic growth, food availability and higher quality of living for Kenyan citizens. It is therefore critical that the environment is given full recognition in all development plans.
Since 2004, the state, pressure and responses on Important Bird Areas (IBAs) have shown general deterioration. Mounting pressures and reduced responses since 2007 resulted in a lower level or state of IBAs. The results from the year 2010 data are therefore encouraging, as they indicate that there is some improvement in all the measured indicators. The country is recovering from the 2007-2008 political crisis and a series of extreme climatic conditions including droughts that had impacted both human and wildlife conditions. This recovery could be a key factor contributing to the positive trends. The pressures that constitute threats to IBAs are still at unprecedented and unacceptable high levels, however.
Despite the efforts that have led to the positive trend noted in 2010, much remains to be done in both protected and unprotected IBAs. As reported above, a number of these sites are experiencing a lot of resource use pressure, and if nothing substantial is done resource confl icts are going to escalate in the near future. Once the demand outstrips resource supply in these areas, encroachment into the protected areas is going to increase. Therefore, there should be deliberate efforts by all to support programmes that will help the population to sustainably utilize the available natural resources.
Conclusion and Recommendations
See recommendations on the next pages.

Kenya’s Important Bird Areas - Status and Trends, 201018
Overall RecommendationsOverall Objectives:
Incorporate biodiversity and its conservation into local, county and national planning and budgetary • processes to ensure governance systems at all levels provide for the effective management and administration of community conservation areas and protected areas as part of national and county development agenda.Develop and implement tools to manage natural resources to generate effective local, national and global • benefi ts, including sustainable water, energy and agriculture, without compromising the biological and ecological foundation of life.Implement existing policies and legislation for increasing indigenous forest cover, reducing land degradation • and protecting plant and animal species and populations, through effective regulatory mechanisms on resource access and use.Develop policies and programmes that empower local communities to pursue sustainable livelihoods while • managing their natural resources. Cushion the rural poor from the effects of climate change mitigation tactics, including effective management of bio-energy-related climate change mitigation solutions. Develop a national policy on agricultural biodiversity as a fundamental base to human populations who rely • on biodiversity for their livelihoods, including bees and other insects that provide invaluable pollination services upon which sustainable food production depends.
General Recommendations:Incorporate biodiversity and its conservation into local, county and national planning and budgetary • processes Integrate natural resource management in poverty reduction strategies because of the high reliance on • natural resources by communities neighbouring IBAs. Natural resource management needs to be a key element of poverty reduction and sustainable development. Environmental issues and cross-sectoral integration need to become keystones of development and poverty alleviation planning.Implement the Constitution 2010 and Land Policy 2009, as they are supportive of improved management • of natural resources. Policy-makers can take this opportunity to develop laws that support conservation and guarantees the future of our natural heritageSensitize developmental organizations to motivate communities to sustainably manage natural resources. • Any development that only considers fi nancial gains and ignores ecological degradation, whether on long or short term basis, needs to be discouraged. Global fi nancial institutions are now factoring loss of ecological services against fi nancial gains to come up with a more balanced assessment of economic progress. Develop and implement species and site management plans that prioritize sustainable natural resources • management by and for stakeholders, in decision making, planning and budgetary processes.Develop and operationalize governance structures for Kenya’s deltas and wetlands, and promote sustainable • wetlands management for biodiversity and development guided by land use management plans based on Strategic Environmental Assessment (SEA).Promote the use of safer alternatives for pest control in agricultural practices including Integrated Pest • Management (IPM) methods and natural pest control products. Strengthen regulations and enforce laws, including stiffer penalties, for pesticide misuse and abuse. Mount • an educational campaign against poisoning of carnivores such as lions, hyenas, birds of prey and water birds.Strengthen Community Forest Associations (CFAs) for effective co-management of forests and mainstream • CFA operational costs in county and national institutional budgets. Increase regular monitoring and patrols within IBAs to curb threats facing IBAs as a result of human • activities, through creation of community-based resource management structures where they do not exist.

Kenya’s Important Bird Areas - Status and Trends, 2010 19
Kenya Forest Service Fast track the implementation of the Forest Act • 2005 so that Community Forest Associations (CFAs) are set up and their capacity built in all forested IBAs.Develop integrated long-term strategic plans • for all forest IBAs, in collaboration with other stakeholders, and fast track station-based management plans in collaboration with CFAs. Identify, mark and gazette unprotected forested • IBAs, e.g. Dakatcha Woodland and Tana Delta forests, invoking the Forest Act 2005. There is scope to establish a network of community forests managed by local communities. Under the 2010 Constitution, it is now possible for local communities to manage forests on Trust lands that used to be managed by the county councils. Increase forest protection activities in high tourism • potential areas including Arabuko-Sokoke Forest and Mt. KenyaFast track marking of forest boundaries to reduce • confl icts with adjacent communities, especially in the Cherengani forests Speed up the process of developing and signing • forest management agreements with CFAs in forests where management plans have been developed Enforce forest utilization and charcoal rules • to curb the current accelerated degradation of unprotected forests and woodlands such as Dakatcha Woodland, which is being decimated by commercial charcoal makers. Enhance forest monitoring and reporting including • initiating the production of annual forest status reports
Kenya Wildlife ServiceReview the Wildlife Act to ensure full inclusion • and recognition of Community Conserved Areas (CCAs) as a means to increase wildlife space including connectivity and corridor establishment. Priority sites include Tana Delta, Dakatcha Woodland, Yala Swamp and other community lands previously managed by the county councils.Finalize the process for listing the Tana River • Delta as a Ramsar siteInitiate processes for Ramsar listing for other • highly threatened wetland IBAs such as Yala Swamp, Sabaki River Mouth and Dunga Swamp.Enhance local community ownership of wildlife • and protected areas, including enhancing capacity for private landowners to establish private wildlife protected areas as a means to increase space for wildlife conservation.Recognise and embrace the Key Biodiversity • Areas (KBAs) approach to priority setting, to ensure that protected areas form a comprehensive network adequate to protect all globally threatened wildlife species. Consider producing regular updates on the • status of wildlife in Kenya, using simple-to-use guidelines and indicators for national good
Recommendations for government and non-governmental organisations

Kenya’s Important Bird Areas - Status and Trends, 201020
National Environment Management Authority (NEMA)
Complete the national wetlands conservation • strategy and policy, including national wetland resource mapping Develop and publicize a national directory on • Key Biodiversity Areas or areas of environmental signifi cance to upscale their recognition, so they may be taken into account when undertaking developmental and infrastructural initiativesPublicise the details of operators who have not • submitted Environment Audit reports of their enterprises as a way of enforcing complianceEnforce environmental compliance for all • development and infrastructure projects, making sure that IBAs are avoided in all destructive development and infrastructure plans
National Museums of KenyaCarry out more research and surveys to qualify • more sites as IBAs starting with listed potential IBAs.
Prioritize research at IBAs with the most threats• Allocate adequate funding to support national • monitoring of water birds.Carry out analyses on IBAs as KBAs and identify • conservation gaps based on non-bird taxa.
Nature Kenya Enhance local community governance, advocacy, • education and awareness to promote sustainable site-based natural resources management and community ability to demand for national accountability in conservation and development planning. Promote NGO-Government-Local Community • Partnership through the IBA NLC and enhance cooperation for joint delivery of conservation initiatives and IBA monitoring Track and report destructive developments and • enhance awareness at all levels of government, private sector and civil society as a means to promote dialogue towards ecological sustainability.
Kenya’s Important Bird Areas - Status and Trends, 2010 21
NotesThe matrix (Appendix 1) does not take into account the magnitude of each threat. Therefore, a site with fewer but large scale threats may be more threatened than a site with many threats that are on a smaller scale. The amount of pressure types on a site are based on the information collected through the basic monitoring forms, print and electronic media and scientifi c reports.
Appendix 1: Pressures and Threats on IBAs in 2010

Kenya’s Important Bird Areas - Status and Trends, 201022
Alex Mutati - NMKAlex Ngari - NKAlfred Tulel - NKB.C Maghanga - KFSCedric Khayale - KWSChrispine Odhiambo - KWSDavid Muchiri - NKDominic Mumbu - NKEdson Mlamba - NMKEdwin Agola - NKElijah Obadhah - NKEmily Atai Away – KWSFleur Ng’weno – NKGeorge Anyona - KWS
Appendix 2: Data contributors to this reportGeorge Muigai Mung’u - KFSHells Gate National Park - KWSJacklyne Ayuka - KWSJacky Ben - KWSJames Ogola - NKJonathan Mwachongo - ASFGAJoseph Maina - KFSJosephine Mutiso - KWSKENVOKanyi Luke Lukaria - KWSKijabe Environment VolunteersLawrence Chovu - Taita SSGLucy Wamuyu - NMKMartin Otieno - NMK
Munene Mutua Njue - KWSMwangi Geofrey - NMKMwangi Joseph - NMKNathaniel Mkombola - Taita SSGNicodemus Nalianya - NMKPaul C. Kaino - KWSPeter Maina - KWSPeter Mwangi - KWSPeter Wairasho - NKSospeter M. Kiambi - KWSTimothy M. Ikime - KWSTimothy Mwinami - NMKViny Otieno - NMK

Kenya’s Important Bird Areas - Status and Trends, 2010 23
Monitoring is a repeated collection of information over time, in order to detect changes in one or more particular variables. If monitoring is well designed, systematic, regular and sustained for a long time, it can provide scientifi cally defensible and credible data that gives timely warning of deterioration in habitats and decline in wildlife populations. The process can also be used to evaluate if conservation interventions are having positive effects, and promote wider conservation responses.
There are two types of monitoring taking place in Kenya’s Important Bird Areas. These include basic monitoring, which is taking place in all 61 IBA sites. Basic Monitoring forms (see Appendix 4) capture the state of the site, pressure or threats on the site and responses (actions) being used to counter the threats. Detailed Monitoring involves detailed measurement of site specifi c habitat and species parameters. Site specifi c protocols have been developed for all the sites that use birds as indicator species. Community members in Site Support Groups (SSGs) have been trained on how to monitor birds and their habitats using site-specifi c protocols. The data collected is then sent to Nature Kenya and subsequently forwarded to the NMK for storage and analysis.
In terms of co-ordination, the IBA National Liaison Committee (NLC) provides overall institutional co-ordination and advice, and responds to the monitoring results through member institutions. Nature Kenya is the secretariat, providing fi eld co-ordination, linking up and supporting Site Support Groups and volunteers. Nature Kenya also co-ordinates training, evaluation, fundraising and reporting to the NLC. The National Museums of Kenya provides technical co-ordination, monitoring design and data storage, analysis and reporting.
The ‘State –Pressure -Response’ Model
IBAs should be managed to conserve important bird populations and other biodiversity for which they are listed. Therefore we need to understand what is happening to them in relation to those species, sites and habitats for which the site qualifi es as an IBA. This defi nes the overall conservation goal that will in turn determine which variables are to be monitored. However the model recognizes that it is not practical to monitor every relevant attribute of an IBA and thus a variety of general environmental and habitat indicators including species of conservation concern were chosen in respective sites to determine conservation needs.
The model has proved to be a useful approach that has been adopted by the Convention on Biological Diversity and the BirdLife Partnership in Europe for purposes of IBA
It should be noted that indicators for the different sites need careful selection. Obviously, a good indicator will actually show or track something – it will respond clearly to changes. Thus, a number of recently cut stumps might be a good indicator of logging intensity (a pressure variable in a forest). An indicator should also be linked clearly to conservation management goals for the IBA; it must be possible to collect information for the indicator within the likely constraints of capacity and resources. Lastly, the indicators should also be scientifi cally credible, simple and easily understood, and quantify information so that its signifi cance is clear.
STATEQuantity and
quality of IBAs
PRESSUREThreats to IBAs
RESPONSEActions at IBAs
Appendix 3: Important Bird Areas Monitoring Framework
monitoring. There exists a BirdLife International global monitoring framework, which is being domesticated at regional and national level.
The model considers:State:State indicators refer to the condition of the site with respect to its important biodiversity. State indicators might be population counts of birds themselves. They might also be measures of the extent and quality of the habitat required by these birds. Pressure:Pressure indicators identify and track major threats to IBAs. Examples include rates of agricultural expansion, over-exploitation and pollution.Response:Response indicators identify and track conservation actions: for example, changes in conservation designation, implementation of conservation projects and establishment of Site Support Groups (SSGs) also known as Local Conservation Groups (LCGs).
The relationship between indicators of state, pressure and response.

Kenya’s Important Bird Areas - Status and Trends, 201024
Table 3. Summary of trends in status of Kenya’s IBAs in 2010IBA No.
Site name State IBA No.
Site name State
1. Aberdare Mountains Small Deterioration 32. Mwea National Reserve
Small Improvement
2. Kianyaga Valleys Small Deterioration 33. Samburu/Buffalo Springs NRs
Small Improvement
3. Kikuyu Escarpment Forest
Small Improvement 34. Shaba National Reserve
Small Deterioration
4. Kinangop Grasslands Moderate Deterioration 35. Dandora Ponds Small Deterioration5. Mt Kenya Small Improvement 36. Nairobi National Park Small Deterioration6. Mukurweini Valleys Moderate Deterioration 37. Dunga Swamp Moderate Deterioration7. Arabuko-Sokoke Forest Small Deterioration 38. Koguta Swamp Small Deterioration8. Dakatcha Woodland Moderate Deterioration 39. Kusa Swamp Moderate Deterioration9. Diani Forest Moderate Deterioration 40. Ruma National Park Small Improvement10. Dzombo Hill Forest Moderate Deterioration 41. Yala Swamp Moderate Deterioration11. Gede Ruins National
MonumentModerate Deterioration 42. Amboseli National
ParkModerate Deterioration
12. Kaya Gandini Small Deterioration 43. Cherangani Hills Small Improvement13. Kaya Waa Small Deterioration 44. Lake Baringo Small Deterioration14. Kisite Island Moderate Deterioration 45. Lake Bogoria National
ReserveSmall Improvement
15. Kiunga Marine National Reserve
Moderate Deterioration 46. Lake Elmenteita Small Improvement
16. Mida Creek/Malindi/Watamu Coast
Small Deterioration 47. Lake Magadi Small Deterioration
17. Marenje Forest Moderate Improvement 48. Lake Naivasha Moderate Deterioration18. Mrima Hill Forest Small Deterioration 49. Lake Nakuru National
ParkSmall Improvement
19. Sabaki River Mouth Small Deterioration 50. Masai Mara Small Deterioration20. Shimba Hills Forest Small Deterioration 51. Mau Forest Complex Moderate Improvement21. Taita Hills Forests Small Deterioration 52. Mau Narok/Molo
GrasslandsSmall Deterioration
22. Tana River Delta Small Deterioration 53. North Nandi Forest Small Improvement23. Tana River Forests Small Deterioration 54. Ol Donyo Sabache Small Deterioration24. Tsavo East National
ParkSmall Deterioration 55. South Nandi Forest Small Improvement
25. Tsavo West National Park
Moderate Deterioration 56. South Nguruman No Change
26. Chyulu Hills Forest Moderate Deterioration 57. Busia Grassland Moderate Deterioration27. Dida Galgalu Desert Small Deterioration 58. Kakamega Forest Moderate Improvement28. Lake Turkana Small Deterioration 59. Mt Elgon Small Improvement29. Machakos Valleys Small Deterioration 60. Sio Port Swamp Moderate Deterioration30. Masinga Reservoir Small Deterioration 61. Lake Ol'Bolossat Small Deterioration31. Meru National Park Small Improvement