2010 HALF-YEAR FINANCIAL REPORT -...
47
1 2010 HALF-YEAR FINANCIAL REPORT This document is a non-certified free translation of the French language of the 2010 half-year financial report drawn up in accordance with Article L.451-1-2(III) of the French Monetary and Financial Code. In all matters of interpretation of information, the original French version takes precedence over this translation. It includes a Business Report for the half-year running from January 1, 2010 to June 30, 2010, the Consolidated Financial Statements of the Bureau Veritas Group as of June 30, 2010, the Statutory Auditor’s Report and the declaration by the persons responsible for the document.
Transcript of 2010 HALF-YEAR FINANCIAL REPORT -...

1
2010 HALF-YEAR FINANCIAL REPORT This document is a non-certified free translation of the French language of the 2010 half-year financial report drawn up in accordance with Article L.451-1-2(III) of the French Monetary and Financial Code. In all matters of interpretation of information, the original French version takes precedence over this translation. It includes a Business Report for the half-year running from January 1, 2010 to June 30, 2010, the Consolidated Financial Statements of the Bureau Veritas Group as of June 30, 2010, the Statutory Auditor’s Report and the declaration by the persons responsible for the document.

2
Sommaire
1. 2010 HALF-YEAR BUSINESS REPORT 3
1.1. Preliminary note 3
1.2. Highlights of the period 3
1.3. Comparison of the Group’s half-year results 4 1.3.1 Revenue 4 1.3.2 Operating profit 5 1.3.3 Adjusted operating profit 5 1.3.4 Net financial expense 6 1.3.5 Income tax expense 7 1.3.6 Attributable net profit 7 1.3.7 Attributable adjusted net profit 7 1.3.8 Results by business 8 1.3.9 Group cash flows and financing sources on June 30, 2010 and June 30, 2009 13
1.4. Risk factors for the remaining six months of the 2010 financial year 20
1.5. Related-party transactions 21
1.6. Outlook 21
1.7. Events after the balance sheet date 22
2. 2010 HALF-YEAR CONSOLIDATED FINANCIAL STATEMENTS 23
2.1 2010 half-year Financial statements 23
2.2 Notes to the condensed 2010 half-year consolidated financial statements 28
2.3 Statutory Auditor’s Review Report on 2010 half-year financial information (from January 1, 2010 to June 30, 2010) 45
3 PERSONS RESPONSIBLE FOR 2010 HALF-YEAR FINANCIAL RE PORT AND STATUTORY AUDITORS 46
3.1 Persons responsible 46
3.2 Statutory Auditors 46

3
1. 2010 Half-Year Business Report
1.1. Preliminary note
Readers are invited to peruse the information set out herein on the Group's financial position and results together with the Group's consolidated half year financial statements and the notes to the consolidated half year financial statements at June 30, 2010 set out in Chapter 2 of this 2010 Half-Year Financial Report, as well as the Group's consolidated financial statements and the notes to the consolidated financial statements at December 31, 2009 set out in Chapter IV of the 2009 Registration Document. Pursuant to Regulation (EC) 1606/2002 of July 19, 2002 on the application of international accounting standards, the consolidated accounts of Bureau Veritas for the first half 2010 (H1 2010) and the first half 2009 (H1 2009) were drawn up in accordance with the guidelines of the IFRS (International Financial Reporting Standards) framework, as adopted by the European Union. Percentages may be calculated using non-whole numbers and consequently they may be different from those calculated using whole numbers.
1.2. Highlights of the period
In 2010, the Group resumed its acquisitions policy by acquiring three companies representing cumulated annual revenue of more than €300 million, as detailed below.
On June 1, 2010, Bureau Veritas announced the acquisition of Advanced Coal Technology – (2009 revenue of SAR78 million), one of the leading suppliers of coal testing services in South Africa and boasting development potential in other southern African countries (Mozambic, Botswana, Zimbabwe).
On June 22, 2010, Bureau Veritas announced the signing of an agreement to acquire Inspectorate (2009 revenue of GBP246 million) and thereby took a decisive step in its development by becoming one of the global leaders in commodities testing and inspection. This acquisition provided the Group a new dimension by doubling the size of its laboratories network (330 sites) and enabling it to offer the widest range of services in the inspection and certification sector via eight lines of global services: Industry, Construction, Marine, Consumer Products, Commodities, Systems Certification, In-Service Inspection & Verification and Government Services. After the consolidation of Inspectorate, the Group will have more than 47,000 employees spread throughout 140 countries and generate revenue of more than €3 billion.
The Group also acquired US company, SMSI, specialised in elevators inspection, with revenue of around €0.2 million.

4
1.3. Comparison of the Group’s half-year results
Since January 1, 2010, the Health, Safety & Environment activities have been reclassified under the In-Service Inspection & Verification, Industry and Construction businesses, such that the Group is now organised into seven global businesses, namely Marine, Consumer Products, Government Services & International Trade and the four businesses making up the Industry & Infrastructure division (Industry, In-Service Inspection & Verification,Construction and Certification). 2009 data have been adjusted in accordance with this new organisation in order to facilitate comparison. (in millions of euros) H1 2010 H1 2009 Change
Revenue 1,349.1 1,329.5 +1.5%
Purchases and external charges (387.3) (373.3)
Personnel costs (699.1) (678.5)
Other expense (49.0) (72.3)
Operating profit 213.7 205.4 +4.0%
Net financial expense (15.2) (28.2)
Equity associates (0.1) -
Profit before income tax 198.4 177.2 +12.0%
Income tax expense (54.4) (44.7)
Profit from discontinued operations and operations held for sale - 0.4
Net profit 144.0 132.9 +8.4%
Minority interests 3.2 2.4
ATTRIBUTABLE NET PROFIT 140.8 130.5 +7.9%
1.3.1 Revenue
H1 2010 revenue rose by 1.5% to €1,349.1 million and broke down as follows:
� Stable organic growth.
� A 0.2% negative impact from non-strategic activities prior to their disposal (undertaken in Q1 2010).
� A 1.4% negative impact from changes in the scope of consolidation due to the disposal of non-strategic activities.
� A positive impact from exchange rates of 3.1%, prompted by advantageous trends in the majority of currencies relative to the euro.
(in millions of euros) 2010 2009 Total growth
Organic growth
Marine 156.0 165.0 (5.5)% (8.3)% Industry 349.2 304.3 +14.8% +6.3% In-Service Inspection & Verification (IVS) 209.1 215.4 (2.9)% (0.6)% Construction 209.6 234.7 (10.7)% (6.3)% Certification 157.1 143.0 +9.9% +6.8% Consumer Products 182.7 188.2 (2.9)% (4.3)% Government Services & International Trade (GSIT) 85.4 78.9 +8.2% +10.0% TOTAL H1 1,349.1 1,329.5 +1.5% 0%

5
1.3.2 Operating profit
H1 2010 operating profit rose by 4.0% to €213.7 million vs. €205.4 million in H1 2009. The €8.3 million increase stemmed from the improvement in operating profit in all operating businesses, except the Marine and Consumer Products businesses:
� Marine: -€6.1 million
� Industry: +€1.7 million
� In-Service Inspection & Verification: +€7.4 million
� Construction: +€0.7 million
� Certification: +€5.5 million
� Consumer Products: -€3.8 million
� Government Services & International Trade: +€2.9 million
H1 2010 EBIT margin widened by 40 basis points to 15.8% of revenue vs. 15.4% in H1 2009.
The value added component (CVAE) of the new business tax applicable in France has been recognized in income tax expense since January 1, 2010. Up to December 31, 2009, business tax expense was included in operating items within “Taxes other than on income”. The impact on the “Taxes other than on income" and “Income tax expense” lines of the income statement for the half-year ended June 30, 2010 was €4.7 million.
1.3.3 Adjusted operating profit
Adjusted operating profit is defined as operating profit before inclusion of income and expense from acquisitions and other non-recurring items.
The table below shows the calculation of adjusted operating profit in H1 2010 vs. H1 2009.
(in millions of euros) H1 2010 H1 2009
Operating profit 213.7 205.4
Amortization of intangibles resulting from business combinations 10.7 9.1
Discontinued activities (1.3) -
Acquisition expense 2.5 -
ADJUSTED OPERATING PROFIT 225.6 214.5
Adjusted operating profit rose by 5.2% to €225.6 million in H1 2010 vs. €214.5 million in H1 2009. This €11.1 million increase stemmed from the improvement in adjusted operating profit in all operating businesses, with the exception of the Marine and Consumer Products businesses:
� Marine: -€5.8 million
� Industry: +€3.6 million
� In-Service Inspection & Verification: +€6.4 million
� Construction: +€1.5 million
� Certification: +€5.7 million
� Consumer Products: -€3.4 million
� Government Services & International Trade: +€3.1 million

6
Adjusted operating margin, expressed as a percentage of revenue, widened by 60 basis points to 16.7% in H1 2010, compared with 16.1% in H1 2009. This growth reflected the improvement in operating processes, primarily in the In-Service Inspection & Verification, Certification and Government Services & International Trade businesses and the ability to adapt the organisation to offset the decline in revenue in the Construction and Marine businesses.
The improvement in operating margin was also enabled by the reform of business tax in France. The value added component (CVAE) of the new business tax applicable in France has been recognized in income tax expense since January 1, 2010. Up to December 31, 2009, it was included in operating items within “Taxes other than on income”. This reclassification generated an improvement of €4.7 million in operating profit, equivalent to 35 basis points of operating margin.
The completion of the disposal programme for non-strategic activities decided at the end of 2009 generated capital gains on disposals of €1.3 million, for which adjusted operating profit has been restated. The contribution from these activities prior to their disposal was not restated and had a negative impact of €0.9 million on adjusted operating profit.
In addition, the Group booked €2.5 million in expenses prompted by the acquisition of Inspectorate (see section 1.2 Highlights of the Period in this Half-Year Report).
1.3.4 Net financial expense
Net financial expense totalled €15.2 million in H1 2010 vs. €28.2 million in H1 2009, thereby representing a €13.0 million improvement.
(in millions of euros) H1 2010 H1 2009 Change
Cost of gross financial debt (19.1) (24.8) +5.7
Gains on cash and cash equivalents 1.0 0.9 +0.1
Finance costs, net (18.1) (23.9) +5.8
o/w change in fair value adjustments of financial assets/liabilities (0.9) (2.1) +1.2
Foreign exchange gains/losses 9.6 (2.2) +11.8
o/w change in fair value adjustments of financial assets/liabilities - - -
Interest cost on pension plans (2.2) (2.1) (0.1)
Other (4.5) - (4.5)
NET FINANCIAL EXPENSE (15.2) (28.2) +13.0
Net finance costs were reduced by €5.8 million from €23.9 million in H1 2009 to €18.1 million in H1 2010 primarily thanks to the decrease in financial expenses over the period prompted by:
� A decline in the average amount of net financial debt.
� Lower interest rates on the non-hedged part of gross financial debt.
� The expiry of a number of interest rate hedging instruments.
H1 2010 foreign exchange gains were primarily generated by transactions concerning the Group’s subsidiaries in a different currency to their operating currency. Foreign exchange gains of €9.6 million stemmed from the plunge in the value of the euro relative to the majority of other currencies and notably, the US dollar.
In addition, the interest cost on pension plans was virtually stable relative to H1 2009. Other costs totalled €4.5 million in H1 2010 and corresponded mainly to write-downs on financial assets for the non-strategic activities sold off during the period.

7
1.3.5 Income tax expense
Consolidated income tax expense totalled €54.4 million on June 30, 2010 vs. €44.7 million on June 30, 2009.
The effective tax rate calculated by dividing income tax expense by pre-tax profit, totalled 27.4% on June 30, 2010 vs. 25.2% on June 30, 2009.
This increase was primarily caused by the reform of France’s business tax. The value added component (CVAE) of the new business tax applicable in France has been recognized in income tax expense since January 1, 2010. Up to December 31, 2009, business tax expense was included in operating items within “Taxes other than on income”. The impact on the “Taxes other than on income" and “Income tax expense” lines of the income statement for the half-year ended June 30, 2010 was €4.7 million. Adjusted for this reclassification, the Group’s effective tax rate would have totalled 25.6% on June 30, 2010, similar to the level booked on June 30, 2009.
1.3.6 Attributable net profit
H1 2010 consolidated attributable net profit rose by 7.9% to €140.8 million, with the €10.3 million increase stemming primarily from:
� An €8.3 million increase in operating profit.
� A €13 million decrease in net financial expense.
� A €10.5 million increase in income tax expense and minority interests.
Earnings per share rose by 7.4% from €1.21 in H1 2009 to €1.30 in H1 2010.
1.3.7 Attributable adjusted net profit
Attributable adjusted net profit is defined in the same way as adjusted operating profit, less net finance costs and income tax expenses calculated by applying the Group’s effective tax rate.
Adjusted net profit rose 9.3% from €139.7 million in H1 2009 to €152.7 million in H1 2010.
Attributable adjusted net profit rose by 8.9% from €137.3 million in H1 2009 to €149.5 million in H1 2010.
Adjusted earnings per share were up 8.6% from €1.27 in H1 2009 to €1.38 in H1 2010.
(in millions of euros) H1 2010 H1 2009
Adjusted operating profit 225.6 214.5
Net financial expense (15.2) (28.2)
Adjusted income tax (1) (57.6) (47.0)
Share of profit of associates (0.1) -
Profit from operations held for sale - 0.4
Adjusted net profit 152.7 139.7
ATTRIBUTABLE ADJUSTED NET PROFIT 149.5 137.3 (1) using the effective tax rate of 27.4% in H1 2010 and 25.2% in H1 2009

8
1.3.8 Results by business
Since January 1, 2010, following the reclassification of the Health, Safety & Environment activities into the IVS, Industry and Construction businesses, the Group has been organised into seven global businesses, namely Marine, Consumer Products, Government Services & International Trade and the four businesses making up the Industry & Infrastructures division (Industry, In-Service Inspection & Verification). 2009 data have been adjusted for this new classification in order to facilitate comparison.
Marine
(in millions of euros) H1 2010 H1 2009 Change
Revenue 156.0 165.0 (5.5)%
Adjusted operating profit 48.2 54.0 (10.7)%
Adjusted operating margin 30.9% 32.7% (180)bps* * bps: basis points
Revenue in the Marine business fell by 5.5% from €165.0 million in H1 2009 to €156.0 million in H1 2010, due to:
� An 8.3% organic (same-structure and same currency) decline in revenue.
� A 2.8% increase in revenue prompted by favourable exchange rates notably for the Korean Won.
New construction (54% of H1 2010 revenue in the Mar ine business)
Revenue from the new construction activity fell by 15% on a same-structure and exchange-rate basis.
The Marine business took 335 orders for new ship construction during H1 2010; representing 3.8 million gross tons (GRT), up 46% relative to H1 2009.
The order book for new construction only incurred a low number of cancellations and totalled GRT 29.5 million on June 30, 2010 compared with GRT 31.0 million on December 31, 2009.
The decline in revenue ought to slow during H2 2010 and the rise in new orders has improved visibility on 2011.
Ships in service (46% of H1 2010 revenue in the Mar ine business)
Revenue in the ships in service activity rose by 1% on a same-structure and exchange rate basis.
On June 30, 2010, the fleet classed by Bureau Veritas totalled 9,217 ships, up 6% relative to H1 2009 and representing GRT 72.1 million (+10.2%).
Lower growth in revenue generated by the ships in service inspection activity in H1 2010 was due to the younger age of the fleet classed by Bureau Veritas since new ships do not require inspection for around 18 months after their delivery, as well as delays in periodical inspections by certain ship owners. This lag should be gradually reabsorbed over the next 12 months.
Adjusted operating margin in the Marine business remained at a high level of 30.9% vs. 32.7% in H1 2009, reflecting the flexible organisation of the business.

9
Industry
(in millions of euros) H1 2010 H1 2009 Change
Revenue 349.2 304.3 +14.8%
Adjusted operating profit 37.4 33.8 +10.7%
Adjusted operating margin 10.7% 11.1% (40)bps
Revenue in the Industry business totalled €349.2 million in H1 2010 vs. €304.3 million in H1 2009, with the 14.8% increase driven by:
� Organic growth of 6.3%.
� A 9.6% increase in revenue prompted by favourable exchange rates, notably the Australian dollar and the Brazilian real.
� A 1.1% negative impact caused by the disposal of non-strategic activities.
Higher organic growth of 10.1% in Q2 2010 compared with 2.6% in Q1, stemmed from:
� Oil & gas and power investments in fast-growing geographies (Asia, Latin America, Middle-East and Africa).
� The development of asset integrity management services for ageing industrial assets in mature countries.
� The 15% rally in minerals testing revenue prompted by the recovery in production and exploration investments, notably in Australia.
Adjusted operating profit in the Industry business rose by 10.7% from €33.8 million in H1 2009 to €37.4 million in H1 2010. The slight decline in adjusted operating margin to 10.7% from 11.1% in H1 2009 was due to the Mining & Minerals activity, where margins narrowed in H1.
For H2 2010, the Industry division is set to benefit from robust organic growth generated by:
� Further investments in oil exploration/production, particularly offshore.
� The ongoing expansion in minerals testing.
In-Service Inspection and Verification (IVS)
(in millions of euros) H1 2010 H1 2009 Change
Revenue 209.1 215.4 (2.9)%
Adjusted operating profit 22.6 16.2 +39.5%
Adjusted operating margin 10.8% 7.5% +330bps
Revenue in the In-Service Inspection & Verification business fell by 2.9% from €215.4 million in H1 2009 to €209.1 million due to:
� A virtually stable organic performance (-0.6%).
� A 0.6% negative impact on growth caused by non-strategic activities prior to their disposal during Q1 2010.
� A 2.2% negative impact from the disposal of non-strategic activities.
� A 0.5% positive impact from exchange rates.

10
Organic growth in the IVS business improved to 1.7% in the second quarter of 2010 (Q2 2010) after the 2.8% decrease witnessed in Q1, which suffered particularly from calendar effects and disadvantageous weather conditions.
Performances were mixed depending on the region:
� Revenue in France was robust during H1 2010 notably thanks to the roll-out of new regulatory schemes for heating, ventilation and air-conditioning equipment while revenue in the US grew sharply on the back of rising momentum of a contract with the USPS postal services.
� Revenue in Spain was dented by delays in renewals and start-dates for a number of major contracts, while that in the UK suffered from the halt to the portable electrical appliances inspection activity which was highly competitive and loss-making. The Group decided to halt the activity and made this effective in Q4 2009.
Adjusted operating profit in the In-Service Inspection & Verification business rose by 39.5% from €16.2 million in H1 2009 to €22.6 million in H1 2010 prompted by the 330 basis-point widening in adjusted operating margin to 10.8%. This performance stemmed from the completion of re-engineering of processes and the roll-out of automated production tools in France, as well as the recognition of the value added component (CVAE) of the new business tax applicable in France in income tax expense since January 1, 2010 whereas up to December 31, 2009, it was included in operating items.
In the future, the IVS business should continue to benefit from the extended scope of mandatory periodical inspections in Europe as well as expansion in new regions (eastern Europe, Germany, Italy and the US), further re-engineering of methods and the overhaul of production tools in all countries.
In H2 2010, the Group is forecasting an improvement in activity in Spain and the end to the negative impact caused by the halt to electrical appliance inspection in the UK beyond the third quarter of 2010 (Q3 2010).
Construction
(in millions of euros) H1 2010 H1 2009 Change
Revenue 209.6 234.7 (10.7)%
Adjusted operating profit 20.7 19.2 +7.8%
Adjusted operating margin 9.9% 8.2% +170bps
Revenue in the Construction business fell by 10.7% from €234.7 million to €209.6 million due to:
� A 6.3% organic decline in revenue.
� A 0.6% increase in revenue prompted by favourable exchange rates.
� A 5% negative impact caused by changes in the scope of consolidation in 2010 relative to 2009 (disposal of construction material testing activity).
The organic performance improved gradually in Q2, with a decline of 2.3% vs. -10.3% in Q1 2010 prompted by the combination of:
� An improvement in France with the announcement of tougher criteria for eligibility to the Scellier tax incentive law as of January 1, 2011 having boosted applications for building permits and housing starts before the end of 2010. Furthermore, business registration indicators have increased in recent months.
� No recovery in building permits and housing starts in the municipalities where the Group is present in the US.
� The decline noted in state-financed infrastructure projects in Spain.
� A recovery in Japan.
Adjusted operating profit in the Construction business rose by 7.8% thanks to the recovery in adjusted operating margin from 8.2% in H1 2009 to 9.9% in H1 2010. The margin widened considerably in Japan

11
from 7% in H1 2009 to 13% in H1 2010 and also increased in France with the recognition of the value added component (CVAE) of the new business tax applicable in France in income tax expense since January 1, 2010 whereas up to December 31, 2009, it was included in operating items.
The Group confirmed that the lower volume of operations ought to be gradually reabsorbed by the end of 2010 despite a slower infrastructure market due to lower state spending in Europe.
Certification
(in millions of euros) H1 2010 H1 2009 Change
Revenue 157.1 143.0 +9.9%
Adjusted operating profit 30.9 25.2 +22.6%
Adjusted operating margin 19.7% 17.6% +210bps
Revenue in the Certification business rose by 9.9% from €143.0 million in H1 2009 to €157.1 million in H1 2010, driven by:
� Organic growth of 6.8%.
� A 3.1% increase in revenue prompted by favourable exchange rates.
During H1 2010, the Certification business reported robust organic growth thanks to:
� The rising momentum of sustainable development schemes including management systems for energy performance, bio fuels, greenhouse gases, carbon footprint, food safety and forest management.
� The development of global clients aiming to place all of their certifications into the hands of a single body offering them global presence, an integrated stance for the various schemes and methodologies adapted to their business sectors and internal processes.
� Double-digit growth in emerging regions: China, Africa, Middle-East, India, Russia.
Adjusted operating profit in the Certification business rose by 22.6% from €25.2 million in H1 2009 to €30.9 million in H1 2010 on the back of 9.9% growth in revenue and an improvement in productivity prompted by the gradual roll-out of the new integrated production IT system. Operating margin therefore totalled 19.7% in H1 2010 compared with 17.6% in H1 2009.
2010 should continue to benefit from the roll-out of new certification schemes, customized audit solutions for major clients and development in fast-growing economies. In France, the GSAC (Group for Civil Aviation Safety) contract concerning control and verification of civil aviation safety may not be renewed with the Group. The contract is worth €18 million in revenue over the full year and could be ended in Q4 2010.
Consumer Products
(in millions of euros) H1 2010 H1 2009 Change
Revenue 182.7 188.2 (2.9)%
Adjusted operating profit 49.8 53.2 (6.4)%
Adjusted operating margin 27.3% 28.3% (100)bps
Revenue in the Consumer Products business fell by 2.9% from €188.2 million in H1 2009 to €182.7 million in H1 2010 due to the combination of:
� A 4.3% organic decline in revenue.
� A 1.2% rise in revenue prompted by favourable exchange rates.

12
� A 0.2% rise in revenue prompted by the full-year consolidation of companies acquired in 2009 (notably SPD in China and Thurmelec in Germany).
After the 11.2% organic decline noted in Q1 2010 due to particularly demanding comparison with record high organic growth of 38% in Q1 2009, revenue picked up rapidly in Q2 (+2.1%).
Over H1 2010 as a whole, revenue from toys and other children's products testing dropped 20.6% on a same-structure and exchange rate basis given demanding comparison in H1 2009 caused by the new Consumer Product Safety Improvement Act (CPSIA) in the US. The Group reported healthy growth in other business segments and in particular the electrics and electronics segment.
Adjusted operating profit in the Consumer Products business fell by 6.4% due to the 2.9% decrease in revenue and slight narrowing in adjusted operating margin from 28.3% in H1 2009 to 27.3% in H1 2010.
This slight decline in adjusted operating margin stemmed from a disadvantageous product mix with a lower share of high-margin analytical testing on toys. This disadvantageous mix was offset by high structural productivity gains generated by the rising momentum of the new laboratories platform in China. Over the full-year, adjusted operating margin in the business ought to be stable compared with the 2009 level of 27.5% of revenue.
The Group is forecasting acceleration in organic growth in H2 2010, particularly in view of the end to demanding comparison with the year-earlier period caused by the CPSIA. In addition to this, growth factors in the business are set to stem from new regulations, especially the European Directive on toys and tougher standards in the local Chinese market as well as the development of new innovative solutions for improving security in client supply chains.
Government Services & International Trade
(in millions of euros) H1 2010 H1 2009 Change
Revenue 85.4 78.9 +8.2%
Adjusted operating profit 16.0 12.9 +24.0%
Adjusted operating margin 18.7% 16.3% +240bps
Revenue in the Government Services & International Trade business rose by 8.2% from €78.9 million in H1 2009 to €85.4 million in H1 2010 following:
� Organic growth of 10.0%.
� A 1.8% negative impact from exchange rate fluctuations due to the devaluation of the Angolan Kwanza.
Organic growth in the Government Services segment was healthy throughout H1 2010 with an increase in the FOB value of merchandise inspected as well as the rising momentum of new contracts in Indonesia, Algeria and Saudi Arabia. The international trade segment benefited from the recovery in volumes of goods inspected.
Adjusted operating profit in the business rose by 24.0% to €16.0 million driven by higher volumes and improved improved contract terms in Ivory Coast and Mali.
In H2 2010, the Group should benefit from further robust organic growth with the start-up of recently signed contracts (Syria, Uganda and the Philippines).

13
1.3.9 Group cash flows and financing sources on June 30, 2010 and June 30, 2009
Cash flow
(in millions of euros) H1 2010 H1 2009
Profit before income tax 198.4 177.2
Elimination of cash flows from financing and investing activities 19.8 24.2
Provisions and other non-cash items (7.3) 4.5
Depreciation, amortization and impairment 40.0 34.7
Movements in working capital attributable to operations (69.4) (11.0)
Income tax paid (63.4) (35.5)
Net cash generated from operating activities 118.1 194.1
Acquisitions of subsidiaries (16.7) (32.7)
Proceeds from sales of subsidiaries 7.9 -
Purchases of property, plant & equipment and intangible assets (28.1) (27.8)
Proceeds from sales of property, plant & equipment and intangible assets 0.6 0.1
Purchases of non-current financial assets (12.4) (5.1)
Proceeds from sales of non-current financial assets 2.0 2.1
Other 1.1 5.2
Net cash used in investing activities (45.6) (58.2)
Capital increase 0.5 1.8
Purchase / sales of treasury shares 0.5 0.8
Dividends paid (84.6) (77.9)
Increase in borrowings and other debt 119.2 66.1
Repayments of borrowings and other debt (95.3) (158.6)
Interest paid (17.2) (23.2)
Net cash used in financing activities (76.9) (191.0)
Impact of currency translation differences 11.2 (0.3)
Net increase (decrease) in cash and cash equivalent s 6.8 (55.4)
Net cash and cash equivalents at beginning of period 139.3 145.4
Net cash and cash equivalents at end of period 146.1 90.0
o/w cash and cash equivalents 169.1 105.7
o/w bank overdrafts (23.0) (15.7)

14
Cash flows generated from operating activities
Net cash flow generated from operating activities totalled €118.1 million in H1 2010 compared with the exceptionally high amount of €194.1 million in H1 2009. Indeed, H1 2009 cash flows more than doubled relative to the H1 2008 level of €86.8 million.
In 2010, seasonal trends in cash flow should be similar to those noted in previous years (excluding 2009) with H1 generally accounting for 30% of full-year cash flow. Note that seasonal factors primarily stem from higher working capital requirements in H1 given that three categories of spending are entirely focused in the first months of the year: � Insurance premiums payable in January. � Employess bonuses and profit-sharing premiums as well as the associated social charges, payable in
April. � The balance of corporate tax due for the previous year, payable during H1 on different dates
depending on the country.
On June 30, 2010, working capital requirements totalled €241.9 million, representing 9.1% of revenue overthe previous 12 months and compared with €236.9 million on June 30, 2009 (8.8% of revenue).
(in millions of euros) H1 2010 H1 2009
Net cash generated from operating activities 118.1 194.1 Purchases of property, plant and equipment and intangible assets (28.1) (27.8) Proceeds from sales of property, plant and equipment and intangible assets
0.6 0.1
Interest paid (17.2) (23.2)
Levered free cash flow 73.4 143.2
Levered free cash flow (cash flow available after income tax, interest expenses and capex) totalled €73.4 million in H1 2010 compared with €143.2 million in H1 2009.
Purchases of property, plant & equipment and intang ible assets
In general, inspection and certification activities are not particularly capital intensive. Only the laboratories testing and analysis activities require capital spending (Consumer Products, Mining & Minerals and scanners).
The overall amount of capital expenditure (Capex) undertaken by the Group in H1 2010 totalled €28.1 million, which was slightly ahead of the €27.8 million reported in H1 2009. The Group's capex-to-revenue ratio remained stable at 2.1% of revenue in H1 2010.

15
Cash flows used in investing activities
Cash flows generated by the Group's investment activities reflect expansion via acquisitions over the past two years. The table below sets out the breakdown of acquisitions made by the Group during H1 2010 and H1 2009.
(in millions of euros) H1 2010 H1 2009
Cost of acquisitions (16.2) (24.6)
Cash and cash equivalents of acquired companies 0.8 -
Purchase price outstanding at June 30 2.5 0.1
Purchase price paid related to prior periods (1.1) (8.2)
Impact of acquisitions on cash and cash equivalents (14.0) (32.7)
Acquisition fees (2.7) -
ACQUISITION OF SUBSIDIARIES (16.7) (32.7)
Acquisitions
A description of the main acquisitions made in H1 2010 is presented in the paragraph "Highlights of the Period" in this section of the report.
Company disposals
The operating disposals undertaken by the Group during H1 2010 were carried out in Spain, Australia and the UK as part of the process to streamline the Group's business protfolio.
Cash flows used in financing activities
Dividends In H1 2010, the "dividends paid" line item mainly included the €91.0 million dividend payout to shareholders for the financial year 2009 (dividend per share of €0.84), up 17.4% relative to the amount paid in the previous year.
Borrowings Increases in and repayments of loans and borrowings showed a net increase of €23.9 million during H1 2010, driven primarily by a translation effect for debts denominated in local currencies (USPP loan and syndicated loan).
Interest paid
The €6.0 million decrease in the amount spent on interest expenses in H1 2010 vs. H1 2009 stemmed primarily from the decline in the average level of net financial debt, lower interest rates in the non-hedged part of gross financial debt and the expiry of a number of interest rate hedging instruments.
Financing
Sources of Group financing
Apart from the use of its own capital, the Group is financed mainly via the 2006 Syndicated Loan, the 2007 Club Deal and the 2008 Private Placement (USPP). Virtually all of the Group's financial debt on June 30, 2010 is represented by these various financing programmes.
On June 30, 2010, the Group's gross borrowings totalled €941.8 million and therefore primarily included the syndicated loans (€447.2 million), the October 2007 Club Deal (€150 million), the 2008 Private Placement (€293.8 million) and other bank loans (€50.8 million including €23 million in bank overdrafts).

16
The Group's gross financial debt is set out in the following table:
(in millions of euros) June 30, 2010
Dec. 31, 2009
June 30, 2009
Bank borrowings (long term portion) 833.0 740.8 892.0
Bank borrowings (short term portion) 85.8 77.8 78.1
Bank overdrafts 23.0 7.7 15.7
GROSS FINANCIAL DEBT 941.8 826.3 985.8
The following table shows cash and cash equivalents as well as the group's net financial debt:
(in millions of euros) June 30, 2010
Dec. 31, 2009
June 30, 2009
Marketable securities and similar receivables 17.0 15.5 8.3
Cash on hand 152.1 131.5 97.4
Cash and cash equivalents 169.1 147.0 105.7 Gross financial debt 941.8 826.3 985.8 NET FINANCIAL DEBT 772.7 679.3 880.1
Adjusted net financial debt (after currency hedging instruments as defined in the calculation of banking covenants) totalled €712.8 million on June 30, 2010 vs. €693.0 million on December 31, 2009.
The Group's available cash is spread between more than 250 units located in more than 140 countries. In a number of countries (particularly Brazil, China, South Korea, India and Turkey), the Group's units are subject to strict currency controls which make intra-group loans very difficult.
Main characteristics of the 2006 syndicated loan
The 2006 Syndicated Loan, which is repayable early, in part or in full, without penalty upon maturity of each drawdown by the Group’s borrowing entities (either 1, 3 or 6 months), is made up of two tranches:
� the A Facility (term loan), amortizable, for an initial amount of $560 million. The A Facility has been completely drawn. The amount of A Facility has already reached $258.3 million. The A Facility is for seven years, with an expiry date in May 2013; and
� the B Facility (revolving credit facility), in the sum of €550 million. The B Facility permits drawings in several currencies. The expiry date was extended from May 2012 to May 2013 for the greater part of this facility (95% of the tranche).
17
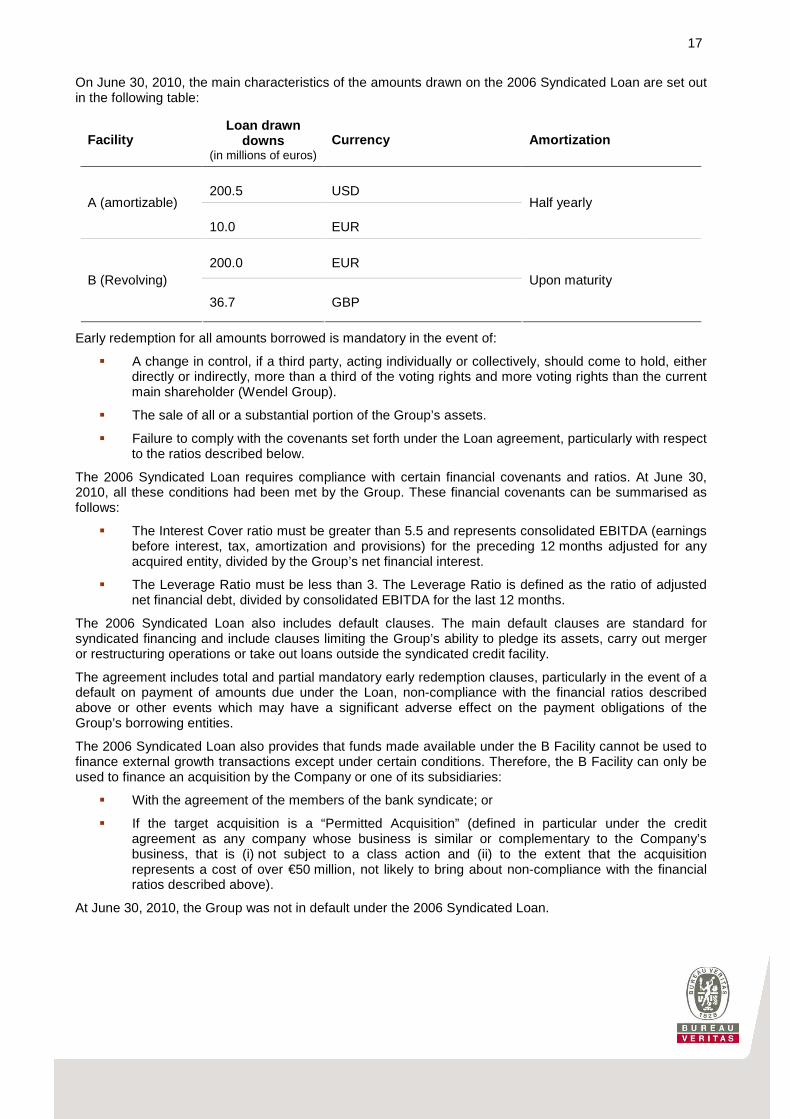
On June 30, 2010, the main characteristics of the amounts drawn on the 2006 Syndicated Loan are set out in the following table:
Facility Loan drawn
downs (in millions of euros)
Currency Amortization
200.5 USD A (amortizable)
10.0 EUR
Half yearly
200.0 EUR B (Revolving)
36.7 GBP
Upon maturity
Early redemption for all amounts borrowed is mandatory in the event of:
� A change in control, if a third party, acting individually or collectively, should come to hold, either directly or indirectly, more than a third of the voting rights and more voting rights than the current main shareholder (Wendel Group).
� The sale of all or a substantial portion of the Group’s assets.
� Failure to comply with the covenants set forth under the Loan agreement, particularly with respect to the ratios described below.
The 2006 Syndicated Loan requires compliance with certain financial covenants and ratios. At June 30, 2010, all these conditions had been met by the Group. These financial covenants can be summarised as follows:
� The Interest Cover ratio must be greater than 5.5 and represents consolidated EBITDA (earnings before interest, tax, amortization and provisions) for the preceding 12 months adjusted for any acquired entity, divided by the Group’s net financial interest.
� The Leverage Ratio must be less than 3. The Leverage Ratio is defined as the ratio of adjusted net financial debt, divided by consolidated EBITDA for the last 12 months.
The 2006 Syndicated Loan also includes default clauses. The main default clauses are standard for syndicated financing and include clauses limiting the Group’s ability to pledge its assets, carry out merger or restructuring operations or take out loans outside the syndicated credit facility.
The agreement includes total and partial mandatory early redemption clauses, particularly in the event of a default on payment of amounts due under the Loan, non-compliance with the financial ratios described above or other events which may have a significant adverse effect on the payment obligations of the Group’s borrowing entities.
The 2006 Syndicated Loan also provides that funds made available under the B Facility cannot be used to finance external growth transactions except under certain conditions. Therefore, the B Facility can only be used to finance an acquisition by the Company or one of its subsidiaries:
� With the agreement of the members of the bank syndicate; or
� If the target acquisition is a “Permitted Acquisition” (defined in particular under the credit agreement as any company whose business is similar or complementary to the Company’s business, that is (i) not subject to a class action and (ii) to the extent that the acquisition represents a cost of over €50 million, not likely to bring about non-compliance with the financial ratios described above).
At June 30, 2010, the Group was not in default under the 2006 Syndicated Loan.
18
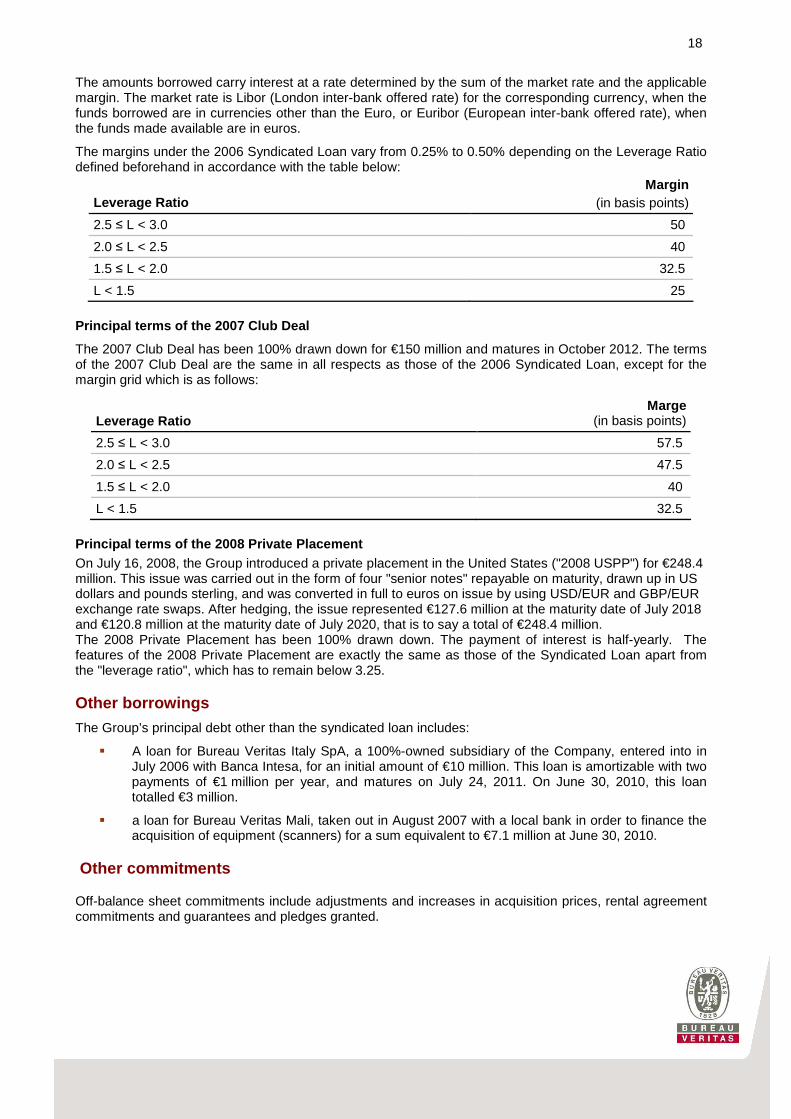
The amounts borrowed carry interest at a rate determined by the sum of the market rate and the applicable margin. The market rate is Libor (London inter-bank offered rate) for the corresponding currency, when the funds borrowed are in currencies other than the Euro, or Euribor (European inter-bank offered rate), when the funds made available are in euros.
The margins under the 2006 Syndicated Loan vary from 0.25% to 0.50% depending on the Leverage Ratio defined beforehand in accordance with the table below:
Leverage Ratio Margin
(in basis points)
2.5 ≤ L < 3.0 50
2.0 ≤ L < 2.5 40
1.5 ≤ L < 2.0 32.5
L < 1.5 25
Principal terms of the 2007 Club Deal
The 2007 Club Deal has been 100% drawn down for €150 million and matures in October 2012. The terms of the 2007 Club Deal are the same in all respects as those of the 2006 Syndicated Loan, except for the margin grid which is as follows:
Leverage Ratio Marge
(in basis points)
2.5 ≤ L < 3.0 57.5
2.0 ≤ L < 2.5 47.5
1.5 ≤ L < 2.0 40
L < 1.5 32.5
Principal terms of the 2008 Private Placement On July 16, 2008, the Group introduced a private placement in the United States ("2008 USPP") for €248.4 million. This issue was carried out in the form of four "senior notes" repayable on maturity, drawn up in US dollars and pounds sterling, and was converted in full to euros on issue by using USD/EUR and GBP/EUR exchange rate swaps. After hedging, the issue represented €127.6 million at the maturity date of July 2018 and €120.8 million at the maturity date of July 2020, that is to say a total of €248.4 million. The 2008 Private Placement has been 100% drawn down. The payment of interest is half-yearly. The features of the 2008 Private Placement are exactly the same as those of the Syndicated Loan apart from the "leverage ratio", which has to remain below 3.25.
Other borrowings
The Group’s principal debt other than the syndicated loan includes:
� A loan for Bureau Veritas Italy SpA, a 100%-owned subsidiary of the Company, entered into in July 2006 with Banca Intesa, for an initial amount of €10 million. This loan is amortizable with two payments of €1 million per year, and matures on July 24, 2011. On June 30, 2010, this loan totalled €3 million.
� a loan for Bureau Veritas Mali, taken out in August 2007 with a local bank in order to finance the acquisition of equipment (scanners) for a sum equivalent to €7.1 million at June 30, 2010.
Other commitments
Off-balance sheet commitments include adjustments and increases in acquisition prices, rental agreement commitments and guarantees and pledges granted.

19
Guarantees and pledges Guarantees and pledges granted as of June 30, 2010 and in 2009 are set out below:
Guarantees and pledges include bank guarantees and parent company guarantees:
� Bank guarantees: these essentially include bid bonds as well as performance bonds, with none yet called at the time of this half-yearly financial report. Bid bonds enable the beneficiary to protect itself in the event of a withdrawal of a commercial offer, a refusal to sign a contract or a failure to provide the guarantees requested. Performance bonds guarantee the buyer that the Group will meet its contractual obligations as provided under contract. Performance bonds are usually issued for a percentage (in the order of 10%) of the value of the contract; and
� Parent company guarantees: these concern market guarantees and guarantees granted by the parent company to financial institutions to cover financial pledges given by the financial institutions in connection with the Group’s business activities and rental payment guarantees. By granting guarantees for rental payments, the parent company undertakes to pay rent to the lessor in the event of default by the subsidiary concerned.
At June 30, 2010, the Group believed that the risk of payout under the guarantees described above was low. As a result, no provisions were set aside for this purpose. At June 30, 2010, the guarantees and pledges granted were as follows:
The presentation of off-balance sheet commitments in this document does not omit any significant off-balance sheet commitment in accordance with the applicable accounting standards.
Adjustments and acquisition price complements
On June 30, 2010, the Group had no significant off-balance sheet commitment associated with acquisitions.
Sources of financing anticipated for future investm ents
The Group estimates that financing needs for operations will be fully covered by operating cash flows.
In order to finance acquisitions, the Group has:
� Resources generated by available cash flow after taxes, financial expenses and dividends.
� Resources from cash and cash equivalents.
� Resources from the 2006 Syndicated Loan, the terms of which are set out in this document. On June 30, 2010, €313.3 million of the 2006 Syndicated Loan were available.
� New financing lines as set out below.
(in millions of euros) June 30, 2010
Dec. 31, 2009
Less than one year 59.5 47.0
Between one and five years 71.8 64.2
More than five years 7.1 5.6
Total 138.4 116.8
(in millions of euros) June 30, 2010
Dec. 31, 2009
Bank guarantees 96.3 83.0
Parent company guarantees 42.1 33.8
Total 138.4 116.8

20
Main characteristics of 2010 US Private Placement In July 2009, the Group set up a three-year multi-currency credit line with a US institutional lender for a total amount of $225 million. The Group confirmed the use of this line in June 2010 after the acquisition of Inspectorate was signed. The terms of this financing contract (USPP 2010) are similar to those of the 2008 Private Placement with the exception of the duration (nine years maturing in 2019), currency (US dollars) and the rate (fixed rated of 4.095%).
Main characteristics of 2010 French Private Placeme nt In June 2010, the Group set up a five-year bank credit line with French institutionals for €200 million, expiring in June 2015. The terms of the financing contract (French PP 2010) are virtually the same as those of the 2006 Syndicated Loan, with the exception of the following margin grid:
Type Repayment Margin
(basis points)
Facility A: €100 million Revolving Amortization 150
Facility B: €50 million Revolving Upon maturity 150
Facility C: €50 million Loan Upon maturity 165
1.4. Risk factors for the remaining six months of t he 2010 financial year
Readers are invited to refer to the company's 2009 Registration Document registered with the French Financial Markets Authorities on 12 April 2010 under the number R.10-019 (paragraph 1.8 – Risk factors).
Financial and market risks are also set out in the Appendix to the Consolidated Half-Year Financial Statements in Note 15 presented in Chapter 2 – 2010 half-year Consolidated Financial Statements of this 2010 Half-Year Financial Report.
Legal, administrative, government and arbitration procedures and investigations
In the ordianry course of its activities, the Group is involved in a large number of legal procedures for certain activities that contest its professional civil liability following services provided. Although the Group takes great care in controlling risks and the quality of services provided, some of these services can give rise to claims and court sentences to pay financial damages. The eventual expenses prompted by disputes are the object of provisions. The amount set aside under provisions is the best estimate of the expense required to eliminate the obligatory damages payment, booked in the present value at the closing date. The costs that the Group could have to pay may exceed the amount of provisions set aside for disputes due to numerous factors, particularly the uncertain nature of the outcome of the disputes. On the date of the current document, the Group is implied in the following main procedures:
Terminal 2E at Paris-Roissy CDG airport On May 23, 2004, a part of the roof of the departure hall of Terminal 2E at the Roissy CDG Airport collapsed, causing the death of four persons, injuries to six persons and the closing of the terminal.
Legal proceedings were started after the accident and a criminal investigation opened led to the questioning of the builders and the Company.The investigation is still underway. At the same time, two

21
legal expertises procedures were initiated at the request of the main main parties involved in the construction, namely Aéroports de Paris (the party responsible for the construction project,architect and general contractor) and companies of the Vinci group (that participated in the construction of the outer structure of the hall).
A deal has already been made regarding the “ten-year” physical damage borne, with the Company's share covered by its insurance policies. Experts have valued non-material damages at around €145 million and proposed a responsibility percentage for the Group of around 8-10%.
Based on these valuations and proposals and on the basis of available insurance warranties and provisions set aside by the Group, the Company estimates that the event should not have a significant adverse effect on the consolidated financial statements of the Group..
Gabon Express airline crash
No significant changes have intervened in the dispute concerning the Gabon Express airline since the publication of the 2009 registration document, the declarations for which remain valid.
Disputes concerning the construction of a hotel and shopping complex in Turkey Bureau Veritas Gozetim Hizmetleri Ltd Sirketi (BVT) and the Turkish company Aymet are parties to a dispute before the Commercial Court of Ankara relating to the construction of a hotel and business complex in respect of which the parties concluded a contract in 2003. Aymet filed an action in 2008 and is currently claiming more than US$63 million in damages from BVT for alleged failures in the performance of its project inspection and supervision mission.
Documents recently brought to the Court's attention by the bank that partly financed the project, confirm the Company's position whereby the requests made by Aymet are unfounded in legal and contractual terms.
Based on the available insurance warranties and the provisions set aside by the Group and in view of information to date, the Company believes that this claim should not have significantly affect the Group's consolidated financial statements.
There are no other government, administrative, legal, or arbitration proceedings or investigations (including any proceeding of which the Company is aware, pending, or with which the Group is threatened), which are likely to have or have had within the last six months a material impact on the financial position or profitability of the Group.
1.5. .Related-party transactions
Readers are invited to refer to Note 17 - Related-party transactions - presented in Chapter 2 - 2010 Half-Year Consolidated Financial Statements of the present 2010 Half-Year Financial Report.
1.6. Outlook
In view of the gradual acceleration in organic growth and the consolidation of Inspectorate over four months, H2 2010 revenue growth should total around 10%. Over the full-year 2010, the Group is targeting a slight growth in adjusted operating margin (as a percentage of revenues) on an organic basis. Inspectorate’s financial performance in H1 allows us to confirm its full-year target of £280 million in revenues and £30 million in operating profit. Group net debt at December 31, 2010 should represent less than 2x EBITDA, thereby leaving the Group sufficient financial capacity to pursue an active policy to make small and medium-sized acquisitions.

22
Further out, structural growth factors in the sector remain the same, namely the multiplication and the bolstering of QHSE regulations, the privatisation and outsourcing of inspection and control activities and the globalisation of trade. The Group's strategy is to invest in market segments offering the highest potential growth such as commodities testing, nuclear, offshore energy and energy efficiency of buildings while remaining the reference for consolidation of the market and maintaining a high-level operating performance.
1.7. Events after the balance sheet date
Acquisition
On July 1, 2010, Bureau Veritas acquired Italian company, Kamelot, specialised in in-service verifications.
Performance shares and options
On 23 July 2010, the Board of Directors decided to grant share subscription options and free shares to 686 members of staff, corresponding to a total of 707,600 shares (463,400 free shares and 244,200 share subscription options) and representing around 0.65% of the share capital.
The subscription price of the options was set at €46.31, corresponding to the average without discounts of the first traded prices on the last 20 stock market trading days preceding the allocation date.
Under this framework, the share subscription options and performance-related shares were granted to three executive corporate officers on the basis of two conditions:
� Performance: depending on the level of 2010 adjusted operating profit achieved, beneficiaries can exercise and/or acquire between 0% and 100% of the options/shares granted. In addition, if adjusted operating margin in either 2011 and 2012 is lower than the target level set by the Board of Directors on the allocation date, no performance shares can be acquired by the beneficiaries.
� Presence: for share subscription options, if the beneficiary leaves the Group, the rights to these share subscription options are cancelled. For performance shares, a three-year acquisition period is followed by a two-year conservation period.

23
2. 2010 half-year Consolidated Financial Statements
2.1 2010 half-year Financial statements
2010 Half-year consolidated income statement
(in mil l ions of euros)Notes
First-half 2010
First-half 2009
Revenue 1,349.1 1,329.5
Purchases and external charges 6 (387.3) (373.3)
Personnel costs 6 (699.1) (678.5)
Taxes other than on income (28.8) (31.8)
Net (additions to)/reversals of provisions 6 7.7 (10.6)
Depreciation and amortization (37.2) (34.7)
Other operating income 6 10.4 6.5
Other operating expense 6 (1.1) (1.7)
Operating profit 213.7 205.4
Income from cash and cash equivalents 1.0 0.9
Finance costs, gross (19.1) (24.8)
Finance costs, net (18.1) (23.9)
Other financial income 10.0 0.4
Other financial expense (7.1) (4.7)
Net financial expense (15.2) (28.2)
Share of profit of associates (0.1) -
Profit before income tax 198.4 177.2
Income tax expense (54.4) (44.7)
Profit from continuing operations 144.0 132.5
Profit from discontinued operations and operations held for sale - 0.4
Net profit for the period 144.0 132.9
Attributable to:
owners of the Company 140.8 130.5
non-controlling interests 3.2 2.4
Basic earnings per share (in euros) 13 1.30 1.21
Diluted earnings per share (in euros) 13 1.28 1.19 The notes on pages 28 to 44 are an integral part of the condensed financial statements.

24
2010 Half-year consolidated statement of comprehensive income
Notes
First-half 2010
First-half 2009
Net profit for the period 144.0 132.9
Other comprehensive income 157.5 8.8
Currency translation differences 134.8 (0.7)
Cash flow hedges 22.7 9.5
Tax effect on other comprehensive income 12 (7.4) (3.3)
Total other comprehensive income (after tax) 150.1 5. 5
Total comprehensive income 294.1 138.4
Attributable to:
owners of the Company 289.6 136.6
non-controlling interests 4.5 1.8
The notes on pages 28 to 44 are an integral part of the condensed financial statements.

25
2010 Half-year consolidated statement of financial position
Notes June 30, 2010 Dec. 31, 2009Goodwill 7 936.2 832.2
Intangible assets 176.0 171.4
Property, plant and equipment 220.4 208.2
Investments in associates 0.5 0.6
Deferred income tax assets 12 63.4 66.3
Investments in non-consolidated companies 0.4 0.4
Other non-current financial assets 37.2 31.2
Total non-current assets 1,434.1 1,310.3
Trade and other receivables 891.8 798.9
Current income tax assets 26.6 20.2
Current financial assets 6.9 7.9
Derivative financial instruments 69.9 13.8
Cash and cash equivalents 169.1 147.0
Total current assets 1,164.3 987.8
Assets held for sale - -
TOTAL ASSETS 2,598.4 2,298.1
Share capital 13.1 13.1
Retained earnings and other reserves 686.5 476.6
Equity attributable to owners of the Company 699.6 489.7
Non-controlling interests 9.0 11.5
Total equity 708.6 501.2
Bank borrowings 10 833.0 740.8
Other non-current financial liabilities 10 1.6 1.9
Deferred income tax liabilities 12 25.2 35.2
Pension plans and other long-term employee benefits 89.2 88.0
Provisions for other liabilities and charges 88.3 102.8
Total non-current liabilities 1,037.3 968.7
Trade and other payables 649.9 632.8
Current income tax liabilities 66.3 57.2
Derivative financial instruments 18.5 42.6
Current financial liabilities 10 117.8 95.6
Total current liabilities 852.5 828.2
Liabilities held for sale - -
TOTAL EQUITY AND LIABILITIES 2,598.4 2,298.1
The notes on pages 28 to 44 are an integral part of the condensed financial statements.

26
2010 Half-year consolidated statement of changes in equity
NotesShare
capitalShare
premium
Currency translation
reserves
Other reserves
Total equity
Attributable to owners of the
Company
Attributable to non-
controlling interests
January 1, 2009 13,0 112,2 (57,6) 216,2 283,8 270,4 13,4
Capital reduction
Exercise of stock options 0,1 1,7 1,8 1,8
Fair value of stock options 9 2,4 2,4 2,4
Dividends paid 14 (81,8) (81,8) (77,5) (4,3)
Treasury share transactions 0,8 0,8 0,8
Other movements (2,1) (2,1) (2,1)
Total transactions with owners 0,1 1,7 (80,7) (78,9) (72 ,5) (6,4)Total comprehensive income (0,7) 139,1 138,4 136,6 1,8
June 30, 2009 13,1 113,9 (58,3) 274,6 343,3 334,5 8,8
January 1, 2010 13,1 116,2 (44,5) 416,4 501,2 489,7 11,5
Capital reduction
Exercise of stock options 0,5 0,5 0,5
Fair value of stock options 9 4,2 4,2 4,2
Dividends paid 14 (91,4) (91,4) (91,0) (0,4)
Treasury share transactions 0,6 0,6 0,6
Other movements (0,6) (0,6) 6,0 (6,6)
Total transactions with owners 0,5 (87,2) (86,7) (79,7) (7,0)
Total comprehensive income 134,8 159,3 294,1 289,6 4,5
June 30, 2010 13,1 116,7 90,3 488,5 708,6 699,6 9,0 The notes on pages 28 to 44 are an integral part of the condensed financial statements.
27
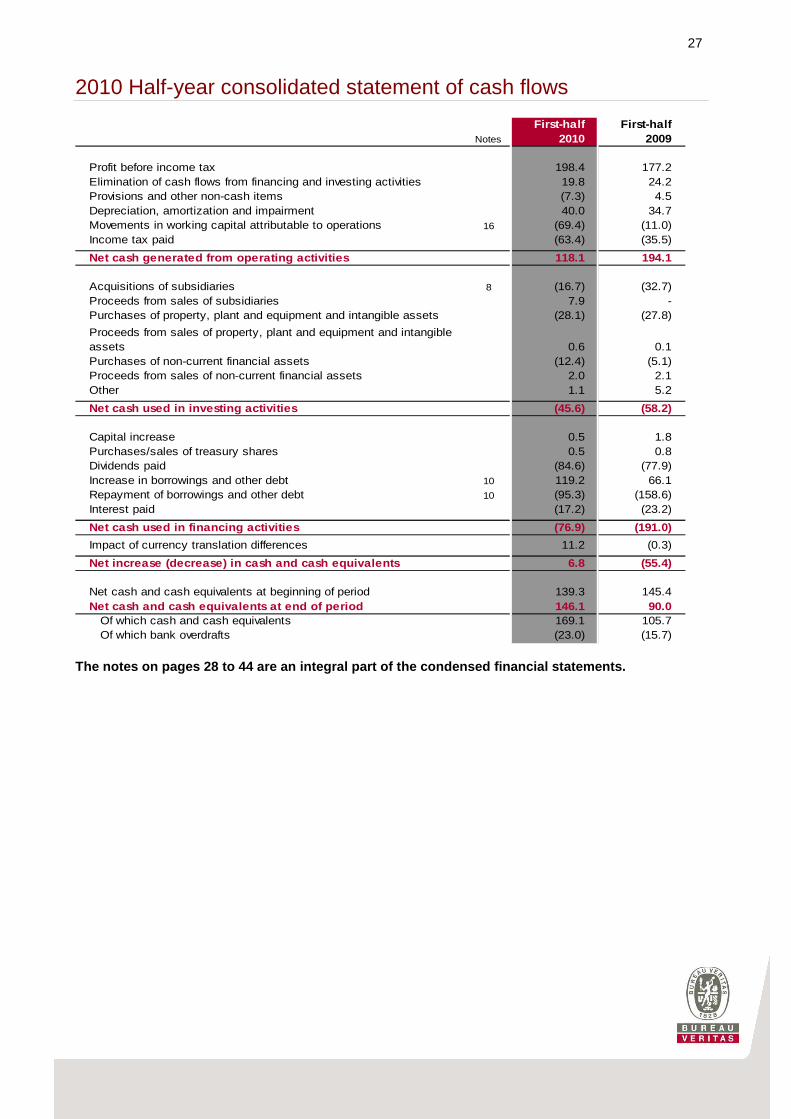
2010 Half-year consolidated statement of cash flows
Notes
First-half 2010
First-half 2009
Profit before income tax 198.4 177.2Elimination of cash flows from financing and investing activities 19.8 24.2Provisions and other non-cash items (7.3) 4.5Depreciation, amortization and impairment 40.0 34.7Movements in working capital attributable to operations 16 (69.4) (11.0)Income tax paid (63.4) (35.5)
Net cash generated from operating activities 118.1 194.1
Acquisitions of subsidiaries 8 (16.7) (32.7)Proceeds from sales of subsidiaries 7.9 - Purchases of property, plant and equipment and intangible assets (28.1) (27.8)
Proceeds from sales of property, plant and equipment and intangible assets 0.6 0.1Purchases of non-current financial assets (12.4) (5.1)Proceeds from sales of non-current financial assets 2.0 2.1Other 1.1 5.2
Net cash used in investing activities (45.6) (58.2)
Capital increase 0.5 1.8Purchases/sales of treasury shares 0.5 0.8Dividends paid (84.6) (77.9)Increase in borrowings and other debt 10 119.2 66.1Repayment of borrowings and other debt 10 (95.3) (158.6)Interest paid (17.2) (23.2)
Net cash used in financing activities (76.9) (191.0)
Impact of currency translation differences 11.2 (0.3)
Net increase (decrease) in cash and cash equivalent s 6.8 (55.4)
Net cash and cash equivalents at beginning of period 139.3 145.4Net cash and cash equivalents at end of period 146.1 90.0
Of which cash and cash equivalents 169.1 105.7Of which bank overdrafts (23.0) (15.7)
The notes on pages 28 to 44 are an integral part of the condensed financial statements.

28
2.2 Notes to the condensed 2010 half-year consolida ted financial statements
Note 1: General information
Since it was formed in 1828, Bureau Veritas has developed recognized expertise for helping its clients to comply with standards and/or regulations on quality, health and safety, security, the environment and social responsibility. The Group specializes in inspecting, testing, auditing and certifying the products, assets and management systems of its clients in relation to regulatory or self-imposed standards, and subsequently issues compliance reports.
Bureau Veritas S.A. (“the Company”) and all of its subsidiaries make up the Bureau Veritas Group (“Bureau Veritas” or “the Group”).
Bureau Veritas S.A. is a joint stock company (société anonyme) incorporated and domiciled in France. The address of its registered office is 67-71 Boulevard du Château, 92571 Neuilly-sur-Seine, France. Between 2004 and October 2007, the Group was more than 99%-owned by Wendel. On October 24, 2007, Bureau Veritas S.A. shares were admitted for trading on the Euronext-Paris market. At June 30, 2010, Wendel held an interest of 51.9% in Bureau Veritas (excluding treasury shares).
These condensed 2010 half-year consolidated financial statements were adopted on August 25, 2010 by the Board of Directors.
Note 2: First-half 2010 highlights
Dividend payout
On June 17, 2010, the Group paid out dividends on eligible shares totaling €91.0 million in respect of financial year 2009.
Acquisitions and disposals
In the first half of 2010, the Group acquired Advanced Coal Technology in South Africa and SMSI in the US.
On June 22, 2010, Bureau Veritas announced that it had entered into an agreement with UK firm Inspicio (owned by private equity fund 3i) to acquire the entire capital stock of Inspicio’s Inspectorate subsidiary. The transaction is expected to be completed in the third quarter of 2010, upon clearance from the relevant competition authorities.
Inspectorate caters to three market segments in which it enjoys top-ranking positions worldwide: oil and petrochemicals (59% of revenue in 2009 – ranked no. 2 in the US), metals and minerals (26% of revenue – ranked no. 2 worldwide in trading activities), and agricultural products and other goods (15% of revenue – ranked no. 3 worldwide). Inspectorate has an extensive network in 60 countries across the globe, with 150 laboratories and more than 7,000 employees. Inspectorate reported revenue of GBP 246 million in 2009.
This places Bureau Veritas among the top three firms worldwide engaged in commodities testing and inspection, a fast-growing global market offering promising internal and external growth opportunities. The operation will enable the Group to continue diversifying its business portfolio by gaining a foothold in the oil inspection market and bolstering its position in the minerals and food sectors. It will also help consolidate the Group’s international network in countries where Bureau Veritas has not yet reached a critical size

29
(particularly the US and the UK), and enhance its presence in regions with high growth potential such as Russia, India, Latin America, China, Central and South-East Asia and the Middle East.
The acquisition will be carried out for around GBP 450 million (including debt), payable on completion of the transaction. The transaction will be financed by the Group’s new and existing credit lines. Ancillary acquisition expenses incurred in the half-year to June 30 totaled €2.5 million and are included in operating expenses.
As the transaction should be completed only in the third quarter of 2010 (upon clearance from the relevant competition authorities), no disclosures may be provided regarding the fair value of assets acquired and liabilities assumed, and the amount of goodwill and total ancillary expenses incurred.
During the period, Bureau Veritas continued to streamline its business portfolio by selling non-core activities in Spain, Australia and the US.
Business tax reform in France
The value added component (CVAE) of the new business tax applicable in France has been recognized in income tax expense since January 1, 2010. Up to December 31, 2009, business tax expense was included in operating items within “Taxes other than on income”. The impact on the “Taxes other than on income" and “Income tax expense” lines of the income statement for the half-year ended June 30, 2010 was €4.7 million.
Note 3: Summary of significant accounting policies
Basis of preparation
The condensed consolidated financial statements for the half-year ended June 30, 2010 have been prepared in accordance with IAS 34, Interim Financial Reporting as adopted by the European Union. They should be read in conjunction with the annual financial statements for the year ended December 31, 2009, which were prepared in accordance with IFRS as adopted by the European Union.
IFRS developments
The Group applies the following standards and interpretations effective for accounting periods beginning on or after January 1, 2010:
� IAS 27 (revised), Consolidated and Separate Financial Statements and IFRS 3 (revised), Business Combinations
� Amendment to IFRS 2, Group Cash-settled Share-based Payment Transactions
� Amendment to IFRS 5, Partial Sale of a Subsidiary Leading to the Loss of Exclusive Control
� Amendment to IAS 39, Eligible Hedged Items
� Amendment to IAS 32, Classification of Rights Issues
� IFRIC 17, Distributions of Non-cash Assets to Owners
� IFRIC 18, Transfers of Assets from Customers
30
These new standards and amendments do not have a material impact on the consolidated financial statements at June 30, 2010, with the exception of the revised IFRS 3, which requires ancillary costs to be included in operating expenses.
The standards, amendments and interpretations which are not yet effective and which have not been early adopted by the Group in these condensed financial statements are:
� IFRIC 19, Extinguishing Financial Liabilities with Equity Instruments
Preparation of half-yearly financial statements
Applicable accounting policies
The accounting methods used to prepare the condensed half-yearly financial statements are consistent with those used to prepare the annual financial statements at December 31, 2009, except in the case of income tax expense, which is calculated based on a projection for the full year.
Use of estimates
The preparation of financial statements in compliance with IFRS requires the use of certain key accounting estimates. It also requires management to exercise its judgment in the process of applying the Company’s accounting policies.
The preparation of half-yearly financial statements requires the use of estimates and assumptions for the same items as those described in the consolidated financial statements for the year ended December 31, 2009, with the exception of income tax expense and long-term employee benefit obligations, for which the following estimation methods were applied:
� Income tax expense
Income tax expense for first-half 2010 was calculated based on a projection for the full year of the expected weighted average tax rate by country, assuming taxable profit for the period.
� Long-term employee benefit obligations As no material changes have occurred, the expense in the income statement for first-half 2010 was
estimated based on the 2010 forecasts included in the actuary’s reports at December 31, 2009.
Note 4: Seasonal fluctuations
Revenue, operating profit and cash flows are sensitive to seasonal fluctuations, with the Group typically recording a stronger performance in the second half of the year.
Seasonal fluctuations in revenue and operating profit essentially concern the Consumer Products, Inspection In-Service & Verification, and Certification businesses. In the Consumer Products business, seasonality arises from the fact that end-consumers tend to concentrate the bulk of their purchases in the closing stages of the calendar year. For the Inspection In-Service & Verification and Certification businesses, this phenomenon results from clients’ wish to obtain certification before the end of the fiscal and corporate year (typically December 31). Profit is more sensitive to seasonal fluctuations than revenue, due to a lower absorption of fixed costs in the first half of the year.
Cash flows are affected by:
� the seasonal fluctuations in operating profit described above;
� strong cyclical trends in working capital requirements, as the following three types of expenses are incurred only in the first few months of the year:

31
� insurance premiums (payable in January);
� bonuses and profit-sharing payments, payroll charges and other related expenses (payable in April);
� income tax balances in respect of the previous financial period (payable during the first six months of the year, at a date which varies according to the country concerned).
Note 5: Segment reporting
The following table provides a breakdown of revenue and operating profit by business segment:
First-half 2010
First-half 2009
First-half 2010
First-half 2009
Marine 156,0 165,0 47,9 54,0Industry 349,2 304,3 31,2 29,5Inspection In-Service & Verification 209,1 215,4 21,6 14,2Construction 209,6 234,7 17,9 17,2Certification 157,1 143,0 30,0 24,5Consumer Products 182,7 188,2 49,2 53,0Government Services & International Trade 85,4 78,9 15,9 13,0Total 1 349,1 1 329,5 213,7 205,4
Revenue Operating profit
Since January 1, 2010, items relating to the Health, Safety & Environment (HSE) activities have been mostly reclassified to the Inspection In-Service & Verification, Industry and Construction businesses. To ensure a meaningful comparison between periods presented, data for first-half 2009 have been restated accordingly.

32
Note 6: Operating income and expense
First-half 2010
First-half 2009
Supplies (14.3) (14.0)
Subcontracting (85.3) (87.3)
Lease payments (49.2) (49.2)
Transport and travel costs (120.2) (112.0)
Service costs rebilled to clients 20.3 20.5
Other external services (138.6) (131.3)
Total purchases and external charges (387.3) (373.3)
Salaries and bonuses (548.1) (534.2)
Payroll taxes (130.1) (124.7)
Other employee-related expenses (20.9) (19.6)
Total personnel costs (699.1) (678.5)
Provisions for receivables (5.7) (10.2)
Provisions for other liabilities and charges 13.4 (0.4)
Total (additions to)/reversals of provisions 7.7 (10.6)
Other operating income 10.4 6.5
Goodwill impairment - -
Other operating expense (1.1) (1.7)
Total other operating expense (1.1) (1.7)
Note 7: Goodwill
June 30, 2010 Dec. 31, 2009Gross value 848.7 784.9Impairment (16.5) (15.2)Net goodwill at January 1 832.2 769.7Acquisitions of consolidated businesses 14.0 20.3Disposals of consolidated businesses (2.7) (10.2)Impairment for the period - (1.9)Exchange differences 92.7 54.3
Gross value 950.9 848.7Impairment (14.7) (16.5)Net goodwill at June 30 936.2 832.2
33
The net carrying amount of goodwill is assessed at least yearly as part of the accounts closing process. At June 30, goodwill was tested for impairment if:
� the estimated present value of earnings expected to flow from a cash-generating unit (CGU) in the period was lower than initially forecast, thereby indicating a possible loss in value;
� any CGUs were subject to specific monitoring procedures at the end of the previous reporting period.
The method used to determine the recoverable amount of a CGU is the same as that described in the consolidated financial statements for the year ended December 31, 2009, except that budgets for all reporting lines are formally approved at year-end.
The Group performed an analysis of cash flow forecasts for the following businesses (based on 2009 Group structure):
� Construction in the US and Spain;
� Health, Safety & Environment in the US (reclassified to Construction and Inspection In-Service & Verification reporting lines as from 2010);
� Mining & Minerals in Australia.
The present value of future cash flows was revised to take into account the latest available earnings forecasts and any changes in estimates over the mid- to long-term for each CGU concerned.
The growth outlook remains stable for the Group as a whole, except for Construction in Spain, where developments in the market prompted a downward revision of business prospects.
The growth rates used by Bureau Veritas for its long-term estimates remain unchanged from December 31, 2009.
The discount rates used are identical to those used for the impairment tests at December 31, 2009. These discount rates are post-tax rates applied to net-of-tax future cash flows before external financing costs.
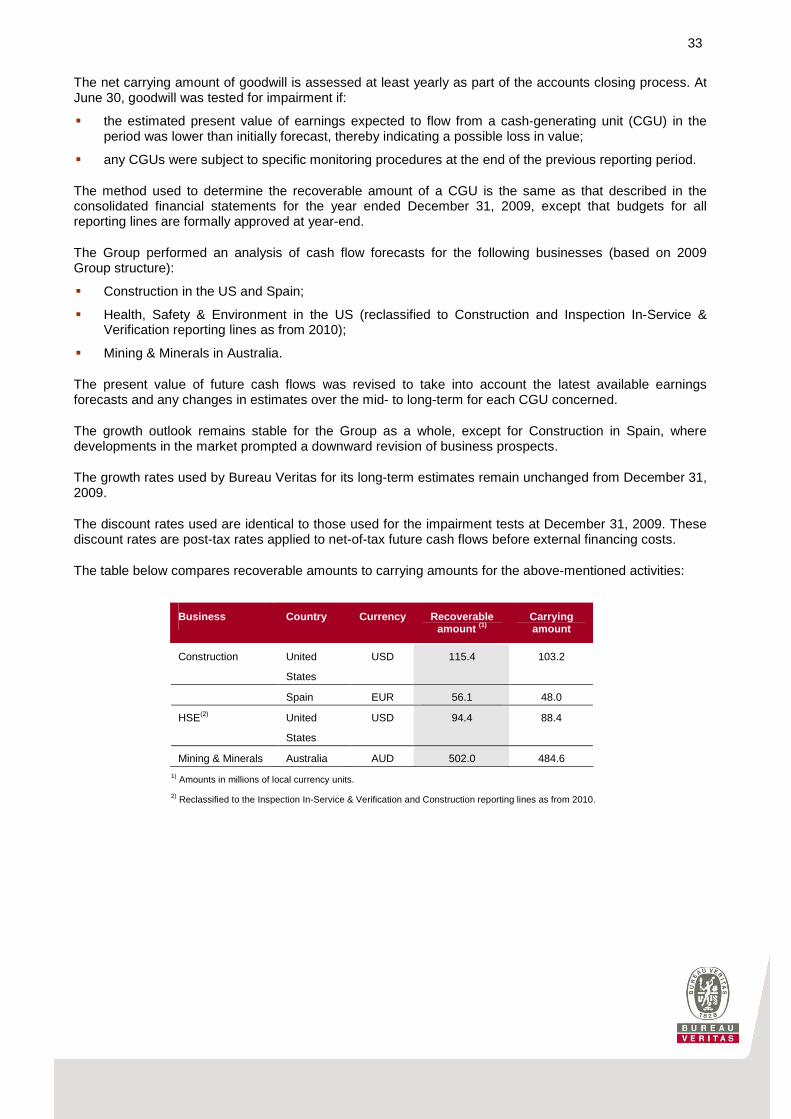
The table below compares recoverable amounts to carrying amounts for the above-mentioned activities:
Business Country Currency Recoverable amount (1)
Carrying amount
Construction United
States
USD 115.4 103.2
Spain EUR 56.1 48.0
HSE(2) United
States
USD 94.4 88.4
Mining & Minerals Australia AUD 502.0 484.6
1) Amounts in millions of local currency units.
2) Reclassified to the Inspection In-Service & Verification and Construction reporting lines as from 2010.

34
The table below shows the sensitivity of these businesses to a rise or fall of one point in the discount rate and long-term growth rate:
Business Country Currency 1 point rise in discount rate
1 point fall in growth
rate
Construction United
States
USD (8.0) (4.6)
Spain EUR (0.5) (0.0)
HSE United
States
USD (10.3) (7.6)
Mining & Minerals Australia AUD (48.0) (25.6)
NB: Theoretical write-down in millions of local currency units based on changes in one input variable.
Note 8: Acquisitions and disposals
On June 1, 2010, the Group acquired South Africa-based firm, Advanced Coal Technology. This company posted revenue of ZAR 78 million in 2009.
The Group also acquired a small in-service verification firm in the US (SMSI).
First-half 2010
Cost of acquisitions 16,2
Purchase consideration on prior-year acquisitions
Total purchase price 16,2
Assets and liabilities acquired/assumed Carrying amountFair
value
Non-current assets 0,9 0,9
Current assets (excluding cash and cash equivalents) 1,2 1,2
Assets held for sale - -Current liabilities (excluding borrowings) (1,5) (1,5)
Non-current liabilities (excluding borrowings) 0,2 0,2Liabilities held for sale - -Borrowings - -Non-controlling interests acquired 0,6 0,6Cash and cash equivalents of acquired companies 0,8 0,8
Total assets and liabilities acquired/assumed 2,2 2,2
Goodwill 14,0

35
The Group’s acquisitions were paid exclusively in cash. The impact of these acquisitions on cash and cash equivalents for the period was as follows:
First-half 2010Cost of acquisitions (16,2)Cash and cash equivalents of acquired companies 0,8Purchase price outstanding at June 30 2,5Purchase price paid relating to prior periods (1,1)Impact of acquisitions on cash and cash equivalents (14,0)
The impact of acquisition fees on cash and cash equivalents for the period amounted to €2.7 million, including €2.5 million relating to Inspectorate (acquisition currently in progress).
In first-half 2010, the Group disposed of non-core activities in Spain, Australia and the US.
The table below presents the impacts of the disposals carried out in the period on the statement of financial position and income statement:
June 30, 2010Carrying amount of assets sold 5.3
Gains and losses on disposals of consolidated companies 1.4
Proceeds from disposals of consolidated companies 6. 7 of whichCash received 5.9 Deferred payment 0.8
Note 9: Share capital and share-based payment
Stock option plans
No new grants of stock options or performance shares were made in first-half 2010. The Group recorded a net share-based payment expense of €4.2 million for the period (first-half 2009: €2.4 million).
Stock appreciation rights
The fair value of stock appreciation rights (SARs) granted further to the Shareholders’ Meeting of June 18, 2007 and the Management Committee’s decision of December 13, 2007 was revised based on the Black & Scholes option pricing model. The fair value came out at €18.85 for each SAR, based on the following assumptions:
� share price at the grant date;
� expected share volatility of 26%;
� risk-free interest rate of 1.05% (2009: 2.4%), determined by reference to the yield on government bonds over the estimated life of the rights.

36
Note 10: Financial liabilities
Total
Due within 1 year
Due between 1 and 2
years
Due between 2 and 5
years
Due beyond 5 years
At December 31, 2009
Bank borrowings (long-term portion) 740.8 - 66.6 419.2 255.0
Other non-current financial liabilities 1.9 - 1.9 - -
Non-current financial liabilities 742.7 - 68.5 419.2 255.0
Bank borrowings (short-term portion) 77.8 77.8
Bank overdrafts 7.7 7.7
Other current financial liabilities 10.1 10.1
Current financial liabilities 95.6 95.6
Estimated interest payable on bank borrowings 200.5 2 4.4 29.0 67.5 79.6
Impact of cash flow hedges (principal and interest) 17.1 13.6 8.0 6.6 (11.1)
At June 30, 2010
Bank borrowings (long-term portion) 833.0 - 87.7 451.4 293.8
Other non-current financial liabilities 1.6 - 1.6 - -
Non-current financial liabilities 834.6 - 89.3 451.4 293.8
Bank borrowings (short-term portion) 85.8 85.8Bank overdrafts 23.0 23.0Other current financial liabilities 9.0 9.0
Current financial liabilities 117.8 117.8
Estimated interest payable on bank borrowings 204.2 2 7.3 28.7 67.2 81.0
Impact of cash flow hedges (principal and interest) (64.8) 3.2 0.3 (9.1) (59.2)
The significant increase in debt between December 31, 2009 and June 30, 2010 is due mainly to the impact of converting foreign currency debt into euros (USPP and syndicated loan).
Short-and long-term bank borrowings can be analyzed as follows by currency:
Currency June 30, 2010 Dec. 31, 2009
US dollar (USD) 85.6 84.8
Euro (EUR) 784.7 692.5Pound sterling (GBP) 36.7 27.0Other currencies 11.8 14.3
Total 918.8 818.6
The Group’s main source of financing is a syndicated loan taken out in May 2006. The loan comprises a USD 560 million amortizable tranche maturing in May 2013 and a €550 million revolving facility, 95% of which now matures in May 2013 as opposed to May 2012 previously. In July 2008, the Group completed a fixed-rate US private placement (USPP) in order to diversify its sources of financing and extend the maturity of its debt to July 2018 and July 2020.
The USPP debt including tranches in pounds sterling and US dollars has been converted into euros using a currency swap and is therefore included on the “EUR” line. A portion of the USD debt under the amortizable tranche of the syndicated credit facility has also been converted into euros and is included on the “EUR” line.
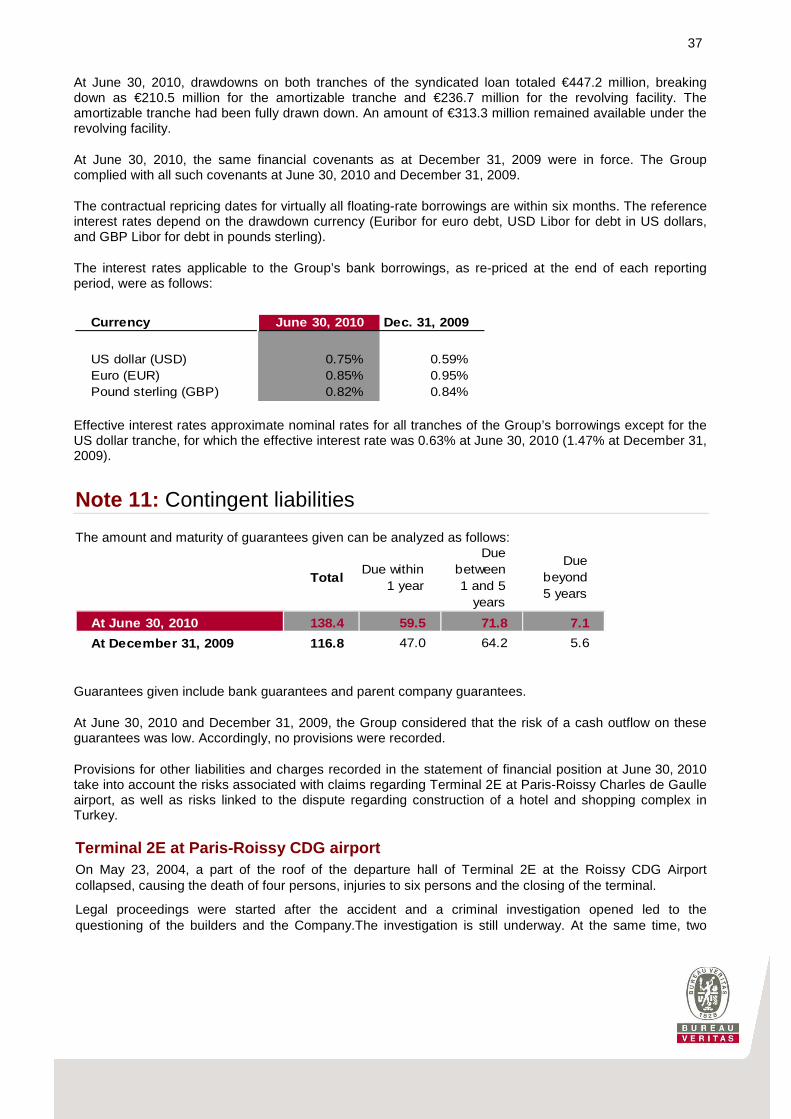
37
At June 30, 2010, drawdowns on both tranches of the syndicated loan totaled €447.2 million, breaking down as €210.5 million for the amortizable tranche and €236.7 million for the revolving facility. The amortizable tranche had been fully drawn down. An amount of €313.3 million remained available under the revolving facility.
At June 30, 2010, the same financial covenants as at December 31, 2009 were in force. The Group complied with all such covenants at June 30, 2010 and December 31, 2009.
The contractual repricing dates for virtually all floating-rate borrowings are within six months. The reference interest rates depend on the drawdown currency (Euribor for euro debt, USD Libor for debt in US dollars, and GBP Libor for debt in pounds sterling).
The interest rates applicable to the Group’s bank borrowings, as re-priced at the end of each reporting period, were as follows:
Currency June 30, 2010 Dec. 31, 2009
US dollar (USD) 0.75% 0.59%Euro (EUR) 0.85% 0.95%Pound sterling (GBP) 0.82% 0.84%
Effective interest rates approximate nominal rates for all tranches of the Group’s borrowings except for the US dollar tranche, for which the effective interest rate was 0.63% at June 30, 2010 (1.47% at December 31, 2009).
Note 11: Contingent liabilities
The amount and maturity of guarantees given can be analyzed as follows:
TotalDue within
1 year
Due between 1 and 5
years
Due beyond 5 years
At June 30, 2010 138.4 59.5 71.8 7.1
At December 31, 2009 116.8 47.0 64.2 5.6
Guarantees given include bank guarantees and parent company guarantees.
At June 30, 2010 and December 31, 2009, the Group considered that the risk of a cash outflow on these guarantees was low. Accordingly, no provisions were recorded.
Provisions for other liabilities and charges recorded in the statement of financial position at June 30, 2010 take into account the risks associated with claims regarding Terminal 2E at Paris-Roissy Charles de Gaulle airport, as well as risks linked to the dispute regarding construction of a hotel and shopping complex in Turkey.
Terminal 2E at Paris-Roissy CDG airport On May 23, 2004, a part of the roof of the departure hall of Terminal 2E at the Roissy CDG Airport collapsed, causing the death of four persons, injuries to six persons and the closing of the terminal.
Legal proceedings were started after the accident and a criminal investigation opened led to the questioning of the builders and the Company.The investigation is still underway. At the same time, two

38
legal expertises procedures were initiated at the request of the main main parties involved in the construction, namely Aéroports de Paris (the party responsible for the construction project,architect and general contractor) and companies of the Vinci group (that participated in the construction of the outer structure of the hall).
A deal has already been made regarding the “ten-year” physical damage borne, with the Company's share covered by its insurance policies. Experts have valued non-material damages at around €145 million and proposed a responsibility percentage for the Group of around 8-10%.
Based on these valuations and proposals and on the basis of available insurance warranties and provisions set aside by the Group, the Company estimates that the event should not have a significant adverse effect on the consolidated financial statements of the Group..
Gabon Express airline crash
No significant changes have intervened in the dispute concerning the Gabon Express airline since the publication of the 2009 registration document, the declarations for which remain valid.
Disputes concerning the construction of a hotel and shopping complex in Turkey Bureau Veritas Gozetim Hizmetleri Ltd Sirketi (BVT) and the Turkish company Aymet are parties to a dispute before the Commercial Court of Ankara relating to the construction of a hotel and business complex in respect of which the parties concluded a contract in 2003. Aymet filed an action in 2008 and is currently claiming more than US$63 million in damages from BVT for alleged failures in the performance of its project inspection and supervision mission.
Documents recently brought to the Court's attention by the bank that partly financed the project, confirm the Company's position whereby the requests made by Aymet are unfounded in legal and contractual terms.
Based on the available insurance warranties and the provisions set aside by the Group and in view of information to date, the Company believes that this claim should not have significantly affect the Group's consolidated financial statements.
There are no other government, administrative, legal, or arbitration proceedings or investigations (including any proceeding of which the Company is aware, pending, or with which the Group is threatened), which are likely to have or have had within the last six months a material impact on the financial position or profitability of the Group.
Note 12: Income taxes
Consolidated income tax expense rose 21.7%, coming in at €54.4 million for first-half 2010 versus €44.7 million for the same prior-year period.
The effective tax rate, representing tax expense divided by profit before tax, rose to 27.4% for first-half 2010 from 25.2% in first-half 2009. The year-on-year increase in the tax rate reflects the inclusion of the CVAE tax within income tax. On a like-for-like basis, the Group’s effective tax rate would have been 25.6% for first-half 2010.
At June 30, 2010 and December 31, 2009, deferred tax assets and liabilities were offset at the level of the same taxable entity.
Deferred taxes before offsetting at the level of taxable entities mainly relate to pension obligations, tax loss carryforwards, customer relationships and non-competition agreements acquired within the scope of

39
business combinations, as well as provisions for disputes and accrued payables and fair value adjustments on financial instruments.
The breakdown of the tax effect on other comprehensive income is as follows:
Before tax Tax After tax Before tax Tax After tax
Currency translation differences 134.8 0.2 135.0 (0.7) - (0.7)
Actuarial gains/(losses) - - - - - -
Cash flow hedges 22.7 (7.6) 15.1 9.5 (3.3) 6.2
Total other comprehensive income 157.5 (7.4) 150.1 8.8 (3.3) 5.5
First-half 2010 First-half 2009
Note 13: Earnings per share
Basic earnings per share
First-half 2010
First-half 2009
Net profit attributable to owners of the Company (€ thousands) 140,822 130,540
Weighted average number of ordinary shares in issue (thousands) 108,091 107,780
Basic earnings per share (in euros) 1.30 1.21
Diluted earnings per share
First-half 2010
First-half 2009
Net profit attributable to owners of the Company (€ thousands) 140,822 130,540
Weighted average number of ordinary shares in issue (thousands) 108,091 107,780
Adjustment for stock options (thousands) 1,950 1,854Weighted average number of ordinary shares for diluted earnings per share (thousands)
110,041 109,634
Diluted earnings per share (in euros) 1.28 1.19
Note 14: Dividend per share
On June 17, 2010, the Group paid out dividends to eligible shareholders in respect of the 2009 financial year. The dividend payout totaled €91.0 million, corresponding to a dividend per share of €0.84 (2009: €0.72).
Note 15: Additional financial instrument disclosures
The table below presents the carrying amount, valuation method and fair value of financial instruments classified in each IAS 39 category at the end of each reporting period:

40
IAS 39 category
Carrying amount
Amortized cost Cost
Fair value through equity
Fair value through
profit or loss
Fair value
At June 30, 2010FINANCIAL ASSETSInvestments in non-consolidated companies FVPL 0.4 - - - 0.4 0.4Other non-current financial assets HTM 37.2 37.2 - - - 37.2Trade and other receivables LR 866.0 866.0 - - - 866.0Current financial assets LR 4.6 4.6 - - - 4.6Current financial assets FVPL 2.3 - - - 2.3 2.3Derivative financial instruments FVPL/FVE 69.9 - - 65.4 5.9 71.3Cash and cash equivalents FVPL 169.1 - - - 169.1 169.1
FINANCIAL LIABILITIESBank borrowings AC 918.8 918.8 - - - 974.8Bank overdrafts FVPL 23.0 - - - 23.0 23.0Other non-current financial liabilities AC 1.6 1.6 - - - 1.6Trade and other payables AC 649.9 649.9 - - - 649.9Current financial liabilities AC 9.0 9.0 - - 9.0Derivative financial instruments FVPL/FVE 18.5 - - 11.7 7.6 19.3At December 31, 2009FINANCIAL ASSETSInvestments in non-consolidated companies FVPL 0.4 - - - 0.4 0.4Other non-current financial assets HTM 31.2 31.2 - - - 31.2Trade and other receivables LR 772.8 772.8 - - - 772.8Current financial assets LR 4.5 4.5 - - - 4.5Current financial assets FVPL 3.4 - - - 3.4 3.4Derivative financial instruments FVPL/FVE 13.8 - - 13.2 1.0 14.2Cash and cash equivalents FVPL 147.0 - - - 147.0 147.0
FINANCIAL LIABILITIESBank borrowings AC 818.6 818.6 - - - 1,163.8Bank overdrafts FVPL 7.7 - - - 7.7 7.7Other non-current financial liabilities AC 1.9 1.9 - - - 1.9Trade and other payables AC 632.8 632.8 - - - 632.8Current financial liabilities AC 10.1 10.1 - - - 10.1Derivative financial instruments FVPL/FVE 42.6 - - 24.2 19.7 43.9
IAS 39 measurement method
NB: The following abbreviations are used to represent IAS 39 financial instrument categories: - HTM for held-to-maturity assets; - LR for loans and receivables; - FVPL for instruments at fair value through profit or loss; - FVE for instruments at fair value through equity; and - AC for debt measured at amortized cost.
With the exception of interbank borrowings and debt, the Group considers that the carrying amount of the financial instruments reported on the statement of financial position approximates their fair value. Measurement of these instruments at fair value requires the Group to use valuation techniques that draw on observable market inputs (level 2 of the fair value hierarchy). In the case of the 2008 USPP for example, fair value is based on a comparison between the fixed rate due over the remaining term and the yield curve for US and UK funds over the same period.
The nature of the gains and losses arising on each financial instrument category can be analyzed as follows:
Fair valueAmortized
costExchange differences
Impairment
Held-to-maturity assets HTM - - - - - - -Loans and receivables LR - - - 23.2 (1.7) 21.5 (7.0)Financial assets at fair value through profit or loss FVPL 0.9 (0.9) - - - - (10.7)Debt carried at amortized cost AC (18.1) - (0.1) (13.6) - (31.8) (16.1)Total (17.2) (0.9) (0.1) 9.6 (1.7) (10.3) (33.8)
Net gains/
(losses) for first-
half 2009
Interest Adjustments for Net gains/
(losses) for first-
half 2010
41
Sensitivity analysis
Due to the international scope of its operations, the Group is exposed to currency risk on its use of several different currencies.
Operational risk
In general, hedges arise naturally with the matching of income and expenses in most countries in which the Group operates, since services are provided locally. The Group’s exposure to currency risk arising on transactions carried out in foreign currencies is therefore relatively low.
Translation risk
In the first six months of 2010, more than half of the Group’s revenue was generated in currencies other than the euro, including 15% in US dollars, 3% in pounds sterling, 5% in Hong Kong dollars and 6% in Australian dollars. Taken individually, other currencies do not represent more than 5% of the Group’s revenue. The Group’s evolving currency mix reflects the fast-paced development of its activities outside the euro zone, particularly in US dollars and other dollar-linked currencies.
As the Group’s presentation currency is the euro, it must convert into euros any assets, liabilities, income and expenses denominated in other currencies at the time of preparing its financial statements. The results of the Group’s foreign currency operations are consolidated in its income statement after being converted into euros using the average exchange rate for the period. Assets and liabilities are converted at the closing exchange rate. As a result, changes in the value of the euro against other currencies affect the corresponding amounts in the consolidated financial statements, even if the value of the items concerned remains unchanged in their original currencies.
The impact of a 1% rise or fall in the euro against a number of different currencies is described below:
� a 1% change in the value of the euro against the US dollar would have had an impact of 0.15% on consolidated revenue and 0.20% on operating profit for first-half 2010;
� a 1% change in the value of the euro against the Hong Kong dollar would have had an impact of 0.05% on consolidated revenue and 0.09% on operating profit for first-half 2010;
� a 1% change in the value of the euro against the pound sterling would have had an impact of 0.03% on consolidated revenue and 0.01% on operating profit for 2010;
� a 1% change in the value of the euro against the Australian dollar would have had an impact of 0.06% on consolidated revenue and 0.01% on operating profit for first-half 2010.
Financial currency risk
The syndicated loan set up in May 2006 is a multi-currency facility which enables subsidiaries to borrow in local currencies. If it deems appropriate, the Group may hedge certain commitments by matching financing costs with operating income in the currencies concerned.
When financing arrangements are set up in a currency other than the country’s functional currency, the Group takes out currency hedges to protect itself against the impact of currency risk on its income statement.

42
The table below shows the results of the sensitivity analysis for financial instruments exposed to currency risk on the Group’s main foreign currencies (euros, US dollars and pounds sterling) at June 30, 2010:
(in millions of euros) USD EUR GBPFinancial liabilities (687,8) (46,7) (139,5)Financial assets 416,3 32,6 61,6
Net position (assets - liabilities) before hedging (271,5) (14,0) (77,9)Off balance sheet (currency hedging instruments) 332,9 77,1Net position (assets - liabilities) after hedging 61,4 (14,0) (0,9)Impact of a 1% rise in exchange rates
On equity (2,2) - (0,8)On net profit before income tax 1,8 (0,1) (0,0)
Impact of a 1% fall in exchange ratesOn equity 2,2 - 0,8
On net profit before income tax (1,8) 0,1 0,0
Non-functional currency
The Group is exposed to currency risk inherent to financial instruments denominated in foreign currencies (i.e., currencies other than the functional currency of each Group entity). The sensitivity analysis presented below shows the impact that a significant change in the value of the euro, US dollar and Pound sterling would have on earnings in a non-functional currency. The analysis for the US dollar does not include entities whose functional currency is strongly correlated to the US dollar, for example Group entities based in Hong Kong. Liabilities denominated in a currency other than the functional currency of the entity, for which a hedge has been taken out converting the liability to the functional currency, have not been included in the analysis. The impact of a 1% change in exchange rates on hedges is shown in the table above. Financial instruments denominated in foreign currencies which are included in the sensitivity analysis relate to key monetary statement of financial position items and in particular, current and non-current financial assets, trade and other receivables, cash and cash equivalents, current and non-current financial liabilities, current liabilities, and trade and other payables.
Interest rate risk
The Group’s interest rate risk arises primarily from assets and liabilities bearing interest at floating rates. The Group seeks to limit its exposure to a rise in interest rates through the use of swaps and collars.
The Group monitors its interest rate exposure on a monthly basis. It continually analyzes the level of hedges put in place and ensures that they are appropriate for the related underlying exposure. The Group’s policy is to prevent more than 60% of its consolidated net debt being exposed to a rise in interest rates over a long period (more than six months). The Group may therefore enter into other swaps, collars or similar instruments for this purpose. No financial instruments are contracted for speculative purposes.
The table below shows the maturity of fixed- and floating-rate financial assets and liabilities at June 30, 2010:
(in millions of euros) < 1 year 1 to 5 years > 5 years Total
Fixed-rate bank borrowings (2.9) (4.2) (293.8) (300.9)Floating-rate bank borrowings (82.9) (534.9) - (617.8)Bank overdrafts (23.0) (23.0)TOTAL - Financial liabilities (108.8) (539.1) (293.8) (941.8)TOTAL - Financial assets 169.1 169.1
Net position (assets - liabilities) before hedging 60.3 (539.1) (293.8) (772.7)Off balance sheet (interest rate hedging instruments) 100.0 170.0 - 270.0Net position (assets - liabilities) after hedging 163.2 (364.9) - (201.7)Impact of a 1% rise in interest rates
On equity 4.3On net profit before income tax (0.3)
Impact of a 1% fall in interest ratesOn equity (3.7)
On net profit before income tax 0.5
43
At June 30, 2010, the Group considers that a 1% rise in short-term interest rates across all currencies would lead to an increase of around €2 million in interest payable.
Debts maturing after five years, representing a total amount of €293.8 million, are at fixed rates. The overall notional amount of hedging contracts whose fair value is recognized in the statement of financial position is €270 million, and includes interest rate hedges of euro debt maturing in less than five years.
To hedge the interest rate on its euro-denominated debt, the Group has entered into swaps and collars.
Taking account of these hedging instruments and of the Group’s fixed-rate debt, 61% of consolidated gross debt was at a fixed interest rate at end-June 2010.
Note 16: Movements in working capital attributable to operations
Movements in working capital were a negative €69.4 million in first-half 2010 and a negative €11.0 million in first-half 2009:
First-half 2010
First-half 2009
Trade receivables (47.1) 16.0
Trade payables (3.2) (16.6)
Other receivables and payables (19.1) (10.4)
Total (69.4) (11.0)
At June 30, 2010, working capital totaled €241.9 million, or 9.1% of revenue for the last 12 months, versus €236.9, or 8.8% of revenue at June 30, 2009.
Note 17: Related-party transactions
Parties related to the Company are its majority shareholder Wendel as well as executive corporate officers, the Chairman and Chief Executive Officer and the Executive Officers.
Amounts recognized with respect to remuneration paid in France (fixed and variable portions) and long-term compensation plans (stock option and performance share grants) are as follows:
First-half 2010
First-half 2009
Wages and salaries 1.8 1.6
Stock options 0.2 -
Free share grants 0.5 2.1
Total expense for the period 2.5 3.7
The amounts reflect the fair value of stock options and shares in accordance with IFRS 2, and not the actual amounts that could be released on exercise of the stock options or vesting of the shares, where appropriate. Stock option awards and share grants are subject to a number of performance conditions and also require a minimum period of service.
Shares are measured at fair value as calculated under the Black-Scholes model rather than based on the compensation effectively received. The performance share awards are subject to presence and
44
performance conditions, except for the plan approved on September 22, 2008 which requires a minimum period of service of three years.
Key management personnel held a total of 210,000 stock options at June 30, 2010 (170,000 at June 30, 2009), with an average exercise price of €11.25 (end-June 2009: €7.99).
Note 18: Events after the end of the reporting period
Acquisitions
On July 1, 2010, Bureau Veritas acquired Kamelot in Italy. Kamelot is engaged in the in-service verification business.
Performance shares and options
On July 23, 2010 the Board of Directors decided to grant share subscription options and frees shares to 686 members of staff, corresponding to a total of 707,600 shares (463,400 performance shares and 244,200 share subscription options) and representing around 0.65% of the share capital.
The subscription price of the options was set at €46.31, corresponding to the average without discounts of the first traded prices on the last 20 stock market trading days preceding the allocation date.
Under this framework, the share subscription options and performance-shares were granted to 3 Executive Corporate Officers on the basis of two conditions:
� Performance: depending on the level of 2010 adjusted operating profit achieved, beneficiaries can exercise and/or acquire between 0% and 100% of the options/shares granted. In addition, if adjusted operating margin in either 2011 and 2012 is lower than the target level set by the Board of Directors on the allocation date, no performance share can be acquired by the beneficiaries. � Presence: for share subscription options, if the beneficiary leaves the Group, the rights to these share subscription options are cancelled. For performance shares, a three-year acquisition period is followed by a two-year conservation period.

45
2.3 Statutory Auditor’s Review Report on 2010 half- year financial information (from January 1, 2010 to June 30, 2010)
This is a free translation into English of the Statutory Auditors’ review report issued in French and is provided solely for the convenience of English speaking readers. This report should be read in conjunction with, and construed in accordance with, French law and professional auditing standards applicable in France.
Bureau Veritas SA 67 – 71, boulevard du Château 92571 Neuilly-sur-Seine Cedex To the Shareholders, In compliance with the assignment entrusted to us by your Shareholders’ Meeting and in accordance with the requirements of article L. 451-1-2 III of the French Monetary and Financial Code (Code monétaire et financier), we hereby report to you on: - the review of the accompanying condensed half-yearly consolidated financial statements of Bureau Veritas
SA for the six months ended June 30, 2010; - the verification of the information contained in the half-yearly management report. These condensed half-yearly consolidated financial statements are the responsibility of the Board of Directors. Our role is to express a conclusion on these financial statements based on our review. 1. CONCLUSION ON THE FINANCIAL STATEMENTS We conducted our review in accordance with professional standards applicable in France. A review of half-yearly financial information consists of making inquiries, primarily of persons responsible for financial and accounting matters, and applying analytical and other review procedures. A review is substantially less in scope than an audit conducted in accordance with professional standards applicable in France and consequently does not enable us to obtain assurance that we would become aware of all significant matters that might be identified in an audit. Accordingly, we do not express an audit opinion.
Based on our review, nothing has come to our attention that causes us to believe that the accompanying condensed half-yearly consolidated financial statements have not been prepared, in all material respects, in accordance with IAS 34 – “Interim Financial Reporting”, as adopted by the European Union. 2. SPECIFIC VERIFICATION
We have also verified the information given in the half-yearly management report on the condensed half-yearly consolidated financial statements subject to our review. We have no matters to report as to its fair presentation and its consistency with the condensed half-yearly consolidated financial statements. Neuilly-sur-Seine and Paris, August 25, 2010
The Statutory Auditors
PricewaterhouseCoopers Audit Bellot Mullenbach & Associés Olivier Thibault Pascal de Rocquigny

46
3 Persons responsible for 2010 Half-Year financial report and Statutory Auditors
3.1 Persons responsible
Person responsible for the 2010 half-year report
Mr. Frank Piedelièvre, Chairman and Chief Executive Officer of Bureau Veritas
Declaration by the person responsible for the 2010 half-year report
I declare that to the best of my knowledge the financial statements for the preceding half year appearing in Chapter 2 – “2010 half-year Consolidated financial statements” – have been drawn up in accordance with applicable accounting standards and provide a faithful picture of the capital, financial position and results of the company and all the businesses included in the consolidation, and that the half-year business report appearing in Chapter 1 – “2010 Half-year business report” – has a table which faithfully presents the important events which took place in the first six months of the financial period, their effect on the consolidated accounts as at June 30, 2010, the principal related-party transactions and a description of the main risks factors for the remaining six months of the 2010 financial year.
Frank Piedelièvre
Chairman and Chief Executive Officer of Bureau Veritas
Person responsible for financial information
François Tardan Chief Financial Officer
Address: 67/71, boulevard du Château – 92571 Neuilly-sur-Seine Cedex, France Telephone: +33 (0)1 55 24 76 11 Fax: +33 (0)1 55 24 70 32
3.2 Statutory Auditors
Statutory Auditors
PricewaterhouseCoopers Audit Represented by Olivier Thibault 63, rue de Villiers 92200 Neuilly-sur-Seine - France PricewaterhouseCoopers Audit’s mandate as Statutory Auditors was renewed at the Ordinary General Shareholders’ Meeting on June 1, 2010, for a period of six financial years. PricewaterhouseCoopers Audit is a member of the Compagnie Régionale des Commissaires aux Comptes de Versailles.

47
Bellot Mullenbach & Associés Represented by Pascal de Rocquigny 11, rue de Laborde 75008 Paris - France Bellot Mullenbach & Associés was appointed Statutory Auditors at the Ordinary General Shareholders’ Meeting on June 1, 2010 for a period of six financial years. Bellot Mullenbach & Associés is a member of the Compagnie Régionale des Commissaires aux Comptes de Paris.
Alternate Auditors
M. Yves Nicolas 63, rue de Villiers 92200 Neuilly-sur-Seine - France Mr. Yves Nicolas’s mandate as Alternate Auditor was renewed at the Ordinary General Shareholders’ Meeting on June 1, 2010 for a period of six financial years.
M. Jean-Louis Brun d’Arre 11, rue de Laborde 75008 Paris - France Mr. Jean-Louis Brun d’Arre was appointed Alternate Auditor at the Ordinary General Shareholders’ Meeting on June 1, 2010 for a period of six financial years.