2010 Employee Engagement Survey Executive Summary 6 December 2010.
41
2010 Employee Engagement Survey Executive Summary 6 December 2010
-
Upload
meghan-mccarthy -
Category
Documents
-
view
218 -
download
3
Transcript of 2010 Employee Engagement Survey Executive Summary 6 December 2010.

2010 Employee Engagement Survey
Executive Summary
6 December 2010
Page 2
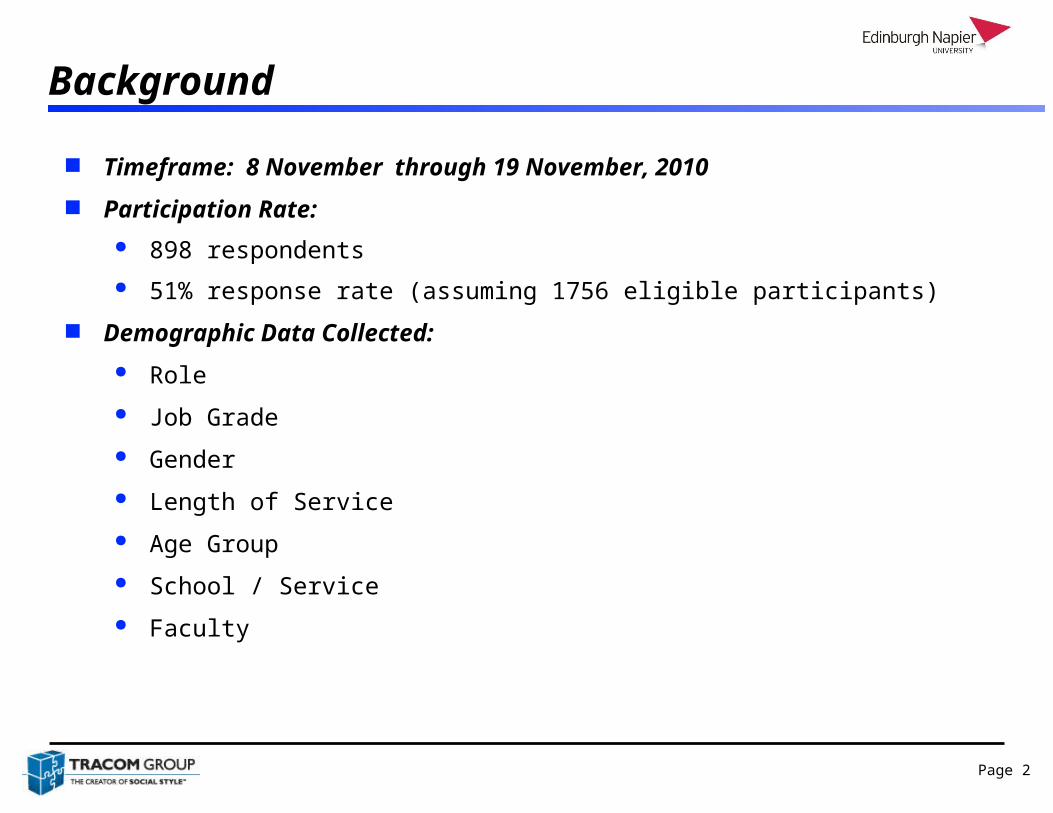
Background
Timeframe: 8 November through 19 November, 2010
Participation Rate:
898 respondents
51% response rate (assuming 1756 eligible participants)
Demographic Data Collected:
Role
Job Grade
Gender
Length of Service
Age Group
School / Service
Faculty

Page 3
Background Questionnaire:
52 core questions 11 supplemental questions One open-ended question
Themes:

Page 4
Questionnaire:
No data is reported for groups with fewer than 10 respondents
Data Presentation:
Questions were answered on a five-point response scale with the midpoint being neutral.
The two favourable responses are combined and the two unfavourable responses are combined to produce a simplified three-response presentation (positive, neutral, and negative).
Key dimension scores are the average of the question responses that make up the dimension.
Background

Page 5
General Benchmarks for Interpreting Survey Items
•Clear Strength > 65% Positive
•Moderate Strength 50 – 65% Positive
•Opportunity for Improvement < 50% Positive
•Weakness > 25% Negative
•Clear Problem > 40% Negative

Page 6
Major Themes
Overall engagement has fallen since 2009 All major dimensions have declined Most significant decline is in perceptions of
Leadership (15% drop since 2009) 2010 engagement levels are now roughly equivalent
across Faculty areas
Middle job grades (5-7) declined more than lower and upper job grades
The 25 to 44 year-old age group declined more than older groups

Page 7
Major Themes - continued
Favourability ratings for both men and women declined since 2009 Perceptions of men and women are now roughly
equivalent across dimensions, with women slightly more favourable
Length of service Declines occurred across all categories of service Employees with less than 12 months are generally
more favourable than employees with longer service, though this is a very small group
Role Of the two largest roles, Academic and Support, the
Academic role remains less engaged

Page 8
Major Themes - continued
Some of the gains seen in 2009 have reverted. This is particularly noticeable among certain demographics: Job Grade 5-7 Employees age 25-44 Women
And among certain dimensions: Leadership Overall Satisfaction

Page 9
Major Themes - continued
Though declines have occurred, relative strengths remain: Perceptions of immediate manager remain positive
(e.g., recognition, feedback) Fair pay and benefits Pride in team Challenging work that utilises personal skills

Page 10
Overall Satisfaction
Dropped 11% from 2009 to 60% favourable
Opinions about immediate work environment are still relatively positive Immediate manager The job itself
Declines are related to the broader University environment Recommend University as place to work Global feeling of dissatisfaction with University

Page 11
Overall Satisfaction
Declines across all demographics, with significant drops in:
Demographic 2009 2010 Diff
University Overall 71% 60% -11%
Job Grade 5-7 72% 59% -13%
Age 25-44 71% 57% -14%
Female 73% 61% -12%
Service 3-10 years 70% 59% -11%
Technical Role 77% 54% -23%
*Percent Favourable

Page 12
Overall Satisfaction
Survey item details
Item 2009 2010 Diff
How good a job is being done by your immediate manager?
69% 66% -3%
How satisfied are you with your job? 71% 64% -7%
I would recommend University to others as a place to work
66% 47% -19%
Will you still be working for the University 12 months from now?
77% 69% -8%
Rate your overall satisfaction with the University
71% 56% -15%
*Percent Favourable

Page 13
Leadership
Leadership dimension saw the greatest declines from 2009 Dropped by 15% to only 39% favourable
Opinions are sharply critical toward senior management, particularly in the areas of: Strategy and direction of the University Ability to make necessary changes and make effective
decisions Communication with employees Job security

Page 14
Leadership
Declines across all demographics, notably:
Demographic 2009 2010 Diff
University Overall 54% 39% -15%
Job Grade 5-7 52% 34% -18%
Age 25-44 55% 36% -19%
Female 57% 39% -18%
Service 10-20 years 49% 32% -17%
Support Role 60% 43% -17%
*Percent Favourable

Page 15
Leadership Survey item details
Item 2009 2010 Diff
I understand University’s strategy 75% 65% -10%
I am confident strategy will succeed 54% 36% -18%
University is making changes necessary to succeed
60% 42% -18%
I understand what is expected of me 82% 79% -3%
Senior Management communicates effectively
51% 32% -19%
Confident in ability of senior mgmt to make decisions to ensure success
47% 27% -20%
*Percent Favourable

Page 16
Leadership Survey item details
Item 2009 2010 Diff
Sufficient effort to get people’s opinions and ideas
39% 30% -9%
Senior management understands issues faced at my level
22% 16% -6%
Satisfaction with information received from senior management
46% 32% -14%
Actions of senior management are consistent with stated values
42% 30% -12%
Rate University in providing job security
74% 37% -37%
*Percent Favourable

Page 17
Atmosphere of Cooperation
Dropped 4% from 2009 to 57% favourable
Some areas remained relatively stable since 2009 Teamwork and team accomplishments
Largest declines are in areas of: How people treat one another (trust and respect) Matters of personal involvement (decisions, new ways
of doing things) Pride in University

Page 18
Atmosphere of Cooperation
Remained consistent across certain demographics, with modest declines:
Demographic 2009 2010 Diff
University Overall 61% 57% -4%
Job Grade 5-7 62% 54% -8%
Age 25-44 62% 54% -8%
*Percent Favourable

Page 19
Atmosphere of Cooperation
Survey item details
Item 2009 2010 Diff
Clear understanding of school/ service’s priorities
77% 72% -5%
I understand how my work supports school/service’s goals
83% 79% -4%
In my section/department we work effectively as a team
64% 63% -1%
In my part of the University, there are well defined processes and standards
55% 56% +1%
People treat one another with trust and mutual respect
46% 38% -8%
I feel encouraged to come up with new and better ways of doing things
61% 52% -9%
*Percent Favourable

Page 20
Atmosphere of Cooperation
Survey item details
Item 2009 2010 Diff
There is a free exchange of opinions and ideas
43% 38% -5%
Satisfaction with involvement in decisions that affect your work
54% 47% -7%
Satisfaction with cooperation between your department and other depts
43% 40% -3%
I am proud of my team’s accomplishments
79% 79% 0%
I am proud to work here 69% 59% -10%
*Percent Favourable

Page 21
Equity
Dropped 5% from 2009 to 55% favourable
Though most aspects around perceptions of immediate manager declined, these were generally slight Work/life balance Recognition for quality work Performance feedback
Areas that dropped more severely are related to University and leadership Fairness of University management Feeling valued as an employee

Page 22
Equity
Small declines across most demographics, with some notable drops:
Demographic 2009 2010 Diff
University Overall 55% 50% -5%
Job Grade 5-7 55% 48% -7%
Age 25-44 57% 50% -7%
Service less than 1 year 66% 59% -7%
Technical Role 57% 45% -12%
*Percent Favourable

Page 23
Equity
Survey item details
Item 2009 2010 Diff
My immediate manager is considerate of my need for work/life balance
82% 80% -2%
I am confident that management at the University is fair
52% 37% -15%
I understand how my performance is evaluated
62% 56% -6%
The overall evaluation of my performance is fair
67% 62% -5%
My immediate manager deals effectively with poor performers
42% 38% -4%
My immediate manager recognises quality work
73% 71% -2%
*Percent Favourable

Page 24
Equity
Survey item details
Item 2009 2010 Diff
My immediate manager gives me feedback to improve performance
58% 57% -1%
Satisfaction with recognition for doing a good job
52% 45% -7%
I feel valued as an employee of the University
47% 37% -10%
I am paid fairly for my work 62% 58% -4%
The better my performance, the better my pay will be
8% 4% -4%
How do you rate your total benefits package?
49% 55% +6%
*Percent Favourable

Page 25
Personal Development
Dropped 4% from 2009 to 52% favourable
Satisfaction with personal aspects of job remained stable Challenging and fulfilling Good use of skills Have information to succeed at job
Less satisfaction around opportunities to improve skills
More serious dissatisfaction with opportunities to advance within the University and with retaining talented employees

Page 26
Personal Development
Small declines across most demographics, with some notable drops:
Demographic 2009 2010 Diff
University Overall 56% 52% -4%
Job Grade 5-7 57% 51% -6%
Age 25-44 62% 54% -8%
Technical Role 61% 48% -13%
*Percent Favourable

Page 27
Personal Development
Survey item details
Item 2009 2010 Diff
My job is challenging and fulfilling 73% 72% -1%
My job makes good use of my skills and abilities
69% 69% 0%
I have enough information to succeed in my job
71% 70% -1%
My department has the resources necessary to achieve its objectives
39% 32% -7%
I receive the training and development I need to do my job
65% 61% -4%
*Percent Favourable

Page 28
Personal Development
Survey item details
Item 2009 2010 Diff
How satisfied are you with your physical working conditions?
62% 64% +2%
I know what skills I will need in the future to be a valuable contributor
69% 65% -4%
I am given opportunities to improve my skills at the University
69% 61% -8%
My manager takes an active interest in my growth and development
61% 57% -4%
I am satisfied with my opportunities for growth and development
54% 48% -6%
*Percent Favourable

Page 29
Personal Development
Survey item details
Item 2009 2010 Diff
How satisfied are you with your opportunities to advance?
32% 25% -7%
The University is successful in developing and promoting employees from within
37% 26% -11%
The University is doing what is necessary to keep its most talented employees
21% 13% -8%
Overall, how good a job do you feel is being done by your immediate manager?
69% 66% -3%
*Percent Favourable

Page 30
Supplemental
This dimension is at 61% favourable overall Items were changed from previous administration;
therefore, a direct comparison of the overall dimension with 2009 is not possible
Declines in specific areas seem to reflect overall attitude toward the University Poor understanding of customer needs Retaining talent Value placed on innovation Encouragement of diversity

Page 31
Supplemental
Survey item details
Item 2009 2010 Diff
Satisfaction with information on intranet
67%
Satisfaction with information from line manager
57%
Ability to give line manager feedback that is received and acted on
60%
My school/service has a clear understanding of customer needs
77% 67% -10%
Overall, how would you rate your school/service’s customer service?
79% 76% -3%
The University is able to attract and retain high quality employees
43% 34% -9%
*Percent Favourable

Page 32
Supplemental
Survey item details
Item 2009 2010 Diff
The University values innovation and creativity in pursuit of excellence
53% 40% -13%
I am fully aware of the University’s corporate values
58% 55% -3%
The University encourages and promotes diversity
79% 64% -15%
If I have a formal complaint, my concerns will be taken seriously
63% 65% +2%
In the last 12 months I have not been bullied, harassed, etc.
81% 83% +2%
*Percent Favourable

Page 33
Key Results Matrix
Primary Strength
Secondary Strength
Neither Strength nor Weakness Opportunity for Improvement
Critical Weakness
• Immediate manager behavior
• Good use of skills and abilities
• Receive needed information
• Opportunities to improve skills
• Understanding of University strategy
Clear Majority Positive
( > 65% Positive)
Majority Positive
( > 50% Positive)
Less Than Majority Positive
(or > 25% Negative)
Above
Avg
At or
Near
Avg
Below
Avg
• Performance evaluation
• Fair pay
•Effective teamwork
•Overall Satisfaction
•Benefits package
•Proud to work at University
• Department resources
• Opportunity for growth
• Mutual trust & respect
• Feel valued as employees
• Cooperation between departments
• Recommend University
• Making necessary changes
• Confidence in University strategy
• Confidence in senior management decisions, actions, communication
• Advancement and developing & promoting from within
• Pay for performance
• Retaining talented employees

Page 34
Open-Ended Comments

Page 35
Communicating Survey Results
It is recommended that survey results be communicated to employees. Different levels of results are typically communicated utilising different methods of communication.
Organisation-level results are typically disseminated to a wider group of employees and print media is generally preferred. However, video or voice media are also effective. Results to other levels are generally communicated in smaller groups or during meetings between employees and their managers.
Organisation-Level Results Newsletter Memos from Top Management Intranet/ E-mail
Other Results Small Group Meetings Face-to-Face Meetings between Managers and Employees Group Newsletters or Memos

Page 36
Action Planning
After determining your areas of strength and areas in need of improvement, develop a summary balance sheet (see chart on the following page). This provides a starting point for determining how to address the issues you’ve identified. It can guide you in coordinating efforts, where appropriate, with other levels of the organisation. Additionally, it clearly identifies those areas you need to address solely within a specific group.
List the strengths and weaknesses that are unique to a group (not shared with broader level organisations) in the “unique” column, and list those that are similar to broader organisations in the “shared” column.
Using the balance sheet, compare your organisation to the next highest or most logical organisation level.

Page 37
UNIQUE SHARED
STRENGTH
WEAKNESS
Action Planning - Balance Sheet

Page 38
Characteristics of an Effective Action Plan
After you’ve reviewed and analysed your results, it’s time to take action. An effective action plan has the following characteristics:
Is fully supported by senior leadership - Having the support of senior leadership is critical to success. If the actions you are undertaking are not important to and supported by senior leaders, there is little likelihood of success. Having their support ensures focus and priority are placed on the plan. Additionally, they can help eliminate roadblocks to implementation of the plan.
Focuses on what can be done - Don’t waste time on what is not possible. Although all ideas should be considered, focus on the positive and possible.
Involves employees - Involve employees as much as possible to gain their perspective on the issues, their ideas and their commitment.
Establishes specific actions and goals - Specificity ensures clarity and leads to success.
Provides a timetable of events - Publicising the timing of events enhances the likelihood that deadlines will be met and helps inform the organisation of the changes planned.
Assigns responsibilities and accountabilities - Ensure ONE person is accountable for each action plan item. This level of accountability eliminates the potential for assuming someone else will get it done.
Describes how success will be measured - Define what success is, since this provides the goal your team needs. This target offers continual feedback to the team on the progress they are making.
Is clearly communicated - Document your action plan to ensure that everyone has the same understanding of what will occur and who is accountable.

Page 39
The final step in analysing your data and preparing to take action is to prioritise the areas you will address. Attempting to implement too many changes will dilute your focus and effort. Strive to identify 2 or 3 key issues you want to work on. Once your plans are developed and implemented, you can move to additional issues while monitoring the changes already established.
The following chart is a guide for prioritising the areas you will work on. It considers areas for improvement on two factors – Importance and Potential for Change. Priority should be placed on those issues that are important and have a high potential for change. Areas that are important, but have low potential for change can be addressed by minimising the negative impact they exert. Areas of low importance are addressed if resources permit, avoiding those that have a low potential to change.
Prioritising Your Action Plan

Page 40
Prioritising Your Action Plan
Area to AvoidOptional Areas for Action
DilemmasPriorities for ActionI
MPORTANCE
HIGH LOW
Monitor for
Future Importance
Focus if
Resources AllowLOW
Attempt to Minimize Negative
Impact and Curtail Damage
Focus for Research
and EnergyHIGH
POTENTIAL FOR CHANGE

Page 41
2010 Employee Engagement Survey
Executive Summary
6 December 2010