2010 Annual Report - nccommerce.com JDIG Annual...NORTH CAROLINA DEPARTMENT OF COMMERCE Job...
44
NORTH CAROLINA DEPARTMENT OF COMMERCE Job Development Investment Grant 2010 Annual Report Submitted by Economic Investment Committee
Transcript of 2010 Annual Report - nccommerce.com JDIG Annual...NORTH CAROLINA DEPARTMENT OF COMMERCE Job...

NORTH CAROLINA DEPARTMENT OF COMMERCE
Job Development Investment Grant
2010 Annual Report
Submitted by Economic Investment Committee

Calendar Year 2010 Legislative Report 2
Table of Contents
I. Introduction ............................................................................................................................. 3 II. JDIG Program Summary......................................................................................................... 3
Program Process: From Application to Award ........................................................................... 4 III. JDIG Applicants and Grantees for CY 2010 ....................................................................... 5
Tier .............................................................................................................................................. 6 Awards (Payments) to 2010 Grantees ......................................................................................... 6 Performance Minimums.............................................................................................................. 6
Estimated Economic Impact ....................................................................................................... 8 IV. General Description of Calendar Year 2010 Grantees ........................................................ 8 V. JDIG Grantee Performance ..................................................................................................... 9
Jobs by Wage Increment ........................................................................................................... 10
Distribution of Grants ............................................................................................................... 10 Environmental Impact ............................................................................................................... 12
VI. Grantee Profiles for Calendar Year 2010 ........................................................................... 12 ABB, Inc. (“ABB”) ............................................................................................................... 12
BAE Technologies, Inc. ........................................................................................................ 12 Brunswick Corporation (“Brunswick”) ................................................................................ 13 Caterpillar, Inc. (“Caterpillar-Forsyth”) ............................................................................... 14
Caterpillar, Inc. (“Caterpillar-Lee”) ...................................................................................... 14 Celgard, LLC ........................................................................................................................ 14
Citco Fund Services (USA) Inc. (“Citco”) ........................................................................... 15 Clearwater Paper Corporation (“Clearwater Paper”) ............................................................ 16 Cree, Inc. (“Cree”) ................................................................................................................ 16
Hewitt Associates LLC (“Hewitt”) ....................................................................................... 17
Husqvarna Professional Products, Inc. (“HPP”) ................................................................... 17
IBM Lender Business Process Services, Inc. (“LBPS”) ....................................................... 18 Magna Composites, LLC (“Magna”) .................................................................................... 18
Novartis Vaccines and Diagnostics Inc. (“Novartis V&D”) ................................................ 19 Novo Nordisk Pharmaceutical Industries, Inc. (“Novo”) ..................................................... 19 Plastek Industries, Inc. (“Plastek”) ....................................................................................... 20
Siemens Energy, Inc. (“SEI”)II ............................................................................................ 20 Siemens Energy, Inc. (“SEI”) SmartGrid ............................................................................. 20 SPX Corporation (“SPX”) .................................................................................................... 21 TIMCO Aerosystems, LLC (“TIMCO”) .............................................................................. 21
VII. Conclusion ......................................................................................................................... 22
Caveats ...................................................................................................................................... 32
Attachment A1 Maximum State Liability under JDIG Awards Made in CY 2010
Attachment A2 Maximum Annual Grant Amount Payable to Grantees
Attachment A3 Maximum Annual Grant Amount Payable to Utility Account of IDF
Attachment B Estimated Lifetime Fiscal and Economic Impacts for Grants awarded in
CY 2003-2010
Attachment C JDIG Grantee Report Findings on 2009 Performance
Attachment D Disbursements for Grants awarded in CY 2003-2010
Attachment E Withdrawn/Terminated Projects

Calendar Year 2010 Legislative Report 3
I. Introduction
This report describes CY 2010 performance by grantees under the Job Development
Investment Grant (“JDIG”) program, pursuant to North Carolina General Statute (“G.S.”)
§143B-437.55(c). Information presented includes a listing of grants made and accepted; the
results of the cost/benefit analysis conducted by the Economic Investment Committee (the “EIC”
or the “Committee”) for each project; the term of each grant; the percentage of withholdings
used to determine the amount of each grant; job creation, investment and minimum average
annual wage requirements; and the State’s liability under the grants.
II. JDIG Program Summary
The JDIG program, adopted by the General Assembly in the 2001-2002 session, became
effective January 2003 and is currently scheduled to sunset on January 1, 2016
(G.S.§143B-437.62). It is a performance-based economic development incentive program that
provides annual grant disbursements for a period of up to 12 years, to new and expanding
businesses based on a percentage of withholding taxes paid by new employees during each
calendar year of a grant. This percentage ranges from 10% to 75%. Grants are made to
qualifying companies by the EIC, subject to caps set by the General Assembly on future grant
year liability. The EIC is comprised of five members: the Secretary of Commerce, the Secretary
of Revenue, the Director of the Office of State Budget and Management, and two private sector
members appointed by the General Assembly.
In considering whether or not to award a grant, and the appropriate amount and term of a grant,
the EIC considers both economic and fiscal impacts. It conducts an extensive review and
analysis of applications submitted by proposed grantees, considering factors enumerated in the
JDIG statute and the Criteria for Operation and Implementation of Job Development Investment
Grant Program (the “Criteria”), adopted pursuant to G. S. §143B-437.52 and 54(d), which
govern program administration. A determination is made as to how a proposed project benefits
the State, and, in particular, whether the fiscal benefits of the project, as measured by tax
revenues to the State, outweigh the grant costs to the State. The analysis of State revenue impacts
is conducted using an economic model developed by Dr. Michael Walden of North Carolina
State University.1
The model generates estimates of income and employment impacts (direct,
indirect and induced), calculates expected impacts on State expenditures and revenues, and the
likely net increase in revenue to the State’s General Fund. The Walden model includes all State
incentives known at the time of application in its calculation of net State fiscal cost.
By statute, the EIC is authorized to award up to 25 grants per year. The total amount paid out in
any single grant year to all companies awarded a grant in the same calendar year cannot exceed
$15 million. Most companies do not receive a 12-year grant, and in many years the annual cap is
1 Walden, Michael. A Model to Estimate the Economic Impacts of Business Location in North Carolina. Developed for the NC
Department of Commerce. February 2003 (with updates provided regularly).

Calendar Year 2010 Legislative Report 4
not achieved by a company. The maximum State liability for grants awarded during CY 2003-
2010 will be far less than the maximum theoretically possible. Each grant agreement specifies
the maximum amount for which a company is eligible in each of its grant years. The State’s
maximum annual liability under grants made in 2010 is set forth for each grant in Attachment
A1, with the maximum liability to the grantee provided in Attachment A2, and the maximum
liability to the Utility Account of the Industrial Development Fund (the “Utility Account”) set
forth in Attachment A3. The Utility Account receives 25% of the value of every grant payment
earned by companies for projects located in Tier 3 counties and 15% of the value of every grant
payment earned by companies for projects located in Tier 2 counties. Funds in the Utility
Account are then made available for infrastructure projects in North Carolina’s more distressed
counties.
Program Process: From Application to Award
All companies considered for a JDIG must first meet the minimum eligibility requirements set
forth in G.S. 143B-437.53. Department of Commerce (“Commerce”) economic developers
working with a business that meets the requirements and is a good candidate for a JDIG award
recommends the project to senior staff for consideration. If preliminarily approved, the EIC is
polled to determine if they would support a grant for the project. Business and Industry staff will
assist the company in identifying how North Carolina can meet its needs, in competition with
other states the company is considering for the project and Commerce Finance staff informs the
company of program requirements and begins the data collection process. The company then
submits a draft application for review by Commerce staff, which works with the company to
complete an accurate final application. During the application process, the company is required
to submit the following:
• Audited financial statements
• Employment profile & average annual wage for the proposed project
• Information on existing North Carolina jobs and activity
• Investment schedule
• Project description
• Competitive nature of the project
• Corporate governance
• Company organization and activity information
• Application fee of $5,000
An applicant is also asked to describe any anticipated environmental issues, anticipated impact of
project on public infrastructure, and information about compliance with laws and regulations
associated with the project. This is in addition to the extensive OSHA, environmental, and tax
compliance checks and the cost-benefit analysis conducted by Commerce. An Economic Impact
Analysis using the Walden Model is also conducted in order to model the Net State Revenue
anticipated from a project. It should be cautioned that no economic impact analysis is infallible.
The results depend heavily on the assumptions underlying each case, most of which are subject
to some level of uncertainty. Best practice in impact analysis dictates the adoption of the most
conservative probable assumptions, in order to avoid over-estimation of any positive benefits
attributable to a given project.

Calendar Year 2010 Legislative Report 5
The JDIG statute requires the EIC to find based on the model estimates, a proposed JDIG
project's benefits, as measured by tax revenues to the State, outweigh its costs to the State, thus
rendering the grant appropriate. The EIC seeks to identify and select projects that are the most
beneficial to the State, after considering a number of different evaluation factors. Materials
provided to the EIC for the consideration of a JDIG award are discussed in one or more closed
sessions. Should the EIC choose to enter into contract with a firm, a term sheet is drafted and
proposed to the company. The term sheet outlines the structure of the grant and the conditions
necessary to fulfill the grant requirements. If the company accepts the terms (in writing) and
commits to locate the project in North Carolina, subject to the award of the grant, a public open
meeting is held by the EIC to award the grant and a Community Economic Development
Agreement (CEDA) is executed. Grantees are required to submit reports on an annual basis (by
March 1st of each grant year), along with a reporting fee of $1,500, to demonstrate satisfactory
grant performance for the previous calendar year and eligibility for disbursement. The actual
disbursement amount for which the company is eligible is determined from Commerce’s analysis
of the annual reports, which include certification by the Department of Revenue with respect to
the company’s reported withholdings and the absence of overdue tax debts. All disbursements
must be approved by the EIC before actual payment can be made to the company.
III. JDIG Applicants and Grantees for CY 2010
During CY 2010, the EIC awarded 20 grants based on 22 applications received.2 Of these 22
applications, 20 were accepted (3 were based on applications received in 2009) and 5 projects are
still pending. No grants were awarded to projects which did not locate in North Carolina. Table
1 lists the county and tier in which the project has or will locate, the first grant year and length of
grant term for each company, the percent of withholdings that will be the basis for each
company’s grant payment, the grant amount to the company, the grant amount to the Utility
Account, and the total grant amount.
Table 1. CY 2010 Grantee Terms and Award Amounts
Company Name Year Of Eligibility County Tier
Length of
Grant Withholding
Grant Amount to Company
Grant Amount to
Utility Total Grant
Amount
ABB Inc. 2012 Mecklenburg and Wake 3 9 67% $2,149,500 $716,500 $2,866,000
BAE Technologies, Inc. 2011 Mecklenburg 3 9 60% $1,961,250 $653,750 $2,615,000
Brunswick Corporation 2010 Craven 2 12 70% $3,068,500 $541,500 $3,610,000
Caterpillar Inc. (Butterfly) 2011 Lee 2 11 75% $3,462,050 $610,950 $4,073,000
Caterpillar, Inc. (Camo) 2011 Forsyth 3 11 75% $4,677,750 $1,559,250 $6,237,000
Celgard, LLC 2010 Mecklenburg, Cabarrus 3 11 65% $4,593,750 $1,531,250 $6,125,000
Citco Fund Services (USA) Inc. 2011 Mecklenburg 3 9 60% $4,137,750 $1,379,250 $5,517,000
2 It should be noted that Commerce developers interact with many more business prospects, but only those
businesses that are likely to be awarded a grant are encouraged to apply for an award, as the $5,000 fee is non-
refundable. In such cases, developers work with companies on other assistance that can be provided to help locate their project
in the State.

Calendar Year 2010 Legislative Report 6
Company Name Year Of Eligibility County Tier
Length of
Grant Withholding
Grant Amount to Company
Grant Amount to
Utility Total Grant
Amount
Clearwater Paper Corporation 2011 Cleveland 1 12 65% $3,478,000 $0 $3,478,000
Cree, Inc. II 2012 Durham 3 10 60% $2,236,500 $745,500 $2,982,000
Hewitt Associates LLC 2010 Mecklenburg 3 9 60% $4,017,750 $1,339,250 $5,357,000
Husqvarna Professional Products, Inc. 2011 Mecklenburg 3 9 55% $2,619,750 $873,250 $3,493,000
IBM Lender Business Process Services, Inc. 2010 Durham 3 10 65% $7,779,000 $2,593,000 $10,372,000
Magna Composites LLC 2010
Rowan, Catawba, Caldwell
1 & 2 9 50% $1,111,800 $196,200 $1,308,000
Novartis Vaccines and Diagnostics Inc. 2011 Wake 3 9 75% $2,706,750 $902,250 $3,609,000
Novo Nordisk Pharmaceutical Industries, Inc. 2011 Johnston 3 10 65% $840,000 $280,000 $1,120,000
Plastek Industries, Inc. 2010 Richmond 1 9 65% $1,976,000 $0 $1,976,000
Siemens Energy, Inc. II 2011 Mecklenburg 3 12 75% $21,756,750 $7,252,250 $29,009,000
Siemens Energy, Inc. III (Smart Grid) 2011 Wake 3 9 60% $2,574,000 $858,000 $3,432,000
SPX Corporation 2011 Mecklenburg 3 11 70% $4,154,250 $1,384,750 $5,539,000
TIMCO Aerosystems, LLC 2011 Davidson 2 9 60% $1,798,600 $317,400 $2,116,000
Total $81,099,700 $23,734,300 $104,834,000
Tier
Of the CY 2010 grants, two were awarded to companies locating in a tier 1county; three were
awarded to companies locating in a tier 2 county; fourteen grants went to companies locating in
tier 3 counties, with two of those companies locating in multiple counties. One grant went to a
company locating operations in two tier 2 counties and one tier 1 county. These companies will
contribute a maximum amount of at least $23 million to the Utility Account over the life of the
grants.
Awards (Payments) to 2010 Grantees
In CY 2010, six of the twenty JDIG grantees’ first grant year was 2010. Of the remaining
grantees, twelve will seek their first payment in 2011, and two will have their first grant year in
2012. Maximum State liability for grants awarded in 2010 is $104 million, consisting of $81
million for companies, and $23 million for the Utility Account, over the life of those grants.
Performance Minimums
Each grantee agrees to a set of performance requirements for job creation, investment, and
average annual wages to be paid during each year of the grant. Grantees with existing
employees are typically required to retain those positions. A grantee’s actual performance

Calendar Year 2010 Legislative Report 7
determines the grant payment it receives each year. The payment can never be more than the
maximum annual State liability stated in each company’s grant agreement for that year.
CY 2010 grantees are expected to create 5,818 direct jobs and are required to retain 6,744 jobs.
Grantees are also anticipated to invest in excess of $1 billion in capital. Table 2 outlines the
target number of jobs, wages and investment for each 2010 grantee. For companies listed as
having no capital investment (denoted by an asterisk), investment requirements were excluded
from grant terms due to the small size of expected investment (typically less than $5 million).
This is because a company’s annual compliance is measured by a weighted average of a
company’s compliance with job creation, average wages, and investment minimums, and the
EIC chooses not to provide “credit” for a small amount of investment.
Table 2: CY 2010 Grantee Jobs, Wages and Investment
Company Name Target Jobs
Job Retention
Target Wage
Target Investment
ABB Inc. 130 301 $71,120 $90,000,000
BAE Technologies, Inc. 176 0 $51,392 $0*
Brunswick Corporation 350 279 $31,426 $4,700,000
Caterpillar Inc. (Butterfly) 325 825 $35,602 $28,300,000
Caterpillar, Inc. (Camo) 392 0 $40,482 $426,000,000
Celgard, LLC 289 390 $56,960 $91,000,000
Citco Fund Services (USA) Inc. 258 0 $78,256 $0*
Clearwater Paper Corporation 250 2 $37,897 $260,000,000
Cree, Inc. II 244 1723 $42,726 $135,000,000
Hewitt Associates LLC 463 534 $43,438 $0*
Husqvarna Professional Products, Inc. 160 160 $79,453 $8,250,000
IBM Lender Business Process Services, Inc. 600 95 $50,000 $0*
Magna Composites LLC 327 360 $33,352 $10,000,000
Novartis Vaccines and Diagnostics Inc. 100 350 $106,200 $36,000,000
Novo Nordisk Pharmaceutical Industries, Inc. 85 436 $42,976 $131,069,638
Plastek Industries, Inc. 250 0 $32,824 $19,000,000
Siemens Energy, Inc. II 825 777 $63,966 $135,000,000
Siemens Energy, Inc. III (Smart Grid) 139 260 $88,736 $0*
SPX Corporation 180 252 $82,917 $70,000,000
TIMCO Aerosystems, LLC 275 0 $34,728 $0*
Total 5,818 6,744 $1,444,319,638
Attachment B provides historical and CY 2010 direct job creation requirements (the number of
jobs to be created when the project is complete). The minimum required job creation in order to
avoid default is typically 90% of the target number of direct jobs, to account for inevitable
fluctuations and attrition. Typically, there is a lag between the time an award is made and the
actual commencement of new project operations and hiring of permanent staff on which the
grant is based. Many projects invest substantial time and dollars on building construction, plant

Calendar Year 2010 Legislative Report 8
renovation, and equipment. As a result, many JDIG grantees do not create a substantial number
of positions in the year in which they are awarded a grant.
Estimated Economic Impact
The 5,818 new direct jobs associated with CY 2010 projects affect other sectors by increasing
demand for goods and services by businesses and households. These indirect and induced
(multiplier) effects are estimated to add 12,186 jobs, for a total estimated employment impact of
18,004 jobs. State Gross Domestic Product is expected to increase by over $9 billion over the life
of CY 2010 grants. Further, the projects are expected to provide a net fiscal benefit to the State
of approximately $175 million during their grant terms. A complete listing of estimated
economic impacts for all JDIG projects is presented in Attachment B.
Table 3. Comparison of CY 2009 Grantees to CY 2010 Grantees
IV. General Description of Calendar Year 2010 Grantees
A project’s strategic importance to the state, region and locality is considered in the EIC’s grant
decision-making process. Many projects bring higher wages, high technology and knowledge-
intensive businesses that offer steady employment, generous benefits, and long-term competitive
potential. Companies such as Siemens Energy, Inc., Novartis Vaccines and Diagnostics, Inc.,
Husqvarna Professional Products, Citco Fund Services (USA), Inc, and ABB, Inc., fit this
criterion and were awarded grants in the 2010 calendar year. Other projects, such as Brunswick
Corporation, Caterpillar, Inc., Celgard, Inc., and Magna Composites, LLC, provide opportunities
for the re-hiring of manufacturing workers laid off from jobs with similar skill sets. The
manufacturing sector has been a staple of the North Carolina economy for decades and has
sustained a loss of nearly 98,000 jobs since the start of the recession in December 2007.
The industry sectors of the projects are examined by the EIC to make certain a project’s initiative
compliments the strategic plans of the State and its regions. CY 2010 projects include sectors
such as global defense, headquarters, human resources consulting, financial services, smart grid
technology, construction equipment manufacturing, boat and boat engine manufacturing, energy
cable manufacturing, information technology, medical instrument manufacturing as well as many
more. These projects require labor at a variety of skill levels -- lower-skilled assembly trades,
high-skilled manufacturing production, and knowledge-intensive consumer services. For all
projects awarded in CY 2010, the average annual wage of all employees is expected to be
approximately $52,000. Below is a chart describing the expected wage levels of CY 2010
grantees, along with the number of employees attributed to each wage. It is expected that 47%
of total 2010 employees will make anywhere between $30,000- $49,000 a year. Wage
information does not include total employee compensation, such as health insurance, employee
stock options, or other benefits offered by the grantee. For all grants made, the company is
Total Grant Award
($ millions)
Jobs
Committed
Jobs
RetainedInvestment Total
Indirect +
Induced
Jobs
Total Jobs
Total NC GSP
Impact ($
millions)
Cumulative Net
State Revenue ($
millions)
Total 2009 CY $119,898 5,221 6,030 $727 6,642 11,863 $7,301.03 $104.86
Total 2010 CY $104,834 5,818 6,744 $1,444 12,186 18,004 $9,428.26 $175.44
Percent Change
from 2009 to 2010-14% 10% 11% 50% 45% 34% 23% 40%

Calendar Year 2010 Legislative Report 9
required to pay at least 50% of employee health insurance premiums, although most pay around
70%.
JDIG is an effective program for both retention and expansion of existing North Carolina
companies and recruitment of new companies to the State. For existing businesses, a JDIG
award not only supports new job creation, but can help assure existing jobs are protected. Of the
20 projects, 16 are expansions of businesses already doing business within the State, while 4 are
new to North Carolina. Below is a more detailed description of the contributions of both existing
and new businesses which were awarded grants in CY 2010.
Table 4. Comparison of New Businesses to Existing Businesses, CY 2010
V. JDIG Grantee Performance
This section examines actual results generated by JDIG grantees.
Companies are required to provide the EIC with detailed annual reports during each year they are
eligible for grant payments. The reports document a company’s compliance with performance
requirements of their individual grant agreements. The companies must provide the EIC with
information on the number of eligible jobs created, existing positions retained, wages paid for
eligible positions, investment made, certifications they have provided employees with the
required health insurance, and evidence showing fulfillment of environmental, tax and OSHA
requirements. Companies lose some of their grant payments for failure to achieve minimum
requirements, and the company may lose its grant entirely after a second year of non-compliance.
819
1,580
1,154
404
530
370
608
140
138
56
19
$20,000 - $29,999
$30,000 - $39,999
$40,000 - $49,999
$50,000 - $59,999
$60,000 - $69,999
$70,000 - $79,999
$80,000 - $89,999
$90,000 - $99,999
$100,000 - $124,999
$125,000 - $149,999
More than $150,000
Chart 1. Expected Wage Levels of CY 2010 Grantees
2010 Number of Employees
2010 GranteesTotal Grant Award
($ millions)
Grant
%Target Jobs Investment Total
Investment
%
Indirect +
Induced
Jobs
Total Jobs Total
Jobs%
Total NC GSP
Impact ($
millions)
New 10,971,000 10% 758 $279,000,000 19% 1,346 2,104 12% $1,249.21
Existing 93,863,000 90% 5,060 $1,165,319,638 81% 10,840 15,900 88% $8,179.05

Calendar Year 2010 Legislative Report 10
Attachment C displays the 2009 grantee performance results for the companies required to
submit annual reports. Companies must report by March 1 of each year following the end of a
calendar year, and Commerce staff analyzes and reviews grantee reports for eligibility for
payments from that point. Thus, in 2010, Commerce reviewed, certified, and made payments
with respect to 2009 performance by grantees. Attachment D displays disbursements made for
grants awarded in CY 2003-2009.
Jobs by Wage Increment:
The EIC considers the wage levels prospective grantees will pay new employees as a
determinant in its JDIG awards. The following graph shows the actual confirmed average wage
levels for the 59 companies filing annual reports in CY 2009.
Distribution of Grants:
An important goal of JDIG and other state incentive packages is the broad distribution of
benefits across the State. The JDIG program has two mechanisms to fulfill this goal. First, the
Committee takes into account the economic characteristics of counties when awarding grants and
deciding grant terms. Second, for grants awarded in tier 3 or tier 2 counties (less economically
distressed counties), 25% (tier 3) or 15% (tier 2) of the amount of the grant payment for which a
company would otherwise be eligible is deposited into the Utility Account of the Industrial
0
500
1000
1500
2000
2500
Chart 2. Actual Average Wage Levels for Companies Submitted in 2009 JDIG Grantee Reports

Calendar Year 2010 Legislative Report 11
Development Fund3. The annual deposits to the Utility Account will increase significantly as
more projects become eligible for disbursements. Figure 1 summarizes the distribution of JDIG
grants awarded in CY 2003-2010 by county4.
Figure 1. Location of JDIG Awards, CY 2003-2010
3 Utility Account funds may be used for construction or improvements to water, sewer, gas, or electrical utility lines and for
equipment for existing or proposed industrial buildings in economically distressed counties.
4 All JDIG awards including awards not accepted or terminated. In instances where a project received one grant for locating
facilities in two counties, each county received 0.5 of a grant awarded.

Calendar Year 2010 Legislative Report 12
Environmental Impact:
All JDIG projects are screened for necessary environmental permits and reviewed for
potential major environmental impacts. Commerce works closely with the Department of
Environment and Natural Resources (DENR) staff during the JDIG review process.
Upon receipt of an application, Commerce forwards a copy to the staff environmental
consultant, who prepares a memo and a due diligence report for consideration by the EIC.
To-date, there has been no indication any existing grantee will experience difficulty
obtaining needed permits, nor have there been significant concerns regarding the
environmental impacts of existing projects. In addition, all grantees are required to
certify they have received all required environmental permits when filing their annual
report with the EIC.
VI. Grantee Profiles for Calendar Year 2010
The following information was provided to the Economic Investment Committee at the
time of evaluation of each grant discussed.
ABB, Inc. (“ABB”)
ABB Inc. is a Delaware corporation (incorporated in 1980) and a wholly-owned
subsidiary of ABB Holdings, which is a wholly-owned subsidiary of ABB Ltd. The
company is a leader in power and automation technologies that enable utility and
industrial customers to improve their performance while lowering their environmental
impact. ABB has five core competencies in low voltage products, discrete automation
and motion products, process automation, power products, and power systems.
ABB will construct a new factory that will manufacture high-voltage land cables for
power transmission for use in both AC and DC applications. The North Carolina site for
the plant, Huntersville in Mecklenburg County, will create 100 jobs, with another 30 jobs
to be added at the main campus in Raleigh, in Wake County. The 130 new jobs will all
reside in the Power Systems division of the company and, as a result, the company will
be required to retain 301 Raleigh-based jobs, many of whom share the same reporting
structure and divisional obligations. The competition for this project was South Carolina;
the company valued incentives offered by South Carolina at $40 million.
BAE Technologies, Inc.
BAE Systems, Inc. is a subsidiary of BAE Systems Plc., a global defense, security and
aerospace company which delivers a full range of products and services for air, land and
naval forces, as well as advanced electronics, security, information technology solutions
and customer support services. BAE Systems, Inc. was incorporated in Delaware in 1997,
and is responsible for relationships with the United States Government, administration of
BAE Systems’ Special Security Agreement, and managing BAE’s United State’s based
businesses.

Calendar Year 2010 Legislative Report 13
The grantee, which will be formed prior to operation, will operate a shared services
center that will help the BAE companies control overhead, better manage human
resources, and achieve accounting efficiencies to enable BAE Systems to maintain
competitiveness on government contracts. The facility will be located in Mecklenburg
County. BAE Systems, Inc. evaluated three locations for this project: the Lending Tree
Building or University Building, both located in Mecklenburg County, North Carolina;
the South Cross Building located in Rock Hill, South Carolina; and an existing BAE
complex in Austin, Texas. South Carolina offered various incentives. The company
would have achieved cost savings at the Austin site due to its ownership of the building
located there.
Brunswick Corporation (“Brunswick”)
Brunswick is a leading global manufacturer of recreation products including marine
engines, boats, fitness equipment and bowling and billiards equipment. Brunswick’s
engine products include outboard, stern drive, and inboard engines, trolling motors, and
propellers. They also manufacture engine control systems and marine accessories. Boat
offerings include fiberglass pleasure boats, luxury sport-fishing convertibles and motor
yachts, offshore fishing boats, aluminum fishing, deck, and pontoon boats.
Hatteras Yachts (“Hatteras”), established in 1959, is now a division of Brunswick,
acquired by Brunswick in 2001. Hatteras, which is located in New Bern, North Carolina,
manufactures luxury sport-fishing convertibles and motor yachts from 50’ to 100’ in
length. In 2006, Hatteras acquired Cabo Yachts (“Cabo”) in Adelanto, California. Cabo
manufactures sport-fishing convertibles from 32’ to 52’ in length. Hatteras hopes to
capture sport-fishing enthusiasts earlier in their career, when they are buying smaller
boats such as Cabo, with the potential that consumers eventually convert to the Hatteras
size range.
While Hatteras believes the strategic reason for acquiring Cabo has been successful, the
worldwide market for sport-fishing convertibles has shrunk. Cabo typically manufactured
and sold 100+ boats per year and Hatteras manufactured and sold 60+. Because of market
contraction, Hatteras believes the demand for the two brands is likely to peak at 70-80
Cabo boats and 40-50 Hatteras boats per year. As a result, instead of operating two
plants at some 60-70% capacity, Brunswick will combine the two plants into a single
location in Craven County.
The cost to relocate the California plant to North Carolina was estimated to be over $4
million. This included relocating people, molds, and equipment, severance pay, a lease
buyout of the California property, a new storage building in North Carolina, and training
for production of the new product in North Carolina. The company believed the benefit
of relocating in North Carolina, including the incentive package provided, was sufficient
to move operations.

Calendar Year 2010 Legislative Report 14
Caterpillar, Inc. (“Caterpillar-Forsyth”)
Caterpillar is the largest maker of construction and mining equipment, diesel and natural
gas engines, and industrial gas turbines in the world. The company has nearly 300
operations in 40 countries and employs nearly 95,000 people. Caterpillar will construct
an approximately 850,000 square foot manufacturing facility for the machining,
assembly, testing and painting of axle assemblies for large mining trucks. This
component is currently produced in multiple locations across the United States. The
primary objective is to consolidate these operations into a state-of-the-art manufacturing
facility in Forsyth County, in order to meet the current and projected global demand for
these products.
Caterpillar conducted an initial search in 9 states and 72 communities, which resulted in
the identification of 3 potential sites - Montgomery, Alabama; Spartanburg, South
Carolina; and Winston-Salem, North Carolina. Each location presented a favorable
environment for long-term success. The team assessed each market on the basis of
availability of a skilled workforce, operating cost factors, and logistics to support the
final business case for this location decision. The availability of economic incentives at
the State and local level played a key role in the final decision in favor of Forsyth
County.
Caterpillar, Inc. (“Caterpillar-Lee”)
The Lee County Caterpillar project is an expansion of operations to consolidate,
manufacture and assemble new lines of Skid Steer Loaders. The Lee County facility will
dramatically increase the number of models produced in order to provide Caterpillar
customers with machines that meet new Federal emissions standards that will be phased
in over the next several years. The project also includes upgrading the paint system to
environmental-friendly powder coating, and consolidates two different operations to
reduce the impact of transportation costs for inbound material. The project will also
result in the location of a parts supplier near the site. The supplier’s process consists of
receiving raw steel, cutting it into manageable pieces, and completing additional prep
operations like bending and forming. Having the fabrication facility and related supply
chain close to the Lee County assembly facility not only decreases transportation costs
but also improves product quality. Previously, the long travel required in the old supply
chain process from Mexico impacted fabrication quality.
During the site selection process, Caterpillar considered locating this project at an
existing facility in Florence, South Carolina, which had additional space for expansion.
South Carolina offered an incentive package of approximately $16 million, of which
approximately $6 million would have been cash or cash equivalents.
Celgard, LLC
Celgard is a wholly-owned subsidiary of Polypore International, Inc. (NYSE: PPO)
(“Polypore”), with manufacturing and headquarters in Charlotte, North Carolina. With 14
facilities worldwide, Polypore is a $600 million global high-technology company that

Calendar Year 2010 Legislative Report 15
develops, manufactures, and markets specialized microporous polymer-based
membranes. These Polypore products are used in separation and filtration processes in
two primary market segments, Energy Storage and Separations Media. Products
manufactured by Celgard are highly engineered separators used in lithium batteries for
consumer electronic devices such as notebook computers, mobile telephones, digital
cameras, power tools, reserve power and electricity grid storage systems, and Electric
Drive Vehicles (EDV). The company has been in Charlotte for more than 20 years, and
has over 30 years experience in the market.
Celgard will expand its separator production capacity in the United States to supply
domestic lithium-ion battery manufacturers participating in the EDV industry. Celgard
will increase separator manufacturing within an existing building on its Charlotte
campus. An additional new building is being constructed in Concord, Cabarrus County.
The new addition will create additional capacity and jobs. Both sites will manufacture
Poly-ethylene/Poly-propylene battery separators for use in lithium ion batteries
Before deciding on the North Carolina expansion, Celgard pursued opportunities in
various states, and possibly several sites within states. Each location was unique and
presented its own set of advantages and disadvantages. The company based its decision
on the value of incentives, proximity to existing company facilities, opportunities for
synergies with existing facilities, proximity to major customers, availability of a quality
workforce, access to major highways and/or a large airport, and opportunities to work
with existing academic or government research facilities. Incentives offered by South
Carolina and Georgia were detailed in the application. In each case, the company
received a written response from the State and/or applicable localities outlining the
incentives available for a project of this size. Where appropriate, the company began the
process of completing applications and other necessary steps in order to secure the
incentive.
Citco Fund Services (USA) Inc. (“Citco”)
Citco is one of three core operations within the Citco Group, which includes hedge fund
services, banking and custody, and trust and corporate management. The Citco Group
was founded in 1940 by A.A.G. Smeets and is currently controlled by Christopher
Smeets. With over 35 years experience, Citco offers back, middle, and front office
administration and other services to hedge funds, fund of funds, and private equity funds,
including fund accounting and net asset value calculations, investor relations, anti-money
laundering compliance, corporate & legal services, and various other services such as tax
reporting and financial statement preparation. After considering two other candidate
locations, Citco will expand these services in Charlotte, with an emphasis on back office
operations. The company’s selection of a site was heavily influenced by a number of
favorable factors offered by Charlotte.
Charlotte has been widely known as the second largest financial services hub in the
United States, after New York. Citco believed it could successfully cull from among
Charlotte’s 30,000 skilled financial services workers to obtain the talent required. Citco
also recognized the high quality of life in the Charlotte region that provides a satisfying
work/life environment for staff, including: available and affordable housing, quality

Calendar Year 2010 Legislative Report 16
educational institutions, universities and robust entertainment choices. Third, North
Carolina has a strong legal framework to protect Citco’s intellectual property and that of
Citco clients. Finally, Citco determined that Charlotte has a competitive mix of
reasonable salaries and affordable commercial lease rates.
Clearwater Paper Corporation (“Clearwater Paper”)
Clearwater Paper is a pulp and paperboard private-label tissue and wood products
company, once a part of the Potlatch Corporation. In 2006, Potlatch converted from a
corporation to a REIT because of the tax savings associated with having large ownership
of timberlands. In late 2008, Clearwater Paper was spun off as its own publicly-traded
corporation which included the pulp & paperboard manufacturing, tissue production, and
wood products manufacturing site. The timberlands, however, remained under Potlatch
Corporation ownership.
One of Clearwater Paper’s divisions is the Consumer Products Division (“CPD”). This
division manufactures private label tissue and has a manufacturing presence in the
Western U.S. (Las Vegas NV, and Lewiston ID), and in the Midwest (Elwood, IL). Over
the years, the CPD has become a dominant supplier of private label tissue in those
regions. The CPD currently sells products in the Southeast, but does not have cost-
effective, high-production capacity capable of supporting market demand. The company
believes there is large growth potential in the Southeast for private label tissue, and, has
decided to locate a paper making, converting, and distribution facility in this region.
Clearwater Paper is opening a facility in Shelby, Cleveland County- a tier one county.
The project will be introduced over approximately five years with a 650,000 sq. foot
converting/distribution warehouse and two converting lines. Clearwater Paper narrowed
the applicable site search from over 50 sites to four sites, including Shelby, North
Carolina. The other three sites were located in Macon, Georgia, Chester, South Carolina
and Chattanooga, Tennessee. All had similar 10-year cumulative costs structures.
Incentives which lowered on-going operation costs and/or site development costs were
critical to the selection of Shelby, North Carolina.
Cree, Inc. (“Cree”)
Cree was established in 1987 and maintains its corporate and manufacturing headquarters
in the Research Triangle Park (“RTP”) and Silicon Drive in Durham County, North
Carolina, where currently Cree employs 1,723 people. Globally, the company employs
an additional 2,700 people in offices and manufacturing centers in China, Malaysia,
Japan and Germany. Cree is focused on growing its core business of research,
development and production of LED lighting products.
Cree is “leading the LED lighting revolution” and setting the stage for exclusion of the
incandescent light bulb through the use of energy-efficient, environmentally friendly
LED lighting. Cree produces LED fixtures and bulbs, blue and green LED chips, high-
brightness LEDs, lighting-class power LEDs, power-switching devices and radio-
frequency/wireless devices.

Calendar Year 2010 Legislative Report 17
With the grant, Cree will increase production of next-generation LED chips. Cree has
historically manufactured LED chips on 2-, 3-, and currently 4- inch diameter wafers; this
project will allow Cree to produce chips on 150 mm (approx 6 inch) wafers, increasing
output and production efficiency.
The company has an existing JDIG award, and must remain in compliance with that grant
in order to be eligible for payments under the new grant.
Cree evaluated three locations for this expansion: the current Cree facilities in Durham,
North Carolina; current production facilities in Huizhou, China with support functions in
Hong Kong; or Penang, Malaysia, where Cree currently utilizes contract manufacturers.
Hewitt Associates LLC (“Hewitt”)
Hewitt provides leading organizations around the world with human resources consulting
and outsourcing solutions. Hewitt works with companies to design, implement,
communicate, and administer a wide range of human resources, retirement, investment
management, healthcare, compensation, and talent management strategies. Established in
1940, Hewitt has approximately 150 offices in more than 30 countries and employs
approximately 23,000 associates worldwide.
Currently, Hewitt has 534 employees in the State. Over 400 are located in the company’s
Charlotte facilities. The remaining North Carolina positions work from home offices.
Hewitt was given a previous JDIG award, which was terminated on Dec. 29, 2009. The
terms of the prior grant depended on a contract for the outsourcing of Wachovia’s
benefits work. With the takeover of that bank by Wells Fargo, the anticipated project
would not proceed. The current project involves a number of new contracts that are
independent of the company’s previous plans.
Hewitt has identified several clients whose demands, during the next three years, are
anticipated to create substantial new jobs for Hewitt. This project is not geographically
tied to existing and future client locations; performance of the work could be done at any
of Hewitt’s existing global service centers. Hewitt evaluated existing locations in
Charlotte, Lincolnshire, Illinois, Orlando, Florida, and The Woodlands, Texas to
determine the optimal location for expansion. Each location possessed the infrastructure
and space to accommodate the expansion. Factors that affected the ultimate decision
included the availability of a skilled workforce, labor costs, the proximity to existing
teams and customers, and the availability of financial assistance. None of the existing
locations required additional investment to accommodate the expansion – all were
considered equal. Incentives, helpful in reducing operational costs, were a determining
factor in selecting the final location. The JDIG grant and proposed North Carolina
training grant made a difference when compared to incentives being considered in Florida
and Texas and was competitive with the Illinois incentives.
Husqvarna Professional Products, Inc. (“HPP”)
With gross revenues equivalent to approximately $4.5 billion and 15,700 employees in
over 100 countries, Husqvarna is the world's largest producer of chainsaws, garden

Calendar Year 2010 Legislative Report 18
tractors, lawn mowers and other gas-powered garden equipment such as trimmers and
leaf blowers. Husqvarna is also one of the world's largest producers of cutting equipment
for the construction and stone industries.
Husqvarna will consolidate its Consumer Products headquarters from Augusta, Georgia,
with its Professional Products headquarters in Charlotte in Mecklenburg County, a tier
three county. Currently, HPP has 160 employees at the Charlotte facility, which will be
remodeled by the building owner. Also, a build-to-suit research and development facility
will be constructed by an unrelated party and leased to the HPP. In addition to
Mecklenburg County, Husqvarna received a generous incentives offer from the State of
South Carolina.
IBM Lender Business Process Services, Inc. (“LBPS”)
Incorporated in the State of New York in 1911, IBM is a globally integrated innovation
company, serving the needs of enterprises and institutions worldwide. IBM develops and
manufactures information technologies, offers information technology infrastructure and
business process services, application outsourcing services, computing and storage
solutions, middleware and operating systems software, information management
software, and commercial financing.
Founded in 2006, IBM Lender Business Process Services, Inc. provides turnkey private
label mortgage loan origination services, including application enablement, underwriting,
vendor order and transaction management, loan processing, document preparation, loan
closing coordination and settlement, and post-closing review and investor delivery. By
providing origination fulfillment capability, LBPS will allow lender clients to focus on
their core strengths and more effectively manage their customer relationships and
distribution strategies.
LBPS selected Durham County, specifically the Research Triangle Park, to expand
mortgage processing/fulfillment operations. A recent acquisition of a West Coast
mortgage processing business, as well as new customer developments led LBPS to
expand operations. Competing sites included other IBM properties in Metro-Atlanta,
Georgia and Metro-Dallas, Texas.
Magna Composites, LLC (“Magna”)
Magna International, Inc. (“Magna International”), the parent of Magna, is a highly
diversified automotive supplier. It designs, develops and manufactures automotive
systems, assemblies, modules and components; and engineers and assembles complete
vehicles, primarily for sale to original equipment manufacturers (OEMs) of cars and light
trucks in three geographic segments - North America, Europe, and Asia. The guarantor
on the grant, Magna Exteriors and Interiors of America, Inc. (“MEIA”), common parent
of an affiliated group that includes Magna Composites, LLC, had 242 manufacturing
operations and 86 product development, engineering and sales centers in 25 countries on
five continents as of September 2009.

Calendar Year 2010 Legislative Report 19
Over the next few years, Magna intends to increase its current operations in three
different locations: Salisbury, Rowan County, Newton, Catawba County, and Lenoir,
Caldwell County.
Magna International purchased certain assets of Meridian Automotive Systems, Inc. on
June 1, 2009. Included in this acquisition were the three North Carolina facilities in the
locations noted above. Magna International also acquired the rights for future business
either already awarded or being pursued by Meridian’s composite products division. As
a result, numerous product launches are planned over the next three years. Before
deciding to accept the proposed grant and locate in North Carolina, the company pursued
opportunities in both Indiana and Kentucky, for which strong proposals were presented.
Novartis Vaccines and Diagnostics Inc. (“Novartis V&D”)
Novartis V&D, a Delaware corporation, is a wholly-owned subsidiary of Novartis AG
(NYSE: NVS), which was created in 1996 from the merger of the Swiss companies,
Ciba-Geigy and Sandoz. Headquartered in Basel, Switzerland, the Novartis Group
employs approximately 96,000 people and operates in over 140 countries around the
world. The project company, Novartis V&D, focuses on the development of preventive
treatment and tools. Novartis V&D consists of Novartis Vaccines and Chiron, the blood
testing and molecular diagnostics unit.
Novartis V&D recently received a JDIG grant for construction of a facility in Holly
Springs, North Carolina, for production of pandemic and seasonal flu vaccine.
The grant awarded in the 4th
quarter of 2010, was for development of a TD Viral Lab and
Pilot Plant at the existing Holly Springs facility. The North Carolina site was chosen over
a competing site in Rosia, Italy, where the company was offered a grant equal to 30% of
Novartis’ planned investment for the project. To be eligible for payments under the
2010 grant, Novartis V&D will be required to create and retain jobs under the first grant
Novo Nordisk Pharmaceutical Industries, Inc. (“Novo”)
Novo is a subsidiary of Novo Nordisk A/S (Denmark), a leader in diabetes care with
more than 29,000 employees located in 76 countries. Novo is involved in many aspects
of the insulin production process. The company currently has facilities in Clayton, North
Carolina where the FlexPen®, a disposable insulin device, is assembled and prepared for
the US market.
This project is an expansion of existing production lines in order to manufacture the next
generation FlexPen®. Additionally, Nypro, Inc., based in Buncombe County, will supply
components for the new pens, and the Nypro supplier jobs will be required to be created
under this grant.
The company considered existing facilities in China and Europe for this project, before
choosing the Clayton facility.

Calendar Year 2010 Legislative Report 20
Plastek Industries, Inc. (“Plastek”)
Plastek is a family-owned and managed business, founded in 1956 as a tool building
company that has grown to include plastic molding and assembly. The company
specializes in tool building, injection molding and assembling rigid packaging for the
personal care, cosmetics, pharmaceutical, food and beverage industries. Plastek currently
operates worldwide, with locations in the United Kingdom, Brazil, Venezuela and the
United States. Customers include Abbott Labs, Pfizer, Wyeth Pharmaceuticals, Unilever,
Procter and Gamble, Church and Dwight, Colgate and other leading Fortune 500
companies.
Plastek has transferred a substantial amount of work from its Erie, Pennsylvania facilities
to a location in Hamlet, North Carolina, in order to bring manufacturing of various items
closer to customer manufacturing sites. This project is very capital intensive and requires
the purchase of a factory, significant renovations and investment in new equipment.
The competitive nature of custom injection molding and the bargaining power customers
have results in supplier contracts carrying a “condition of competitiveness” such that,
even long-term agreements allow the customer to move the business at any time during
the contract, if they find a cheaper price and wish to move. North Carolina incentives
were a critical part of this company’s decision to move. Plastek considered remaining in
Erie in order to possibly avoid the large investment and risk associated with moving.
North Carolina provided adequate incentives, allowing the company to lower cost, reduce
risk, and make the decision to locate in NC.
Siemens Energy, Inc. (“SEI”) II
Siemens Energy is a leading company in the international power generation sector
providing cutting-edge power and energy solutions. Siemens Energy develops and builds
fossil fuel power plants and power-generating components, as well as wind turbines,
turbines for use as mechanical drivers, compressors for industrial applications,
instrumentation and control systems, and fuel cell technology. Siemens Energy, Inc. is
Siemens Energy’s United States Corporation. SEI is ultimately owned by the German
corporation, Siemens AG. Siemens AG is organized in 3 sectors; the project company is
the United State energy sector entity.
As a result of expanding demand for cleaner and more efficient energy production, SEI
continues to experience long term growth. This project, which will locate in Charlotte,
involves engineering, manufacturing, and servicing of gas turbines. SEI pursued
opportunities in various other locations. The top three competing locations were Ontario,
Michigan, and Louisiana. Louisiana’s offer was valued at approximately $66 million,
and Michigan offered $56 million. Ontario incentives were kept confidential.
Siemens Energy, Inc. (“SEI”) SmartGrid
Siemens Energy is a leading company in international power generation. The company’s
ultimate parent is the German public corporation, Siemens AG, which is organized in 3
sectors. The grantee is the United State’s entity in the energy sector. (See above)

Calendar Year 2010 Legislative Report 21
This grant was provided for a smart grid high voltage engineering and equipment
demonstration project in the grantee’s Transmission and Distribution division, in
Wendell, North Carolina, with possible expansion to another Wake County facility.
Before deciding to locate this project in North Carolina, the company evaluated
expansion possibilities at existing locations in Florida and Mississippi. North Carolina’s
JDIG award, together with North Carolina customized training and work force
development assistance, addressed cost disadvantages North Carolina had when
compared to the competing sites.
SPX Corporation (“SPX”)
SPX, incorporated in Delaware in 1968, is a Fortune 500 multi-industry manufacturing
leader that provides highly specialized engineered solutions. The company employs
approximately 15,000 individuals in more than 35 countries worldwide. Operating
segments include Flow Technology, Test and Measurement systems, Thermal
Equipment, Industrial Products and related services.
The company is expanding operations with the development and construction of new
global headquarters in Charlotte, as well a new regional shared services center for the
Americas. The shared services center will provide tactical support to the business
through providing transactional services such as accounts payable, accounts receivable
and general ledger functions. The center will deliver centralized human resources,
finance, payroll and other support services. Other SPX regional centers currently exist in
China and England. The company states South Carolina offered state and local
incentives valued in excess of $45 million for the company to locate at the Edgewater
Corporate Center in Lancaster County.
TIMCO Aerosystems, LLC (“TIMCO”)
TIMCO Aerosystems, LLC is a wholly-owned subsidiary of TIMCO Aviation Services,
Inc., a privately-held company incorporated in Delaware in 1996. TIMCO is one of the
largest providers of maintenance, repair and overhaul services in the world. TIMCO
currently has facilities in Greensboro as well as satellite offices in Seattle and Atlanta.
TIMCO is also recognized as the only project integrator in the industry certified by the
FAA with Organization Designation Authorization authority. The company believes this
designation provides a unique competitive advantage within the industry, as TIMCO can
support customer operations from initial design and engineering to complete, in-house
systems and structures manufacturing.
The project represents the establishment of an East Coast-based passenger seat
manufacturing operation and the formation of a dedicated aircraft galley and lavatory
manufacturing facility. The project entails the creation of a standalone manufacturing
presence that offers synergistic benefits to the engineering and integration operation
currently based in Greensboro. The project will bring the operations of another TIMCO
Aviation Services wholly-owned subsidiary, California-based Brice Manufacturing
Company, to Davidson County.
Calendar Year 2010 Legislative Report 22
TIMCO considered several options, including the expansion of existing operations in
either Georgia or California. Construction of new operations in Alabama was also
considered. The company made its final decision based on State and local incentives,
facility specifications and workforce development opportunities.
VII. Conclusion
The JDIG program has been very successful in keeping North Carolina competitive. The
use of the JDIG program to expand existing businesses helps to protect jobs companies
might decide to locate in other states or overseas. The jobs, investment, and increased
diversity of industry created through this grant program help mitigate negative economic
shocks now and in the future. The JDIG program has allowed the State to attract a high
level of globally competitive employers to drive long-term innovation and growth.
Calendar Year 2010 Legislative Report 23
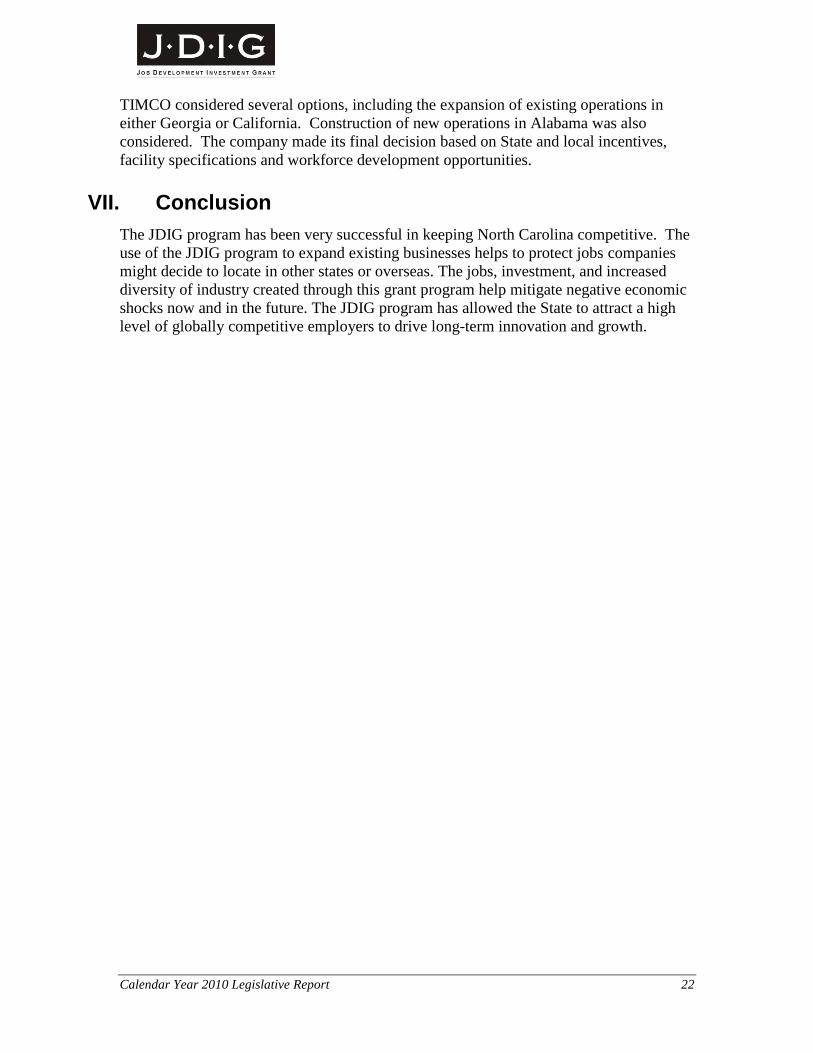
Attachment A1. Total Annual Grant Caps per Project
All Projects Awarded in 2010
Company Name 2010 2011 2012 2013 2014 2015 2016 2017 2018 2019 2020 2021 2022 Total by Project
ABB Inc. $0 $0 $298,000 $321,000 $321,000 $321,000 $321,000 $321,000 $321,000 $321,000 $321,000 $0 $0 $2,866,000
BAE Technologies, Inc.$0
$221,000 $287,000 $301,000 $301,000 $301,000 $301,000 $301,000 $301,000 $301,000$0 $0 $0 $2,615,000
Brunswick Corporation $84,000 $175,000 $242,000 $309,000 $350,000 $350,000 $350,000 $350,000 $350,000 $350,000 $350,000 $350,000 $0 $3,610,000
Caterpillar Inc. (Butterfly)$0
$150,000 $260,000 $359,000 $413,000 $413,000 $413,000 $413,000 $413,000 $413,000 $413,000 $413,000$0 $4,073,000
Caterpillar, Inc. (Camo) $0 $65,000 $344,000 $545,000 $628,000 $665,000 $665,000 $665,000 $665,000 $665,000 $665,000 $665,000 $0 $6,237,000
Celgard, LLC $176,000 $375,000 $501,000 $600,000 $639,000 $639,000 $639,000 $639,000 $639,000 $639,000 $639,000 $0 $0 $6,125,000
Citco Fund Services
(USA) Inc. $0$253,000 $406,000 $562,000 $716,000 $716,000 $716,000 $716,000 $716,000 $716,000
$0 $0 $0 $5,517,000
Clearwater Paper
Corporation $0$139,000 $222,000 $291,000 $314,000 $314,000 $314,000 $314,000 $314,000 $314,000 $314,000 $314,000 $314,000
$3,478,000
Cree, Inc. II $0 $0 $192,000 $310,000 $310,000 $310,000 $310,000 $310,000 $310,000 $310,000 $310,000 $310,000 $0 $2,982,000
Hewitt Associates LLC $327,000 $564,000 $638,000 $638,000 $638,000 $638,000 $638,000 $638,000 $638,000 $0 $0 $0 $0 $5,357,000
Husqvarna Professional
Products, Inc.$0 $349,000 $393,000 $393,000 $393,000 $393,000 $393,000 $393,000 $393,000 $393,000
$0 $0 $0 $3,493,000
IBM Lender Business
Process Services, Inc.$715,000 $1,073,000 $1,073,000 $1,073,000 $1,073,000 $1,073,000 $1,073,000 $1,073,000 $1,073,000 $1,073,000
$0 $0 $0 $10,372,000
Magna Composites LLC $70,000 $178,000 $229,000 $277,000 $277,000 $277,000 $0 $0 $0 $0$0 $0 $0 $1,308,000
Novartis Vaccines and
Diagnostics Inc.$0 $297,000 $414,000 $414,000 $414,000 $414,000 $414,000 $414,000 $414,000 $414,000
$0 $0 $0 $3,609,000
Novo Nordisk
Pharmaceutical
Industries, Inc.
$0 $82,000 $97,000 $108,000 $119,000 $119,000 $119,000 $119,000 $119,000 $119,000 $119,000
$0 $0 $1,120,000
Plastek Industries, Inc. $124,000 $214,000 $234,000 $234,000 $234,000 $234,000 $234,000 $234,000 $234,000 $0 $0 $0 $0 $1,976,000
Siemens Energy, Inc. II $0 $361,000 $1,086,000 $1,555,000 $2,303,000 $2,963,000 $2,963,000 $2,963,000 $2,963,000 $2,963,000 $2,963,000 $2,963,000 $2,963,000$29,009,000
Siemens Energy, Inc. III
(Smart Grid)$0 $144,000 $257,000 $367,000 $444,000 $444,000 $444,000 $444,000 $444,000 $444,000
$0 $0 $0 $3,432,000
SPX Corporation $0 $84,000 $180,000 $395,000 $526,000 $622,000 $622,000 $622,000 $622,000 $622,000 $622,000 $622,000 $0 $5,539,000
Timco Aerosystems,
LLC$0 $104,000 $166,000 $205,000 $236,000 $281,000 $281,000 $281,000 $281,000 $281,000
$0 $0 $0 $2,116,000
Total $1,496,000 $4,828,000 $7,519,000 $9,257,000 $10,649,000 $11,487,000 $11,210,000 $11,210,000 $11,210,000 $10,338,000 $6,716,000 $5,637,000 $3,277,000 $104,834,000

Calendar Year 2010 Legislative Report 24
Company Name 2010 2011 2012 2013 2014 2015 2016 2017 2018 2019 2020 2021 2022 Total by Project
ABB Inc. $0 $0 $223,500 $240,750 $240,750 $240,750 $240,750 $240,750 $240,750 $240,750 $240,750 $0 $0 $2,149,500
BAE Technologies, Inc. $0 $165,750 $215,250 $225,750 $225,750 $225,750 $225,750 $225,750 $225,750 $225,750 $0 $0 $0 $1,961,250
Brunswick Corporation $71,400 $148,750 $205,700 $262,650 $297,500 $297,500 $297,500 $297,500 $297,500 $297,500 $297,500 $297,500 $0 $3,068,500
Caterpillar Inc. (Butterfly) $0 $127,500 $221,000 $305,150 $351,050 $351,050 $351,050 $351,050 $351,050 $351,050 $351,050 $351,050 $0 $3,462,050
Caterpillar, Inc. (Camo) $0 $48,750 $258,000 $408,750 $471,000 $498,750 $498,750 $498,750 $498,750 $498,750 $498,750 $498,750 $0 $4,677,750
Celgard, LLC $132,000 $281,250 $375,750 $450,000 $479,250 $479,250 $479,250 $479,250 $479,250 $479,250 $479,250 $0 $0 $4,593,750
Citco Fund Services (USA)
Inc. $0 $189,750 $304,500 $421,500 $537,000 $537,000 $537,000 $537,000 $537,000 $537,000 $0 $0 $0 $4,137,750
Clearwater Paper
Corporation $0 $139,000 $222,000 $291,000 $314,000 $314,000 $314,000 $314,000 $314,000 $314,000 $314,000 $314,000 $314,000 $3,478,000
Cree, Inc. II $0 $0 $144,000 $232,500 $232,500 $232,500 $232,500 $232,500 $232,500 $232,500 $232,500 $232,500 $0 $2,236,500
Hewitt Associates LLC $245,250 $423,000 $478,500 $478,500 $478,500 $478,500 $478,500 $478,500 $478,500 $0 $0 $0 $0 $4,017,750
Husqvarna Professional
Products, Inc. $0 $261,750 $294,750 $294,750 $294,750 $294,750 $294,750 $294,750 $294,750 $294,750 $0 $0 $0 $2,619,750
IBM Lender Business
Process Services, Inc. $536,250 $804,750 $804,750 $804,750 $804,750 $804,750 $804,750 $804,750 $804,750 $804,750 $0 $0 $0 $7,779,000
Magna Composites LLC $59,500 $151,300 $194,650 $235,450 $235,450 $235,450 $0 $0 $0 $0 $0 $0 $0 $1,111,800
Novartis Vaccines and
Diagnostics Inc. $0 $222,750 $310,500 $310,500 $310,500 $310,500 $310,500 $310,500 $310,500 $310,500 $0 $0 $0 $2,706,750
Novo Nordisk
Pharmaceutical Industries,
Inc. $0 $61,500 $72,750 $81,000 $89,250 $89,250 $89,250 $89,250 $89,250 $89,250 $89,250 $0 $0 $840,000
Plastek Industries, Inc. $124,000 $214,000 $234,000 $234,000 $234,000 $234,000 $234,000 $234,000 $234,000 $0 $0 $0 $0 $1,976,000
Siemens Energy, Inc. II $0 $270,750 $814,500 $1,166,250 $1,727,250 $2,222,250 $2,222,250 $2,222,250 $2,222,250 $2,222,250 $2,222,250 $2,222,250 $2,222,250 $21,756,750
Siemens Energy, Inc. III
(Smart Grid) $0 $108,000 $192,750 $275,250 $333,000 $333,000 $333,000 $333,000 $333,000 $333,000 $0 $0 $0 $2,574,000
SPX Corporation $0 $63,000 $135,000 $296,250 $394,500 $466,500 $466,500 $466,500 $466,500 $466,500 $466,500 $466,500 $0 $4,154,250
Timco Aerosystems, LLC$0 $88,400 $141,100 $174,250 $200,600 $238,850 $238,850 $238,850 $238,850 $238,850 $0 $0 $0 $1,798,600
Total $1,168,400 $3,769,950 $5,842,950 $7,189,000 $8,251,350 $8,884,350 $8,648,900 $8,648,900 $8,648,900 $7,936,400 $5,191,800 $4,382,550 $2,536,250 $81,099,700
Attachment A2. Total Annual Grant Caps on Company Portion only
All Projects Awarded in 2010

Calendar Year 2010 Legislative Report 25
Company Name 2010 2011 2012 2013 2014 2015 2016 2017 2018 2019 2020 2021 2022 Total
ABB Inc. $0 $0 $74,500 $80,250 $80,250 $80,250 $80,250 $80,250 $80,250 $80,250 $80,250 $0 $0 $716,500
BAE Technologies, Inc. $0 $55,250 $71,750 $75,250 $75,250 $75,250 $75,250 $75,250 $75,250 $75,250 $0 $0 $0 $653,750
Brunswick Corporation $12,600 $26,250 $36,300 $46,350 $52,500 $52,500 $52,500 $52,500 $52,500 $52,500 $52,500 $52,500 $0 $541,500
Caterpillar Inc. (Butterfly) $0 $22,500 $39,000 $53,850 $61,950 $61,950 $61,950 $61,950 $61,950 $61,950 $61,950 $61,950 $0 $610,950
Caterpillar, Inc. (Camo) $0 $16,250 $86,000 $136,250 $157,000 $166,250 $166,250 $166,250 $166,250 $166,250 $166,250 $166,250 $0 $1,559,250
Celgard, LLC $44,000 $93,750 $125,250 $150,000 $159,750 $159,750 $159,750 $159,750 $159,750 $159,750 $159,750 $0 $0 $1,531,250
Citco Fund Services (USA)
Inc. $0 $63,250 $101,500 $140,500 $179,000 $179,000 $179,000 $179,000 $179,000 $179,000 $0 $0 $0 $1,379,250
Clearwater Paper
Corporation $0 $0 $0 $0 $0 $0 $0 $0 $0 $0 $0 $0 $0 $0
Cree, Inc. II $0 $0 $48,000 $77,500 $77,500 $77,500 $77,500 $77,500 $77,500 $77,500 $77,500 $77,500 $745,500
Hewitt Associates LLC $81,750 $141,000 $159,500 $159,500 $159,500 $159,500 $159,500 $159,500 $159,500 $0 $0 $0 $0 $1,339,250
Husqvarna Professional
Products, Inc. $0 $87,250 $98,250 $98,250 $98,250 $98,250 $98,250 $98,250 $98,250 $98,250 $0 $0 $0 $873,250
IBM Lender Business
Process Services, Inc. $178,750 $268,250 $268,250 $268,250 $268,250 $268,250 $268,250 $268,250 $268,250 $268,250 $0 $0 $0 $2,593,000
Magna Composites LLC $10,500 $26,700 $34,350 $41,550 $41,550 $41,550 $0 $0 $0 $0 $0 $0 $0 $196,200
Novartis Vaccines and
Diagnostics Inc. $0 $74,250 $103,500 $103,500 $103,500 $103,500 $103,500 $103,500 $103,500 $103,500 $0 $0 $0 $902,250
Novo Nordisk
Pharmaceutical Industries,
Inc. $0 $20,500 $24,250 $27,000 $29,750 $29,750 $29,750 $29,750 $29,750 $29,750 $29,750 $0 $0 $280,000
Plastek Industries, Inc. $0 $0 $0 $0 $0 $0 $0 $0 $0 $0 $0 $0 $0 $0
Siemens Energy, Inc. II $0 $90,250 $271,500 $388,750 $575,750 $740,750 $740,750 $740,750 $740,750 $740,750 $740,750 $740,750 $740,750 $7,252,250
Siemens Energy, Inc. III
(Smart Grid) $0 $36,000 $64,250 $91,750 $111,000 $111,000 $111,000 $111,000 $111,000 $111,000 $0 $0 $0 $858,000
SPX Corporation $0 $21,000 $45,000 $98,750 $131,500 $155,500 $155,500 $155,500 $155,500 $155,500 $155,500 $155,500 $1,384,750
Timco Aerosystems, LLC$0 $15,600 $24,900 $30,750 $35,400 $42,150 $42,150 $42,150 $42,150 $42,150 $0 $0 $0 $317,400
Total $327,600 $1,058,050 $1,676,050 $2,068,000 $2,397,650 $2,602,650 $2,561,100 $2,561,100 $2,561,100 $2,401,600 $1,524,200 $1,254,450 $740,750 $23,734,300
Attachment A3. Total Annual Grant Caps on IDF Utility Account Portion
Only Projects Awarded in 2010

Calendar Year 2010 Legislative Report 26
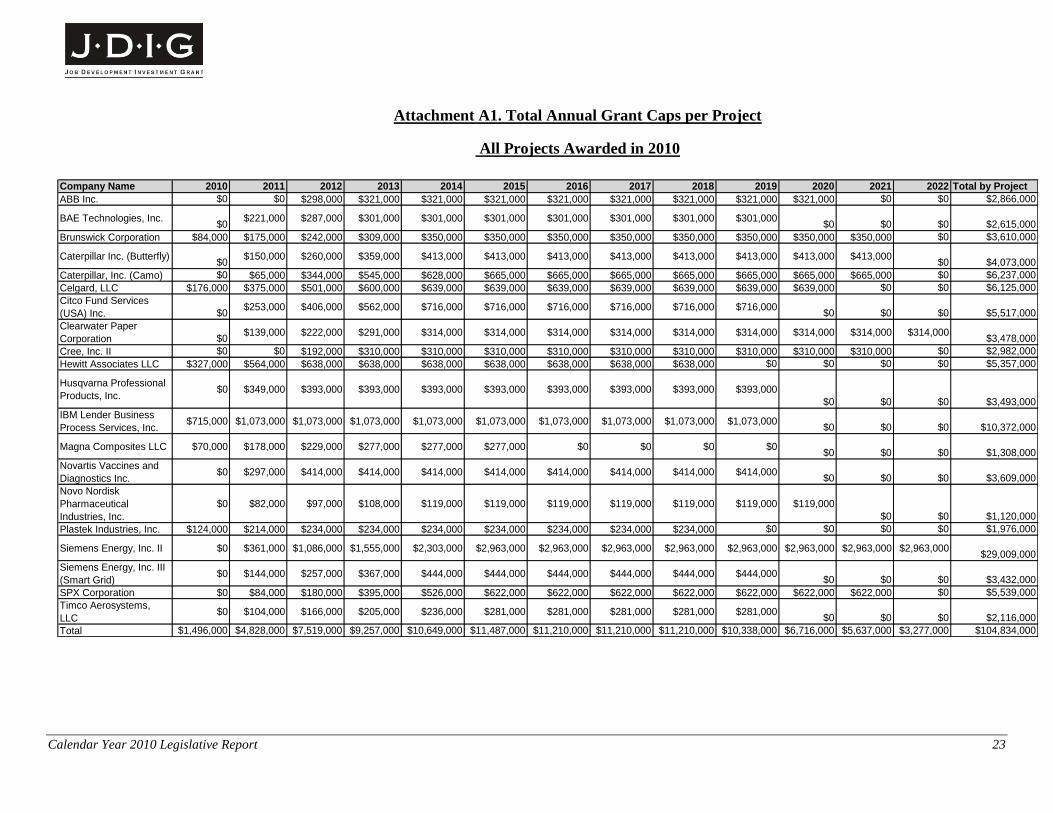
Attachment B. Estimated Lifetime Fiscal and Economic Impacts for Grants
Awarded in CY 2003-2010
Grant Year
Project (Grantee) Grant Years
Direct Jobs
Indirect & induced
Jobs
Total Jobs
Total NC GSP
impact ($millions)
Cumulative Net State Revenue
($millions)
2003 AFG Wipes 10 200 416 616 $194.40 $0.80
2003 General Dynamics 10 405 701 1,106 $616.80 $9.70
2003 General Electric 10 200 174 374 $359.10 $4.80
2003 Goodrich 10 300 560 860 $326.00 $4.40
2003 Infineon (Quimonda) 11 400 268 668 $620.30 $10.30
2003 R H Donnelley 10 275 240 515 $325.30 $6.40
2003 Total (Grant Term is average) 10.2 1,780 2,359 4,139 $2,441.90 $36.40
2004 Altec Industries 11 350 302 652 $240.40 $2.90
2004 Cellco Ptshp/Verizon 10 1,211 1,938 3,149 $1,206.60 $20.70
2004 Citicorp Credit Svcs. 10 900 1,621 2,521 $833.00 $12.50
2004 CS First Boston 10 400 344 744 $2,469.90 $88.40
2004 Cree Inc. 11 300 731 1,031 $902.90 $16.90
2004 Dell Inc. 12 2,000 7,803 9,803 $20,123.40 $610.00
2004 Getrag Corporation 11 302 467 769 $981.50 $34.60
2004 Harris Corp. 10 258 271 529 $3,738.00 $165.00
2004 Hospira 10 152 380 532 $316.80 $8.20
2004 Merck 12 200 360 560 $1,429.60 $20.20
2004 Network Appliances 10 361 410 771 $2,520.40 $98.90
2004 Novo Nordisk Pharma. Ind. 10 187 524 711 $413.80 $4.80
2004 PCB Piezotronics, Inc. 10 250 146 396 $171.20 $2.10
2004 Prairie 10 242 140 564 $444.10 $14.00
2004 Sysco 10 442 731 1,173 $1,576.50 $59.10
2004 Time Warner Entertainment 10 350 305 655 $371.50 $7.30
2004 Unilin 10 330 261 591 $260.60 $4.40
2004 Z F Lemforder 9 200 247 447 $564.30 $20.00

Calendar Year 2010 Legislative Report 27
Grant Year
Project (Grantee) Grant Years
Direct Jobs
Indirect & induced
Jobs
Total Jobs
Total NC GSP
impact ($millions)
Cumulative Net State Revenue
($millions)
2004 Total (Grant Term is average) 10.3 8,435 16,981 25,598 $38,564.50 $1,190.00
2005 AAR 11 500 660 1,160 $837.00 $21.90
2005 AICPA 12 360 179 539 $606.10 $11.30
2005 Cobia Boat Company (Maverick)
10 292 216 508 $302.20 $7.40
2005 General Electric II 10 200 194 394 $555.00 $16.50
2005 GlaxoSmithKline 12 200 593 793 $3,976.90 $171.10
2005 Headway 10 188 642 830 $604.90 $18.10
2005 Hewitt Associates 10 900 645 1,545 $650.80 $9.40
2005 Target 10 580 270 850 $362.60 $5.50
2005 Total (Grant Term is average) 10.6 3,220 3,399 6,619 $7,895.50 $261.20
2006 BSH 10 225 434 659 $404.40 $10.70
2006 Carolina Classifieds 9 287 192 479 $221.80 $5.40
2006 Chris-Craft 10 640 472 1,112 $394.30 $3.20
2006 Credit Suisse Securities 10 400 282 682 $1,021.90 $28.60
2006 Fidelity Global Brokerage 12 2,000 772 2,772 $4,300.30 $93.80
2006 Indian Motorcycle 10 167 153 320 $172.10 $2.60
2006 Lotus 10 108 173 281 $108.50 $4.90
2006 Maersk 11 254 136 390 $1,134.40 $27.50
2006 Malt-O-Meal 10 164 247 411 $351.00 $9.90
2006 MeadWestvaco Corp 10 200 136 336 $578.90 $16.40
2006 Newell Rubbermaid 9 320 800 1,120 $1,036.30 $32.30
2006 Novartis Vaccines & Diagnostics
12 350 1,038 1,388 $1,463.00 $41.20
2006 PGT Industries 10 712 602 1,314 $896.10 $24.20
2006 Quintiles 12 1,000 830 1,830 $962.50 $4.70
2006 Ralph Lauren Media 10 200 43 243 $1,745.90 $77.70
2006 RF Micro Devices 11 300 633 933 $1,324.30 $41.30
2006 Stiefel Research Institute 9 200 136 336 $200.20 $3.60
2006 Volvo 12 264 1,674 1,938 $1,098.40 $25.30

Calendar Year 2010 Legislative Report 28
Grant Year
Project (Grantee) Grant Years
Direct Jobs
Indirect & induced
Jobs
Total Jobs
Total NC GSP
impact ($millions)
Cumulative Net State Revenue
($millions)
2006 Total (Grant Term is average) 10.4 7,791 8,753 16,544 $17,414.30 $453.30
2007 Arneg S.P.A. 9 181 259 440 $167.44 $2.71
2007 Brunswick Corporation 10 858 705 1563 $909.42 $24.18
2007 Force Protection 11 270 356 626 $275.37 $1.84
2007 Honda Aerospace 12 70 116 186 $338.74 $11.46
2007 Honda Aircraft Company 12 283 672 955 $753.88 $12.33
2007 INC Research 9 1,093 927 2,020 $723.81 $4.72
2007 Narricot Industries 9 200 107 307 $276.56 $8.37
2007 Network Appliance, Inc. 10 646 418 1064 $1,079.65 $24.35
2007 PRA International 9 494 419 913 $421.89 $5.01
2007 PRC Industries, Inc. 9 288 405 693 $237.91 $1.21
2007 RF Micro Devices II 11 350 929 1279 $639.79 $9.49
2007 Stone & Webster Services (Shaw)
10 556 496 1,052 $611.44 $7.03
2007 Trans Tech/PharmaCore, Inc. 12 205 1550 1735 $682.23 $5.31
2007 Turbomeca 12 180 297 477 $251.05 $1.99
2007 Total (Grant Term is average) 10.4 5,674 7,656 13,310 $7,369.18 $120.00
2008 Sypris Technologies, Inc. 10
203 171
374
$364.59 $6.37
2008 GE Hitachi Nuclear Energy Americas LLC III
12
900 2,493
3,393
$3,757.29 $62.26
2008 Spirit AeroSystems, Inc 12
1,031 1,437
2,468
$2,944.20 $39.21
2008 Tessera North America, Inc. 9
185 242
427
$237.62 $3.17
2008 Becton Dickinson & Company 9
274 654
928
$446.11 $1.32
2008 IBM LBPS 10
600 749
1,349
$911.92 $16.70
2008 Siemens Medical Group 10
300 168
468
$594.14 $16.78

Calendar Year 2010 Legislative Report 29
Grant Year
Project (Grantee) Grant Years
Direct Jobs
Indirect & induced
Jobs
Total Jobs
Total NC GSP
impact ($millions)
Cumulative Net State Revenue
($millions)
2008 Sutter Street Manufacturing, Inc.
10
820 623
1,443
$757.20 $6.56
2008 Merchant Distributors, Inc 10
200 170
370
$830.60 $28.68
2008 HCL America, Inc. 10
513 341
854
$407.07 $0.84
2008 Fountain Power Boats 11
250 210
460
$245.36 $0.33
2008 Time Warner Cable LP II 9
200 136
336
$440.14 $12.61
2008 Mack Trucks 9
493 597
1,090
$738.06 $9.35
2008 Total (Grant Term is average) 10.1 5,969 7,992 13,961 $12,674.30 $204.18
2009 Asco Power Technologies 9 328 425 753 367.435 4.254
2009 Bayer CropScience LP 9 128 124 252 149.062 0.733
2009 Continental Automotive Systems, Inc.
9 338 368 706 346.103 7.274
2009 DB Global Technologies 11 319 584 903 724.34 13.685
2009 DRS Technical Services, Inc. 9 100 133 233 178.327 5.105
2009 Electrolux Home Products, Inc. 12 738 912 1650 1274.491 13.338
2009 EMC Corporation 9 397 850 1247 751.661 13.468
2009 GMAC 9 200 234 434 271.734 2.086
2009 Innovative Emergency Management, Inc.
12 430 367 797 619.048 9.009
2009 Loparex LLC 9 128 166 294 197.796 1.878
2009 LS Tractors USA, LLC 9 134 105 239 391.231 13.753
2009 Premier, Inc. 9 300 241 541 292.159 5.987
2009 Siemens Energy, Inc. 9 226 147 373 236.21 2.133
2009 Talecris Biotherapeutics, Inc. 12 259 977 1236 714.707 8.187
2009 Toshiba Nuclear Energy Corporation
9 194 126 320 231.98 1.205
2009 Zenta Mortgage Services, LLC 9 1002 883 1885 554.75 2.767
Calendar Year 2010 Legislative Report 30
Grant Year
Project (Grantee) Grant Years
Direct Jobs
Indirect & induced
Jobs
Total Jobs
Total NC GSP
impact ($millions)
Cumulative Net State Revenue
($millions)
2009 Total (Grant Term is average) 9.7 5,221 6,642 11,863 $7,301 $104.86
2010 ABB Inc. 9
130
311
441 $295.0 $6.9
2010 BAE Technologies, Inc. 9
176
157
333 $188.6 $4.5
2010 Brunswick Corporation 12
350
487
837 $290.3 $2.1
2010 Caterpillar Inc. (Butterfly) 11
325
1,320
1,645 $834.3 $23.4
2010 Caterpillar, Inc. (Camo) 11
392
1,125
1,517 $757.5 $13.1
2010 Celgard, LLC 11
289
291
580 $380.7 $4.8
2010 Citco Fund Services (USA) Inc. 9
258
336
594 $223.2 $2.5
2010 Clearwater Paper Corporation 12
250
813
1,063 $762.0 $11.5
2010 Cree, Inc. II 10
244
922
1,166 $762.0 $22.7
2010 Hewitt Associates LLC 9
463
538
1,001 $516.6 $14.0
2010 Husqvarna Professional Products, Inc. 9
160
663
823 $223.8 $3.0
2010 IBM Lender Business Process Services, Inc. 10
600
793
1,393 $731.0 $16.1
2010 Magna Composites LLC 9
327
424
751 $175.3 $2.9
2010 Novartis Vaccines and Diagnostics Inc. 9
100
125
225 $141.0 $1.3
2010 Novo Nordisk Pharmaceutical Industries, Inc. 10
85
145
230 $117.0 $0.8
2010 Plastek Industries, Inc. 9
250
197
447 $264.0 $3.4

Calendar Year 2010 Legislative Report 31
Grant Year
Project (Grantee) Grant Years
Direct Jobs
Indirect & induced
Jobs
Total Jobs
Total NC GSP
impact ($millions)
Cumulative Net State Revenue
($millions)
2010 Siemens Energy, Inc. II 12
825
2,784
3,609 $2,149.0 $32.3
2010 Siemens Energy, Inc. III (Smart Grid) 9
139
173
312 $156.0 $2.5
2010 SPX Corporation 11
180
161
341 $250.0 $4.2
2010 TIMCO Aerosystems, LLC 9
275
421
696 $211.0 $3.2
2010 Total (Grant Term is average) 9.9 5,818 12,186 18,004 $9,428.3 $175.4

Calendar Year 2010 Legislative Report 32
Caveats
The economic impact analysis results are based on a methodology developed by Dr. Mike Walden of North Carolina State University. The Walden
methodology uses accepted economic impact techniques and data from the following sources: the IMPLAN and economic impact models (e.g.,
income and employment multipliers, migration estimates, and local purchase ratios), the project applications, the NC Dept. of Commerce Finance
Center (for estimates of eligible grants and credits), and other secondary sources.
The model is designed to generate conventional estimates of gross economic impact in terms of income and employment. However, the model also
yields a fiscal net benefit figure or an estimate of projected state revenues over costs attributable to a given project. The cost-benefit element of the
methodology is designed to prevent a scenario in which total credits and grants provided to a company exceed total state revenues yielded by the
additional economic activity represented by the project.
No economic impact analysis is infallible. The results depend heavily on the assumptions underlying each case, most of which are subject to some
level of uncertainty. Best practice in impact analysis therefore dictates the adoption of the most conservative assumptions possible in order to avoid
over-estimation of any positive benefits attributed to a given project. This application of the model to the projects outlined in this report follows
that principle.

Calendar Year 2010 Legislative Report 33
Attachment C. Certified JDIG Grantee Report Findings on 2009 Performance
Note: 2009 is the latest year company results have been certified
Term Year
Company Name New Jobs
Job Retention
Avg. Wage Investment Disbursement to Company
Disbursement to Utility
Fund Withholdings
2009 A.F.G. Wipes, Inc. 181 0 $23,158.00 $30,548,324.00 $109,673.00 $0.00 $193,356.00
2009 AAR Manufacturing, Inc. 255 9 $33,870.00 $21,356,301.00 $293,455.00 $0.00 $469,730.00
2009 Ally US LLC 196 285 $197,035.00 $10,590,629.00 $338,250.00 $112,750.00 $1,292,070.00
2009 Altec Industries, Inc. 195 332 $42,312.00 $19,936,317.00 $148,192.00 $0.00 $412,588.00
2009 American Institute of Certified Accountants, Inc. 414 0 $64,200.00 $10,100,000.00 $604,000.00 $201,000.00 $1,533,429.00
2009 Arneg, LLC 35 8 $34,732.00 $0.00 $0.00 $0.00 $57,034.00
2009 ASCO Power Technologies, L.P. 48 211 $26,782.00 $5,576,687.00 $13,061.00 $2,305.00 $26,258.00
2009 Bayer CropScience LP 16 496 $113,594.00 $0.00 $0.00 $0.00 $32,079.00
2009 Becton Dickinson and Company 198 578 $89,225.00 $0.00 $239,169.00 $65,770.00 $667,579.00
2009 Carolina Classifieds.Com LLC 50 29 $36,189.00 $0.00 $0.00 $0.00 $87,394.00
2009 Cellco Partnership d/b/a Verizon Wireless 1342 0 $44,397.00 $39,868,088.00 $800,000.00 $266,666.00 $3,014,127.00
2009 Citicorp Credit Services, Inc. 515 556 $32,393.00 $39,672,988.00 $0.00 $0.00 $828,873.00
2009 Credit Suisse Securities USA LLC (I) 400 436 $80,759.00 $179,656,078.00 $867,209.00 $289,070.00 $1,821,139.00
2009 Credit Suisse Securities USA LLC (II) 436 400 $73,759.00 $69,808,731.00 $790,074.00 $263,358.00 $1,664,044.00
2009 Cree, Inc. I 512 1021 $87,205.00 $332,000,259.00 $586,170.00 $195,390.00 $2,453,353.00
2009 Dex One Corporation 234 305 $115,787.00 $8,266,458.00 $450,000.00 $150,000.00 $1,954,637.00
2009 DRS Technical Services, Inc. 15 203 $52,887.00 $0.00 $0.00 $0.00 $33,237.00
2009 Fidelity Global Brokerage Group, Inc. 1237 1007 $76,341.00 $74,191,163.00 $2,575,851.00 $858,617.00 $5,775,050.00
2009 Fountain Power Boats 0 0 $0.00 $0.00 $0.00 $0.00 $0.00
2009 GE-Hitachi Nuclear Energy Americas LLC 122 1510 $123,854.00 $0.00 $0.00 $0.00 $772,578.00
2009 General Electric Company 200 1432 $119,934.00 $4,464,914.00 $650,000.00 $216,666.00 $1,497,970.00
2009 GETRAG Corporation 0 352 $0.00 $85,168,769.00 $0.00 $0.00 $0.00
2009 Goodrich Corporation 201 199 $66,035.00 $4,250,000.00 $272,426.00 $90,809.00 $728,481.00
2009 HCL America, Inc. 41 33 $61,971.00 $1,117,000.00 $0.00 $0.00 $62,204.00
2009 Honda Aero, Inc. 25 0 $139,552.00 $26,835,257.00 $78,578.00 $13,867.00 $210,522.00
2009 Honda Aircraft Company 237 51 $97,916.00 $0.00 $355,000.00 $118,000.00 $1,287,887.00

Calendar Year 2010 Legislative Report 34
Term Year
Company Name New Jobs
Job Retention
Avg. Wage Investment Disbursement to Company
Disbursement to Utility
Fund Withholdings
2009 Hospira, Inc. 195 2018 $47,103.00 $17,075,434.00 $141,426.00 $47,142.00 $499,303.00
2009 IBM LBPS* 0 0 $0.00 $0.00 $0.00 $0.00 $0.00
2009 INC Research, Inc. 115 362 $59,404.00 $0.00 $0.00 $0.00 $470,330.00
2009 LS Tractors USA, LLC 20 0 $45,997.00 $0.00 $14,511.00 $2,561.00 $30,684.00
2009 Mack Trucks, Inc. 139 1454 $77,127.00 $0.00 $0.00 $0.00 $509,880.00
2009 Maersk Inc. 160 652 $51,836.00 $63,921,534.00 $186,539.00 $62,180.00 $493,803.00
2009 Malt-O-Meal Company 153 0 $44,913.00 $124,081,833.00 $42,000.00 $14,000.00 $314,986.00
2009 Merck Sharp & Dohme Corp. 259 621 $85,718.00 $423,354,150.00 $381,000.00 $126,999.00 $1,049,307.00
2009 NetApp, Inc. I 380 580 $121,710.00 $86,348,754.00 $1,113,750.00 $371,250.00 $2,541,032.00
2009 NetApp, Inc. II 290 670 $117,776.00 $64,066,448.00 $0.00 $0.00 $1,902,586.00
2009 Newell Rubbermaid Inc. 65 378 $133,522.00 $7,615,861.00 $0.00 $0.00 $503,730.00
2009 Novartis Vaccines & Diagnostics, Inc. 206 0 $111,324.00 $0.00 $362,000.00 $121,000.00 $905,173.00
2009 Novo Nordisk Pharmaceutical Industries, Inc. I 82 398 $98,831.00 $146,693,007.00 $0.00 $0.00 $557,961.00
2009 PCB Piezotronics of North Carolina, Inc. 99 0 $24,186.00 $2,657,217.00 $0.00 $0.00 $133,867.00
2009 Pharmaceutical Research Associates, Inc. 149 29 $80,968.00 $2,638,401.00 $0.00 $0.00 $619,453.00
2009 Polo Ralph Lauren Corporation 232 891 $35,097.00 $34,161,024.00 $154,000.00 $51,000.00 $368,672.00
2009 Prairie Packaging, Inc. 303 0 $34,816.00 $0.00 $144,000.00 $47,999.00 $516,128.00
2009 PRC Industries, Inc.* 0 0 $0.00 $0.00 $0.00 $0.00 $0.00
2009 Quintiles Transnational Corp. 415 1170 $82,384.00 $55,779,067.00 $671,000.00 $224,000.00 $1,829,510.00
2009 Siemens Energy, Inc. I 0 768 $0.00 $4,979,420.00 $0.00 $0.00 $0.00
2009 Siemens Medical Solutions USA, Inc. 0 661 $0.00 $0.00 $0.00 $0.00 $0.00
2009 Stiefel Research Institute, Inc. 142 0 $129,404.00 $0.00 $312,254.00 $104,085.00 $1,183,131.00
2009 Stone & Webster Services, LLC 253 780 $126,539.00 $14,218,888.00 $511,906.00 $170,636.00 $1,179,452.00
2009 Sutter Street Manufacturing, Inc. 145 56 $37,878.00 $0.00 $0.00 $0.00 $263,890.00
2009 Sysco Raleigh, LLC 167 995 $77,193.00 $46,593,477.00 $0.00 $0.00 $749,231.00
2009 Target Corporation 474 0 $32,548.00 $157,746,621.00 $397,000.00 $0.00 $684,390.00
2009 Tessera North America, Inc. 38 101 $70,581.00 $18,420,718.00 $0.00 $0.00 $143,071.00
2009 Time Warner Entertainment Company, L.P. I 462 537 $98,354.00 $31,294,366.00 $460,000.00 $153,333.00 $3,090,259.00
2009 Time Warner Entertainment Company, L.P. II 137 862 $75,434.00 $5,566,911.00 $156,392.00 $52,130.00 $352,655.00
2009 Toshiba America Nuclear Energy Corporation 41 0 $207,618.00 $3,327,616.00 $0.00 $0.00 $158,085.00
2009 TransTech Pharma, Inc. 48 125 $76,689.00 $23,368,047.00 $0.00 $0.00 $211,099.00
2009 Turbomeca Manufacturing, Inc. 97 0 $52,950.00 $52,331,829.00 $0.00 $0.00 $258,203.00

Calendar Year 2010 Legislative Report 35
Term Year
Company Name New Jobs
Job Retention
Avg. Wage Investment Disbursement to Company
Disbursement to Utility
Fund Withholdings
2009 Unilin Flooring NC, LLC 147 57 $51,748.00 $106,992,701.00 $0.00 $0.00 $443,283.00
2009 Total
12,518 23,618 $73,450 $2,456,641,287 $ 14,218,886 $ 4,392,583 $ 48,838,773
*Company filed for 2009 but terminated early therefore results for 2009 were not analyzed and/or confirmed. Note: Some companies showing zero dollars of investment may not have been required to submit investment totals at the time of this report. Investment is only required to be reported to the Department of Commerce one time, and is typically done so after the company has completed making initial investments in a project. Often this requirement comes at the end of a company’s base period/job creation period.

Calendar Year 2010 Legislative Report 36
Attachment D. Disbursements for Grants Awarded in CY 2003-2010
Year Company Name Company Utility Fund Total
Disbursement
2005 A.F.G. Wipes, Inc. $53,781.00 $0.00 $53,781.00
2006 A.F.G. Wipes, Inc. $36,149.00 $0.00 $36,149.00
2008 A.F.G. Wipes, Inc. $0.00 $0.00 $0.00
2007 A.F.G. Wipes, Inc. $0.00 $0.00 $0.00
2009 A.F.G. Wipes, Inc. $109,673.00 $0.00 $109,673.00
2007 AAR Manufacturing, Inc. $110,000.00 $0.00 $110,000.00
2008 AAR Manufacturing, Inc. $200,000.00 $0.00 $200,000.00
2009 AAR Manufacturing, Inc. $293,455.00 $0.00 $293,455.00
2009 Ally US LLC $338,250.00 $112,750.00 $451,000.00
2006 Altec Industries, Inc. $48,000.00 $0.00 $48,000.00
2007 Altec Industries, Inc. $77,000.00 $0.00 $77,000.00
2008 Altec Industries, Inc. $126,000.00 $0.00 $126,000.00
2009 Altec Industries, Inc. $148,192.00 $0.00 $148,192.00
2006 American Institute of Certified Accountants, Inc. $184,781.00 $61,593.00 $246,374.00
2007 American Institute of Certified Accountants, Inc. $604,000.00 $201,000.00 $805,000.00
2008 American Institute of Certified Accountants, Inc. $604,000.00 $201,000.00 $805,000.00
2009 American Institute of Certified Accountants, Inc. $604,000.00 $201,000.00 $805,000.00
2008 Arneg, LLC $0.00 $0.00 $0.00
2009 Arneg, LLC $0.00 $0.00 $0.00
2009 ASCO Power Technologies, L.P. $13,061.00 $2,305.00 $15,366.00
2009 Bayer CropScience LP $0.00 $0.00 $0.00
2009 Becton Dickinson and Company $239,169.00 $65,770.00 $304,939.00
2007 Brunswick Corporation $83,524.00 $27,841.00 $111,365.00
2007 Carolina Classifieds.Com LLC $0.00 $0.00 $0.00
2008 Carolina Classifieds.Com LLC $0.00 $0.00 $0.00
2009 Carolina Classifieds.Com LLC $0.00 $0.00 $0.00
2005 Cellco Partnership d/b/a Verizon Wireless $680,000.00 $226,666.00 $906,666.00
2006 Cellco Partnership d/b/a Verizon Wireless $800,000.00 $266,666.00 $1,066,666.00
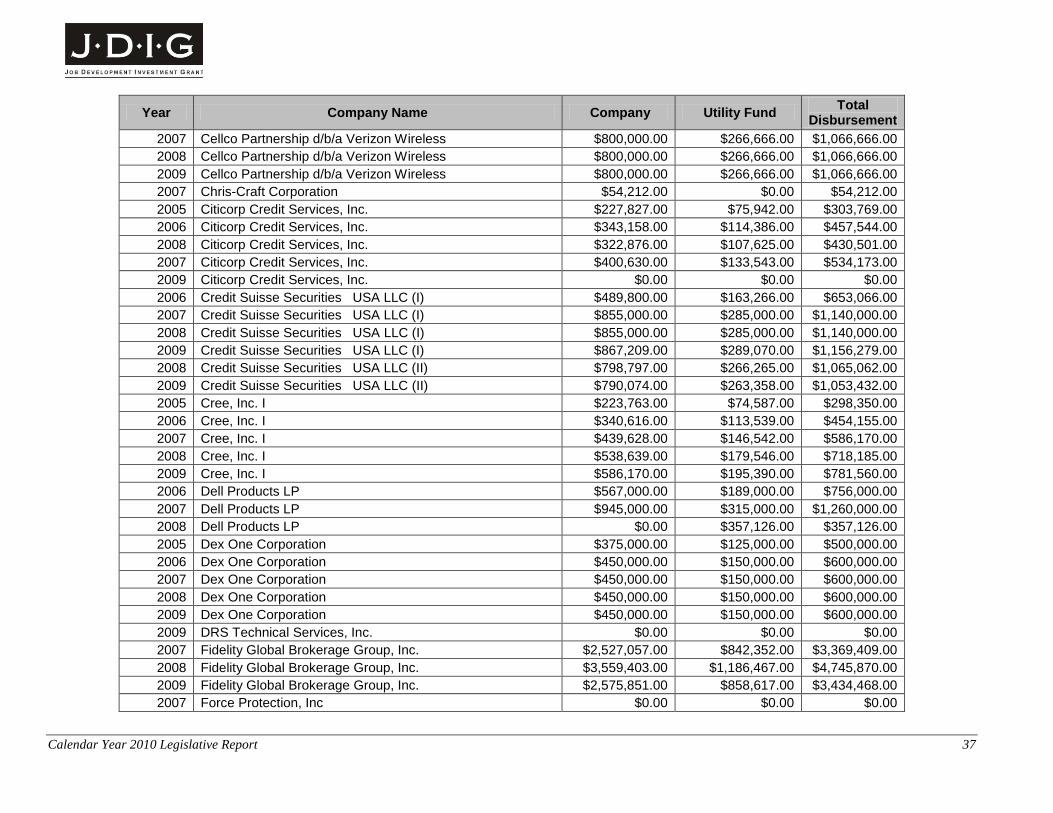
Calendar Year 2010 Legislative Report 37
Year Company Name Company Utility Fund Total
Disbursement
2007 Cellco Partnership d/b/a Verizon Wireless $800,000.00 $266,666.00 $1,066,666.00
2008 Cellco Partnership d/b/a Verizon Wireless $800,000.00 $266,666.00 $1,066,666.00
2009 Cellco Partnership d/b/a Verizon Wireless $800,000.00 $266,666.00 $1,066,666.00
2007 Chris-Craft Corporation $54,212.00 $0.00 $54,212.00
2005 Citicorp Credit Services, Inc. $227,827.00 $75,942.00 $303,769.00
2006 Citicorp Credit Services, Inc. $343,158.00 $114,386.00 $457,544.00
2008 Citicorp Credit Services, Inc. $322,876.00 $107,625.00 $430,501.00
2007 Citicorp Credit Services, Inc. $400,630.00 $133,543.00 $534,173.00
2009 Citicorp Credit Services, Inc. $0.00 $0.00 $0.00
2006 Credit Suisse Securities USA LLC (I) $489,800.00 $163,266.00 $653,066.00
2007 Credit Suisse Securities USA LLC (I) $855,000.00 $285,000.00 $1,140,000.00
2008 Credit Suisse Securities USA LLC (I) $855,000.00 $285,000.00 $1,140,000.00
2009 Credit Suisse Securities USA LLC (I) $867,209.00 $289,070.00 $1,156,279.00
2008 Credit Suisse Securities USA LLC (II) $798,797.00 $266,265.00 $1,065,062.00
2009 Credit Suisse Securities USA LLC (II) $790,074.00 $263,358.00 $1,053,432.00
2005 Cree, Inc. I $223,763.00 $74,587.00 $298,350.00
2006 Cree, Inc. I $340,616.00 $113,539.00 $454,155.00
2007 Cree, Inc. I $439,628.00 $146,542.00 $586,170.00
2008 Cree, Inc. I $538,639.00 $179,546.00 $718,185.00
2009 Cree, Inc. I $586,170.00 $195,390.00 $781,560.00
2006 Dell Products LP $567,000.00 $189,000.00 $756,000.00
2007 Dell Products LP $945,000.00 $315,000.00 $1,260,000.00
2008 Dell Products LP $0.00 $357,126.00 $357,126.00
2005 Dex One Corporation $375,000.00 $125,000.00 $500,000.00
2006 Dex One Corporation $450,000.00 $150,000.00 $600,000.00
2007 Dex One Corporation $450,000.00 $150,000.00 $600,000.00
2008 Dex One Corporation $450,000.00 $150,000.00 $600,000.00
2009 Dex One Corporation $450,000.00 $150,000.00 $600,000.00
2009 DRS Technical Services, Inc. $0.00 $0.00 $0.00
2007 Fidelity Global Brokerage Group, Inc. $2,527,057.00 $842,352.00 $3,369,409.00
2008 Fidelity Global Brokerage Group, Inc. $3,559,403.00 $1,186,467.00 $4,745,870.00
2009 Fidelity Global Brokerage Group, Inc. $2,575,851.00 $858,617.00 $3,434,468.00
2007 Force Protection, Inc $0.00 $0.00 $0.00

Calendar Year 2010 Legislative Report 38
Year Company Name Company Utility Fund Total
Disbursement
2009 Fountain Power Boats $0.00 $0.00 $0.00
2009 GE-Hitachi Nuclear Energy Americas LLC $0.00 $0.00 $0.00
2008 GE-Hitachi Nuclear Energy Americas LLC $199,993.00 $66,664.00 $266,657.00
2005 General Dynamics Armament and Technical Products, Inc. $550,000.00 $183,000.00 $733,000.00
2006 General Dynamics Armament and Technical Products, Inc. $620,000.00 $207,000.00 $827,000.00
2007 General Dynamics Armament and Technical Products, Inc. $685,755.00 $228,585.00 $914,340.00
2007 General Electric Company $650,000.00 $216,666.00 $866,666.00
2006 General Electric Company $710,000.00 $236,666.00 $946,666.00
2005 General Electric Company $589,057.00 $196,353.00 $785,410.00
2008 General Electric Company $650,000.00 $216,666.00 $866,666.00
2009 General Electric Company $650,000.00 $216,666.00 $866,666.00
2007 General Electric Company II $221,120.00 $77,040.00 $298,160.00
2006 General Electric Company II $167,000.00 $56,000.00 $223,000.00
2005 General Electric Company II $23,572.00 $7,857.00 $31,429.00
2005 GETRAG Corporation $16,684.00 $5,561.00 $22,245.00
2006 GETRAG Corporation $49,350.00 $16,450.00 $65,800.00
2007 GETRAG Corporation $153,813.00 $51,271.00 $205,084.00
2008 GETRAG Corporation $177,826.00 $59,275.00 $237,101.00
2009 GETRAG Corporation $0.00 $0.00 $0.00
2005 Goodrich Corporation $213,616.00 $71,205.00 $284,821.00
2006 Goodrich Corporation $219,743.00 $73,248.00 $292,991.00
2007 Goodrich Corporation $243,842.00 $81,281.00 $325,123.00
2008 Goodrich Corporation $241,314.00 $80,438.00 $321,752.00
2009 Goodrich Corporation $272,426.00 $90,809.00 $363,235.00
2005 Harris Stratex Networks Operating Corporation $160,858.00 $53,619.00 $214,477.00
2006 Harris Stratex Networks Operating Corporation $213,023.00 $71,008.00 $284,031.00
2009 HCL America, Inc. $0.00 $0.00 $0.00
2006 Headway Corporation $50,175.00 $13,375.00 $63,550.00
2008 Honda Aero, Inc. $63,000.00 $11,000.00 $74,000.00
2009 Honda Aero, Inc. $78,578.00 $13,867.00 $92,445.00
2008 Honda Aircraft Company $77,000.00 $25,000.00 $102,000.00
2009 Honda Aircraft Company $355,000.00 $118,000.00 $473,000.00

Calendar Year 2010 Legislative Report 39
Year Company Name Company Utility Fund Total
Disbursement
2005 Hospira, Inc. $23,250.00 $7,750.00 $31,000.00
2006 Hospira, Inc. $56,500.00 $18,834.00 $75,334.00
2007 Hospira, Inc. $0.00 $0.00 $0.00
2008 Hospira, Inc. $162,000.00 $54,000.00 $216,000.00
2009 Hospira, Inc. $141,426.00 $47,142.00 $188,568.00
2008 IBM LBPS $0.00 $0.00 $0.00
2009 IBM LBPS $0.00 $0.00 $0.00
2008 INC Research, Inc. $0.00 $0.00 $0.00
2009 INC Research, Inc. $0.00 $0.00 $0.00
2007 Indian Motorcycles $62,870.00 $0.00 $62,870.00
2008 Indian Motorcycles $0.00 $0.00 $0.00
2007 ITG Automotive Safety Textiles, LLC (Narricot Industries) $13,890.00 $0.00 $13,890.00
2008 ITG Automotive Safety Textiles, LLC (Narricot Industries) $0.00 $0.00 $0.00
2009 LS Tractors USA, LLC $14,511.00 $2,561.00 $17,072.00
2009 Mack Trucks, Inc. $0.00 $0.00 $0.00
2006 Maersk Inc. $117,447.00 $39,149.00 $156,596.00
2007 Maersk Inc. $280,000.00 $93,000.00 $373,000.00
2008 Maersk Inc. $308,000.00 $103,000.00 $411,000.00
2009 Maersk Inc. $186,539.00 $62,180.00 $248,719.00
2009 Malt-O-Meal Company $42,000.00 $14,000.00 $56,000.00
2006 Maverick Boat Company, Inc (Cobia Boat) $48,204.00 $0.00 $48,204.00
2007 Maverick Boat Company, Inc (Cobia Boat) $82,512.00 $0.00 $82,512.00
2007 Merck Sharp & Dohme Corp. $140,999.00 $47,000.00 $187,999.00
2008 Merck Sharp & Dohme Corp. $185,000.00 $61,666.00 $246,666.00
2009 Merck Sharp & Dohme Corp. $381,000.00 $126,999.00 $507,999.00
2005 NetApp, Inc. I $236,250.00 $78,750.00 $315,000.00
2006 NetApp, Inc. I $427,500.00 $142,500.00 $570,000.00
2007 NetApp, Inc. I $648,750.00 $216,250.00 $865,000.00
2008 NetApp, Inc. I $881,250.00 $293,750.00 $1,175,000.00
2009 NetApp, Inc. I $1,113,750.00 $371,250.00 $1,485,000.00
2008 NetApp, Inc. II $572,364.00 $190,788.00 $763,152.00
2009 NetApp, Inc. II $0.00 $0.00 $0.00
2007 Newell Rubbermaid Inc. $299,908.00 $99,969.00 $399,877.00

Calendar Year 2010 Legislative Report 40
Year Company Name Company Utility Fund Total
Disbursement
2008 Newell Rubbermaid Inc. $522,000.00 $174,000.00 $696,000.00
2009 Newell Rubbermaid Inc. $0.00 $0.00 $0.00
2008 Novartis Vaccines & Diagnostics, Inc. $192,000.00 $64,000.00 $256,000.00
2009 Novartis Vaccines & Diagnostics, Inc. $362,000.00 $121,000.00 $483,000.00
2005 Novo Nordisk Pharmaceutical Industries, Inc. I $36,750.00 $12,250.00 $49,000.00
2006 Novo Nordisk Pharmaceutical Industries, Inc. I $93,000.00 $31,000.00 $124,000.00
2007 Novo Nordisk Pharmaceutical Industries, Inc. I $0.00 $0.00 $0.00
2009 Novo Nordisk Pharmaceutical Industries, Inc. I $0.00 $0.00 $0.00
2008 Novo Nordisk Pharmaceutical Industries, Inc. I $0.00 $0.00 $0.00
2006 PCB Piezotronics of North Carolina, Inc. $72,000.00 $0.00 $72,000.00
2007 PCB Piezotronics of North Carolina, Inc. $97,621.00 $0.00 $97,621.00
2008 PCB Piezotronics of North Carolina, Inc. $93,436.00 $0.00 $93,436.00
2009 PCB Piezotronics of North Carolina, Inc. $0.00 $0.00 $0.00
2006 PGT Industries, Inc. $35,689.00 $0.00 $35,689.00
2007 PGT Industries, Inc. $0.00 $0.00 $0.00
2008 PGT Industries, Inc. $0.00 $0.00 $0.00
2008 Pharmaceutical Research Associates, Inc. $0.00 $0.00 $0.00
2009 Pharmaceutical Research Associates, Inc. $0.00 $0.00 $0.00
2008 Polo Ralph Lauren Corporation $140,000.00 $46,000.00 $186,000.00
2009 Polo Ralph Lauren Corporation $154,000.00 $51,000.00 $205,000.00
2006 Prairie Packaging, Inc. $50,000.00 $16,666.00 $66,666.00
2007 Prairie Packaging, Inc. $86,999.00 $29,000.00 $115,999.00
2008 Prairie Packaging, Inc. $116,000.00 $38,666.00 $154,666.00
2009 Prairie Packaging, Inc. $144,000.00 $47,999.00 $191,999.00
2009 PRC Industries, Inc. $0.00 $0.00 $0.00
2005 Qimonda (formerly Infineon) $489,326.00 $163,108.00 $652,434.00
2009 Quintiles Transnational Corp. $671,000.00 $224,000.00 $895,000.00
2008 Quintiles Transnational Corp. $299,000.00 $100,000.00 $399,000.00
2006 RF Micro Devices, Inc. I $108,143.00 $36,047.00 $144,190.00
2007 RF Micro Devices, Inc. I $319,000.00 $107,000.00 $426,000.00
2008 RF Micro Devices, Inc. I $0.00 $0.00 $0.00
2008 RF Micro Devices, Inc. II $0.00 $0.00 $0.00
2009 Siemens Energy, Inc. I $0.00 $0.00 $0.00

Calendar Year 2010 Legislative Report 41
Year Company Name Company Utility Fund Total
Disbursement
2009 Siemens Medical Solutions USA, Inc. $0.00 $0.00 $0.00
2006 Stiefel Research Institute, Inc. $47,000.00 $15,000.00 $62,000.00
2007 Stiefel Research Institute, Inc. $248,000.00 $82,000.00 $330,000.00
2008 Stiefel Research Institute, Inc. $251,550.00 $83,850.00 $335,400.00
2009 Stiefel Research Institute, Inc. $312,254.00 $104,085.00 $416,339.00
2009 Stone & Webster Services, LLC $511,906.00 $170,636.00 $682,542.00
2008 Stone & Webster Services, LLC $208,500.00 $69,500.00 $278,000.00
2009 Sutter Street Manufacturing, Inc. $0.00 $0.00 $0.00
2006 Sysco Raleigh, LLC $141,463.00 $47,155.00 $188,618.00
2007 Sysco Raleigh, LLC $339,750.00 $113,250.00 $453,000.00
2009 Sysco Raleigh, LLC $0.00 $0.00 $0.00
2008 Sysco Raleigh, LLC $363,156.00 $121,052.00 $484,208.00
2009 Target Corporation $397,000.00 $0.00 $397,000.00
2008 Tessera North America, Inc. $23,832.00 $7,944.00 $31,776.00
2009 Tessera North America, Inc. $0.00 $0.00 $0.00
2005 Time Warner Entertainment Company, L.P. I $360,000.00 $120,000.00 $480,000.00
2006 Time Warner Entertainment Company, L.P. I $414,000.00 $138,000.00 $552,000.00
2007 Time Warner Entertainment Company, L.P. I $460,000.00 $153,333.00 $613,333.00
2008 Time Warner Entertainment Company, L.P. I $460,000.00 $153,333.00 $613,333.00
2009 Time Warner Entertainment Company, L.P. I $460,000.00 $153,333.00 $613,333.00
2009 Time Warner Entertainment Company, L.P. II $156,392.00 $52,130.00 $208,522.00
2009 Toshiba America Nuclear Energy Corporation $0.00 $0.00 $0.00
2008 TransTech Pharma, Inc. $41,796.00 $13,932.00 $55,728.00
2009 TransTech Pharma, Inc. $0.00 $0.00 $0.00
2008 Turbomeca Manufacturing, Inc. $77,589.00 $25,863.00 $103,452.00
2009 Turbomeca Manufacturing, Inc. $0.00 $0.00 $0.00
2005 Unilin Flooring NC, LLC $53,000.00 $17,666.00 $70,666.00
2006 Unilin Flooring NC, LLC $97,000.00 $32,333.00 $129,333.00
2007 Unilin Flooring NC, LLC $149,000.00 $49,666.00 $198,666.00
2008 Unilin Flooring NC, LLC $174,720.00 $58,240.00 $232,960.00
2009 Unilin Flooring NC, LLC $0.00 $0.00 $0.00
2007 Volvo Construction Equipment $69,247.00 $23,082.00 $92,329.00
2005 ZF Lemforder Corporation $3,685.00 $1,229.00 $4,914.00

Calendar Year 2010 Legislative Report 42
Year Company Name Company Utility Fund Total
Disbursement
2006 ZF Lemforder Corporation $91,149.00 $30,383.00 $121,532.00
2007 ZF Lemforder Corporation $120,590.00 $40,197.00 $160,787.00

Calendar Year 2010 Legislative Report 43
Attachment E: Withdrawn/Terminated Projects*
Status Date Company Name
5. Awarded-Withdrawn Andrew Corporation
5. Awarded-Withdrawn Reliance Industries Ltd
5. Awarded-Withdrawn Smiths Aerospace
5. Awarded-Withdrawn Superior Essex, Inc.
5. Awarded-Withdrawn 12/4/2008 Google, Inc.(formerly Madras Integration, LLC)
6. Awarded-Terminated 11/15/2007 Lenovo, Inc. I
6. Awarded-Terminated 1/23/2008 GlaxoSmithKline Beecham Corporation
6. Awarded-Terminated 3/13/2008 Qimonda (formerly Infineon)
6. Awarded-Terminated 4/5/2008 Skybus Airlines, Inc.
6. Awarded-Terminated 12/4/2008 Chris-Craft Corporation
6. Awarded-Terminated 4/6/2009 Brunswick Corporation*
6. Awarded-Terminated 6/20/2009 Harris Stratex Networks Operating Corporation
6. Awarded-Terminated 12/29/2009 Hewitt Associates, LLC
6. Awarded-Terminated 2/25/2010 Dell Products LP
6. Awarded-Terminated 2/25/2010 Fountain Power Boats
6. Awarded-Terminated 2/25/2010 ITG Automotive Safety Textiles, LLC (Narricot Industries)
6. Awarded-Terminated 2/25/2010 Volvo Construction Equipment
6. Awarded-Terminated 3/18/2010 BSH Home Appliances Corporation
6. Awarded-Terminated 3/31/2010 Force Protection, Inc
6. Awarded-Terminated 3/31/2010 General Dynamics Armament and Technical Products, Inc.
6. Awarded-Terminated 3/31/2010 Headway Corporation
6. Awarded-Terminated 3/31/2010 RF Micro Devices, Inc. II
6. Awarded-Terminated 4/8/2010 IBM LBPS*
6. Awarded-Terminated 5/13/2010 General Electric Company II
6. Awarded-Terminated 5/13/2010 Mead Westvaco Corporation
6. Awarded-Terminated 5/13/2010 PGT Industries, Inc.
6. Awarded-Terminated 5/13/2010 PRC Industries, Inc.
6. Awarded-Terminated 6/10/2010 ZF Lemforder Corporation
6. Awarded-Terminated 6/14/2010 Lotus Engineering, Inc.
6. Awarded-Terminated 8/12/2010 Citicorp Credit Services, Inc.
6. Awarded-Terminated 8/12/2010 Novo Nordisk Pharmaceutical Industries, Inc. I*

Calendar Year 2010 Legislative Report 44
Status Date Company Name
6. Awarded-Terminated 10/14/2010 Goodrich Corporation
6. Awarded-Terminated 10/14/2010 Indian Motorcycles
6. Awarded-Terminated 11/5/2010 Maverick Boat Company, Inc (Cobia Boat)
6. Awarded-Terminated 12/9/2010 RF Micro Devices, Inc. I
* Company has been awarded more than one grant, of which only one has been terminate and/or withdrawn. Company repaid first grant as a condition of receiving second grant. Note: Companies that cease operations in North Carolina within a specified period after receiving grant payments (150% of the grant periods) are required to repay grant payments.