2010 AGRICULTURAL CROP REPORT - Madera County
20
2010 AGRICULTURAL CROP REPORT 2010 AGRICULTURAL CROP REPORT 2010 AGRICULTURAL CROP REPORT MADERA COUNTY DEPARTMENT OF AGRICULTURE MADERA COUNTY DEPARTMENT OF AGRICULTURE MADERA COUNTY DEPARTMENT OF AGRICULTURE
Transcript of 2010 AGRICULTURAL CROP REPORT - Madera County

2010 AGRICULTURAL CROP REPORT2010 AGRICULTURAL CROP REPORT2010 AGRICULTURAL CROP REPORT MADERA COUNTY DEPARTMENT OF AGRICULTUREMADERA COUNTY DEPARTMENT OF AGRICULTUREMADERA COUNTY DEPARTMENT OF AGRICULTURE
BRANDS AND THEIR HISTORYBRANDS AND THEIR HISTORYBRANDS AND THEIR HISTORY
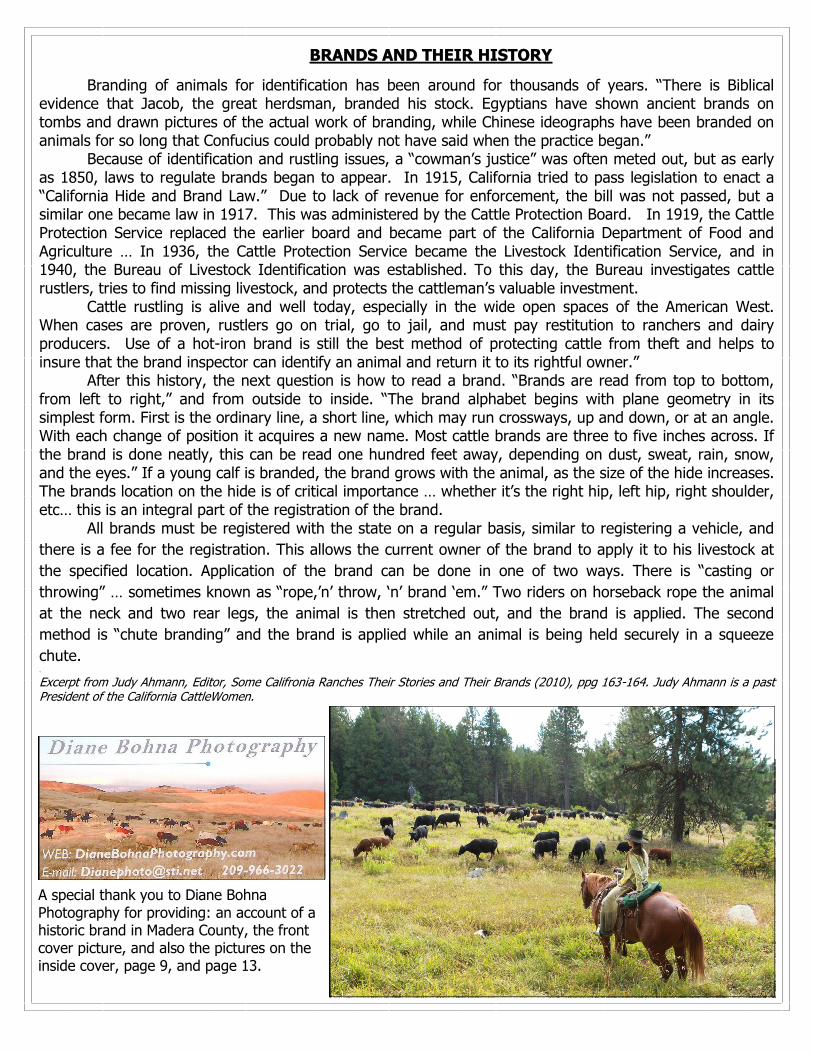
Branding of animals for identification has been around for thousands of years. “There is Biblical evidence that Jacob, the great herdsman, branded his stock. Egyptians have shown ancient brands on tombs and drawn pictures of the actual work of branding, while Chinese ideographs have been branded on animals for so long that Confucius could probably not have said when the practice began.”
Because of identification and rustling issues, a “cowman‟s justice” was often meted out, but as early as 1850, laws to regulate brands began to appear. In 1915, California tried to pass legislation to enact a “California Hide and Brand Law.” Due to lack of revenue for enforcement, the bill was not passed, but a similar one became law in 1917. This was administered by the Cattle Protection Board. In 1919, the Cattle Protection Service replaced the earlier board and became part of the California Department of Food and Agriculture … In 1936, the Cattle Protection Service became the Livestock Identification Service, and in 1940, the Bureau of Livestock Identification was established. To this day, the Bureau investigates cattle rustlers, tries to find missing livestock, and protects the cattleman‟s valuable investment.
Cattle rustling is alive and well today, especially in the wide open spaces of the American West. When cases are proven, rustlers go on trial, go to jail, and must pay restitution to ranchers and dairy producers. Use of a hot-iron brand is still the best method of protecting cattle from theft and helps to insure that the brand inspector can identify an animal and return it to its rightful owner.” After this history, the next question is how to read a brand. “Brands are read from top to bottom, from left to right,” and from outside to inside. “The brand alphabet begins with plane geometry in its simplest form. First is the ordinary line, a short line, which may run crossways, up and down, or at an angle. With each change of position it acquires a new name. Most cattle brands are three to five inches across. If the brand is done neatly, this can be read one hundred feet away, depending on dust, sweat, rain, snow, and the eyes.” If a young calf is branded, the brand grows with the animal, as the size of the hide increases. The brands location on the hide is of critical importance … whether it‟s the right hip, left hip, right shoulder, etc… this is an integral part of the registration of the brand. All brands must be registered with the state on a regular basis, similar to registering a vehicle, and
there is a fee for the registration. This allows the current owner of the brand to apply it to his livestock at
the specified location. Application of the brand can be done in one of two ways. There is “casting or
throwing” … sometimes known as “rope,‟n‟ throw, „n‟ brand „em.” Two riders on horseback rope the animal
at the neck and two rear legs, the animal is then stretched out, and the brand is applied. The second
method is “chute branding” and the brand is applied while an animal is being held securely in a squeeze
chute. .
Excerpt from Judy Ahmann, Editor, Some Califronia Ranches Their Stories and Their Brands (2010), ppg 163-164. Judy Ahmann is a past President of the California CattleWomen.
A special thank you to Diane Bohna Photography for providing: an account of a historic brand in Madera County, the front cover picture, and also the pictures on the inside cover, page 9, and page 13.

332 Madera Avenue · Madera, CA 93637-5499 · Phone (559) 675-7876 · Fax (559) 674-4071
Karen Ross, Secretary California Department of Food and Agriculture
and
The Honorable Board of Supervisors
Frank Bigelow, Ronn Dominici, Max Rodriguez, David Rogers, and Tom Wheeler
In accordance with the provisions of Section 2279 of the California Food and Agricultural Code, I am pleased to submit the 2010 Agricultural Crop Report for Madera County. It must be emphasized that the values presented in this report reflect gross returns only and do not in any manner reflect net income or loss to producers.
The gross value of Madera County‟s agricultural production in 2010 was $1,348,505,000. This represents an overall increase of $384,969,000 (39.9%) over the revised 2009 production levels.
The Fruit and Nut Crop category was largely responsible for pushing production levels back over the billion dollar mark with a remarkable 50.8% increase. Leading the way in this category was the number one commodity, Almonds (nuts and hulls) valued at $270,916,000. Pistachios made a strong comeback from 2009 with a 192% increase to $239,702,000. Dairy prices rebounded and Milk remained the third ranking commodity with an overall value of $236,610,000. Grapes showed modest gains despite reduced acreage but dropped to the number four position at $232,740,000. Cattle and Calves remained Madera County‟s fifth highest individual commodity at $43,586,000.
Over the past century and a half, raising livestock has had a lasting impact on Madera County‟s economy and lifestyle. The 2010 Crop Report is dedicated to the tradition of ranching in Madera County.
The preparation of a report of this type requires extensive collaboration, and I sincerely appreciate the contributions of our growers, the UC Cooperative Extension, and my staff. In particular, I would like to thank Senior Agricultural & Standards Inspector, Cha Vang, for his assistance with crop surveys throughout the year and for compilation of this report.
Respectfully Submitted,
Robert J. Rolan
Agricultural Commissioner/
Sealer of Weights and Measures
Madera County Department of Agriculture
Weights and Measures
Robert J. Rolan, Agricultural Commissioner
Sealer of Weight and Measures
Jay Seslowe, Assistant Agricultural
Commissioner/Sealer

TABLE OF CONTENTS
Brands & Their History Inside Front Cover
Letter from Commissioner 1
Ten Leading Crops 3
Brands of California Missions 4
Madera County Highlights 5
Field Crops 6
Vegetable Crops 7
Fruit & Nut Crops 8
Forest Products 10
Nursery Products 10
Apiary Products 10
Livestock & Poultry 11
Livestock & Poultry Products 11
Sustainable Agriculture Report 12
Crop Report Summary 14
1st brands registered in each county in California 15
Historic Brand of Madera County 16
Chowchilla Western Stampede Inside Back Cover
MADERA COUNTY DEPARTMENT OF AGRICULTURE
MADERA COUNTY STAFF
Madera County Board of Supervisors
Frank Bigelow District 1
David Rogers District 2
Ronn Dominici District 3
Max Rodriguez
District 4
Tom Wheeler District 5
County Administrative Officer
Eric Fleming
Agricultural Commissioner/ Sealer of Weights & Measures
Robert J. Rolan
Assistant Agricultural Commissioner/Sealer
Jay Seslowe
Deputy Agricultural Commissioner
Melissa Cregan
Agricultural & Standards Inspectors
Jason Contreras Lance B. Hofer
Judy Cumming Sharon Seslowe Molly Glover Cha Vang
Andrea L. Hardy
Agricultural & Standards Technicians
Bobby Arias Gabriel Mejia
Administrative Support Staff
Lore Ciuffoli, Administrative Analyst
Tammy Dodson, Program Assistant II Mary Arias, Program Assistant I
Pest Detection Trappers
Justin Betts Charles Reiring, Jr. Gloria Johnson Ron Uyeno
Peter Konovalov Rosie Valdovinos Alan Pehl

Diversity, which serves to strengthen the agricultural economy of Madera County, is evident in this
listing of our Ten Leading Crops, which include fruit and nut crops, milk, dairy and beef cattle,
nursery stock, field crops, poultry and apiary pollination. The wide range of commodities produced in
our county is further underscored by that segment on the chart entitled "Other," which includes such
diverse products as corn, cotton, figs, stone fruit, tomatoes, timber and sheep.
TEN LEADING CROPS
MADERA COUNTY 2010
Commodity
2010 Rank
2010 Dollar Value
2009 Rank
Almonds, Nuts & Hulls 1 $270,916,000 2
Pistachios 2 $239,702,000 4
Milk 3 $236,610,000 3
Grapes 4 $232,740,000 1
Cattles & Calves 5 $43,586,000 5
Replacement Heifers 6 $38,252,000 6
Pollination 7 $26,410,000 10
Alfalfa, Hay & Silage 8 $25,534,000 8
Nursery Stock 9 $24,445,000 7
Poultry 10 $22,994,000 9
Almonds, Nuts & Hulls, $270,916,000
Pistachios, $239,702,000
Milk, $236,610,000
Grapes, $232,740,000
Cattle & Calves, $43,586,000
Replacement Heifers, $38,252,000
Pollination, $26,410,000
Alfalfa, Hay & Silage, $25,534,000
Nursery Stock, $24,445,000
Poultry, $22,994,000
Other, $187,316,000


MADERA COUNTY
HIGHLIGHTS
County Established March 11, 1893
County Seat Madera (city)
Populationa 150,865
Total County Acreageb 1,366,951
2010 Harvested Acreage 663,930
Field Crop Acreage 105,400
Fruit and Nut Acreage 199,970
Nursery Acreage 840
Vegetable Acreage 4,720
Rangeland Acreage 353,000
Forest Acreage 414,300
U. S. Parkland Acreage 83,000
Bordering Counties
Merced County Northwest
Mariposa County North
Mono County East
Fresno County South and West
Ranking of Madera County Among Counties of California
Populationa 33
Total Acreage 24
Total Agricultural Productionc 14
Commodity, by Value
Figs 1
Grapes, Raisin Variety 2
Pistachios 4
Almonds 5
Grapes, Table Variety 5
Cattle & Calves 7
Corn, Silage 7
Olives 7
Grapes, Wine Variety 8
Milk, Market 9
Ranking of Madera County Among Counties of the United States
Total Agricultural Productionb 21
a/ US Bureau of Census, 2010 Estimate
b/ USDA Ag Census, 2007
c/ County Agricutural Commissioners's Data, 2009
* Madera County Crop Reports from 2001 to 2010 are available at:
http://www.madera-county.com/agcommissioner/cropreports/index.html

PRODUCTION VALUE
Item Year Harvested
Acreage
Per Acre
Total Unit
Per Unit Total
Alfalfa
Hay 2010 28,900 6.09 176,001 Ton $133.00 $23,408,000
2009 30,000 7.00 210,000 Ton 113.00 23,730,000 2008 33,400 7.05 235,470 Ton 205.00 48,271,000
Silagea 2010 62,522 Ton 34.00 2,126,000 2009 52,710 Ton 30.00 1,581,000 2008 39,700 Ton 53.00 2,104,000
Total 2010 28,900 25,534,000
2009 30,000 25,311,000
2008 33,400 50,375,000
Beans, Dryb 2010 - - - - - - 2009 620 1.51 936 Ton 742.00 695,000
2008 - - - - - -
Corn
Grain 2010 1,100 5.49 6,039 Ton 192.00 1,159,000
2009 1,100 5.51 6,061 Ton 178.00 1,079,000
2008 2,000 6.41 12,820 Ton 213.00 2,731,000
Silage 2010 21,300 26.94 573,822 Ton 30.00 17,215,000
2009 19,700 25.25 497,425 Ton 25.00 12,436,000
2008 27,300 26.11 712,803 Ton 37.00 26,374,000
Total 2010 22,400 18,374,000
2009 20,800 13,515,000
2008 29,300 29,105,000
Cotton
Lint 2010 4,100
1,561c 13,334 Baled 1.20e 7,680,000
2009 330 1,123 772 Bale 0.72 267,000
2008 2,500 1,139 5,932 Bale 0.76 2,164,000
Seed 2010 5,328 Ton 237.00 1,263,000
2009 310 Ton 290.00 90,000
2008 2,400 Ton 335.00 804,000
Oat
Hay 2010 3,100 2.08 6,448 Ton 81.00 522,000
2009 3,400 2.14 7,276 Ton 72.00 524,000
2008 5,300 2.04 10,812 Ton 163.00 1,762,000
Pasture
Irrigated 2010 3,300 Acre 150.00 495,000
2009 3,300 Acre 150.00 495,000
2008 3,500 Acre 150.00 525,000
Rangeland 2010 353,000 Acre 12.00 4,236,000
2009 353,000 Acre 12.00 4,236,000
2008 353,000 Acre 12.00 4,236,000
6
FIELD CROPS

PRODUCTION VALUE
Item Year Harvested
Acreage Per
Acre Total Unit
Per Unit
Total
Wheat
Grain 2010 14,200 2.40 34,080 Ton $182.00 $6,203,000 2009 6,000 2.46 14,760 Ton 245.00 3,616,000 2008 5,200 2.71 14,092 Ton 251.00 3,537,000
Silage 2010 17,800 14.98 266,644 Ton 21.00 5,600,000 2009 16,500 14.40 237,600 Ton 18.00 4,277,000 2008 19,200 15.09 289,728 Ton 29.00 8,402,000
Total 2010 32,000 11,803,000 2009 22,500 7,893,000 2008 24,400 11,939,000
Winter Forage 2010 2,700 16.81 45,387 Ton 20.00 908,000 2009 3,400 12.17 41,378 Ton 18.00 745,000 2008 2,900 14.24 41,296 Ton 27.00 1,115,000
Miscellaneousf 2010 8,900 8,601,000 2009 12,100 7,451,000
2008 9,300 5,943,000
TOTAL 2010 458,400 $79,416,000 2009 449,450 61,222,000*
2008 463,600 107,968,000
a/ Alfalfa acreage yields both hay and silage d/ Bale: 480 pounds
b/ Includes Black-eyes, Kidneys and Limas. 2008 & e/ Per pound
2010 acreage & value included in Miscellaneous f/ Includes barley (hay & silage), seed crops, Sudan grass, wheat
c/ Pounds hay, field and stubble straw. Beans, Dry included in 2008 & 2010
PRODUCTION VALUE
Item Year Harvested
Acreage Per
Acre Total Unit
Per Unit
Total
Tomatoes
Fresh 2010 320 16.22 5,190 Ton $425.00 $2,206,000 2009 400 15.80 6,320 Ton 441.00 2,787,000 2008 300 15.26 4,578 Ton 462.00 2,115,000
Processed 2010 2,700 49.17 132,759 Ton 64.00 8,497,000 2009 2,000 39.52 79,040 Ton 81.00 6,402,000 2008 1,900 39.73 75,487 Ton 70.00 5,284,000
Miscellaneousa 2010 1,700 12,572,000 2009 1,740 8,156,000
2008 720 6,854,000
TOTAL 2010 4,720 $23,275,000 2009 4,140 17,345,000
2008 2,920 14,253,000
a/ Includes artichokes, carrots, all cabbage, eggplant, herbs, melons, onions, all peppers, potatoes, all squash
and miscellaneous truck crops
7
* Revised
Pumpkins: by Thomas Hagopian/Grower
VEGETABLE CROPS
FIELD CROPS

FRUIT & NUT CROPS
PRODUCTION VALUE
Item Year Harvested
Acreage
Per Acre Total Unit
Per Unit Total
Almondsa 2010 80,000 0.91 72,800b Ton $3,501.00 $254,873,000 2009 68,000 0.79 53,720 Ton 3,018.00 162,127,000
2008 66,800 1.05 70,140 Ton 2,769.00 194,218,000
Almond Hulls 2010 155,758 Ton 103.00 16,043,000
2009 114,936 Ton 86.00 9,884,000
2008 150,067 Ton 120.00 18,008,000
Cherries 2010 400 5.23 2,092 Ton 2,713.00 5,676,000
2009 380 4.84 1,839 Ton 2,648.00 4,870,000
2008 360 3.83 1,379 Ton 2,873.00 3,962,000
Figs 2010 6,750 1.95 13,163 Ton 1,518.00 19,981,000
2009 6,280 1.70 10,676 Ton 1,511.00 16,131,000
2008 6,000 1.66 9,960 Ton 1,690.00 16,832,000
Grapes
Raisin Varieties
Crushed 2010 10,000 9.29 92,900 Ton 212.00 19,695,000
2009 10,900 7.60 82,840 Ton 165.00 13,669,000
2008 13,300 10.24 136,192 Ton 220.00 29,962,000
Dried 2010 21,000 2.60 54,600 Ton 1,321.00 72,127,000
2009 21,100 2.80 59,080 Ton 1,139.00 67,292,000
2008 21,000 2.99 62,790 Ton 1,073.00 67,374,000
Fresh 2010 900 10.30 9,270 Ton 1,001.00 9,279,000
2009 1,020 10.05 10,251 Ton 856.00 8,775,000
2008 1,150 8.51 9,787 Ton 885.00 8,661,000
Table Varieties 2010 2,300 9.41 21,643 Ton 1,424.00 30,820,000
2009 2,060 9.90 20,394 Ton 1,510.00 30,795,000
2008 2,200 7.22 15,884 Ton 1,108.00 17,599,000
Wine Varietiesc
Red 2010 22,400 10.25 229,600 Ton 257.00 59,007,000
Varieties 2009 23,500 10.43 254,105 Ton 262.00 64,218,000
2008 24,100 10.10 243,410 Ton 266.00 64,747,000
White 2010 15,200 11.32 172,064 Ton 243.00 41,812,000
Varieties 2009 15,900 10.42 165,678 Ton 248.00 41,088,000
2008 17,800 9.88 175,864 Ton 252.00 44,318,000
Total Grapes 2010 71, 800 232,740,000
2009 74,480 225,837,000* 2008 79,550 232,661,000
Nectarinesd 2010 - - - - - - 2009 - - - - - -
2008 450 6.00 2,700 Ton 670.00 1,809,000
8
* Revised

FRUIT & NUT CROPS
PRODUCTION VALUE
Item Year Harvested
Acreage Per
Acre Total Unit Per
Unit Total
Olives 2010 1,380 4.76 6,569 Ton $793.00 $5,209,000
2009 1,100 0.57 627 Ton 1,116.00 700,000
2008 1,190 4.68 5,569 Ton 891.00 4,962,000
Oranges 2010 3,430 12.74 43,698 Ton 168.00 7,341,000
2009 3,550 12.64 44,872 Ton 187.00 8,391,000
2008 3,630 16.31 59,205 Ton 142.00 8,407,000
Peaches
Cling 2010 320 16.00 5,120 Ton 310.00 1,587,000
2009 340 16.21 5,512 Ton 318.00 1,753,000
2008 350 16.81 5,884 Ton 325.00 1,912,000
Freestone 2010 740 12.84 9,502 Ton 493.00 4,684,000
2009 770 11.48 8,840 Ton 527.00 4,659,000
2008 460 14.57 6,702 Ton 319.00 2,138,000
Pistachios 2010 28,000 1.74 48,720b Ton 4,920.00 239,702,000
2009 27,700 0.84 23,268 Ton 3,520.00 81,903,000
2008 26,900 1.60 43,040 Ton 4,155.00 178,831,000
Plumse 2010 - - - - - -
2009 180 8.55 1,539 Ton 904.00 1,391,000
2008 320 7.52 2,406 Ton 863.00 2,077,000
Plums, Dried 2010 1,100 3.62 3,982 Ton 1,437.00 5,722,000
2009 1,290 3.45 4,451 Ton 1,445.00 6,431,000
2008 1,240 3.46 4,290 Ton 1,506.00 6,461,000
Walnuts 2010 1,250 1.78 2,225 Ton 1,867.00 4,154,000
2009 1,200 1.53 1,836 Ton 1,674.00 3,073,000
2008 1,250 1.43 1,788 Ton 1,542.00 2,757,000
Miscellaneous
Fruits & Nutsf 2010 4,800 33,834,000
2009 4,190 23,531,000
2008 2,500 19,950,000
Orchard 2010 6,500 Cord 975,000
Firewood 2009 7,000 Cord 980,000
2008 7,800 Cord 1,170,000
TOTAL 2010 199,970 $832,521,000
2009 189,460 552,033,000 2008 191,000 696,154,000
a/ Meat basis
b/ Reflects total production, including imperfect stock; price weighted accordingly
c/ Includes table grape crushed
9
d/ 2009 & 2010 harvested acreage & value included in Miscellaneous Fruit & Nuts
e/ 2010 harvested acreage & value included in Miscellaneous Fruit & Nuts
f/ Includes apples, apricots, berries, kiwis, nectarines, pears, pecans, persimmons,
pomegranates, tangelos, tangerines, strawberries, almond and walnut shells

FOREST PRODUCTS
PRODUCTION VALUE
Item Year Production Unit Total Value
Timber 2010 3,353 MBF a $225,000 2009 280 MBF 36,000 2008 620 MBF 86,000
Firewood 2010 2,075 Cordb 228,000c
2009 1,380 Cord 287,000
2008 1,253 Cord 262,000
TOTAL 2010 $453,000 2009 323,000
2008 348,000
a/ Thousand Board Feet c/ Includes value for Christmas trees, greenery, pinecones and saw logs b/ Cord: 128 cubic feet
NURSERY PRODUCTS
PRODUCTION VALUE
Item Year Field Acres House Sq. Foot Total Value
Nursery Stocka 2010 840 653,000 $24,445,000
2009 740 669,000 26,081,000 2008 670 697,000 33,820,000
a/ Includes grapevines, fruit trees, nut trees and ornamentals
APIARY PRODUCTS
PRODUCTION VALUE
Item Year Total Unit Per Unit Total
Apiary Products
Beeswax 2010 30,000 Pound $2.04 $61,000
2009 22,000 Pound 2.12 47,000 2008 34,000 Pound 1.73 59,000
Honey 2010 781,000 Pound 1.43 1,117,000 2009 611,000 Pound 1.26 770,000 2008 509,000 Pound 1.29 657,000
Pollination 2010 190,000 Colony 139.00 26,410,000
2009 141,000 Colony 138.00 19,458,000
2008 167,000 Colony 139.00 23,213,000
TOTAL 2010 $27,588,000 2009 20,275,000
2008 23,929,000
10

LIVESTOCK AND POULTRY
PRODUCTION VALUE
Item Year
Head Liveweight Unit Per
Unit Total
Cattle and Calvesa 2010 76,300 551,720 CWTb $79.00 $43,586,000
2009 81,040 596,220 CWT 68.00 40,543,000
2008 82,560 598,280 CWT 70.00 41,880,000
Replacement Heifersc 2010 29,200 1,310.00 38,252,000
2009 28,520 1,210.00 34,509,000
2008 31,280 1,740.00 54,427,000
Poultry 2010 22,994,000
2009 24,531,000
2008 33,708,000
TOTAL 2010 $104,832,000
2009 99,583,000
2008 130,015,000
a/ Range and dairy cattle sold for beef
b/ Hundredweight: 100 pounds
c/ Milk cows
LIVESTOCK AND POULTRY PRODUCTS
PRODUCTION VALUE
Item Year
Production
Unit Per Unit Total
Milk Marketa 2010 15,671,924 CWT $14.52 $227,556,000
2009 14,382,349 CWT 11.25 161,758,000
2008 16,995,929 CWT 16.57 281,623,000
Milk Manufacturinga 2010 621,409 CWT 14.57 9,054,000
2008 571,168 CWT 12.08 6,897,000
2007 658,191 CWT 18.56 12,216,000
Other Productsb 2010 19,365,000
2009 18,019,000
2008 10,549,000
TOTAL 2010 $255,975,000
2009 186,674,000
2008 304,388,000
a/ Madera County has 55 dairies, with 73,000 lactating cows
b/ Includes aquaculture, ducks, market eggs, hogs, manure, sheep, lambs and wool
11

Sustainable Agriculture Report 2010
PEST PREVENTION Pest prevention programs are mandated by the California Food and Agricultural Code to prevent the introduction and spread of pests in California. Pest prevention involves three strata: pest exclusion, pest detection and integrated pest management. The Pest Exclusion Program prevents the introduction of injurious pests that are not of common occurrence in the county. During 2010, five nursery locations were inspected to ensure pest cleanliness. Over 40 shipments of plant materials, received by nurseries, were inspected for potentially injurious pests prior to retail sale. Red Imported Fire Ant (Photo/University of California Cooperative Extension)
Over 20,000 acres were surveyed for Red Imported Fire Ants (RIFA), including commercial nurseries, recently-landscaped residential developments and orchards pollinated by out-of-state beehives. Nineteen beehive shipments from RIFA infested states, with over 9,100 beehives, were inspected for RIFA. RIFA were found on two beehive shipments in February, 2010, one shipment from Florida and one shipment from Texas. The orchards where the RIFA
infested beehives were placed were surveyed and no RIFA was found. RIFA was found outside of the infested area in a pistachio orchard. The State of California is following up with additional surveys, treatment and post-treatment surveys of the site. During 2010, over sixty countries received agricultural commodities, which required certification that the commodities were free from potentially injurious pests. Over 3,000 phytosanitary inspections were performed on Madera County commodities destined for export. The Pest Detection Program utilizes insect traps and surveys for the detection of foreign pests which may have eluded exclusion efforts. Over 1,360 traps were deployed in the county, with over 13,900 trap servicings performed during the 2010 season. The trapping program in Madera County targeted multiple pests, including the following:
Caribbean Fruit Fly European Corn Borer Gypsy Moth
Japanese Beetle Khapra Beetle Light Brown Apple Moth
Mediterranean Fruit Fly Melon Fruit Fly Mexican Fruit Fly
Oriental Fruit Fly
12
Some 2010 registered cattle brands in Raymond Some 2010 registered cattle brands in
North Fork, Oakhurst & O’Neals
The Integrated Pest Control Program strives to eradicate infestations of new pests before they become widespread. Pink Bollworm (Pectinophora gossypiella), a non-established and economically significant pest of cotton, is controlled by post-season plowdown of cotton plants. In 2010, plowdown of over 4,100 acres of cotton was verified, ensuring the destruction of habitat supportive of this pest.
PEST MANAGEMENT
The Glassy-winged Sharpshooter Program serves to detect and control the vector of Pierce‟s Disease, a potentially catastrophic disease of vineyards. This program involved the placement of 500 traps, with 6,962 subsequent trap servicings. In addition, incoming shipments of host material and susceptible county plantings were inspected. Over 500 nursery shipments were inspected in 2010. From July 27 through October 29 of 2010,
multiple Glassy-winged Sharpshooters were found with the majority of the finds in the Cobb Ranch and Wildwood Mobile Home Park area. Our office deployed over 700 delimitation traps throughout the find sites, with over 11,000 subsequent trap servicings. Treatment was performed on the find sites. Detection surveys will continue in 2011 as the weather warms up. The Vertebrate Pest Management Program provides expertise and materials, to growers and homeowners, for the control of certain depredating vertebrate pests.
Fifty Organic Farms, totaling more than 6,800 acres, three handlers and one processor, were registered in Madera County in 2010. Utilizing organic principles defined in the California Organic Products Act of 2003, these farms produce a wide array of commodities, such as: alfalfa, almonds, apples, apricots, artichokes, arugula, avocado, basil, green beans, beets, berries, broccoli, brussels sprouts, cabbage, cauliflower, cantaloupe, carrots, chard, cherries, collards, sweet corn, cucumbers, cut flowers, eggplant, endive, fennel, figs, garlic, grapes (table, raisin, wine), hay, herbs, honeydew, kale, kiwi, kohlrabi, leeks, lettuce, okra, olives, onions, oranges, peaches, peas, peppers, persimmons, pistachios, dried plums, pomegranates, potatoes, radish, seed crops, spinach, squash, tomatillo, tomatoes, turnips, watermelons, yams, zucchini.
The value of organic production in Madera County during 2010 was $20,108,000.
13
Glassy-Winged Sharshooter, UC Extension
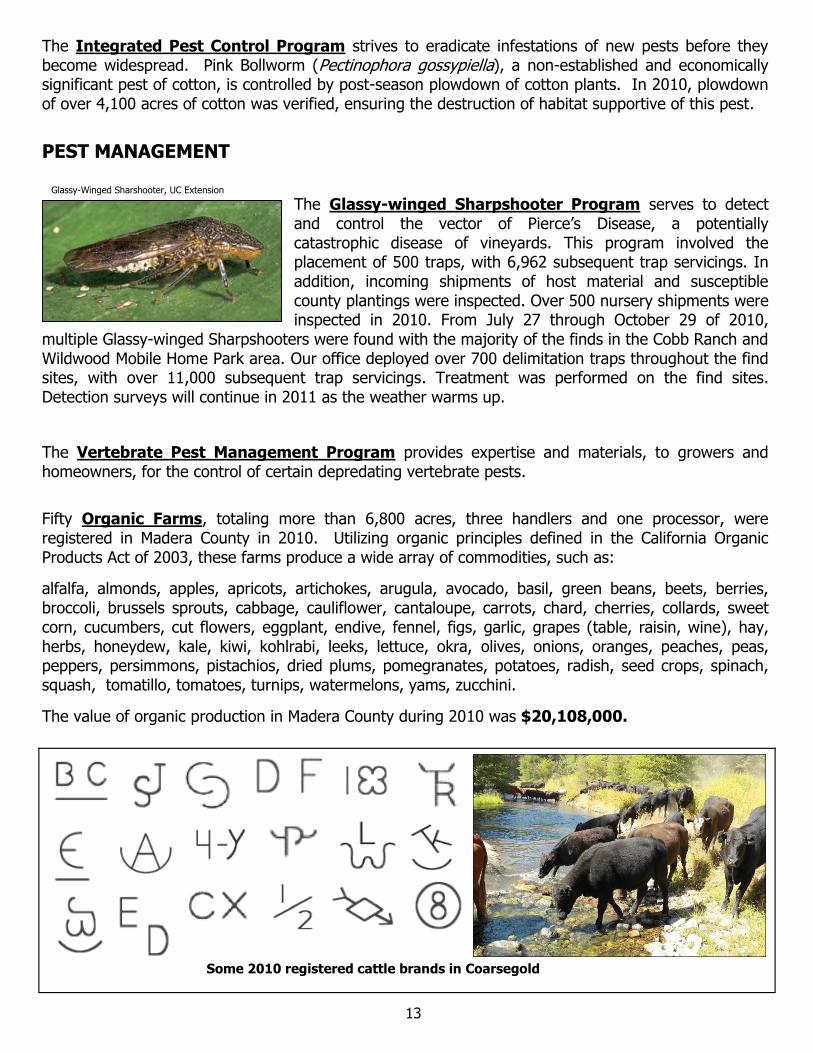
Some 2010 registered cattle brands in Coarsegold
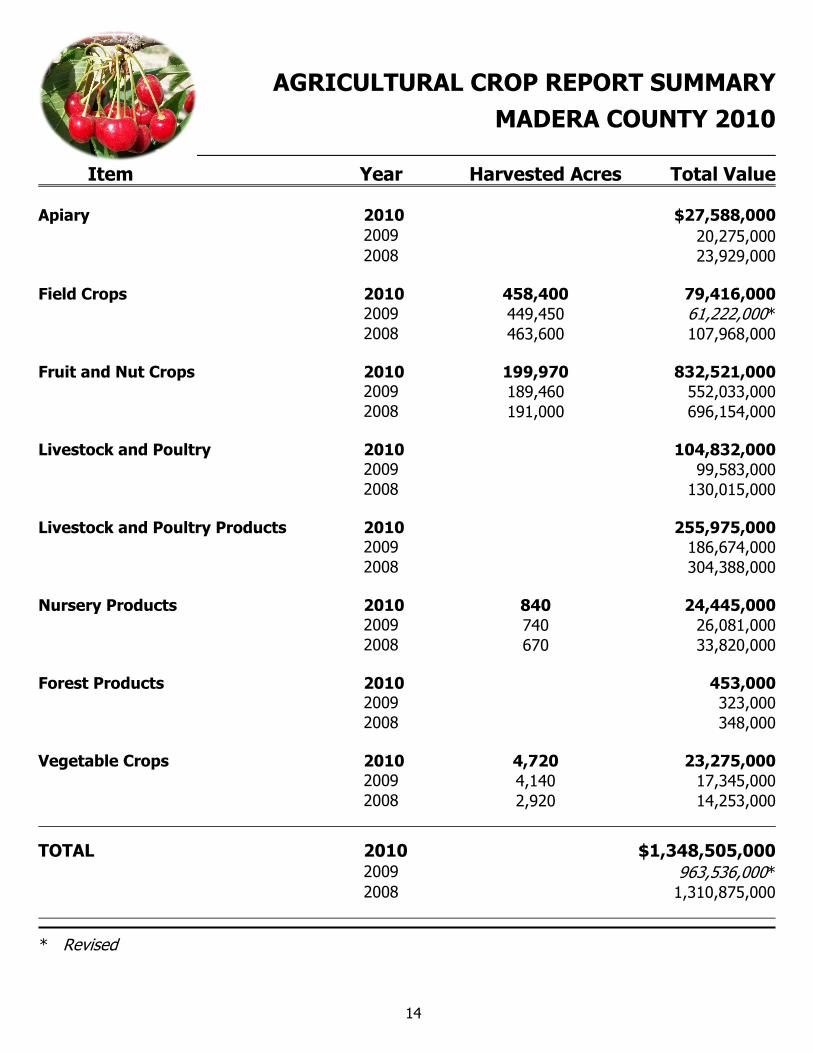
AGRICULTURAL CROP REPORT SUMMARY
MADERA COUNTY 2010
Apiary 2010 $27,588,000
2009 20,275,000
2008 23,929,000
Field Crops 2010 458,400 79,416,000
2009 449,450 61,222,000*
2008 463,600 107,968,000
Fruit and Nut Crops 2010 199,970 832,521,000
2009 189,460 552,033,000
2008 191,000 696,154,000
Livestock and Poultry 2010 104,832,000
2009 99,583,000
2008 130,015,000
Livestock and Poultry Products 2010 255,975,000
2009 186,674,000
2008 304,388,000
Nursery Products 2010 840 24,445,000
2009 740 26,081,000
2008 670 33,820,000
Forest Products 2010 453,000
2009 323,000
2008 348,000
Vegetable Crops 2010 4,720 23,275,000
2009 4,140 17,345,000
2008 2,920 14,253,000
TOTAL 2010 $1,348,505,000 2009 963,536,000*
2008 1,310,875,000
* Revised
Item Year Harvested Acres Total Value
14


Historic Brand of Madera County Lazy S Wrench – Left Rib
Three Horizontal Bars – Left Rib
The S Wrench brand was originally used as a horse brand by Henry Miller. Then, in the late 1800 to early 1900 Tom Beasore acquired the brand for the use on his cattle. Mr. Beasore was one of the pioneers that summered his cattle in the Sierras and this is where Beasore Meadows found a name. Beasore Meadow is located in the Sierra Nevada Mountains and is above Bass Lake. He would keep his cattle on the lower elevations of Madera County in the cold of winter and as the season would change and the green grass would fade to gold he would migrate with his herd to the mountains. He purchased a ranch in Coarsegold to hold his cattle over on the trek to the mountains. This is where he first met my father Henry Bohna, a young man at the time: the year 1940. Tom was getting on in age, closing in on 90, so he had asked my father to help him. My father was batching at the time on the old river road near the Olive Trees with Bud Shannon. He would walk to work up the grade to cross the road from where the Coarsegold School currently is to work every day. Bud decided this would not do and loaned my father a horse to ride. Soon Tom Beasore needed more than just help on the ranch; he needed someone to care for him. Thus, my father moved in and stayed with him until he passed away in 1950. The S Wrench brand was registered into Henry Bohnas‟ name in 1945. This brand on cattle continued to go from stubble feed in the San Joaquin Valley to the high country for many years until the 1960‟s when my father designed a new brand: three horizontal bars on the left rib. He utilized this three bar brand on his cattle herd until he passed away in 1986. The brand however has not missed a year of going from near Coarsegold to the Sierras since my father registered it. I now have the brand registered in my name and continue the tradition of driving the cattle from the lower elevation near Raymond to the Sierra Nevada Mountains when the snow gives way for the lush green feed to grow.
The Three Bar Brand stands for “Tradition”, a word I hold a great deal of respect and pride for.
By Diane Bohna, June 22, 2011
Photo taken in 2008 at the "Nich Pass" coming down off the side of Kaiser Pass (elevation near 10,000 feet), North of Huntington Lake towards Edison Lake in the Sierra Nevada‟s. The cattle are Bohna Cattle on the way home from the high country.

The Cattle Drive down the main street of Chowchilla first began on Friday, March 28, 1958. Since that time, the Cattle Drive has become a tradition and has been the official opening for the Chowchilla Western Stampede.
The annual event attracts children, adults, cowboys, cowgirls, and out-of-town visitors. It "hails the beginning of Roping Fever" that spreads throughout the community. The Cattle Drive sets the stage for five days of team roping, calf roping and barrel racing.
How did the cattle drive get its start? Well, there are several versions. According to local residents Dan Branco and Jim Looney, the cattle drive was the end result of a bunch of young cowboys with a lot of energy.
In 1958, the stock for the Stampede was to be furnished by Paul Perry of Madera. He planned to have approximately 150 steers and 60 calves on hand for the big three-day event. The stock was on a ranch the other side of Dairyland. The committee was at a loss as to how they were going to get the steers to town. The young cowboys decided they would just drive the stock to town, which they did. As they got closer to town they thought it would be funny to drive the steers right down the main street, Robertson Boulevard, of Chowchilla, which they did.
The drive did create a sensation and definitely announced the coming of the Chowchilla Western Stampede. It did cause one problem. One Chowchilla resident got a little upset when a steer stepped on his strawberry plants. The little incident ended up costing the fair manager $20. The Cattle Drive has continued each year but the cost is far more than $20.
At one time, the cattle drive through town was threatened due to the high cost of insurance. Two local farmers/dairymen, Charlie Keller and Tony Fagundes, stepped in to save the day. Today the cost of insurance for the Cattle Drive runs around $800.
There has never been an injury as a result of the Cattle Drive.
Nearing its 50th year, the Chowchilla Western Stampede Cattle Drive continues to be a popular event. School children line the streets dressed in their western attire. Adults envision the days of Roy Rogers and Gene Autry and the news media capture it all on film. The Cattle Drive has received national coverage and has been featured in numerous magazines and papers. Other cities have tried to copy the event but not as successfully as the Chowchilla event.
The Cattle Drive and Stampede are a part of Chowchilla's rich heritage. At one time the grandstands were packed with spectators. There is no charge to watch the roping and barrel racing. The Stampede Committee invites the community to come out and catch the "Stampede Spirit."
LEGEND OF THE CATTLE The following is an excerpt from the March 6, 2005 edition of the Chowchilla News, Patty Mandrell, Editor
Photo credit: Chowchilla News

Madera County Department of Agriculture/Weights and Measures
332 S. Madera Avenue
Madera, CA 93637
Phone: (559) 675-7876
Fax: (559) 674-4071
Website: www.madera-county.com/agcommissioner