2010-2014 Pedestrian and Bicycle Traffic Count Preliminary ...
16
University of New Mexico UNM Digital Repository Reports & Documents Publications & Reports 2014 2010-2014 Pedestrian and Bicycle Traffic Count Preliminary Report Sally M. Davis eresa H. Cruz Emily Lilo Heather Lucero Alejandro Ortega See next page for additional authors Follow this and additional works at: hps://digitalrepository.unm.edu/prc-reports-documents is Report is brought to you for free and open access by the Publications & Reports at UNM Digital Repository. It has been accepted for inclusion in Reports & Documents by an authorized administrator of UNM Digital Repository. For more information, please contact [email protected]. Recommended Citation Davis, Sally M.; eresa H. Cruz; Emily Lilo; Heather Lucero; Alejandro Ortega; Tim Rogers; JoAnne Hughes; Richard Kozoll; Jeanee Linville; and Lorea Tollefson. "2010-2014 Pedestrian and Bicycle Traffic Count Preliminary Report." (2014). hps://digitalrepository.unm.edu/prc-reports-documents/15
Transcript of 2010-2014 Pedestrian and Bicycle Traffic Count Preliminary ...

University of New MexicoUNM Digital Repository
Reports & Documents Publications & Reports
2014
2010-2014 Pedestrian and Bicycle Traffic CountPreliminary ReportSally M. Davis
Theresa H. Cruz
Emily Lilo
Heather Lucero
Alejandro Ortega
See next page for additional authors
Follow this and additional works at: https://digitalrepository.unm.edu/prc-reports-documents
This Report is brought to you for free and open access by the Publications & Reports at UNM Digital Repository. It has been accepted for inclusion inReports & Documents by an authorized administrator of UNM Digital Repository. For more information, please contact [email protected].
Recommended CitationDavis, Sally M.; Theresa H. Cruz; Emily Lilo; Heather Lucero; Alejandro Ortega; Tim Rogers; JoAnne Hughes; Richard Kozoll;Jeanette Linville; and Loretta Tollefson. "2010-2014 Pedestrian and Bicycle Traffic Count Preliminary Report." (2014).https://digitalrepository.unm.edu/prc-reports-documents/15

AuthorsSally M. Davis, Theresa H. Cruz, Emily Lilo, Heather Lucero, Alejandro Ortega, Tim Rogers, JoAnne Hughes,Richard Kozoll, Jeanette Linville, and Loretta Tollefson
This report is available at UNM Digital Repository: https://digitalrepository.unm.edu/prc-reports-documents/15

2010-2014 Pedestrian and Bicycle Traffic Count Preliminary Report
Cuba, New Mexico
2014

1
Acknowledgements: This report was compiled by the UNM Prevention Research Center as a component
of the VIVA-Step Into Cuba project and the Robert Wood Johnson Foundation (RWJF) Healthy Kids
Healthy Cuba project. This report was supported in part by Cooperative Agreement Number
5U48DP001931from the Centers for Disease Control and Prevention (CDC), Prevention Research
Centers Program. The findings and conclusions in this report are those of the authors and do not
necessarily represent the official position of the CDC or the RWJF.
Thank you to the following individuals for contributing to this report:
University of New Mexico Prevention Research Center Faculty and Staff
Sally M. Davis, Director, Ph.D Heather Lucero
Theresa H. Cruz, Deputy Director, Ph.D Alejandro Ortega, BS
Emily Lilo, MPH
Transportation Planning Consultant
Tim Rogers, Santa Fe Conservation Trust, MCRP
Step Into Cuba Alliance Evaluation Workgroup
JoAnne Hughes, Public Health Nurse, Alliance
Chairperson, RN
Richard Kozoll, Family Physician, Nacimiento
Community Foundation Board President, MD
Jeanette Linville, Nacimiento Community
Foundation Executive Director
Loretta Tollefson Special Projects Manager
Mid-region Council of Governments of New
Mexico
We would like to thank all of the individuals that assisted with the pedestrian counts and we would like to
acknowledge the Step Into Cuba Alliance and the Village of Cuba for their support of this project.

1
Introduction
The Step Into Cuba Alliance (the Alliance) is a
broad coalition of local, state and national
organizations and individuals working to increase
opportunities for physical activity in the Village of
Cuba, NM (the Village). A primary goal of the
Alliance is to increase the walkability of Cuba to
encourage walking as a convenient and low-cost
form of physical activity. One of the areas of focus
for the Alliance is US Highway 550 (US 550), a
four lane, federal highway that bisects the Village
and serves as Cuba’s main street. The Alliance is
also working to make NM 126, leading from US
550 to the Village of Cuba St. Francis of Assisi
Park, more pedestrian friendly.
US 550 is a primary route connecting Albuquerque to Northwestern New Mexico and Colorado. In Cuba,
US 550 is estimated to have a traffic count of about 8,200 vehicles per day.1 Cuba’s health clinic, post
office and other essential services are located on US 550, and the Village of Cuba serves as the
commercial center for the area. Residents from within the municipality and the outlying areas visit Cuba
regularly to retrieve their mail from the post office (there is no mail delivery service in the Cuba area),
shop for food and other necessities, receive medical care, and obtain social services. Many residents of
Cuba live within walking distance of the commercial center. Most roadways used by residents to reach
services and businesses on US 550 do not have safe sidewalks or walkways. Additionally, on US 550
there are no traffic lights or stop signs, only two crosswalks, and the sidewalks are not continuous. In
winter, snow removal from the highway leads to piles of snow on sidewalks and highway shoulders,
obstructing pedestrian access.
The Village and the Alliance have been working with the NM Department of Transportation (NMDOT)
to explore ways to make US 550 and NM 126 more pedestrian friendly. In 2011, federal funding was
obtained and utilized to complete a new section of pedestrian-friendly sidewalks along US 550 on
the south end of Cuba. Applications have been approved and funding has been earmarked for
additional improvement projects along US 550 and adjoining roadways.
Pedestrian and bicycle traffic counts represent another way in which the Alliance and the Village have
focused needed attention on US 550 and its intersecting streets. Faculty and staff from the University of
New Mexico Prevention Research Center (UNM PRC), working with an independent transportation
planning consultant and pedestrian and bicycle safety expert, organized the counting effort, trained
counters and participated in the counting. Community members from the Cuba area contributed to the
effort by conducting the counts as volunteers and paid workers.
This report provides data on the use of US 550 and intersecting roads, including NM 126, and the Village
of Cuba’s St. Francis of Assisi Park by pedestrians, bicyclists and other non-motorized transportation
(e.g., skateboarders). Baseline data were collected in 2010, and follow-up data collected in 2011-2014.
The repeated counts document changes in non-motorized use following improvements to make the area
1 Per http://www.mrcog-nm.gov/images/stories/pdf/maps_and_data/traffic_flow/tfm-2013-sandoval.pdf Cf.
NMDOT estimate for 2012 of only approx. 4,400 daily vehicles per day at
http://dot.state.nm.us/content/dam/nmdot/Data_Management/US_AADT_Listing.pdf
2
safer and more attractive for pedestrians. Data from the counts have also been submitted to the National
Bicycle and Pedestrian Documentation Project, a nationwide effort to create a consistent, uniform
collection and analysis system for non-motorized transportation.
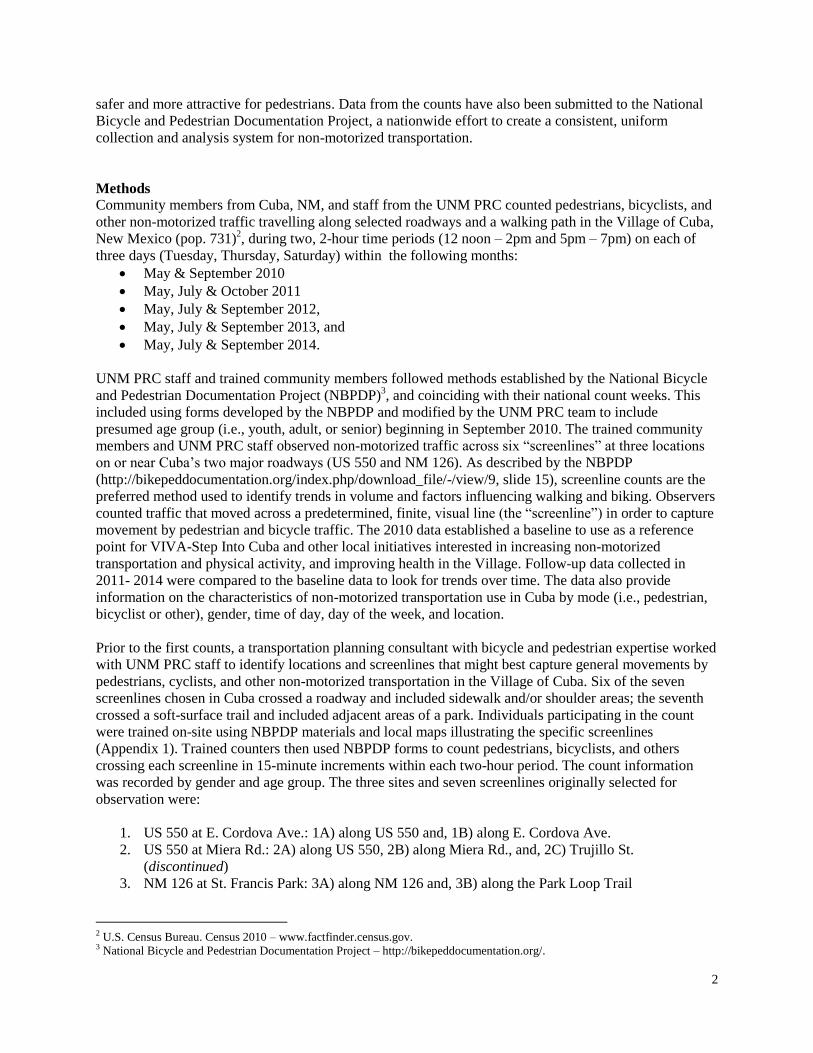
Methods
Community members from Cuba, NM, and staff from the UNM PRC counted pedestrians, bicyclists, and
other non-motorized traffic travelling along selected roadways and a walking path in the Village of Cuba,
New Mexico (pop. 731)2, during two, 2-hour time periods (12 noon – 2pm and 5pm – 7pm) on each of
three days (Tuesday, Thursday, Saturday) within the following months:
May & September 2010
May, July & October 2011
May, July & September 2012,
May, July & September 2013, and
May, July & September 2014.
UNM PRC staff and trained community members followed methods established by the National Bicycle
and Pedestrian Documentation Project (NBPDP)3, and coinciding with their national count weeks. This
included using forms developed by the NBPDP and modified by the UNM PRC team to include
presumed age group (i.e., youth, adult, or senior) beginning in September 2010. The trained community
members and UNM PRC staff observed non-motorized traffic across six “screenlines” at three locations
on or near Cuba’s two major roadways (US 550 and NM 126). As described by the NBPDP
(http://bikepeddocumentation.org/index.php/download_file/-/view/9, slide 15), screenline counts are the
preferred method used to identify trends in volume and factors influencing walking and biking. Observers
counted traffic that moved across a predetermined, finite, visual line (the “screenline”) in order to capture
movement by pedestrian and bicycle traffic. The 2010 data established a baseline to use as a reference
point for VIVA-Step Into Cuba and other local initiatives interested in increasing non-motorized
transportation and physical activity, and improving health in the Village. Follow-up data collected in
2011- 2014 were compared to the baseline data to look for trends over time. The data also provide
information on the characteristics of non-motorized transportation use in Cuba by mode (i.e., pedestrian,
bicyclist or other), gender, time of day, day of the week, and location.
Prior to the first counts, a transportation planning consultant with bicycle and pedestrian expertise worked
with UNM PRC staff to identify locations and screenlines that might best capture general movements by
pedestrians, cyclists, and other non-motorized transportation in the Village of Cuba. Six of the seven
screenlines chosen in Cuba crossed a roadway and included sidewalk and/or shoulder areas; the seventh
crossed a soft-surface trail and included adjacent areas of a park. Individuals participating in the count
were trained on-site using NBPDP materials and local maps illustrating the specific screenlines
(Appendix 1). Trained counters then used NBPDP forms to count pedestrians, bicyclists, and others
crossing each screenline in 15-minute increments within each two-hour period. The count information
was recorded by gender and age group. The three sites and seven screenlines originally selected for
observation were:
1. US 550 at E. Cordova Ave.: 1A) along US 550 and, 1B) along E. Cordova Ave.
2. US 550 at Miera Rd.: 2A) along US 550, 2B) along Miera Rd., and, 2C) Trujillo St.
(discontinued)
3. NM 126 at St. Francis Park: 3A) along NM 126 and, 3B) along the Park Loop Trail
2 U.S. Census Bureau. Census 2010 – www.factfinder.census.gov. 3 National Bicycle and Pedestrian Documentation Project – http://bikepeddocumentation.org/.

3
More specific descriptions of the screenlines are provided in Table 1; observation locations and
screenlines are also identified on maps and photos in Appendix 1. Screenline 1A was adjusted and
screenline 2C (across Trujillo St. east of US 550) was discontinued after the first count.4 Resulting data
were prepared for submission to NBPDP in a reporting spreadsheet provided by the Project.
Table 1. Locations and screenlines for non-motorized traffic counts, Cuba, NM, 2010-2014. Loc# Site # Screenline Description of Screenline
1 1 1A Across US 550 south of Cordova (church to food pantry building; adjusted after 1st
count) 2 1 1B Across E. Cordova Ave. (food pantry to fence) 3 2 2A Across US 550 south of Miera Rd. and north of Trujillo St. (on bridge over Rito de Leche) 4 2 2B Across Miera Rd. west of US 550 (Rito de Leche to utility pole west of McDonald's) 5 3 3A Across NM 126 west of St. Francis of Assisi Park (space between driveways to fence) 6 3 3B Across Park Loop Trail - SW corner of St. Francis of Assisi Park (fence to interior of park)
Results
Overall
Through September 2014 a total of 5,059 instances of pedestrian, bicyclist or other non-motorized traffic
were tallied crossing the six screenlines in Cuba. Table 2 summarizes these traffic counts by location and
year since counting began in May 2010. As illustrated in Figure 1, the two screenlines across US 550
accounted for nearly two-thirds of all observations in 2010-2014.
Table 2. Non-motorized traffic movements counted by year and location, Cuba, NM, 2010-2014.
Loc. Description of Movement 2010* 2011 2012 2013 2014 TOTAL
1A Along US 550, s. of Cordova 82 263 343 309 230 1227
1B Along E. Cordova Ave. 33 104 103 163 136 539
2A Along US 550 s. of Miera Rd. 313 478 465 253 425 1934
2B Along Miera Rd. 84 115 198 94 174 665
3A Along NM 126 38 46 68 58 139 349
3B Park Loop Trail 49 114 45 71 66 345
TOTAL 599 1120 1222 948 1170 5059
*In 2010, observations were conducted in May and September only.
4 The screenline across US550 south of Cordova was moved closer to Cordova after the first screenline location closer to the post
office was found to be capturing significant “temporary” pedestrian activity by motorists using a parking lot to gain access to the
post office. The screenline across Trujillo Street was discontinued because it was capturing significant, localized foot traffic by a
limited number of individuals walking back and forth between a store and bushes by the creek. These movements were not
representative of the type of data we were interested in collecting and we did not want them to skew the results.

4
Figure 1. Non-motorized traffic movements counted by screenline location, Cuba, NM, 2010-2014.
Table 3 provides average counts per two-hour observation period for each location and overall. Table 3
and Figure 2 show an overall increase in non-motorized traffic per 2-hour observation period from 2010 –
2014.
Table 3. Non-motorized traffic movements, per two-hour observation period, by year and location, Cuba,
NM, 2010-2014.
Loc. Description of Movement 2010 2011 2012 2013 2014 Overall
1A Along US 550, s. of Cordova 6.8 14.6 19.1 17.2 12.8 14.6
1B Along E. Cordova Ave. 3.0 5.8 5.7 9.1 7.6 6.5
2A Along US 550, s. of Miera Rd. 26.1 26.6 25.8 14.1 23.6 23.0
2B Along Miera Rd. 7.0 6.4 11.0 5.2 9.7 7.9
3A Along NM 126 3.2 2.6 3.8 3.2 7.7 4.2
3B Park Loop Trail 4.1 6.3 2.5 3.9 3.7 4.1
TOTAL 49.9 62.2 67.9 52.7 65.0 60.2
Note: May 2010 Counts exclude one screenline location (1B) for the first two-hour period because the screenline was changed.
1A US 550, south of
Cordova Ave. 24%
1B E. Cordova Ave. 11%
2A US 550 south of Miera
Rd. 38%
2B Miera Rd. 13%
3A NM 126 7%
3B Park Loop Trail 7%

5
Figure 2. Non-motorized traffic movements (N=5,059) per two-hour observation period by year, Cuba,
NM, 2010-2014.
Figure 3 below indicates count levels by month. The six counting periods in September 2014 produced
the highest total to date. Up to that point, totals had generally dropped since peaking in July 2012.
Inclement weather, including rain and hail, was reported during some of the lowest count periods (e.g.,
September 2012, May 2013, and May 2014).
Figure 3. Non-motorized traffic movements (N-5,059) per month, Cuba, NM, 2010-2014.
0
10
20
30
40
50
60
70
80
2009 2010 2011 2012 2013 2014 2015
Ob
serv
atio
ns
per
2-h
ou
r p
erio
d
Year
Scre
enlin
e cr
oss
ings
ob
serv
ed

6
Gender
September 2014 produced the highest counts to date for both males and females. While males consistently
have higher counts compared with females, females rose steadily as a percentage of all traffic, from 32%
in 2010 to 34% in 2011, 39% in 2012, and 42% in 2013. In 2014, the share of females decreased to 34%.
Figure 4. Non-motorized traffic movements counted per month, by gender, Cuba, NM, 2010-2014.
Females account for 36.5% of all traffic counted in 2010-2014. As indicated in Table 4 and Figure 5,
females represent close to half of traffic along E. Cordova (46.2%) as well as on the Park Loop Trail
(44.6%) and along Miera Rd. (42.7%). Females account for the lowest share of traffic along US 550
south of Miera Rd. (30.3%).
Table 4. Gender of non-motorized traffic movements observed, by screenline location, Cuba, NM, 2010-
2014.
Loc. Description of Movement Male Female Unknown Total
1A Along US 550, s. of Cordova 773 452 2 1227
1B Along E. Cordova Ave. 290 249 0 539
2A Along US 550 s. of Miera Rd. 1345 586 3 1934
2B Along Miera Rd. 379 284 2 665
3A Along NM 126 226 123 0 349
3B Park Loop Trail 191 154 0 345
TOTAL 3204 1848 7 5059
Scre
enlin
e cr
oss
ings
ob
serv
ed

7
Figure 5. Females as a percentage of all non-motorized traffic movements, by screenline location, Cuba,
NM, 2010-2014.
Age Groups
Individuals tallied as “Youth” (presumed under 18 years of age) comprised one-quarter (25.2%) of all
traffic counted in 2010-2014. Youth represented over half of traffic counted along NM 126, and nearly
one-third of counts on Miera Rd. and the Park Loop Trail (Figure 6). The highest overall number of
youth tallied (369) was on US 550 south of Miera Rd.
Older adults tallied as ‘seniors’ (presumed over 65 years of age) accounted for 7.4% of all traffic counted
in the five-year period, with the highest proportion along E. Cordova and the lowest along Miera Rd., NM
126, and the Park Loop Trail, each just over four percent (see Table 5 and Figure 6). The highest overall
number of seniors tallied (124) was on US 550 south of Miera Rd.
Table 5. Presumptive age group of non-motorized traffic movements observed, by screenline location,
Cuba, NM, 2010-2014.
Loc. Description of Movement Child/Youth Adult Senior Total
1A Along US 550, s. of Cordova 196 895 95 1186
1B Along E. Cordova Ave. 119 326 78 523
2A Along US 550 s. of Miera Rd. 369 1260 124 1753
2B Along Miera Rd. 228 367 27 622
3A Along NM 126 179 139 15 333
3B Park Loop Trail 102 209 14 325
TOTAL 1193 3196 353 4742

8
Figure 6. Presumptive age group: youth (<18) and seniors (>65) as a percentage of all non-motorized
traffic movements, by screenline location, Cuba, NM, 2010-2014.
Traffic Type
Nearly 90 percent of non-motorized traffic counted consisted of pedestrians. Bicyclists and other non-
pedestrians (e.g., individuals riding skateboards, roller blades, or non-motorized scooters) accounted for
just over one-tenth (10.9%) of all non-motorized traffic counted in 2010-2014 (see Table 6 and Figure 7).
Bicyclists and other non-pedestrians have their highest share of non-motorized traffic along NM 126, the
Park Loop Trail, and Miera Rd., and their lowest share along US 550. The highest actual number of
“bicyclists and others,” however, was observed along US 550 south of Miera Rd., where the total number
of bicyclists observed (N=140), is close to double that of the next location. The “other” category −
primarily skateboarders per observers’ notes − also has its most significant presence here and on Miera
Rd., with 28 observations at each location (Table 6).
Table 6. Pedestrians, bicyclists, and other non-motorized traffic movements observed, by screenline
location, Cuba, NM, 2010-2014.
Loc. Description of Movement Pedestrians Bicyclists Others Total
1A Along US 550, s. of Cordova 1148 64 15 1227
1B Along E. Cordova Ave. 496 35 8 539
2A Along US 550 s. of Miera Rd. 1766 140 28 1934
2B Along Miera Rd. 557 80 28 665
3A Along NM 126 259 82 8 349
3B Park Loop Trail 282 55 8 345
TOTAL 4508 456 95 5059

9
Figure 7. Bicyclists and others as a percentage of all non-motorized traffic movements, by screenline
location, Cuba, NM, 2010-2014.
The “other” category increased substantially in 2014. In September 2014 alone, 46 “others” were
observed – primarily skateboarders coming out in the evening.
Time of day and day of week
Among the six two-hour time periods during which observations were made each week of data collection
since 2010, weekday mid-day counts were the highest and Saturday counts, along with Thursday
evenings, were the lowest (see Figure 8 and Tables 7 and 8). Counts taken between 12 and 2 pm
comprised 55.6% of all counts, including roughly two-thirds of those along US 550 south of Cordova
(69.7%) and along E. Cordova (67.7%). Most non-motorized traffic observed on the Park Loop Trail
(80.3%) and on NM 126 (71.9%) occurred during the early evening observation period (5-7 pm). The
distribution was split more evenly along Miera Rd. (49.0% during 12-2 pm) and US 550 south of Miera
Rd. (56.9% during 12-2 pm).
Figure 8. Non-motorized traffic movements by day of week and time of day, Cuba, NM, 2010-2014.
Scre
enlin
e cr
oss
ings
ob
serv
ed

10
Saturday tallies were the lowest of the three days, representing 29.0% of the total, and Thursday tallies the
highest at 36.4% of the total (see Table 8). Saturday counts were over one-third of the total on Miera Rd.
and along US 550 south of Miera Rd., but were a markedly lower share of the observations along US 550
south of Cordova (21.8%) and on the Park Loop Trail (22.9%).
Table 7. Time of day and day of week of non-motorized traffic movements observed, by screenline
location, Cuba, NM, 2010-2014.
Loc. Description of Movement Tues 12-2
Tues 5-7
Thurs 12-2
Thurs 5-7
Sat 12-2
Sat 5-7 Total
1A Along US 550, s. of Cordova 263 157 418 122 174 93 1227
1B Along E Cordova Ave. 98 51 168 56 99 67 539
2A Along US 550 s. of Miera Rd. 398 282 389 252 314 299 1934
2B Along Miera Rd. 137 113 88 96 101 130 665
3A Along NM 126 28 82 37 89 33 80 349
3B Park Loop Trail 24 114 10 118 34 45 345
TOTAL 948 799 1110 733 755 714 5059
Table 8. Proportional representation of non-motorized traffic by time of day and day of week, by
screenline location, Cuba, NM, 2010-2014.
Loc. Description of Movement
12-2 5-7
Tues Thurs Sat.
1A Along US 550, s. of Cordova
69.7% 30.3%
34.2% 44.0% 21.8%
1B Along E. Cordova Ave.
67.7% 32.3%
27.6% 41.6% 30.8%
2A Along US 550 s. of Miera Rd.
56.9% 43.1%
35.2% 33.1% 31.7%
2B Along Miera Rd.
49.0% 51.0%
37.6% 27.7% 34.7%
3A Along NM 126
28.1% 71.9%
31.5% 36.1% 32.4%
3B Park Loop Trail
19.7% 80.3%
40.0% 37.1% 22.9%
TOTAL
55.6% 44.4%
34.5% 36.4% 29.0%
Trends over time, overall, and across locations
A consistent rise was observed in total annual counts from 2010-2012. The number of observed counts
dropped in 2013, and rose again in 2014. Trends over time are subject to wide fluctuations. Data in May
2013 included two of the lowest totals across all six screenlines for a two-hour time period (N = 23 and
N=24) while July 2013 saw the highest total count ever made up to that date during a two-hour period (N
= 130). After below-average counts in May and July of 2014, September 2014 had a record high count of
574 observations including the highest counts ever made along NM 126 (N=108) and the highest counts
along US 550 since observations at these locations peaked in July 2012.
US 550 pedestrian traffic still dominates the data, but pedestrians, bicyclists, and others on US 550 side
streets (E. Cordova and Miera St.), and on NM 126 have also become more substantial in 2013-14.

11
Limitations
Several limitations could affect the results. Changes in two screenline locations following the initial
counts necessitated some data being dropped from use. Also, the low numbers associated with counts in
small rural communities create variability in the data. As a result, community events or inclement weather
during a single observation period can substantially affect observed movements, either increasing or
decreasing, depending on the event. Having multiple observations over multiple years with staggered
days and multiple time periods helps to minimize the effect.
12
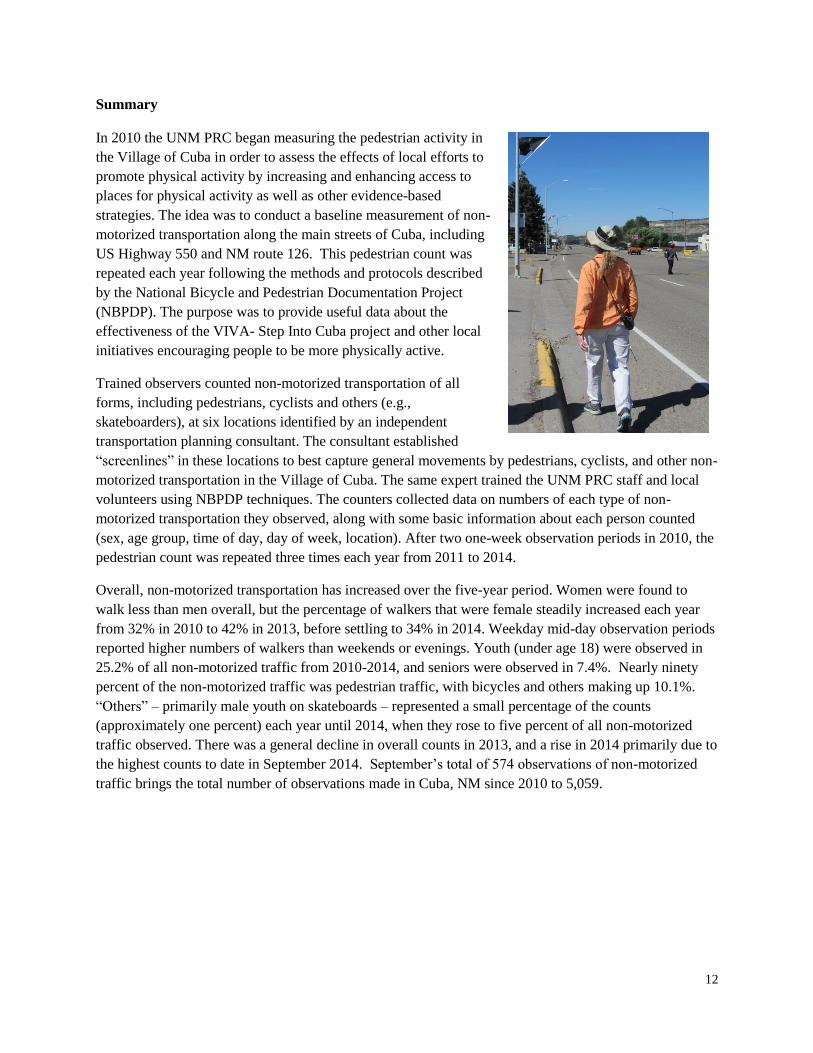
Summary
In 2010 the UNM PRC began measuring the pedestrian activity in
the Village of Cuba in order to assess the effects of local efforts to
promote physical activity by increasing and enhancing access to
places for physical activity as well as other evidence-based
strategies. The idea was to conduct a baseline measurement of non-
motorized transportation along the main streets of Cuba, including
US Highway 550 and NM route 126. This pedestrian count was
repeated each year following the methods and protocols described
by the National Bicycle and Pedestrian Documentation Project
(NBPDP). The purpose was to provide useful data about the
effectiveness of the VIVA- Step Into Cuba project and other local
initiatives encouraging people to be more physically active.
Trained observers counted non-motorized transportation of all
forms, including pedestrians, cyclists and others (e.g.,
skateboarders), at six locations identified by an independent
transportation planning consultant. The consultant established
“screenlines” in these locations to best capture general movements by pedestrians, cyclists, and other non-
motorized transportation in the Village of Cuba. The same expert trained the UNM PRC staff and local
volunteers using NBPDP techniques. The counters collected data on numbers of each type of non-
motorized transportation they observed, along with some basic information about each person counted
(sex, age group, time of day, day of week, location). After two one-week observation periods in 2010, the
pedestrian count was repeated three times each year from 2011 to 2014.
Overall, non-motorized transportation has increased over the five-year period. Women were found to
walk less than men overall, but the percentage of walkers that were female steadily increased each year
from 32% in 2010 to 42% in 2013, before settling to 34% in 2014. Weekday mid-day observation periods
reported higher numbers of walkers than weekends or evenings. Youth (under age 18) were observed in
25.2% of all non-motorized traffic from 2010-2014, and seniors were observed in 7.4%. Nearly ninety
percent of the non-motorized traffic was pedestrian traffic, with bicycles and others making up 10.1%.
“Others” – primarily male youth on skateboards – represented a small percentage of the counts
(approximately one percent) each year until 2014, when they rose to five percent of all non-motorized
traffic observed. There was a general decline in overall counts in 2013, and a rise in 2014 primarily due to
the highest counts to date in September 2014. September’s total of 574 observations of non-motorized
traffic brings the total number of observations made in Cuba, NM since 2010 to 5,059.