2010 09 05 AR Mandatory audit firm rotation and audit … Mandatory Audit Firm Rotation and Audit...
63
Mandatory Audit Firm Rotation and Audit Quality: Evidence from the Korean Audit Market Soo Young Kwon Korea University Young Deok Lim University of New South Wales Roger Simnett University of New South Wales November 2010 We are grateful for the insightful comments from Michael Ettredge and participants at the seminars at the University of New South Wales.
Transcript of 2010 09 05 AR Mandatory audit firm rotation and audit … Mandatory Audit Firm Rotation and Audit...

Mandatory Audit Firm Rotation and Audit Quality:
Evidence from the Korean Audit Market
Soo Young Kwon
Korea University
Young Deok Lim
University of New South Wales
Roger Simnett
University of New South Wales
November 2010
We are grateful for the insightful comments from Michael Ettredge and
participants at the seminars at the University of New South Wales.

Mandatory Audit Firm Rotation and Audit Quality:
Evidence from the Korean Audit Market
Abstract
Using a unique database consisting of 12,463 firm-year observations in Korea
between 2000 and 2007, this study examines the effect of mandatory audit firm
rotation on audit hours, audit fees, and audit quality. Since the Korean
government mandated audit firm rotation in 2006, (1) audit hours increased, (2)
audit fees increased, and (3) audit quality (measured as abnormal discretionary
accruals) remained unchanged or decreased slightly. These results, which are
robust to controlling for potential endogeneity between audit hours and earnings
management and to measuring audit quality alternatively, suggest that mandatory
audit firm rotation increases the cost for audit firms and clients while having no
discernable positive effect on audit quality.
Keywords: Mandatory Audit Firm Rotation, Audit Hours, Audit Fees, Audit
Quality
JEL Classifications: M42, M48
Data Availability: Most of the financial data used in the present study are
available from the KIS Value database. The data for audit hours and fees were
drawn from statements of operating results filed with the Financial Supervisory
Services (FSS) in Korea.

1
Mandatory Audit Firm Rotation and Audit Quality:
Empirical Evidence from the Korean Audit Market
1. Introduction
The Korean Financial Supervisory Services (FSS) has mandated audit firm
rotation in 2006. The mandatory audit firm rotation, which requires audit firms to be
rotated every seven years, is intended to reduce auditors’ incentives to develop long-
term relationships with their clients so that their preference for conservative
accounting choices may be induced. This study examines the effect of the mandatory
audit firm rotation in Korea on audit hours, audit fees, and discretionary accruals.
Further, the study explores a forced auditor change setting that allows for a more
direct examination of how audit quality is affected by a mandatory auditor change and
an increase in auditor skepticism.
Whether audit firm rotation should be made mandatory is an issue that has been
debated for almost five decades in the U.S. and around the world. Proponents of
mandatory audit firm rotation have argued that a new auditor would bring to bear
greater skepticism and a fresh perspective that may be lacking in long-standing
auditor-client relationships.1 They have also claimed that when a company has been a
client of an audit firm for a number of years, the client can be viewed as a source of a
perpetual annuity, potentially impairing the auditor’s independence. Conversely,
opponents of mandatory firm rotation have argued that audit quality would suffer
under such a regime because the auditor would lack familiarity with the client and its
industry (AICPA [1992]). Furthermore, opponents have pointed to a higher incidence
of problem audits in the early years of the auditor-client relationship than in the later
years (St. Pierre and Anderson [1984]).
The Enron debacle in late 2001 (and its high-profile collapse) has refocused
attention on the profession’s effectiveness in protecting public interest. The Sarbanes-
Oxley Act [2002] required the General Accounting Office (GAO2) to conduct a study
of the potential effects of requiring the mandatory rotation of auditors registered
under the Act. The GAO’s study concluded that mandatory audit firm rotation might 1 Benson [2002] suggested that institutional investors have focused on this issue and opposed shareholder approval of any audit firm that has been retained by a company for more than five years. 2 Effective July 7, 2004, the GAO changed its name to the Government Accountability Office.

2
not be the most efficient way to strengthen auditor independence. Consequently, the
legislatures settled on the rotation of lead partners. However, the GAO has left open
the possibility of revisiting the mandatory audit firm rotation requirement if the other
requirements of the Sarbanes-Oxley Act do not lead to improved audit quality. Thus,
despite concerns that mandatory rotation could diminish the quality of financial
reporting, the demand for mandatory audit firm rotation has remained.
Because the effects of mandatory firm rotation cannot be analyzed using archival
data, prior research has examined the relation between audit quality and audit firm
tenure. As proxies for audit quality, they employ discretionary accruals, the cost of
debt financing, earnings response coefficients (ERCs), going-concern reports, AAERs
(Accounting and Auditing Enforcement Releases), auditor litigation, and fraud.
Overall, previous studies have suggested that long auditor tenure is not associated
with a decline in audit quality but that short tenure is associated with lower quality
audits (Geiger and Raghunandan [2002], Johnson et. al. [2002], Carcello and Nagy
[2004], Myers et. al. [2003], Ghosh and Moon [2005]). However, no study has
directly examined the effect of mandatory audit firm rotation because all have
examined audit firm rotation in the context of a voluntary change regime. Thus, the
results of prior research may not extend to a mandatory change regime.
Because auditor change is widely known to be endogenously determined, the
association between auditor tenure and audit quality has the self-selection bias (i.e.,
clients with long tenure tend to be good performers with less incentives to manage
earnings). Furthermore, unlike those under a mandatory audit firm rotation regime,
companies under a voluntary change regime are not required to change auditors in
future, and thus, they may still retain bargaining power over successor auditors. To
date, few studies have examined the effect of audit firm rotation in the mandatory
regime context because of the lack of data from a mandatory audit firm rotation
environment.
However, Korea has mandated the audit firm rotation requirement since 2006.
This allows a direct examination of the impact of a forced auditor change on audit
quality under a mandatory audit firm rotation regime. Furthermore, by employing
publicly disclosed data on audit hours and fees to determine the effects of a forced
auditor change on audit hours (auditor effort/cost) and audit fees (cost to clients), this

3
study provides a better understanding of the costs and benefits of mandatory audit
firm rotation.
Using a unique database consisting of 12,463 firm-year observations in Korea
between 2000 and 2007, this study examines the effect of mandatory audit firm
rotation on audit hours, audit fees, and audit quality. Since the Korean government
mandated audit firm rotation in 2006, (1) audit hours increased, (2) audit fees
increased, and (3) audit quality (measured as abnormal discretionary accruals)
remained unchanged or decreased slightly. These results, which are robust to
controlling for potential endogeneity between audit hours and earnings management
and to measuring audit quality alternatively, suggest that mandatory audit firm
rotation increases the cost for audit firms and clients while having no discernable
positive effect on audit quality.
Our study contributes to the literature in several ways. This study explicitly
examines the impact of mandatory audit firm rotation on audit quality under a
mandatory audit firm rotation regime. Previous studies have examined either the
effects of auditor tenure on earnings quality or the characteristics of firms voluntarily
changing auditors on the engagement under a voluntary rotation system, not under a
mandatory system.3 Thus, the results from a voluntary auditor change environment
may not extend to a mandatory auditor change environment if such a requirement is
imposed on public companies.
Second, to the authors’ knowledge, the present study is the first to employ the
rich dataset of audit hours and audit fees to address an important policy question --
the effect of mandatory auditor change on auditor efforts (auditor cost), audit fees
(client cost), and discretionary accruals (audit quality) -- under one study. Prior
studies have employed audit tenure, the auditor’s opinion, or financial statement
restatements to explore the impact of mandatory audit firm rotation. However, they
have not examined the rotation-related costs to clients and audit firms. The present
study has useful implications for regulators, members of the accounting profession,
and financial statement users as they deliberate on the costs and benefits of mandatory
audit firm rotation.
3 One recent study by Ruiz-Barbadillo et al. [2009] examined the impact of mandatory audit firm rotation on auditor behavior in the Spanish context. They used the likelihood of issuing going-concern opinions as a proxy for audit quality and focused on financially distressed firms from 1991~2000.
4
Third, this study provides evidence for the incremental effect of mandatory
auditor changes over voluntary auditor changes on auditor efforts, audit fees, and
discretionary accruals. Further, this study explicitly considers auditors’ responses to
the rule by increasing audit hours; the auditors were expected to change their audit
hours in anticipation of government scrutiny.
The remainder of the paper proceeds as follows. Section 2 provides a review of
the controversy and literature about mandatory rotation. Section 3 develops the
hypotheses, and Section 4 presents the models and key variables. Section 5 describes
the sample and reports the results. Section 6 provides additional analyses, and Section
7 concludes with a summary.
2. Controversy over Mandatory Rotation and Literature Review
2.1 Debate on Mandatory Audit Firm Rotation
2.1.1 Controversy over Mandatory Audit Firm Rotation Among Politicians,
Regulators, and Accounting Practitioners
In their seminal work, Mautz and Sharaf [1961] suggested that extended auditor-
client relationships can have a detrimental effect on auditor independence because an
auditor’s objectivity about a client decreases over time. Further, the Metcalf
Committee indicated that mandatory audit firm rotation is a way to bolster auditor
independence (U.S. Senate [1976]). Regulators have suggested a link between auditor
tenure and reductions in earnings quality and recommended imposing such a
requirement (Commission on Auditors’ Responsibilities [1978]; Division for CPA
firms, [1992]).
The Enron scandal and the Andersen audit failure rekindled the issue of
mandatory audit firm rotation. Mandatory audit firm rotation was advocated in the
congressional testimony by Arthur Levitt, Jr., former chairman of the SEC; Lynn E.
Turner, former SEC chief accountant; and Charles A. Bowsher, a chair of the Public
Oversight Board. They suggested that serious consideration be given to requiring
companies to change their audit firm every 5~7 years to ensure that fresh and
skeptical eyes are always looking at the numbers. Several bills containing provisions
limiting auditor tenure and mandating auditor rotation were proposed in the House
and the Senate as part of an effort to improve financial reporting and protect investors.

5
However, the views expressed above have not been universally accepted. The
Cohen Commission in 1978 concluded that mandatory rotation costs would exceed
the benefits. The auditing profession has argued that mandatory audit firm rotation
would not only decrease audit quality but also increase the cost of an audit (AICPA
[1992]). The 1996 GAO study opposed auditor rotation citing its detrimental impact
on the value of continuity in conducting audits. The AICPA’s Quality Control Inquiry
Committee of the SEC Practice Section analyzed 406 cases of alleged audit failure
between 1979 and 1991 and concluded that allegations of audit failure occurred
almost three times as often when an audit firm was performing its first or second
audit of a given client (AICPA [1992]).
Given the conflicting views on auditor tenure, Congress decided in 2002 not to
require the mandatory rotation of audit firms. Instead, it directed the GAO to conduct
research on the potential effects of mandatory audit firm rotation on audit quality; the
GAO’s 2003 study concluded that mandatory audit firm rotation may not be the most
efficient way to strengthen auditor independence and improve audit quality. As a
result, Congress decided that it was necessary to require mandatory partner rotation
(not mandatory audit firm rotation) every five years to increase audit quality.4
However, the GAO has left open the possibility of revisiting the mandatory audit
firm rotation requirement if the other requirements of the Sarbanes-Oxley Act do not
lead to improved audit quality (GAO [2003, 5]). In addition, several parties including
the GAO [2003, 9], the New York Stock Exchange [2003, 11], the Commission on
Public Trust and Private Enterprise [2003, 3], and TIAA-CREF [2004, 9] suggested
that periodically changing audit firms may enhance audit quality. Therefore, although
mandatory rotation is not required at the present time, regulators, policy makers, and
institutional investors have continued to be interested in this topic.
2.1.2 Pros and Cons of Mandatory Audit Firm Rotation
The most widely used arguments in favor of auditor rotation are as follows. First,
if auditors continue to audit the entity for too long, they risk developing too close a
4 Following the Sarbanes-Oxley Act, the SEC issued its rules on audit partner rotation in 2003; Rule 2-01(c)(6) of Regulation S-X requires the mandatory rotation of the lead partner and the concurring partner every five years in relation to their audit client.

6
relationship with the client and compromising independence.5 Second, periodically
having a new auditor would bring a fresh look to the public company’s financial
reporting and help the auditor appropriately deal with financial reporting issues
because the auditor’s tenure would be limited under mandatory audit firm rotation.
Third, mandatory audit firm rotation would help in the more even development of the
auditing profession, helping smaller and medium-sized audit firms to grow.
There are several arguments against mandatory audit firm rotation. First, new
auditors may miss problems in the period under review because they lack adequate
experience with the client to notice either unusual events or important changes in the
client’s environment.6 Second, there are not enough large audit firms to address the
audit requirements of large companies, making auditor rotation impracticable at the
ground level. Third, mandatory rotation increases audit start-up costs and the risk of
audit failure because the incoming auditor places increased reliance on the client’s
estimates and representations in the initial years of the engagement. Thus, there may
be negative effects on audit quality and effectiveness in the first years following a
change. Fourth, the rotation would only prevent auditors from building in-depth
institutional knowledge of a client and its business.7
It appears that politicians, regulators, analysts, and small audit firms favor
mandatory audit firm rotation as a solution to the perceived lack of objectivity and
independence of auditors. On the other hand, academicians, companies, and large
audit firms tend to be against mandatory audit firm rotation because changing
auditors is costly. It is certainly interesting to observe such different perspectives on
the same issue.
Without empirical evidence, it is neither clear whether mandatory rotation would
really ensure audit quality by strengthening auditor independence nor obvious
whether the rotation rule would hamper audit quality because of insufficient
knowledge of clients.
5 For example, Waste Management, W. R. Grace, and JWP were identified as three cases in which, in the context of a long-term audit relationship, an issue was identified by the auditors but then not resolved (Turner [2001]). 6 The accounting profession has argued that uncertainty about the characteristics of the client increases the potential for audit failures early in the auditor-client relationship (PricewaterhouseCoopers [2002]). 7 Most obviously, the cumulative knowledge of the existing audit team is lost, and the new auditor faces a steep learning curve. The increasing complexity of large groups and the complexities surrounding the financial reporting of their activities suggest that it can take the new auditor several years to fully understand the business (CGAA).

7
The response to mandatory rotation varies from firm to firm. Intel’s audit
committee decided in 2003 to change its auditor regularly in the wake of calls by a
number of advocates for better corporate governance. Intel had been audited by Ernst
& Young since the chipmaker was founded in 1968. However, the audit committee
had decided that Intel might benefit from obtaining a fresh look at its financial
accounting and internal control processes. LESCO also reported in 2003 that its board
of directors appointed KPMG as the company’s independent auditor by replacing
Ernst & Young. LESCO disclosed in a filing with the SEC that there were no
disagreements between the company and Ernst & Young on any matter of accounting
principles or practices, financial statement disclosure, or auditing scope or procedure.
By contrast, DuPont periodically rotated its auditor not only to assure
disinterestedness on the part of the auditor but also to provide the company with a
fresh perspective (Zeff [2003]). However, in 1954, it allowed Price Waterhouse & Co
to remain as the permanent auditor, particularly in view of the increasing size and
complexity of the company and its extensive overseas operations. These two
seemingly conflicting views under the voluntary auditor change setting suggest that
no clear consensus has emerged in favor of or against the concept of auditor rotation.
2.1.3 Trends in Mandatory Audit Firm Rotation Worldwide
In the wake of a number of financial reporting failures (notably in the U.S. but
also in Europe), legislators and regulators have questioned the quality of auditors’
work. The countries that already have an audit rotation system in place are Italy,
Brazil, Malaysia, Singapore, and Korea. Italy has a statutory requirement for audit
firm rotation every nine years. In Brazil, companies have been made to change
auditing firms every three years. In Singapore, banks are required to change audit
firms every five years, but there is no requirement on listed companies. In 2003,
Korea adopted the mandatory rotation rule and required listed firms to rotate their
auditors every six years starting in 2006.
Spain introduced mandatory rotation in 1988 after a maximum period of nine
years but abolished the mandatory rotation requirement in 1995. In 1998, France
considered the reform proposal with a provision to limit the term of the statutory
auditor to six years but dropped the provision from the proposal at the final stage.

8
Similarly, Austria approved a law in 2002 that required audit firm rotation by the end
of six years, but the requirement has been put on hold.
The U.K. concluded that the mandatory rotation of firms was not necessary.
Instead, it decided to increase the frequency of rotation for the lead audit partner to
every five years. Hong Kong also adopted audit partner rotation in 2003 by requiring
lead audit partners to be rotated every five years. Federation des Experts Compatables
Europeans (FEE) recommended in its letter to the European Commission that the
proposed Directive be amended to omit the suggestion that the mandatory rotation of
audit firms should be seen as an alternative to the mandatory rotation of partners.
Accordingly, none of countries in Europe have introduced mandatory audit firm
rotation.
2.2 Literature Review of Mandatory Audit Firm Rotation
Some studies have reported results consistent with the perspective that audit
quality deteriorates as the length of audit tenure increases. Mautz and Sharaf [1961]
suggested that extended client-auditor relationships alone impede auditor
independence. Deis and Giroux [1992] reviewed audit quality letters produced by a
public audit agency and concluded that audit quality declines as audit tenure increases.
Davis et al. [2002] suggested that longer auditor tenure is associated with the use of
discretionary accruals to manage earnings. This argument is reinforced by Bazerman
et al. [2002], who provided evidence of stronger psychological bias with increasing
ties between the auditor and its client. Dopuch et al. [2001] concluded that mandatory
rotation can increase auditor independence because rotation requirements constrain
low-balling in anticipation of potential income from future engagements.
On the other hand, other studies have provided conflicting results. St. Pierre and
Anderson [1984] and Stice [1991] suggested that many audit errors and lawsuits
occur during early years of the client-auditor relationship. Geiger and Raghunandan
[2002] determined that auditors become more efficient at collecting and evaluating
audit evidence as tenure increase. Carcello and Nagy [2004] proposed that the
probability of fraudulent financial reporting is highest early in the audit firm’s tenure
and is not substantially higher for instances of longstanding audit engagements.
Myers et al. [2004] found no evidence of an association between the nature and
severity of the restatement and auditor tenure. Mansi et al. [2004] suggested that

9
longer audit firm tenure is associated with higher bond ratings and a lower cost of
debt. Ghosh and Moon [2005] found that earnings response coefficients increased
with the length of audit firm tenure, suggesting that earnings have a greater influence
on equity prices as auditor tenure increases. Davis et al. [2009] demonstrated that
both short- and long-term auditor engagements were associated with the increased use
of discretionary accruals to meet and beat earnings forecasts in the pre-SOX period
but that the results disappeared following SOX.
A study by the University of Bocconi in Italy, using the number of suspensions
of partners imposed by the Italian nation commission as a proxy for audit quality,
concluded that mandatory auditor rotation was detrimental to audit quality because it
increased start-up costs and caused disruptions in the appointment phase. Ruiz-
Barbadillo et al. [2009] examined the impact of mandatory audit firm rotation on
auditor behavior in the Spanish context and found no evidence that a mandatory
rotation requirement is associated with a higher likelihood of issuing going-concern
opinions.
Overall, prior research on the effect of audit firm tenure on audit quality has
been mixed, although recent studies have tended to support higher audit quality as
auditor tenure increases. However, regardless of whether the results have been in
favor of or against mandatory audit firm rotation, previous studies have not
determined whether mandatory audit firm rotation would improve or hamper audit
quality. They have merely provided evidence that under the system of voluntary audit
firm rotation, audit quality does not appear to decrease with tenure. Therefore, any
generalization of such findings to a regime with mandatory audit rotation should be
implemented with caution.
To better understand the impact of mandatory audit firm rotation, recent studies
have taken two important approaches. The first approach examines the effect of
mandatory audit firm rotation on audit quality under a real mandatory audit firm
rotation regime. Recent studies have taken this approach by investigating the case of
Arthur Andersen (AA), where ex-AA clients were forced to change auditors because
of AA’s failure (Nagy [2005], Blouin et al. [2007]). However, this setting is not a true
mandatory audit firm rotation regime because companies still possessed considerable
amounts of bargaining power in the case of the AA failure.

10
The second approach examines the effect of audit partner rotation on audit
quality (Carey and Simnett [2006], Chi et al. [2009], Chen et al. [2008]).8 However,
audit partner rotation differs considerably from audit firm rotation; although the
former increases the risk of audit failures during a partner’s initial years on an
engagement and brings fresh eyes to an engagement, increasing audit quality, the
extent of the fresh view is less than that of the latter because of the potential
knowledge transfer and staff sharing within the audit firm. Thus, it is not clear
whether the results from these studies can be extended to a mandatory audit firm
rotation setting. Furthermore, Bamber and Bamber [2009] suggested that, compared
with audit firm rotation, audit partner rotation is likely to yield second-order effects.
Thus, audit partner rotation is not likely to have a substantial effect on audit quality.
Despite these attempts, previous studies have been limited by the fact that the
setting remains the voluntary rotation regime. In this regard, the present study
examines the effect of rotation at the time that mandatory rotation occurs, rather than
the effect of auditor tenure. In addition, the study employs audit hours and audit fees
to capture the rotation-related costs to audit firms and their clients; the study also uses
discretionary accruals to measure client managers’ accounting discretion.
3. Institutional Background and Hypotheses Development
3.1 Mandatory Audit Firm Rotation in Korea
The Korean government has initiated many legal and regulatory reforms since
the 1997 financial crisis. In particular, the government has launched bold programs to
improve corporate governance and accounting standards. In the wake of the Sarbanes-
Oxley Act of 2002, which the U.S. enacted in response to the accounting irregularities
of Enron, the Korean government formed a task force composed of experts from both
the public and private sectors, and the group was mandated to formulate robust
8 Carey and Simnett [2006] found that audit quality, proxied by the propensity to issue going-concern opinions and the incidence of just beating (missing) earnings benchmarks, decreased under long partner tenure. By using audit data from Taiwan, Chi, et al. [2009] found no support for the belief that mandatory auditor audit partner rotation enhances audit quality, whereas Chen et al. [2008] found that audit quality increased with partner tenure.

11
reform proposals to further strengthen Korea’s corporate governance and accounting
standards.
In April 2003, Korean regulators proposed an accounting reform bill that would
require listed companies to change auditors periodically. The bill passed through the
National Assembly, marking an epoch in the Korean accounting market; this contrasts
the situation in the U.S., where the implementation of the same scheme failed in 2002.
The mandatory rotation rule, which requires auditor rotation after six consecutive
years of audit engagement, is intended to prevent auditors from compromising their
duty or independence because of financial interests or a long-term relationship with
the same client. The FSS alleged that companies can easily manipulate their financial
statements in connivance with their long-standing auditor because an accounting firm
conducts audits on a listed company for a number of years.
Korea’s adoption of mandatory audit firm rotation provides us with an ideal
setting in which its real impact on costs and audit quality can be examined. The
voluntary setting provides an understanding of one aspect of a mandatory rotation
regime, but it does not truly allow for the examination of the effect that a forced
auditor change has on the level of audit quality. The voluntary setting considers a
company’s choice of an audit firm as exogenous, but in reality, the company is free to
choose any firm it deems appropriate. Thus, this raises the issue of endogeneity
because typically, troubled firms change auditors more often than sound ones.
Furthermore, there seems to be incentives for managers to switch to incompetent
auditors the moment a problem occurs. In this study, the endogeneity issue does not
arise because we deal with the mandatory rotation regime. In addition, we exploit
publicly disclosed audit hours and audit fees data to complement discretionary
accruals.
3.2 The Effect of Mandatory Audit Firm Rotation on Audit Hours
During the first year of a new appointment, more man-hours are necessary,
together with the deployment of more qualified resources than those usually
employed during the auditing of financial statements. Prior studies (Deis and Giroux
[1996], Caramanis and Lennox [2008]) suggested that if a client changes its auditor,
the incoming auditor is more likely to work longer hours because its start-up costs

12
(e.g., assessing the strength of internal controls) are high. Based on this reasoning, we
propose the following hypothesis:
H1-1: An auditor is more likely to spend more audit hours in its initial
audit engagement than in its subsequent audit engagements.
The engagement by mandatory audit firm rotation is a type of initial audit
engagement. However, it differs from the initial engagement because regulators
scrutinize the results of audits from mandatory audit firm rotation. Thus, auditors
under the mandatory auditor regime are more likely to make more audit effort to meet
regulators’ expectations. Furthermore, voluntary auditor change can be motivated by
opinion shopping; thus, a company may end up with a lower quality audit firm. Thus,
an auditor has less incentive to make audit efforts than an auditor under the
mandatory audit firm rotation regime.
On the other hand, low-balling practices to obtain the initial engagement may
result in insufficient audit work being done as auditors try to meet lower budgets. The
2003 GAO study suggested that if intensive price competition occurs, the expected
benefits of mandatory audit firm rotation can be adversely affected if audit quality
suffers as a result of audit fees that do not support an appropriate level of audit work.
In this case, mandatory audit firm rotation is more likely to reduce audit efforts than
the initial audit engagement.
Based on these two conflicting perspectives, we propose the following
hypothesis in an alternate form:
H1-2: An auditor in its initial audit engagement is likely to spend more
audit hours under the mandatory audit firm rotation regime than that
under the voluntary auditor change regime.
3.3 The Effect of Mandatory Audit Firm Rotation on Audit Fees
3.3.1 Without the Inclusion of Audit Hours as Determinants of Audit Fees
Competition among public accounting firms for providing audit services should
affect audit fees to some extent. Firms may be using low bids to obtain their initial
audit engagement. DeAngelo [1981] suggested that the existence of a learning curve

13
in auditing can lead to low-balling (price below cost) when auditors bid to perform a
new engagement. Simon and Francis [1988] suggested that price cutting exists in
early periods and that fee discounting occurs when clients incur considerable
incremental costs when changing auditors. Deis and Giroux [1996] provided
empirical evidence that initial audits are associated with lower audit fees.
Based on these results, we propose the following hypothesis:
H2-1: An auditor is more likely to charge lower audit fees in its initial
audit engagement than in its subsequent audit engagement.
The rule of mandatory external rotation might intensify price competition. In the
case of auditing, which is generally considered as a public interest activity, such
competition may be considered as inappropriate. If this were the case, then audit fees
under the mandatory audit firm rotation regime would be less than those under the
voluntary auditor change regime.
On the other hand, Petty and Cuganesan [1996] argued that auditing fees are
likely to escalate because auditors may be unable to absorb the initial higher costs
associated with the first years of auditing. Engagements through mandatory audit firm
rotation differ from voluntary initial engagements because the former is a case in
which the economic benefits are truncated from an extended period of repeat
engagements. Thus, auditors have fewer incentives to low-ball audit fees in initial
engagements. Furthermore, clients have less bargaining power because of the lack of
auditor choice. Based on these two conflicting views, the following hypothesis is
proposed:
H2-2: Auditors under the mandatory audit firm rotation regime are likely
to charge higher audit fees than those in their initial audit
engagement under the voluntary auditor change regime.
3.3.2 With the Inclusion of Audit Hours As Determinants of Audit Fees
Audit fees are determined by both audit efforts (audit cost) and audit risk. As
discussed above, mandatory audit firm rotation is likely to affect auditors’ efforts
because of regulators’ scrutiny as well as high start-up costs associated with the initial

14
engagement. In this case, it is not clear whether an audit fee increase stems from
compensation for additional work or from mandatory audit firm rotation per se. To
disentangle the effect of mandatory audit firm rotation on audit fees from that of audit
efforts, we further control for auditors’ efforts.
3.4 The Effect of Mandatory Audit Firm Rotation on Earnings Quality
In the voluntary auditor change setting, audit quality is more likely to deteriorate
for two reasons. First, a client is likely to hire an auditor with audit quality not higher
than its outgoing auditor. In the case of resignation, a client has difficulty finding an
auditor that can provide a similar level of audit quality. In the case of dismissal, a
client has an incentive to hire an auditor to get a desired opinion on an accounting
matter or on the financial statements as a whole. Second, the successor auditor under
the voluntary auditor change setting is unfamiliar with the new engagement and faces
a high learning curve. DeFond and Subramanyam [1998] suggested that audit quality
decreases in the initial year of audit engagement.
Thus, we propose the following alternate hypothesis for the initial audit
engagement:
H3-1: Audit quality in the initial audit engagement is lower than that in the
subsequent audit engagements.
Proponents of mandatory audit firm rotation have argued that long-term
relationships between auditors and their clients impede auditor independence. In
addition, they have suggested that decreased auditor independence can lead to
auditors’ support for more aggressive accounting choices that push the boundaries of
GAAP and can ultimately result in a failure to detect material fraud and/or
misstatements. They have argued that mandatory rotation enhances auditor
independence because managers cannot directly threaten auditors with their dismissal
and cannot promise future income arising from their continued appointment.
On the other hand, opponents of such rotation have questioned whether rotation
itself would reduce the incidence of audit failures because new auditors are invariably
unfamiliar with their clients and need time to acquire the relevant information and
know-how to effectively audit firms. They have argued that audit failures typically

15
occur in the first year of a mandate and that an auditor better understands the client’s
business, control risks, and other factors that contribute to audit failures as auditor
tenure increases.
Based on these two conflicting predictions, it is not clear whether an increase in
skepticism can overcome the hazards of a new engagement. Thus, it would be of
interest to empirically test the overall effect of mandatory audit firm rotation on audit
quality. In this regard, we propose the following hypothesis in the alternate form:
H3-2: Audit quality in the initial audit engagement under the mandatory
auditor regime is lower than that under the voluntary auditor change
regime.
The prior discussion assumes that auditors do not respond to the mandatory audit
firm rotation requirement. However, auditors under the mandatory audit firm rotation
regime participate in the bid with full recognition that they need to develop detailed
knowledge of a company’s business, its risks, and its constantly changing external
and internal environment. Auditors accept an audit engagement only if they are
willing to take considerable time to achieve full effectiveness. Thus, auditors are
expected to make additional efforts under the mandatory auditor regime, which
should reduce the adverse effect of mandatory audit firm rotation on audit quality. It
would be of interest to empirically test whether audit quality deteriorates in the
mandatory audit firm rotation regime after controlling for audit efforts.
4. Research Design
4.1 Measures of Audit Hours, Audit Fees, and Discretionary Accruals
4.1.1 Measures of Audit Hours and Audit Fees
The scarcity of empirical findings on audit efforts has been primarily due to the
unavailability of large data sets on audit hours. Prior research has collected data on
audit hours via either questionnaires (Palmrose [1989]; O’Keefe et al. [1994]) or
confidential sources (Davidson and Gist [1989]; Deis and Giroux [1996]). One
exception is Caramanis and Lennox’s [2008] study, which used a database of audit

16
hours from 9,738 audits in Greece between 1994 and 2002. Their study is notable in
that its sample consists of large-scale data on audit hours for a reasonable timeframe
in the private sector.
Until recently, audit fees have been confidential in most countries. Thus, early
studies obtained audit fee data through questionnaires. Simunic [1980], Palmrose
[1986], and Francis and Simon [1987] mailed questionnaires and collected audit fee
data. Maher et al. [1992] obtained data on external audit fees and internal audit costs
from the Michigan database, a collaborative effort by a nonrandom sample of
companies who agreed to participate in a study of internal auditing for 1977 and 1981.
Recent studies (DeFond et al. [2002], Abbott et al. [2003]) have obtained audit fee
data from proxies filed with the SEC since the SEC established a rule requiring fee
disclosure for proxies filed on or after February 5, 2001.
Korea provides a good research setting for collecting and analyzing data on audit
hours and fees. Korean companies are required to disclose such data in the annual
reports filed with the FSS. In this study, we conducted cross-sectional analyses,
employing 5,557 audits in Korea from 2000 to 2007, by using audit hours, audit fees
and earnings quality from annual reports. The data have two merits, clearly
distinguishing the present study from many previous studies. First, we used data on
actual audit hours and fees. This made a survey unnecessary and eliminated potential
problems arising from non-response bias. Second, we used both audit hours and audit
fees in one study, complementing each other in examining the effect of mandatory
audit firm rotation.
4.1.2 Measurement of Discretionary Accruals
Audit quality is typically viewed as compliance with Generally Accepted
Auditing Standards (GAAS). Consistent with prior research, here we posit that higher
quality audits constrain the extreme choices of management in presenting the
financial position of the firm. Accruals have been widely used to identify these
extreme reporting decisions (Becker et al. [1998], Myers et al. [2003]). In this regard,
we document the effect of mandatory audit firm rotation on earnings quality by using
absolute, signed, and raw [unsigned] accrual measures as proxies for earnings quality.
Accruals are defined as the difference between cash flows from operations and
net income. Hribar and Collins [2002] argued that a portion of the changes in balance

17
sheet working capital accounts relates to non-operating events and may erroneously
be shown as accruals under the balance sheet approach, possibly leading to an
erroneous conclusion that earnings management exists when there is none. They
recommend that accruals be measured directly from the cash flow statement as
follows:
ACCCFt = EBXIt –CFOt , (1)
where EBXIt is earnings before extraordinary items and discontinued operations and
CFOt is operating cash flows taken directly from the statement of cash flows.
We used performance-matched discretionary accruals (DA adj ) as the measure for
discretionary accruals. Following Tucker and Zarowin [2005], DA adj was calculated
as a residual from regression (2) as the regression-based approach, as in Kothari et al.
[2005].9 To measure the discretionary portion of accruals, we first estimated the
predicted nondiscretionary accruals by using the cross-sectional adaptation of the
performance-matched modified Jones model and then subtracted these predicted
nondiscretionary accruals from the realized accruals. Specifically, we estimated the
following regressions for a given year by using the control firms in the same two-digit
industry code as the firms in the sample:
jtjtjt
jtjtjtjtjtjtjtjt
TAROA
TAPPETARECREVTATAACC
13
1211101
/
//)(// , (2)
where ACCjt is accruals in year t for firm j; TAjt-1 is total assets in year t-1 for firm j;
REVjt is revenues in year t less revenues in year t-1 for firm j (i.e., change in
revenues); RECjt is receivables in year t less receivables in year t-1 for firm j (i.e.,
change in receivables); PPEjt is property, plant, and equipment in year t for firm j; jt
is the error term in year t for firm j; and ROAjt is the net income in year t for firm j.
We scaled all the variables in regression (2) by total assets in year t-1 to reduce
potential heteroskedasticity. These cross-sectional regressions were re-estimated for
9 Kothari et al. [2005] found that performance-matched discretionary accrual measures enhance the reliability of inferences from earnings management research.

18
each year in the sample period. The nondiscretionary accruals deflated by the total
assets (NDACC) for the sample firms were computed as follows:
13121110 ///)(/ itjtjtjtjtjtjtjtjt TAROAaTAPPEaTARECREVaTAaNDACC
, (3)
where 0a , 1a , 2a , and 3a are the estimated coefficients from regression (3). The
discretionary accruals (DACC) were computed as the difference between realized
accruals scaled by prior-year total assets and NDACC.
4.2 Model Specification
4.2.1 Audit Hours Model
We used the following model to test the hypotheses on audit hours.
LAHjt = + 1INITIALjt + 2INITIALjt MAN_ROTjt + 3LagLAHjt + 4LTAjt
+ 5BIGjt + 6CA_CLjt + 7LEVjt + ejt , (4)
where
LAH = the natural log of audit hours,
INITIAL = 1 if an audit was an initial engagement and 0 otherwise,
MAN_ROT = 1 if a firm changed its auditor as a result of the auditor
rotation requirement and 0 otherwise ,
LagLAH = the log of lag audit hours,
LTA = the natural log of total assets,
BIG = 1 if a firm was audited by one of Big N audit firms and 0
otherwise,
CA_CL = the current ratio (current assets ÷ current liabilities),
LEV = the ratio of long-term liabilities and debt to total assets.
The coefficients of interest were 1, the coefficient of INITIAL, and 2,, the
coefficient of the interaction term between INITIAL and MAN_ROT. We expected
that the coefficient estimate of 1 would be positive. The coefficient estimate of 2
was of primary interest because it allowed the determination of whether there were
19
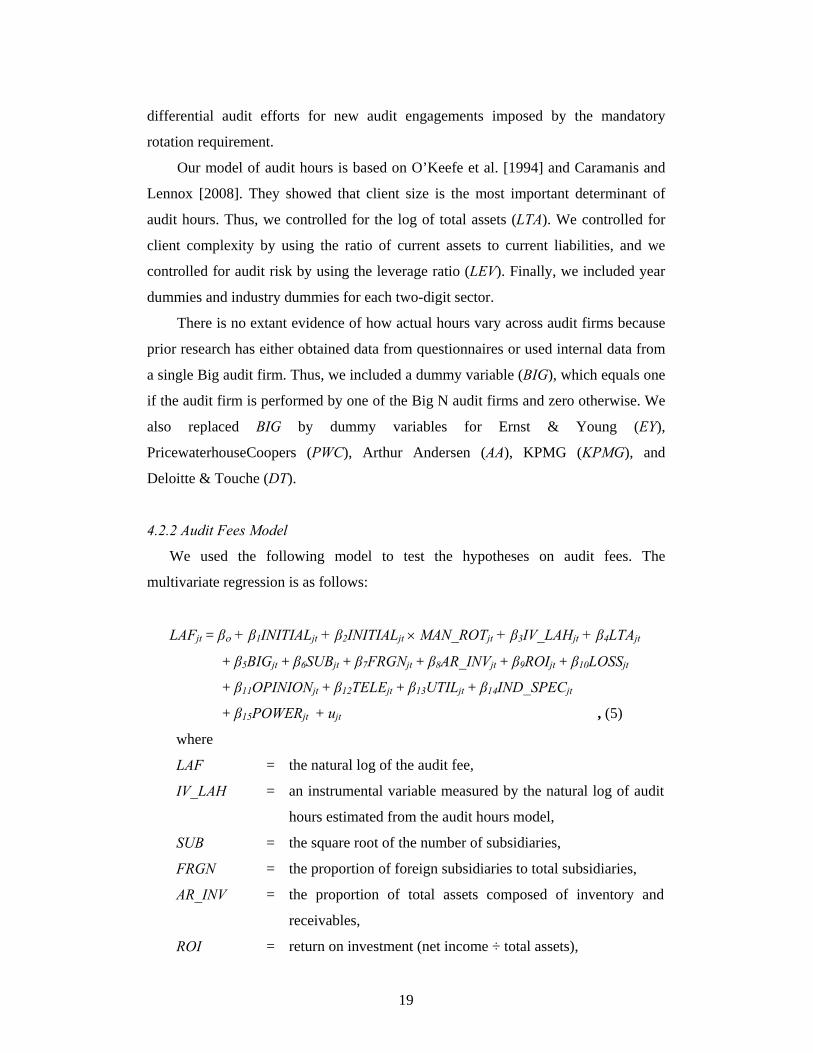
differential audit efforts for new audit engagements imposed by the mandatory
rotation requirement.
Our model of audit hours is based on O’Keefe et al. [1994] and Caramanis and
Lennox [2008]. They showed that client size is the most important determinant of
audit hours. Thus, we controlled for the log of total assets (LTA). We controlled for
client complexity by using the ratio of current assets to current liabilities, and we
controlled for audit risk by using the leverage ratio (LEV). Finally, we included year
dummies and industry dummies for each two-digit sector.
There is no extant evidence of how actual hours vary across audit firms because
prior research has either obtained data from questionnaires or used internal data from
a single Big audit firm. Thus, we included a dummy variable (BIG), which equals one
if the audit firm is performed by one of the Big N audit firms and zero otherwise. We
also replaced BIG by dummy variables for Ernst & Young (EY),
PricewaterhouseCoopers (PWC), Arthur Andersen (AA), KPMG (KPMG), and
Deloitte & Touche (DT).
4.2.2 Audit Fees Model
We used the following model to test the hypotheses on audit fees. The
multivariate regression is as follows:
LAFjt = β + β1INITIALjt + β2INITIALjt MAN_ROTjt + β3IV_LAHjt + β4LTAjt
+ β5BIGjt + β6SUBjt + β7FRGNjt + β8AR_INVjt + β9ROIjt + β10LOSSjt
+ β11OPINIONjt + β12TELEjt + β13UTILjt + β14IND_SPECjt
+ β15POWERjt + ujt , (5)
where
LAF = the natural log of the audit fee,
IV_LAH = an instrumental variable measured by the natural log of audit
hours estimated from the audit hours model,
SUB = the square root of the number of subsidiaries,
FRGN = the proportion of foreign subsidiaries to total subsidiaries,
AR_INV = the proportion of total assets composed of inventory and
receivables,
ROI = return on investment (net income ÷ total assets),

20
LOSS = 1 if the company reported an operating loss in each of the
past two years and 0 otherwise,
OPINION = an indicator variable equal to 1 if the firm received a going-
concern modification in the prior year and 0 otherwise,
TELE = 1 if a firm operated in a telecommunication industry and 0
otherwise,
UTIL = 1 if a firm operated in an utility industry and 0 otherwise,
IND_SPEC = 1 if an auditor had 25 (33.3) percent or more market share in
an industry in each year and 0 otherwise,
POWER = the natural logarithm of each company’s sales divided by the
sum of industry sales for all firms in the industry audited by
the company’s auditor.
The INITIAL variable was coded as 1 if an audit was an initial engagement and 0
otherwise. Simon and Francis [1988] found that there is a significant fee reduction in
the initial engagement. H2-1 predicts that the coefficient estimate of β1 is negative or
non-positive. The MAN_ROT variable was coded as 1 if an auditor change occurred
as a result of the mandatory rotation requirement and 0 otherwise. MAN_ROT was the
variable of primary interest because it allowed the determination of whether there was
the pricing of new audit engagements imposed by the mandatory rotation requirement.
We included the instrument variable IV_LAH in the full model to address the
endogeneity issue. First, we regressed the log of audit hours at t (LAHjt) with respect
to log-lagged audit hours at t-1 (LAHjt-1) with control variables in the regression. We
expected strong persistence in audit hours, which would make lagged audit hours a
powerful predictor of current audit hours. In addition, LAHjt-1 was expected to be
uncorrelated with ujt. Second, we obtained the predicted (instrumented) log of audit
hours (IV_LAHjt) by using the coefficient estimates in the first regression.
The control variables included in our analysis were drawn from a large body of
research on audit fees (Casterella et al. [2004], Huang et al. [2007]). We included the
LTA variable, the natural log of total assets, because larger client firms were expected
to require more audit effort and consequently higher audit fees. We included the Big
N indicator variable (BIG) to represent the high-quality audit service provided by Big
N auditors, which was expected to influence audit fees (Francis and Simon [1987]).

21
We controlled for client complexity by including the square root of the number of
subsidiaries (SUB) and the proportion of foreign subsidiaries to total subsidiaries
(FRGN). AR_INV measures the proportion of total assets in inventory and accounts
receivable. Because the audit fee is positively related to client size, client complexity,
client-specific risk factors, and high-quality service, we predicted all these
coefficients to be positive.
Prior research has controlled for the client’s financial status and risk profile. We
used an indicator variable (ROI), return on investment, to measure profitability. We
also employed another indicator variable (LOSS) to capture client-specific litigation
risks. LOSS was coded as 1 if the client reported a net loss and 0 otherwise. OPINION
was coded as 1 if the client received a going concern modification in the sample year
and 0 otherwise. We further controlled for industry characteristics by including TELE
(telecommunication industry) and UTIL (utility industry) dummy variables (Huang et
al. [2007]). In addition, auditor industry specialization (IND_SPEC) and client
bargaining power (POWER) were included.
4.2.3 Discretionary Accruals Model
We used the following model to test the hypotheses on audit quality. Our model
specification is as follows:
DAjt = + 1INITIALjt + 2INITIALjt MAN_ROTjt + 3IV_LAHjt + 4LTAjt
+ 5BIGjt + 6AGEjt + 7OCF_TAjt + 8IND_GRWTHjt
+ 9CA_CLjt + vjt , (6)
Where
DA = Discretionary accruals,
AGE = the number of years after establishment,
OCF_TA = the ratio of operating cash flows to total assets,
IND_GRWTH =
N
iitSales
1
/
N
iitSales
11 by two-digit SIC code.
The coefficients of interest were 1, and 2. DeFond and Subramanyam [1998]
found that discretionary accruals are income-decreasing during the last year with the
predecessor auditor. Our key variables were INITIAL, which was coded as 1 if an

22
audit was performed by a predecessor auditor, and MAN_ROT, which was coded as 1
if an initial engagement occurred as a result of the mandatory rotation requirement.
The instrument variable IV_LAH was measured as described in 4.2.2.
The control variables in our analysis were drawn from Myers et al. [2003].
Client size is positively related to abnormal accruals (Becker et al. 1998]. Thus, we
included client size (LTA) as a control variable. We included the Big dummy variable
to control for differences in earnings management between Big N and non-Big N
client firms (Becker et al. 1998). We included AGE because accruals differ with
changes in the firm’s life cycle (Anthony and Ramesh [1992], Dechow et al. [2001],
Myers et al. [2003]). OCF_TA was included because firms with higher cash flows
from operations are more likely to be better performers (Frankel et al. 2002) and
because accruals and cash flows are negatively correlated on average (Dechow [1994],
Sloan [1996], Myers et al. [2003]). We controlled for IND_GRWTH because growth
in the industry should be positively correlated with accruals (Myers et al. [2003]).
Butler, Leone, and Willenborg [2004] found a positive relation between discretionary
accruals and liquidity. Based on their study, we included the current ratio (CA_CL) to
control for liquidity.
5. Empirical Results
5.1 Sample
The sample firms were selected from companies listed on the Korean Stock
Exchange (KSE) and Korea Securities Dealers Automated Quotations (KOSDAQ)
from 2000 to 2007. Initially, a total of 12,463 firm-year observations were obtained
from the KIS value database.10 Non-December year-end firms were excluded because
their tax change effects could have been different. We also excluded 266 financial
and insurance observations from the sample because of differences in financial
characteristics. We further deleted observations if audit fee, audit hour, and financial
data were not available during the sample period. Firms in the industry with less than
eight member firms each year were also excluded because discretionary accruals were
estimated for each industry and each year by using the cross-sectional modified Jones 10 The KIS value database is provided by Korea Investors Service Inc., which is affiliated with
Moody’s.

23
model (Kothari et al. [2005]). These procedures resulted in the final sample
comprising 5,557 firm-year observations (Table 1). There are more observations after
2005 because the disclosure of audit hours and audit fees has stabilized since it was
made mandatory in 2000.
<Insert Table 1 here>
5.2 Descriptive Statistics
5.2.1 Frequency of Observations with Respect to Initial Audit Engagement, Auditor
Change, Industry, and Year
Panel A of Table 2 reports the frequency of observations for the consecutive
audit and initial audit engagements. Out of 5,557 observations, 4,373 (78.7%)
engagements were consecutive audits, and 1,184 (21.3%) were initial audits. Roughly
speaking, one out of five was an initial audit engagement. Of these 1,184 initial
engagements, 1,010 observations were classified as voluntary auditor change. The
remaining 174 engagements were due to auditor change based on the mandatory audit
firm rotation requirement.
Panels B of Table 2 presents the frequency of predecessors and successors for
the 174 engagements. Out of 112 Big audit firm clients, 86 clients (76.8%) chose
another Big audit firm, and the remaining 26 clients (23.2%) chose a non-Big audit
firm. On the other hand, of the 62 non-Big clients, 27 clients (43.5%) switched to a
Big audit firm, and only 35 clients (56.5%) chose a non-Big audit firm. This indicates
the increased concentration of Big N audit firms. This is inconsistent with the recent
argument by Economist [2004] that mandatory audit firm rotation can be a
mechanism to mitigate the dominance of Big N audit firms in the market for public
companies.
Panel C presents the frequency analysis (the net gain or loss of clients for each
audit firm). For example, PWC lost 42 clients but gained 26 clients after the
mandatory audit firm rotation. Thus, PWC experienced 16 losses. Other than PWC,
all the Big audit firms gained clients from the rotation requirement. The biggest
winner was Deloitte Touche, which had a net gain of 10 clients. Non-Big audit firms
lost 62 clients and gained 61 clients, indicating that the effect of mandatory audit firm
rotation on gaining clients was minimal.

24
Panel D of Table 2 shows the industry distribution of our sample firms according
to the 2-digit industry classification code of the Korea National Statistical Office.
Although many firms were concentrated in industries such as chemicals (11.48%),
other machinery (6.75%), computer (6.68%), and basic metals (6.05%), firms were
relatively evenly distributed across all industries, indicating no significant industry
clustering. Panel E of Table 2 exhibits the distribution of the sample by year. There
are more observations since 2005 because the disclosure of audit hours and audit fees
has spiked around this period, even though the disclosure has been required since
2000.
<Insert Table 2 here>
5.2.2 Descriptive Statistics of Study Variables and the Correlation Matrix
Table 3 presents the descriptive statistics for the variables used in our analysis.
The means of INITIAL, VOL_ROT, and MAN_ROT were 0.21, 0.18, and 0.03,
respectively, which were derived from the frequency data in Panel A of Table 2. The
mean and median values of audit hours (AH) were 806 and 516, respectively. The
corresponding values of audit fees (AF) were $73,483 and $50,000, respectively. The
means of both variables were larger than the medians, indicating right-skewed
distributions for both audit hours and audit fees. We then took logarithms of audit
hours and audit fees to normalize the distributions. The mean (median) DA adj was
0.000 (0.000), and the mean (median) Abs_DA adj was 0.08 (0.05). The mean value of
BIG was 0.58, indicating that 58% of the sample was audited by Big N audit firms.
<Insert Table 3 here>
Table 4 reports the correlations among audit hours, audit fees, earnings quality,
and other control variables. The audit hour variable, LAH, was not significantly
correlated with INITIAL but was positively (negatively) correlated with MAN_ROT
(VOL_ROT). This suggests that an auditor is more likely to spend more audit hours in
an initial audit engagement under the mandatory audit firm rotation regime than under
the voluntary audit firm rotation regime. The negative and significant correlation
between LAF and INITIAL suggests that an auditor is likely to charge lower audit fees

25
in an initial audit engagement, which is consistent with H2-1. We did not find a
significant correlation between DA adj and INITIAL, MAN_ROT, and VOL_ROT. This
implies that discretionary accruals neither increased nor decreased in the first year
when auditors changed. DA adj was negatively related to LAH, indicating that the
more the audit effort, the less the discretionary accruals became. The correlations of
BIG with LAH and LAF were significantly positive, but its correlation with DA adj was
significantly negative. This suggests that Big N audit firms make more effort and
receive higher audit fees and constrain clients from managing earnings more than
non-Big firms. The other correlations are consistent with the expectations and the
findings of prior research.
<Insert Table 4 here>
5.2.3 Univariate Analyses of Audit Hours, Audit Fees, and Audit Quality
Panel A of Table 5 presents the univariate analyses between consecutive audit
and initial audit engagements. Initial audits had significantly lower LAF and higher
Abs_DA adj and OPINION than consecutive audits. This suggests that an auditor in an
initial audit engagement is more likely to charge lower audit fees, allow clients to
exercise more discretion, and issue a going-concern opinion than an auditor in
consecutive audits, supporting H2-1 and H3-1.
Panel B compares MAN_ROT with VOL_ROT with respect to audit hours, audit
fees, and audit quality. It shows that MAN_ROT firms had significantly higher AH
and AF than VOL_ROT firms, indicating that an auditor under the mandatory audit
firm rotation is more likely to spend more audit hours and charge higher audit fees
than in an initial auditor under the voluntary auditor change regime. There was no
significant difference in DA adj and Abs_DA adj between MAN_ROT and VOL_ROT
firms. However, MAN_ROT firms had lower OPINION than VOL_ROT firms.
However, it is not clear whether the result that MAN_ROT firms issued a going-
concern opinion less frequently than VOL_ROT firms stemmed from low audit
quality or from high-quality clients that cared less about going-concern issues. Thus,
multivariate analyses are needed to control for client characteristics.

26
<Insert Table 5 here>
5.3 Regression Analyses of the Impact of Mandatory Audit Firm Rotation on
Audit Hours
Table 6 reports the results for the models of audit hours. The coefficient of
INITIAL was positive and significantly associated with audit hours, consistent with
those in Giroux et al. [1995], Deis and Giroux [1996], and Caramanis and Lennox
[2008]. This indicates that auditors invested the additional effort required to audit a
new client. However, the inclusion of the interaction term of INITIAL with
MAN_ROT made the coefficient of INITIAL nonsignificant, whereas the term
INITIAL MAN_ROT was significantly positive. This indicates that the significant
coefficient of the initial engagement was driven by a subset of firms required to rotate
auditors. This was unexpected, given the high set-up costs associated with the first
year’s engagement. This suggests that newly appointed auditors work more hours
than retained incumbent auditors only when they are engaged by the mandatory
rotation requirement.
<Insert Table 6 here>
As expected, the coefficients of LTA (0.287) and BIG (0.248) were significantly
positive. Consistent with O’Keefe et al. [1994], company size and audit firm
size/reputation were all important determinants of audit hours. Therefore, audit hours
were significantly higher for large clients and/or Big N audit firms than for small
clients and non-Big N audit firms. In Model 3, we replaced the BIG variable with
dummy variables for each of the Big N audit firms (PWC, EY, AA, KPMG, and DT).
The coefficients of these Big N dummy variables were all significantly positive
except AA. This indicates that, after controlling for client characteristics such as client
size, all Big N audit firms except Arthur Andersen made more effort than non-Big N
audit firms (Arthur Andersen made less effort than non-Big N audit firms). In model
4, we decomposed INITIAL into MAN_ROT and VOL_ROT and found that the
coefficient of MAN_ROT (0.289) was significant and positive and that the coefficient
of VOL_ROT was nonsignificant.

27
In Model 5, we included the log of the previous year’s audit hours (LagLAH) as
an independent variable to control for persistence in audit hours. The coefficient of
LagLAH was positive and highly significant (t-statistic = 33.56), showing strong
persistence in audit hours. We used the coefficient estimates in Model 5 to obtain the
instrumented log of audit hours (IV_LAH). As IV_LAHjt-1 was a strong predictor of
IV_LAHjt, we were confident that IV_LAHjt was a powerful instrument. We tested
whether IV_LAHjt was a valid (i.e., exogenous) instrument when we estimated the
audit fees and earnings management models. The magnitudes of LTA and BIG
coefficients decreased to a great extent but were still significantly positive. In Model
5, CA_CL and LEV were positive and significant after LagLAH was included.
It is quite evident that the auditee incurs additional costs as a result of the greater
amount of time devoted to interactions with the new audit firm by managers,
personnel, and internal auditors who supply to the audit firm necessary information
on aspects concerning corporate governance, internal control systems, organizational
structure, market position, and so forth. In addition, it seems that mandatory audit
firm rotation imposes an increased financial burden on audit firms while making it
difficult to predict and quantify the potential benefits of mandatory audit firm rotation.
5.4 Regression Analyses of the Impact of Mandatory Audit Firm Rotation on
Audit Fees
The results reported in Table 7 show that the association between the initial
engagement (INITIAL) and audit fees (LAF) was negative but insignificant. It became
significant when we included the interaction term of INITIAL with MAN_ROT. This
is consistent with H2-1. We further decomposed INITIAL into MAN_ROT and
VOL_ROT in Model 2 and found that the coefficient of MAN_ROT was significant
and positive and that the coefficient of VOL_ROT was significant and negative. Our
findings suggest that lower initial audit fees are dominant in VOL_ROT than in
MAN_ROT and that low-balling of initial audit fees do not happen under the
mandatory rotation regime.
<Insert Table 7 here>

28
The coefficient of INITIAL MAN_ROT was positive and significant even when
the instrumented variable of audit hours was included, suggesting that initial
engagements arising from the mandatory rotation requirement fetch higher audit fees.
To the extent that audit fees are competitively determined in the audit market and that
clients are willing to pay additional audit fees for high-quality audits, audit fees can
be used as a proxy for audit quality. From this point of view, the results might suggest
that the mandatory audit firm rotation requirement enhanced audit quality.11
However, it may be premature to make any decisive conclusion because the audit
fee is a noisy proxy for audit quality. High audit fees can be driven by the bargaining
power auditors have under the mandatory rotation regime. Clients are often limited to
choices among the Big 4 firms. The choices can be further restricted because the
accounting profession has become segmented by industry and because a lack of
industry-specific knowledge may preclude some firms from performing audits.12 Thus,
it is difficult to attribute an increase in audit fees for firms under mandatory audit firm
rotation to an increase in audit quality. Thus, we conclude that the mandatory audit
firm rotation increased the audit cost to clients.
The LTA and BIG variables were significantly positive, consistent with prior
studies (e.g., Craswell et al. [1995]). The proxies for operational complexity were
SUB, FRGN, and AR_INV, and those for audit risk were ROI, and LOSS. Some of the
control variables were both significant and in the correct direction. The coefficient of
IND_SPEC was significantly positive, indicating that specialist auditors received
audit premium. The coefficient of POWER was slightly positive but not consistent
with prior research (Casterella et al. [2004], Huang et al. [2007]).13 However, because
the results varied across models, we can place less weight on the significance of the
POWER variable.
11 The relationship between mandatory audit firm rotation and audit quality is addressed in section 5.5. 12 For a company limited to using Big 4 firms, the selection may be limited because an audit firm providing certain non-audit services or serving as a company’s internal auditor is prohibited by independence rules from also serving as that company’s auditor of record. In some cases, a company may also be limited in its choice of firms if an audit firm audits one of the company’s major competitors and the public company decides not to use that firm as its auditor of record (GAO [2003]). 13 Casterella et al. [2004] and Huang et al. [2007] documented a negative association between client bargaining power and audit fees, suggesting that audit fees are lower when clients have greater bargaining power.

29
5.5 Regression Analyses of the Impact of Mandatory Audit Firm Rotation on
Audit Quality
In this section, we document the effect of adopting the mandatory audit firm
rotation requirement on earnings quality. Following prior studies, we employed
discretionary accruals as a proxy for earnings quality. Panel A of Table 8 presents the
results of the OLS regression model estimated with the dependent variable of
abnormal accruals, and Panel B shows the results with the dependent variables of
positive abnormal accruals and negative abnormal accruals.
<Insert Table 8 here>
The INITIAL variable was negative but nonsignificant across models, indicating
that discretionary accruals did not increase in the initial audit engagement year. This
is inconsistent with the concern about poor audit quality in the initial years as a result
of insufficient knowledge of firm-specific risks. The interaction term INITIAL
MAN_ROT was positive but not significant across all models (except the model with
positive abnormal accruals). This result indicates that the forced auditor change under
the mandatory auditor regime did not decrease discretionary accruals; instead, it
increased discretionary accruals when they were income-increasing accruals. This
finding lends some support to no increase or and/or a decrease in audit quality
following a mandatory auditor change. The mandated rotation did not enhance audit
quality; instead, it decreased audit quality while imposing higher audit costs.
The LAH variable and its instrument variable, IV_LAH, were significantly
negative. This is consistent with the results of Caramanis and Lennox [2008] and
suggests that abnormal accruals are more likely to be income-increasing than income-
decreasing accruals when audit hours are low. On the other hand, the audit hour
coefficients were not significantly negative in the models with the dependent variable
of positive abnormal accruals but were significantly negative with that of negative
abnormal accruals. This indicates that less audit effort does not necessarily increase
income-increasing abnormal accruals but that it increases income-decreasing
abnormal accruals. Because audit hours here indicate a raw measure correlated with
other control variables in the regression model, we rely more on the result based on
the IV_LAH variable than that based on the instrument variable IV_LAH.

30
For abnormal accruals, the BIG coefficient was not different from 0. However, for
positive abnormal accruals, the coefficient was significantly negative, indicating that
income-increasing abnormal accruals were significantly smaller for Big N audit firms
than for non-Big N. For negative abnormal accruals, the coefficient was significantly
positive, indicating that income-decreasing abnormal accruals were significantly
larger for Big N audit firms than for non-Big N. This result suggests that Big N audit
firms are effective in constraining extreme abnormal accruals. Noteworthy is that the
coefficient of AA was positive, indicating that firms audited by Arthur Andersen had
more abnormal accruals than non-Big audit firms.
The OCF_TA control variables all had significantly negative coefficients,
implying that financially healthy firms are less likely to manage earnings. On the
other hand, the IND_GRWTH variable was significantly positive. This is consistent
with the view that firms with growth opportunities are more likely to be engaged in
earnings management (Myers et al., 2003). The LEV variable was significantly
negative, suggesting that the higher the debt-to-equity ratio, the less likely the firms
will manage earnings, which is not consistent with the prediction. The TENURE
variable was positive and significant, but the magnitude of the coefficient was so
small that it may have no economic significance. Furthermore, the correlation of
TENURE with the INITIAL and VOL_ROT variables was significantly negative by
construction, indicating that we need to interpret the TENURE coefficient with
caution.
6. Additional Analyses
Several sensitivity tests were performed to check the robustness of our results.
6.1 Alternatives Measures of Audit Quality
Carey and Simnett [2006] used three common measures -- i) the auditor’s
propensity to issue a going-concern opinion for distressed companies, ii) the amount
of abnormal working capital accruals, and iii) the extent to which key earnings targets
are just beaten (missed) -- as proxies for audit quality to determine whether there is a
negative association between long audit partner tenure and audit quality. In this
section, we also test the effect of mandatory audit firm rotation on earnings quality by

31
using the propensity to issue a going-concern opinion for financially distressed
companies and the observations that just beats or misses breakeven as the alternative
earnings quality measures for robustness.
6.1.1 Propensity to Issue a Going-Concern Opinion for Financially Distressed
Companies
We examined the effect of the initial audit and the mandatory audit firm rotation
regime on the propensity to issue a going-concern opinion for financially distressed
companies. Panel A of Table 9 reports the nonsignificant coefficients of INITIAL and
INITIAL MAN_ROT for the regression of both Models 1 and 2, suggesting a
minimal effect of mandatory audit firm rotation on the alternative measure of
earnings quality, which is consistent with Ruiz-Barbadillo et al.’s [2009] results for
Spain.
<Insert Table 9 here>
6.1.2 Observations that Just Beats or Misses Breakeven
We investigated the effect of the initial audit and the mandatory audit firm
rotation regime on the propensity to just beat or miss breakeven. Panel B of Table 10
reports the earnings benchmark frequency and statistics. The results indicate that
MAN_ROT (13.2%) had a slightly higher proportion of just beats (the net profit to
total assets is 0 to 2%) than VOL_ROT (12.3%), but the difference is not significant.
Panel C of Table 10 provides the results of the logistic regression with the dependent
variables of Beats breakeven and Misses breakeven. The coefficients of INITIAL and
INITIAL MAN_ROT for the regression of just beats breakeven and just misses
breakeven were not statistically significant.
To summarize, the findings from the alternative approach indicate that mandatory
audit firm rotation had little significant effect on audit quality, supporting the main
results.
6.2 Focus on the Initial and Final Engagements
6.2.1 Initial Engagement

32
There is an omitted variable problem if the initial audit engagement has certain
characteristics that are correlated with audit hours, audit fees, and audit quality but are
not controlled for in the regression models. Then it is possible to attribute the effect of
mandatory audit firm rotation to the VOL_ROT and/or MAN_ROT variables. Thus, we
tested the impact of mandatory audit firm rotation on audit hours, audit fees, and
earnings quality by focusing on the sample of 1,184 initial audit engagements. Panel
A of Table 10 shows that MAN_ROT had positive coefficients on LAH and LAF but
nonsignificant coefficient on DA adj , which is consistent with the main findings.
<Insert Table 10 here>
6.2.2 Final Engagement
We examined audit hours, audit fees, and accruals in the auditor’s sixth year with
a client. In the old era (2000-2005), the sixth year was just like any other year. In the
new era (2006-2007), the sixth year was the incumbent’s final year before the
mandatory rotation. We investigated whether auditors systematically altered their
efforts and fees in the sixth year by comparing pre- with post- periods. Panel B of
Table 10 shows that the coefficient on LAF was 0.408 (positive and significant),
indicating that in post-periods, the final engagement entailed higher audit fees than
one in pre-periods.
6.3. Control for Structural Change in Voluntary Audit Firm Rotation
Our main models do not control for the distinction between voluntary audit firm
changes in the old era (2000-2005) and voluntary changes in the new era (2006-2007).
Model 3 of Table 6, Model 4 of Table 7, and Model 3 of Table 8 contrast mandatory
changes in 2006-2007 with voluntary changes in 2000-2007. We defined NEWERA as
a dummy variable of 1 from 2006 to 2007 and 0 from 2000 to 2005 and added the
interaction variable between VOL_ROT and NEWERA in our main model. Table 11
shows that there were marginal increases in LAH and LAF for VOL_ROT in post-
periods. The sign and significance of the coefficient on LAH and LAF for MAN_ROT
remained the same after controlling for structural changes in firms under voluntary
audit firm rotation.
33
<Insert Table 11 here>
6.4 Miscellaneous Sensitivity Analyses
Several sensitivity tests were performed to check the robustness of our results.
6.4.1 Alternative Measure of Discretionary Accruals
Following Dechow et al. [1995], we obtained discretionary accruals DA mod based
on the modified Jones model. The discretionary accruals (DA mod ) were calculated as
the residuals from regression (7). The unreported results using DA mod as earnings
quality were similar to those using DA adj , suggesting the robustness of our findings in
estimating discretionary accruals.
6.4.2 Lack of Choice
One of the most practical concerns is the limited number of audit firms available
from which to choose. For example, some companies, particularly those with
geographically diverse operations or those operating in certain industries, may be
somewhat limited in their choice of auditing firms capable of performing the audit.
Not all audit firms have offices or staff located in all the geographic areas, whether
domestically or internationally, where the clients conduct their operations, nor do all
audit firms have personnel with certain industry knowledge to be able to perform
audits of clients that operate in specific environments (GAO [2003]).
It would be difficult for companies operating in very specialized industries to
meet the mandatory rotation requirements, which might potentially impede audit
quality. In some industries, major audit firms may possess differing levels of
expertise to effectively serve a particular company. If one of those firms provides
internal audit services and another provides prohibited non-audit services, the only
way for the company to meet the rotation requirement would be to choose a firm that
lacks the depth of industry expertise, which could increase risks and potentially harm
the company as well as its shareholders (GAO [2004]).
We tested whether firms, given their lack of choice, chose industry specialists.
The Pearson correlation between MAN_ROT and IND_SPEC, capturing auditor
industry specialization, was -0.018 (p-value = 0.170), which was not significant,
whereas the correlation between MAN_ROT and BIG was 0.027 (p-value=0.047),

34
which was significant at the 5% level. The results indicate that firms did not
necessarily choose an industry specialist as a way to have more choices.
6.4.3 Winsorization of Variables
We winsorized all the continuous variables at the top 1% and bottom 99%
percentiles to avoid outlier problems. We found that the unreported results for each
hypothesis remained qualitatively unchanged.
7. Conclusion
The mandatory rotation of audit firms has long been recommended as a means to
improve audit effectiveness for high-quality financial reporting. In this study, we
examined the impact of mandatory audit firm rotation on competition in the audit
market, the cost of audit services, and the quality and independence of audit activities.
Using a unique database consisting of 12,463 firm-year observations in Korea
between 2000 and 2007, we investigated the effect of mandatory audit firm rotation
on audit hours, audit fees, and audit quality. After the mandatory audit firm rotation
took effect in 2006, (1) audit hours increased, (2) audit fees increased, and (3) audit
quality (measured as abnormal discretionary accruals) remained unchanged or
decreased slightly. These results, which are robust to controlling for potential
endogeneity between audit hours and earnings management and to measuring audit
quality alternatively, suggest that mandatory audit firm rotation increases the cost for
audit firms and clients while having no discernable positive effect on audit quality.
An important implication of this study is that imposing mandatory audit firm
limits on the duration of the auditor-client relationship may result in unintended costs
without improvements in audit quality.
This study focuses on the impact of mandatory audit firm rotation on auditor
costs (audit hours), client costs (audit fees), and financial reporting quality
(discretionary accruals). In this regard, future research using alternative proxies for
audit quality (e.g., ERC or restatements) is warranted to further examine the effect of
mandatory audit firm rotation on audit quality. It may also be beneficial to replicate

35
the results of this study by using data from other countries as audit fee data are now
available in many countries, including the U.S.

36
REFERENCES
ABBOTT, L. J., S. PARKER, G. F. PETERS, and K. RAGHUNANDAN. ‘The
Association between Audit Committee Characteristics and Audit Fees.’ Auditing:
A Journal of Practice & Theory 22 (2003): 17-32.
BAMBER E. M. and L. S. BAMBER, ‘Discussion of “Mandatory Audit Partner
Rotation, Audit Quality, and Market Perception: Evidence from Taiwan’
Contemporary Accounting Research 26 (2009): 393–402.
BAZERMAN, M., G. LOEWENSTEIN, and D. MOORE. ‘Why Good Accountants
Do Bad Audits.’ Harvard Business Review 80 (2002): 97-102.
BECKER, C., M. DEFOND, J. JIAMBALVO, and K.R. SUBRAMANYAM. ‘The
Effect of Audit Quality on Earnings Management.’ Contemporary Accounting
Research 15 (1998): 1-24.
BENSON, M. ‘Calpers Vows Action to Help Prevent Accounting Schemes.’ Wall
Street Journal (Feb. 22, 2002).
BlOUIN, J., B. GREIN, and B. ROUNDTREE. ‘An Analysis of Forced Auditor
Change: The Case of Former Arthur Andersen Clients.’ The Accounting Review
82 (2007): 621–650.
BUTLER, M., LEONE, A., and M. WILLENBORG. ‘An Empirical Analysis of
Auditor Reporting and its Association with Abnormal Accruals.’ Journal of
Accounting and Economics 37 (2004): 139–165.
CARCELLO, J., and A. NAGY. ‘Audit Firm Tenure and Fraudulent Financial
Reporting.’ Auditing: A Journal of Practice & Theory 23 (2004): 55–69.
CARAMANIS, C. and C. LENNOX. ‘Audit Effort and Earnings Management.’
Journal of Accounting and Economics 45 (2008): 116–138
CAREY, P. and R. SIMNETT, ‘Audit Partner Tenure and Audit Quality.’ The
Accounting Review 81 (2006): 653-676.
CASTERELLA, J., W. R. KNECHEL, and P. WALKER. ‘Factors Affecting the
Influence of Auditor Tenure on Auditor Judgment.’ Unpublished paper,
University of Florida. (2004).

37
CHEN, C., C. LIN, and Y. LIN. ‘Audit Partner Tenure, Audit Firm Tenure, and
Discretionary Accruals: Does Long Auditor Tenure Impair Earnings Quality?’
Contemporary Accounting Research 25 (2008): 415-45.
CHI, W., H. HUANG, Y. LIAO, and H. XIE. ‘Mandatory Audit Partner Rotation,
Audit Quality, and Market Perception: Evidence from Taiwan.’ Contemporary
Accounting Research 26 (2009): 359-391.
CHUNG, H., and S. KALLAPUR. ‘Client Importance, Nonaudit Services, and
Abnormal Accruals.’ The Accounting Review 78 (2003): 931–55.
DAVIS, L. R., B. S. SOO, and G. M. TROMPETER, ‘Auditor Tenure and the Ability
to Meet or Beat Earnings Forecasts.’ Contemporary Accounting Research 26
(2009): 517–48
DECHOW, P., R. SLOAN, and A. SWEENEYY. ‘Detecting Earnings Management.’
The Accounting Review 70 (1995): 193-225.
DEANGELO, L. E. ‘Auditor Independence, “Low-Balling” and Disclosure
Regulation.’ Journal of Accounting and Economics (1981): 113-127.
DEFOND, M., K. RAGHUNANDAN and K. R. SUBRAMANYAM. ‘Do Non-Audit
Service Fees Impair Auditor Independence? Evidence from Going Concern
Audit Opinions.’ Journal of Accounting Research (2002): 1247-1274.
DEFOND, M. and K.R. SUBRAMANYAM. ‘Auditor Changes and Discretionary
Accruals.’ Journal of Accounting and Economics 25 (1998): 35-67.
DEIS Jr., D.R. and G.A. GIROUX. ‘Determinants of Audit Quality in the Public
Sector.’ The Accounting Review 67 (1992): 462–479.
DEIS Jr., D.R. and G.A. GIROUX. ‘The Effect of Auditor Changes on Audit fees,
Audit Hours, and Audit Quality.’ Journal of Accounting and Public Policy 15
(1996): 55–76.
DOPUCH, N., R. KING, and R. SCHWARTZ. ‘An Experimental Investigation of
Retention and Rotation Requirements.’ Journal of Accounting Research 39
(2001): 93-118.
38
FRANCIS, J. and D. SIMON. ‘A Test of Audit Pricing in the Small-client Segment of the U.S. Audit Market.’ The Accounting Review 62 (1987): 145-157.
General Accounting Office (GAO). Required study on the potential effects of
mandatory audit firm rotation. Report to the Senate Committee on Banking,
Housing, and Urban Affairs and the House Committee on Financial Services.
Washington, DC: GAO. (2003).
GHOSH, A., and D. MOON. ‘Auditor Tenure and Perceptions of Audit Quality.’ The
Accounting Review 80 (2005): 585-613.
GEIGER, M. and K. RAGHUNANDAN. ‘Auditor Tenure and Audit Quality.’
Auditing: A Journal of Practice & Theory 21 (2002): 187-196.
HUANG, H., LIU, L., RAGHUNANDAN, K., and D.V. RAMA, ‘Auditor Industry
Specialization, Client Bargaining Power, and Audit Fees: Further Evidence.’
Auditing: A Journal of Practice & Theory 26 (2007): 147-158.
HRIBAR, P., and D.W. COLLINS. ‘Errors in Estimating Accruals: Implications for
Empirical Research.’ Journal of Accounting Research 40 (2002): 105-134.
JOHNSON, V., KHURANA, I. and J., REYNOLDS. ‘Audit-Firm Tenure and the
Quality of Financial Reports.’, Contemporary Accounting Research 19 (2002):
637-660.
KOTHARI, S., LEONE, A., and C. WASLEY. ‘Performance Matched Discretionary
Accrual Measures.’ Journal of Accounting and Economics 39 (2005): 163-197.
MAHER, M. W., P. TIESSEN, R. COLSON, and A. BROMAN. ‘Competition and
Audit Fees.’ The Accounting Review 67 (1992): 199-211.
MANSI, S., W. MAXWELL, and D. MILLER. ‘Does Auditor Quality and Tenure
Matter to Investors? Evidence from the Bond Market.’ Journal of Accounting
Research 42 (2004): 755–93.
MAUTZ, R., and H. SHARAF. ‘The Philosophy of Auditing.’ Sarasota, FL:
American Accounting Association. (1961)

39
MYERS, J., L. MYERS and T. OMER. ‘Exploring the Term of the Auditor-Client
Relationship and the Quality of Earnings: A Case for Mandatory Auditor
Rotation?’ The Accounting Review 78 (2003): 779-799.
MYERS, J., L. MYERS, Z. V. PALMROSE, and S. SCHOLZ. ‘Mandatory Auditor
Rotation: Evidence from Restatements.’ Unpublished paper, University of
Illinois at Urbana-Champaign (2004).
NAGY, A. ‘Mandatory Audit Firm Turnover, Financial Reporting Quality, and Client
Bargaining Power: The Case of Arthur Andersen.’ Accounting Horizons 19
(2005): 51-68.
O’KEEFE, T.B., SIMUNIC, D.A., and M.T. STEIN. ‘The Production of Audit
Services: Evidence from a Major Public Accounting Firm.’ Journal of
Accounting Research 32 (1994): 241–261.
PALMROSE, Z. ‘The Effect of Nonaudit Services on the Pricing of Audit Services:
Further evidence.’ Journal of Accounting Research 24 (1986): 405-11.
PALMROSE, Z. ‘The relation of audit contract type to audit fees and hours.’ The
Accounting Review 64 (1989): 488-499.
PETERSEN, M. A., ‘Estimating Standard Errors in Finance Panel Data Sets:
Comparing Approaches.’ Review of Financial Studies 22 (2009): 435-480.
PUTTY, R. and S. CUGANESAN. “Auditor Rotation: Framing the Debate.”
Australian Accountant (1996): 40-41.
RUIZ-BARBADILLO, E., GOMEZ-AGUILAR, N., and N. CARRERA. ‘Does
Mandatory Audit Firm Rotation Enhance Auditor Independence? Evidence from
Spain.’ Auditing: A Journal of Practice & Theory 28 (2009): 113-135.
SIMON, D. and J. FRANCIS. ‘The Effects of Auditor Change on Audit Fees: Tests of Price Cutting and Price Recovery.’ The Accounting Review 63 (1988): 255-269.
SIMUNIC, D. ‘The Pricing of Audit Services: Theory and Evidence.’ Journal
of Accounting Research 18 (1980): 161-190.

40
ST. PIERRE, K. and J. ANDERSON. ‘An Analysis of the Factors Associated with
Lawsuits against Public Accountants.’ The Accounting Review 59 (1984): 242-
263.
STICE, J. D. 1991. ‘Using financial and market information to identify pre-
engagement factors associated with lawsuits against auditors.’ The Accounting
Review 66(3): 516-533.
TUCKER, S. J. and P. ZAROWIN. ‘Does Income Smoothing Improve Earnings
Informativeness?’ The Accounting Review 81 (2006): 251-270.
TURNER, L. ‘Call for Academic Research on Key Accounting Issues.’ (1999)
Available at http://sec.gov/news/extra/aaacall.htm.
ZEFF, S. A. “DuPont’s Early Policy on the Rotation of Audit Firms.” Journal of
Accounting Public Policy 22 (2003): 1-18.

41
TABLE 1 Sample Selection Procedure
Sample selection criteria Number of firms
Number of firm-years
Number of firms listed on the KSE or KOSDAQ 2,126 12,463
Less: Non-December fiscal year-end firms (257) (1,181)
Firms in the financial and insurance industry (55) (266)
Firms with missing audit fee and audit hour data (210) (2,920)
Firms missing financial data (335) (2,044)
Firms with less than 8 firms in an industry in each year (67) (492)
Final sample 1,202 5,557
The final sample consisted of 5,557 firm-years over the period 2000-2007.
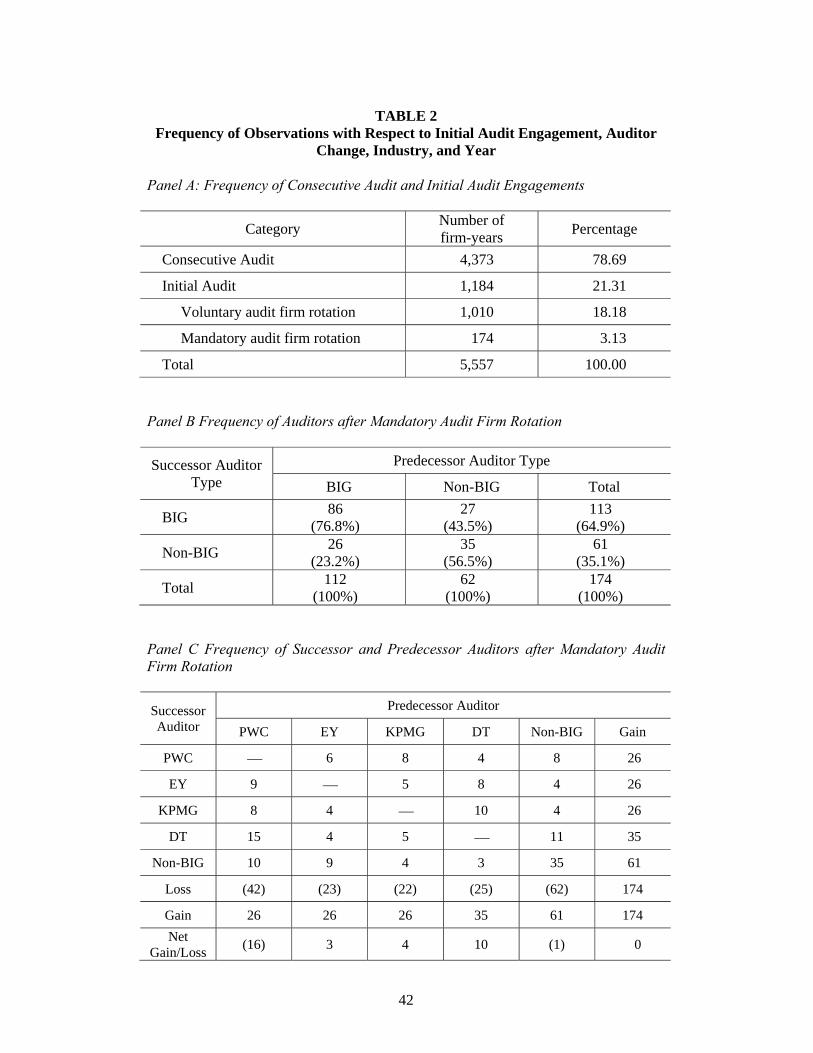
42
TABLE 2 Frequency of Observations with Respect to Initial Audit Engagement, Auditor
Change, Industry, and Year Panel A: Frequency of Consecutive Audit and Initial Audit Engagements
Category Number of firm-years
Percentage
Consecutive Audit 4,373 78.69
Initial Audit 1,184 21.31
Voluntary audit firm rotation 1,010 18.18
Mandatory audit firm rotation 174 3.13
Total 5,557 100.00
Panel B Frequency of Auditors after Mandatory Audit Firm Rotation
Successor Auditor Type
Predecessor Auditor Type
BIG Non-BIG Total
BIG 86
(76.8%) 27
(43.5%) 113
(64.9%)
Non-BIG 26
(23.2%) 35
(56.5%) 61
(35.1%)
Total 112
(100%) 62
(100%) 174
(100%) Panel C Frequency of Successor and Predecessor Auditors after Mandatory Audit Firm Rotation
Successor Auditor
Predecessor Auditor
PWC EY KPMG DT Non-BIG Gain
PWC 6 8 4 8 26
EY 9 5 8 4 26
KPMG 8 4 10 4 26
DT 15 4 5 11 35
Non-BIG 10 9 4 3 35 61
Loss (42) (23) (22) (25) (62) 174
Gain 26 26 26 35 61 174
Net Gain/Loss
(16) 3 4 10 (1) 0

43
Panel D: Distribution of the Sample by Industry
Industry Description Number of firm-years
Percentage
Business Support Services 34 0.6
Computer Programming, Consultancy, and Related Activities 371 6.7
Electricity, Gas, Steam, and Hot Water Supply 74 1.3
General Construction 289 5.2
Manufacturing - Basic Metals 336 6.1
Manufacturing - Chemicals and Chemical Products 638 11.5
Manufacturing - Electrical Machinery and Apparatus 189 3.4
Manufacturing - Electronic Components, Computer, Radio, Television, and Communication Equipment and Apparatus
47 0.9
Manufacturing - Electronic Components, Radio, Television, and Communication Equipment and Apparatus
850 15.3
Manufacturing - Fabricated Metal Products, Except Machinery and Furniture
143 2.6
Manufacturing - Food Products and Beverages 299 5.4
Manufacturing - Furniture 32 0.6
Manufacturing - Medical, Precision and Optical Instruments, Watches, and Clocks
112 2.0
Manufacturing - Other Machinery and Equipment 375 6.8
Manufacturing - Other Non-metallic Mineral Products 164 3.0
Manufacturing - Pulp, Paper, and Paper Products 144 2.6
Manufacturing - Rubber and Plastic Products 141 2.5
Manufacturing - Sewn Wearing Apparel and Fur Articles 106 1.9
Manufacturing - Textiles, Except Sewn Wearing Apparel 102 1.8
Motion Picture, Video and Television Program Production, Sound Recording, and Music Publishing Activities
64 1.2
Motor Vehicles, Trailers, and Semitrailers 256 4.6
Professional, Scientific, and Technical Services 195 3.5
Publishing activities 33 0.6
Retail Trade, Except Motor Vehicles and Motorcycles 88 1.6
Telecommunications 36 0.7
Wholesale Trade and Commission Trade, Except Motor Vehicles and Motorcycles
378 6.8
Others 61 1.1
Total 5,557 100

44
Panel E: Distribution o the Sample by Year
Year Number of firm-years
Percentage
2000 392 7.05
2001 452 8.13
2002 510 9.18
2003 520 9.36
2004 530 9.54
2005 1001 18.01
2006 1034 18.61
2007 1118 20.12
Total 5557 100.00

45
TABLE 3 Descriptive Statistics of Study Variables1)
Variable2) Mean Median Standard deviation
Min Max
INITIAL 0.21 0.00 0.41 0.00 1.00
MAN_ROT 0.03 0.00 0.18 0.00 1.00
VOL_ROT 0.18 0.00 0.38 0.00 1.00
AH 806.45 515.50 1,311.55 12.00 37,000.00
AF $73,483 $50,000 $107,612 $900 $2,717,000
LAH 6.31 6.24 0.80 0.61 10.52
IV_LAH 6.36 6.27 0.68 2.41 9.91
LAF 10.91 10.82 0.65 6.80 14.82
DA mod 0.00 0.01 0.22 -4.81 2.09
DA adj 0.00 0.00 0.13 -1.60 2.41
Abs_DA mod 0.11 0.06 0.19 0.00 4.81
Abs_DA adj 0.08 0.05 0.10 0.00 2.41
TENURE 3.88 3.00 2.77 1.00 17.00
BIG 0.58 1.00 0.49 0.00 1.00
LTA 18.54 18.28 1.43 13.81 24.91
POWER 0.90 0.91 0.09 0.42 1.00
IND_SPEC 0.19 0.00 0.39 0.00 1.00
FRGN 0.27 0.12 0.31 0.00 1.00
AR_INV 0.28 0.27 0.16 0.00 0.87
ROI -0.03 0.03 0.57 -13.93 28.53
LOSS 0.41 0.00 0.49 0.00 1.00
OPINION 0.02 0.00 0.13 0.00 1.00
TELE 0.01 0.00 0.08 0.00 1.00
UTIL 0.01 0.00 0.11 0.00 1.00
CA_CL 2.60 1.55 5.94 0.03 339.74
LEV 0.40 0.38 0.58 -0.58 26.34
IND_GRWTH 1.06 1.04 0.06 0.90 1.17
OCF_TA 0.03 0.04 0.22 -7.14 1.69
AGE 26.80 26.06 14.32 1.00 111.00
SUB 1.86 0.00 6.33 0.00 148.00 1) The number of observations for all the variables were 5,557 (Table 1). 2) Definitions of variables are as follows: INITIAL = 1 if the first-year audit and 0 otherwise

46
MAN_ROT = 1 if mandatory audit firm rotation and 0 otherwise VOL_ROT = 1 if voluntary audit firm rotation and 0 otherwise AF = the audit fee calculated using the exchange rate 1$=1,000 LAF = the natural logarithm of audit fees for the company LAH = the natural logarithm of audit hours for the company IV_LAH = predicted audit hours measured as the instrument variable following Caramanis and Lennox [2008] DA mod = the discretionary accrual measure following Dechow et al. [1995] DA adj = the performance-matched discretionary accrual measure following Kothari et al. [2005] Abs_DA mod = the absolute value of DA mod Abs_DA adj = the absolute value of DA adj TENURE = the number of consecutive years that the company was audited by the
same audit firm BIG = 1 if the audit is performed by one of the Big 4 audit firms; 0 otherwise LTA = the natural logarithm of total assets FRGN = the percentage of sales foreign-based AR_INV = the percentage of total assets in receivables and inventory ROI = return on investment (net income divided by total assets) LOSS = 1 if a loss reported in any of the past three years and 0 otherwise OPINION = 1 if the audit report was modified for going concern and 0 otherwise TELE = 1 if the observation is in the telecommunications industry and 0
otherwise UTIL = 1 if the observation is in the utility industry and 0 otherwise IND_SPEC = 1 if the auditor had 25 (33.3) percent or more market share in an industry in each year POWER = the natural logarithm of each company’s sales divided by the sum of industry sales for all firms in the industry audited by the company’s auditor CA_CL = current assets/current liabilities LEV = (total liabilities-cash)/total assets
IND_GRWTH =
N
iitSales
1
/
N
iitSales
11 by the two-digit SIC code
OCF_TA = the firm’s cashflows from operations divided by previous total assets SUB = the number of subsidiaries AGE = the number of years after the establishment

47
TABLE 4 Correlation Matrix of Study Variables
Variable1) MAN_ROT VOL_ROT LAH LAF DA adj TENURE BIG LTA OPINION CA_CL LEV
INITIAL 0.35***2) 0.91*** -0.01 -0.04*** 0.00 -0.54*** -0.03*** -0.06*** 0.05*** 0.04*** 0.02*
(<.0001) (<.0001) (0.34) (0.00) (0.96) (<.0001) (0.01) (<.0001) (0.00) (0.00) (0.07)
MAN_ROT 1.00 -0.08*** 0.10*** 0.11*** 0.01 -0.19*** 0.03** 0.07*** -0.01 0.00 -0.01
(<.0001) (<.0001) (<.0001) (0.28) (<.0001) (0.05) (<.0001) (0.56) (0.80) (0.33)
VOL_ROT 1.00 -0.06*** -0.09*** -0.01 -0.48*** -0.03*** -0.10*** 0.06*** 0.04*** 0.03**
(<.0001) (<.0001) (0.71) (<.0001) (0.01) (<.0001) (<.0001) (0.00) (0.02)
LAH 1.00 0.69*** -0.03*** 0.10*** 0.32*** 0.56*** -0.04*** -0.07*** 0.02
(<.0001) (0.01) (<.0001) (<.0001) (<.0001) (0.00) (<.0001) (0.17)
LAF 1.00 -0.01 0.14*** 0.29*** 0.79*** -0.03* -0.10*** 0.07***
(0.57) (<.0001) (<.0001) (<.0001) (0.06) (<.0001) (<.0001)
DA adj 1.00 0.01 -0.04*** 0.00 0.03** -0.01 -0.09***
(0.34) (0.00) (0.89) (0.05) (0.53) (<.0001)
TENURE 1.00 0.01 0.13*** -0.05*** -0.03** -0.04**
(0.61) (<.0001) (0.00) (0.02) (0.01)
BIG 1.00 0.33*** -0.03*** -0.05*** 0.00
(<.0001) (0.01) (0.00) (0.89)
LTA 1.00 -0.10*** -0.12*** 0.02
(<.0001) (<.0001) (0.14)
OPINION 1.00 -0.02 0.29***
(0.13) (<.0001)
CA_CL 1.00 -0.15***
(<.0001) 1) See Table 2 for variable definitions. 2) */**/*** denote two-tailed significance at the 0.1, 0.05, and 0.01 levels, respectively.
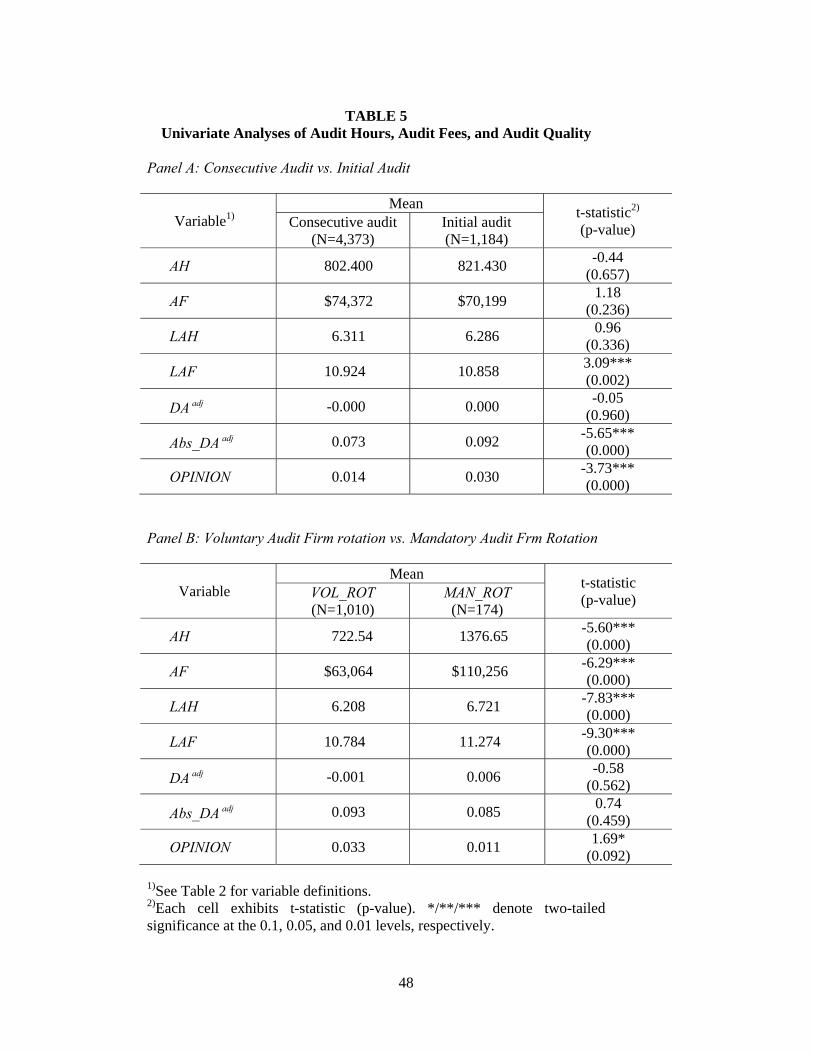
48
TABLE 5 Univariate Analyses of Audit Hours, Audit Fees, and Audit Quality
Panel A: Consecutive Audit vs. Initial Audit
Variable1) Mean
t-statistic2) (p-value) Consecutive audit
(N=4,373) Initial audit (N=1,184)
AH 802.400 821.430 -0.44
(0.657)
AF $74,372 $70,199 1.18
(0.236)
LAH 6.311 6.286 0.96
(0.336)
LAF 10.924 10.858 3.09*** (0.002)
DA adj -0.000 0.000 -0.05
(0.960)
Abs_DA adj 0.073 0.092 -5.65*** (0.000)
OPINION 0.014 0.030 -3.73*** (0.000)
Panel B: Voluntary Audit Firm rotation vs. Mandatory Audit Frm Rotation
Variable Mean
t-statistic (p-value) VOL_ROT
(N=1,010) MAN_ROT
(N=174)
AH 722.54 1376.65 -5.60*** (0.000)
AF $63,064 $110,256 -6.29*** (0.000)
LAH 6.208 6.721 -7.83*** (0.000)
LAF 10.784 11.274 -9.30*** (0.000)
DA adj -0.001 0.006 -0.58
(0.562)
Abs_DA adj 0.093 0.085 0.74
(0.459)
OPINION 0.033 0.011 1.69*
(0.092) 1)See Table 2 for variable definitions. 2)Each cell exhibits t-statistic (p-value). */**/*** denote two-tailed significance at the 0.1, 0.05, and 0.01 levels, respectively.

49
TABLE 6 Regression Analysis of the Effect of Mandatory Rotation on Audit Hours
Variable1) Expected
Sign Model 1 Model 2 Model 3 Model 4 Model 5
Intercept 0.828*** 3)
(5.74) 0.864***
(6.07) 0.886***
(6.13) 0.887***
(3.76) -0.017 (-0.19)
INITIAL + 0.044** (2.05)
0.039* (1.80)
0.000 (0.01)
INITIAL MAN_ROT
+ 0.293***
(6.31)
MAN_ROT 0.289***
(6.98)
VOL_ROT 0.000 (0.00)
LagLAH
0.719*** (33.56)
LTA + 0.287*** (35.95)
0.285*** (36.24)
0.284*** (35.46)
0.284*** (21.68)
0.097*** (11.68)
BIG + 0.248*** (13.89)
0.248*** (13.89)
0.248*** (8.80)
0.111*** (7.70)
PWC 2) 0.472*** (16.68)
EY 2) 0.263*** (11.67)
AA 2) -0.190***
(-5.37)
KPMG 2) 0.313*** (10.82)
DT 2) 0.051* (1.83)
CA_CL 0.000 (0.58)
0.000 (0.05)
0.001 (0.61)
0.001 (0.46)
0.002*** (2.91)
LEV + 0.011 (0.77)
0.014 (1.13)
0.013 (0.98)
0.013 (0.79)
0.032*** (3.10)
R-square 0.341 0.379 0.344 0.344 0.721
F-statistic 395.92*** 264.28*** 347.37*** 137.98*** 1614.33***
Number of observations
5557 5557 5557 5557 4616
1)See Table 2 for variable definitions. 2)AA = 1 if the audit was performed by Arthur Andersen and 0 otherwise; DT = 1 if the audit was performed by Deloitte & Touche and 0 otherwise; EY = 1 if the audit was performed by Ernst & Young and 0 otherwise; KPMG = 1 if the audit was performed by KPMG and 0 otherwise; PWC = 1 if the audit was performed by PricewaterhouseCoopers and 0 otherwise.

50
3)Each cell exhibits coefficient (t-statistic). The t-statistics were computed using robust standard errors adjusted for clustering on the company (Petersen, 2009). */**/*** denote two-tailed significance at the 0.1, 0.05, and 0.01 levels, respectively.

51
TABLE 7 Regression Analysis of the Effect of Mandatory Rotation on Audit Fees
Variable1) Expected
sign Model 1 Model 2 Model 3 Model 4 Model 5 Model 6
Intercept 4.512***2)
(27.45) 4.470*** (27.09)
4.538*** (27.60)
4.538*** (27.59)
4.111*** (30.02)
4.127*** (29.99)
INITIAL -0.002 (-0.17)
-0.014 (-1.04)
-0.037***
(-2.66) 0.001 (0.11)
-0.024 (-1.57)
INITIAL MAN_ROT
+/ 0.229***
(7.19)
0.129*** (4.10)
MAN_ROT +/ 0.192***
(6.45)
VOL_ROT -0.037***
(-2.67)
IV_LAH + 0.312*** (19.88)
0.307*** (19.65)
LTA + 0.332*** (39.36)
0.328*** (38.95)
0.329*** (38.80)
0.329*** (38.80)
0.251*** (29.73)
0.251*** (29.84)
BIG 0.053***
(3.74)
0.055*** (3.89)
0.055*** (3.88)
-0.017 (-1.19)
-0.015 (-1.05)
PWC 0.137***
(6.17)
EW 0.114***
(6.77)
AA -0.204***
(-9.51)
KPMG 0.127***
(6.38)
DT 0.027 (1.43)
SUB + 0.013***
(4.75) 0.013***
(4.69) 0.013***
(4.66) 0.013***
(4.66) 0.008***
(4.24) 0.008***
(4.17)
FRGN + 0.010 (0.56)
0.013 (0.76)
0.009 (0.52)
0.009 (0.52)
0.011 (0.67)
0.011 (0.65)
AR_INV + -0.013 (-0.33)
-0.015 (-0.37)
-0.012 (-0.31)
-0.012 (-0.31)
-0.007 (-0.21)
-0.007 (-0.18)
ROI -0.103* (-1.72)
-0.102* (-1.72)
-0.102* (-1.73)
-0.102* (-1.73)
-0.081* (-1.81)
-0.081* (-1.81)
LOSS + 0.082***
(6.28) 0.082***
(6.37) 0.086***
(6.56) 0.086***
(6.56) 0.072***
(6.03) 0.074***
(6.24)
OPINION + 0.140 (1.51)
0.154* (1.68)
0.145 (1.57)
0.145 (1.57)
0.270*** (3.03)
0.274*** (3.07)
TELE - 0.398***
(4.26) 0.394***
(4.05) 0.396***
(4.33) 0.396***
(4.33) 0.268***
(3.55) 0.270***
(3.61)
UTIL - -0.175***
(-4.48) -0.171***
(-4.37) -0.171***
(-4.37) -0.171***
(-4.37) -0.129***
(-3.46) -0.125***
(-3.37)
IND_SPEC + 0.074***
(4.39) 0.047** (2.51)
0.080*** (4.74)
0.080*** (4.74)
0.059*** (3.69)
0.064*** (3.98)
POWER 0.149 (1.45)
0.264*** (2.58)
0.182* (1.78)
0.181* (1.78)
0.156 (1.56)
0.178* (1.79)
R-square 0.654 0.666 0.657 0.657 0.723 0.724

52
F-statistic 573.97*** 468.64*** 540.16*** 540.15*** 689.01*** 647.67***
Number of observations
5557 5557 5557 5557 4616 4616
1)See Table 2 for variable definitions. 2)Each cell exhibits coefficient (t-statistic). The t-statistics were computed using robust standard errors adjusted for clustering on the company (Petersen, 2009). */**/*** denote two-tailed significance at the 0.1, 0.05, and 0.01 levels, respectively.

53
TABLE 8 Regression Analysis of the Effect of Mandatory Rotation on Earnings
Quality
Panel A: Discretionary Accruals
Variable1) Expected
sign Discretionary accruals (DA adj )
Model 1 Model 2 Model 3 Model 4 Model 5 Model 6
Intercept -0.281***
(-4.24) -0.288***
(-4.32) -0.281***
(-4.21) -0.275***
(-4.15) -0.274***
(-4.12) -0.368***
(-6.41)
INITIAL + -0.0073) (-1.46)
-0.006 (-1.38)
-0.007 (-1.40)
-0.005 (-1.12)
-0.006 (-1.21)
-0.008 (-1.42)
INITIAL MAN_ROT
+/ 0.001 (0.13)
0.006 (0.56)
0.005 (0.48)
LAH -0.014***
(-6.02) -0.014***
(-6.05)
IV_LAH2) -0.014***
(-4.81)
LTA 0.010***
(5.30) 0.010***
(5.39) 0.010***
(5.26) 0.014***
(6.51) 0.014***
(6.50) 0.016***
(7.68)
BIG -0.002 (-0.71)
-0.002 (-0.71)
0.001 (0.39)
0.001 (0.39)
PWC -0.008* (-1.71)
0.005 (1.09)
EW 0.000
(-0.07)
0.004 (0.79)
AA 0.011** (1.96)
0.016***
(3.06)
KPMG -0.004 (-0.83)
0.003 (0.81)
DT -0.002 (-0.45)
-0.001 (-0.24)
AGE 0.000 (0.85)
0.000 (0.71 )
0.000 (0.84 )
0.000 (0.57)
0.000 (0.52)
0.000 (0.79)
OCF_TA -0.310***
(-4.65) -0.310***
(-4.64) -0.310***
(-4.64) -0.313***
(-4.67) -0.313***
(-4.67) -0.405***
(-9.21)
IND_GRWTH + 0.105***
(2.78) 0.107***
(2.84) 0.105***
(2.79) 0.107***
(2.83) 0.107***
(2.84) 0.153***
(4.43)
CA_CL 0.000 (-1.44)
0.000 (-1.39)
0.000 (-1.44)
0.000 (-1.41)
0.000 (-1.41)
0.000 (-0.60)
LEV + -0.029***
(-4.23) -0.029***
(-4.21) -0.029***
(-4.22) -0.028***
(-4.11) -0.028***
(-4.10) -0.023** (-2.44)
TENURE + 0.001** (2.09)
0.001** (2.14)
0.001** (2.10)
0.001*** (2.67)
0.001*** (2.70)
0.002*** (3.22)
R-square 0.273 0.274 0.273 0.278 0.278 0.353
F-statistic 7.13*** 5.36*** 6.59*** 8.50*** 7.95*** 8.75***
Number of observations
5557 5557 5557 5557 5557 4616

54
Panel B Positive and Negative Discretionary Accruals
Variable1) Expected
sign
Magnitude of positive discretionary accruals
(DA adj +)4)
Magnitude of negative discretionary accruals
(DA adj -)4)
Intercept 2.612** (2.26)
2.614** (2.26)
-6.268*** (-3.83)
-5.364*** (-4.04)
INITIAL -0.093 (-0.73)
-0.092 (-0.72)
-0.189 (-1.63)
-0.146 (-1.43)
INITIAL MAN_ROT
+/ 0.566** (2.30)
0.566** (2.30)
0.217 (0.84)
0.254 (1.06)
LAH -0.002 (-0.03)
-0.276***
(-3.15)
LTA -0.098** (-2.00)
-0.097* (-1.90)
0.250*** (3.49)
0.298*** (3.85)
BIG -0.320***
(-2.61) -0.319***
(-2.59) 0.152* (1.70)
0.201** (2.27)
AGE -0.033***
(-3.90) -0.033***
(-3.90) 0.026***
(3.17) 0.023***
(3.30)
OCF_TA -0.649***
(-7.30) -0.649***
(-7.29) -2.127***
(-4.79) -2.038***
(-5.09)
IND_GRWTH -1.885** (-2.51)
-1.884** (-2.51)
2.889*** (3.36)
2.682*** (3.54)
CA_CL + 0.016* (1.76)
0.016* (1.76)
0.001 (0.17)
0.001 (0.22)
LEV + 0.186 (1.35)
0.187 (1.35)
-0.065*** (-3.70)
-0.055*** (-3.62)
TENURE +/ -0.051** (-1.99)
-0.050** (-1.98)
0.040* (1.78)
0.044** (2.08)
Wald-statistic 62.88*** 62.88*** 29.51*** 32.91***
Number of observations
2801 2801 2756 2756
1)See Table 2 for variable definitions. 2)IV_LAH = predicted audit hours measured as the instrument variable from Equation (4) (Caramanis and Lennox, 2008). 3)Each cell exhibits coefficient (t-statistic or z-statistic). The t-statistics were computed using robust standard errors adjusted for clustering on the company (Petersen, 2009). 4)The DA+ and DA- models were estimated using truncated regression because positive (negative) abnormal accruals were left-truncated (right-truncated) at 0 (Maddala, 1983; Caramanis and Lennox, 2008). */**/*** denote two-tailed significance at the 0.1, 0.05, and 0.01 levels, respectively.

55
TABLE 9 Sensitivity Analyses - Alternatives Measures of Audit Quality
Panel A Propensity to Issue a Going-Concern Opinion for Financially Distressed Companies
Variable1) Expected
sign Model 12) Model 22)
Intercept -2.068 2) (0.342)
-2.070 (0.342)
-1.626 (0.542)
-1.605 (0.547)
INITIAL +/ 0.266
(0.446) 0.247
(0.490) -0.130 (0.712)
-0.209 (0.578)
INITIAL MAN_ROT
+/ 0.206
(0.792)
0.577 (0.484)
LTA -0.257** (0.036)
-0.257** (0.036)
-0.273* (0.069)
-0.274* (0.068)
AGE 0.020* (0.067)
0.019* (0.070)
0.024* (0.052)
0.024* (0.060)
LEV + 2.156*** (0.000)
2.164*** (0.000)
1.934*** (0.000)
1.957*** (0.000)
BIG + 0.161
(0.557) 0.161
(0.557) 0.219
(0.490) 0.220
(0.489)
OCF_TA -0.409
(0.204 ) -0.407 (0.205)
-0.344 (0.255)
-0.343 (0.253)
FEERATIO -0.031 (0.852)
-0.029 (0.858)
-0.112 (0.730)
-0.105 (0.743)
LOSS + 1.741*** (0.007)
1.743*** (0.007)
1.870** (0.019)
1.880** (0.019)
Pseudo R2 0.258 0.258 0.229 0.230
Model Chi-square 164.51*** 164.60*** 101.00*** 101.44***
Number of observations
1524 1524 945 945
1)See Table 2 for variable definitions. FEERATIO is nonaudit fees to total fees paid to the incumbent auditor. 2)Following Carey and Simnett [2006], Model 1 (Model 2) restricts the final sample to situations in which the company reports negative earnings or (and) operating cash flows for the current fiscal year and shows logistic regression results.

56
Panel B Just Beats and Just Misses Breakeven: Earnings Benchmark Frequency and Statistics
Category Consecutive INITIAL MAN_ROT VOL_ROT
NPTA<-2% 996 (22.8) 323 (27.3) 32 (18.4) 291 (28.8)
NPTA -2 to 0% (Just misses) 166 (3.8) 39 (3.3) 9 (5.2) 30 (3.0)
NPTA 0 to 2% (Just beats) 612 (14.0) 147 (12.4) 23 (13.2) 124 (12.3)
NPTA>2% 2599 (59.4) 675 (57.0) 110 (63.2) 565 (55.9)
Total 4373 (100.0) 1184 (100.0) 174 (100.0 ) 1010 (100.0 ) Panel C Just Beats and Just Misses Breakeven: Logistic Regression Results
Variable1) Expected
sign Just Beats Breakeven3) Just Misses Breakeven4)
Intercept -4.189***
(0.000) -4.197***
(0.000) -3.945***
(0.000) -3.885***
(0.000)
INITIAL + -0.124 (0.214)
-0.110 (0.303)
-0.181 (0.322)
-0.289 (0.157)
INITIAL MAN_ROT
+/ -0.084 (0.733)
0.566
(0.151)
LTA 0.091*** (0.005)
0.091*** (0.005)
0.007 (0.909)
0.004 (0.946)
AGE /+ 0.018*** (0.000)
0.018*** (0.000)
0.014*** (0.008)
0.014** (0.011)
LEV +/ 0.089* (0.078)
0.089* (0.079)
-0.001 (0.996)
0.004 (0.973)
BIG /+ -0.006 (0.946)
-0.005 (0.950)
-0.082 (0.591)
-0.085 (0.580)
OCF_TA -0.135 (0.460)
-0.137 (0.454)
-0.192 (0.474)
-0.184 (0.500)
FEERATIO -0.017 (0.682)
-0.017 (0.676)
-0.076 (0.606)
-0.071 (0.627)
LOSS + 0.303*** (0.000)
0.302*** (0.000)
0.537*** (0.000)
0.547*** (0.000)
Pseudo R2 0.021 0.021 0.014 0.015
Model Chi-square 94.18*** 94.30*** 24.35*** 26.23***
Number of observations
5,557 5,557 5,557 5,557
1)See Table 2 for variable definitions. NPTA is the net profit to total assets. 2)Panels B and C use the model specifications reflecting Carey and Simnett (2006). 3)Just Beats Breakeven = 1 if the profit was less than 2% of total assets and 0 otherwise. 4)Just Misses Breakeven = 1 if the loss was less than 2% of total assets and 0 otherwise.
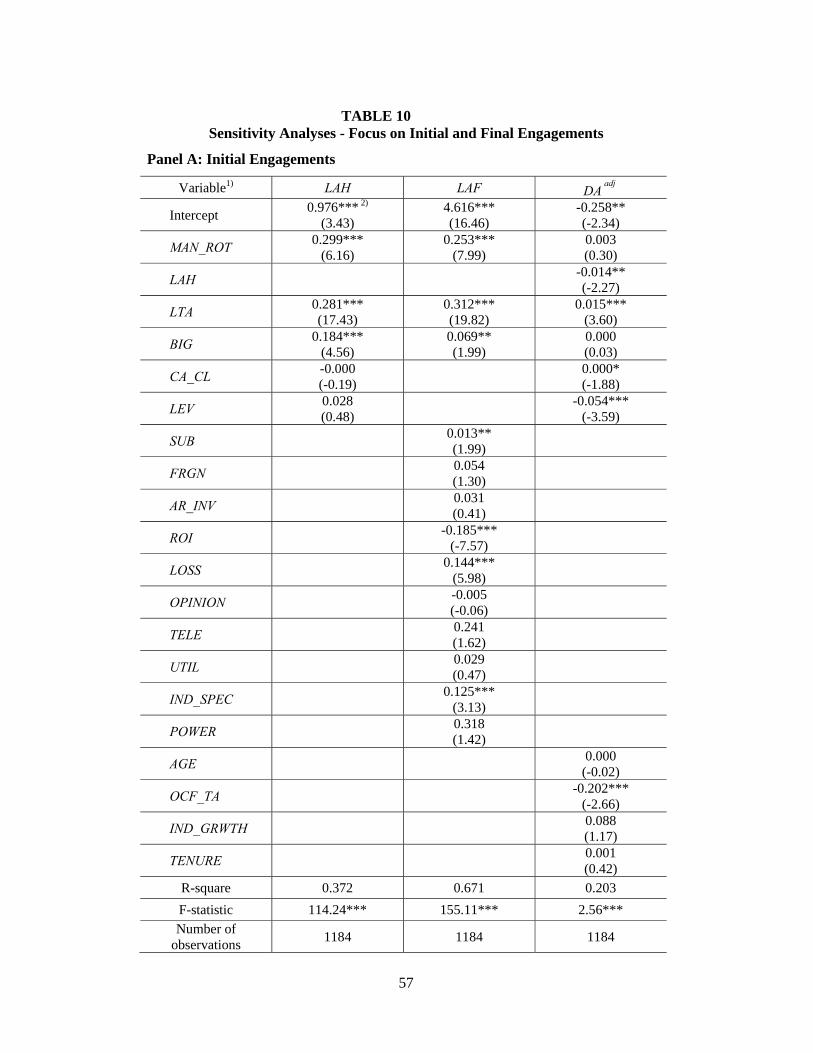
57
TABLE 10 Sensitivity Analyses - Focus on Initial and Final Engagements
Panel A: Initial Engagements
Variable1) LAH LAF DAadj
Intercept 0.976*** 2)
(3.43) 4.616*** (16.46)
-0.258** (-2.34)
MAN_ROT 0.299***
(6.16) 0.253***
(7.99) 0.003 (0.30)
LAH -0.014** (-2.27)
LTA 0.281*** (17.43)
0.312*** (19.82)
0.015*** (3.60)
BIG 0.184***
(4.56) 0.069** (1.99)
0.000 (0.03)
CA_CL -0.000 (-0.19)
0.000* (-1.88)
LEV 0.028 (0.48)
-0.054***
(-3.59)
SUB 0.013** (1.99)
FRGN 0.054 (1.30)
AR_INV 0.031 (0.41)
ROI -0.185***
(-7.57)
LOSS 0.144***
(5.98)
OPINION -0.005 (-0.06)
TELE 0.241 (1.62)
UTIL 0.029 (0.47)
IND_SPEC 0.125***
(3.13)
POWER 0.318 (1.42)
AGE 0.000 (-0.02)
OCF_TA -0.202***
(-2.66)
IND_GRWTH 0.088 (1.17)
TENURE 0.001 (0.42)
R-square 0.372 0.671 0.203
F-statistic 114.24*** 155.11*** 2.56***
Number of observations
1184 1184 1184

58
Panel B: Final Engagements
Variable1) LAH LAF DAadj
Intercept 1.263 (1.19)
6.520*** (7.76)
-0.274 (-0.83)
NEWERA 0.034 (0.09)
0.408*** (5.19)
0.015 (0.48)
LAH
-0.006 (-0.94)
LTA 0.249***
(4.38) 0.292***
(6.59) 0.014 (1.19)
BIG 0.477** (2.37)
-0.079 (-0.81)
-0.010 (-0.43)
CA_CL 0.028 (1.37)
-0.001 (-0.18)
LEV 0.242 (0.76)
0.051 (0.97)
SUB
0.043*** (3.22)
FRGN
-0.122 (-1.06)
AR_INV
0.364 (1.41)
ROI
-0.177* (-1.92)
LOSS
0.016 (0.20)
OPINION
-0.026 (-0.06)
TELE
UTIL -0.042 (-0.32)
IND_SPEC
-0.099 (-0.98)
POWER
-1.282** (-2.16)
AGE 0.001 (0.69)
OCF_TA
-0.360** (-2.54)
IND_GRWTH
0.019 (0.10)
TENURE
R-square 0.184 0.750 0.364
F-statistic 6.25*** 16.17*** 1.40
Number of observations
76 76 76

59
1)See Table 2 for variable definitions. 2)Each cell exhibits the respective coefficient (t-statistic or z-statistic). The t-statistics were computed using robust standard errors adjusted for clustering on the company (Petersen, 2009). */**/*** denote two-tailed significance at the 0.1, 0.05, and 0.01 levels, respectively.

60
TABLE 11 Sensitivity Analyses – Control for Structural Change in Voluntary
Audit Firm Rotation
Variable1) LAH LAF DAadj
Intercept 0.878***
(3.73) 4.513*** (16.77)
-0.275*** (-3.70)
VOL_ROT -0.066***
(-2.60) -0.083***
(-5.35) -0.003 (-0.56)
VOL_ROT*NEWERA 0.330***
(6.92) 0.229***
(7.64) -0.014 (-0.98)
MAN_ROT 0.289***
(6.98) 0.192***
(6.99) -0.000 (-0.05)
LAH
-0.014*** (-5.62)
LTA 0.284*** (21.77)
0.330*** (23.84)
0.014*** (5.85)
BIG 0.254***
(9.04) 0.060***
(2.75) 0.001 (0.28)
CA_CL -0.000 (-0.07)
-0.000 (-1.24)
LEV 0.014 (0.84)
-0.028*** (-4.38)
SUB
0.013** (2.13)
FRGN
0.012 (0.37)
AR_INV
0.000 (0.00)
ROI -0.099* (-1.73)
LOSS 0.086***
(4.70)
OPINION 0.156 (1.59)
TELE 0.399***
(2.69)
UTIL -0.173** (-2.52)
IND_SPEC 0.078***
(3.17)
POWER 0.182 (1.18)
AGE
0.000 (0.42)
OCF_TA -0.314***
(-4.56)
IND_GRWTH 0.107***
(2.57)
TENURE 0.001** (2.47)
R-square 0.349 0.661 0.279

61
F-statistic 124.57*** 164.05*** 6.60***
Number of observations 5557 5557 5557
1)See Table 2 for variable definitions (except for NEWERA, which equals 1 in 2006-2007 and 0 in 2000-2005). 2)Each cell exhibits the respective coefficient (t-statistic or z-statistic). The t-statistics were computed using robust standard errors adjusted for clustering on the company (Petersen, 2009). */**/*** denote two-tailed significance at the 0.1, 0.05, and 0.01 levels, respectively.