2009 Wheat Trials - pss.uvm.edu · This was the third year of the heirloom wheat project; ......
17
2009 Wheat Trials Dr. Heather Darby Erica Cummings, Rosalie Madden, and Amanda Gervais 802-524-6501
Transcript of 2009 Wheat Trials - pss.uvm.edu · This was the third year of the heirloom wheat project; ......
2009
Wheat Trials
Dr. Heather Darby Erica Cummings, Rosalie Madden, and Amanda Gervais
802-524-6501
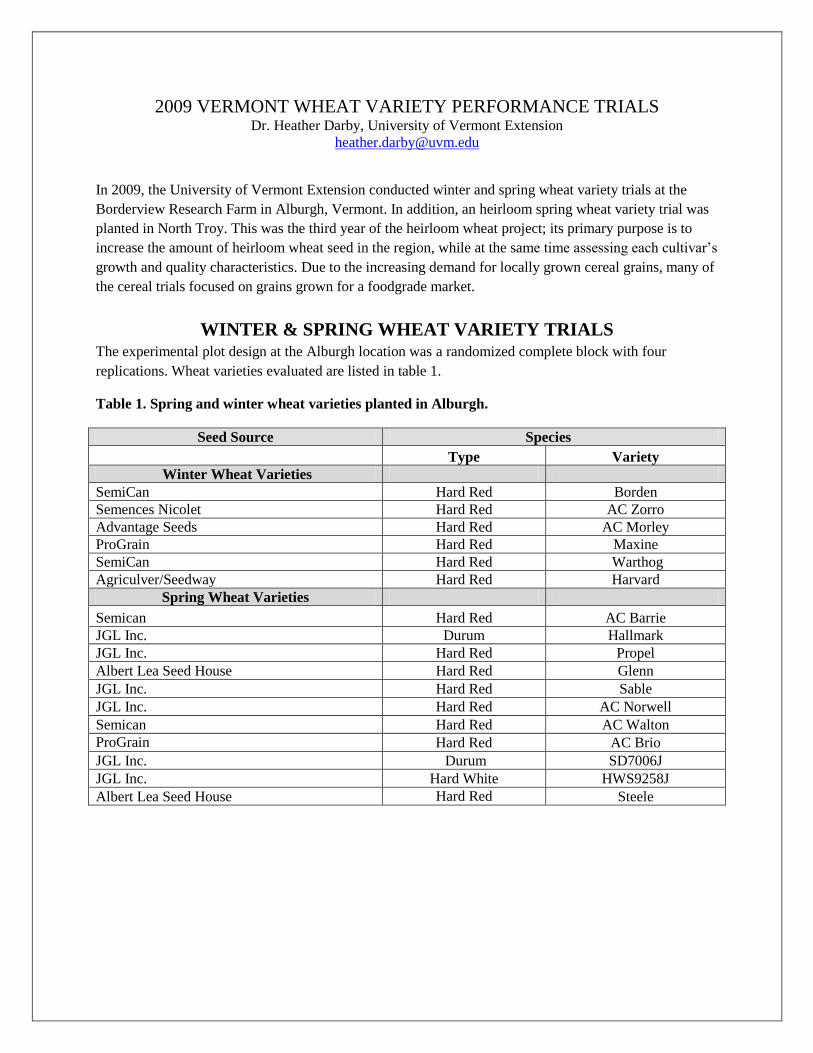
2009 VERMONT WHEAT VARIETY PERFORMANCE TRIALS Dr. Heather Darby, University of Vermont Extension
In 2009, the University of Vermont Extension conducted winter and spring wheat variety trials at the
Borderview Research Farm in Alburgh, Vermont. In addition, an heirloom spring wheat variety trial was
planted in North Troy. This was the third year of the heirloom wheat project; its primary purpose is to
increase the amount of heirloom wheat seed in the region, while at the same time assessing each cultivar’s
growth and quality characteristics. Due to the increasing demand for locally grown cereal grains, many of
the cereal trials focused on grains grown for a foodgrade market.
WINTER & SPRING WHEAT VARIETY TRIALS The experimental plot design at the Alburgh location was a randomized complete block with four
replications. Wheat varieties evaluated are listed in table 1.
Table 1. Spring and winter wheat varieties planted in Alburgh.
Seed Source Species
Type Variety
Winter Wheat Varieties
SemiCan Hard Red Borden
Semences Nicolet Hard Red AC Zorro
Advantage Seeds Hard Red AC Morley
ProGrain Hard Red Maxine
SemiCan Hard Red Warthog
Agriculver/Seedway Hard Red Harvard
Spring Wheat Varieties
Semican Hard Red AC Barrie
JGL Inc. Durum Hallmark
JGL Inc. Hard Red Propel
Albert Lea Seed House Hard Red Glenn
JGL Inc. Hard Red Sable
JGL Inc. Hard Red AC Norwell
Semican Hard Red AC Walton
ProGrain Hard Red AC Brio
JGL Inc. Durum SD7006J
JGL Inc. Hard White HWS9258J
Albert Lea Seed House Hard Red Steele
WEATHER DATA
Seasonal precipitation and temperature recorded at weather stations in close proximity to the 2009 sites
are shown in Table 2. This growing season brought cooler temperatures and higher than normal rainfall
patterns across the region. The cooler temperatures and increased precipitation encouraged fungal
pathogens and increased weed populations.
Table 2. Temperature and precipitation summary, 2009.
Alburgh April May June July August September October
Average
Temperature 44.9 53.9 62.8 65.9 67.7 57.7 44.1
Departure from
Normal +1.4 -2.7 -3.0 -5.2 -1.3 -2.7 -4.7
Precipitation 2.89 6.32 5.19 8.07 3.59 4.01 5.18
Departure from
Normal +0.38 +3.39 +1.98 +4.66 -0.26 +0.55 +0.79
Growing Degree
Days (32˚) 406 680.5 923.5 1052.5 1107 771 395.5
Departure from
Normal +61.0 -82.1 -90.5 -158.1 -40.0 -81.0 -125.3 Based on National Weather Service data from cooperative observer stations in close proximity to field trials. Historical averages are for 30
years of data (1971-2000)
CULTURAL PRACTICES
The seedbed at each location was prepared by conventional tillage methods. All plots were managed with
practices similar to those used by producers in the surrounding areas (Table 3). The plots in Alburgh
were seeded with a John Deere Seed Drill and with a Carter Cone Seeder in North Troy. Grain plots were
harvested with an Almaco SP50 plot combine. Yield, moisture, test weight and/or crude protein were
recorded. All data was analyzed using a mixed model analysis where replicates were considered random
effects. The LSD procedure was used to separate cultivar means when the F-test was significant (P<
0.10).
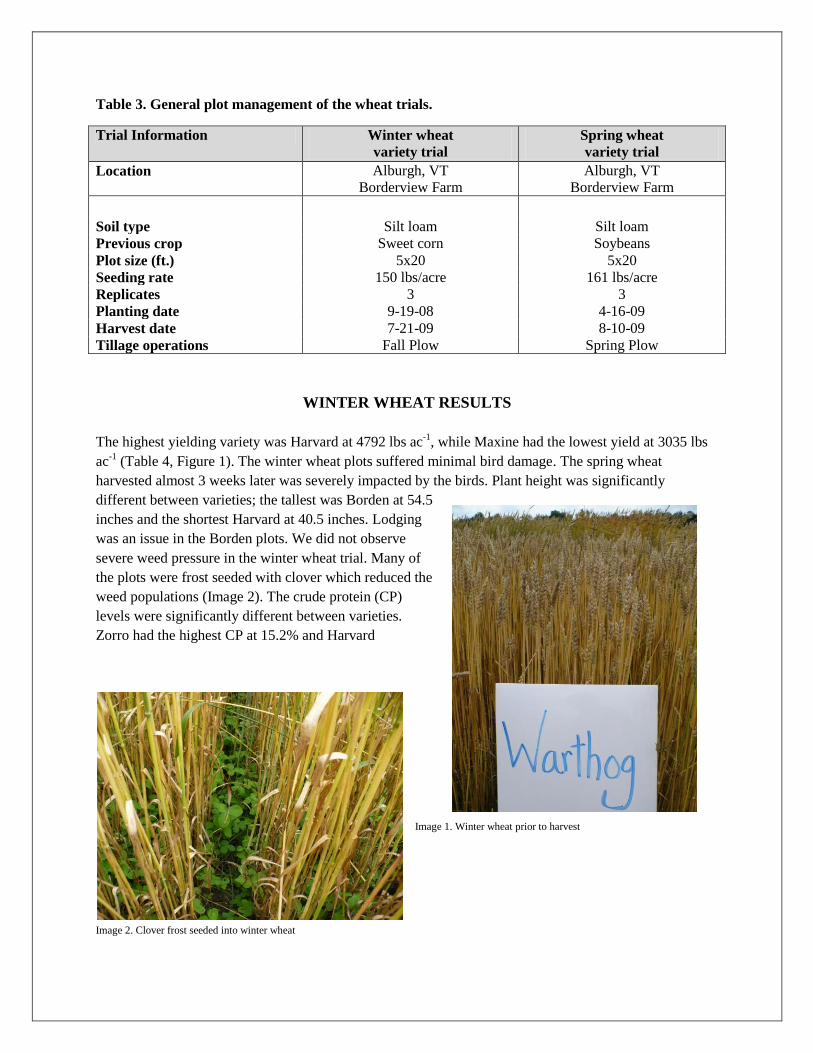
Table 3. General plot management of the wheat trials.
Trial Information Winter wheat
variety trial
Spring wheat
variety trial
Location Alburgh, VT
Borderview Farm
Alburgh, VT
Borderview Farm
Soil type Silt loam Silt loam
Previous crop Sweet corn Soybeans
Plot size (ft.) 5x20 5x20
Seeding rate 150 lbs/acre 161 lbs/acre
Replicates 3 3
Planting date 9-19-08 4-16-09
Harvest date 7-21-09 8-10-09
Tillage operations Fall Plow Spring Plow
WINTER WHEAT RESULTS
The highest yielding variety was Harvard at 4792 lbs ac-1
, while Maxine had the lowest yield at 3035 lbs
ac-1
(Table 4, Figure 1). The winter wheat plots suffered minimal bird damage. The spring wheat
harvested almost 3 weeks later was severely impacted by the birds. Plant height was significantly
different between varieties; the tallest was Borden at 54.5
inches and the shortest Harvard at 40.5 inches. Lodging
was an issue in the Borden plots. We did not observe
severe weed pressure in the winter wheat trial. Many of
the plots were frost seeded with clover which reduced the
weed populations (Image 2). The crude protein (CP)
levels were significantly different between varieties.
Zorro had the highest CP at 15.2% and Harvard
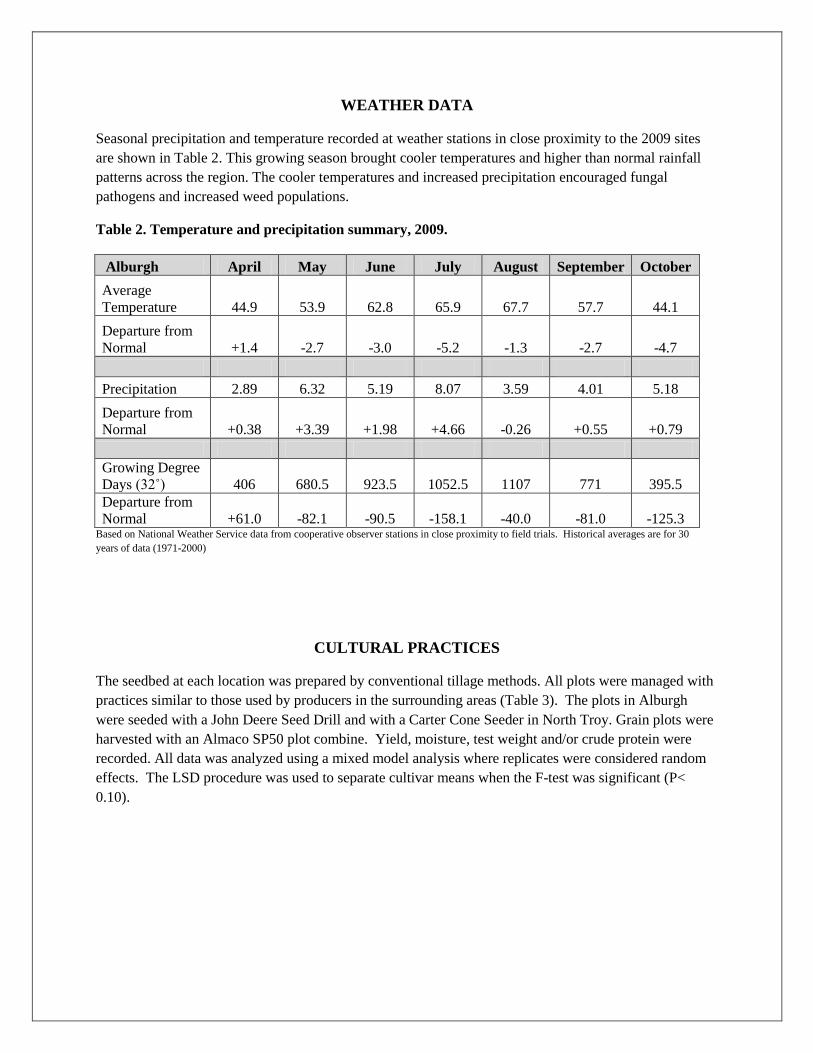
Image 1. Winter wheat prior to harvest
Image 2. Clover frost seeded into winter wheat
had the lowest 12.7% CP. Harvard was the highest yielding but had the lowest protein level while Zorro
had the highest crude protein level but was one of the lower yielding varieties. A correlation between
grain quantity and quality has been documented throughout the literature.
Table 4. Wheat variety height, yield, and crude protein levels.
Variety Plant Height Yield @ 13.5% Moisture Crude Protein
inches bu/acre lbs/acre %
Borden 54.5* 58.1 3487 14.9*
AC Morley 53.9* 56.4 3387 13.9
Harvard 40.5 79.9 4792 12.7
Maxine 41.4 50.6 3035 13.6
Warthog 42.4 58.1 3487 13.7
AC Zorro 49.3 55.7 3342 15.2*
Trial Means 47.0 59.8 3588 14.0
LSD (0.10) 3.70 NS NS 0.8 * Wheat that did not perform significantly lower than the top performing variety in a particular column are indicated
with an asterisk.
** See text for further explanation.
NS - None of the varieties were significantly different from one another.
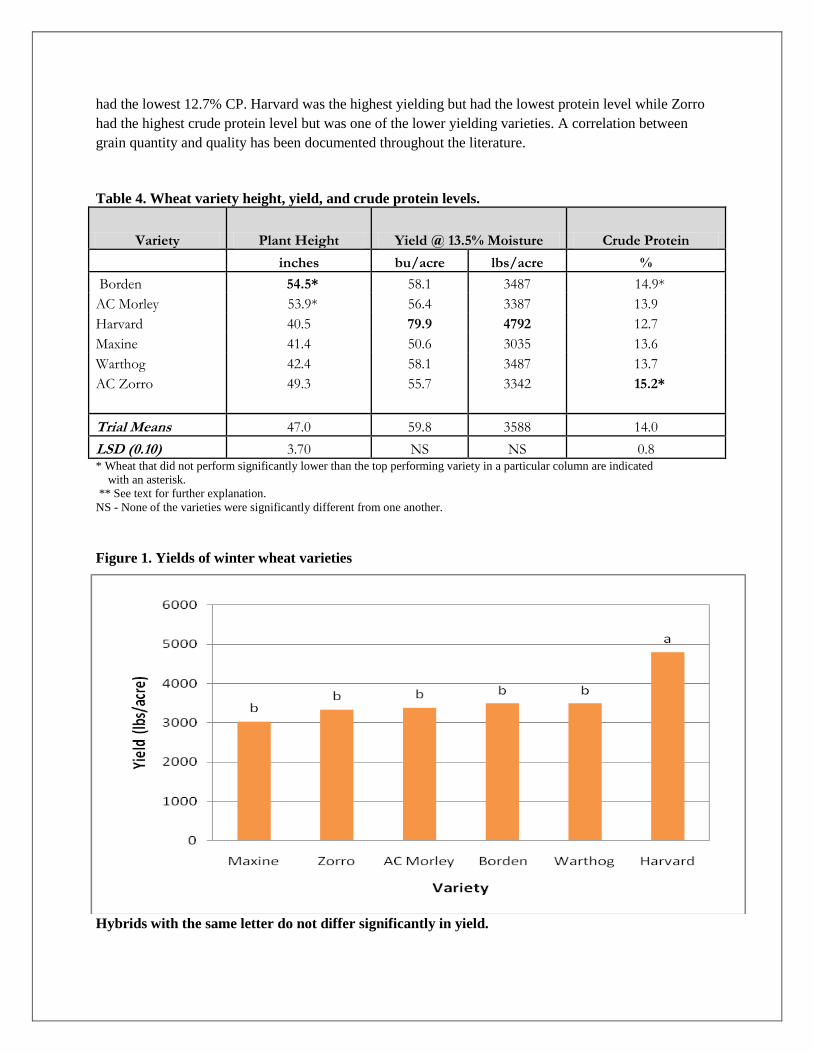
Figure 1. Yields of winter wheat varieties
Hybrids with the same letter do not differ significantly in yield.
SPRING WHEAT RESULTS
HWS9258J was the highest yielding spring wheat variety at 4098.7 lbs ac-1
while AC Walton was the
lowest with 1426.1 lbs ac-1
. The yields were significantly different (Table
5and Figure 2). There was a considerable amount of bird damage in the
spring wheat trials. In the taller varieties (AC Brio & Walton) the birds, by
landing on the wheat, would cause them to lodge. Wheat varieties with
awns appeared to have advantage over varieties without awns. The Durum
wheat, which was significantly shorter, suffered less bird damage but had
higher weed pressure. The test weights of varieties were significantly
different; Glenn wheat had the highest at 62.0 bu ac-1
while the lowest was
SD7006J. Both of the Durum wheat varieties, SD 7006J and Hallmark,
had the lowest test weight values. There was no significant difference
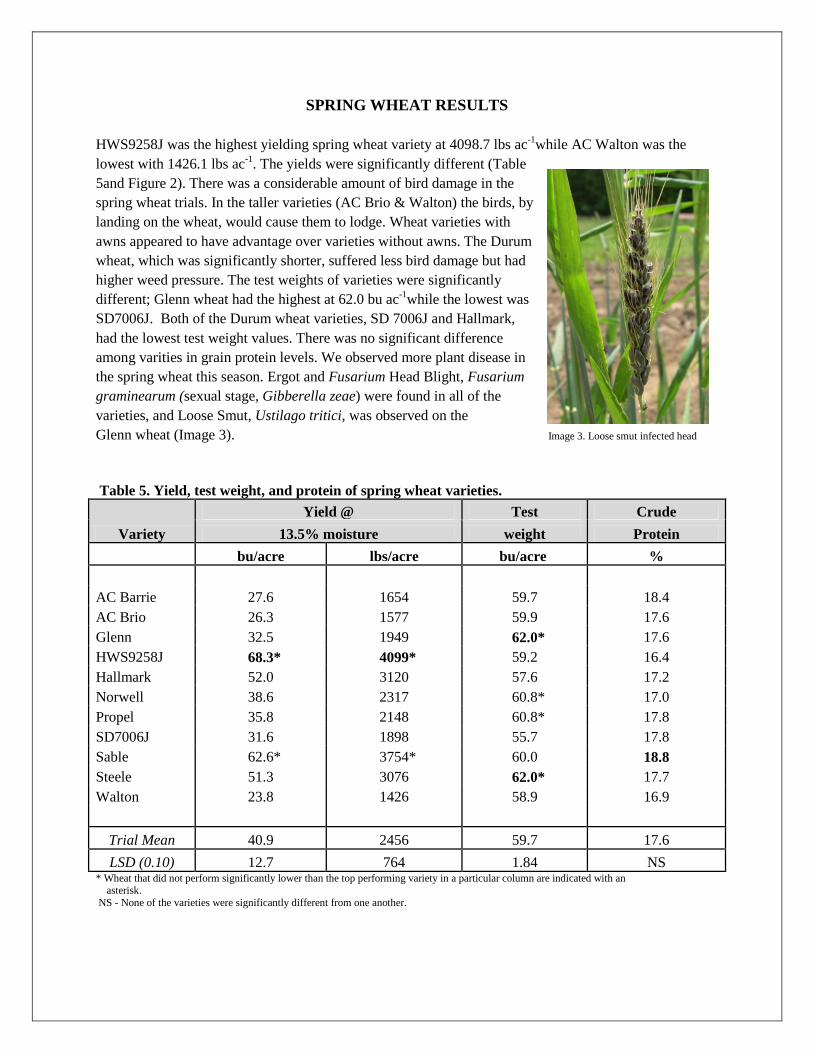
among varities in grain protein levels. We observed more plant disease in
the spring wheat this season. Ergot and Fusarium Head Blight, Fusarium
graminearum (sexual stage, Gibberella zeae) were found in all of the
varieties, and Loose Smut, Ustilago tritici, was observed on the
Glenn wheat (Image 3). Image 3. Loose smut infected head
Table 5. Yield, test weight, and protein of spring wheat varieties.
Variety
Yield @ Test Crude
13.5% moisture weight Protein
bu/acre lbs/acre bu/acre %
AC Barrie 27.6 1654 59.7 18.4
AC Brio 26.3 1577 59.9 17.6
Glenn 32.5 1949 62.0* 17.6
HWS9258J 68.3* 4099* 59.2 16.4
Hallmark 52.0 3120 57.6 17.2
Norwell 38.6 2317 60.8* 17.0
Propel 35.8 2148 60.8* 17.8
SD7006J 31.6 1898 55.7 17.8
Sable 62.6* 3754* 60.0 18.8
Steele 51.3 3076 62.0* 17.7
Walton 23.8 1426 58.9 16.9
Trial Mean 40.9 2456 59.7 17.6
LSD (0.10) 12.7 764 1.84 NS * Wheat that did not perform significantly lower than the top performing variety in a particular column are indicated with an asterisk. NS - None of the varieties were significantly different from one another.
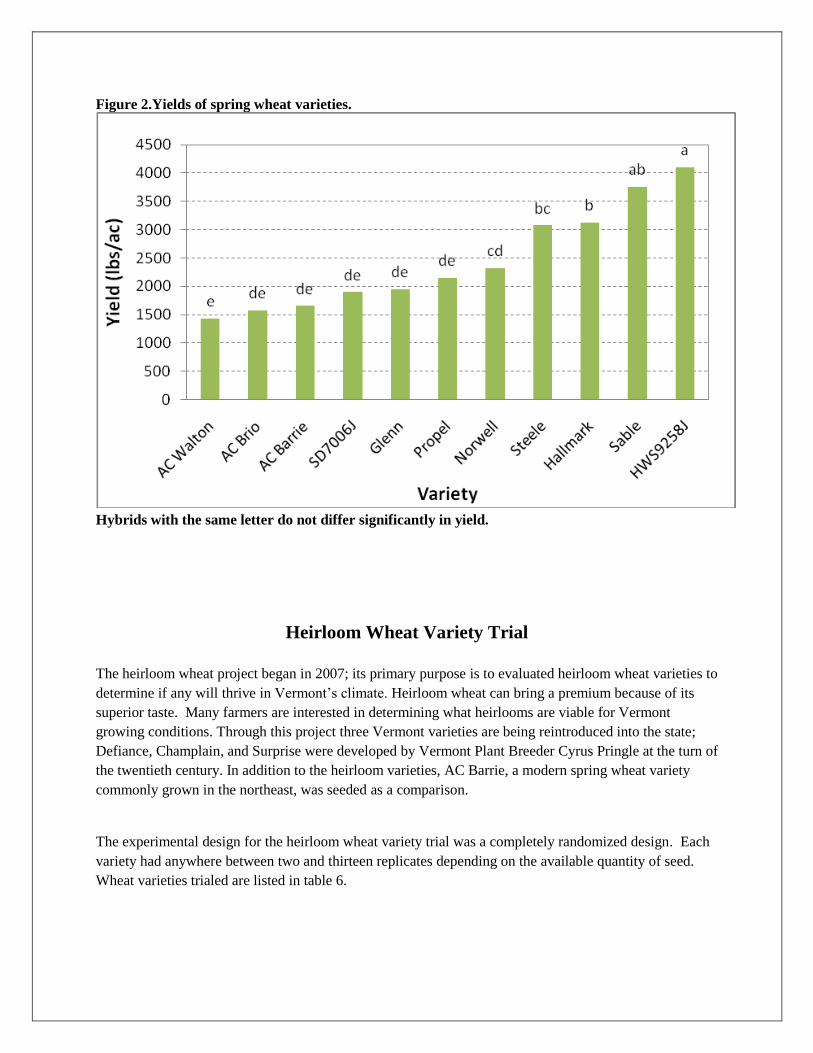
Figure 2.Yields of spring wheat varieties.
Hybrids with the same letter do not differ significantly in yield.
Heirloom Wheat Variety Trial
The heirloom wheat project began in 2007; its primary purpose is to evaluated heirloom wheat varieties to
determine if any will thrive in Vermont’s climate. Heirloom wheat can bring a premium because of its
superior taste. Many farmers are interested in determining what heirlooms are viable for Vermont
growing conditions. Through this project three Vermont varieties are being reintroduced into the state;
Defiance, Champlain, and Surprise were developed by Vermont Plant Breeder Cyrus Pringle at the turn of
the twentieth century. In addition to the heirloom varieties, AC Barrie, a modern spring wheat variety
commonly grown in the northeast, was seeded as a comparison.
The experimental design for the heirloom wheat variety trial was a completely randomized design. Each
variety had anywhere between two and thirteen replicates depending on the available quantity of seed.
Wheat varieties trialed are listed in table 6.
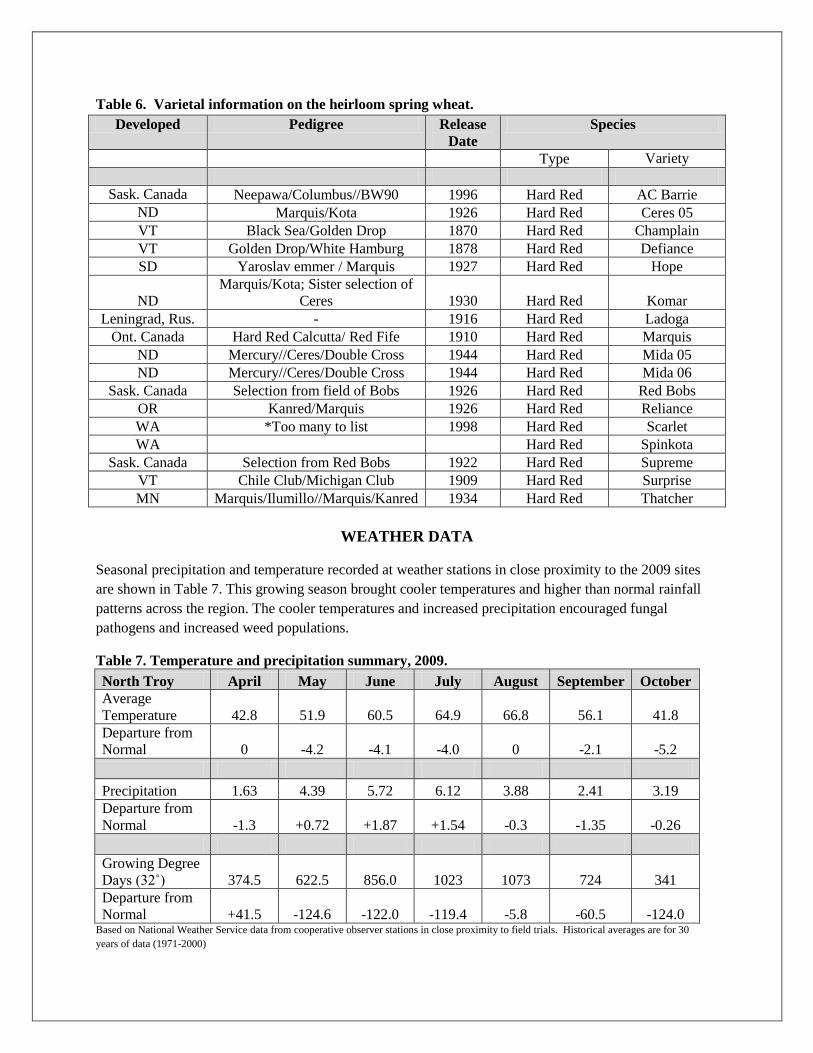
Table 6. Varietal information on the heirloom spring wheat.
Developed Pedigree Release
Date
Species
Type Variety
Sask. Canada Neepawa/Columbus//BW90 1996 Hard Red AC Barrie
ND Marquis/Kota 1926 Hard Red Ceres 05
VT Black Sea/Golden Drop 1870 Hard Red Champlain
VT Golden Drop/White Hamburg 1878 Hard Red Defiance
SD Yaroslav emmer / Marquis 1927 Hard Red Hope
ND
Marquis/Kota; Sister selection of
Ceres 1930 Hard Red Komar
Leningrad, Rus. - 1916 Hard Red Ladoga
Ont. Canada Hard Red Calcutta/ Red Fife 1910 Hard Red Marquis
ND Mercury//Ceres/Double Cross 1944 Hard Red Mida 05
ND Mercury//Ceres/Double Cross 1944 Hard Red Mida 06
Sask. Canada Selection from field of Bobs 1926 Hard Red Red Bobs
OR Kanred/Marquis 1926 Hard Red Reliance
WA *Too many to list 1998 Hard Red Scarlet
WA Hard Red Spinkota
Sask. Canada Selection from Red Bobs 1922 Hard Red Supreme
VT Chile Club/Michigan Club 1909 Hard Red Surprise
MN Marquis/Ilumillo//Marquis/Kanred 1934 Hard Red Thatcher
WEATHER DATA
Seasonal precipitation and temperature recorded at weather stations in close proximity to the 2009 sites
are shown in Table 7. This growing season brought cooler temperatures and higher than normal rainfall
patterns across the region. The cooler temperatures and increased precipitation encouraged fungal
pathogens and increased weed populations.
Table 7. Temperature and precipitation summary, 2009.
North Troy April May June July August September October
Average
Temperature 42.8 51.9 60.5 64.9 66.8 56.1 41.8
Departure from
Normal 0 -4.2 -4.1 -4.0 0 -2.1 -5.2
Precipitation 1.63 4.39 5.72 6.12 3.88 2.41 3.19
Departure from
Normal -1.3 +0.72 +1.87 +1.54 -0.3 -1.35 -0.26
Growing Degree
Days (32˚) 374.5 622.5 856.0 1023 1073 724 341
Departure from
Normal +41.5 -124.6 -122.0 -119.4 -5.8 -60.5 -124.0 Based on National Weather Service data from cooperative observer stations in close proximity to field trials. Historical averages are for 30
years of data (1971-2000)
CULTURAL PRACTICES
The seedbed was prepared by conventional tillage methods. All plots were managed with practices similar
to those used by producers in the surrounding areas (Table 8). The plots were seeded with a Carter Cone
Seeder. Grain plots were harvested with an Almaco SP50 plot combine. Plot yield and moisture were
recorded. Yield per acre of the heirloom varieties was determined based on averaging replicate data. A
statistical analysis was not performed on the data.
Table 8. General plot management of the heirloom wheat trials.
Trial Information Heirloom wheat
variety trial
Location North Troy, VT
Butterworks Farm
Soil type Sandy loam
Previous crop Soybeans
Plot size (ft.) 5x20
Seeding rate 100 lbs/acre
Replicates variable
Planting date 4-15-09
Harvest date 8-18-09
Tillage operations Spring Plow
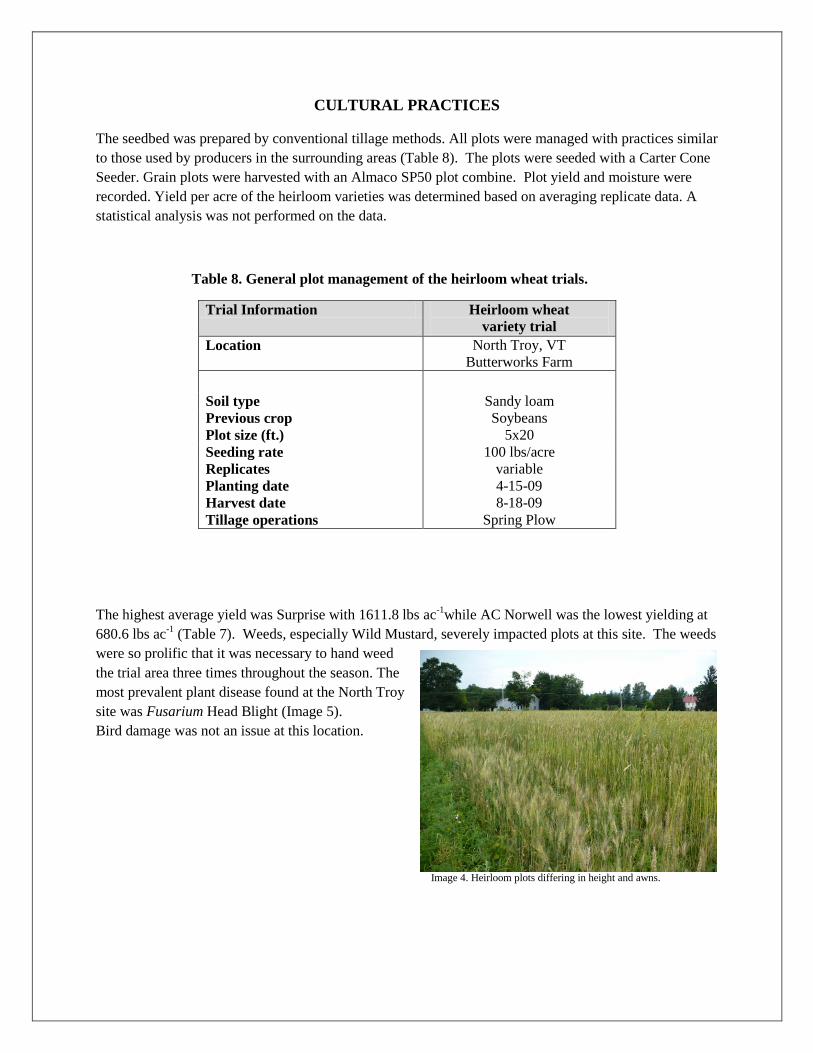
The highest average yield was Surprise with 1611.8 lbs ac-1
while AC Norwell was the lowest yielding at
680.6 lbs ac-1
(Table 7). Weeds, especially Wild Mustard, severely impacted plots at this site. The weeds
were so prolific that it was necessary to hand weed
the trial area three times throughout the season. The
most prevalent plant disease found at the North Troy
site was Fusarium Head Blight (Image 5).
Bird damage was not an issue at this location.
Image 4. Heirloom plots differing in height and awns.
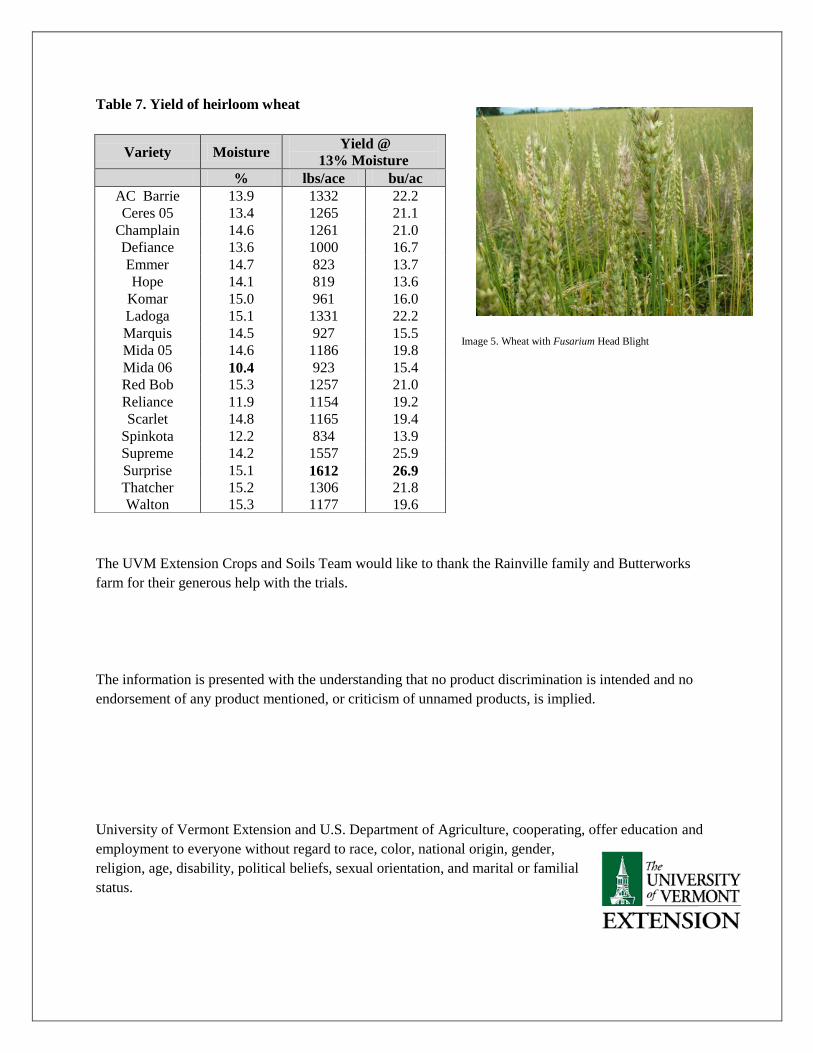
Table 7. Yield of heirloom wheat
Image 5. Wheat with Fusarium Head Blight
The UVM Extension Crops and Soils Team would like to thank the Rainville family and Butterworks
farm for their generous help with the trials.
The information is presented with the understanding that no product discrimination is intended and no
endorsement of any product mentioned, or criticism of unnamed products, is implied.
University of Vermont Extension and U.S. Department of Agriculture, cooperating, offer education and
employment to everyone without regard to race, color, national origin, gender,
religion, age, disability, political beliefs, sexual orientation, and marital or familial
status.
Variety Moisture Yield @
13% Moisture
% lbs/ace bu/ac
AC Barrie 13.9 1332 22.2
Ceres 05 13.4 1265 21.1
Champlain 14.6 1261 21.0
Defiance 13.6 1000 16.7
Emmer 14.7 823 13.7
Hope 14.1 819 13.6
Komar 15.0 961 16.0
Ladoga 15.1 1331 22.2
Marquis 14.5 927 15.5
Mida 05 14.6 1186 19.8
Mida 06 10.4 923 15.4
Red Bob 15.3 1257 21.0
Reliance 11.9 1154 19.2
Scarlet 14.8 1165 19.4
Spinkota 12.2 834 13.9
Supreme 14.2 1557 25.9
Surprise 15.1 1612 26.9
Thatcher 15.2 1306 21.8
Walton 15.3 1177 19.6
2009
Barley and Oat Trials
Dr. Heather Darby Erica Cummings, Rosalie Madden, and Amanda Gervais
802-524-6501
2009 VERMONT BARLEY AND OAT VARIETY PERFORMANCE TRIALS
Dr. Heather Darby, University of Vermont Extension
In 2009, the University of Vermont Extension established malting barley and oat variety trials at the
Borderview Research Farm in Alburgh. Several local breweries and distilleries approached us about
growing malting barley in the region. One of the interested distillers is located in Hardwick; therefore a
second trial site for malting barley was established at High Mowing Seeds in Hardwick
TESTING PROCEDURE
The experimental design at the Alburgh and the Hardwick locations were randomized complete block
with either three or four replications depending on the experiment. Barley and oat varieties evaluated are
listed in table 1. The seedbed at each location was prepared by conventional tillage methods. All plots
were managed with practices similar to those used by producers in the surrounding areas (Table 2). The
plots in Alburgh were seeded with a John Deere Seed Drill and a Carter Cone Seeder at the Hardwick site.
Grain plots were harvested with an Almaco SP50 plot combine. Yield, moisture, test weight and/or crude
protein were recorded. The data collected was analyzed using a mixed model analysis where replicates
were considered random effects. The LSD procedure was used to separate treatment means when the F-
test was significant (P< 0.10).
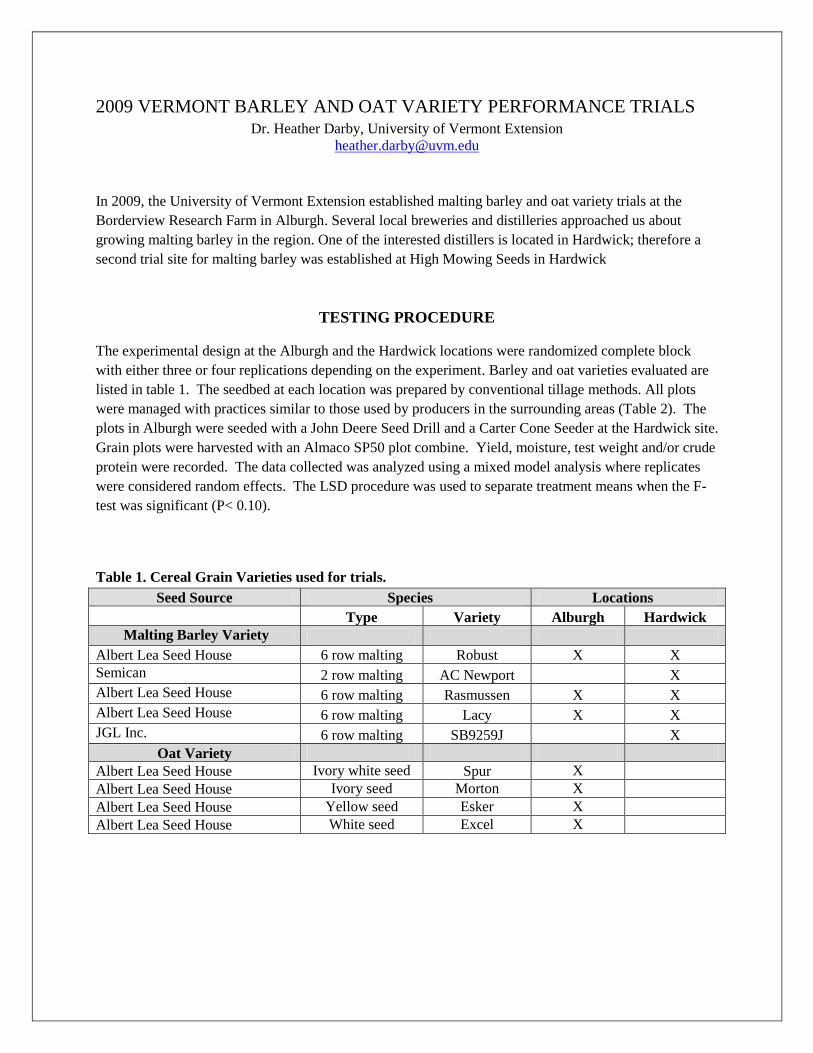
Table 1. Cereal Grain Varieties used for trials.
Seed Source Species Locations
Type Variety Alburgh Hardwick
Malting Barley Variety
Albert Lea Seed House 6 row malting Robust X X
Semican 2 row malting AC Newport X
Albert Lea Seed House 6 row malting Rasmussen X X
Albert Lea Seed House 6 row malting Lacy X X
JGL Inc. 6 row malting SB9259J X
Oat Variety
Albert Lea Seed House Ivory white seed Spur X
Albert Lea Seed House Ivory seed Morton X
Albert Lea Seed House Yellow seed Esker X
Albert Lea Seed House White seed Excel X
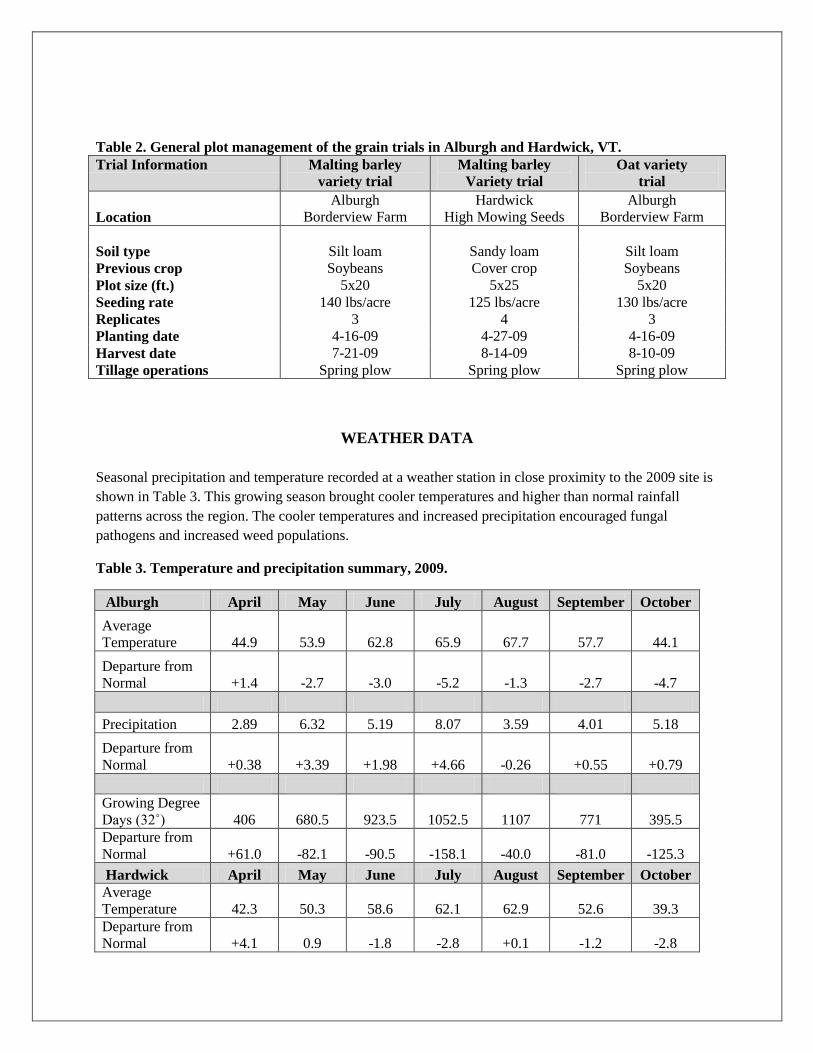
Table 2. General plot management of the grain trials in Alburgh and Hardwick, VT.
Trial Information Malting barley
variety trial
Malting barley
Variety trial
Oat variety
trial
Location
Alburgh
Borderview Farm
Hardwick
High Mowing Seeds
Alburgh
Borderview Farm
Soil type Silt loam Sandy loam Silt loam
Previous crop Soybeans Cover crop Soybeans
Plot size (ft.) 5x20 5x25 5x20
Seeding rate 140 lbs/acre 125 lbs/acre 130 lbs/acre
Replicates 3 4 3
Planting date 4-16-09 4-27-09 4-16-09
Harvest date 7-21-09 8-14-09 8-10-09
Tillage operations Spring plow Spring plow Spring plow
WEATHER DATA
Seasonal precipitation and temperature recorded at a weather station in close proximity to the 2009 site is
shown in Table 3. This growing season brought cooler temperatures and higher than normal rainfall
patterns across the region. The cooler temperatures and increased precipitation encouraged fungal
pathogens and increased weed populations.
Table 3. Temperature and precipitation summary, 2009.
Alburgh April May June July August September October
Average
Temperature 44.9 53.9 62.8 65.9 67.7 57.7 44.1
Departure from
Normal +1.4 -2.7 -3.0 -5.2 -1.3 -2.7 -4.7
Precipitation 2.89 6.32 5.19 8.07 3.59 4.01 5.18
Departure from
Normal +0.38 +3.39 +1.98 +4.66 -0.26 +0.55 +0.79
Growing Degree
Days (32˚) 406 680.5 923.5 1052.5 1107 771 395.5
Departure from
Normal +61.0 -82.1 -90.5 -158.1 -40.0 -81.0 -125.3
Hardwick April May June July August September October
Average
Temperature 42.3 50.3 58.6 62.1 62.9 52.6 39.3
Departure from
Normal +4.1 0.9 -1.8 -2.8 +0.1 -1.2 -2.8
Precipitation 2.16 5.74 4.69 5.82 4.66 2.62 4.17
Departure from
Normal -0.7 +1.97 +0.38 +1.39 -0.13 -1.35 +0.57
Growing Degree
Days (32˚) 366 572.5 796.5 936 964.5 632 296
Departure from
Normal +84.0 -24.3 -55.5 -83.9 +15.6 -23.5 -45.0 Based on National Weather Service data from cooperative observer stations in close proximity to field trials. Historical averages are for 30 years
of data (1971-2000)
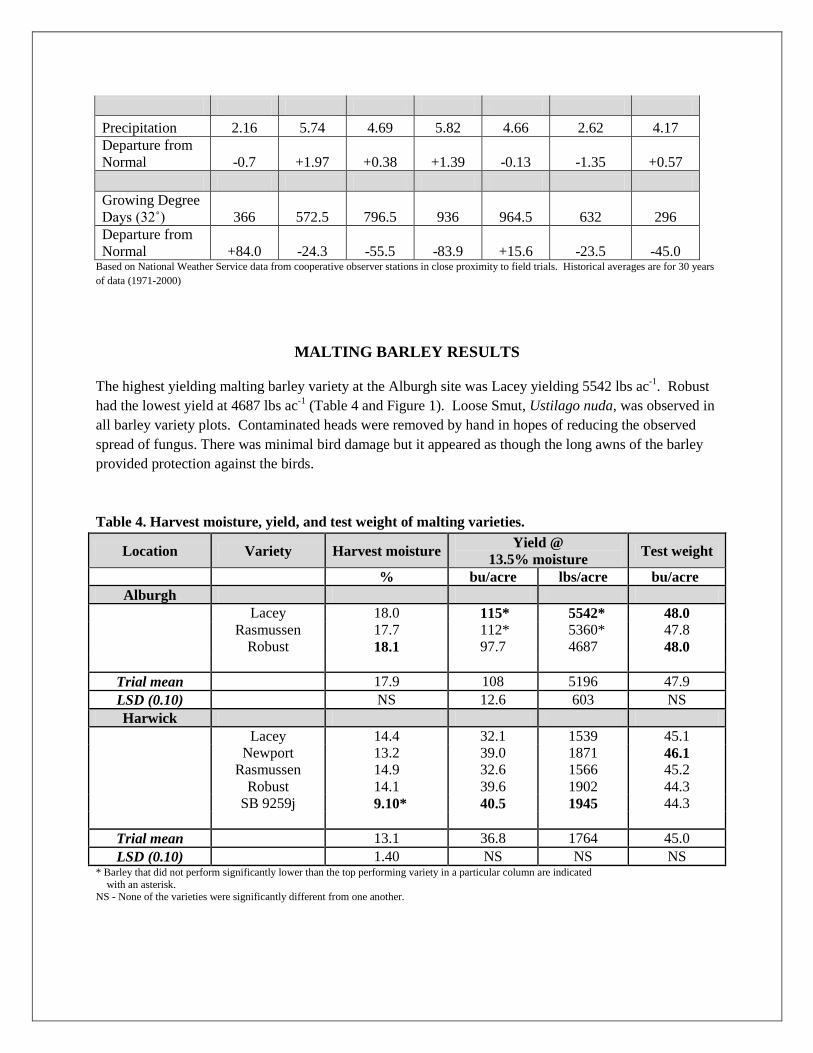
MALTING BARLEY RESULTS
The highest yielding malting barley variety at the Alburgh site was Lacey yielding 5542 lbs ac-1
. Robust
had the lowest yield at 4687 lbs ac-1
(Table 4 and Figure 1). Loose Smut, Ustilago nuda, was observed in
all barley variety plots. Contaminated heads were removed by hand in hopes of reducing the observed
spread of fungus. There was minimal bird damage but it appeared as though the long awns of the barley
provided protection against the birds.
Table 4. Harvest moisture, yield, and test weight of malting varieties.
Location Variety Harvest moisture Yield @
13.5% moisture Test weight
% bu/acre lbs/acre bu/acre
Alburgh
Lacey 18.0 115* 5542* 48.0
Rasmussen 17.7 112* 5360* 47.8
Robust 18.1 97.7 4687 48.0
Trial mean 17.9 108 5196 47.9
LSD (0.10) NS 12.6 603 NS
Harwick
Lacey 14.4 32.1 1539 45.1
Newport 13.2 39.0 1871 46.1
Rasmussen 14.9 32.6 1566 45.2
Robust 14.1 39.6 1902 44.3
SB 9259j 9.10* 40.5 1945 44.3
Trial mean 13.1 36.8 1764 45.0
LSD (0.10) 1.40 NS NS NS * Barley that did not perform significantly lower than the top performing variety in a particular column are indicated
with an asterisk. NS - None of the varieties were significantly different from one another.
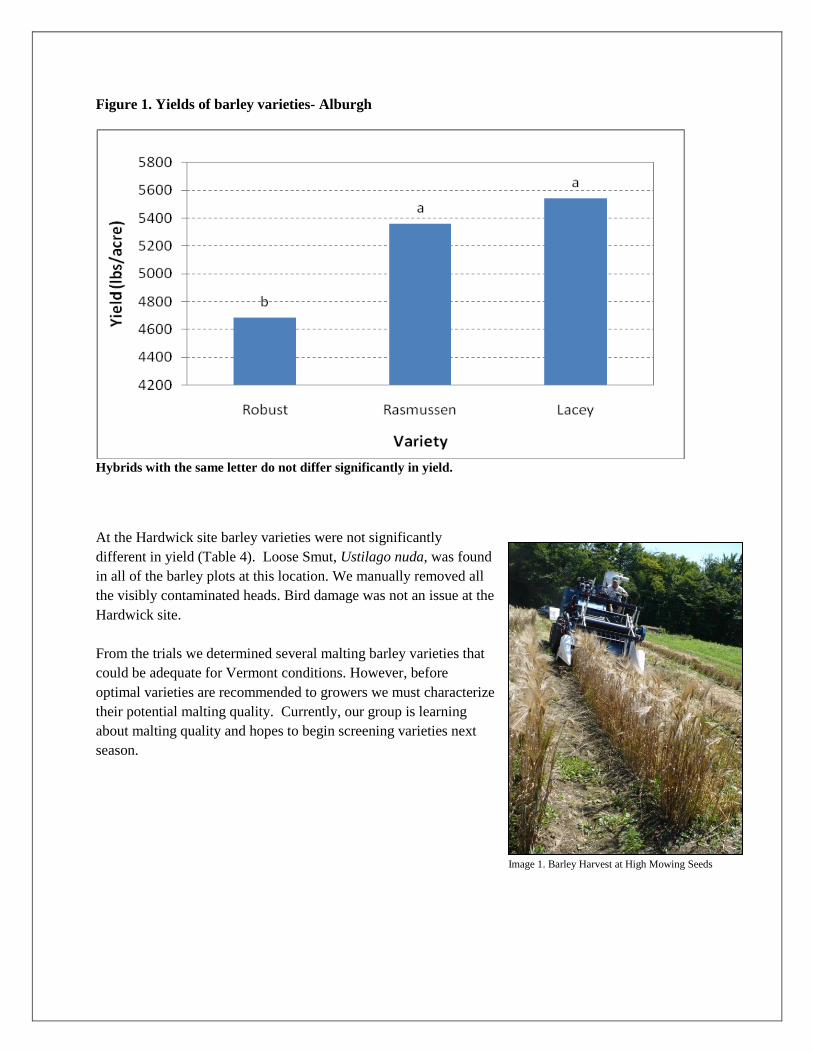
Figure 1. Yields of barley varieties- Alburgh
Hybrids with the same letter do not differ significantly in yield.
At the Hardwick site barley varieties were not significantly
different in yield (Table 4). Loose Smut, Ustilago nuda, was found
in all of the barley plots at this location. We manually removed all
the visibly contaminated heads. Bird damage was not an issue at the
Hardwick site.
From the trials we determined several malting barley varieties that
could be adequate for Vermont conditions. However, before
optimal varieties are recommended to growers we must characterize
their potential malting quality. Currently, our group is learning
about malting quality and hopes to begin screening varieties next
season.
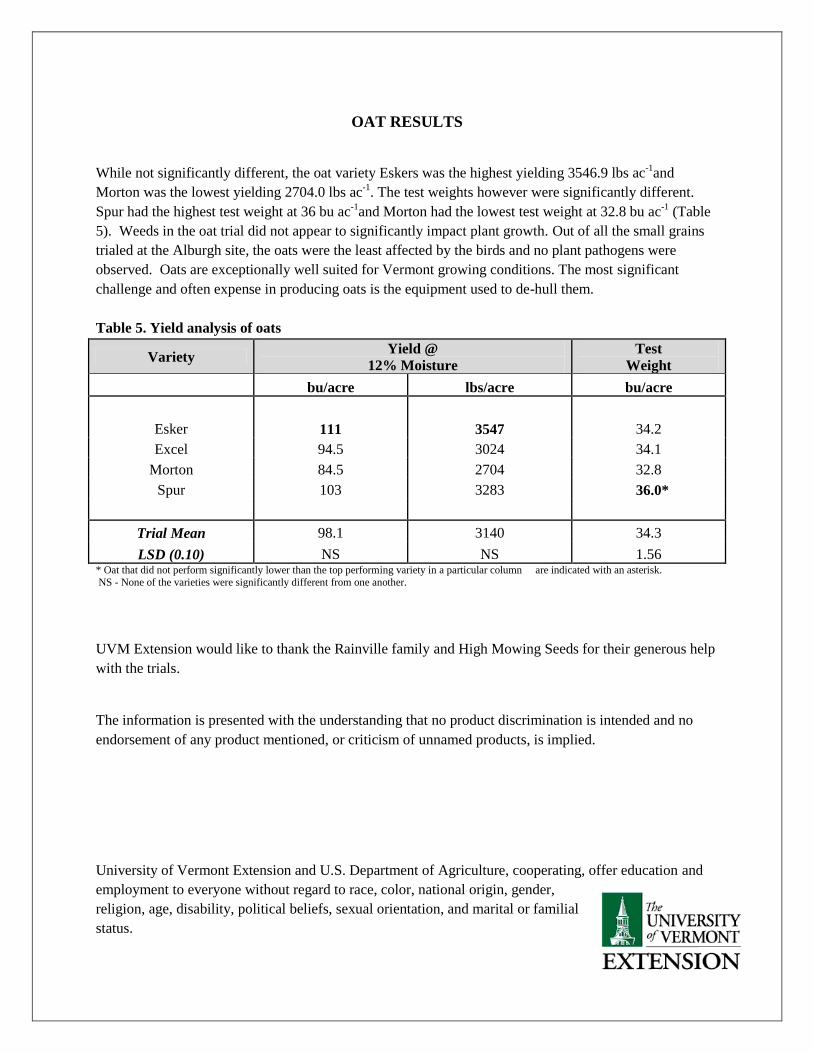
Image 1. Barley Harvest at High Mowing Seeds
OAT RESULTS
While not significantly different, the oat variety Eskers was the highest yielding 3546.9 lbs ac-1
and
Morton was the lowest yielding 2704.0 lbs ac-1
. The test weights however were significantly different.
Spur had the highest test weight at 36 bu ac-1
and Morton had the lowest test weight at 32.8 bu ac-1
(Table
5). Weeds in the oat trial did not appear to significantly impact plant growth. Out of all the small grains
trialed at the Alburgh site, the oats were the least affected by the birds and no plant pathogens were
observed. Oats are exceptionally well suited for Vermont growing conditions. The most significant
challenge and often expense in producing oats is the equipment used to de-hull them.
Table 5. Yield analysis of oats
Variety Yield @
12% Moisture
Test
Weight
bu/acre lbs/acre bu/acre
Esker 111 3547 34.2
Excel 94.5 3024 34.1
Morton 84.5 2704 32.8
Spur 103 3283 36.0*
Trial Mean 98.1 3140 34.3
LSD (0.10) NS NS 1.56 * Oat that did not perform significantly lower than the top performing variety in a particular column are indicated with an asterisk.
NS - None of the varieties were significantly different from one another.
UVM Extension would like to thank the Rainville family and High Mowing Seeds for their generous help
with the trials.
The information is presented with the understanding that no product discrimination is intended and no
endorsement of any product mentioned, or criticism of unnamed products, is implied.
University of Vermont Extension and U.S. Department of Agriculture, cooperating, offer education and
employment to everyone without regard to race, color, national origin, gender,
religion, age, disability, political beliefs, sexual orientation, and marital or familial
status.

.