2009 Eldon D. Foote Lecture in International Business · 2009 Eldon D. Foote Lecture in...
38
1 2009 Eldon D. Foote Lecture in International Business Dr. Daniel Trefler, The Rotman School, CIFAR, Institute for Competitiveness and Prosperity Of Dragons and Elephants: Responding to the Rise of China and India I was told that what I’d have to do is bring you something unique, and I hope that what I’m doing will fit the bill here. I will be trying to go beyond the hyperbola for this talk on what globalization really means, and try to do what most of us do best, and that is to muster facts. It’s really to say of globalization, “it’s an interesting hypothesis, but is it supported by facts?” Currently, and popularly, when you look at what’s happening in China and in India, it’s overwhelming―I mean in the sense that Canada will be overtaken and become a backwash, and it won’t be long at all before we’ll be darning the socks of visiting Chinese businessmen because that’s about all we’ll be good for. So, I want to try to put something into perspective, and this is not easy to do, because it involves understanding the Chinese economy, the Indian economy, and the Canadian economy. It’s not just a trade issue to be sorted through, it’s a matter of understanding the structure of three economies, and that’s vast, as probably everyone understands. I think you can get a sense of the extent of the hyperbola tied up with all this talk of outsourcing to China and India, from this slide which I took off an airplane magazine, offering to “outsource your personal life” through dating for business professionals. It’s an example of the hype over outsourcing which has so permeated the way we think about the world, that to my mind, it’s past the point of absurdity. So, to understand what I think is really going on, there are three things you really need to know. There is what I call the “dragon myth,” the notion that everything that we buy is made in China. Well, if everything is made in China, how can we possibly have any money left for what we produce? Still, when China finally produces that last manufacturing widget which it doesn’t already produce, we must eventually become impoverished...This is how the dragon myth runs. So, first thing, we need to do is to get past it. The second thing to do is to return to basics. And “basics” here is to return to competition. There are two types of competition in this world: there’s low-cost competition, where you manage your processes, keep your costs down as much as possible, and worry about productivity. Then there is innovation-based competition, in which what you’re trying to do is not to manage costs, but, of course, to find [unintelligible]. The Chinese and the Indians both tell us that they’ve completely crossed over, and that what they’re doing now is extraordinarily good, innovative products and services. I’m going to cast extreme skepticism on that claim. Not to take away from what China and India are doing―it’s something historically extraordinary―but they’ve hardly broken into OECD innovation levels…as of yet.
Transcript of 2009 Eldon D. Foote Lecture in International Business · 2009 Eldon D. Foote Lecture in...
1
2009 Eldon D. Foote Lecture in International Business
Dr. Daniel Trefler, The Rotman School, CIFAR, Institute for Competitiveness and
Prosperity
Of Dragons and Elephants: Responding to the Rise of China and India
I was told that what I’d have to do is bring you something unique, and I hope that what
I’m doing will fit the bill here. I will be trying to go beyond the hyperbola for this talk on
what globalization really means, and try to do what most of us do best, and that is to
muster facts. It’s really to say of globalization, “it’s an interesting hypothesis, but is it
supported by facts?”
Currently, and popularly, when you look at what’s happening in China and in India, it’s
overwhelming―I mean in the sense that Canada will be overtaken and become a
backwash, and it won’t be long at all before we’ll be darning the socks of visiting
Chinese businessmen because that’s about all we’ll be good for. So, I want to try to put
something into perspective, and this is not easy to do, because it involves understanding
the Chinese economy, the Indian economy, and the Canadian economy. It’s not just a
trade issue to be sorted through, it’s a matter of understanding the structure of three
economies, and that’s vast, as probably everyone understands.
I think you can get a sense of the extent of the hyperbola tied up with all this talk of
outsourcing to China and India, from this slide which I took off an airplane magazine,
offering to “outsource your personal life” through dating for business professionals. It’s
an example of the hype over outsourcing which has so permeated the way we think about
the world, that to my mind, it’s past the point of absurdity. So, to understand what I think
is really going on, there are three things you really need to know. There is what I call the
“dragon myth,” the notion that everything that we buy is made in China. Well, if
everything is made in China, how can we possibly have any money left for what we
produce? Still, when China finally produces that last manufacturing widget which it
doesn’t already produce, we must eventually become impoverished...This is how the
dragon myth runs. So, first thing, we need to do is to get past it.
The second thing to do is to return to basics. And “basics” here is to return to
competition. There are two types of competition in this world: there’s low-cost
competition, where you manage your processes, keep your costs down as much as
possible, and worry about productivity. Then there is innovation-based competition, in
which what you’re trying to do is not to manage costs, but, of course, to find
[unintelligible]. The Chinese and the Indians both tell us that they’ve completely crossed
over, and that what they’re doing now is extraordinarily good, innovative products and
services. I’m going to cast extreme skepticism on that claim. Not to take away from what
China and India are doing―it’s something historically extraordinary―but they’ve hardly
broken into OECD innovation levels…as of yet.

2
What I’m going to argue as well is that Canada, as much as it likes to think that it has an
innovation-based economy, is sitting on the fence, surprisingly, between low-cost and
innovation-based competition, and that positioning is what’s going to hurt us more than
anything else. It’s not what’s happening in China and India that will hurt us, but what will
happen here, and that’s what worries me more than anything.
The third thing that I want you to understand is what I call the innovation tipping point.
Innovation is spurred on by a number of things, including the presence of sophisticated,
affluent consumers who are driving producers to produce new and innovative products.
And there may, no, there will come a time when consumers in Shanghai and Mumbai are
sufficiently affluent that they are going to be driving such innovation in their own
domestic markets. Their own domestic producers would then become so savvy that they
are going to start churning out the products that we all want to buy. And when that time
comes, China and India will make all of us quake in our boots, in terms of our ability to
survive this manufacturing onslaught. That’s one view of what will happen when we pass
the innovation tipping point. I don’t think that’s quite the right story, but I’ll tell you what
I think is the right story as we go along.
Let us go back to those three pillars―the dragon myth; making sure we know the
difference between low-cost competition and innovation-based competition; and making
sure we understand this innovation tipping point. With those three in place, I think we
can go quite far.
1. The Dragon Myth
DescriptionImports Share (% of total
imports from China)Imports per capita (C$)
Laptop and Accessories 9% 110
Telephone and Accessories 4% 56
Table Games 4% 45
Monitors and Projectors 3% 42
Toys 2% 31
Furniture 2% 30
Seats 2% 26
Sweaters 2% 22
Leather Bags 2% 21
Women/Girls Suits 2% 21
3
So, let me start by telling you about what I call the dragon myth, and which I’ve already
hinted at clearly enough. What is it that we buy from China? We as consumers buy flat
panel TVs that are made in China, Ipods, our telephones, are made in China. Our
dishwashers increasingly, our air conditioners, and so on…it seems like everything we
buy is made in China. Is that true? Well, yes―but take a look at what we import from
China. What are the important things? Nine percent of what we import are laptops,
another four percent are telephones and accessories. You see in the slide’s list cable
games, monitors, toys―a killer in my household, maybe in some of yours, they’re the X-
boxes and Playstations. China produces, through this view, a remarkable weight of great,
consumer-oriented products.
The trouble is with our seeing the world through consumers’ eyes. As shoppers, you
know that this is what we spend all our time on. We don’t spend it buying a house, right?
We buy the house, and that’s it. As renters, we don’t worry about these things. When we
go and use healthcare, we don’t worry about, you know, shopping around for the best
healthcare. So as consumers we’re very much geared to shopping for Chinese goods; and
we’re not geared to shopping for Canadian goods. I want to really bring home this point
clearly, so, let’s just take a scenario.
2: The Dragon Myth
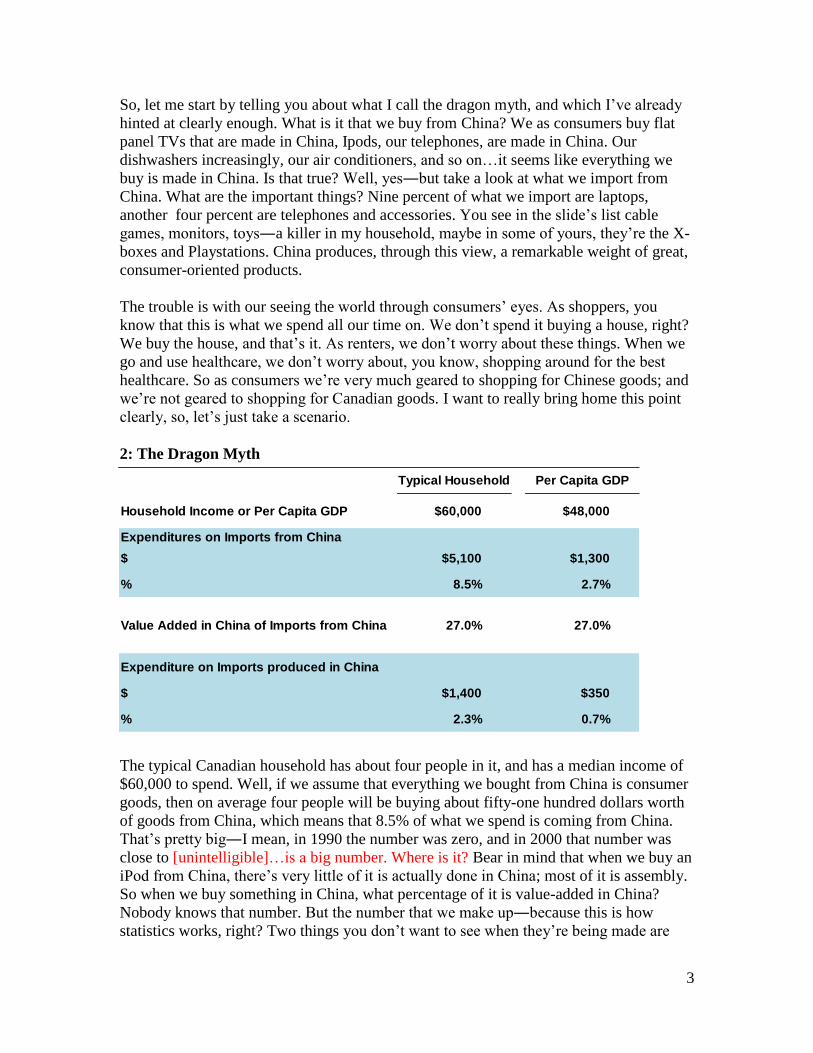
The typical Canadian household has about four people in it, and has a median income of
$60,000 to spend. Well, if we assume that everything we bought from China is consumer
goods, then on average four people will be buying about fifty-one hundred dollars worth
of goods from China, which means that 8.5% of what we spend is coming from China.
That’s pretty big―I mean, in 1990 the number was zero, and in 2000 that number was
close to [unintelligible]…is a big number. Where is it? Bear in mind that when we buy an
iPod from China, there’s very little of it is actually done in China; most of it is assembly.
So when we buy something in China, what percentage of it is value-added in China?
Nobody knows that number. But the number that we make up―because this is how
statistics works, right? Two things you don’t want to see when they’re being made are
Typical Household Per Capita GDP
Household Income or Per Capita GDP $60,000 $48,000
Expenditures on Imports from China
$ $5,100 $1,300
% 8.5% 2.7%
Value Added in China of Imports from China 27.0% 27.0%
Expenditure on Imports produced in China
$ $1,400 $350
% 2.3% 0.7%
4
statistics and sausages.―this number that people cite, is 27% percent. China is coming up
with some serious estimates for value-added in the next two years, so maybe in a couple
of years we’ll actually know what the real number is. But, that’s the number that I think
is most sensible, from all the things I’ve seen. So, if only 27% of what we buy from
China is actually produced in China, then that fifty-one hundred dollars is really about a
quarter, or about fourteen hundred dollars. So really, we spend about 2.3% of our income
on goods produced in China. It’s not so overwhelming.
Now let’s go to a national income accounting frame. The national income accounting
frame given in the second column indicates that GDP per capita is $48, 000. That’s how
much income we have, or that we generate per man, woman, and child. And per man,
woman, and child we purchase about $1300 worth of goods from China, or about 2.7% of
GDP. Only a quarter, or twenty-seven percent, of that is produced in China, which means
that per man, woman, and child, we’re only importing $350 dollars worth of goods
produced in China. And sadly, the number that we’re looking at, instead of being, you
know, a big fraction of what we spend on consumer goods, is now point-seven per cent of
GDP. So, let’s bear in mind that while what we as consumers see is China, China, China,
or what we get the phone calls on is India, India, India, the fact of the matter is it is still a
small share of what we do.
Of course, everybody always asks the question: so what do we do? The Chinese “make
everything” and that makes up only point seven per cent of GDP, then what do we do?
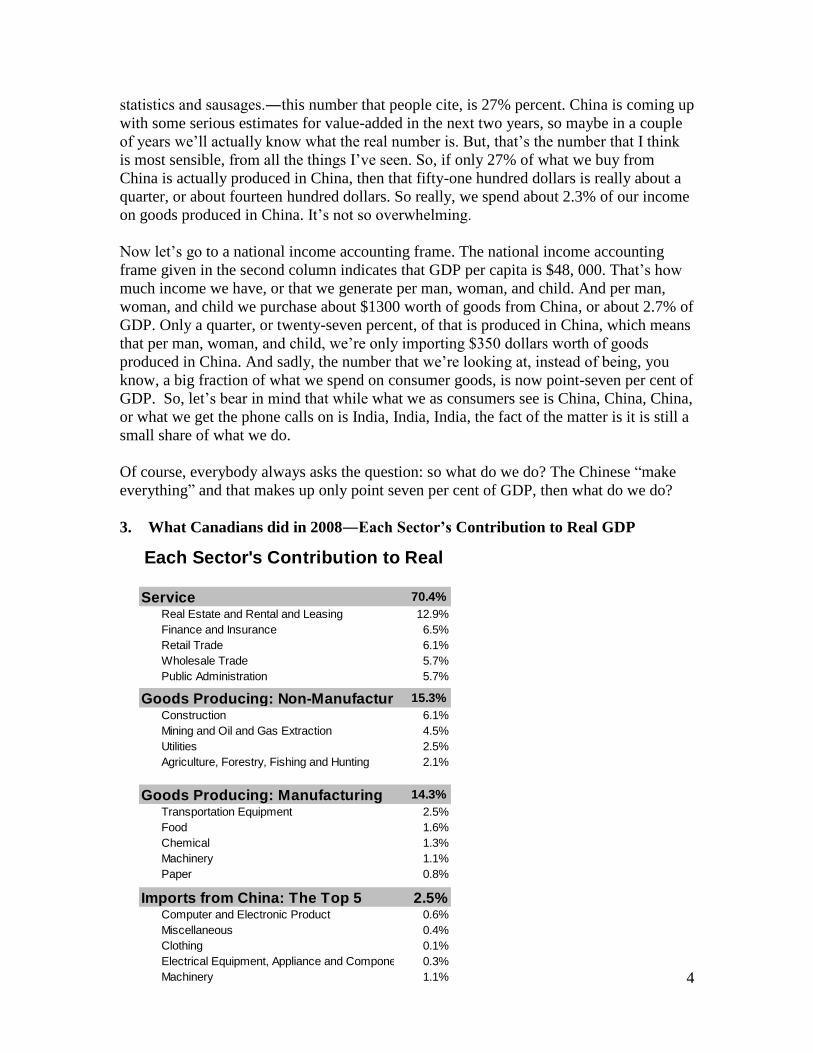
3. What Canadians did in 2008―Each Sector’s Contribution to Real GDP
Service 70.4%
Real Estate and Rental and Leasing 12.9%
Finance and Insurance 6.5%
Retail Trade 6.1%
Wholesale Trade 5.7%
Public Administration 5.7%
Goods Producing: Non-Manufacturing15.3%
Construction 6.1%
Mining and Oil and Gas Extraction 4.5%
Utilities 2.5%
Agriculture, Forestry, Fishing and Hunting 2.1%
Goods Producing: Manufacturing 14.3%
Transportation Equipment 2.5%
Food 1.6%
Chemical 1.3%
Machinery 1.1%
Paper 0.8%
Imports from China: The Top 5 2.5%Computer and Electronic Product 0.6%
Miscellaneous 0.4%
Clothing 0.1%
Electrical Equipment, Appliance and Component 0.3%
Machinery 1.1%
Each Sector's Contribution to Real
GDP

5
Remembering back to 1900, when we talked about agriculture we said that agriculture
was the backbone of the economy, the farmers bore the economy on their shoulders, food
was essential for life, and without it, we’re nothing. Well, today agriculture is two per
cent of GDP. Manufacturing is also trending down fast. In the ‘fifties it was about 25% of
GDP, and now we’re quickly heading towards 10%. Why? It’s because of productivity.
[we’re getting good at time] Just like we got good at producing food, now we’re getting
good at producing manufactured goods. So, manufacturing is shrinking, and that’s not
what we do anymore. Then, what do we do in Canada? Much of it now, 70%, is services.
If you’re my dad you’ll say, “That’s not producing anything really, Dan.” Well, when I
bought my house that real estate agent really did help me. When I go for healthcare,
public administration really does help me. When I buy my iPod, which costs $300 and I
pay $150 of that in wholesale-retail markup, somebody’s providing me a service. I
certainly don’t want to travel to China to buy an iPod. So, these are important things.
When you look into non-manufacturing—building my house, for example, is a big part of
what I’ve spent in my lifetime―it’s 6.1% of the economy. Mining, and oil and gas
extraction is huge, they’re four and a half percent of the economy. That’s all Alberta: it’s
amazing, it’s actually crazy. Manufacturing is14% of the economy, and of course, the
killer, transportation equipment, is two and half percent. That’s all Ontario, or was
Ontario. It’s interesting to note that despite the fact that Ontario has been killed on
transportation equipment, transportation equipment is not on our top five list of goods we
buy from China. We don’t buy from China anything much to do with automobiles.
Alright, so we’ve talked about this dragon myth, and I’d like next to talk about this issue
of low-cost versus innovation-based competition, to bring out the distinction between
them. So let’s take a look at what China produces, and at what Canada imports and
exports, so you can get a sense of where we stand on this front.
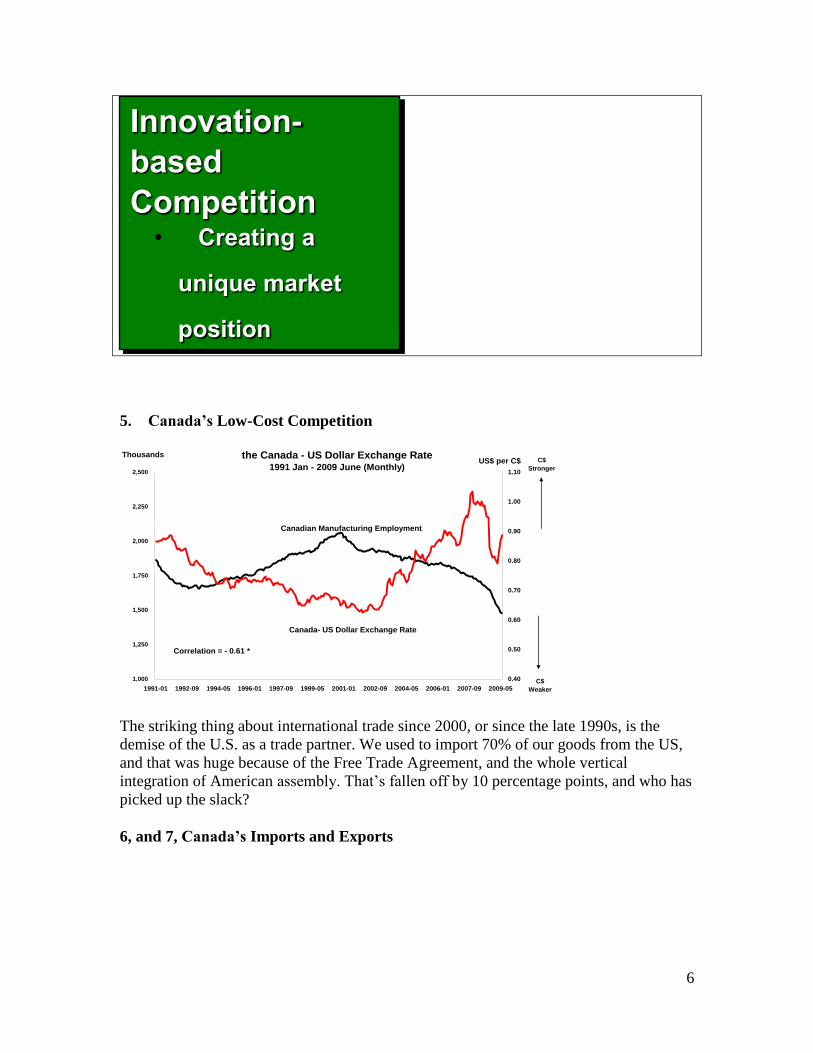
4. Competition
Low-cost
Competition
• Focus on
Productivity • Managing Costs
6
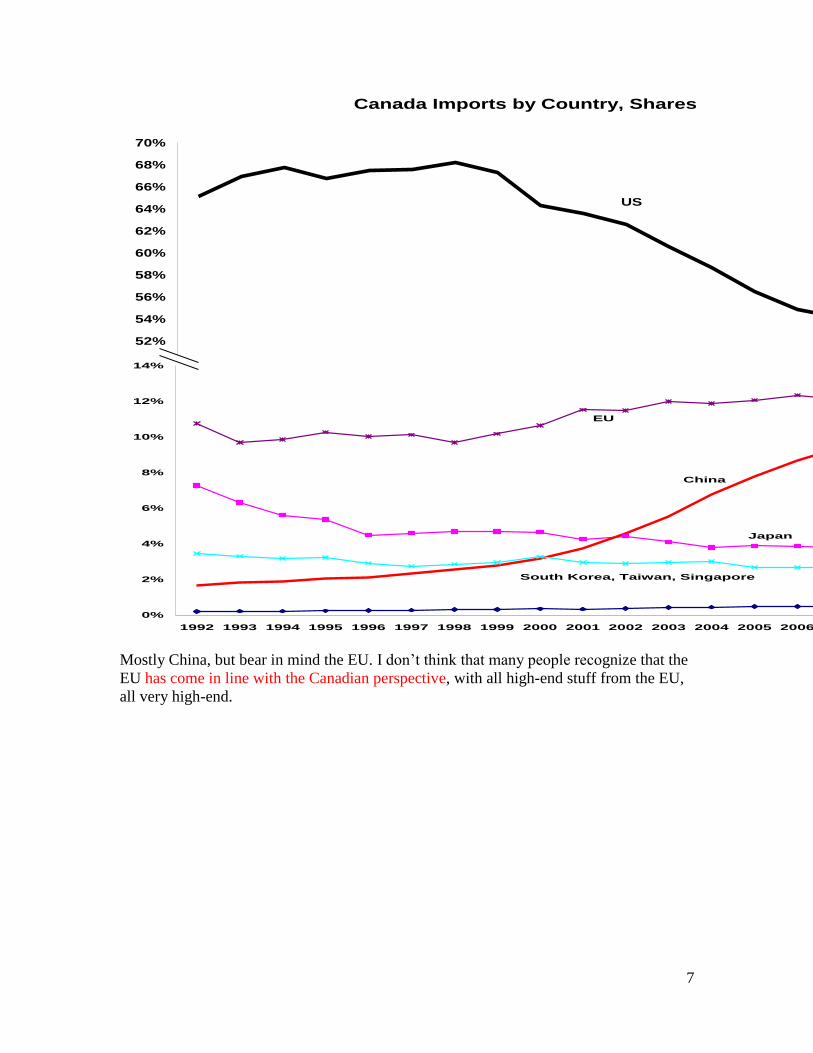
5. Canada’s Low-Cost Competition
The striking thing about international trade since 2000, or since the late 1990s, is the
demise of the U.S. as a trade partner. We used to import 70% of our goods from the US,
and that was huge because of the Free Trade Agreement, and the whole vertical
integration of American assembly. That’s fallen off by 10 percentage points, and who has
picked up the slack?
6, and 7, Canada’s Imports and Exports
1,000
1,250
1,500
1,750
2,000
2,250
2,500
1991-01 1992-09 1994-05 1996-01 1997-09 1999-05 2001-01 2002-09 2004-05 2006-01 2007-09 2009-05
0.40
0.50
0.60
0.70
0.80
0.90
1.00
1.10
Canadian Manufacturing Employment
Canada- US Dollar Exchange Rate
ThousandsUS$ per C$
Canadian Manufacturing Employment and
the Canada - US Dollar Exchange Rate1991 Jan - 2009 June (Monthly)
Note: * significant at 1%.
Source: Institute for Competitiveness & Prosperity analysis based on data from Statistics Canada and Bank of Canada.
C$
Stronger
C$
Weaker
Correlation = - 0.61 *
Innovation-
based
Competition
• Creating a
unique market
position
7
Mostly China, but bear in mind the EU. I don’t think that many people recognize that the
EU has come in line with the Canadian perspective, with all high-end stuff from the EU,
all very high-end.
Canada Imports by Country, Shares
0%
2%
4%
6%
8%
10%
12%
14%
1992 1993 1994 1995 1996 1997 1998 1999 2000 2001 2002 2003 2004 2005 2006 2007 2008
Japan
China
South Korea, Taiwan, Singapore
EU
India
Canada Imports by Country, Shares
40%
42%
44%
46%
48%
50%
52%
54%
56%
58%
60%
62%
64%
66%
68%
70%
1992 1993 1994 1995 1996 1997 1998 1999 2000 2001 2002 2003 2004 2005 2006 2007 2008
US
8
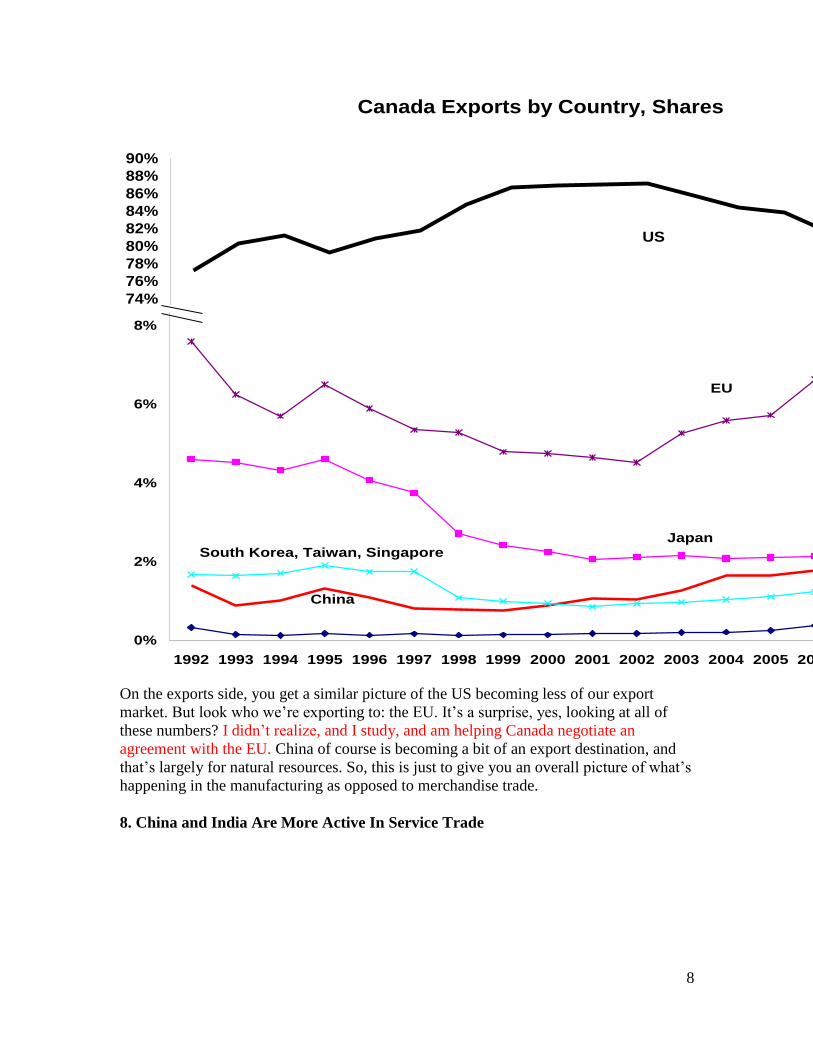
On the exports side, you get a similar picture of the US becoming less of our export
market. But look who we’re exporting to: the EU. It’s a surprise, yes, looking at all of
these numbers? I didn’t realize, and I study, and am helping Canada negotiate an
agreement with the EU. China of course is becoming a bit of an export destination, and
that’s largely for natural resources. So, this is just to give you an overall picture of what’s
happening in the manufacturing as opposed to merchandise trade.
8. China and India Are More Active In Service Trade
Canada Exports by Country, Shares
0%
2%
4%
6%
8%
10%
1992 1993 1994 1995 1996 1997 1998 1999 2000 2001 2002 2003 2004 2005 2006 2007 2008
Japan
China
South Korea, Taiwan, Singapore
EU
India
Canada Exports by Country, Shares
40%
42%
44%
46%
48%
50%
52%
54%
56%
58%
60%
62%
64%
66%
68%
70%
72%
74%
76%
78%
80%
82%
84%
86%
88%
90%
1992 1993 1994 1995 1996 1997 1998 1999 2000 2001 2002 2003 2004 2005 2006 2007 2008
US
9
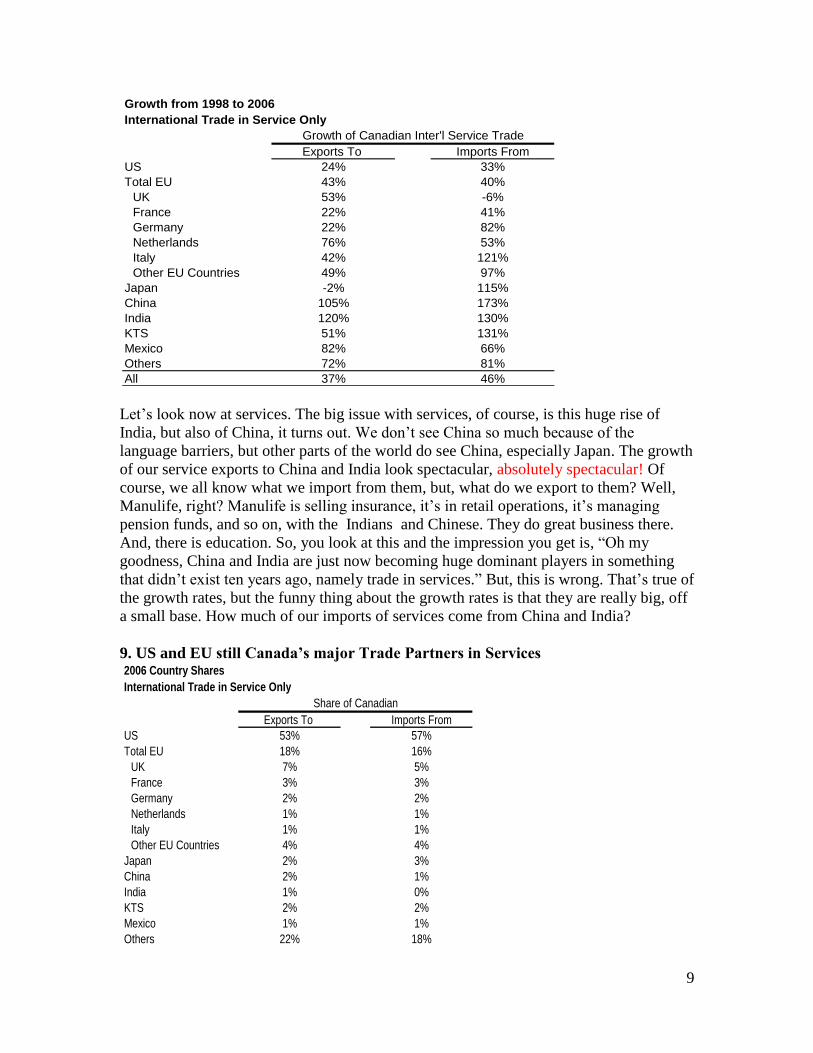
Let’s look now at services. The big issue with services, of course, is this huge rise of
India, but also of China, it turns out. We don’t see China so much because of the
language barriers, but other parts of the world do see China, especially Japan. The growth
of our service exports to China and India look spectacular, absolutely spectacular! Of
course, we all know what we import from them, but, what do we export to them? Well,
Manulife, right? Manulife is selling insurance, it’s in retail operations, it’s managing
pension funds, and so on, with the Indians and Chinese. They do great business there.
And, there is education. So, you look at this and the impression you get is, “Oh my
goodness, China and India are just now becoming huge dominant players in something
that didn’t exist ten years ago, namely trade in services.” But, this is wrong. That’s true of
the growth rates, but the funny thing about the growth rates is that they are really big, off
a small base. How much of our imports of services come from China and India?
9. US and EU still Canada’s major Trade Partners in Services
Growth from 1998 to 2006
International Trade in Service Only
Growth of Canadian Inter'l Service Trade
Exports To Imports From
US 24% 33%
Total EU 43% 40%
UK 53% -6%
France 22% 41%
Germany 22% 82%
Netherlands 76% 53%
Italy 42% 121%
Other EU Countries 49% 97%
Japan -2% 115%
China 105% 173%
India 120% 130%
KTS 51% 131%
Mexico 82% 66%
Others 72% 81%
All 37% 46%
2006 Country Shares
International Trade in Service Only
Share of Canadian
Exports To Imports From
US 53% 57%
Total EU 18% 16%
UK 7% 5%
France 3% 3%
Germany 2% 2%
Netherlands 1% 1%
Italy 1% 1%
Other EU Countries 4% 4%
Japan 2% 3%
China 2% 1%
India 1% 0%
KTS 2% 2%
Mexico 1% 1%
Others 22% 18%

10
Something looks a little bit wrong with the numbers, but the point is that for sure [the
total is] under 3%. Now, China and India remain inconsequential. 80% of what we buy
and sell in the way of services internationally, is with OECD countries, mostly with the
US, though the UK is a big destination as well.
9. “Much Ado about Nothing”
So, let’s not kid ourselves about having spectacular growth rates
impact so far. Runjuan Liu and I have a paper which talks about
what the stats and the impacts from Indian Inc. are: they’re what we
call, “Much Ado about Nothing.” We generated systematic analyses
of what the labor market impacts have been of offshoring services
to China and India, and the impact at the end is zero, and that’s
precisely estimated, for those of you who are statisticians.
I want to make one quick note and that is that Canada is also a major exporter of services.
10. The American “Dis”
We are a major exporter of services, but the fact is, if you look at the composition of what
we export, it is actually surprisingly low end. Manulife is a great example, but I can give
you many more examples of things that look like call centres in the Atlantic provinces.
So, we are much more on the low cost side of competition when it comes to our service
exports.
11. Canada: Wrong End of the Value Chain?
U.S. Imports of Offshored Services
All Offshored Services Royalties & License Fees
United Kingdom 20% Japan 26%
Bermuda 11% Germany 11%
Canada 10% Switzerland 10%
Germany 9% United Kingdom 8%
Japan 6% Netherlands 8%
France 5% Bermuda 7%
Switzerland 5% France 7%
Mexico 3% Canada 5%
Netherlands 3% Mexico 1%
Export-oriented FDI Projects Worldwide, 2002-2003
Country
Low Value
Added Country
High Value
Added
India 60 India 168
Canada 56 UK 144
UK 43 USA 108
China 30 China 102
Ireland 29 Singapore 79
Germany 20 Germany 57
Australia 19 Australia 53
Singapore 16 China & HK 51
USA 15 Ireland 48
China & HK 2 Canada 42
11
Now, let’s see what we know about how, or to what extent China―I’ll put aside India for
awhile, so my apologies to anybody who is really wanting to hear about elephants―is an
innovation-based economy.
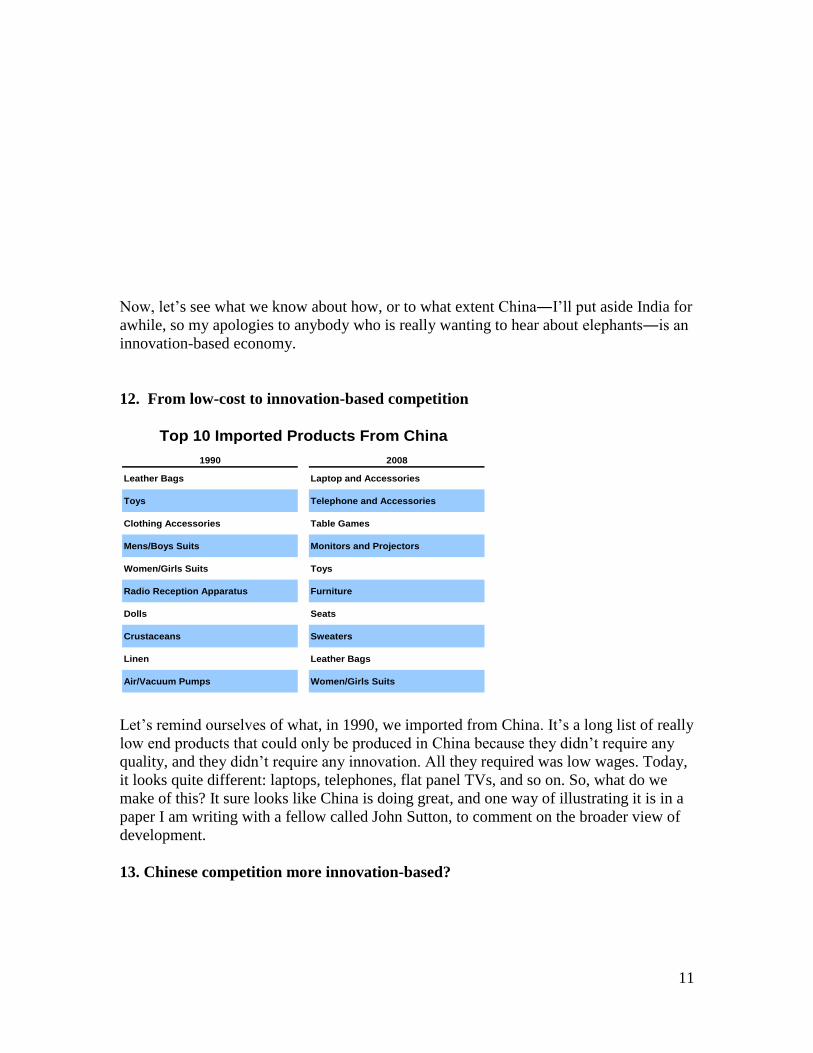
12. From low-cost to innovation-based competition
Let’s remind ourselves of what, in 1990, we imported from China. It’s a long list of really
low end products that could only be produced in China because they didn’t require any
quality, and they didn’t require any innovation. All they required was low wages. Today,
it looks quite different: laptops, telephones, flat panel TVs, and so on. So, what do we
make of this? It sure looks like China is doing great, and one way of illustrating it is in a
paper I am writing with a fellow called John Sutton, to comment on the broader view of
development.
13. Chinese competition more innovation-based?
1990 2008
Leather Bags Laptop and Accessories
Toys Telephone and Accessories
Clothing Accessories Table Games
Mens/Boys Suits Monitors and Projectors
Women/Girls Suits Toys
Radio Reception Apparatus Furniture
Dolls Seats
Crustaceans Sweaters
Linen Leather Bags
Air/Vacuum Pumps Women/Girls Suits
35% of Total Imports from China 32% of Total Imports from China
Top 10 Imported Products From China
12
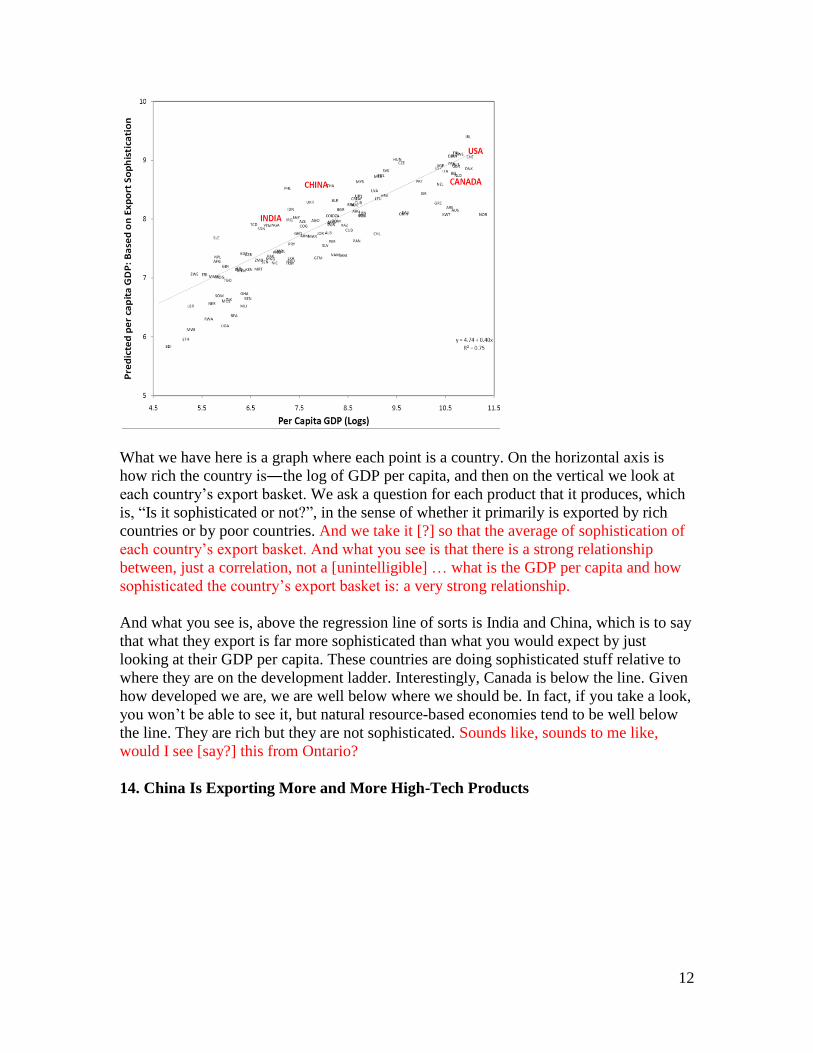
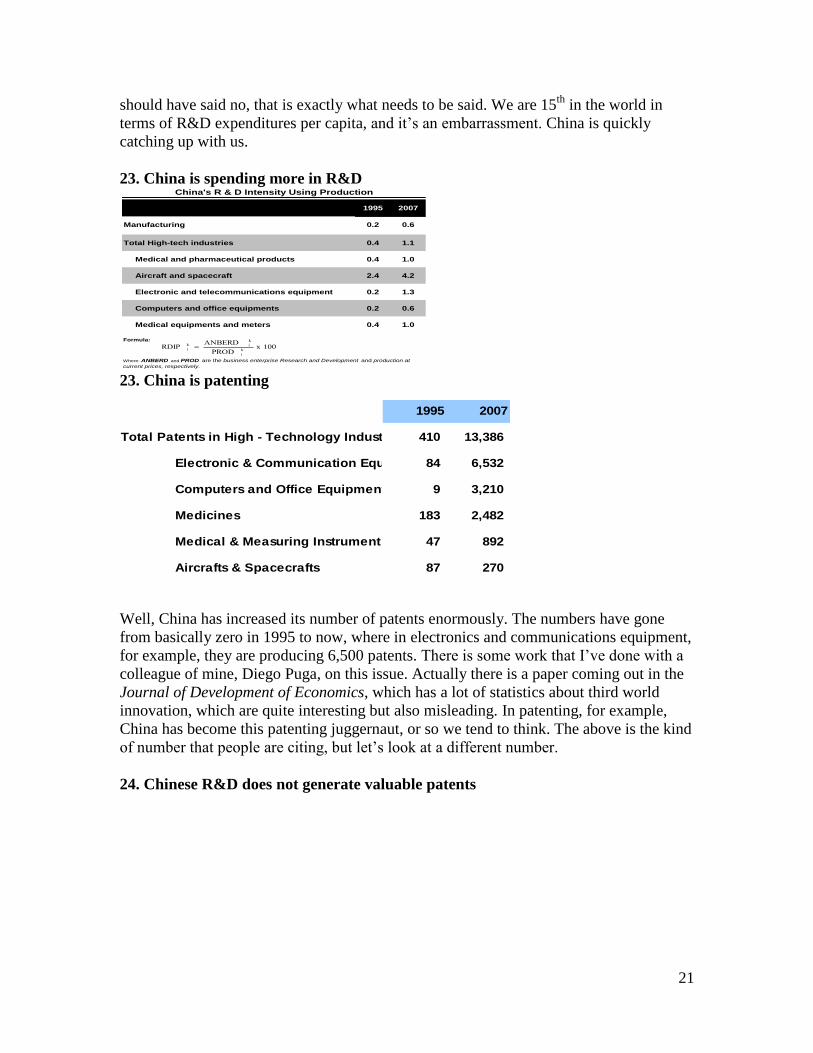
What we have here is a graph where each point is a country. On the horizontal axis is
how rich the country is―the log of GDP per capita, and then on the vertical we look at
each country’s export basket. We ask a question for each product that it produces, which
is, “Is it sophisticated or not?”, in the sense of whether it primarily is exported by rich
countries or by poor countries. And we take it [?] so that the average of sophistication of
each country’s export basket. And what you see is that there is a strong relationship
between, just a correlation, not a [unintelligible] … what is the GDP per capita and how
sophisticated the country’s export basket is: a very strong relationship.
And what you see is, above the regression line of sorts is India and China, which is to say
that what they export is far more sophisticated than what you would expect by just
looking at their GDP per capita. These countries are doing sophisticated stuff relative to
where they are on the development ladder. Interestingly, Canada is below the line. Given
how developed we are, we are well below where we should be. In fact, if you take a look,
you won’t be able to see it, but natural resource-based economies tend to be well below
the line. They are rich but they are not sophisticated. Sounds like, sounds to me like,
would I see [say?] this from Ontario?
14. China Is Exporting More and More High-Tech Products
13
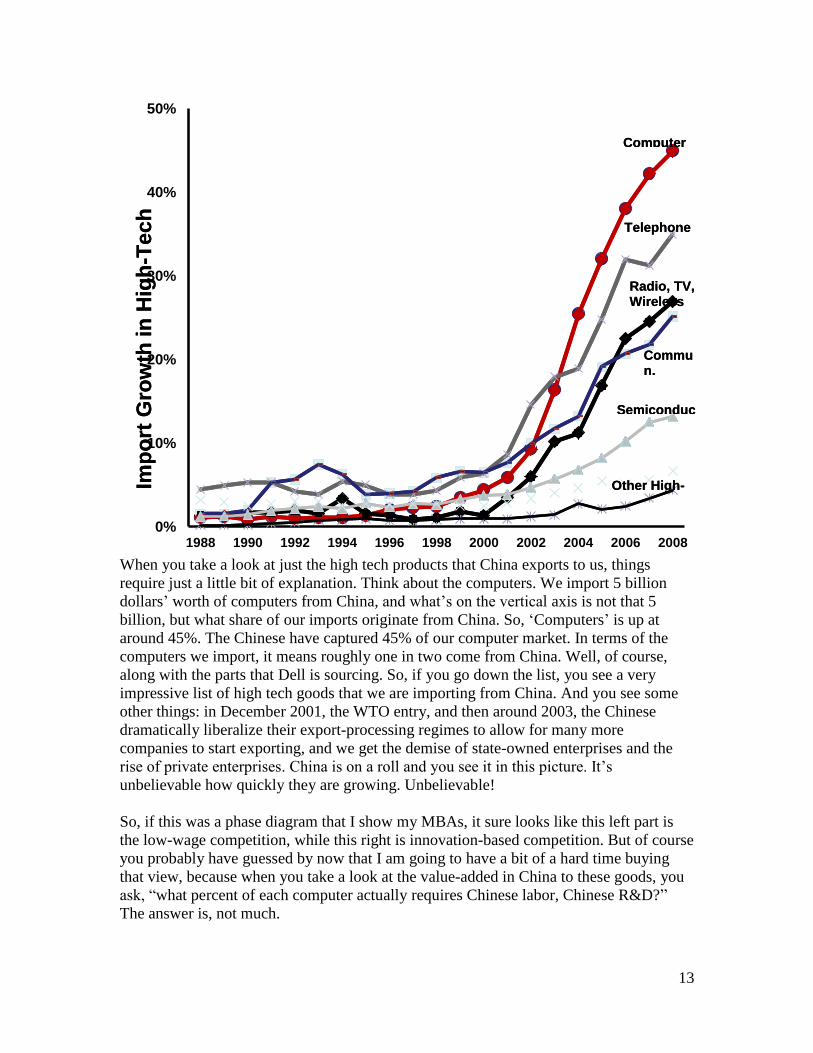
When you take a look at just the high tech products that China exports to us, things
require just a little bit of explanation. Think about the computers. We import 5 billion
dollars’ worth of computers from China, and what’s on the vertical axis is not that 5
billion, but what share of our imports originate from China. So, ‘Computers’ is up at
around 45%. The Chinese have captured 45% of our computer market. In terms of the
computers we import, it means roughly one in two come from China. Well, of course,
along with the parts that Dell is sourcing. So, if you go down the list, you see a very
impressive list of high tech goods that we are importing from China. And you see some
other things: in December 2001, the WTO entry, and then around 2003, the Chinese
dramatically liberalize their export-processing regimes to allow for many more
companies to start exporting, and we get the demise of state-owned enterprises and the
rise of private enterprises. China is on a roll and you see it in this picture. It’s
unbelievable how quickly they are growing. Unbelievable!
So, if this was a phase diagram that I show my MBAs, it sure looks like this left part is
the low-wage competition, while this right is innovation-based competition. But of course
you probably have guessed by now that I am going to have a bit of a hard time buying
that view, because when you take a look at the value-added in China to these goods, you
ask, “what percent of each computer actually requires Chinese labor, Chinese R&D?”
The answer is, not much.
0%
10%
20%
30%
40%
50%
1988 1990 1992 1994 1996 1998 2000 2002 2004 2006 2008
Other High-
ComputerIm
po
rt G
row
th in
Hig
h-T
ech
Radio, TV, Wireless
Semiconduc
Telephone
Commun.
Other High-
ComputerIm
po
rt G
row
th in
Hig
h-T
ech
Radio, TV, Wireless
Semiconduc
Telephone
Commun.
14
15. How Much Is Really Produced In China?
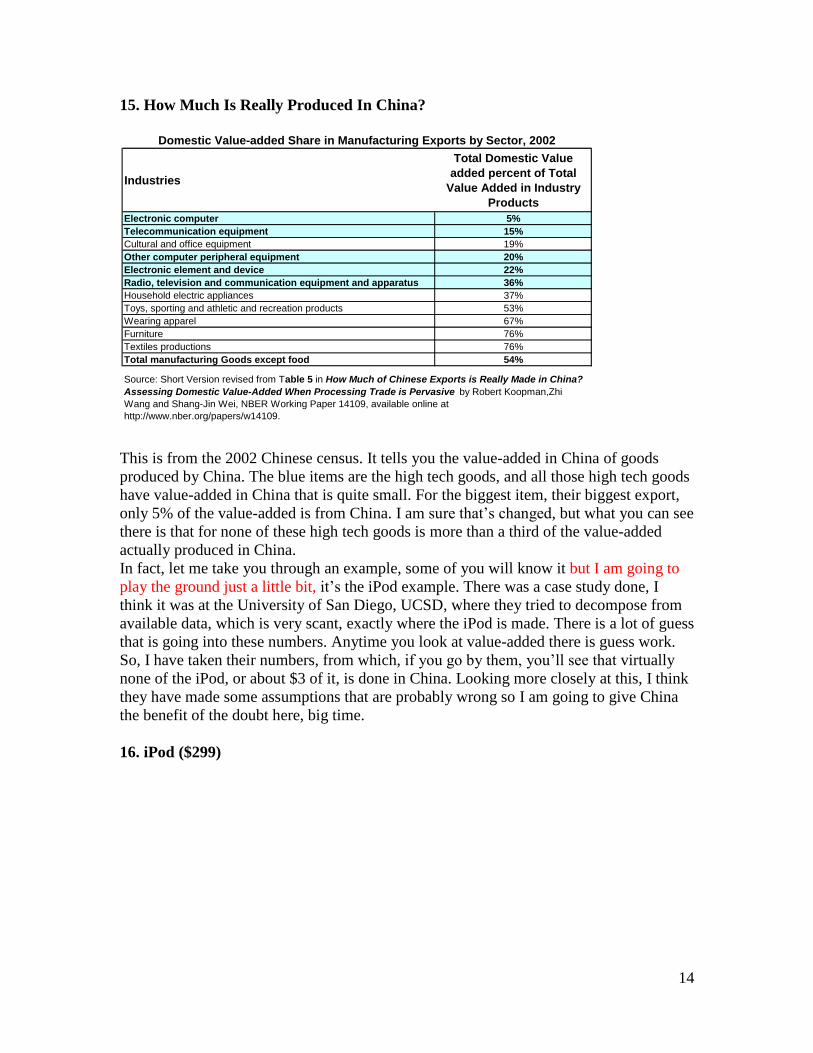
This is from the 2002 Chinese census. It tells you the value-added in China of goods
produced by China. The blue items are the high tech goods, and all those high tech goods
have value-added in China that is quite small. For the biggest item, their biggest export,
only 5% of the value-added is from China. I am sure that’s changed, but what you can see
there is that for none of these high tech goods is more than a third of the value-added
actually produced in China.
In fact, let me take you through an example, some of you will know it but I am going to
play the ground just a little bit, it’s the iPod example. There was a case study done, I
think it was at the University of San Diego, UCSD, where they tried to decompose from
available data, which is very scant, exactly where the iPod is made. There is a lot of guess
that is going into these numbers. Anytime you look at value-added there is guess work.
So, I have taken their numbers, from which, if you go by them, you’ll see that virtually
none of the iPod, or about $3 of it, is done in China. Looking more closely at this, I think
they have made some assumptions that are probably wrong so I am going to give China
the benefit of the doubt here, big time.
16. iPod ($299)
Industries
Total Domestic Value
added percent of Total
Value Added in Industry
Products
Electronic computer 5%
Telecommunication equipment 15%
Cultural and office equipment 19%
Other computer peripheral equipment 20%
Electronic element and device 22%
Radio, television and communication equipment and apparatus 36%
Household electric appliances 37%
Toys, sporting and athletic and recreation products 53%
Wearing apparel 67%
Furniture 76%
Textiles productions 76%
Total manufacturing Goods except food 54%
Source: Short Version revised from Table 5 in How Much of Chinese Exports is Really Made in China?
Assessing Domestic Value-Added When Processing Trade is Pervasive by Robert Koopman,Zhi
Wang and Shang-Jin Wei, NBER Working Paper 14109, available online at
http://www.nber.org/papers/w14109.
Domestic Value-added Share in Manufacturing Exports by Sector, 2002
15
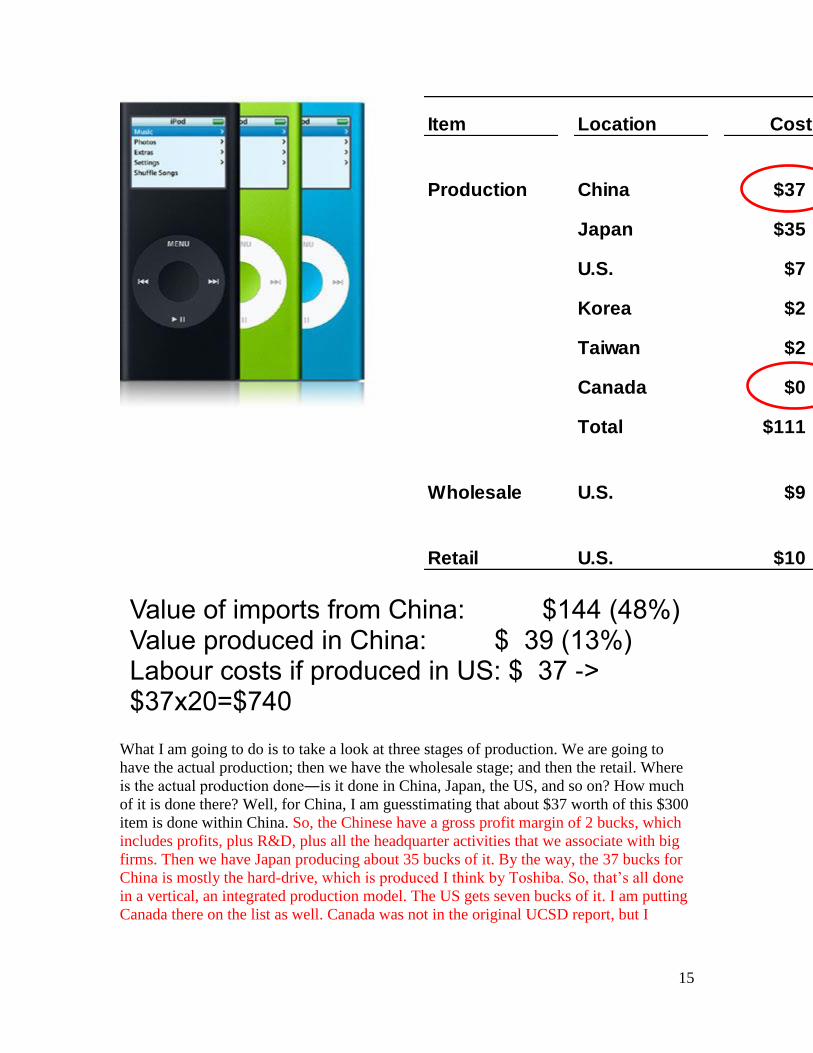
What I am going to do is to take a look at three stages of production. We are going to
have the actual production; then we have the wholesale stage; and then the retail. Where
is the actual production done―is it done in China, Japan, the US, and so on? How much
of it is done there? Well, for China, I am guesstimating that about $37 worth of this $300
item is done within China. So, the Chinese have a gross profit margin of 2 bucks, which
includes profits, plus R&D, plus all the headquarter activities that we associate with big
firms. Then we have Japan producing about 35 bucks of it. By the way, the 37 bucks for
China is mostly the hard-drive, which is produced I think by Toshiba. So, that’s all done
in a vertical, an integrated production model. The US gets seven bucks of it. I am putting
Canada there on the list as well. Canada was not in the original UCSD report, but I
Value of imports from China: $144 (48%) Value produced in China: $ 39 (13%)
Labour costs if produced in US: $ 37 -> $37x20=$740
Item Location Cost Gross Profit
Production China $37 $2
Japan $35 $24
U.S. $7 $7
Korea $2 $1
Taiwan $2 $0
Canada $0 $0
Total $111 $33
Wholesale U.S. $9 $71
Retail U.S. $10 $65
16
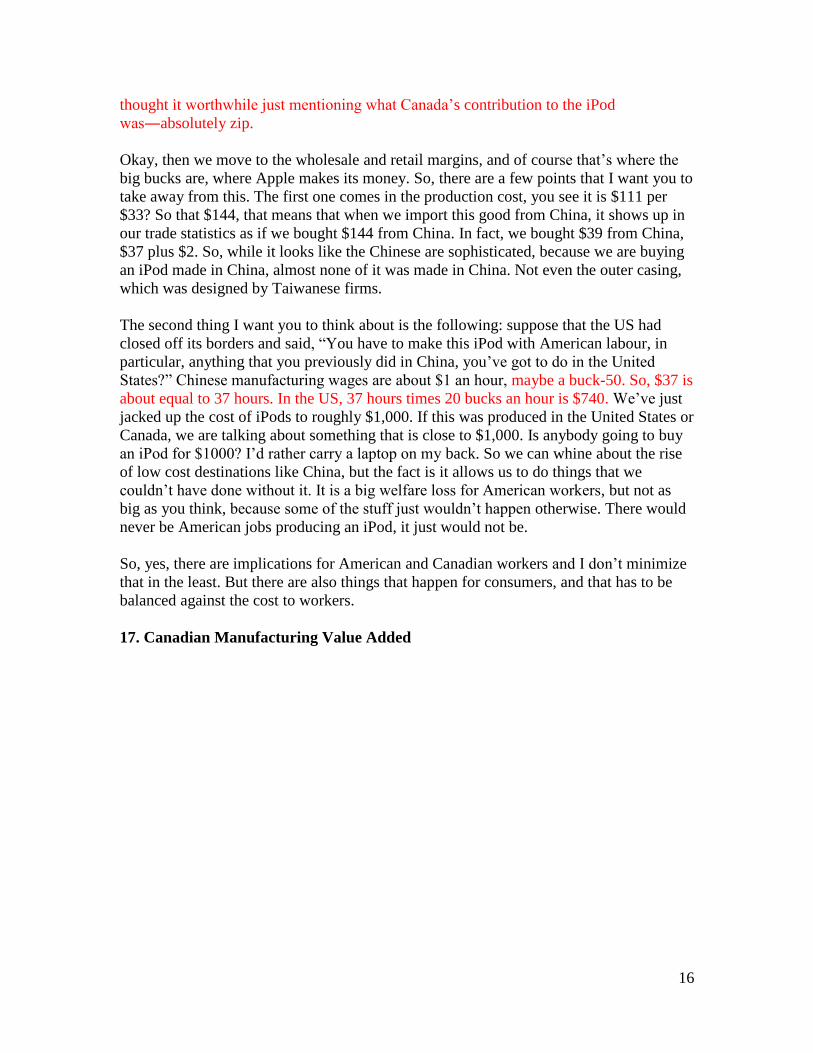
thought it worthwhile just mentioning what Canada’s contribution to the iPod
was―absolutely zip.
Okay, then we move to the wholesale and retail margins, and of course that’s where the
big bucks are, where Apple makes its money. So, there are a few points that I want you to
take away from this. The first one comes in the production cost, you see it is $111 per
$33? So that $144, that means that when we import this good from China, it shows up in
our trade statistics as if we bought $144 from China. In fact, we bought $39 from China,
$37 plus $2. So, while it looks like the Chinese are sophisticated, because we are buying
an iPod made in China, almost none of it was made in China. Not even the outer casing,
which was designed by Taiwanese firms.
The second thing I want you to think about is the following: suppose that the US had
closed off its borders and said, “You have to make this iPod with American labour, in
particular, anything that you previously did in China, you’ve got to do in the United
States?” Chinese manufacturing wages are about $1 an hour, maybe a buck-50. So, $37 is
about equal to 37 hours. In the US, 37 hours times 20 bucks an hour is $740. We’ve just
jacked up the cost of iPods to roughly $1,000. If this was produced in the United States or
Canada, we are talking about something that is close to $1,000. Is anybody going to buy
an iPod for $1000? I’d rather carry a laptop on my back. So we can whine about the rise
of low cost destinations like China, but the fact is it allows us to do things that we
couldn’t have done without it. It is a big welfare loss for American workers, but not as
big as you think, because some of the stuff just wouldn’t happen otherwise. There would
never be American jobs producing an iPod, it just would not be.
So, yes, there are implications for American and Canadian workers and I don’t minimize
that in the least. But there are also things that happen for consumers, and that has to be
balanced against the cost to workers.
17. Canadian Manufacturing Value Added
17
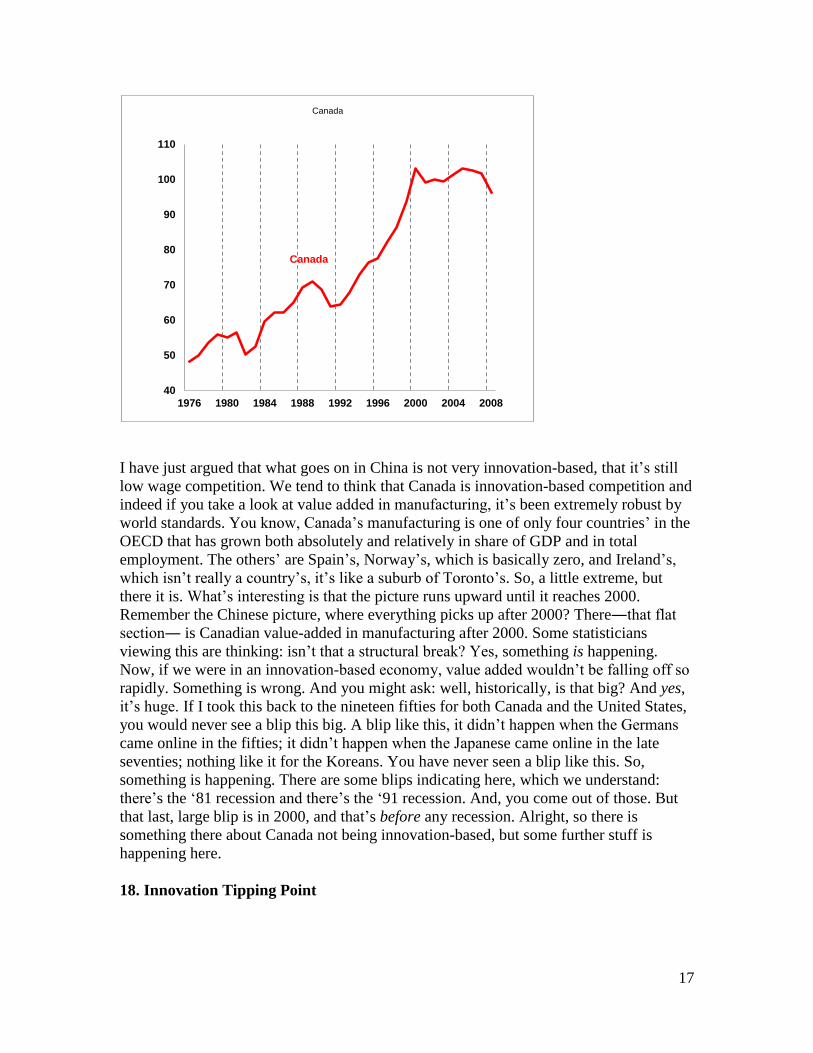
I have just argued that what goes on in China is not very innovation-based, that it’s still
low wage competition. We tend to think that Canada is innovation-based competition and
indeed if you take a look at value added in manufacturing, it’s been extremely robust by
world standards. You know, Canada’s manufacturing is one of only four countries’ in the
OECD that has grown both absolutely and relatively in share of GDP and in total
employment. The others’ are Spain’s, Norway’s, which is basically zero, and Ireland’s,
which isn’t really a country’s, it’s like a suburb of Toronto’s. So, a little extreme, but
there it is. What’s interesting is that the picture runs upward until it reaches 2000.
Remember the Chinese picture, where everything picks up after 2000? There―that flat
section― is Canadian value-added in manufacturing after 2000. Some statisticians
viewing this are thinking: isn’t that a structural break? Yes, something is happening.
Now, if we were in an innovation-based economy, value added wouldn’t be falling off so
rapidly. Something is wrong. And you might ask: well, historically, is that big? And yes,
it’s huge. If I took this back to the nineteen fifties for both Canada and the United States,
you would never see a blip this big. A blip like this, it didn’t happen when the Germans
came online in the fifties; it didn’t happen when the Japanese came online in the late
seventies; nothing like it for the Koreans. You have never seen a blip like this. So,
something is happening. There are some blips indicating here, which we understand:
there’s the ‘81 recession and there’s the ‘91 recession. And, you come out of those. But
that last, large blip is in 2000, and that’s before any recession. Alright, so there is
something there about Canada not being innovation-based, but some further stuff is
happening here.
18. Innovation Tipping Point
40
50
60
70
80
90
100
110
1976 1980 1984 1988 1992 1996 2000 2004 2008
Canada
Canada
18
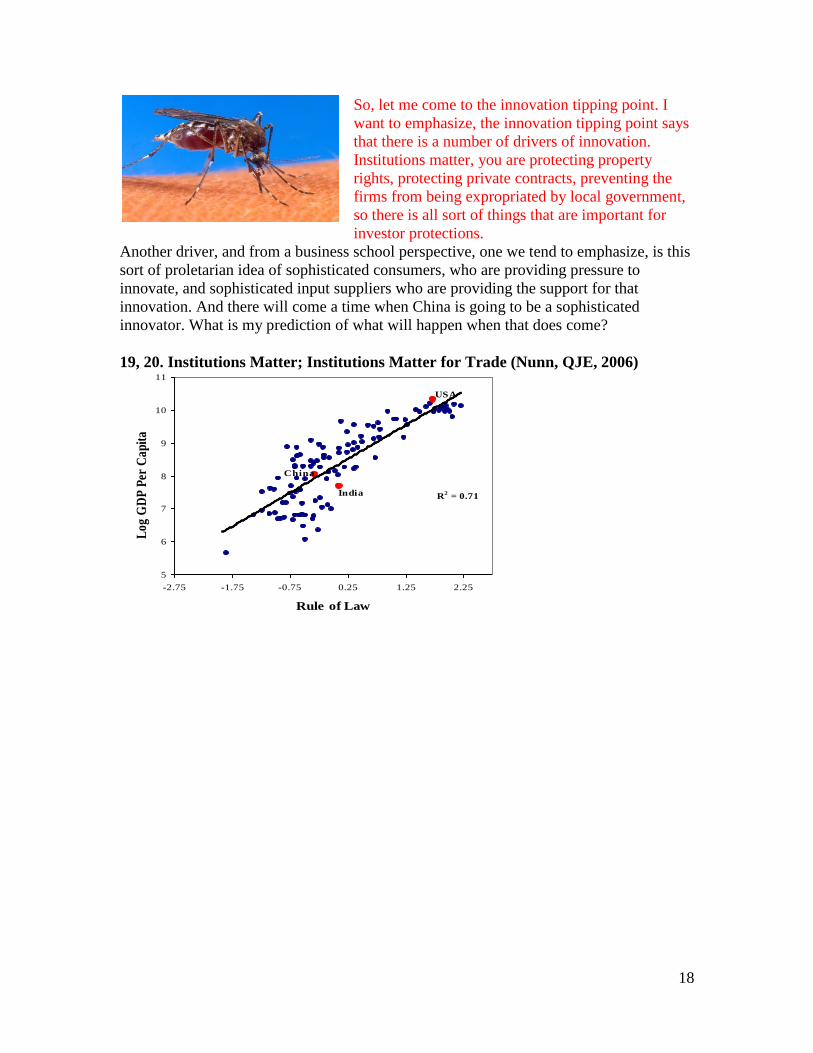
So, let me come to the innovation tipping point. I
want to emphasize, the innovation tipping point says
that there is a number of drivers of innovation.
Institutions matter, you are protecting property
rights, protecting private contracts, preventing the
firms from being expropriated by local government,
so there is all sort of things that are important for
investor protections.
Another driver, and from a business school perspective, one we tend to emphasize, is this
sort of proletarian idea of sophisticated consumers, who are providing pressure to
innovate, and sophisticated input suppliers who are providing the support for that
innovation. And there will come a time when China is going to be a sophisticated
innovator. What is my prediction of what will happen when that does come?
19, 20. Institutions Matter; Institutions Matter for Trade (Nunn, QJE, 2006)
R2 = 0.71
5
6
7
8
9
10
11
-2.75 -1.75 -0.75 0.25 1.25 2.25
Rule of Law
Lo
g G
DP
Per
Ca
pit
a
India
China
USA

19
First of all, how long is it going to take? Well, for it to happen, institutions in China and
India would have to improve dramatically, and I would love to talk about that at length,
but the bottom line is that no country has ever changed its core institutions rapidly. Hong
Kong did something remarkable in the sixties, but you can look across the almost two
hundred countries in existence on the planet, and none of them have transformed their
institutions in anything other than what could be called a glacial pace in history. So, for
China and India to change their institutions to promote innovation, we are talking about
decades― twenty years, thirty years. But the time will come when they join the
innovation club.
What will happen when that occurs? Well, the same thing will happen when they join as
happened when Japan, another low wage economy in the ‘fifties, joined; or when Korea,
a further low wage economy with a devalued currency, joined; or when Taiwan,
Singapore, and so on, joined. There were ripples, and then we adjusted. China would take
us a little bit longer to adjust to, because they have a policy of keeping the Yuan heavily
devalued. Korea did the same thing, but China is taking it to new lengths. So, there will
come a tipping point, but only when it comes. First, it’s going to be far off. And, it will
not do anything dramatic to the world economy. China will be another player in the
innovation game, just as other low wage economies have become other players.
What worries me more is that Canada is losing its position as an innovator, not because
of China or India, but because of government policies and business attitudes towards
innovation which are, frankly, second class. So, I want to show you a series of slides
Standardized Complex, Contract-Intensive
Qu
ality
of
a
Co
un
try’s
Type of Good Exported
= 0.40
t = 6.37

20
which tell us that what’s going on in China and India is not nearly as dramatic as you
think, by looking at R&D, looking at numbers of engineers, looking at patents.
21. China outperforms Canada in BERD in 2007
What’s going on is not nearly what you think either, but, what is going on in Canada is
probably more depressing than what’s going on in China. So, let’s start with R&D. I want
to focus on business R&D because that’s where Canada is really, really pathetic. So, the
black lines are 1997, the blue lines are 2007. In 2007, Japan is the world leader in
business R&D, and companies like Toyota are treading [?spending?] buckets. The United
States, Germany, the countries you would expect, are the big leaders in R&D. Whereas in
Canada, we are sitting: we are spending 1.1% of GDP on business R&D, compared to a
sort of world class standard of 2 %, almost twice that. And we remain stagnant out there,
not going anywhere. There is one country here that has changed dramatically, going from
nowhere to Canadian levels, and that is China. So, something is happening in China that
should be embarrassing to Canada. There is no reason why we should be at 1.1%.
22. Laughing Stock of the OECD
We can look now rather at all R&D, not just business R&D. Let’s consider government
R&D and university R&D, which is huge in Canada―thank goodness for the federal
government. You still see that Canada is what I call the laughing stock of the OECD. I
wrote a report for this for the Canadian government and I was told that I had to take that
terminology out, the minister wouldn’t like it. But, the minister needs to hear it, frankly; I
BERD as a percentage of GDP
1.1%
0.0
0.5
1.0
1.5
2.0
2.5
3.0
Japa
n
Unite
d Sta
tes
Ger
man
y
Franc
e
Belgium
Austra
lia
Unite
d Kin
gdom
EU27
China
Can
ada
Net
herla
nds
Italy
1997
%
2007
Israel
Sweden
Finland
Japan
Korea
Switzerland
Iceland
United States
Taiwan
Germany
Denmark
Austria
Singapore
France
Canada
China
Ireland
1.0% 2.0% 3.0% 4.0%
Israel
Sw eden
Finland
Japan
Korea
Sw itzerland
Iceland
United States
Taiw an
Germany
Denmark
Austria
Singapore
France
Canada
China
Ireland
21
should have said no, that is exactly what needs to be said. We are 15th
in the world in
terms of R&D expenditures per capita, and it’s an embarrassment. China is quickly
catching up with us.
23. China is spending more in R&D
23. China is patenting
Well, China has increased its number of patents enormously. The numbers have gone
from basically zero in 1995 to now, where in electronics and communications equipment,
for example, they are producing 6,500 patents. There is some work that I’ve done with a
colleague of mine, Diego Puga, on this issue. Actually there is a paper coming out in the
Journal of Development of Economics, which has a lot of statistics about third world
innovation, which are quite interesting but also misleading. In patenting, for example,
China has become this patenting juggernaut, or so we tend to think. The above is the kind
of number that people are citing, but let’s look at a different number.
24. Chinese R&D does not generate valuable patents
1995 2007
Manufacturing 0.2 0.6
Total High-tech industries 0.4 1.1
Medical and pharmaceutical products 0.4 1.0
Aircraft and spacecraft 2.4 4.2
Electronic and telecommunications equipment 0.2 1.3
Computers and office equipments 0.2 0.6
Medical equipments and meters 0.4 1.0
Formula:
China's R & D Intensity Using Production
Where: ANBERD and PROD are the business enterprise Research and Development and production at
current prices, respectively.
100 x k
i
k
ik
i PROD
ANBERD=RDIP
1995 2007
Total Patents in High - Technology Industries 410 13,386
Electronic & Communication Equipment84 6,532
Computers and Office Equipment 9 3,210
Medicines 183 2,482
Medical & Measuring Instrument 47 892
Aircrafts & Spacecrafts 87 270

22
We know that the vast majority of patents are junk, right? A very cursory way of
checking whether a patent is worth anything, and this is sort of a minimum criteria, is that
you had better have taken the patent out in Japan, the EU and US. Because, if you haven’t
taken it out in all three of those locations, it’s probably not worth anything. So, let’s just
look at the patents that have been taken out in all three locations. When you do that, each
point is then a country and the horizontal axis is how much R&D that country is doing
and inputting into patenting. Then, over here on the vertical axis is how many patents are
listed in all three patent offices. And, what you see is that China is way off the trend.
They are doing lots of R&D, they’re doing lots of patenting, but they are not doing lots of
patenting that warrants being listed on all three markets, in all three offices. And in fact,
I’ve read through every patent that China has taken out in the United States. It’s
extraordinary how many of them are literally better mouth traps, or can openers, a better
design for a light fixture―just complete nonsense.
So, don’t let the patent numbers scare you, and don’t let the engineering numbers scare
you either. Let me take you through these, because people really misunderstand the
engineering numbers.
25. Is This Turning Point Happening in China?
23
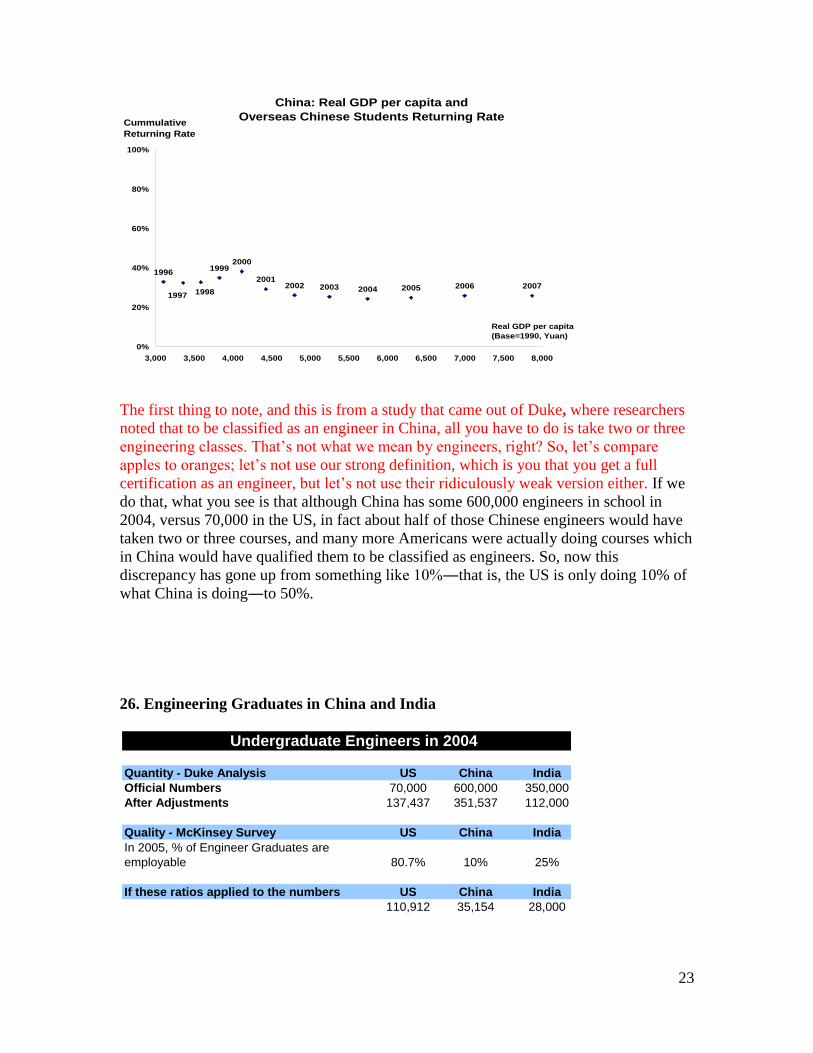
The first thing to note, and this is from a study that came out of Duke, where researchers
noted that to be classified as an engineer in China, all you have to do is take two or three
engineering classes. That’s not what we mean by engineers, right? So, let’s compare
apples to oranges; let’s not use our strong definition, which is you that you get a full
certification as an engineer, but let’s not use their ridiculously weak version either. If we
do that, what you see is that although China has some 600,000 engineers in school in
2004, versus 70,000 in the US, in fact about half of those Chinese engineers would have
taken two or three courses, and many more Americans were actually doing courses which
in China would have qualified them to be classified as engineers. So, now this
discrepancy has gone up from something like 10%―that is, the US is only doing 10% of
what China is doing―to 50%.
26. Engineering Graduates in China and India
China: Real GDP per capita and
Overseas Chinese Students Returning Rate
1996
1997 1998
19992000
20012002 2003 2004 2005 2006 2007
0%
20%
40%
60%
80%
100%
3,000 3,500 4,000 4,500 5,000 5,500 6,000 6,500 7,000 7,500 8,000
Cummulative
Returning Rate
Real GDP per capita
(Base=1990, Yuan)
Quantity - Duke Analysis US China India
Official Numbers 70,000 600,000 350,000
After Adjustments 137,437 351,537 112,000
Quality - McKinsey Survey US China India
In 2005, % of Engineer Graduates are
employable 80.7% 10% 25%
If these ratios applied to the numbers US China India
110,912 35,154 28,000
Undergraduate Engineers in 2004
24
Now, let’s remember a McKinsey report in 2005 which added up the quality of students
coming out of engineering programs, and McKinsey says that about 80% of engineers
that come out of US schools are qualified to be engineers. They had a series of
qualifications. This is very much business-oriented: they wanted to make sure that these
engineers can communicate. First, that they know their technical stuff, but then, that they
can communicate in various types of environments, including business environments.
China’s and India’s engineers are unfortunately not qualified to be in a series of business
environments. So what you end up with, is, actually, that the US has far more engineers
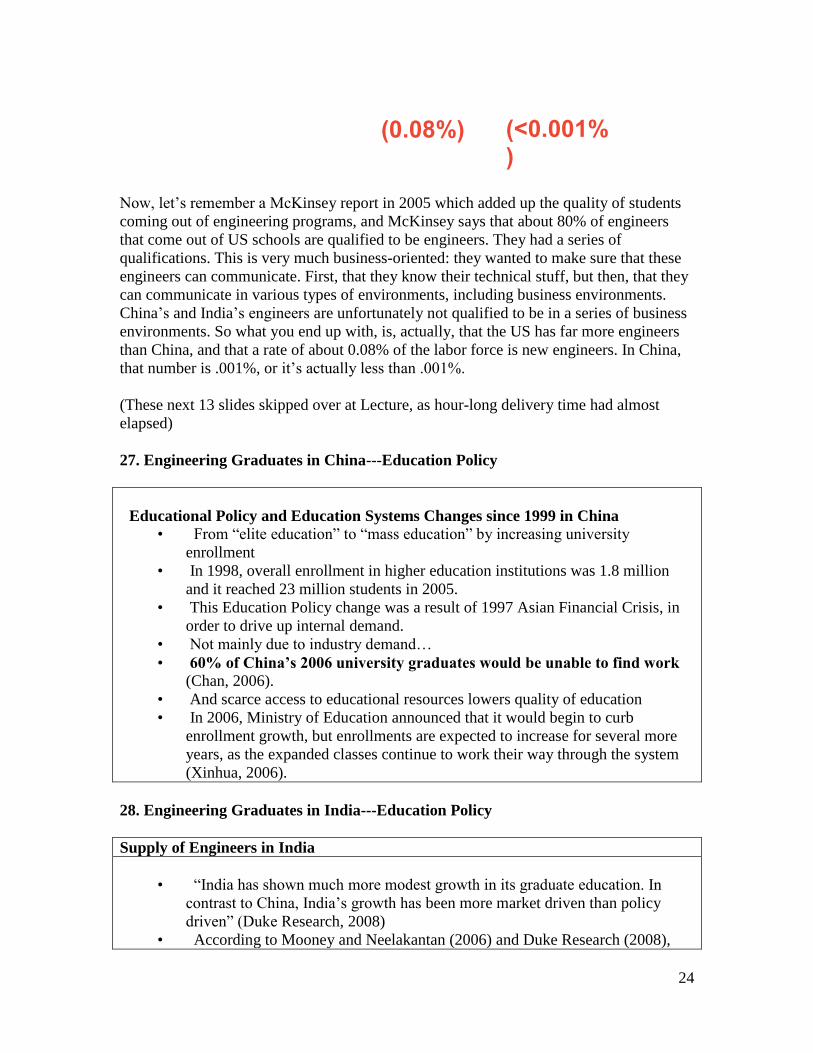
than China, and that a rate of about 0.08% of the labor force is new engineers. In China,
that number is .001%, or it’s actually less than .001%.
(These next 13 slides skipped over at Lecture, as hour-long delivery time had almost
elapsed)
27. Engineering Graduates in China---Education Policy
Educational Policy and Education Systems Changes since 1999 in China • From “elite education” to “mass education” by increasing university
enrollment
• In 1998, overall enrollment in higher education institutions was 1.8 million
and it reached 23 million students in 2005.
• This Education Policy change was a result of 1997 Asian Financial Crisis, in
order to drive up internal demand.
• Not mainly due to industry demand…
• 60% of China’s 2006 university graduates would be unable to find work (Chan, 2006).
• And scarce access to educational resources lowers quality of education
• In 2006, Ministry of Education announced that it would begin to curb
enrollment growth, but enrollments are expected to increase for several more
years, as the expanded classes continue to work their way through the system
(Xinhua, 2006).
28. Engineering Graduates in India---Education Policy
Supply of Engineers in India
• “India has shown much more modest growth in its graduate education. In
contrast to China, India’s growth has been more market driven than policy
driven” (Duke Research, 2008)
• According to Mooney and Neelakantan (2006) and Duke Research (2008),
(<0.001%)
(0.08%)
25
India has nearly one million unemployed engineers.
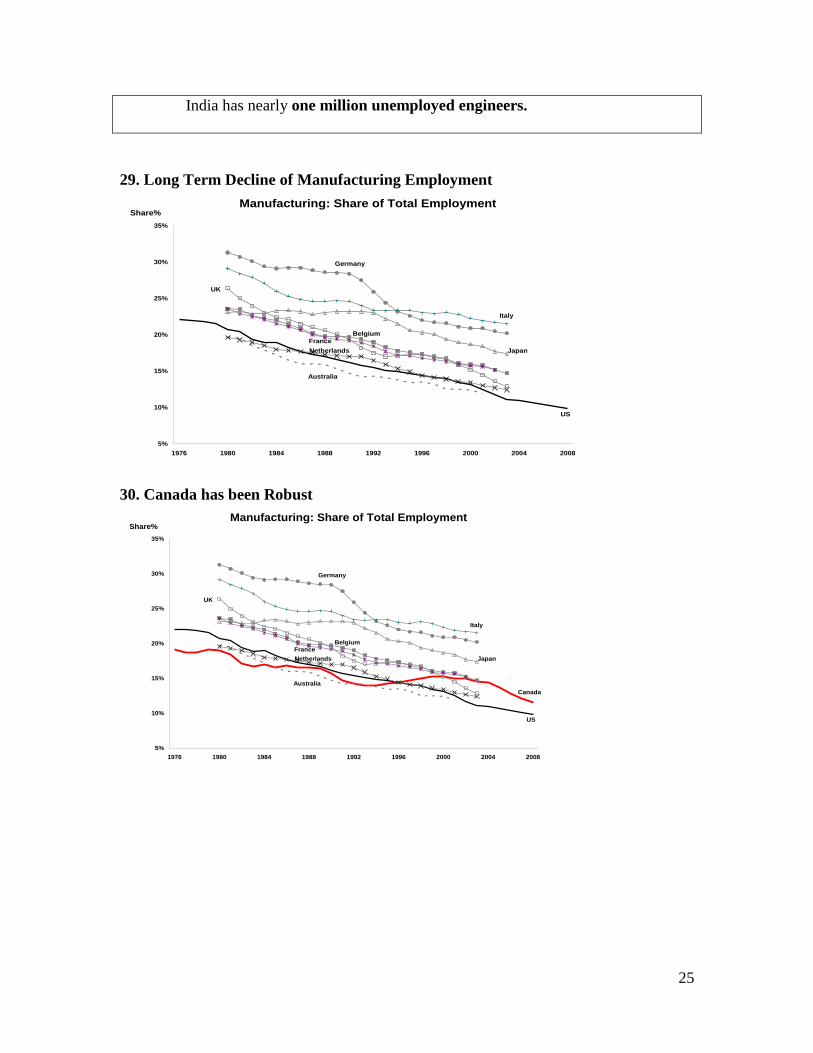
29. Long Term Decline of Manufacturing Employment
30. Canada has been Robust
Manufacturing: Share of Total Employment
5%
10%
15%
20%
25%
30%
35%
1976 1980 1984 1988 1992 1996 2000 2004 2008
US
Australia
Germany
Italy
Japan
UK
BelgiumFrance
Share%
Netherlands
Manufacturing: Share of Total Employment
5%
10%
15%
20%
25%
30%
35%
1976 1980 1984 1988 1992 1996 2000 2004 2008
Canada
US
Australia
Germany
Italy
Japan
UK
BelgiumFrance
Share%
Netherlands
26
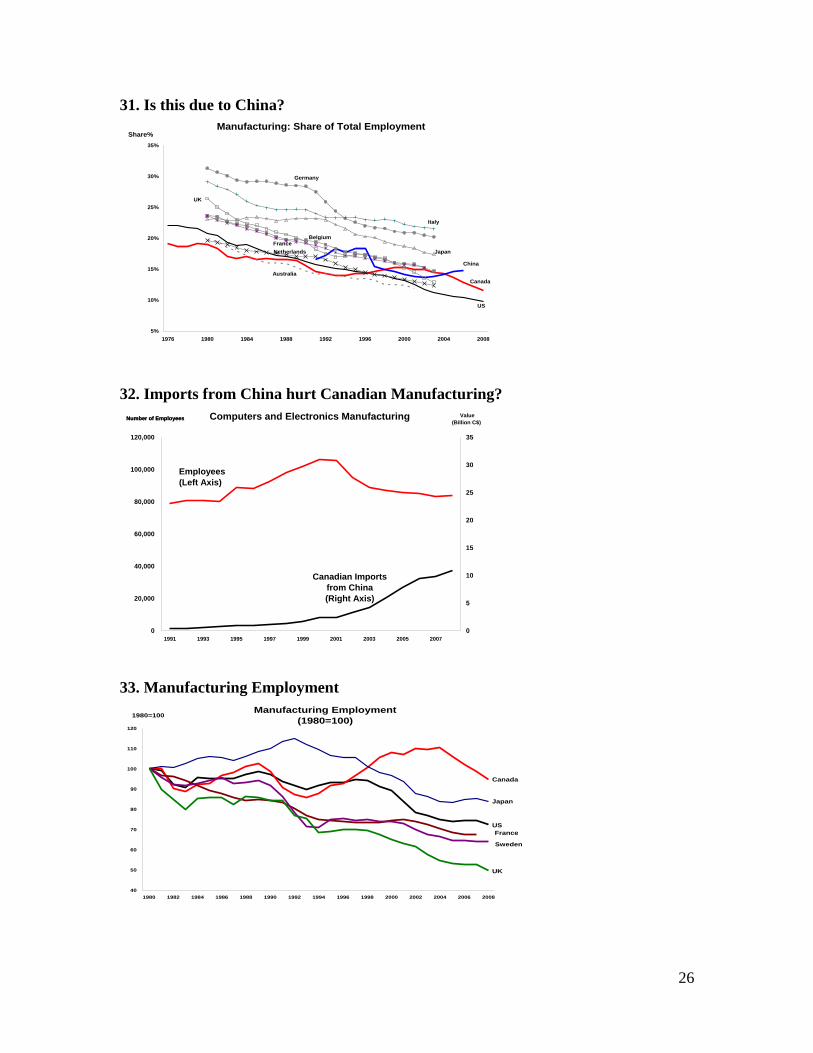
31. Is this due to China?
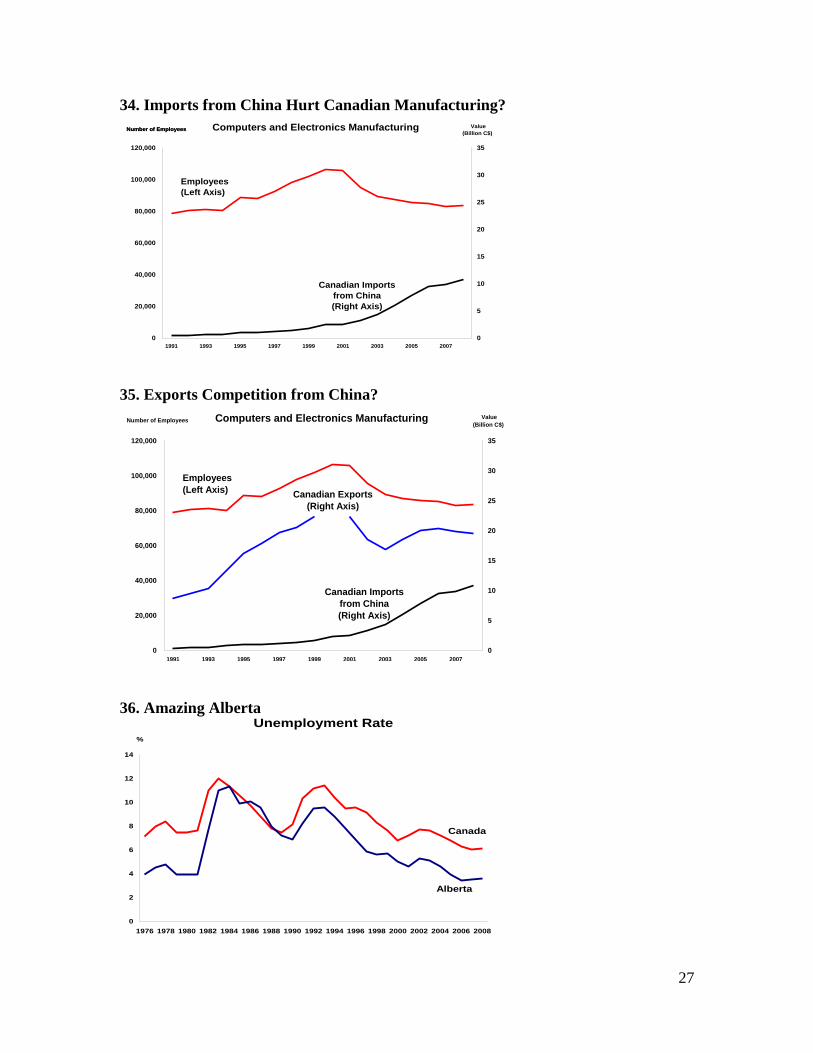
32. Imports from China hurt Canadian Manufacturing?
33. Manufacturing Employment
Manufacturing: Share of Total Employment
5%
10%
15%
20%
25%
30%
35%
1976 1980 1984 1988 1992 1996 2000 2004 2008
Canada
US
Australia
Germany
Italy
Japan
UK
BelgiumFrance
Share%
Netherlands
China
Computers and Electronics Manufacturing
0
20,000
40,000
60,000
80,000
100,000
120,000
1991 1993 1995 1997 1999 2001 2003 2005 2007
0
5
10
15
20
25
30
35
Number of Employees Value
(Billion C$)
Employees
(Left Axis)
Canadian Imports
from China
(Right Axis)
Number of Employees
Manufacturing Employment
(1980=100)
40
50
60
70
80
90
100
110
120
1980 1982 1984 1986 1988 1990 1992 1994 1996 1998 2000 2002 2004 2006 2008
1980=100
US
Canada
UK
Japan
Sweden
France
27
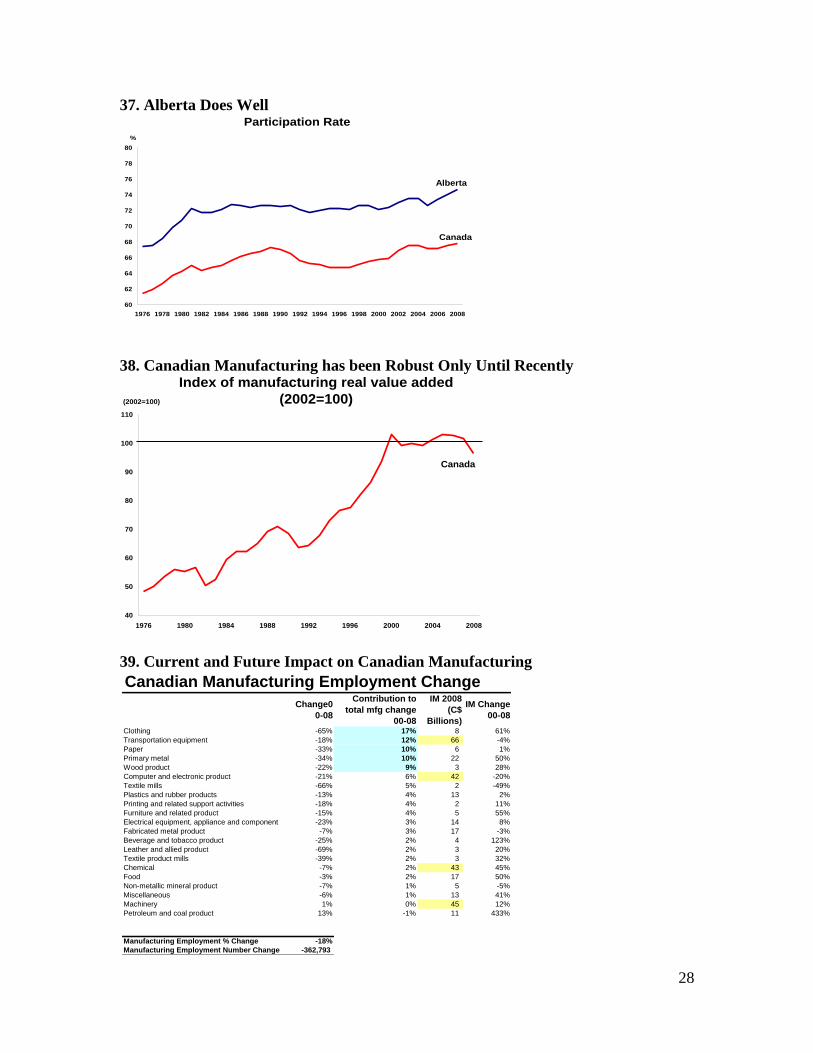
34. Imports from China Hurt Canadian Manufacturing?
35. Exports Competition from China?
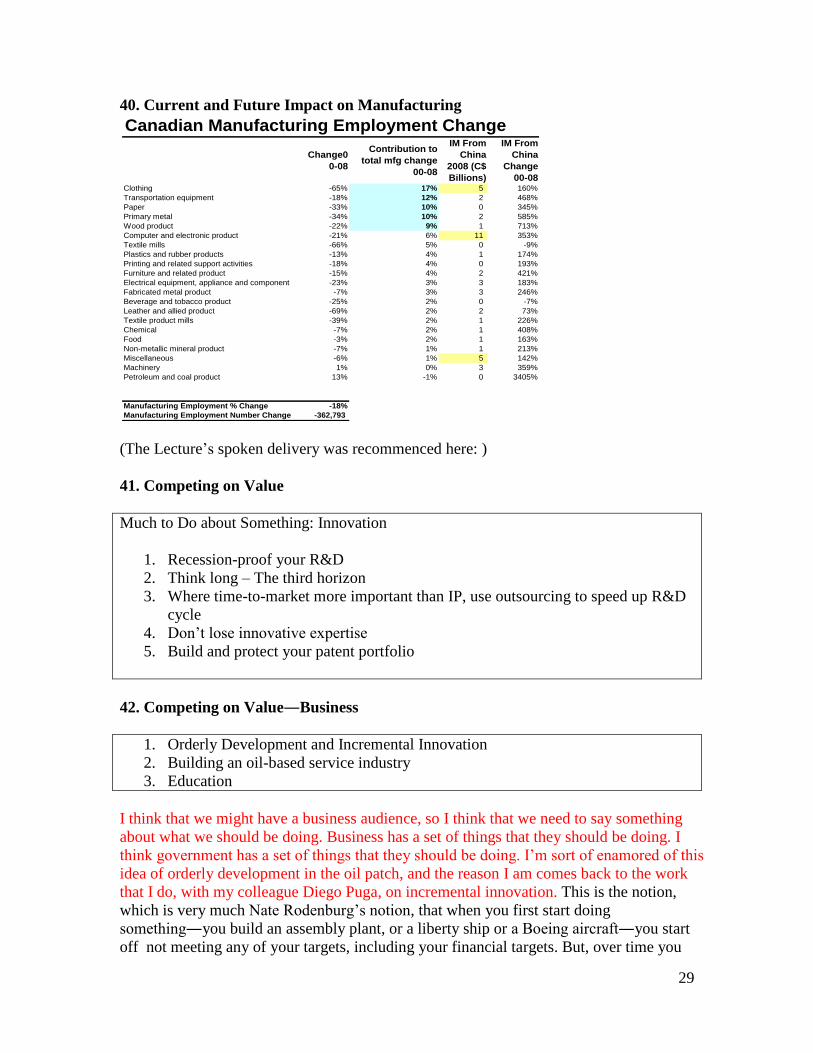
36. Amazing Alberta
Computers and Electronics Manufacturing
0
20,000
40,000
60,000
80,000
100,000
120,000
1991 1993 1995 1997 1999 2001 2003 2005 2007
0
5
10
15
20
25
30
35
Number of Employees Value
(Billion C$)
Employees
(Left Axis)
Canadian Imports
from China
(Right Axis)
Number of Employees
Computers and Electronics Manufacturing
0
20,000
40,000
60,000
80,000
100,000
120,000
1991 1993 1995 1997 1999 2001 2003 2005 2007
0
5
10
15
20
25
30
35
Canadian Exports
(Right Axis)
Number of Employees Value
(Billion C$)
Employees
(Left Axis)
Canadian Imports
from China
(Right Axis)
Unemployment Rate
0
2
4
6
8
10
12
14
1976 1978 1980 1982 1984 1986 1988 1990 1992 1994 1996 1998 2000 2002 2004 2006 2008
Canada
Alberta
%
28
37. Alberta Does Well
38. Canadian Manufacturing has been Robust Only Until Recently
39. Current and Future Impact on Canadian Manufacturing
Participation Rate
60
62
64
66
68
70
72
74
76
78
80
1976 1978 1980 1982 1984 1986 1988 1990 1992 1994 1996 1998 2000 2002 2004 2006 2008
Canada
Alberta
%
40
50
60
70
80
90
100
110
1976 1980 1984 1988 1992 1996 2000 2004 2008
Index of manufacturing real value added
(2002=100)
Canada
(2002=100)
Change0
0-08
Contribution to
total mfg change
00-08
IM 2008
(C$
Billions)
IM Change
00-08
Clothing -65% 17% 8 61%
Transportation equipment -18% 12% 66 -4%
Paper -33% 10% 6 1%
Primary metal -34% 10% 22 50%
Wood product -22% 9% 3 28%
Computer and electronic product -21% 6% 42 -20%
Textile mills -66% 5% 2 -49%
Plastics and rubber products -13% 4% 13 2%
Printing and related support activities -18% 4% 2 11%
Furniture and related product -15% 4% 5 55%
Electrical equipment, appliance and component -23% 3% 14 8%
Fabricated metal product -7% 3% 17 -3%
Beverage and tobacco product -25% 2% 4 123%
Leather and allied product -69% 2% 3 20%
Textile product mills -39% 2% 3 32%
Chemical -7% 2% 43 45%
Food -3% 2% 17 50%
Non-metallic mineral product -7% 1% 5 -5%
Miscellaneous -6% 1% 13 41%
Machinery 1% 0% 45 12%
Petroleum and coal product 13% -1% 11 433%
Manufacturing Employment % Change -18%
Manufacturing Employment Number Change -362,793
Canadian Manufacturing Employment Change
29
40. Current and Future Impact on Manufacturing
(The Lecture’s spoken delivery was recommenced here: )
41. Competing on Value
Much to Do about Something: Innovation
1. Recession-proof your R&D
2. Think long – The third horizon
3. Where time-to-market more important than IP, use outsourcing to speed up R&D
cycle
4. Don’t lose innovative expertise
5. Build and protect your patent portfolio
42. Competing on Value―Business
1. Orderly Development and Incremental Innovation
2. Building an oil-based service industry
3. Education
I think that we might have a business audience, so I think that we need to say something
about what we should be doing. Business has a set of things that they should be doing. I
think government has a set of things that they should be doing. I’m sort of enamored of this
idea of orderly development in the oil patch, and the reason I am comes back to the work
that I do, with my colleague Diego Puga, on incremental innovation. This is the notion,
which is very much Nate Rodenburg’s notion, that when you first start doing
something―you build an assembly plant, or a liberty ship or a Boeing aircraft―you start
off not meeting any of your targets, including your financial targets. But, over time you
Change0
0-08
Contribution to
total mfg change
00-08
IM From
China
2008 (C$
Billions)
IM From
China
Change
00-08Clothing -65% 17% 5 160%
Transportation equipment -18% 12% 2 468%
Paper -33% 10% 0 345%
Primary metal -34% 10% 2 585%
Wood product -22% 9% 1 713%
Computer and electronic product -21% 6% 11 353%
Textile mills -66% 5% 0 -9%
Plastics and rubber products -13% 4% 1 174%
Printing and related support activities -18% 4% 0 193%
Furniture and related product -15% 4% 2 421%
Electrical equipment, appliance and component -23% 3% 3 183%
Fabricated metal product -7% 3% 3 246%
Beverage and tobacco product -25% 2% 0 -7%
Leather and allied product -69% 2% 2 73%
Textile product mills -39% 2% 1 226%
Chemical -7% 2% 1 408%
Food -3% 2% 1 163%
Non-metallic mineral product -7% 1% 1 213%
Miscellaneous -6% 1% 5 142%
Machinery 1% 0% 3 359%
Petroleum and coal product 13% -1% 0 3405%
Manufacturing Employment % Change -18%
Manufacturing Employment Number Change -362,793
Canadian Manufacturing Employment Change
30
look at all the bugs, and if you’re really good, you design your assembly so that you can
work out the bugs on the fly. Boeing knew, when it produced the 747, that it was going to
stretch its plane; it knew that it was going to double its capacity even before it put out its
first one. So you “design-in” the notion that you’ll improve over time. But where the
trouble comes in with orderly development is when you start building, say, four upgraders
at once. I don’t if that is the number for upgraders, I’m winging it here, but when you start
doing everything at once, you’re not gaining the benefits of seeing what had been the
previous state of the art. Everybody’s replicating, and you’re losing an enormous
opportunity for incremental innovation. Incremental innovation is the heart and soul of
innovation, vastly more important by all estimates than lab-coated technicians coming up
with brilliant ideas. It’s the day-to-day shop floor activities that matter for producing
productivity gains. “Disorderly development” is perhaps too emotive of a term, but the
current rapid pace of development precludes, locks you in ways that prevent you, from
benefitting from that incremental innovation. And that is a way for government― to try to
force firms to internalize what is essentially an externality.
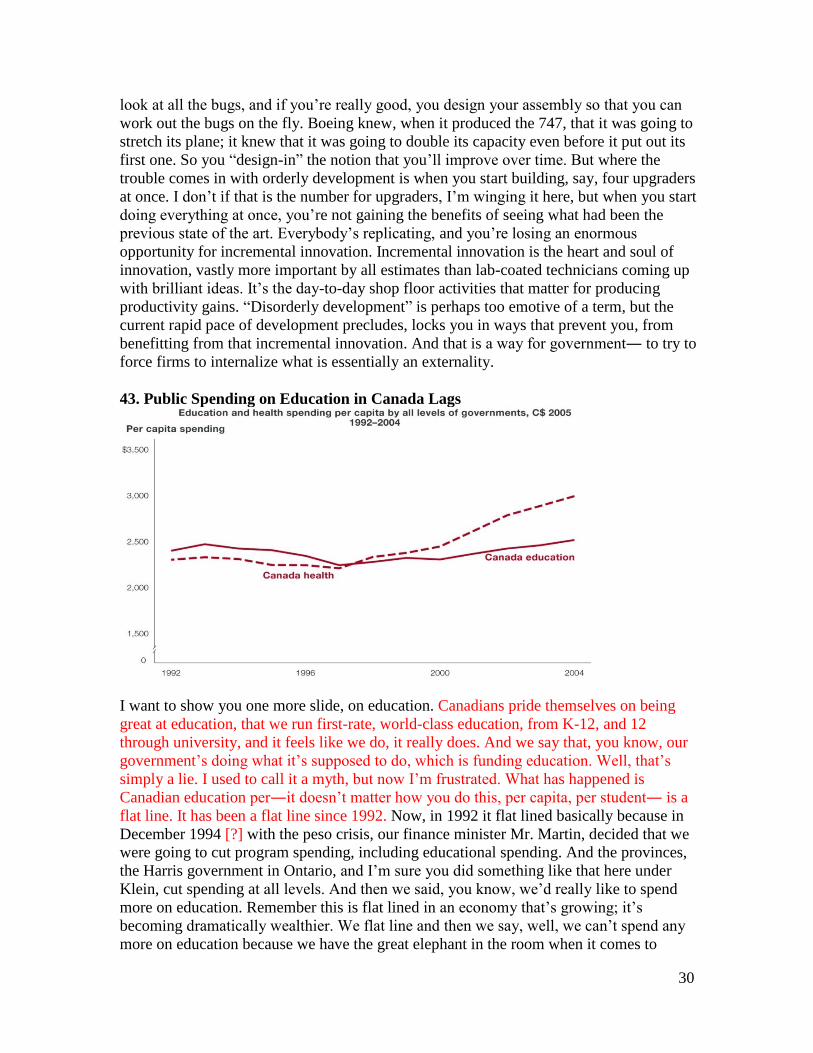
43. Public Spending on Education in Canada Lags
I want to show you one more slide, on education. Canadians pride themselves on being
great at education, that we run first-rate, world-class education, from K-12, and 12
through university, and it feels like we do, it really does. And we say that, you know, our
government’s doing what it’s supposed to do, which is funding education. Well, that’s
simply a lie. I used to call it a myth, but now I’m frustrated. What has happened is
Canadian education per―it doesn’t matter how you do this, per capita, per student― is a
flat line. It has been a flat line since 1992. Now, in 1992 it flat lined basically because in
December 1994 [?] with the peso crisis, our finance minister Mr. Martin, decided that we
were going to cut program spending, including educational spending. And the provinces,
the Harris government in Ontario, and I’m sure you did something like that here under
Klein, cut spending at all levels. And then we said, you know, we’d really like to spend
more on education. Remember this is flat lined in an economy that’s growing; it’s
becoming dramatically wealthier. We flat line and then we say, well, we can’t spend any
more on education because we have the great elephant in the room when it comes to

31
budgeting, and that is healthcare. Healthcare’s eating up all our resources. That’s what
we’re told over and over again, but it’s a lie. It’s a choice. It is governments that have
said we don’t care about our kids, we don’t care about future productivity, elect us
because we’re going to help spend on your healthcare, and nothing else. That’s what
you’re voting for, your politicians. I’ve never heard them say that quite clearly, but that’s
what they’re asking us to vote them into office for.
44. Public Spending on Education in Canada Lags
What about the Americans, the big bad, ugly Americans, right? Obama has to come in
and say, “Get your act together, we need to spend more on education. Get the healthcare
system in order, because we need to spend more on healthcare.” The big, bad Americans,
and they’re not dissing. Obama’s are actually accurate statements. Even with those
statements, what have the Americans done? They’ve ramped up education spending
faster than Canada, and they’ve ramped up public expenditures on healthcare. So, as bad
as the Americans think of themselves on these two items, they’re better than Canadians.
We should be frustrated, we should be angry. This is just completely unacceptable. It’s
only going to get worse, because if Obama can get his educational reform together, the
Americans are going to do a heck of a lot better. Somebody has to say it’s actually quite
sound, based on current research on education policy.
45. Competing on Value―Governments
1. Orderly Development and Incremental Innovation
2. Building an oil-based service industry
3. Develop an EU relationship
4. Education
5. Invest in building tomorrow’s productivity, reduce current consumption
32
The main message then, for what governments can do—it’s not what firms can do, but
what governments can do―is keep on task, and “on task” means to keep investing in
productivity, keep finding other tax incentives, or ways of encouraging people to get
higher levels of educational attainment, and so on. Invest in future productivity, stop
thinking about consuming current prosperity. That’s what governments can do.
And so, just to conclude, I said that there are three things that prevent people from
understanding what I believe is the right perspective on China and India. The first thing is
the dragon myth. It sure looks like they’re producing everything and we’re producing
nothing. But that’s because we see the world as consumers, and that’s not the right way to
see the world. That’s one leg on the elephant, you’ve got to see the whole elephant.
The second thing is, you’ve got to see where we really are in the spectrum between low-
cost and innovation-based competition. I don’t think the Chinese are nearly so far along
as they advertise, and I think that Canadians—I don’t want to say that we’re regressing,
but we’re stagnating in a world in which everybody else is doing more. The second thing
you have to understand is that that’s the thing we should be worried about. We can
control that, and we’ve chosen to let it get out of control.
The third thing that we have to remember is the innovation tipping point. It will come,
but it’s going to come at a glacial pace. We’re talking about decades...twenty, thirty
years, and when it does come, it’s actually not as threatening as it seems. There’ll be
another member in the world innovation class. Innovation is good for the world, and
we’re going to benefit from it. The only question is whether we’re going to be part of the
innovation club in twenty or thirty years, because of the things that we’re choosing to do,
and not because of things that the Chinese are doing.
33
Questions from the Foote Lecture audience:
Question: [not clear]
DT: They spend 17%, we spend 11% of GDP.
Question:
Yes, you didn’t really have time to compare or talk much about India. What about, say,
two things that we should be thinking about concerning India?
DT: I think my starting point would be: what is it that’s new here? The newness that
people are worried about, I think, is that for the first time ever, skilled workers in North
America are being exposed to low-wage competition. It’s never happened before. So
suddenly, an educated person in Hyderabad can compete with an educated person here.
So that’s the context in which this is something really new to my mind. It’s also cool
technologically that we can do these things, but that doesn’t really make it fundamentally
new. So the research I’ve done with Runjuan Liu tells me that that turns out not to be a
big issue, despite the hype by people like Alan Blinder that, you know, it’s going to be a
steamroller. So, that’s the first point I’d make. The second point I’d make is the same
point I’ve made about China: there’s a debate about how sophisticated what India does in
its sphere of activity. Is it really, you know, high-end management consulting, high-end
custom designed computer software, etc? Or, is it really pre-packaged software and you
know, payrolls of a dollar per client. And there’s quite a few people who have made an
articulate argument about the value-added data that came out of India, that in fact it’s
much closer to, you know, routinized payroll software than anything like, say Microsoft
or Broadcom produces. And, the third thing to bear in mind is that, suppose India really
did take off? And in many ways I think that India is more likely to take off than China.
The reason for that is—I didn’t talk about it—but it is institutions. You know, you ask
what do you do need, for good institutions, and you need something that looks like
Western intellectual property protections, rule of law, and so on. You know, remove the
appropriation risk problem by sovereign [unintelligible]. I mean, why is Shanghai so
important to China? What’s Shanghai’s history, that puts it in so central a position? Well,
the answer is: not only was it one of about twenty-three customs-free zones that the
British conquered in the 19th
century, but it’s the one that the British came to do business
at, more than any other place. Once the British came to do business, and to start
developing a legal system to deal with internal contract law between, you know, the
many expats in there, who started to arrive? The Chinese. And the Chinese start to do
business in Shanghai precisely because it allowed them to escape a legal system which
was dysfunctional, and a political system which was increasingly dysfunctional,
fragmenting, the center of gravity from Beijing had all but disappeared. You come to
Shanghai to do business, you buy a piece of property, you know it’s not going to be
expropriated by a local landlord, and you have a contract it’s going to be adjudicated in a
British court. That’s the history of Shanghai.
Fortunately for India, things that really matter—banking, and a legal system—are
actually surprisingly good by the standards of the country at that level of development.
And the Indians are working hard at making transparency in financial markets clearer,
improving the banking system, making it more stable in terms of reserve requirements.
34
You know, compare that to what’s going on in China with state-owned banks and central
interference in the balance sheets of these banks---just a nightmare, a huge overhang of
debts that will never be repaid from the state-owned enterprises. The Chinese banking
system has serious problems but added to that the Indian banking system is looking much
better, and their legal system is going through a series of reforms to try and get it out of
the volume exit bottleneck[?] it’s currently in. But the foundations are there and the
questions is to get rid of the bottleneck. So, I’m very optimistic about India.
Question: unclear
DT: So let me preface it by saying I know very little about the oil patch. I’m a Toronto-
boy, so bear that in mind. But there’s a certain obvious place to look, and that is Houston,
which ran out of oil fifty years ago. So the question is: what can you leverage
permanently out of the oil patch? Where is the big value-added that you can try and get?
Is it transportation? Is it pipelines? Trying to, you know, corner the pipeline nexus in
North America? That sounds sort of dumb, but, you know, there are people in Canada
who are trying to build a for hire port on the West coast, right? Where, you can say if my
goods come through your port, then my competitor’s goods do not. I mean, you can think
strategically about infrastructure. Then services. What service expertise are we gaining
from it? Maybe it’s financial expertise. You know, when a banker’s looking at a proposal
that comes out of the oil patch, that banker in Calgary—I’m assuming Edmonton, too—
knows a lot about the industry, knows the appropriate benchmarks, knows how things
work. That’s expertise that doesn’t just, it can be used not just here. It can be used in, you
know, in a calmer Congo, or in Ecuador, or wherever. How can we leverage this
knowledge, these abilities, take it abroad and do well. That’s what I have in mind.
Question: unclear
DT: Unfortunately, if I...the easiest thing to do is to go to government and ask about tax
rates. And do I have to say, the last five years, both, you know, sides of the aisle have
done quite well in trying to get down marginal effective tax rates. You know, you’re
harmonizing the capital gains, the machinery-equipment tax, the capital surcharge, so
you’re doing pretty good on that front. Really at some point, business has to step up to
the plate, because at the end of the day, it’s business R&D where Canada is weakest. So,
we have, you know, to think up ways. I’m never going to be up here picking winners, so
how do you avoid picking winners? You avoid picking winners by funding industry
associations, never by funding individual companies. Right, figuring out, you know,
identifying...In Toronto, the board of trade, it’s practically a corpse. Where is its civic
initiative? Where’s its sense of pride in trying to promote business, entrepreneurial spirit
in Toronto? I don’t see it. So I think that if I were connected in the business community,
or if I could find—and I know we could find people who are connected in the business
community who share this view—that’s where I would push. And perhaps I would push
it hardest in Quebec, which is really a drag on the Canadian economy, and Quebecers
know it.
Question: unclear
35
DT: Yeah, we know all the R&D level, numbers, probably to 2007. China’s now the, in
absolute terms, it’s the second largest spender on R&D in the world behind the US. So
they’re continuing to ramp up, ramp up. And maybe the day will come, for instance
when actually there’s a biotech patent out of Beijing that’s worth anything. I don’t know.
Uh, but you know, they’re doing great guns in all sorts of areas. But you know you keep
seeing the same points. Microchip fear, you know, they’re going to take over all of the
microchips the way the Japanese did RAMS back in the ‘90s. And yet, that’s not where
the action is. That’s all commodity chips. All the boutique stuff, that’s still all happening
in the US.
Question: unclear.
DT: That’s exactly what I’m saying. Why would it happen? Because, no matter where
you invent the good, you’re still going to...we’ve already seen, manufacturing is just a
small piece of the whole picture. The money, the value-added is when you need market
positions from the idea, right? So, whether you’re inventing in the US, you’re inventing
in China, you’re still going to be producing in China. There is no cost advantage on the
manufacturing side...these are all contract manufacturers, right? Does Voxcon care who
invented it? They’re still going to be producing it. So, by the time China gets to the point
where it’s a real innovation juggernaut, you think that these innovators are going to be
earning $3 an hour? I don’t think so. I mean, Runjuan, you just told me the other day that
salaries for business professors in one university is $150,000, and that’s before PPP
conversion, right? You know, I just don’t see how they’re going to be beating us on costs
that we can’t take advantage of. We can take advantage of the same costs they do.
Question: unclear
DT: Okay, there’s a lot of questions there. And you’re asking a question which is near
and dear to my heart, so I’ll probably end up with an hour-long conversation on that. Let
me make some very brief comments about that. First of all, if you break down...uh, sort
out medium public universities in the US—so, let’s forget about M.I.Ts and Stanfords,
and so on, because you’ve just got no apples compared them with here—you’ll see that
their revenue sources in every single category that you can imagine, are vastly higher
than ours, including government contributions that are not defense-related.
They out-fund their universities, their middle public universities at every possible level,
okay? So, it is not a defense story. The defense story is for Stanfords and M.I.Ts, not
exclusively but... The next one is where should the money go? To me the money should
not just go, if we’re talking about education, universities. If we’re talking about R&D, to
universities is great, but Canada already spends a lot on R&D in universities, so I think
we’re doing great on that front. If we’ve got to spend on education at all levels, where
would I start? I’d start at age three. In fact, I’d put in...I have a paper that’s coming out in
Pediatrics and Healthcare, which is Canada’s big pediatrics journal, on why we should
be investing in children.Which you all know, and you’ve all heard, and I subscribe to
thoroughly. I think the government should be spending another $15 billion a year funding
K-6. And I think that answers all of the questions that you asked me.
Question: unclear
36
DT: I’m much less concerned that you are about dumping US bonds. The US dollar is
here for another long, long time, in my view, but let’s not argue about that. The thing
to...that I think is the most important is actually long-term. Long-term, China is going to
be intransigent on devaluing against the US dollar, which means that the burden—the
massive burden of adjustment, since the US must export more—falls on the rest of the
world, and particularly it falls on Japan, EU, and Canada. So in this...yet again Canada’s
going to find itself in the midst...it’s going to be the collateral damage in a US battle on
international trade issues. We got hammered with the EU-US battles with their
agriculture, we’ll get hammered with the US-China battles, over structural adjustment.
And that means long-term Canadian currency is going to stay high because that’s the only
way the US is going to get rid of its trade imbalances. China won’t let them do anything
else. So we should be really frustrated at being collateral victims of China’s
intransigence.
Question: unclear
DT: So here’s the thing, here’s to me what is a huge puzzle: that view has been expressed
a number of times and I clearly bought into it, but what makes me pause is the Ontario
Task Force on competitiveness. We actually spent piles of money, it’s embarrassing, to
get a first-rate consulting firm to do a large-scale survey of business attitudes among US
businessmen, Canadian businessmen, and Canadian public. We asked them a gazillion
questions about you know, do businessmen deserve the rewards that they get; should we
have higher taxes; are businessmen taking up, you know, the whole slew of questions,
question after question after question. It was a large scale survey, over a thousand people
on each sides of the border. Question after question, we found no differences in responses
to anything. You know, would you be willing to work weekends? Would, you know...It’s
not in innovation, there were no innovation questions where you are, but on all sorts
about other questions that reflect cultural attitudes, no difference, except for one. And
that was, we asked businessmen on both sides of the border: what level of education do
you need, in order to be a successful businessman? In the US, more than half said you
need a university degree; and in Canada, it was less than a quarter.
So what you’re saying is very...makes total sense, but I just haven’t...we’ve looked and
looked in the data to see if we could find something in the date which is a smoking gun.
We just haven’t been able to find it; it doesn’t show up in the data. Casual empiricism, I
agree, it looks like it’s there.
Question: unclear.
DT: The OECD has been on our case for years, saying that we’re way too generous with
small and medium-sized enterprises. Just to bear in mind, one thing to bear in mind,
though, uhm, Canadian, small Canadian firms export in far greater numbers than is the
norm in all the OECD countries for which we have numbers. So they’re actually pretty
good exporters. Why that is, I don’t know. I’ve never taken the time to do cross-country
comparisons. But you’re absolutely right. The tax system’s gone way overboard, way
overboard. But don’t dis them completely.
Question: unclear.
37
DT: This is...Roger first showed me this slide probably about, oh, what year? Probably
about five years ago. This has been, this has been a big issue now, and we’ve been
pushing that for years.
Question:
DT: Uh, yeah, it’s. …I’m not sure how...uh...you’ve asked a couple of questions...
So, it flat lines by most, it’s not completely flat lined, it’s not doing robustly any way you
cut it. And so, you can cut it so it’s risen slightly, but it hasn’t risen nearly as
dramatically...it’s never going to rise nearly as dramatically as in the US. Now, in terms
of output, output’s always a little tricky here, so there are several output measures. Uh, it
turns out that it…if you’re talking about university, ‘cause now you have to see which
university comes under outcomes…at university level, um, adult education…adults in
North America tend to be much better educated than you’d think, given, uh, you
know…let me stop, it’ll get too long-winded of an answer. What’s really salient here is,
you get good outcomes from university when you do block funding. That is to say, you
give the university money, and let it manage the money. So we now have cross-OECD
studies about university performance for a variety of measures, like Shanghai Index or
Patents Indices. Universities do well if they have more money, and they do much better if
they have discretion on how they use their money. My view of what’s happened in
Canada is one of the big devils in uh, in university outputs, is that we have a monopsony.
Inadvertently, it’s no criticism of the government. Unfortunately, the government does
most of the funding of universities, which means they’re…they, when a minister says I
really think we should do research on the new economy, we’re all doing the new
economy. In the United States where there’s multiple funders, including private donors,
some will say, well, that’s pretty stupid. I’m not going to encourage these guys to do the
new economy; I want them to do entrepreneurship. And so, because you have a, a much
more competitive, uh funding sources, you get, I think, a much better set of outcomes
that’s less directed, and we know that that directedness hurts, uh, university outputs. Uh,
so…we…I don’t want to keep going for too long. Let me stop there. I think that’s the
important point, that’s often not seen.
Question: unclear
DT: Right, Spellsian case, 1995, on why term limits are a bad thing. Uh…well, uh, um,
that’s what my, this article in the pediatrics journal is all about. It’s trying to say why you
will get returns quickly. And the reason that you’ll get returns quickly is, uh, part of it is,
you won’t get all the returns, but you’ll get some of it pretty quickly because of
remediation in social service costs. Uh, it’s always easier….the article’s called “Quality
is Free”, Forum [unintelligible] Literature, that prevention is really a good way to get
quality at a low…at a low cost. And that’s true even when kids are young because there
are remedial costs, and those are quite extensive. So if you spend 15, maybe a billion of
that is straight out remedial costs that can be avoided. Uh, again, I’m not going to, I don’t
have a full answer for that. You know, sign petitions, [Muttain?] just had a petition going
around; she was asking people to sign, it was directed against McGuinty. You know,
scream, shout, shake trees, do whatever you can. It’s a very…I think its’ a tremendously
38
important issue, and it won’t happen until the business community gets mobilized behind
it, which is why I have this huge respect for uh, for Copley?, for what he did.
Question: unclear
DT: I have some thoughts on it. Uhmm, the thing to, you know, where some of the
opportunities are, seems to me, is what a colleague of mine, Lauren Berenson?, talks
about the race to the middle. And that is, the Chinese are upgrading what they need to do
business, and they’re needing more increasingly sophisticated intermediated inputs,
machinery, and you know, managerial expertise, the whole range. What we provide both
here and in the US, what we provide is too much quality; what they, what they provide is
too little quality. And so there’s an opportunity here for whoever can race to the middle
fastest, and that is to provide, to downgrade, to take out all the bells and whistles and to
provide the Chinese just the right amount of quality for what they need. So, what seems
like its engineered properly for us is over-engineered for the Chinese. Can we get
into…can we de-engineer and get into what the Chinese need? That’s something, you
know, this is a little piece of it, but that’s something that I find intriguing.