2009 Bushfires Royal Commission report
70
-
Upload
philip-jensen -
Category
Documents
-
view
214 -
download
0
description
2009 Bushfires Royal Commission report
Transcript of 2009 Bushfires Royal Commission report


1
1.0 INTRODUCTION ...................................................................................................................3
2.0 CONDITIONS LEADING UP TO THE FEBRUARY FIRES .........................................................4
2.1 WEATHER................................................................................................................................. 4 2.1.1 Overview...................................................................................................................4 2.1.2 Temperature .............................................................................................................4 2.1.3 Rainfall .......................................................................................................................5 2.1.4 Drought indices ........................................................................................................5
2.2 IMPACTS ON FUELS.................................................................................................................... 6 2.2.1 Grassland fuels .........................................................................................................6 2.2.2 Forest fuels.................................................................................................................6
2.3 FUEL/FIRE RELATIONSHIP ............................................................................................................ 7 2.4 LEADING UP TO 7 FEBRUARY 2009 ............................................................................................ 7
3.0 RATING THE CONDITIONS OF 7 FEBRUARY .....................................................................10
3.1 OVERVIEW.............................................................................................................................10 3.2 FIRE DANGER INDEX ...............................................................................................................10 3.3 GRASSLAND FIRE DANGER INDEX .............................................................................................11 3.4 FOREST FIRE DANGER INDEX....................................................................................................11 3.5 FIRE DANGER INDICES OF 7 FEBRUARY 2009 ............................................................................11
4.0 WEATHER CONDITIONS AND WILDFIRES IGNITED ON 7 FEBRUARY 2009......................12
4.1 TEMPERATURE .........................................................................................................................12 4.2 RELATIVE HUMIDITY AND FUEL MOISTURE CONTENT.....................................................................12 4.3 WIND SPEED...........................................................................................................................12 4.4 FIRES ON 7 FEBRUARY 2009....................................................................................................12
5.0 SELECTED MAJOR FIRES IGNITED ON 7 FEBRUARY 2009 ................................................15
5.1 OVERVIEW.............................................................................................................................15 5.2 KILMORE EAST/KINGLAKE FIRE .................................................................................................15
5.2.1 Fire Danger Index and driving influences ...........................................................15 5.2.2 Ignition of the Kilmore East Fire.............................................................................15 5.2.3 Spread of the Kilmore East fire .............................................................................16 5.2.4 Previous prescribed burns .....................................................................................22 5.2.5 Continuing fire spread and the wind change ...................................................22 5.2.5 Lightning strikes and the spread of fire into the Yarra Ranges National Park 23 5.2.6 Containment and control of the Kilmore East Fire.............................................23 5.2.7 Areas affected by the Kilmore East fire...............................................................25
5.3 MURRINDINDI FIRE ..................................................................................................................27 5.3.1 Fire Danger Index and driving influences ...........................................................27 5.3.2 Ignition of the Murrindindi fire...............................................................................27 5.3.3 Spread of the Murrindindi fire ...............................................................................27 5.3.4 Fire severity and forest age classes in the O’Shannassy ...................................35 5.3.5 Fire intensity and thinning (logging) operations.................................................37 5.3.6 Influence of cool temperate rainforests .............................................................40 5.3.7 The containment and control of the Murrindindi Fire........................................42 5.3.8 Area breakdown for the Murrindindi Fire ............................................................42
5.4 OVERALL MURRINDINDI/KILMORE COMPLEX ............................................................................43 5.5 CHURCHILL FIRES ....................................................................................................................44
5.5.1 Fire Danger Index and driving influences ...........................................................44 5.5.2 Ignition of the Churchill fire ...................................................................................44 5.5.3 Spread of the Churchill fire ...................................................................................44

2
5.5.4 Southern extent of main fire .................................................................................49 5.5.5 After the wind change..........................................................................................51 5.5.6 Containment and control of the Churchill fire...................................................52 5.5.7 Churchill fire affected areas breakdown ...........................................................53
6.0 OTHER FIRES IN VICTORIA.................................................................................................54
6.1 DELBURN FIRE, LATE JANUARY 2009 ........................................................................................54 6.2 BUNYIP FIRE ............................................................................................................................56 6.3 ERICA FIRE .............................................................................................................................57 6.5 REDESDALE FIRE......................................................................................................................59 6.6 DAYLESFORD FIRE ...................................................................................................................60
7.0 OVERALL AREA FIRE AFFECTED ........................................................................................62
8.0 FIRE DANGER AND CHANGING CLIMATE PATTERNS .....................................................63
8.1 OVERVIEW.............................................................................................................................63 8.2 REPORT BY LUCAS, HENNESSY, MILLS AND BATHOLS .................................................................63 8.3 DID CLIMATE CHANGE EXACERBATE THE FIRES OF 7 FEBRUARY?.................................................64
9.0 FUEL REDUCTION BURNS AND EXTREME FIRE DANGER INDEX (FDI)..............................64
10. CONCLUSIONS..................................................................................................................66
REFERENCES....................................................................................................................................67

3
1.0 Introduction
The wildfires of 7 February 2009 were unprecedented and many communities endured one
of the worst peacetime disasters in Australia’s history. These fires tragically claimed 173 lives,
damaged or destroyed more than 2000 properties and 61 businesses, burned through
entire towns and affected 430,000 hectares of land throughout Victoria. Disasters on this
scale do not occur in isolation, but are the result of preceding events and conditions. The
Victorian Bushfires Royal Commission has been charged with investigating the causes of
and responses to these fires. To date, it has focused on warnings, information, protecting
people during bushfires, identifying wildfire risk, emergency management and response.
The next step for the Royal Commission is to examine building standards in ‘bushfire’ prone
areas, hear evidence about the structure and regulation of the electricity industry in
Victoria and look at land management issues. Given that the condition of the land was
relevant to the behaviour of the fires that started on 7 February, this report will focus on
land tenure issues and driving influences. It is a submission to the Commission and is being
made generally available to the public as a tool for people seeking to submit to the
Commission. The aim of this report is to identify relevant issues for further investigation by
the Royal Commission, with particular reference to its investigation into land management.
The report begins with a brief overview of the weather conditions leading up to the events
of 7 February 2009. Tolhurst (2009), Sullivan and McCaw (2009) and Karoly (2009) consider
that these conditions significantly influenced the severity of the fires. The main body of the
report focuses on three fires: 1) Kilmore East/Kinglake: 2) Murrindindi and 3) Churchill. Each
review of these fires has a brief summary of the weather and fire danger index (FDI)
observed on 7 February 2009, then reports on the types of land tenure affected by the fires,
the intensity of the fires, and some management issues concerning environmental values.
A percentage analysis of fire affected land tenure is provided to provide readers with an
overview of where the fires started, on what type of land tenure and how much of each
type of land was fire affected.
The report concludes with an overview of observed and predicted changes in climate
patterns which may already influence fire behaviour on those land tenures and which are
predicted to increase fire severity and number of extreme fire danger days in the future.
The information in this report is preliminary and may be superseded once comprehensive
academic and departmental analysis is undertaken. However, it is hoped this report will
help the Royal Commission identify a number of key issues of relevance and assist
members of the community in contributing toward reducing the risk of such a disaster
causing significant loss of life, property and the environment in the future. The report draws
from data from the following sources:
• The Interim Report by the Royal Commission and supporting documentation
• Department of Sustainability and Environment’s (DSE) Fire Web page
• Bureau of Meteorology
• NASA Earth Observatory
• Media reports
• On-site visits to a number of the fire affected areas
• Review of literature and interviews with fire prevention and response personnel and
witnesses

4
2.0 Conditions leading up to the February fires
2.1 Weather
2.1.1 Overview
Tolhurst (2009) explains that weather elements, such as seasonal conditions (droughts),
shorter term episodic events (heatwaves and storms), dynamic situations (extreme
temperature combined with low air moisture, strong winds, atmospheric patterns and
passage of low pressure troughs and cold fronts) are critical to fire behaviour.
2.1.2 Temperature
Several experts in fire behaviour and climatology have noted that the preceding weather
and climate played a significant role in the severity of the fires (Tolhurst 2009, Sullivan and
McCaw 2009, Karoly 2009). The Bureau of Meteorology has documented how an
exceptional heat wave affected south-eastern Australia during late January and early
February 2009. The Bureau noted that extreme conditions affected most of Victoria and
adjacent areas of New South Wales, northern and eastern Tasmania and southern South
Australia.
The Bureau of Meteorology observed two major episodes of exceptionally high
temperatures, 28-31 January and 6-8 February, with slightly lower but still very high
temperatures persisting in many inland areas through the entire period. The Bureau of
Meteorology (2009) stated that this was caused by the presence of a slow-moving high-
pressure system in the Tasman Sea combining with an intense tropical low off the north-
west coast of Western Australia and an active monsoon trough. This provided the
conditions for hot air of tropical origin to be directed over the southern parts of the
continent.
Figure 2.1 details the temperature anomaly observed over the heatwave period of late
January and early February 2009. In the areas affected by the fires the Bureau observed temperature anomalies of 10°C. This was particularly evident around the Kilmore East and Murrindindi locations where the two largest fires started.
The first stage of the heatwave (27-31 January 2009) damaged infrastructure throughout
Victoria. This included warped train tracks and the temporary closure of businesses and
government offices. The heatwave severely disrupted transport services, with more than
1,000 train services being cancelled. Housten and Reilly (2009) estimate the damage cost
the economy in the order of $100 million.
The impact on human health was significant. Assoc. Professor Mark Fitzgerald, Director of
Emergency at the Alfred Hospital, said on ABC TV’s Four Corners on 16 February:
“We had the heat wave where we had to call in extra people and
enact a sort of mini disaster plan the week before and we’ve been
having an average of one major burns patient per day up until the
bushfires and we did have a discussion on the Friday about one, what
would happen if there was another heat wave and secondly our
response if there was a bushfire”.

5
Figure 2.1 Land surface temperature anomaly between 25
January and 1 February 2009 (Source:
http://earthobservatory.nasa.gov/NaturalHazards/view.php
?id=36900, accessed 13.04.08)
According to Koch (2009), the Victorian state morgue was taking in the bodies of more
than 50 deceased persons per day, more than three times the average. According to Fyfe
(2009), the heat wave period may have been responsible for the deaths of 100 people in
Melbourne and more than 200 people across south-eastern Australia.
2.1.3 Rainfall
The report provided to the Royal Commission by the Bushfire Cooperative Research Centre
(CRC) (Sullivan and McCaw 2009) said there was a strong association between drought
and the occurrence of major bushfires in central and eastern Victoria. The Bushfire CRC
report stated that the cumulative effect of successive years of below normal rainfall in the
decade prior to 2009 was likely to have significantly affected groundwater levels, soil
moisture and the dryness of large dead woody fuels. The report said in the decade
between January 1999 to December 2008 cumulative annual rainfall was 885mm below
normal at Toorourrong Reservoir and 1877mm below normal at Wallaby Creek. Only
1.0mm was recorded there during January 2009. The long-term median rainfall for January
is 55mm. Overall, this trend of rainfall deficit was replicated across most of Victoria (Sullivan
and McCaw 2009). Karoly (2009) believes the lack of rainfall contributed to extremely low
fuel moisture (3-5 per cent) on 7 February 2009.
2.1.4 Drought indices
Sullivan and McCaw (2009) explain that Melbourne had reached Keetch-Byram drought
index (KBDI) value greater than 100 on 7 February 2009. The KBDI uses a method for
tracking soil moisture loss, recharge and use simplified evapotranspiration relationships
based on daily maximum temperature to estimate moisture loss and daily rainfall
corrected for interception by forest canopies for recharge. Sullivan and McCaw (2009)
explain that the area north and east of Melbourne, particularly in the Yarra Valley,
experienced KBDI values between 125 and 150. They note that these values were at least
50 points above the normal level expected at that time of year. This contributed to most

6
of Victoria (excluding the Otways and the Alpine area) having a drought factor of 9.5 or
greater on 7 February 2009. The drought factor aims to encapsulate the effects of slowly
varying long-term rainfall deficits and short term wetting of fine fuels from recent rain
(Lucas et al 2007).
2.2 Impacts on fuels
2.2.1 Grassland fuels
Sullivan and McCaw (2009) report that grass-curing maps prepared from NOAA satellite
imagery show that by 7 February, grasslands and pastures in the north and west of Victoria
were approaching full curing (>95 per cent). They note that curing ranged from 65 to 95
per cent in the Upper Plenty Valley, Yarra Valley, eastern parts of the Goulburn Valley and
Gippsland. They say curing was less advanced at higher elevations in central Victoria that
remained moister and cooler during January and in sites along rivers and gullies.
Luke and McArthur (1978) found the curing of grass occurs when the percentage of
moisture in the grass in relation to its Oven Dried Weight (ODW), decreases from 350 per
cent when green to around 10 per cent when it is 100 per cent cured. Tolhurst (2009) notes
the high degree of desiccation throughout grassland areas resulted in further fuel being
available to burn. This is significant as the Kilmore East and Murrindindi Fires started on
pastoral and agricultural land (Clancy 2009, Four Corners 2009).
Noble (1991) notes that throughout the world grasslands are traditionally regarded as
highly flammable plant communities that require frequent burning. He notes that the
intensity of grassfires can reach 20,000 KW/m and can achieve speeds of 22km/h. Tolhurst
(2009) notes that fuel loads on 7 February were about 1.5 t/ha in eaten out paddocks.
2.2.2 Forest fuels
Luke and McArthur (1978) stated the overall availability of fuels in forests is relatively low
and thus only a small proportion of the total fuel is consumed in a fire, even a fire of high
intensity. In some forests the total dry weight of dead and living plant material may be 500
tonnes per hectare or more. Luke and McArthur (1978) provided a breakdown of the fuel
components in a dry sclerophyll forest in south-eastern Australia:
Component Weight (t/ha) Percentage
Fine fuel 10.0 3.8
Scrub species 10.8 4.0
Bark 27.3 10.3
Wood: 0.6 to 2.5cm diameter 4.8 1.8
Wood: 2.5 to 12.5cm diameter 46.0 17.4
Wood greater than 12.5cm diameter 166.0 62.7
Total 264.9 100
Tolhurst (2009) notes that due to the drought conditions, many of the normally moist forests
were dry and carried the fire easily. He estimates mountain forests carried around 45 t/ha.
Tolhurst notes the heatwave in late January desiccated, to a high degree, the green
vegetation adding to the total fuel available. In this case, as with grassland fuels, more
7
energy was available to drive the fire instead of being used to dry the fuel and heat it to
the kindling temperature.
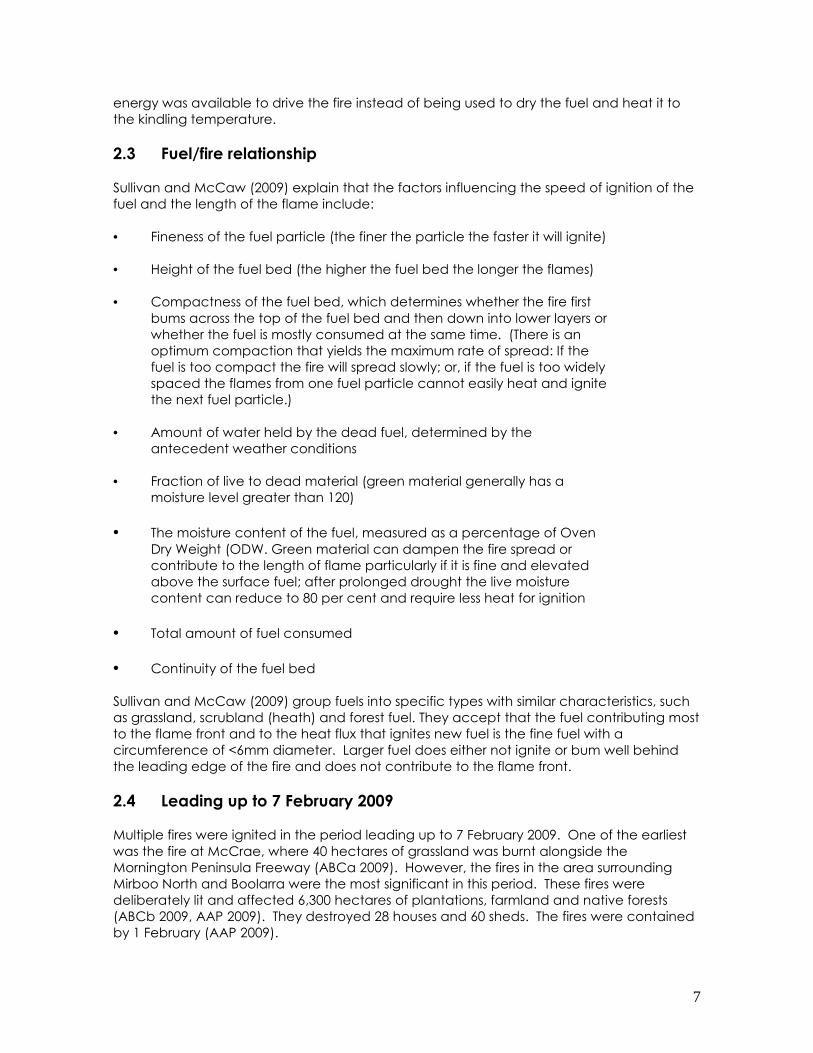
2.3 Fuel/fire relationship
Sullivan and McCaw (2009) explain that the factors influencing the speed of ignition of the
fuel and the length of the flame include:
• Fineness of the fuel particle (the finer the particle the faster it will ignite)
• Height of the fuel bed (the higher the fuel bed the longer the flames)
• Compactness of the fuel bed, which determines whether the fire first
bums across the top of the fuel bed and then down into lower layers or
whether the fuel is mostly consumed at the same time. (There is an
optimum compaction that yields the maximum rate of spread: If the
fuel is too compact the fire will spread slowly; or, if the fuel is too widely
spaced the flames from one fuel particle cannot easily heat and ignite
the next fuel particle.)
• Amount of water held by the dead fuel, determined by the
antecedent weather conditions
• Fraction of live to dead material (green material generally has a
moisture level greater than 120)
• The moisture content of the fuel, measured as a percentage of Oven
Dry Weight (ODW. Green material can dampen the fire spread or
contribute to the length of flame particularly if it is fine and elevated
above the surface fuel; after prolonged drought the live moisture
content can reduce to 80 per cent and require less heat for ignition
• Total amount of fuel consumed
• Continuity of the fuel bed
Sullivan and McCaw (2009) group fuels into specific types with similar characteristics, such
as grassland, scrubland (heath) and forest fuel. They accept that the fuel contributing most
to the flame front and to the heat flux that ignites new fuel is the fine fuel with a
circumference of <6mm diameter. Larger fuel does either not ignite or bum well behind
the leading edge of the fire and does not contribute to the flame front.
2.4 Leading up to 7 February 2009
Multiple fires were ignited in the period leading up to 7 February 2009. One of the earliest
was the fire at McCrae, where 40 hectares of grassland was burnt alongside the
Mornington Peninsula Freeway (ABCa 2009). However, the fires in the area surrounding
Mirboo North and Boolarra were the most significant in this period. These fires were
deliberately lit and affected 6,300 hectares of plantations, farmland and native forests
(ABCb 2009, AAP 2009). They destroyed 28 houses and 60 sheds. The fires were contained
by 1 February (AAP 2009).

8
Following the first period of the heatwave, a period of cooler temperatures relieved the
southern half of Victoria. However, during this cooler period, 23 new fires were ignited in
the Bunyip State Park and in areas in south and west Gippsland. According to news reports
on the ABC (ABCb 2009), these fires were the results of lightning strikes. A spokesperson
from the DSE said high humidity resulted in the fires being kept at a small scale. However,
Miller (2009) reported in the Berwick & District Journal that what was to become the major
fire in the Bunyip region was deliberately lit, under the cover of lightning, early on
Wednesday 4 February.
The Coldstream station recorded temperatures approaching the mid 40s C on 28, 29 and
30 January 2009. The relative humidity was as low as 10 per cent at 3pm on 28 January.
Luke and McArthur (1978) note that low relative humidity has a significant effect on fuel
moisture content. The Bureau of Meteorology forecast a Forest Fire Danger Index above 50
for these three consecutive days. The region experienced a period of extreme fire danger
which reached a peak of 73 on 29 January 2009.
Despite a short period of relief from the high temperatures in the days following 31 January
2009, maximum temperatures again reached the mid 30s from 4 February with the highest temperature, 44.8°C, recorded on 7 February.
Two days earlier, on 5 February 2009, the Office of the Emergency Services Commissioner
issued a news statement warning of fire conditions forecast to exceeding those reached
during the 1983 Ash Wednesday fire disaster. On Friday 6 February, the Chief Officer of the
Country Fire Authority, Russell Rees, provided a briefing for 7 February, stating:
“The situation is quite clearly in a weather sense for tomorrow that we
are in almost uncharted territory.
“And when I say unchartered territory, there are no records that show
the sort of fire conditions tomorrow predicted.”
“I looked at it and I thought these figures have got to be wrong,
there’s got to be a glitch in the computer. In effect our weather
conditions for the state if I said they are bloody horrible I am
underestimating them, I have never seen figures like this.”

9
Figure 2.2 Chart measuring, maximum and minimum temperatures, relative humidity and
maximum wind gusts, along with record predictions for the forest and grass fire danger
index at the Coldstream weather station. Source: Bureau of Meteorology, 2009

10
3.0 Rating the conditions of 7 February
3.1 Overview
The conditions of 7 February 2009 set new records for extremes in temperature and relative
humidity (Karoly 2009). When combined with long-term rainfall deficits and drought
conditions they created unique conditions for fire. Wildfire behaviour academics and
researchers have developed methods for measuring fire danger, through the Fire Danger
Index (FDI). This system rates the fire danger for a particular day, based on its temperature,
relative humidity, wind velocity and the long-term drought conditions, often referred to as
drought factor. The following section provides a background to this system.
3.2 Fire Danger Index
The Fire Danger Index system is used throughout eastern Australia. It was initially developed
as the McArthur Fire Danger Rating System. It provides a means of estimating fire
behaviour and the rate of spread in most of the common fuel types in eastern Australia
(Luke and McArthur 1978).
Luke and McArthur (1978) say the Fire Danger Rating System consists of two meters: the
forest fire danger meter and the grass fire danger meter. They integrate the combined
effects of fuel moisture content and wind velocity to form a basic fire danger index. Each
basic index can be related to fuel quantity and slope to give the head fire spread rates
and other fire behaviour characteristics.
Luke and McArthur (1978) express the forest and grassland indices to the rate of forward
spread on a scale of 1 to 100. They state that an index of 100 represented the near worst
possible fire weather conditions that could be experienced in Australia. They claim an
index of 1 would be virtually self-extinguishing, while an index of 100 (or greater) would burn
so rapidly and intensively that control of these fires would be virtually impossible. Luke and
McArthur (1978) divide the FDI rating into five categories:
• Low
• Moderate
• High
• Very high
• Extreme
The FDI takes account of long and short term drying. Luke and McArthur (1978) make use
of a modified version of the Keetch-Byram drought index (KBDI). They take the short term
rainfall to be based on the changes expected in the moisture content of surface litter,
specifically in material less than 6mm in diameter. Wind speed is expressed in what Luke
and McArthur (1978) refer to as “open station wind speed”. The rate of spread and other
fire behaviour characteristics given by the forest fire danger meter are based on typical
single fires burning under commercial eucalypt forests. Luke and McArthur (1978) advise
that the index should not be used to predict the behaviour of multiple fires burning in close
proximity.
11
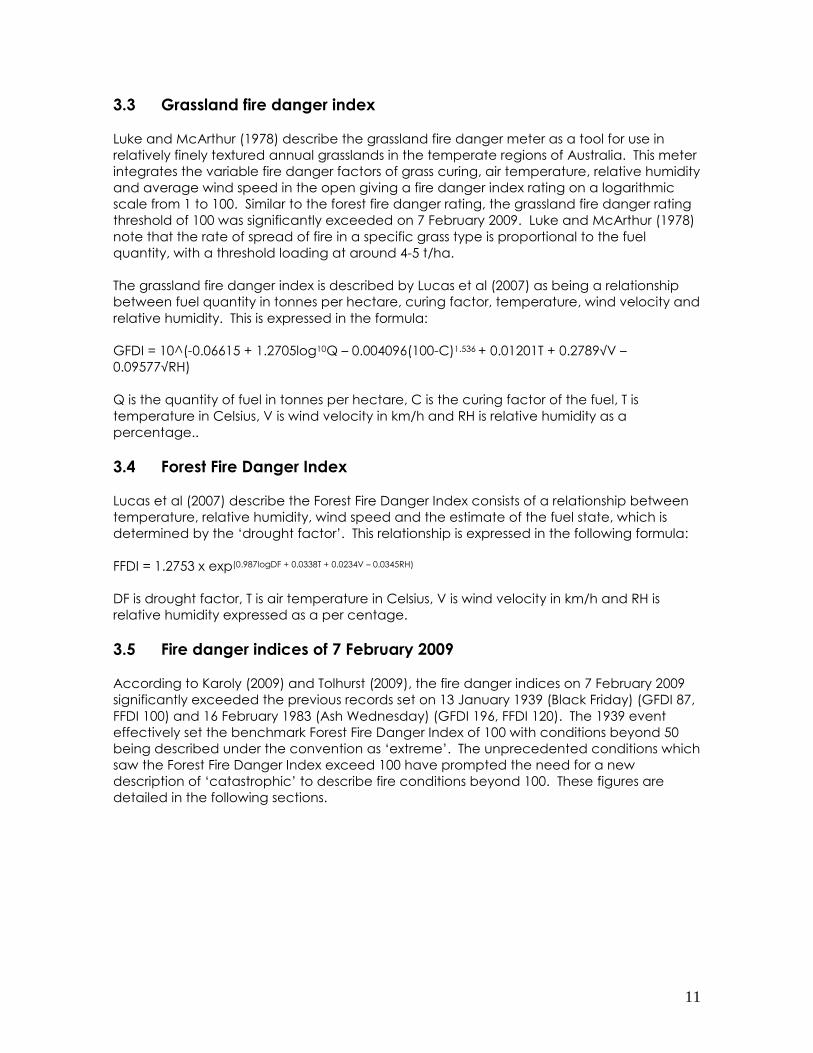
3.3 Grassland fire danger index
Luke and McArthur (1978) describe the grassland fire danger meter as a tool for use in
relatively finely textured annual grasslands in the temperate regions of Australia. This meter
integrates the variable fire danger factors of grass curing, air temperature, relative humidity
and average wind speed in the open giving a fire danger index rating on a logarithmic
scale from 1 to 100. Similar to the forest fire danger rating, the grassland fire danger rating
threshold of 100 was significantly exceeded on 7 February 2009. Luke and McArthur (1978)
note that the rate of spread of fire in a specific grass type is proportional to the fuel
quantity, with a threshold loading at around 4-5 t/ha.
The grassland fire danger index is described by Lucas et al (2007) as being a relationship
between fuel quantity in tonnes per hectare, curing factor, temperature, wind velocity and
relative humidity. This is expressed in the formula:
GFDI = 10^(-0.06615 + 1.2705log10Q – 0.004096(100-C)1.536 + 0.01201T + 0.2789√V – 0.09577√RH)
Q is the quantity of fuel in tonnes per hectare, C is the curing factor of the fuel, T is
temperature in Celsius, V is wind velocity in km/h and RH is relative humidity as a
percentage..
3.4 Forest Fire Danger Index
Lucas et al (2007) describe the Forest Fire Danger Index consists of a relationship between
temperature, relative humidity, wind speed and the estimate of the fuel state, which is
determined by the ‘drought factor’. This relationship is expressed in the following formula:
FFDI = 1.2753 x exp(0.987logDF + 0.0338T + 0.0234V – 0.0345RH)
DF is drought factor, T is air temperature in Celsius, V is wind velocity in km/h and RH is
relative humidity expressed as a per centage.
3.5 Fire danger indices of 7 February 2009
According to Karoly (2009) and Tolhurst (2009), the fire danger indices on 7 February 2009
significantly exceeded the previous records set on 13 January 1939 (Black Friday) (GFDI 87,
FFDI 100) and 16 February 1983 (Ash Wednesday) (GFDI 196, FFDI 120). The 1939 event
effectively set the benchmark Forest Fire Danger Index of 100 with conditions beyond 50
being described under the convention as ‘extreme’. The unprecedented conditions which
saw the Forest Fire Danger Index exceed 100 have prompted the need for a new
description of ‘catastrophic’ to describe fire conditions beyond 100. These figures are
detailed in the following sections.

12
4.0 Weather conditions and wildfires ignited on 7
February 2009
4.1 Temperature
To begin with, Karoly (2009) provides an overview of the temperatures on the day. He
states that Melbourne and much of Victoria had record high maximum temperatures on 7
February. Melbourne had a new record maximum of 46.4°C, 0.8°C hotter than the
previous all-time record set on Black Friday 1939 and 3°C higher than the previous February
record set on 8 February 1983. Tolhurst (2009) explains that these high temperatures lead to
rapid and extreme fuel drying, bringing these fuels closer to the kindling temperature and
aiding ignition.
4.2 Relative humidity and fuel moisture content
Karoly (2009) notes that new record low values of relative humidity were set on 7 February
in Melbourne and other sites in Victoria, with values as low as 5 per cent in the late
afternoon. He states that the very low humidity was likely to have been associated with
the unprecedented low rainfall in Melbourne since the start of the year and the protracted
heatwave. Tolhurst (2009) explains that this dries out dead fuel and stresses live fuel,
decreasing their moisture content.
Sullivan and McCaw (2009) show that on 6 February at Kilmore Gap the minimum surface
moisture content (SMC) reached about 6.2 per cent at 3pm. In the evening this increased
to a maximum of just 13.2 per cent at 9pm. From then until 5am on 7 February the SMC
dropped slightly to about 11.9 per cent. Following sunrise, the SMC decreased rapidly
during the morning until it reached 4.6 per cent at midday. Over the next four hours, the
SMC decreased to around 4 per cent before increasing rapidly with the arrival of the wind
change at 5pm. Sullivan and McCaw’s simulation suggests that the moisture content of
the fine fuels was extremely low due to the very hot and dry conditions, resulting in high
combustibility and increased availability of fuel.
4.3 Wind speed
Karoly (2009) notes that the weather pattern and northerly winds on 7 February were similar
to those on Ash Wednesday 1983 and Black Friday 1939. Sullivan and McCaw (2009) note
wind speeds exceeding 70km/h and gusts exceeding 90km/h at Kilmore Gap.
4.4 Fires on 7 February 2009
Early in the morning of 7 February fires were reported east of Melbourne around the Bunyip
State Park (ABCd 2009). These were believed to be ignited by lightning, but other fires in
this region were deliberately lit in the days before 7 February and these fires continued to
burn into the catastrophic conditions of 7 February (Miller 2009). According to reporting on
the ABC’s Four Corners of 16 February 2009 (ABCd 2009), the Emergency Response Centre
was focusing its initial attention on the Bunyip fire.
At 11:49am a fire started on farmland in the Kilmore East region was later found to have
resulted from a fallen single wire earth return (SWER) power line (Clancy 2009, Royal

13
Commission 2009). This fire was to eventually burn through Kinglake and Chum Creek.
Further fires were ignited around the state by failing power infrastructure between 12:26pm
and 1:17 pm (Thom 2009, Tobin 2009).
At 1:33pm a fire, which was later found to have been deliberately lit ignited in a hardwood
plantation south of Churchill in South Gippsland. This fire was to eventually burn through a
number of small communities in the Strzelecki Ranges (Cooke and Silvester 2009).
Just before 3pm, another fire was deliberately lit on cleared farmland near the old
Murrindindi Sawmill. This fire was to burn through to Narbethong and Marysville (Four
Corners-b 2009, Royal Commission 2009, AAP 2009).
At 3:11pm, a fire broke out on farmland at Redesdale. West of this fire, another was ignited
on a paddock near Bendigo (ABCd 2009). Lightning is thought to have started the fires
near Dargo and Erica (Waller 2009). At 6:09pm, a fire in the Beechworth area was reported
to DSE (Waller 2009). This is believed to have started by tree branches falling on power lines
(Weekly Times 2009).
Lightning is thought to have ignited the fire at Mount Riddell, east of Healesville, later in the
day of 7 February. The large pyro-cumulus cloud rising above the Kilmore East fire is
thought to have generated the lightning strike (Royal Commission 2009, Blair pers comm
Rees pers comm). A summary of the fires is provided in Table 4.1 below:
Fires ignited on
7 Feb 2009
Reporting
of fire
Reported
ignition source
Land tenure at
ignition
Total area affected
(ha)
Bunyip 04.02.09 Arson State Park 26,200
Kilmore East 11:50am Power line Private property 127,676*
Horsham 12:26pm Power line Private property 2,200
Coleraine 12:36pm Power line Private property 775
Weerite 1:17pm Power line Private property 1,300
Churchill 1:33pm Arson Plantation 24,500
Murrindindi 2:57pm Arson Private property 131,712*
Redesdale 3:11pm Unconfirmed Private property 9,500
Bendigo 4:34pm Arson Private property 330
Erica 6:00pm Lightning State forest 1,778
Beechworth 6:09pm Powerline State forest /
private property
31,000
Dargo N/A Lightning State forest 13,640
Mt Riddell N/A Lightning National Park Part of Kilmore East
Total - - - 370,611
Table 4.1 List of fires burning on 7 February 2009 by start time, ignition source and land
tenure and subsequent area affected by the fire.
Source: Summary of Incidents of Public Land by DSE and joint State Fire Situation Reports by
DSE and CFA, 20 February 2009. (* These figures are estimates by the author based on
measuring DSE maps showing extent of fires, not DSE figures for the Murrindindi north and
south divisions. These figures vary from DSE figures because the administrative boundaries

14
between the Kilmore East and Murrindindi fires do not reflect the actual area burnt by
each fire.)
According to the data in Table 4.1, failing power infrastructure was the single largest
ignition source of the fires across the state, comprising 38 per cent of the total. Arson was
responsible for 31 per cent, followed by lightning at 23 per cent. Unconfirmed sources
comprise the remainder. These percentages are detailed in Figure 4.1.
Unconfirmed
8%
Arson
31%
Powerline
38%
Lightning
23%
Figure 4.1 Proportions of fire ignition sources
Half of the total area burnt was from fires started by acts of arson. Failed power line
infrastructure accounted for fires affecting 40 per cent of the burnt area. Lightning started
fires that burnt 7 per cent of the total area burnt, while in 3 per cent remains unconfirmed.
These percentages are expressed in a graph in Figure 4.2.
Lightning
7%
Powerline
40%
Arson
50%
Unconfirmed
3%
Figure 4.2 Proportion of Area Burnt by Ignition Source

15
5.0 Selected major fires ignited on 7 February 2009
5.1 Overview
The following section provides an overview of three major fires that were ignited on 7
February 2009. These are:
• Kilmore East fire
• Murrindindi fire
• Churchill fire
These fires comprised the majority of the area fire affected and burnt through a variety of
land tenures. Each overview provides images and maps of the areas affected.
5.2 Kilmore East/Kinglake fire
5.2.1 Fire Danger Index and driving influences
According to Sullivan and McCaw (2009), the weather conditions at Kilmore Gap included
temperatures above 40°C, relative humidity as low as 5 per cent and wind speeds exceeding 70km/h, with gusts reaching 90km/h. Combined with a drought factor
exceeding 9.5, Sullivan and McCaw (2009) detail a grassland fire danger index of 400, and
a Forest Fire Danger Index reaching nearly 200 (see Figure 5.1).
Figure 5.1 Kilmore Gap FFDI and GFDI data for 7 February 2009 from 9am to midnight.
(Source: Sullivan and McCaw 2009)
5.2.2 Ignition of the Kilmore East Fire
The Royal Commission (2009) notes that the Emergency Services Telecommunications
Agency (ESTA) took a call at 11:49am advising of a fire at Saunders Road, Kilmore East.
Clancy (2009) quotes a spokesperson from the Kilmore Country Fire Authority who claimed
the likely cause of this fire was a fallen power line. Sullivan and McCaw (2009) note that

16
the fire initially spread to the south east through pasture and agricultural land (Figures 5.2
and 5.3).
Figure 5.2 - Area surrounding the Kilmore East ignition point, near
Saunders Road. (Photo: Chris Taylor, 26 April 2009)
Figure 5.3 - Farmland south east of the ignition area showing individual
remnant native trees. Note sparse grass cover remaining in unburnt
areas. (Photo: Chris Taylor, 26 April 2009)
5.2.3 Spread of the Kilmore East fire
Sullivan and McCaw (2009) and Clancy (2009) note that the fire progressed into a radiata
pine plantation adjoining Saunders Road (Refer to Figure 5.4). Clancy notes that the local
fire brigade was unsuccessful in preventing the fire from spreading into the pine plantation.
Tolhurst and Cheney (1999) note that very intense fires are possible in radiata pine

17
plantations when the Fuel Moisture Content is less than 7 per cent. Given that Sullivan and
McCaw (2009) record that relative humidity was around 5 per cent, the moisture content
of the fuel would have been less than 7 per cent, based on the methods described in Luke
and McArthur (1978).
Figure 5.4 Burnt pine plantation along Saunders Road (26 April 2009)
The Saunders Road Plantation adjoins the Hume Highway. According to the Royal
Commission (2009), initial efforts at controlling the fire before it crossed the Hume Highway
were unsuccessful. The Royal Commission (2009) noted that the fire front crossed the Hume
Highway at Heathcote Junction at 1:58pm. The fire front was reported to be three
kilometres wide, between Clonbinane and Broadford–Wandong Roads.
Figure 5.5 - Hume Freeway at Saunders Road overpass (26 April 2009)

18
The Royal Commission (2009) explains that the fire had a very elongated shape under the
influence of north-westerly winds, with a length-to-breadth ratio of approximately 7:1.
Sullivan and McCaw (2009) note that the fire burnt in a south–easterly direction along the
escarpment of the Hume Range.
The Royal Commission (2009) notes that between 2pm and 5pm the fire front travelled
another 6 kilometres under the influence of a 60–90 km/h north-westerly wind, through
timber plantations and agricultural land, before entering the Mount Disappointment State
Forest. It then travelled across the Great Dividing Range at Mount Disappointment,
reaching the base of Mount Disappointment at 3:30pm at a speed of 8km/h. On a site trip
the author observed evidence of extremely high fire severity impact resulting from intense
fire in these forest areas (refer to Figure 5.6). The DSE (2009) fire severity map reveals that
the area sustained class 1 to 2 fire severity impact (refer to Maps 5.1 and 5.2).
Map 5.1 - Kilmore fire and areas of Kinglake and St Andrews fire affected
(Image Source: Earth Observatory. Image date: 14 February 2009)

19
Map 5.2 – Severity of Kilmore fire in areas of Kinglake and St Andrews.
(Image Source: DSE 2009)
Tolhurst (2009) explains that the topography of the region played a significant role in the
direction and spread of the fire. He states:
“When the Kilmore East fire burnt up the side of Mount Disappointment,
the winds became stronger and more westerly than those lower down
in the valleys. This resulted in the fire being directed more towards
Strathewen and Kinglake West rather than towards Whittlesea, but it
also meant that firebrands were blown further as well, reaching the
area north of Healesville. This is a distance of 35km.” (Tolhurst 2009:10)

20
Figure 5.6 Severe fire intensity impact. State forest west of Mount
Disappointment. (Photo: Chris Taylor, 26 April 2009)
The Mount Disappointment State Forest has an extensive history of logging and other
forestry operations (DSE Forest Explorer Map: accessed 20 April 2009). On a site visit, the
author observed severe fire intensity impact to previous logging coupes with young trees
developing conical crowns. This was the case on Lords Track, north-west of Whittlesea (see
Figure 5.7).
Coupes with dense young regrowth, that had not yet developed conical crowns,
appeared to suffer scorching but were not consumed as older trees in previously logged
areas had been.
Figure 5.7 Fire affected regeneration after 1997 logging. Lords Track.
(Photo: Chris Taylor, 26 April 2009)

21
The fire progressed from Mount Disappointment State forest into the Wallaby Creek Water
Catchment, part of the Kinglake National Park. The southern half of the Wallaby Creek
catchment contained mature and old growth stands of Mountain Ash dating back to 1730
(Ashton 1976). The northern half of the catchment had been affected by fire in 1982 and a
new stand of Mountain Ash had grown up following that fire. A change in wind direction
during the 1982 fire resulted in the fire burning away from the mature and old growth
stands of Mountain Ash in the southern half of the catchment (Griffiths 2002).
On 7 February Mr Paul Jones, a fire spotter stationed at the fire tower on the summit of Mt St
Leonards, observed the fire passing through the Mount Disappointment area. Jones (pers
comm) states that the fire progressed more slowly over the summit of Mount
Disappointment and through Wallaby Creek, than it had along the southern escarpment
and surrounding private land. This is illustrated in a photo (Figure 5.8) by Mr Jones, showing
the approaching Kilmore East fire. Thick smoke can be seen under the main smoke plume
in the left of the photo, indicating that the fire had already passed through and along the
southern escarpment of Mount Disappointment.
Figure 5.8 Image showing the fire progressing over the
summit of Mount Disappointment and Wallaby Creek
catchment. The smoke cover to the left (south of the
summit of Mount Disappointment) indicates where the fire
had moved faster through the surrounding foothill forests
and farmland to the south.
(Photo: Paul Jones, 7 February 2009)

22
5.2.4 Previous prescribed burns
A number of forest areas in the Mount Disappointment State Forest and Kinglake National
Park had been subjected to prescribed burns between 2005 and 2008, as detailed in map
5.1. and 5.2. As indicated on Map 5.2, sites treated with previous prescribed burns west of
Mount Disappointment, experienced a high severity Class 2 fire on 7 February.
Figure 5.9 shows one of these areas where crowns were scorched. It was observed by the
author that forests in surrounding areas sustained crown consumption. The prescribed burn
may have decreased the intensity of the fire but not to such an extent that it would have
been controllable given the extreme conditions. Tolhurst (2009) estimates that the average
fire line intensity on the day reached 100,000 kW/m whilst Waller (2009) states that the
current limit to active suppression (direct attack) is 4,000 kW/m.
.
Figure 5.9 Fire affected forest treated with a prescribed burn in 2008.
(Photo: Chris Taylor, 19 April 2009)
The previous prescribed burn areas adjoining the north-east boundary of the Wallaby
Creek Catchment reveal some small areas of crown vegetation left un-scorched (refer
Map 5.1 & 5.2). Of the 1,800 hectares (approx) prescribed burnt between 2005 and 2009 in
the Mount Disappointment state forest and Wallaby Creek catchment area, around 90 per
cent suffered mostly Class 2 fire impact. This appears to be congruent with the Esplin
Report (2003), which found none of the areas within the perimeter of the 2002–2003 North
East and Gippsland fires that had been subjected to recent fuel reduction burns remained
unburned.
5.2.5 Continuing fire spread and the wind change
The Royal Commission (2009) notes that the fire progressed onto the Whittlesea–Yea Road,
just south of the settlement of Kinglake West. The Commission notes spotting was reported
at Smith Gully at 4pm, with forests of Stringybark and Peppermint and pockets of Manna
Gum, Grey Gum and Mountain Ash, contributing to significant spotting.

23
The Royal Commission (2009) found the fire was reported to be approximately six kilometres
wide by the time it reached the Whittlesea–Yea Road. Spot fires were reported at St
Andrews at 5:46pm, with the wind change arriving at 6:01pm. The main fire and the
subsequent spot fires then headed in a north-easterly direction, reaching Flowerdale at
7:40pm. The Kilmore East–Wandong section of the fire headed generally north along the
Hume Highway, reaching Reedy Creek at 8:00pm and burning through the remainder of
the Mount Disappointment State Forest, the Wallaby Creek catchment and the Kinglake
National Park (Royal Commission 2009).
Figure 5.10 Panorama looking west from the fire tower on Mount St Leonards showing fire
affected areas surrounding Kinglake, Toolangi, Dixon’s Creek and Yarra Glen.
(Photo: Chris Taylor, April 2009)
5.2.5 Lightning strikes and the spread of fire into the Yarra Ranges National Park
The Royal Commission (2009) noted that lightning from intense smoke plumes and
atmospheric interaction with the south-west change triggered other fires in the region. The
fire spread into other areas of the Maroondah catchment, part of the Yarra Ranges
National Park (See Figure 5.12, Map 5.3). Late in the day residents of Healesville and Chum
Creek observed lightning striking the northern slopes of Mount Riddell, east of Healesville
(Blair pers comm, Rees pers comm). It ignited fires which proceeded across the north face
of Mount Riddell, an area which had been subjected to a prescribed burn in April 2008
(see Map 5.3 and Figure 5.11).
5.2.6 Containment and control of the Kilmore East Fire
The Royal Commission (2009) notes that the overall fire continued to burn throughout the
night of 7 February and in the following days. The fire was progressively secured as it
reached grassland. However, containment was difficult in forested areas, particularly in
the Maroondah catchment, Toolangi State Forest and Yarra Ranges National Park. In
particular, the fire caused considerable concern around Healesville over the next few days
as containment works, including back burning, continued. The fire was listed as
‘contained’ on 16 February.

24
Figure 5.11 View of Mount Riddell, from Chum Creek being treated with a
prescribed burn. (Photo: Sarah Rees, 10 April 2008)
Figure 5.12 View from Mt St Leonards fire tower looking south down Donnelly’s
Creek with Mount Riddell in the centre distance.
(Photo: Chris Taylor, April 2009)

25
Map 5.3 Fire affected land around Healesville.
(Image source: Earth Observatory. Image Date: 16 February 2009)
5.2.7 Areas affected by the Kilmore East fire
Using DSE base maps, the author has found the largest area of land tenure affected by the
Kilmore East fire is privately owned (42 per cent). This is inclusive of pastoral and agricultural
land, built up areas and privately owned native forest. State Forests made up 28 per cent
and National Parks, primarily the Kinglake National Park, made up 28 per cent. Plantations
fire affected comprised 2 per cent of the area fire affected. These percentages are
detailed in Figure 5.13.

26
Private
Land/Other
42%
Plantations
2%
State Forest
28%
National park
28%
Figure 5.13 Kilmore fire land tenure area affected

27
5.3 Murrindindi fire
5.3.1 Fire Danger Index and driving influences
According to Sullivan and McCaw (2009), on 7 February the temperature at the
Coldstream weather station (in the proximity of the ignition site of the Murrindindi fire) was
close to 45°C, with relative humidity down to 5 per cent, wind speeds exceeding 60km/h
and gusts reaching 90km/h. Combined with a drought factor exceeding 9.5, Sullivan and
McCaw (2009) detail a grassland fire danger index reaching 140 and a Forest Fire Danger
Index exceeding 100 (see Figure 5.14).
Figure 5.14 Coldstream weather station Forest Fire Danger Index and grassland fire danger
index data for 7 February 2009 from 9am to midnight.
(Source: Sullivan and McCaw 2009)
5.3.2 Ignition of the Murrindindi fire
The Royal Commission (2009) notes that fire spotters at the Mount Despair fire lookout tower
reported the Murrindindi fire to Broadford and Alexandra DSE offices just before 3pm on 7
February. The Commission reports that the point of origin was estimated to be two
kilometres south of Murrindindi on private land. Figure 5.15 details the area of ignition on
pastoral and agricultural land, north of the Old Murrindindi Sawmill. ABC TV’s Four Corners
broadcast allegations that the Murrindindi fire was deliberately lit (Four Corners b 2009). The
author has observed that the ignition point is entirely surrounded by farmland.
5.3.3 Spread of the Murrindindi fire
The Royal Commission (2009) notes that early observations described the fire behaviour as
severe. Flames were 20 metres high and the fire was spreading at a rate of around 12
km/h, with spotting to 15 kilometres. The Royal Commission reported that the fire spread
rapidly into the forests of the Black Range from agricultural lands and began spotting when
it reached the top of the range. The Mount Gordon tower observer, west of Marysville,
reported that the fire was crossing the Black Range at 4:20pm (Royal Commission 2009).

28
Figure 5.15 View from the entrance to the Old Murrindindi Sawmill looking north-west
towards the ignition area. This area consists of cleared farmland.
(Photo: Jonathan La Nauze, April 2009)
Fire spotter, Mr Paul Jones, observed the ignition of the Murrindindi Fire from the fire tower
on the summit of Mount St Leonards. Figures 5.16, 5.17 and 5.18 show the progression of the
fire. The photographs were taken 15 minutes, 20 minutes and 75 minutes after ignition. Mr
Jones (pers comm) stated that the fire began to exhibit extreme behaviour within 30
minutes of ignition and gained this intensity primarily within the Murrindindi State Forest.
Figure 5.16 Murrindindi Fire 15 minutes after ignition
(Photo: Paul Jones, 7 February 2009)

29
Figure 5.17 Murrindindi Fire 20 minutes after ignition
(Photo: Paul Jones, 7 February 2009)
Figure 5.18 Murrindindi Fire 75 minutes after ignition
(Photo: Paul Jones, 7 February 2009)
The Royal Commission (2009) reported that the fire moved across the Black Range very
quickly and was spotting long distances. At 4:30pm, spot fires and ember attack were
reported in the Narbethong area. Sullivan and McCaw (2009) indicate that fire spread
was likely to have been the result of “substantial spotting”.
Figure 5.19 details the view across the lower Acheron Valley looking towards Mount
Gordon, north-west of Marysville. By 4:15pm, Paul Jones observed the fire spotting into the
Acheron Valley. He observed fire activity along Strickland Spur. The main fire front
progressed through the eastern slopes of the Black Range and into the plantations
between the state forest and the farmland straddling the Acheron River.

30
Figure 5.19 View of the Lower Acheron Valley
(Photo: Chris Taylor, April 2009)
On site visits to the fire affected areas, the author observed evidence of intense fire activity
(Figure 5.20). These observations correlate with the fire severity map developed by DSE
(see map 5.5).
Figure 5.20 Fire affected Mountain Ash – Black Range
(Photo: Chris Taylor, April 2009)
The fire progressed through forest areas of the Black Range which had been subjected to
extensive past and current logging and forestry operations (DSE forest interactive maps
accessed 24 April 2009). The author observed that the conical crowns of trees
regenerating from past logging operations were severely fire affected. (Refer Figure 5.21).

31
Figure 5.21 Fire affected trees regenerating from past logging along the
ridge of the Black Range. (Photo: Chris Taylor, April 2009)
As the fire went through Narbethong and up into the Mount Gordon forest, it severely
impacted (mostly class 2 fire severity) an area previously treated with a prescribed burn in
2008 (DSE fire interactive map, accessed 12 April 2009). The Royal Commission reports that
a back burn was attempted at around 6:00pm east of the town of Marysville, although it
was quickly abandoned “when it became hazardous and was going to be overrun by the
main fire”. By 6:30pm, the Commission notes, the south-westerly wind change had arrived
in Marysville. DSE advised the Commission that the wind change had arrived earlier and
passed through the area with greater force than forecast. Lightning from intense smoke
plumes and atmospheric interaction with the south-west change triggered other fires
between the Murrindindi and Bunyip fires (Royal Commission 2009). The progression of the
fire is detailed in Maps 5.4 and 5.5.

32
Map 5.4 Murrindindi fire from ignition to the Yarra Ranges National Park.
(Image Source: Earth Observatory. Image date: 16 February 2009)

33
Map 5.5 Severity of Murrindindi fire from ignition to the Yarra Ranges National Park
(Image Source: DSE)
34
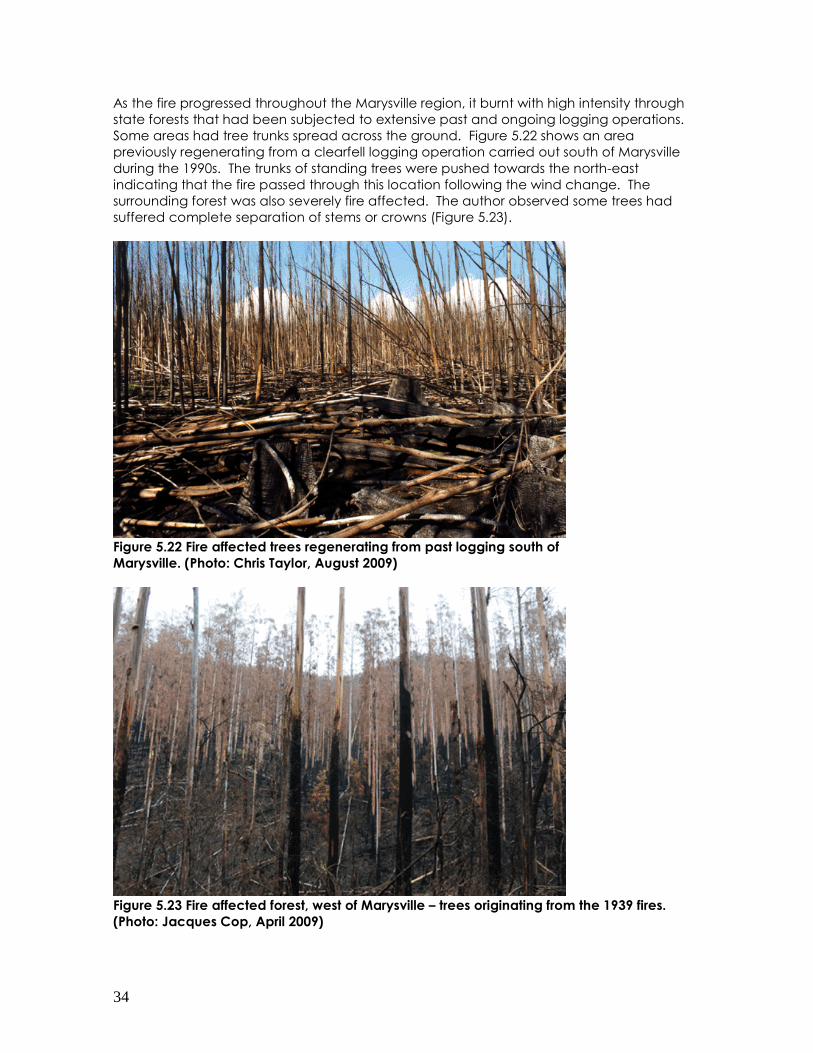
As the fire progressed throughout the Marysville region, it burnt with high intensity through
state forests that had been subjected to extensive past and ongoing logging operations.
Some areas had tree trunks spread across the ground. Figure 5.22 shows an area
previously regenerating from a clearfell logging operation carried out south of Marysville
during the 1990s. The trunks of standing trees were pushed towards the north-east
indicating that the fire passed through this location following the wind change. The
surrounding forest was also severely fire affected. The author observed some trees had
suffered complete separation of stems or crowns (Figure 5.23).
Figure 5.22 Fire affected trees regenerating from past logging south of
Marysville. (Photo: Chris Taylor, August 2009)
Figure 5.23 Fire affected forest, west of Marysville – trees originating from the 1939 fires.
(Photo: Jacques Cop, April 2009)

35
5.3.4 Fire severity and forest age classes in the O’Shannassy
To the south of Marysville, the fire was spotting on the western slopes of Mount Strickland,
starting new fires in the O’Shannassy water catchment, part of the Yarra Ranges National
Park (Jones pers comm). Tolhurst (2009) told the Royal Commission the Poley fire tower
camera (located inside the O’Shannassy catchment) recorded spotting at 4:43pm. It
filmed embers landing around the tower at 6pm and intense fire there at 6:44pm.
The O’Shannassy catchment supports large areas of mature and old growth forests,
interspersed with cool temperate rainforest communities. Map 5.6 shows the extent of pre-
fire forest age classes and rainforest communities (right map). The fire severity overlay
indicates the high intensity of the fire (Severity class 1 and 2) as it progressed into the
catchment from adjoining younger stands in the state forests (left map).
Map 5.6 O’Shannassy Water Supply Catchment.
Left: Fire Severity map (Source DSE, 2009) Right: Age classes of forests and rainforest
communities. (Source Mackey et al, 2002)
Map 5.6 shows as the fire progressed into old and mature stands of forest intensity
decreased from Severity Class 1 and 2 to Class 3. The mapping shows the tree crowns in
these areas are moderately scorched. The fire decreased again to Class 4 in a core
rainforest community. On the northern slopes of Mount Ritchie, where younger trees
originating from the 1939 fires occur, the fire severity was higher (Class 2), with some parts
of the crown entirely consumed (Class 1). Further south, fire severity decreased significantly

36
to Classes 4 and 5, with light scorching or no scorching of the crown and some or no fire
impact to the understorey.
On a visit to an area known as the Cumberland Reserve (a mix of mature, old growth forest
and cool temperate and pure rainforest in the northern section of the Armstrong
catchment) the author noted varied fire intensities in varied vegetation communities. This
reserve adjoins the O’Shannassy catchment and shares similar vegetation. The younger
stands of forest, south of the Cumberland Reserve, were severely fire affected (DSE 2009).
As the fire burnt into the Cumberland Reserve the crowns of numerous mature and old
trees were severely scorched. As the fire moved into areas of cool temperate mixed
rainforest the fire’s intensity decreased. The crowns of numerous tall mature and old trees
sustained little or no scorching. An example is featured in Figure 5.24.
Figure 5.24 Fire affected forest in the
Cumberland Reserve, Yarra Ranges
National Park.
(Photo: Chris Taylor, August 2009)
Overall, this phenomenon appears congruent with the results detailed in Mackey et al
(2002). In their discussion of environmental controls on vegetation structure and fire
regimes in the Central Highlands of Victoria the authors explain:
“Old trees have thicker bark and are more fire-resistant than younger
stems. Therefore, more trees are likely to survive in old growth stands
following an unplanned (wild) fire, leading to a multi-aged stand
structure. This is consistent with dendrochronological studies by Banks,
who found that several large Mountain Ash trees he examined had

37
survived many (more than seven) fire events. In additional,
Lindenmayer et al found that fire scars characterised many large
living trees surveyed on field sites. Very old forests (200+ years old) are
likely to have been exposed to fire at some stage during their
standing life. If a fire occurs when a stand is old, it is less likely to be a
complete stand-replacing event” (Mackey et al 2002:85).
In seeking a scientific explanation for why younger wet forests experienced higher fire
severity, Florence (1994) provides an interesting commentary:
“The amount of litter which accumulates on the floor of the old-
growth forest may be appreciably less that that which accumulates
at earlier growth stages. Where regrowth develops following a severe
perturbation, the forest floor biomass builds up rapidly to a point of
peak fuel energy storage during the forests’ rapid early growth stage.
This point may be as soon as 35 years in stands of fast-growing
species. Beyond this point, there will be a progressive reduction in the
forest floor biomass as wood volume production and the rate of
crown expansion and litter fall decline, as the shrubby understorey
breaks up, and the litter is accumulated at the point of peak energy
storage is incorporated into the soil organic matter”.
5.3.5 Fire intensity and thinning (logging) operations
On the night of 7 February and early morning of 8 February, the fire progressed in a north-
easterly direction through the heavily forested regions of the Upper Taggerty, the Rubicon
and Royston Valleys and Lake Mountain.
Much of this area has been subjected to intensive logging and forestry operations. In
several areas that were previously clearfell logged and regrown during the 1970s, forestry
has conducted further logging on these sites using the silvicultural practice of commercial
thinning where approximately half of the regenerating stand is removed for sale generally
as pulpwood.
Figure 5.25 shows pre and post-fire images of a thinnings coupe in the Blue Range area
where thinned Alpine Ash stands have been severely scorched. The author observed that
some of the surrounding forest sustained lower intensities of fire, or was not burnt at all.
Figure 5.26 shows the boundary of the thinnings coupe and the adjoining un-thinned stand
regenerating from a previous logging operation. The understory sustained scorching, but
the canopy remained un-scorched and green.
To the south-west of the thinnings coupe, the author observed unburnt mature forest areas
near the junction of Quartz Creek and Blue Range roads (Figure 5.27). This area is between
forests that sustained severe fire impact to the south-west and the thinnings coupe to the
north-east. The author assumes the fire was decreasing in intensity as it approached this
area, with the Forest Fire Danger Index decreasing following the wind change. The
evidence is in the unburnt and moderately fire affected forest areas in the surrounding
region. However, it is apparent the fire increased its intensity in the recently thinned stand.

38
Figure 5.25 Thinned stand of Alpine Ash, Quartz Creek Road, Blue Range.
Left Image looking down-slope (September 2008). Right Image up-slope (May 2009).
(Photos: Chris Taylor,)
Figure 5.26 View from the thinned coupe to the adjoining un-thinned stand
regrowing from clearfell logging in the 1970s. (Photo: Chris Taylor, May 2009)

39
Figure 5.27 Un-logged forest around Quartz Creek Road, south-west of the
thinned coupe in Figure 5.26. (Photo: Chris Taylor, May 2009)
Buckley and Corkish (1991) note in their Victorian based experiments with thinning
operations during 1988-89 that;
“The thinning operation increased the quantity and changed the
distribution of fuels on the forest floor. The felling and snigging partly
flattened the shrub layer and therefore decreased the hazard of this
fuel component and, depending upon the type of harvesting system
used and the harvesting prescriptions applied to the operation, slash
fuels were heaped in out rows and broadcast over the coupe.
Harvested and culled stems greater than ten cm DBHOB increased
the fine fuel load ..… by about 5 t/ha of leaf material and by about
5t/ha of twig material. These dead fine fuels dried faster than the fine
fuels in the uncut forest and were therefore more flammable.
Fuel loads in the diameter classes of 10.1 to 30.0 cm and greater than
30.0 cm did not change significantly after thinning, as judged by the t-
test. However, thinning operations increase significantly the average
course fuel load in the 2.6 to 10.0 cm diameter class from 11.3 t/ha to
25.1 t/ha, an increase of about 14 t/ha.”
This overall hazard increase is identified in Forestry Tasmania’s Technical Bulletin 13,
Thinning Regrowth Eucalypts, which references work by fire experts Phillip Cheney and
James Gould:
“One of the major planning constraints associated with thinning is the
higher level of fuel present after the operation. It is not considered
feasible in Tasmania to carry out fuel reduction burns in thinned
coupes because of the high fuel loads and the sensitivity of the
retained trees to fire. The location of thinned coupes amongst
40
conventionally logged coupes is problematic, as it is not
recommended that any regeneration burns take place within two
kilometres of areas with high levels of flash fuel within two years of
harvest” (LaSala 2001).
“Tree crowns (heads), bark and other harvest residue make up the
fuel load. The climate on the floor of the forest is altered by thinning,
with higher wind speeds and air temperatures, lower humidity and
lower moisture content in the fuel itself. Understorey vegetation
characteristics change because of these changes to the
microclimate, especially increased light. Bracken ferns and cutting
grass may grow vigorously, each having a far higher flammability than
the replaced woody species” (LaSala 2001).
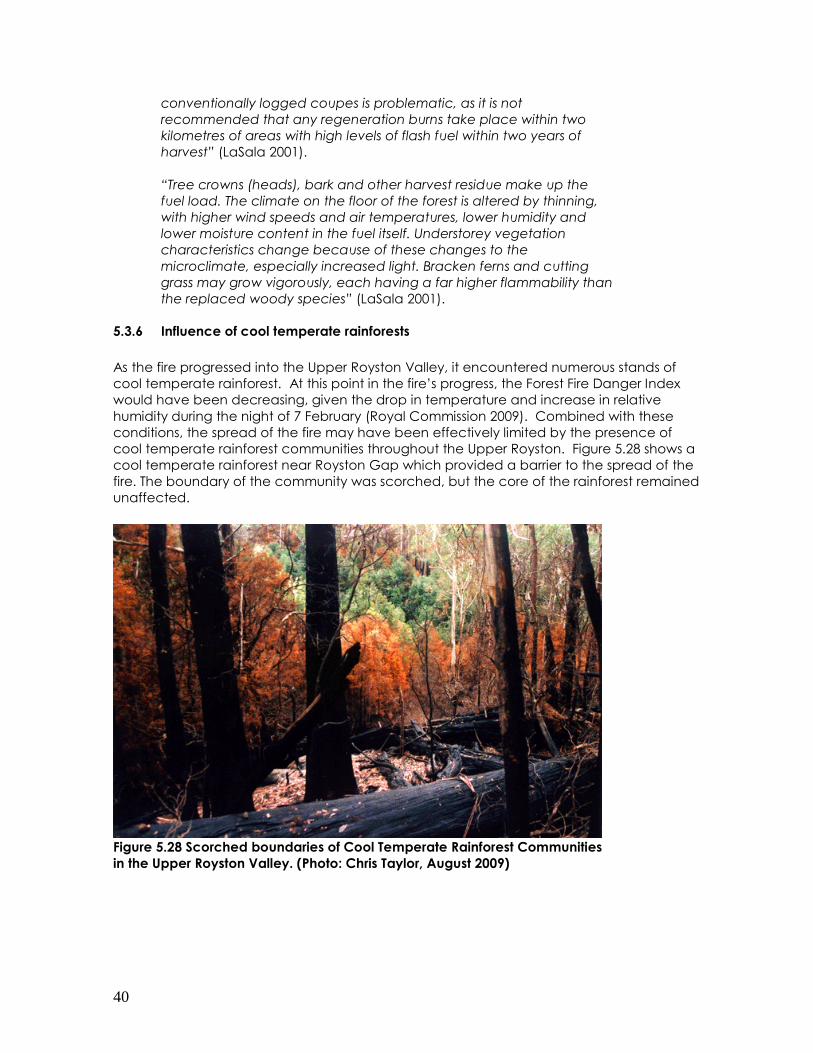
5.3.6 Influence of cool temperate rainforests
As the fire progressed into the Upper Royston Valley, it encountered numerous stands of
cool temperate rainforest. At this point in the fire’s progress, the Forest Fire Danger Index
would have been decreasing, given the drop in temperature and increase in relative
humidity during the night of 7 February (Royal Commission 2009). Combined with these
conditions, the spread of the fire may have been effectively limited by the presence of
cool temperate rainforest communities throughout the Upper Royston. Figure 5.28 shows a
cool temperate rainforest near Royston Gap which provided a barrier to the spread of the
fire. The boundary of the community was scorched, but the core of the rainforest remained
unaffected.
Figure 5.28 Scorched boundaries of Cool Temperate Rainforest Communities
in the Upper Royston Valley. (Photo: Chris Taylor, August 2009)

41
Figure 5.29 Extent of fire limited by Cool Temperate Rainforest Community in
the Upper Royston Valley. (Photo: Chris Taylor, August 2009)
The fire was seen on most occasions to penetrate a short distance inside the boundary of
the cool temperate rainforest community then stop. Barker (1992) stated that there is a
gradient of fire frequency decreasing from sclerophyll forest to rainforest. He noted also
that fuel loads decrease along this gradient which includes increasing age of the forests.
Figure 5.30 Extent of fire limited by cool temperate rainforest community in
the Upper Royston Valley. (Photo: Chris Taylor, August 2009)
Beyond the cool temperate rainforest community near Royston Gap, the author observed
some areas of Alpine Ash dominated forest communities were unaffected by the fire
(Figure 5.30). However, this was not consistent, as spotting had caused more fires further

42
north-east of Lake Mountain (downwind of the fire). Within the region, cool temperate
rainforests played a significant role in limiting the spread of these fires.
5.3.7 The containment and control of the Murrindindi Fire
The Royal Commission (2009) noted that the Murrindindi fire continued to burn for 26 days
before it was contained. The Commission recognised that this was after an immense effort
to construct control lines and back burns to stop the fire moving south and threatening
Melbourne’s water catchments. The fire was listed as ‘contained’ at 6pm on 5 March and
‘under control’ at 11am on 13 March.
5.3.8 Areas affected by the Murrindindi fire
The Murrindindi fire, initially ignited on pastoral and agricultural land (Four Corners b 2009),
burnt primarily through state forest by the time it began spotting around Narbethong and
Marysville (Royal Commission 2009). Of the area burnt in this fire, 68 per cent was in state
forests. National Parks then made up the next largest area, comprising 18 per cent of the
area burnt. Private land comprised 11 per cent and plantations the remainder at 3 per
cent. This is illustrated in Figure 5.31.
Private Land/Other
11%Plantations
3%
State Forest
68%
National and State
Park
18%
Figure 5.31 Murrindindi fire land tenure area affected.

43
5.4 Overall Murrindindi/Kilmore complex
Using DSE maps, the author found state forest comprised the largest tenure at 48 per cent
of the total area affected by the Kilmore East/Murrindindi fire complex. The next largest
land tenure was privately owned land at 26 per cent, National Parks comprised 23 per
cent, with timber plantations comprising the remaining 3 per cent. This is detailed in Figure
5.32.
Private
Land/Other
26%
Plantations
3%
State Forest
48%
National State
Park
23%
Figure 5.32 Kilmore/Murrindindi fire complex land tenure area affected.

44
5.5 Churchill fires
5.5.1 Fire Danger Index and driving influences
According to Sullivan and McCaw (2009), on 7 February the Morwell weather station,
which monitors the region covering the town of Churchill, recorded temperature above
45°C, relative humidity down to 5 per cent and wind speeds at 45km/h gusting 60km/h.
Combined with a drought factor above 9.5, Sullivan and McCaw (2009) detail a grassland
fire danger index reaching 80 and a Forest Fire Danger Index exceeding 120. Refer to
Figure 5.33.
Figure 5.33 Morwell weather station Forest Fire Danger Index and Grassland Fire Danger
Index data for 7 February 2009 from 9am to midnight. (Source: Sullivan and McCaw 2009)
5.5.2 Ignition of the Churchill fire
The Royal Commission (2009) notes that at 1:33pm a fire was reported in open country on
the south side of Glendonald Road, 3 km south-east of Churchill (See Figure 5.34). Sullivan
and McCaw (2009) quote reports that the fire was ignited in roadside grass and rapidly
spreading uphill into a blue gum plantation. According to media reports the fire was
deliberately lit (AAPb 2009).
5.5.3 Spread of the Churchill fire
Sullivan and McCaw (2009) explain that initially the fire was predominantly in blue gum,
shining gum and pine plantations with half of the area eventually burnt being 5-15 year-old
shining gum and pine plantations (refer to Figures 5.35, 5.36 and 5.37). A further third of the
area eventually burnt was mature native forest with stands of tall wet-sclerophyll forest with
moist understorey (refer to Figure 5.38). Farmlets and dryland agricultural lands were also
burnt during the latter stages of the fire.

45
Figure 5.34 Hardwood plantation along Glendonald Road.
(Photo: Chris Taylor, April 2009)
Figure 5.35 Severely fire affected hardwood plantations south east of
the ignition area. (Photo: Chris Taylor, April 2009)

46
Figure 5.36 Severely burnt Radiata Pine plantations south-east of the
ignition area. (Photo: Chris Taylor, April 2009)
Figure 5.37 Severely burnt Radiata Pine plantations south east of the
ignition area. (Photo: Chris Taylor, August 2009)
47
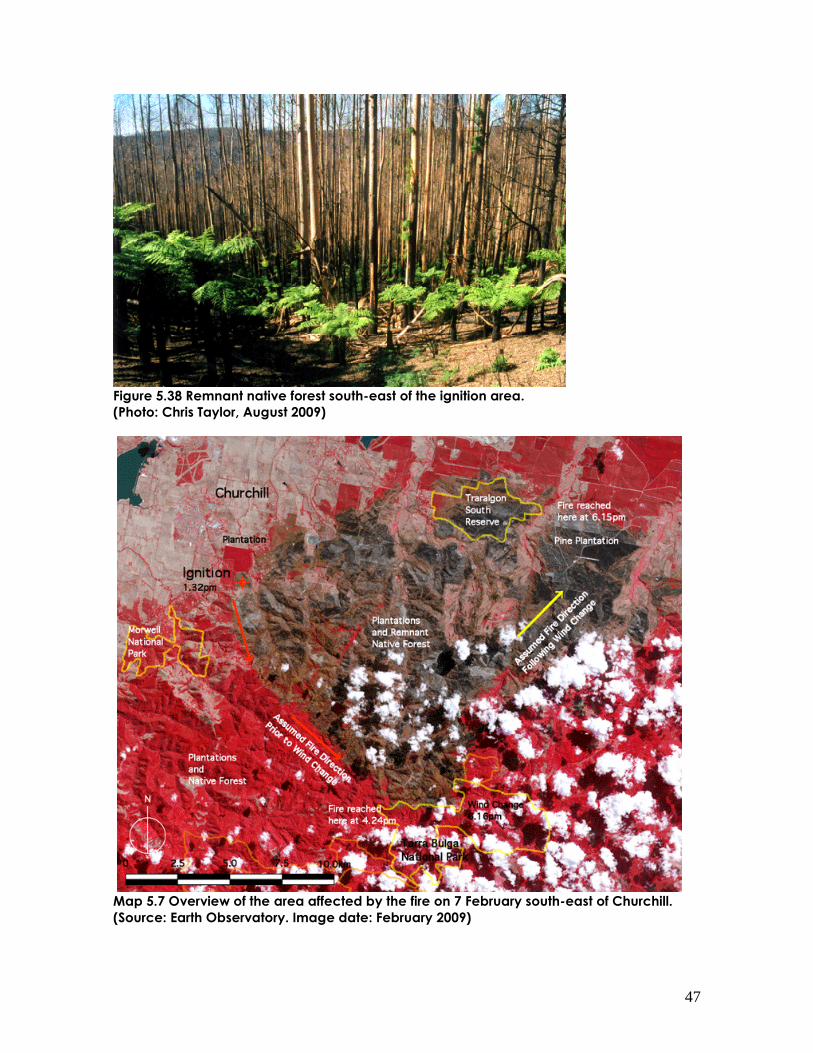
Figure 5.38 Remnant native forest south-east of the ignition area.
(Photo: Chris Taylor, August 2009)
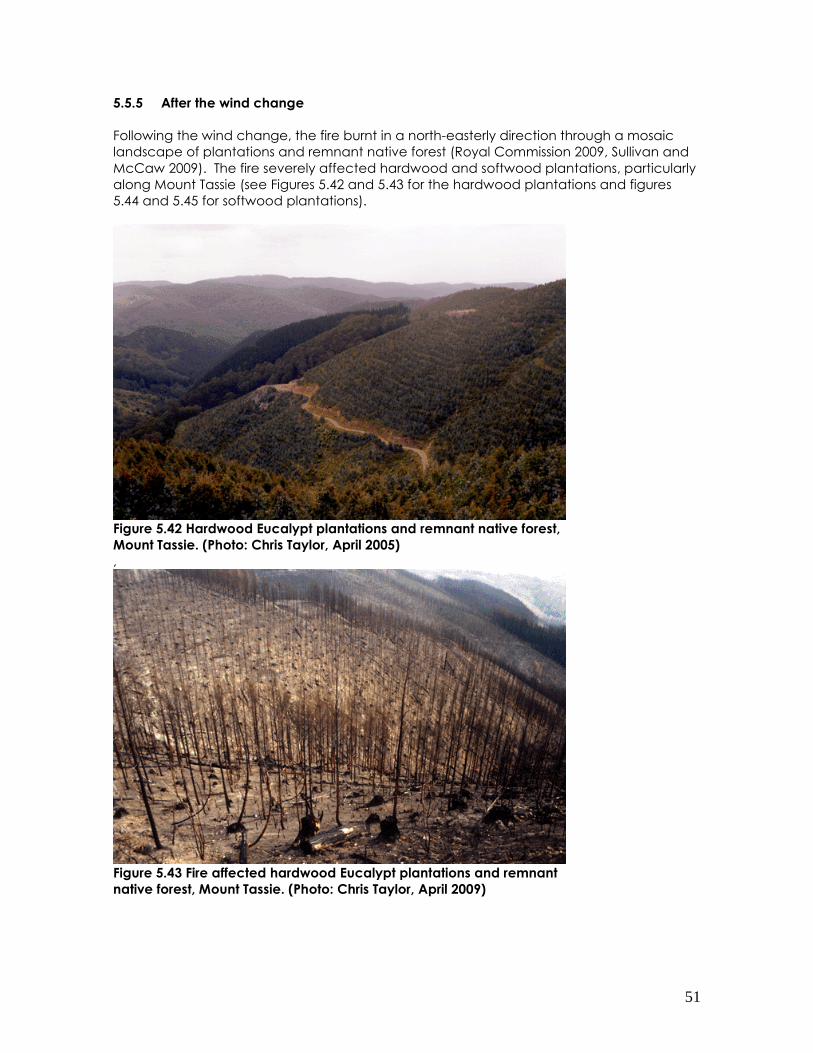
Map 5.7 Overview of the area affected by the fire on 7 February south-east of Churchill.
(Source: Earth Observatory. Image date: February 2009)

48
Map 5.8 Severity of the Churchill fire. (Source: DSE 2009)
The Royal Commission (2009) notes that by 5:17pm the main fire front was approaching Mount Tassie, with spot fires on the eastern side of the mountain. The wind change at around 6pm, as noted by the Royal Commission (2009), meant 13 kilometres of the eastern
flank of the fire, was burning through steep, inaccessible country. These areas were noted
by the Commission to have carried high fuel loads in the pine and blue gum plantations,
along with remnant native forest. The Commission notes this had a progressive impact on
areas such as Hazelwood South, Koornalla, Traralgon South, Callignee, Callignee South,
Callignee North, Jeeralang North, Devon, Yarram and Carrajung South. By around 8pm,
the fire was still burning in north-easterly direction, but had slowed.

49
Sullivan and McCaw (2009) note there was likely to have been substantial spotting outside
the final perimeter of the main fire. A number of long distance spots from the initial fire
reached 22 kilometres from the main fire perimeter. The Royal Commission (2009) notes
that at 4:50pm multiple spot fires were reported around the township of Yarram. Sullivan
and McCaw report that two of these spots developed to burn out about 550 and 2000
hectares in area, mainly following the south-westerly wind change.
The Royal Commission (2009) notes that the wind change between 6:00pm and 6:30pm
altered the direction of the fire, resulting in spotting towards Callignee, Traralgon South
and Koornalla. At 6:04pm, a spot fire was reported nine kilometres east of Yarram on the
South Gippsland Highway. At 6:05pm another spot fire was reported on the Hyland
Highway, four kilometres north of Yarram. This fire burnt into the Won Wron State Forest. At
6:10pm a spot fire was reported on the Currajung Woodside Road, four kilometres east of
Carrajung South.
5.5.4 Southern extent of main fire
The fire progressed in a south-easterly direction, extending to the northern boundary of the
Tarra Bulga National Park (See Map 5.7). The fire burned the northern periphery of the
National Park, with several areas affected by spotting as observed by the author,
however, the National Park remains primarily unaffected by the fire (see figure 5.39).
Figure 5.39 Tarra Bulga National Park. (Photos: Chris Taylor, April 2009)
The author also observed spotting inside the National Park that did not develop into major
fires. Figure 5.40 shows evidence of a low severity spot fire along the Traralgon-Balook
Road within the park boundary.

50
Figure 5.40 Evidence of a spot fire inside Tarra Bulga National Park.
(Photo: Chris Taylor, April 2009)
Figure 5.41 Cool temperate rainforest along fire
boundary. (Photo: Chris Taylor, April 2009)
The author observed the extent of the spot fire appeared to be limited by the cool
temperate rainforest on the down slope of the road (see Figure 5.41). The wind change at
around 6pm may have prevented the main fire front from entering the National Park.
Vegetation communities may have limited the extent and severity of spotting.
51
5.5.5 After the wind change
Following the wind change, the fire burnt in a north-easterly direction through a mosaic
landscape of plantations and remnant native forest (Royal Commission 2009, Sullivan and
McCaw 2009). The fire severely affected hardwood and softwood plantations, particularly
along Mount Tassie (see Figures 5.42 and 5.43 for the hardwood plantations and figures
5.44 and 5.45 for softwood plantations).
Figure 5.42 Hardwood Eucalypt plantations and remnant native forest,
Mount Tassie. (Photo: Chris Taylor, April 2005)
,
Figure 5.43 Fire affected hardwood Eucalypt plantations and remnant
native forest, Mount Tassie. (Photo: Chris Taylor, April 2009)

52
Figure 5.44 Radiata Pine plantation coupe, Mount Tassie.
(Photo: Chris Taylor, August 2008)
Figure 5.45 The same Radiata Pine plantation coupe Mount Tassie.
(Photo: Chris Taylor, April 2009)
To the north-east of the plantations and private land, the fire burnt into the Traralgon Flora
and Fauna Reserve. Almost the whole reserve was affected by the fire. The fire reached
its north-eastern extremity at the reserve and a neighbouring plantation to the east (Map
5.7).
5.5.6 Containment and control of the Churchill fire
While the extent of the fire was largely halted on 8 February, some areas remained
inaccessible and burning continued in heavy fuel areas. The fire was listed as contained
at 5pm on 19 February (Royal Commission 2009).

53
5.5.7 Areas affected by the Churchill fire
In terms of land tenures affected, the Churchill fire is quite different from the Kilmore East
and Murrindindi fires. The Churchill fire was ignited in roadside grass alongside a timber
plantation (Sullivan and McCaw 2009) and primarily affected a combination of private
and leased lands, some of which consist of a mosaic of plantation and remnant native
forest.
Using DSE base maps, the author found a combination of private and other land tenures
(leased land) comprised 53 per cent of the fire affected area. Plantations, which are
dispersed throughout the affected area, comprised 30 per cent, the state forests affected,
primarily around and north of Yarram, comprised 13 per cent and the National Parks and
conservation reserves, primarily the Traralgon South Conservation Reserve impacted later
in the day, comprised 4 per cent (refer figure 5.46).
National Park/
Conservation
Reserve
4%
State Forest
13%
Plantations
30%
Private
Land/Other
53%
Figure 5.46 Churchill fire land tenure area affected – including areas affected
by spot fires.

54
6.0 Other fires in Victoria
6.1 Delburn fire, late January 2009
During the first phase of the heatwave in late January 2009, several fires were deliberately
lit in the Delburn, Mirboo North and Boolarra areas (ABCf 2009). Most of the ignition points
were in the vicinity of the Strzelecki Highway (Zent pers comm, author’s observation, see
figure 6.1). Using DSE base maps, the author found approximately 6,300 hectares of
plantation, farmland and native forests were fire affected.
Figure 6.1 One of the ignition points along the Strzelecki Highway.
Ignition points are marked with Victoria Police tape (centre).
(Photo: Chris Taylor, April 2009)
Timber plantations comprised 47 per cent of the land affected by the Delburn fire. Private
land (26 per cent) and state forest (27 per cent) comprised the remainder. No National
Parks or reserves in this area were affected by the fire (see Figure 6.2).

55
Private Land/Other
26%
Plantations
47%
State Forest
27%
National park
0%
Figure 6.2 Delburn fire land tenure area affected.

56
6.2 Bunyip fire
Several fires were ignited by lightning in the Bunyip State Park following the first phase of
the late January heatwave. Due to the higher humidity percentages and lower fire
danger index, fire-fighting personnel were able to contain the fire (Jones pers comm).
However, several fires were deliberately lit on 4 February 2009 (Miller 2009). It was one of
those fires that intensified on 7 February (Jones pers comm).
As previously discussed, the Bunyip fire started in the Bunyip State Park. State forest
comprised the largest area affected at 43 per cent. Private land and the state park
comprised the next largest areas at 29 per cent and 28 per cent respectively. The author
calculated these percentages using DSE base fire maps. These percentages are detailed
in Figure 6.3.
Private
Land/Other
29%
Plantations
0%
State Forest
43%
State Park
28%
6.
3 Bunyip fire land tenure area affected.

57
6.3 Erica fire
Late in the day of 7 February 2009, lightning ignited several fires in the Gippsland region.
One of these was the fire north of the town of Erica (Waller 2009). The fire primarily burnt
around the vicinity of the intersection of the South Face Road with the Moe Erica Road.
Using DSE base maps, the author has calculated that state forest comprised 55 per cent of
the fire affected areas and the Baw Baw National Park 45 per cent. No private land was
affected (see figure 6.4).
Private Land/Other
0%
Plantations
0%
State Forest
55%
National park
45%
Figure 6.4 Erica fire land tenure area affected.

58
6.4 Beechworth fire
At 6pm on 7 February 2009, tree branches falling on powerlines are believed to have
ignited the fires that burnt east of the town of Beechworth (Waller 2009). In total, 31,000
hectares were fire affected (Royal Commission 2009). Using DSE base maps, the author has
determined that state forest comprised 51 per cent, private or leased land 41 per cent and
plantations 8 per cent of the affected area (see figure 6.5).
Private Land/Other
41%
Plantations
8%
State Forest
51%
National Park
0%
Figure 6.5 Beechworth fire land tenure area affected.

59
6.5 Redesdale fire
At 3:11pm on 7 February 2009, a fire was ignited alongside a road between Bendigo and
Heathcote (Royal Commission 2009). It is not yet clear what started the fire. Using DSE
base maps, the author has calculated the fire affected 9,500 hectares, of which private
land comprised 97 per cent, with the remainder being state forest. This fire did not affect
any National Park area (see figure 6.6)
Private Land/Other
97%
Plantations
0%
State Forest
3%
National park
0%
Figure 6.6 Redesdale fire land tenure area affected.

60
6.6 Daylesford fire
On 23 February 2009 a fire was ignited south of the town of Daylesford (Royal Commission
2009). Using DSE base maps, the author has determined that, of the 2,658 hectares fire
affected, state forest comprised 51 per cent and private land 48 per cent. Plantations
comprised the remaining 1 per cent (see figure 6.7)
Private Land/Other
48%
Plantations
1%
State Forest
51%
National park
0%
Figure 6.7 Daylesford fire land tenure area affected.

61
6.7 Fires affecting single land tenure
At 12:26pm on 7 February 2009 failing power infrastructure ignited a fire west of the town of
Horsham (Tobin 2009). The fire affected a total area of 2,200 hectares, burning mostly on
private land (Royal Commission 2009). Other fires were ignited in the west of Victoria, at
Coleraine (at approximately 12:36pm) and Weerite (at approximately 1:17pm) (Royal
Commission 2009). Failing power infrastructure is believed to have ignited these fires which
primarily affected private land (Tobin 2009).
Prior to 7 February 2009 lightning ignited a fire in remote state forest near the town of Dargo
(Waller 2009). Upon measuring the fire affected area on DSE base maps, the author notes
that the fire burnt only through state forest and affected a total area of 13,640 hectares.
No private property or National Parks were affected.
On 8 February lightning ignited a fire on Mount Cathedral, north of Sealers Cove at Wilsons
Promontory (Royal Commission 2009, Parks Victoria 2009). The fire was confined to Wilsons
Promontory National Park and affected a total area of 25,200 hectares (DSE 2009). The fire
affected the damp forests of Mount Cathedral in varying intensity, however, the fire
intensified once it spread to the tea tree dominated vegetation west of Five Mile Beach
and north towards Chinaman’s Swamp.

62
7.0 Overall area fire affected
For the majority of fires ignited throughout the heatwave period of late January and early
February 2009, around 430,000 hectares of land has been affected by fire (Royal
Commission 2009). Based on the mapping analysis conducted by the author using DSE Fire
and Land Tenure Map overlays, approximately 43 per cent of fire-affected land analysed
was state forest, private land 29 per cent, National Parks 23 per cent and plantations 5 per
cent (see Figure 7.1). In relation to private land, plantations and state forests, many of
these areas have experienced moderate to significant human disturbance through the
removal of the original vegetation, logging or urban development.
Private Land/Other
29%
Plantations
5%
State Forest
43%
National park
23%
Figure 7.1 Overall fire affected land tenure percentages across Victoria.

63
8.0 Fire danger and changing climate patterns
8.1 Overview
There has been much commentary over the influence changing climate patterns may
have had on the intensity of the fires of 7 February 2009. This section provides an overview
of a report that was prepared for the Climate Institute detailing observed and predicted
FDI ratings for south east Australia under changing climate patterns.
8.2 Report by Lucas, Hennessy, Mills and Bathols
In September 2007, a report was prepared for the Climate Institute entitled Bushfire
Weather in Southeast Australia: Recent Trends and Projected Climate Change Impacts.
The report updated the findings of a 2005 study, with a wider range of observations
analysed and additional sites included. The authors introduced two new fire danger
categories for the report: ‘very extreme’ and ‘catastrophic’.
In the study, the authors found the number of ‘very high’ fire danger days generally
increased by 2-13 per cent by 2020 for the low scenarios and 10-30 per cent for the high
scenarios. By 2050, the range is much broader, generally 5-23 per cent for the low
scenarios and 20-100 per cent for the high scenarios. For the number of ‘extreme’ fire
danger days, the authors found these generally increased 5-25 per cent by 2020 for the
low scenarios and 15-65 per cent for the high scenarios. By 2050, the authors found
increases were generally 10-50 per cent for the low scenarios and 100-300 per cent for the
high scenarios. These figures are detailed in Table 8.1.
2020 2050
Low global
warming
(0.4°C)
High global
warming
(1.0°C)
Low global
warming
(0.7°C)
High global
warming
(2.9°C)
Very high +2-13% +10-30% +5-23% +20-100%
Extreme +5-25% +15-65% +10-50% +100-300%
Table 8.1 Percent changes in the number of days with very high and extreme fire weather –
2020 and 2050, relative to 1990. (Source: Lucas et al 2007)
The authors found ‘very extreme’ days tended to occur only once every 2 to 11 years at
most sites. By 2020, the low scenarios showed little change in frequency, although notable
increases occur at some of the inland sites. The authors found the 2020 high scenarios
indicated ‘very extreme’ days might occur about twice as often at many sites. By 2050, the
low scenarios were similar to those for the 2020 high scenarios, while the 2050 high
scenarios indicate a four to five-fold increase in frequency at many sites.
For ‘catastrophic’ fire days, the authors generally found little or no change in the
frequency of occurrence at the sites, where 12 out of the 26 sites analysed had records of
catastrophic fire danger days. For the 2020 high scenarios, the authors found
‘catastrophic’ days would occur at 20 sites, 10 of which have return periods of around 16
years or less. By 2050, the authors found the low scenarios would be similar to those for the
2020 high scenarios. The authors found the 2050 high scenarios exhibited ‘catastrophic’

64
days occurring at 22 sites, 19 of which would have return periods of around eight years or
less, while seven sites have return periods of three years or less.
Lucas et al (2007) found upward trends suggestive of increased fire danger are being
observed during the most active period of the fire season and, to a lesser degree, in the
surrounding seasons. The authors found that the annual cumulative Forest Fire Danger
Index displayed a rapid increase in the late 1990s to the early 2000s at many locations.
Increases of 10-40 percent between 1980-2000 and 2001-2007 are evident at most sites.
Lucas et al (2007) found that the strength of these increases at the majority of sites
analysed equalled or exceeded the changes originally estimated to occur by 2050 in the
different projections. The hypothesis Lucas et al (2007) posit in their study is that the
naturally occurring peak in fire danger, due to interdecadal variability, may have been
exacerbated by climate change. This hypothesis remains to be fully tested in the coming
years.
8.3 Did climate change exacerbate the fires of 7 February?
Did climate change exacerbate the fires of 7 February? Karoly (2009) believes it is highly
likely changing climate patterns are influencing the frequency and intensity of fire danger
days occurring in South East Australia. He states in his summary, posted online (Karoly
2009), that unprecedented records are being set for maximum temperatures, the number
of consecutive days of high temperatures, low levels of relative humidity, extreme low
levels of fuel moisture content and extended periods of low rainfall, of which, parts of the
fire affected areas have experienced the lowest on record for the start of 2009. These
influence the increase of the Fire Danger Index, through increases in the temperature,
decrease in relative humidity, and increase in the drought factor. Where extreme to
catastrophic fire danger days occur, these inputs to the Fire Danger Index can overpower
low fuel levels to produce fires of very high intensity and spread (Tolhurst 2009 public
lecture April 2009, Melbourne University).
9.0 Fuel reduction burns and extreme Fire Danger Index With observations and predictions of increasing intensities and occurrences of high, very
high, extreme and catastrophic FDI days, as outlined in Lucas et al (2007), prescribed
burning is less likely to slow and suppress head fires. McCarthy and Tolhurst (2001) used field
data to develop a model indicating that the benefits of a prescribed burn decrease as the
Fire Danger Index increases. They constructed a model, using the overall fuel hazard at the
final control line and the Fire Danger Index, for predicting the probability of whether a
previous prescribed burn would slow the head fire of a subsequent wildfire. McCarthy and
Tolhurst (2001) constructed the model using a logistic procedure as follows:
Probability of slowing head fire = 1- (1/1 + (1/eb)
where b = (1.37*OVEROL) + (0.035*FDI) – 4.77
The graph used in McCarthy and Tolhurst (2001) details the probability to a Fire Danger
Index of 100. As the Fire Danger Index significantly exceeded a FFDI rating of 100 on 7
February, a modified graph has been constructed for this report using the above formula.
Note this presumably exceeds the range of experimental data but is assumed to provide a

65
reasonable indication of general expected trends where FFDI exceeds 100. The graph is
featured in Figure 9.1.
Figure 9.1 Probability of previous prescribed burn slowing the head fire of a subsequent
wildfire.
The Forest Fire Danger Indices, included on the extrapolated graph, suggest the broad
probability of previous prescribed burns slowing the head fires that occurred in the 7
February fires. For the Kilmore Gap FFDI observations, the probability of previous prescribed
burns slowing the head fire are broadly indicated to have been < 5% for a FFDI of >190.
The broad indications provided from the extrapolation of the McCarthy/Tolhurst graph
beyond FDI 100, as well as observations of fire intensity in prescribe burnt areas subjected
to the wildfires of 7 February, suggest a need to review the effectiveness of prescribed
burns as a fire management tool in these conditions and determining relative strengths and
weaknesses in relation to other fire management strategies.
The McCarthy/Tolhurst model reflects evidence presented to the Royal Commission that
fire behaviour is unlikely to be controllable with current techniques of direct attack above
an intensity of 4,000 KW/m (Waller 2009, Tolhurst 2009).
Under catastrophic FFDI conditions, these intensities can be reached with little fuel,
reducing the relative effectiveness of fuel management in controlling fires.
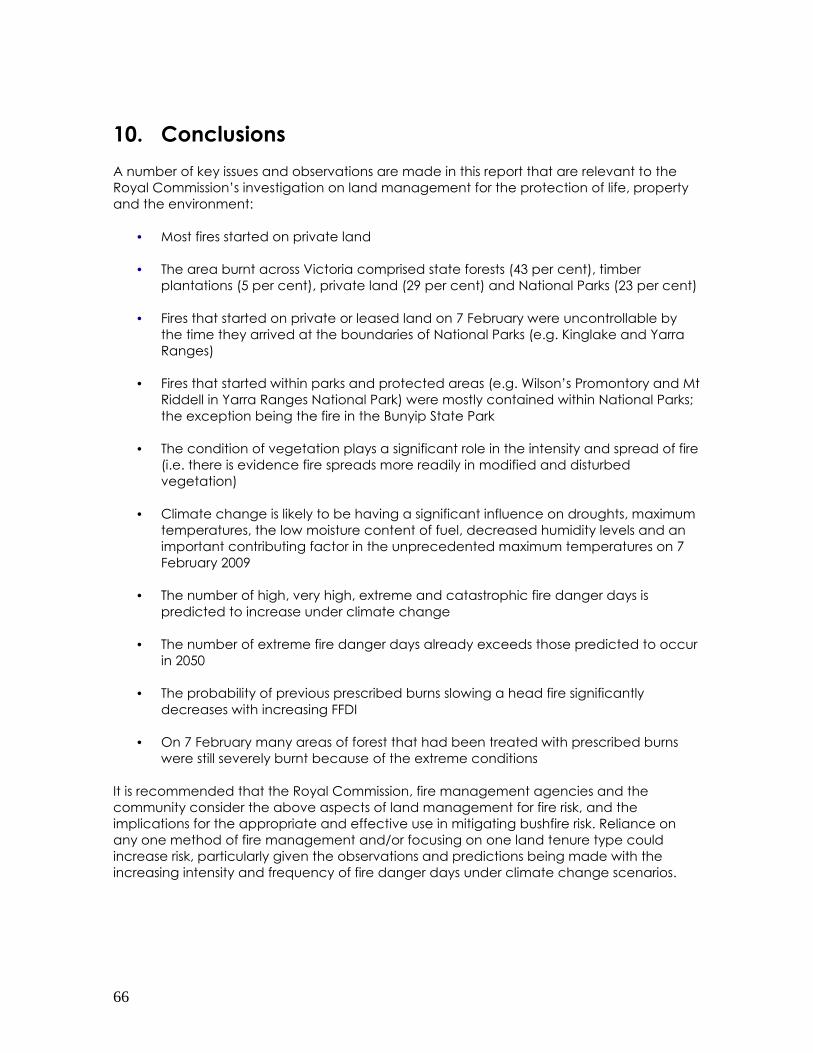
66
10. Conclusions
A number of key issues and observations are made in this report that are relevant to the
Royal Commission’s investigation on land management for the protection of life, property
and the environment:
• Most fires started on private land
• The area burnt across Victoria comprised state forests (43 per cent), timber
plantations (5 per cent), private land (29 per cent) and National Parks (23 per cent)
• Fires that started on private or leased land on 7 February were uncontrollable by
the time they arrived at the boundaries of National Parks (e.g. Kinglake and Yarra
Ranges)
• Fires that started within parks and protected areas (e.g. Wilson’s Promontory and Mt
Riddell in Yarra Ranges National Park) were mostly contained within National Parks;
the exception being the fire in the Bunyip State Park
• The condition of vegetation plays a significant role in the intensity and spread of fire
(i.e. there is evidence fire spreads more readily in modified and disturbed
vegetation)
• Climate change is likely to be having a significant influence on droughts, maximum
temperatures, the low moisture content of fuel, decreased humidity levels and an
important contributing factor in the unprecedented maximum temperatures on 7
February 2009
• The number of high, very high, extreme and catastrophic fire danger days is
predicted to increase under climate change
• The number of extreme fire danger days already exceeds those predicted to occur
in 2050
• The probability of previous prescribed burns slowing a head fire significantly
decreases with increasing FFDI
• On 7 February many areas of forest that had been treated with prescribed burns
were still severely burnt because of the extreme conditions
It is recommended that the Royal Commission, fire management agencies and the
community consider the above aspects of land management for fire risk, and the
implications for the appropriate and effective use in mitigating bushfire risk. Reliance on
any one method of fire management and/or focusing on one land tenure type could
increase risk, particularly given the observations and predictions being made with the
increasing intensity and frequency of fire danger days under climate change scenarios.

67
References
Australian Associated Press (AAP) (2009), Police appeal for help over the Murrindindi Blaze,
The Australian 14.02.2009
ABCa (2009), McCrae residents face fire threat,
http://www.abc.net.au/news/stories/2009/01/28/2476493.htm
Accessed: 15 May 2009
ABCb (2009), Lightning further complicates Vic fire threat,
http://www.abc.net.au/news/stories/2009/02/02/2480272.htm
Accessed: 15 May 2009
ABCc (2009), Towns under ember attack as fires rage,
http://www.abc.net.au/news/stories/2009/02/07/2485101.htm
Accessed: 15 May 2009
ABCd (2009), Arson suspected in deadly Bendigo blaze,
http://www.abc.net.au/news/stories/2009/02/10/2487050.htm
Accessed: 15 May 2009
ABCe (2009), Churchill arson suspect expected to be charged,,
http://www.abc.net.au/news/stories/2009/02/13/2490845.htm
Accessed: 15 May 2009
ABCf (2009), Fire crews search for Boolarra hotspots,
http://www.abc.net.au/news/stories/2009/02/03/2480713.htm
Accessed: 15 May 2009 AAP (2009), Gippsland fire now within containment lines,
http://www.theaustralian.news.com.au/story/0,25197,24991949-12377,00.html
Accessed: 15 May 2009
AAPb 2009, Churchill arson suspect faces 10 charges, The Age, 17 August 2009,
http://news.theage.com.au/breaking-news-national/churchill-arson-suspect-faces-10-
charges-20090817-enjx.html
Accessed: 28 August 2009
Ashton D (1976), The development of even-aged Stands of Eucalyptus regnans (F. Meull) in
Central Victoria, Australian Journal of Botany 1976, Vol 24, pp397-414.
Barker P (1992), Fire and the stability of a Victorian cool temperate rainforest, In (Eds) Gell P,
Mercer P, Victoria’s Rainforests: Perspectives on definition, classification and management,
Monash Publications in Geography No. 41.
Bureau of Meteorology (2009), Special Climate Statement – The exceptional January-
February 2009 heatwave in Southeastern Australia.
Buckley A, Corkish N (1991), Fire Hazard and Prescribed Burning of Thinning Slash in Eucalypt
Regrowth Forest, Research Report No.29 DCE series “Management of Eucalypt Regrowth in
East Gippsland.

68
Clancy B (2009), Lines a threat in waiting, The Weekly Times, 12 February 2009
Cooke D, Silvester J (2009), Arson Arrest as farmers left to pick up the pieces, Canberra
Times, 14.02.2009.
Department of Sustainability and Environment (2009), 2009 Fire Severity Map, (Victorian
Government)
Esplin B (2003), Report of the Inquiry into the 2002-2003 Victorian Bushfires, Victorian
Government
Florence R (1994), The ecological basis for forest fire management in New South Wales, in
The Burning Continent – Forest Ecosystems and Fire Management in Australia (Eds) Attiwill P,
Florence R, Hurditch B, Hurditch B (1994), , Institute of Public Affairs
Four Corners-a (2009), Two days in Hell,
http://www.abc.net.au/4corners/content/2008/s2492832.htm
Accessed: 16 March 2009
Four Corners-b (2009), Eye of the Storm,
http://www.abc.net.au/4corners/content/2009/s2553879.htm
Accessed: 27 April 2009
Fyfe M (2009), Heat wave left hundreds dead, The Age, 22 February 2009
Housten C, Reilly T (2009), Heat leaves a $100m black hole, The Age, 1 February 2009.
Karoly D (2009), Bushfires and extreme heat in south-east Australia, accessed online
http://www.realclimate.org/index.php/archives/2009/02/bushfires-and-climate/#more-654
Koch E (2009), Heat wave puts morgue under pressure, The Age, 6 February 2009.
Lanigan L, Woods K (2009), Gippsland faces third fire, The Weekly Times, 29 January 2009
Lindenmayer D, (2003), Fire behaviour, forest management and biodiversity conservation.
pp 82-88. Australia Burning – Fire ecology policy and management issues, (Eds) Cary,
Lindenmayer D and Dovers S (CSIRO Publishing)
Lines W (2006), Patriots – Defending Australia’s Natural Heritage, University of Queensland
Press
Lucas C, Hennessy K, Mills G, Bathols J (2007), Bushfire Weather in Southeast Australia:
Recent Trends and Projected Climate Change Impacts, Bushfire CRC and CSIRO
Luke R, McArthur L (1978), Bushfires in Australia, Australian Government Publishing Service
Mackey B, Lindenmayer D, Gill M, McCarthy M Lindsey J (2002), Wildlife. Fire & Future
Climate, CSIRO Publishing
McCarthy, Tolhurst K (2001), Research Report No. 51 - Effectiveness of Broadscale Fuel
Reduction Burning in Assisting with Wildfire Control in Parks and Forests in Victoria,
Department of Natural Resources and Environment

69
McCarthy G, Tolhurst K, Chatto K (1999), Overall Fuel Hazard Guide – Third Edition, Forest
Science Centre/Victorian Government
Miller E (2009), Battle to control the Bunyip State Park blaze, Berwick & District Journal, 12
February 2009
NASA (2009), Earth Observatory Satellite Images
Noble J (1991), Behaviour of a very fast Grassland Wildfire on the Riverine Plain of South
Eastern Australia, International Journal of Wildland Fire 1(3): p189-196
Parks Victoria (2009), Wilsons Promontory National Park - Cathedral Fire February 2009,
http://www.parkweb.vic.gov.au/3promfire.cfm
Accessed: 29 August 2009
Royal Commission (2009), Victorian Bushfires Royal Commission – Interim Report
Sullivan A, McCaw L (2009) – Research results from February 7th 2009 Victorian Fires
Preliminary Findings on: Fire behaviour investigation. In Victorian 2009 Bushfire Research
Response Interim Report June 2009 (Bushfire CRC)
Tobin (2009), Statement provided to the Royal Commission, Transcript of proceedings,
Monday 20 April 2009, http://www.royalCommission.vic.gov.au/Public-Hearings/April-09
Accessed: 16 July 2009
Tolhurst K, Cheney P (1999), Synopsis of the Knowledge Used in Prescribed Burning in
Victoria, Department of Natural Resources and Environment
Tolhurst K (2009), Report on the Physical Nature of the Victorian Fires occurring on 7th
February 2009, Report for Council assisting the Royal Commission.
Thom G (2009), It's frightening in the firing line, Herald Sun,
http://www.weeklytimesnow.com.au/article/2009/02/10/51671_latest-news.htm
Accessed: 1 May 2009
Thompson J, Thomas S, Ganio L (2007), Reburn severity in managed and unmanaged
vegetation in a large wildfire, Proceedings of the National Academy of Science, June
2007, vol. 104, no. 25, pp10743-10748
Waller E (2009), Revised Statement of Waller, Statement provided to the Royal Commission,
8 May 2009