2009 Annual Report GLANBIA
131
Glanbia plc 2009 Annual Report
Transcript of 2009 Annual Report GLANBIA
Glanbia plc 2009 Annual Report
Glanb
ia plc 2009 A
nnual Rep
ort
Glanbia plc, Glanbia House, Kilkenny, Ireland.
Tel +353 56 777 2200Fax +353 56 777 2222 www.glanbia.com

Cautionary statementThe 2009 Annual Report contains forward-looking statements. These statements have been made by the Directors in good faith, based on the information available to them up to the time of their approval of this report. Due to the inherent uncertainties, including both economic and business risk factors, underlying such forward-looking information, actual results may differ materially from those expressed or implied by these forward-looking statements. The Directors undertake no obligation to update any forward-looking statements contained in this report, whether as a result of new information, future events, or otherwise.
Get more online www.glanbia.com
Glanbia plc 2009 Annual Report Contents 1
Overview of GlanbiaIntroduction 2 Financial results 3 Glanbia at a glance 4
Directors’ report: Business reviewChairman’s statement 6 Group Managing Director’s review 8 International growth strategy 10 Operations review US Cheese & Global Nutritionals 14 Dairy Ireland 16 Joint Ventures & Associates 18 Finance review 22 Risk management 28 Our responsibilities 30 Our people 31
Directors’ report: Corporate governanceBoard of Directors 34 Statement on corporate governance 36 Statement on Directors’ remuneration 46 Other statutory information 54 Statement of Directors’ responsibilities 55
Financial statementsIndependent auditors’ report to the members of Glanbia plc 60 Group income statement 62 Group statement of comprehensive income 63 Group statement of changes in equity 64 Group statement of financial position 65 Group statement of cash flows 66 Company statement of financial position 67 Company statement of changes in equity 68 Company statement of comprehensive income 69 and statement of cash flows Notes to the financial statements 70
Other informationShareholders’ information 124 Five year trends 127 Index 128
Glanbia plc 2009 Annual Report Overview of Glanbia2
Glanbia plc is an international nutritional ingredients and cheese group, headquartered in Ireland. The Group’s Global Nutritionals head office and main innovation centre are also located in Ireland. Glanbia has over 4,300 employees in fifteen countries, including Joint Ventures & Associates. The Group has three business segments – US Cheese & Global Nutritionals, Dairy Ireland and Other Business. Glanbia also has three principal international joint ventures – Southwest Cheese in the USA, Glanbia Cheese in the UK and Nutricima in Nigeria – as well as a number of smaller Irish-based joint ventures and associates. Glanbia is listed on the Irish and London Stock Exchanges (Symbol: GLB).
Events after the reporting period On 10 March 2010, the Group announced that Glanbia Co-operative Society Limited, its 54.6% shareholder, had expressed an interest in acquiring Glanbia’s Dairy Ireland operations (incorporating Dairy Ingredients, Consumer Products and Agribusiness), Glanbia’s Irish property business, Group Business Services and related Irish joint ventures and associates.
3Glanbia plc 2009 Annual Report Overview of Glanbia
Financial results
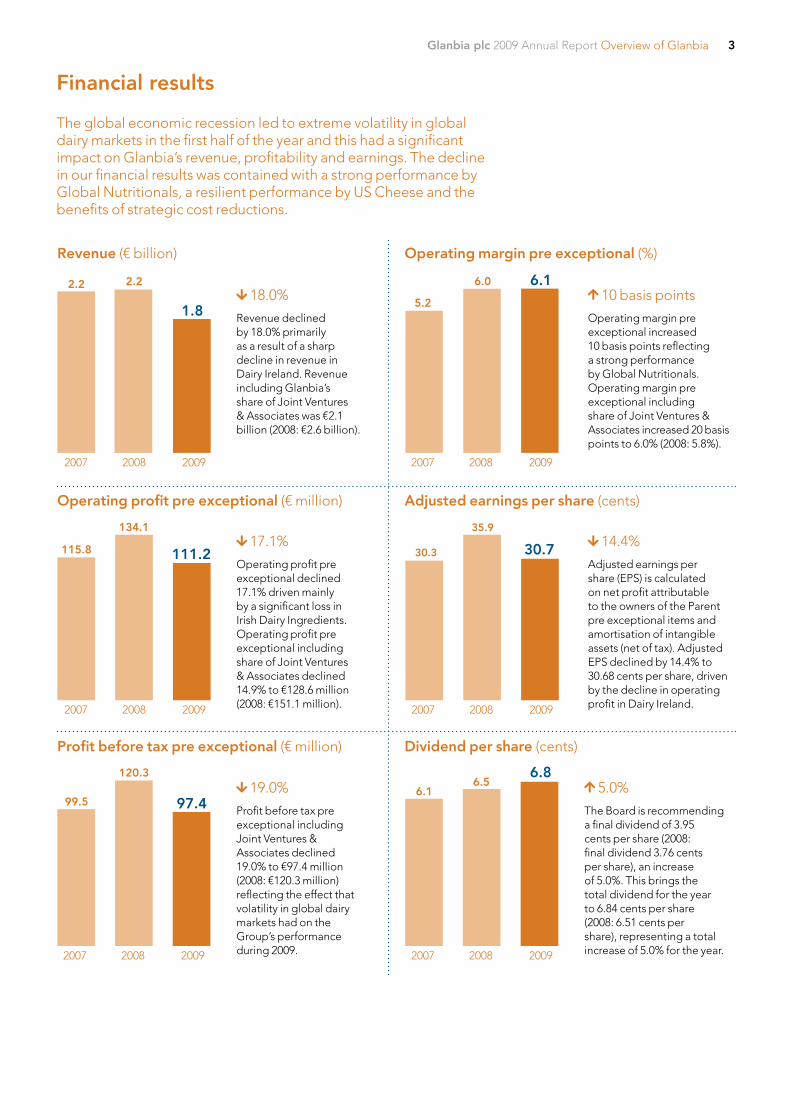
The global economic recession led to extreme volatility in global dairy markets in the first half of the year and this had a significant impact on Glanbia’s revenue, profitability and earnings. The decline in our financial results was contained with a strong performance by Global Nutritionals, a resilient performance by US Cheese and the benefits of strategic cost reductions.
Revenue (€ billion)
2007 2008 2009
2.2
1.8 18.0%
Revenue declined by 18.0% primarily as a result of a sharp decline in revenue in Dairy Ireland. Revenue including Glanbia’s share of Joint Ventures & Associates was €2.1 billion (2008: €2.6 billion).
Operating margin pre exceptional (%)
10 basis points
Operating margin pre exceptional increased 10 basis points reflecting a strong performance by Global Nutritionals. Operating margin pre exceptional including share of Joint Ventures & Associates increased 20 basis points to 6.0% (2008: 5.8%).
Operating profit pre exceptional (€ million) Adjusted earnings per share (cents)
30.3
35.9
30.7 14.4%
Adjusted earnings per share (EPS) is calculated on net profit attributable to the owners of the Parent pre exceptional items and amortisation of intangible assets (net of tax). Adjusted EPS declined by 14.4% to 30.68 cents per share, driven by the decline in operating profit in Dairy Ireland.
Profit before tax pre exceptional (€ million) Dividend per share (cents)
2.2
2007 2008 2009
5.2
6.16.0
2007 2008 2009
17.1%
Operating profit pre exceptional declined 17.1% driven mainly by a significant loss in Irish Dairy Ingredients. Operating profit pre exceptional including share of Joint Ventures & Associates declined 14.9% to €128.6 million (2008: €151.1 million).
115.8 111.2
134.1
2007 2008 2009
2007 2008 2009
19.0%
Profit before tax pre exceptional including Joint Ventures & Associates declined 19.0% to €97.4 million (2008: €120.3 million) reflecting the effect that volatility in global dairy markets had on the Group’s performance during 2009.
99.5 97.4
120.3
2007 2008 2009
5.0%
The Board is recommending a final dividend of 3.95 cents per share (2008: final dividend 3.76 cents per share), an increase of 5.0%. This brings the total dividend for the year to 6.84 cents per share (2008: 6.51 cents per share), representing a total increase of 5.0% for the year.
6.1
6.86.5
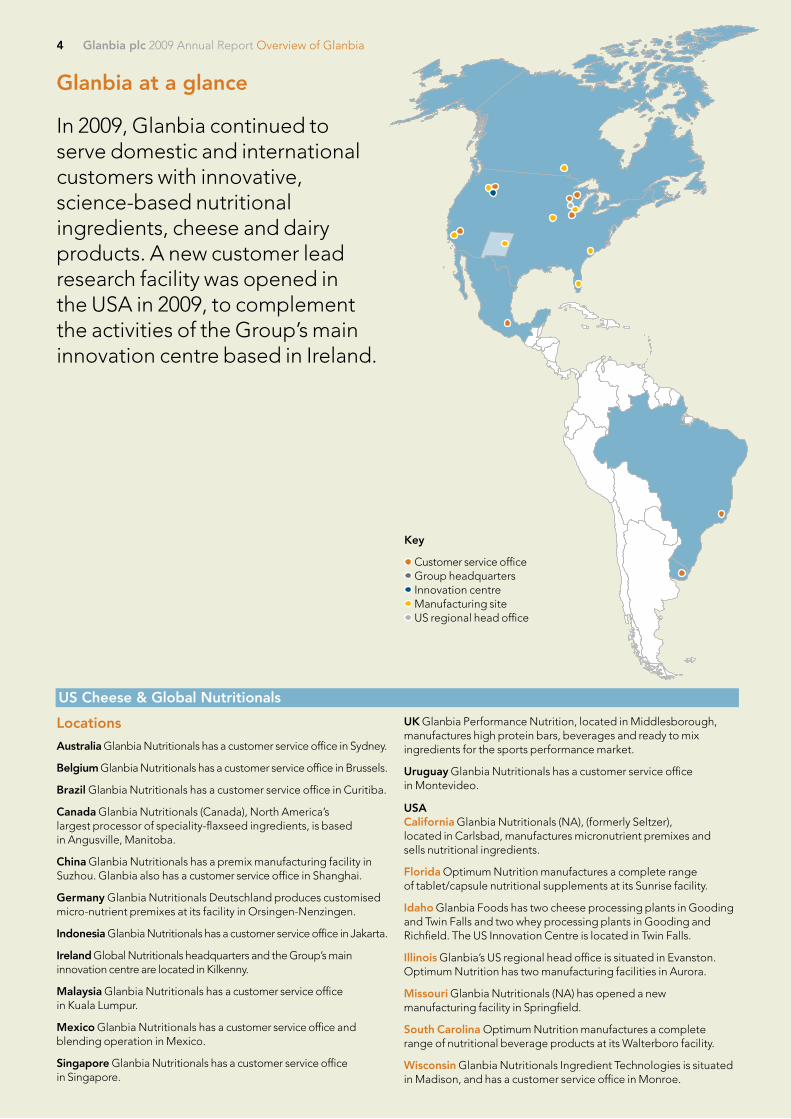
Locations
Australia Glanbia Nutritionals has a customer service office in Sydney.
Belgium Glanbia Nutritionals has a customer service office in Brussels.
Brazil Glanbia Nutritionals has a customer service office in Curitiba.
Canada Glanbia Nutritionals (Canada), North America’s largest processor of speciality-flaxseed ingredients, is based in Angusville, Manitoba.
China Glanbia Nutritionals has a premix manufacturing facility in Suzhou. Glanbia also has a customer service office in Shanghai.
Germany Glanbia Nutritionals Deutschland produces customised micro-nutrient premixes at its facility in Orsingen-Nenzingen.
Indonesia Glanbia Nutritionals has a customer service office in Jakarta.
Ireland Global Nutritionals headquarters and the Group’s main innovation centre are located in Kilkenny.
Malaysia Glanbia Nutritionals has a customer service office in Kuala Lumpur.
Mexico Glanbia Nutritionals has a customer service office and blending operation in Mexico.
Singapore Glanbia Nutritionals has a customer service office in Singapore.
US Cheese & Global Nutritionals
UK Glanbia Performance Nutrition, located in Middlesborough, manufactures high protein bars, beverages and ready to mix ingredients for the sports performance market.
Uruguay Glanbia Nutritionals has a customer service office in Montevideo.
USACalifornia Glanbia Nutritionals (NA), (formerly Seltzer), located in Carlsbad, manufactures micronutrient premixes and sells nutritional ingredients.
Florida Optimum Nutrition manufactures a complete range of tablet/capsule nutritional supplements at its Sunrise facility.
Idaho Glanbia Foods has two cheese processing plants in Gooding and Twin Falls and two whey processing plants in Gooding and Richfield. The US Innovation Centre is located in Twin Falls.
Illinois Glanbia’s US regional head office is situated in Evanston. Optimum Nutrition has two manufacturing facilities in Aurora.
Missouri Glanbia Nutritionals (NA) has opened a new manufacturing facility in Springfield.
South Carolina Optimum Nutrition manufactures a complete range of nutritional beverage products at its Walterboro facility.
Wisconsin Glanbia Nutritionals Ingredient Technologies is situated in Madison, and has a customer service office in Monroe.
Glanbia at a glance
In 2009, Glanbia continued to serve domestic and international customers with innovative, science-based nutritional ingredients, cheese and dairy products. A new customer lead research facility was opened in the USA in 2009, to complement the activities of the Group’s main innovation centre based in Ireland.
Key
Customer service office Group headquarters Innovation centre Manufacturing site US regional head office
Glanbia plc 2009 Annual Report Overview of Glanbia4
Glanbia plc 2009 Annual Report Overview of Glanbia
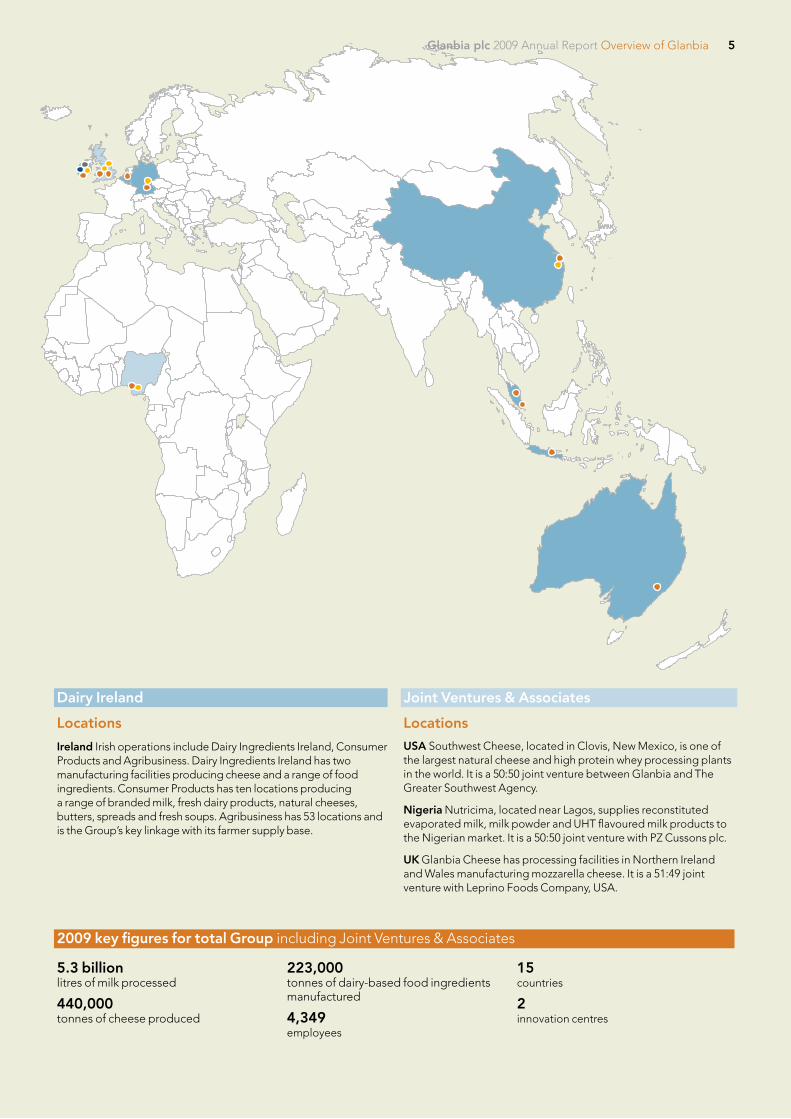
Locations
Ireland Irish operations include Dairy Ingredients Ireland, Consumer Products and Agribusiness. Dairy Ingredients Ireland has two manufacturing facilities producing cheese and a range of food ingredients. Consumer Products has ten locations producing a range of branded milk, fresh dairy products, natural cheeses, butters, spreads and fresh soups. Agribusiness has 53 locations and is the Group’s key linkage with its farmer supply base.
Dairy Ireland
Locations
USA Southwest Cheese, located in Clovis, New Mexico, is one of the largest natural cheese and high protein whey processing plants in the world. It is a 50:50 joint venture between Glanbia and The Greater Southwest Agency.
Nigeria Nutricima, located near Lagos, supplies reconstituted evaporated milk, milk powder and UHT flavoured milk products to the Nigerian market. It is a 50:50 joint venture with PZ Cussons plc.
UK Glanbia Cheese has processing facilities in Northern Ireland and Wales manufacturing mozzarella cheese. It is a 51:49 joint venture with Leprino Foods Company, USA.
Joint Ventures & Associates
5.3 billion litres of milk processed
440,000 tonnes of cheese produced
223,000 tonnes of dairy-based food ingredients manufactured
4,349 employees
15 countries
2 innovation centres
2009 key figures for total Group including Joint Ventures & Associates
5Glanbia plc 2009 Annual Report Overview of Glanbia
Glanbia plc 2009 Annual Report Directors’ report: Business review6
Chairman’s statement
Market commentary
2009 was a very difficult year. Demand for dairy products weakened as a result of the global economic recession. Economic uncertainty and credit availability significantly reduced consumer confidence. As a result, global dairy prices declined sharply through the first half of the year remaining at extremely low levels until the last quarter of 2009 when market conditions improved.
It was a year of negative returns for Irish dairy processors and farmer suppliers, mainly as a result of the scale and pace of market changes in the first half of the year. The reduction in farm incomes, together with difficulty in accessing finance, had a significant impact on farmer spending power.
A deep consumer recession in Ireland drove an exceptionally competitive food retailing environment. This led to a change in shopping profiles, to which suppliers and retailers are responding.
In 2009, nutritional markets had a resilient year despite the global economic recession. Demand was particularly robust in Performance Nutrition, a key sector for Glanbia Global Nutritionals. However, the US dairy market mirrored global trends and US cheese prices fell sharply in January and remained low and volatile until the latter part of the year.
2009 results summary
Against this background the Group delivered a solid financial performance although the sharp decline in global dairy markets in the first half of the year in particular, had a significant impact on Glanbia’s revenue, profitability and earnings.
Earnings per share
Basic earnings per share (EPS) increased 43.7% to 38.46 cents per share (2008: 26.76 cents per share) as the impact of the net exceptional credit in 2009 of €34.9 million offset the effect of the decline in profit pre exceptional for the year relative to 2008. Adjusted EPS declined by 14.4% to 30.68 cents per share (2008: 35.86 cents per share), driven by the decline in operating profit in Dairy Ireland.
Full details of the Group’s performance are contained in the Group Managing Director’s review on pages 8 to 9, operations review on pages 14 to 19 and the finance review on pages 22 and 27, of this report.
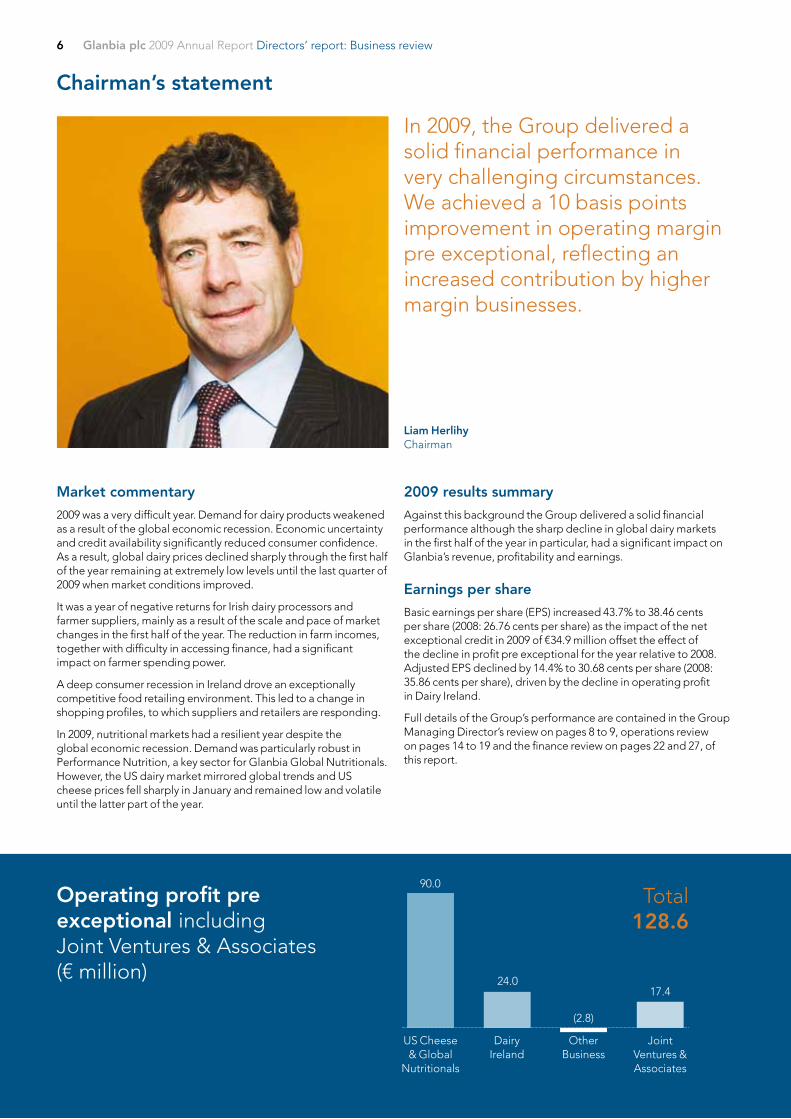
In 2009, the Group delivered a solid financial performance in very challenging circumstances. We achieved a 10 basis points improvement in operating margin pre exceptional, reflecting an increased contribution by higher margin businesses.
Operating profit pre exceptional including Joint Ventures & Associates(€ million)
US Cheese & Global
Nutritionals
Dairy Ireland
Other Business
Joint Ventures & Associates
90.0
24.0
(2.8)
17.4
Total 128.6
Liam Herlihy Chairman
Glanbia plc 2009 Annual Report Directors’ report: Business review 7
Dividends
The Board is recommending a final dividend of 3.95 cents per share (2008: final dividend 3.76 cents per share), an increase of 5.0%. This brings the total dividend for the year to 6.84 cents per share (2008: 6.51 cents per share), representing a total increase of 5.0% for the year. Subject to shareholder approval, dividends will be paid on Wednesday 2 June 2010 to shareholders on the register of members on Friday 7 May 2010. Irish withholding tax will be deducted at the standard rate, where appropriate.
The Annual General Meeting (AGM) will be held on Tuesday 25 May 2010.
Strategic review
The Group has an annual strategic review process to support the achievement of our strategic objectives. The Board annually approves changes to the strategic framework and agrees a three year financial plan. Each business segment produces its own business plan outlining specific strategies and considerations and sets performance targets for the following three years. These business plans are then overlaid with the strategic objectives for the overall Group to produce a final three year strategic plan. This plan is initially formulated and approved by the Executive Committee and ultimately approved by the Board. Progress on implementation is reviewed regularly throughout the year by the Group Managing Director and the Group Finance Director. This review process ensures regular monitoring and reporting of performance against strategy, with regular updating for the Board. The Group’s Managing Director’s review outlines the Group’s growth strategy on pages 10 to 13.
Risk management and governance
During 2009, the Audit Committee in conjunction with members of the executive management team, including the Group Managing Director and Group Finance Director, undertook a detailed assessment of strategic risks within our operating environment. As part of this review process, each area of the business was required to review its principal areas of risk and uncertainty and present to either the Audit Committee or the Board on the steps taken to mitigate such risks. Detailed information on risk management is contained on page 28 and 29.
Management and staff
In 2009, across Glanbia there was a need to adapt to the external environment and the unprecedented change in circumstances. Management and staff throughout the Group undertook to do whatever was necessary to ensure that the business was sustained in the best possible position through this difficult period. Their effort, dedication, commitment and willingness to adapt has been exceptional and the Board’s thanks and appreciation goes to all the Glanbia team.
Proposed disposal of Irish Dairy and Agribusiness operations
On 10 March 2010, Glanbia plc announced that Glanbia Co-operative Society Limited (“the Society”), its 54.6% shareholder, had expressed an interest in acquiring Glanbia’s Dairy Ireland and related operations, primarily incorporating Dairy Ingredients, Consumer Products and Agribusiness. Any such transaction would be likely to involve a significant reduction in the Society’s ownership in the Group and would require the approval of both the Society’s members and Glanbia plc shareholders. While discussions are progressing well, there is no guarantee that they will result in a transaction being concluded. The strategic rationale for this transaction is outlined in the Group Managing Director’s review on page 8 and 9 of this report.
2010 outlook
US Cheese is expected to benefit from a better pricing environment. Global Nutritionals will continue to develop its product range and geographical reach. Overall, US Cheese & Global Nutritionals is expected to deliver good underlying growth although margins are likely to reduce somewhat due to a significant investment by Global Nutritionals in developing its resources and business.
Dairy Ireland is expected to deliver a marked improvement this year mainly as a result of a recovery in Irish Dairy Ingredients and a continuation of the sustainable cost reduction programme.
Joint Ventures & Associates is expected to deliver a reasonable result, underpinned by a good year from Southwest Cheese.
Whilst the outlook remains challenging, we are seeing some positive signs in our operating environment, which coupled with the ongoing strategic cost reduction programme should underpin our performance in 2010.
Liam Herlihy Chairman
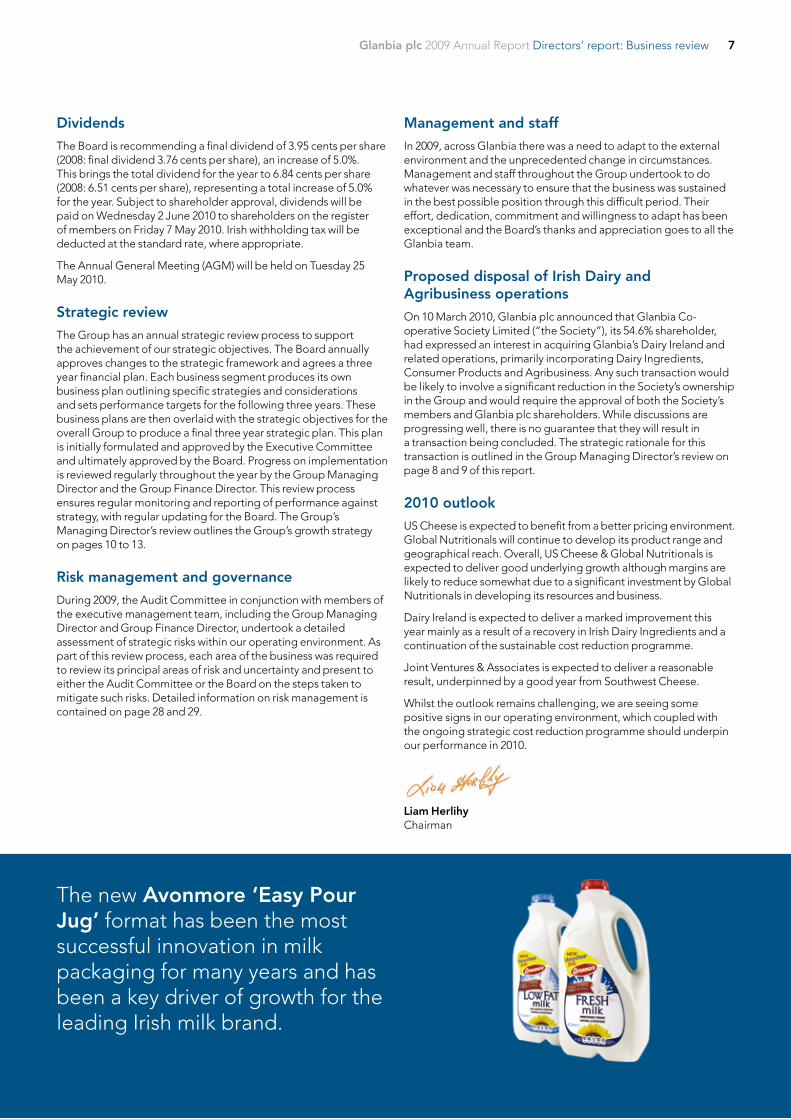
The new Avonmore ‘Easy Pour Jug’ format has been the most successful innovation in milk packaging for many years and has been a key driver of growth for the leading Irish milk brand.
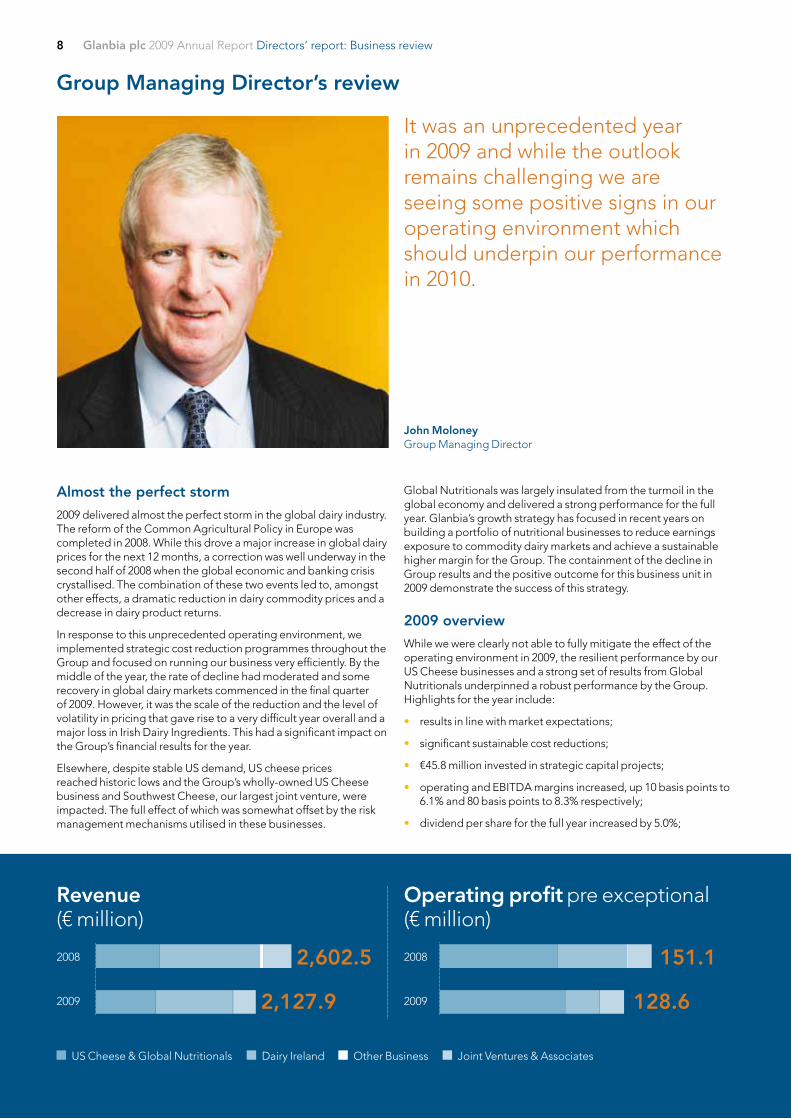
Glanbia plc 2009 Annual Report Directors’ report: Business review8
2008
2009
151.1
128.6
2008
2009
2,602.5
2,127.9
Revenue (€ million)
Group Managing Director’s review
Almost the perfect storm
2009 delivered almost the perfect storm in the global dairy industry. The reform of the Common Agricultural Policy in Europe was completed in 2008. While this drove a major increase in global dairy prices for the next 12 months, a correction was well underway in the second half of 2008 when the global economic and banking crisis crystallised. The combination of these two events led to, amongst other effects, a dramatic reduction in dairy commodity prices and a decrease in dairy product returns.
In response to this unprecedented operating environment, we implemented strategic cost reduction programmes throughout the Group and focused on running our business very efficiently. By the middle of the year, the rate of decline had moderated and some recovery in global dairy markets commenced in the final quarter of 2009. However, it was the scale of the reduction and the level of volatility in pricing that gave rise to a very difficult year overall and a major loss in Irish Dairy Ingredients. This had a significant impact on the Group’s financial results for the year.
Elsewhere, despite stable US demand, US cheese prices reached historic lows and the Group’s wholly-owned US Cheese business and Southwest Cheese, our largest joint venture, were impacted. The full effect of which was somewhat offset by the risk management mechanisms utilised in these businesses.
Global Nutritionals was largely insulated from the turmoil in the global economy and delivered a strong performance for the full year. Glanbia’s growth strategy has focused in recent years on building a portfolio of nutritional businesses to reduce earnings exposure to commodity dairy markets and achieve a sustainable higher margin for the Group. The containment of the decline in Group results and the positive outcome for this business unit in 2009 demonstrate the success of this strategy.
2009 overview
While we were clearly not able to fully mitigate the effect of the operating environment in 2009, the resilient performance by our US Cheese businesses and a strong set of results from Global Nutritionals underpinned a robust performance by the Group. Highlights for the year include:
• results in line with market expectations;
• significant sustainable cost reductions;
• €45.8 million invested in strategic capital projects;
• operating and EBITDA margins increased, up 10 basis points to 6.1% and 80 basis points to 8.3% respectively;
• dividend per share for the full year increased by 5.0%;
It was an unprecedented year in 2009 and while the outlook remains challenging we are seeing some positive signs in our operating environment which should underpin our performance in 2010.
John Moloney Group Managing Director
Operating profit pre exceptional(€ million)
US Cheese & Global Nutritionals Dairy Ireland Other Business Joint Ventures & Associates
Glanbia plc 2009 Annual Report Directors’ report: Business review 9
• completion of a strategic review of the Group’s pension arrangement which is a significant factor in reducing the Group’s pension liability by €79.0 million; and
• 40% expansion in Southwest Cheese is on track to begin processing in the first quarter of 2010.
A review of the financial performance of the Group is in the finance review starting on page 22 of this report.
2009 segmental analysis
Dairy Ireland is the largest business segment by revenue representing 48.3% of total revenue, including Joint Ventures & Associates. Its operating profit contribution declined to 18.7% of total operating profit pre exceptional reflecting a difficult year. In 2009, US Cheese & Global Nutritionals represented 37.2% of total revenue and 70.0% of total operating profit pre exceptional. The Other Business segment is less than 0.5% of total revenue and was loss making in 2009. Joint Ventures & Associates represent 14.0% of total revenue and 13.5% of total operating profit pre exceptional. Share of results of Joint Ventures & Associates are reported as an after interest and tax amount in the income statement. The operations review commences on page 14 of this report.
Unlocking potential
The Chairman’s statement referred to an expression of interest by Glanbia Co-operative Society Limited (“the Society”), the Group’s majority shareholder, in acquiring the Group’s Irish Dairy and Agribusinesses and related activities. While these discussions are very constructive and progressing well, there is no guarantee at this juncture of a successful conclusion. The transaction would be likely to involve a significant reduction in the Society’s 54.6% ownership in the Group. The approval of both the Society’s members and Glanbia plc shareholders would also be required.
The discussions are underpinned by a clear strategic rationale and represent a unique opportunity to transform Glanbia. For the Society and its members the significant changes in global dairy markets creates the right time now to consider a potential transaction. It would offer the prospect of full ownership and control of the Irish businesses most relevant to its members and it would align stewardship of key strategic assets more closely with member interests. For Glanbia, it would, inter alia, increase the Group’s focus on its international businesses, significantly improve financial flexibility and enhance the development of our successful international growth strategy.
Dairy Ireland strategy
Dairy Ireland represents the majority of the assets that the Society is potentially interested in acquiring. This business incorporates Irish Dairy Ingredients, Consumer Products and Agribusiness. Irish Dairy Ingredients is a large scale, well invested business. A major rationalisation programme, which is ongoing in 2010, is achieving a level of cost competitiveness that can and will ensure a sustainable business in this changed global dairy environment. Consumer Products is also competitively well positioned to continue to develop its product portfolio and maintain a strong share of the Irish retail milk market. Its portfolio stretches across milk and fresh dairy products, consumer cheeses, soups and sauces. Agribusiness is very much focused on developing a business that fits the evolving agricultural landscape and farmer needs. For further information go to the Dairy Ireland operations review on page16 and 17 of this report.
International growth strategy
Glanbia has a well established growth strategy and has built a strong track record in developing its international businesses. This growth strategy is explained in detail on pages 10 and 13 of this report.
Corporate responsibility
Building trust with our stakeholders and acting with integrity at all times is critical to our success, our reputation and our long-term sustainability. Key issues managed within our corporate responsibility strategy include business conduct and accountability, fairness and respect for employees, health and safety, sustainability, environmental impact and community involvement. Details of our performance in this area are in the our responsibilities review on page 30 to 33 of this report.
Looking ahead
This is a unique period in the Group’s development that represents a transformational opportunity. We need to find the best strategic way forward for the Group, so that Glanbia continues to develop successful and profitable businesses that contribute meaningfully for all stakeholders. The opportunity at hand is to recognise the structural change that has occurred in our operating environment and to grasp the strategic prospect of unlocking the Group’s potential.
John Moloney Group Managing Director
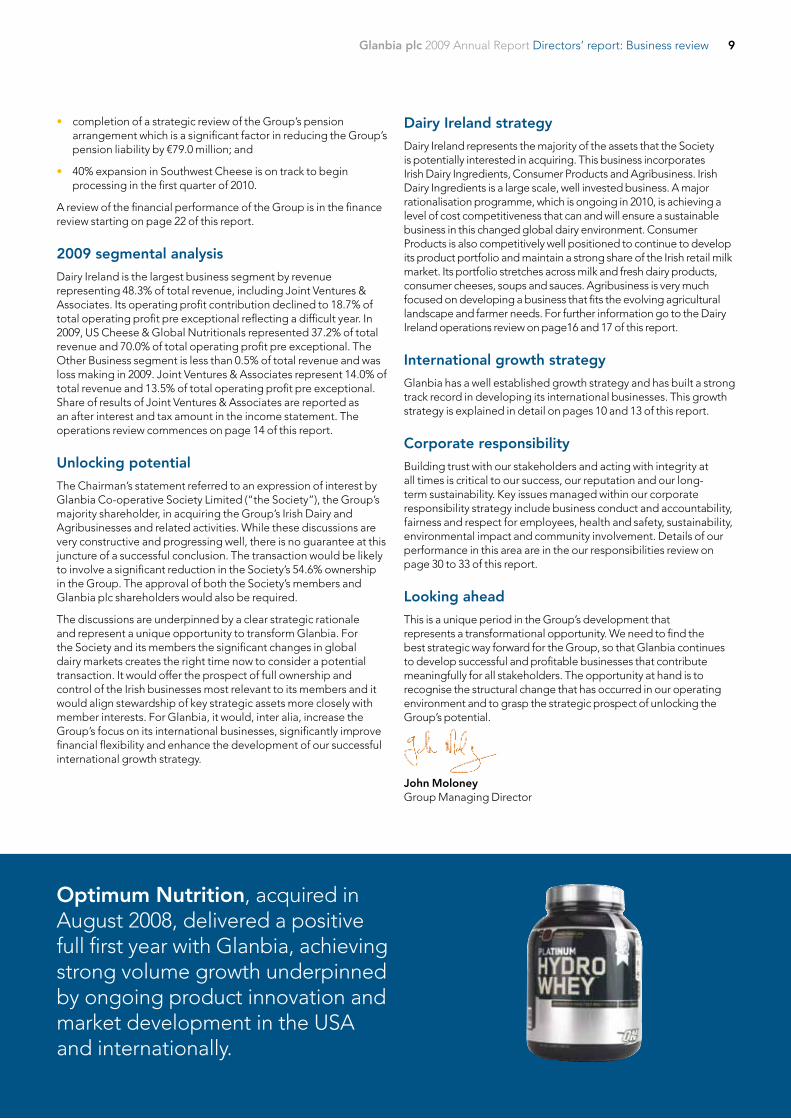
Optimum Nutrition, acquired in August 2008, delivered a positive full first year with Glanbia, achieving strong volume growth underpinned by ongoing product innovation and market development in the USA and internationally.
1010
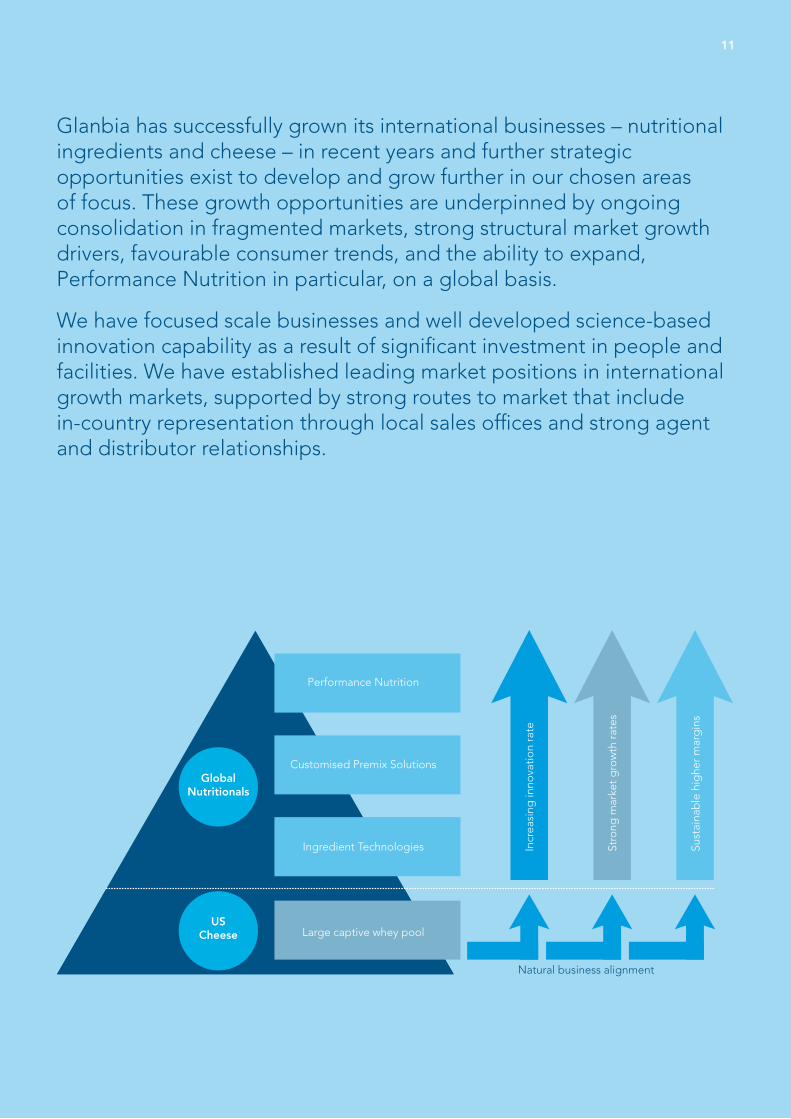
The Group’s international growth strategy is well established and is based on interconnected businesses incorporating nutritional ingredients and cheese
1111
GlobalNutritionals
USCheese
Performance Nutrition
Customised Premix Solutions
Ingredient Technologies
Large captive whey pool
Incr
easi
ng in
nova
tion
rate
Stro
ng m
arke
t g
row
th r
ates
Sust
aina
ble
hig
her
mar
gin
s
Natural business alignment
Glanbia has successfully grown its international businesses – nutritional ingredients and cheese – in recent years and further strategic opportunities exist to develop and grow further in our chosen areas of focus. These growth opportunities are underpinned by ongoing consolidation in fragmented markets, strong structural market growth drivers, favourable consumer trends, and the ability to expand, Performance Nutrition in particular, on a global basis.
We have focused scale businesses and well developed science-based innovation capability as a result of significant investment in people and facilities. We have established leading market positions in international growth markets, supported by strong routes to market that include in-country representation through local sales offices and strong agent and distributor relationships.
1212
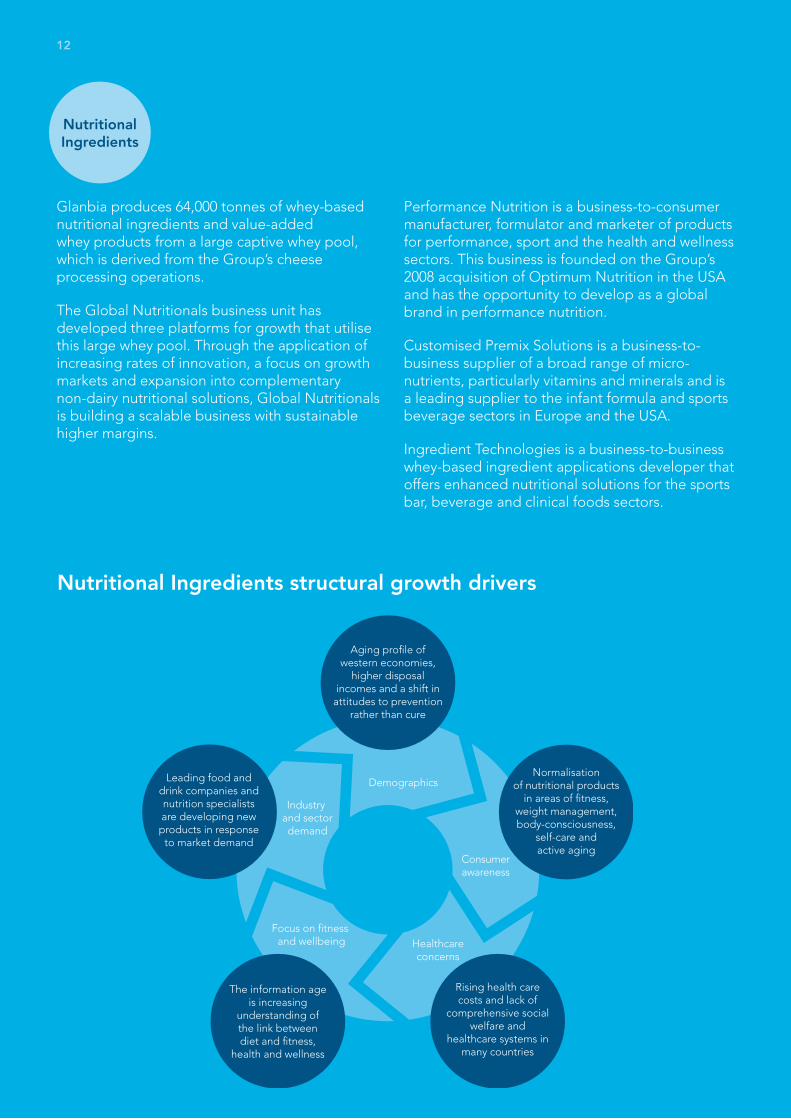
Demographics
Consumerawareness
Healthcareconcerns
Focus on fitness and wellbeing
Industry and sectordemand
Aging profile of western economies,
higher disposal incomes and a shift in
attitudes to prevention rather than cure
Normalisation of nutritional products
in areas of fitness, weight management, body-consciousness,
self-care and active aging
Rising health care costs and lack of
comprehensive social welfare and
healthcare systems in many countries
The information age is increasing
understanding of the link between diet and fitness,
health and wellness
Leading food and drink companies and nutrition specialistsare developing new products in response
to market demand
Glanbia produces 64,000 tonnes of whey-based nutritional ingredients and value-added whey products from a large captive whey pool, which is derived from the Group’s cheese processing operations.
The Global Nutritionals business unit has developed three platforms for growth that utilise this large whey pool. Through the application of increasing rates of innovation, a focus on growth markets and expansion into complementary non-dairy nutritional solutions, Global Nutritionals is building a scalable business with sustainable higher margins.
Performance Nutrition is a business-to-consumer manufacturer, formulator and marketer of products for performance, sport and the health and wellness sectors. This business is founded on the Group’s 2008 acquisition of Optimum Nutrition in the USA and has the opportunity to develop as a global brand in performance nutrition.
Customised Premix Solutions is a business-to-business supplier of a broad range of micro-nutrients, particularly vitamins and minerals and is a leading supplier to the infant formula and sports beverage sectors in Europe and the USA.
Ingredient Technologies is a business-to-business whey-based ingredient applications developer that offers enhanced nutritional solutions for the sports bar, beverage and clinical foods sectors.
Nutritional Ingredients structural growth drivers
Nutritional Ingredients
1313
Glanbia has built up world-class capability in cheese processing in the USA with a wholly-owned business in Idaho and a major joint venture in New Mexico; both low cost milk regions. US Cheese is a business-to-business, large scale, low cost, quality producer that is designed to operate 24/7, 365 days of the year at 100% of its rated capacity.
It sells cheese to companies who cut and package for the retail sector and to businesses who make a range of special ingredient-type cheeses, which are ultimately converted into processed cheese slices for the food service sector.
In 2009 US Cheese and Southwest Cheese produced 340,000 tonnes of American-style cheddar cheese, creating a market leading share in terms of total US cheddar cheese output. These businesses deliver customer value by making ‘gold medal’ quality dairy products at competitive price points. Glanbia recently won 12 medals in the World Cheese championships; a business and industry leading performance.
US Cheese and Global Nutritionals operations review is on page 14 and 15 of this report.
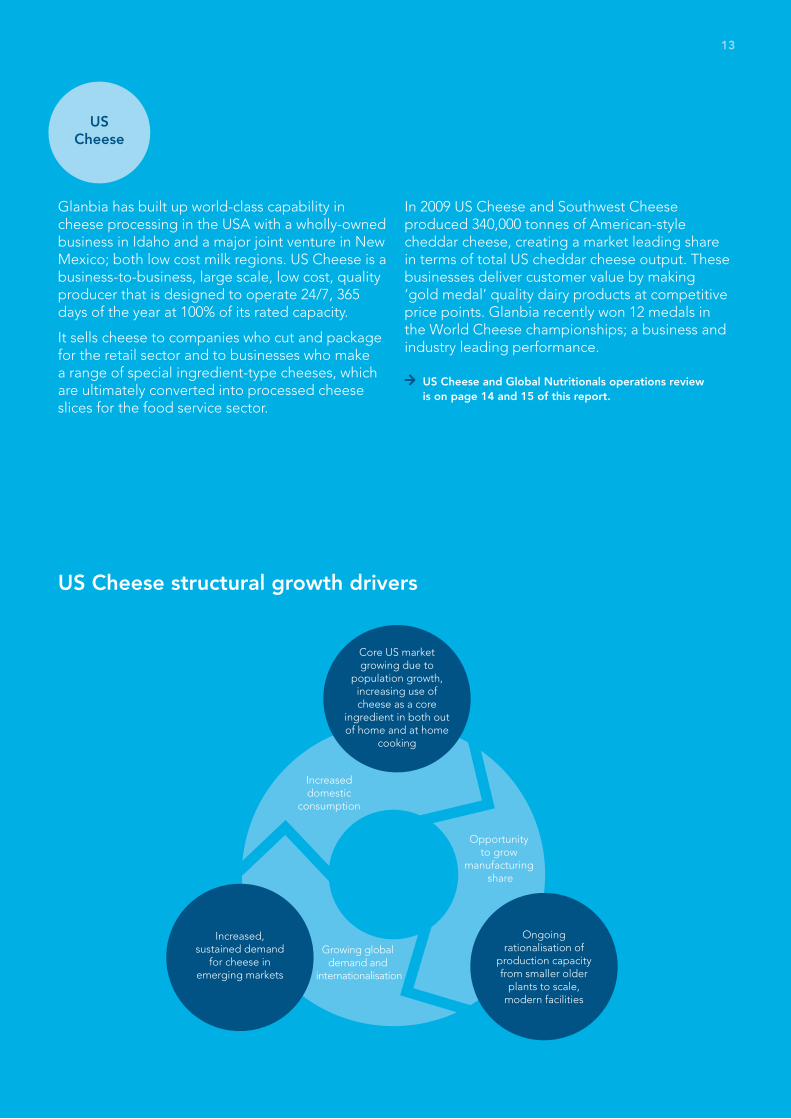
Increaseddomestic
consumption
Core US market growing due to
population growth, increasing use of cheese as a core
ingredient in both out of home and at home
cooking
Opportunity to grow
manufacturing share
Growing global demand and
internationalisation
Ongoing rationalisation of
production capacity from smaller older
plants to scale, modern facilities
Increased, sustained demand
for cheese in emerging markets
US Cheese structural growth drivers
US Cheese
Glanbia plc 2009 Annual Report Directors’ report: Business review14
Raimund Hoenes
Jeff Williams
A strong performance in Global Nutritionals including the full year effect of the Optimum Nutrition acquisition more than offset the impact of lower US cheese prices.
While overall revenue was down 6.1%, US Cheese & Global Nutritionals operating profit pre exceptional increased 7.4% or €6.2 million during the year to €90.0 million (2008: €83.8 million). Operating margin pre exceptional increased to 11.4% (2008: 9.9%) as a strong performance in Global Nutritionals, driven by solid organic growth, new product introductions and the full year effect of Optimum Nutrition acquisition, more than offset the impact of lower US cheese prices. EBITDA pre exceptional increased €13.3 million to €110.0 million (2008: €96.7 million) with EBITDA margin pre exceptional increased 240 basis points in the year to 13.9% (2008: 11.5%).
US Cheese
Glanbia’s wholly-owned US Cheese business, combined with the output from the Group’s Southwest Cheese joint venture, is a leading producer of American-style cheddar cheese with a significant market share. This business operates modern, large scale, efficient plants in two leading milk producing regions in the USA. Commentary on Southwest Cheese is on page 19 of this report.
The Group’s wholly-owned US Cheese business is located in Idaho and operates two cheese processing plants in Gooding and Twin Falls and two whey processing plants in Gooding and Richfield. The US Cheese business employs over 610 people and processes over one-third of the milk produced in Idaho, which is the third largest milk producing state in the USA. In 2009, the plants in Idaho processed 1.9 billion litres of milk into 198,000 tonnes of cheese and 46,000 tonnes of whey-based ingredients.
The cheese plants, aided by a good milk supply, ran at capacity throughout 2009 sustaining their position as a low cost, extremely efficient production facilities. A major reconstruction of the lactose plant in Gooding was ramped up to full production in 2009 producing product to world-class standards for use in infant formula.
Glanbia together with Southwest Cheese recently won 12 medals in the World Cheese Championships; a business and industry leading performance.
Operations review: US Cheese & Global Nutritionals
Senior Management
Kevin TolandCEO & President, Glanbia USA & Global Nutritionals
Raimund C. HoenesCEO, Glanbia Nutritionals Customised Premix Solutions
Hugh McGuireCEO & President, Performance Nutrition
Jerry O’ DeaCEO & President, Glanbia Nutritionals Ingredient Technologies
Jeff WilliamsCEO & President, Glanbia Foods Inc
Jerry O’Dea
Hugh McGuireKevin Toland
€792.4 million revenue
37% of total revenue
1,358 employees
€90.0 million operating profit pre exceptional
70% of total operating profit pre exceptional
11.4% operating margin pre exceptional
2009 key figures
Glanbia plc 2009 Annual Report Directors’ report: Business review 15
The US Cheese business delivered a solid result in the context of market circumstances and compared with a very strong 2008 pricing environment. The US cheese market is a US$6 billion market, at the wholesale level, that grows approximately 2% per annum due to increased US consumption and overall population growth. In 2009, US cheese volumes and milk supply were stable with demand from the retail sector driven by increased promotional activity. Foodservice demand remained reasonably robust through the year as consumers traded to value by moving to the quick service restaurant sector. US Cheese also continued to develop export markets with product exported to Latin America and Asia in 2009.
However, cheese prices declined steeply in January 2009 and remained low until the latter part of the year. Average 2009 US block cheddar prices on the Chicago Mercantile Exchange (CME) were 30% lower than 2008 levels. While reduced prices impacted revenue and profits, operating margin was sustained as a result of the pricing mechanisms of this business unit. These pricing mechanisms include the pricing of both raw material inputs and cheese outputs on a formula basis linked to publicly quoted market prices.
Global Nutritionals
The Global Nutritionals business is a leading supplier of advanced technology whey proteins and fractions, flax and customised micro-nutrients, vitamin and mineral premixes. It comprises three distinct businesses – Ingredient Technologies (business-to-business nutritional ingredients development and marketing); Customised Premix Solutions (business-to-business premix solutions provider) and Performance Nutrition (business-to-consumer manufacturer and marketer of products for performance nutrition and health and wellness). The Global Nutritionals business is headquartered in Ireland and has global operations employing approximately 750 people.
Global Nutritionals had a strong year demonstrating resilience against the global economic recession. The focus for Global Nutritionals during the year continued to be volume growth, further development of science-based nutritional solutions and the continued expansion of Optimum Nutrition which was acquired in August 2008. In 2009, all of Glanbia’s core nutritional sectors continued to grow, outperforming market growth rates. Glanbia Nutritionals is now a scale business with market leadership positions. In 2009, operating profit and operating margin showed good improvement.
Optimum Nutrition delivered an excellent full first year with the Group. Post acquisition integration has been successfully completed and the 2009 performance was driven by strong underlying volume growth, increased innovation together with continuing market and product development both in the USA and internationally.
Customised Premix Solutions delivered a solid performance with strong positions sustained during the year with core customers. A new premix plant in Missouri was commissioned during the year and is now fully operational. The Group’s premix plant in Suzhou, near Shanghai, China, which was fully commissioned in late-2008, continued to grow volumes.
Ingredient Technologies had a good year and continued to grow volumes and develop its added-value solutions business. Continued investment in research and development is being made in clinical, functional and emerging applications.
2010 outlook
US Cheese is expected to benefit from a better pricing environment. Global Nutritionals will continue to develop its product range and geographical reach. Overall, US Cheese & Global Nutritionals is expected to deliver good underlying growth although margins are likely to reduce somewhat due to a significant investment by Global Nutritionals in developing its resources and business.
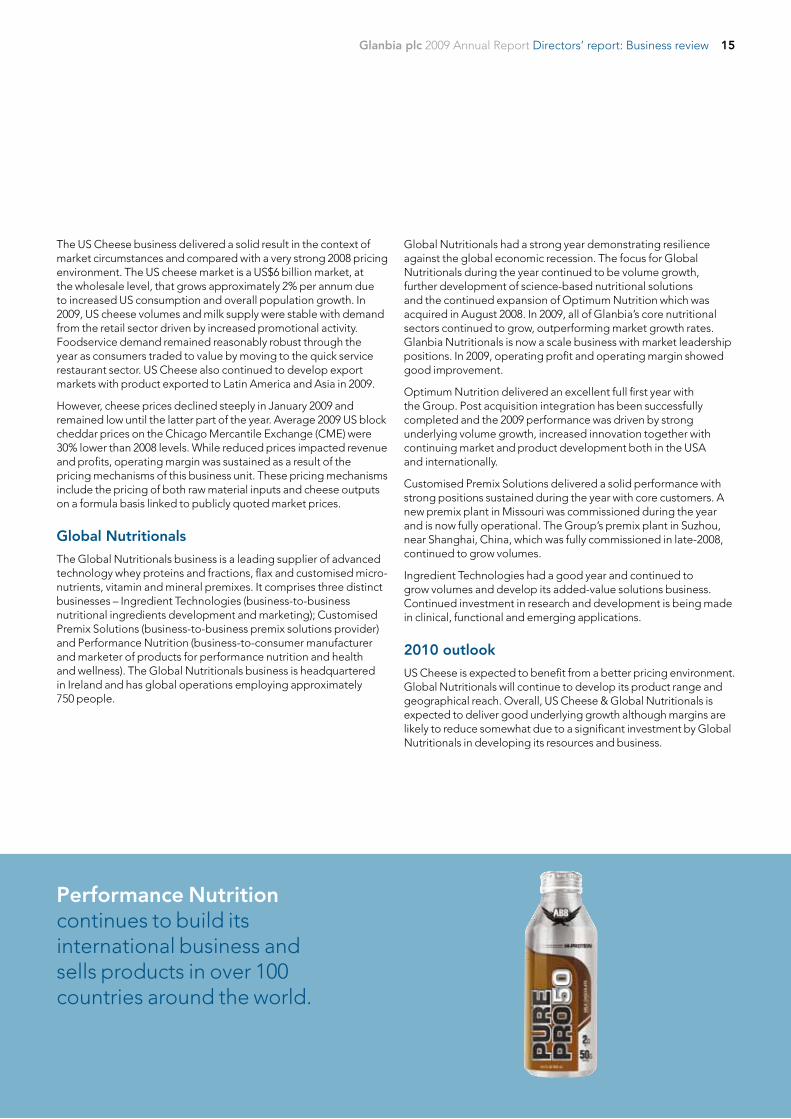
Performance Nutrition continues to build its international business and sells products in over 100 countries around the world.
Glanbia plc 2009 Annual Report Directors’ report: Business review16
Dairy Ireland had a very challenging year. Global dairy markets created a very difficult operating environment and gave rise to a major loss in Irish Dairy Ingredients for the full year.
Dairy Ireland is comprised of three business units. Dairy Ingredients is the largest dairy processor in Ireland, assembling a milk pool of 1.4 billion litres annually and processing this into dairy products and ingredients for sale on a business-to-business basis to customers in 50 countries. Consumer Products is one of the largest branded food suppliers in the Irish grocery sector and has seven brands in the Top 100. Agribusiness is primarily engaged in feed milling, grain processing and marketing and retails a range of farm inputs to the Group’s large Irish farmer supplier base. Its operations also include ‘CountryLife’, which is a broader retail offering for rural based communities.
2009 performance
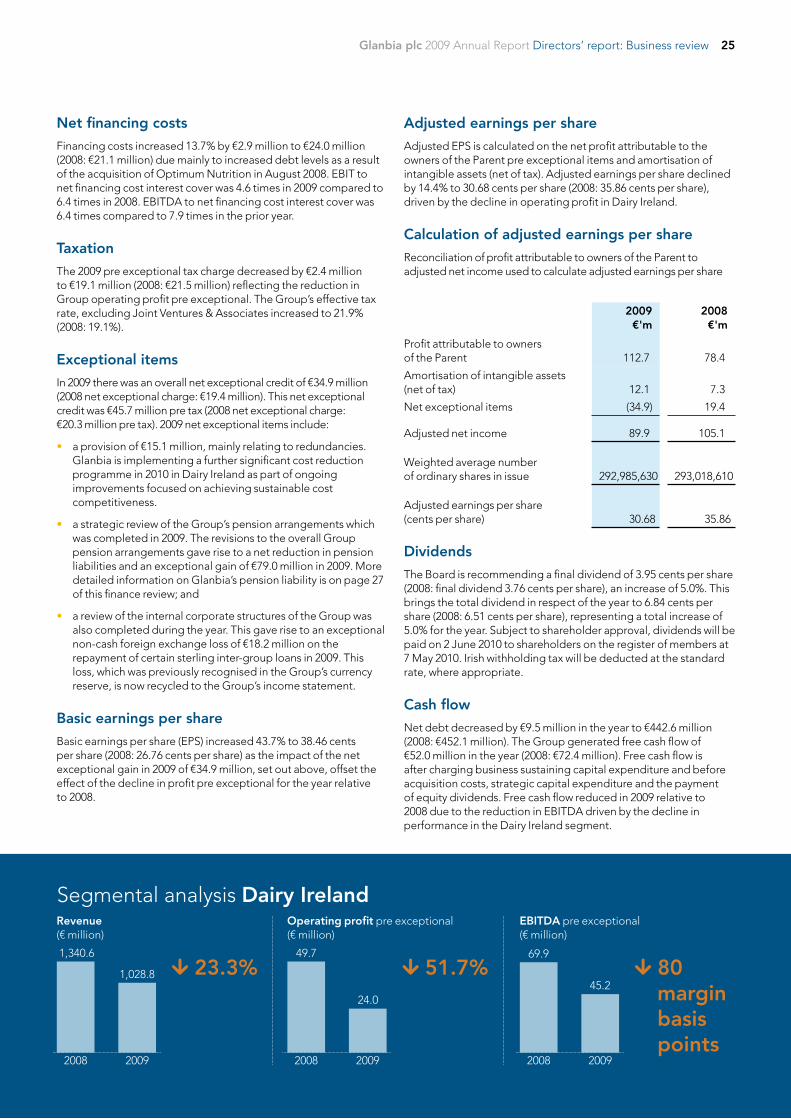
Dairy Ireland had a very challenging year. Revenue declined 23.3% to €1,028.8 million (2008: €1,340.6 million). Operating profit pre exceptional was down 51.7% to €24.0 million (2008: €49.7 million) and operating margin pre exceptional was 140 basis points lower at 2.3% (2008: 3.7%). While the most significant impact was the loss in Irish Dairy Ingredients, Consumer Products experienced a very competitive market place and Agribusiness suffered as a consequence of reduced farm spending. EBITDA pre exceptional decreased €24.7 million to €45.2 million (2008: €69.9 million) with EBITDA margin pre exceptional decreasing 80 basis points to 4.4% (2008: 5.2%).
Dairy Ingredients
Dairy Ingredients is the biggest business of its type in the country. It employs approximately 470 people at two large-scale processing facilities including one of the largest integrated dairy sites in Europe, which processes 40% of the Irish milk pool and 25% of the Irish whey pool. This business unit is a leading Irish supplier of lactose and other whey proteins to the three largest infant formula manufacturers in the world. It is also Ireland’s largest manufacturer of casein, a form of milk protein, and of cheddar cheese. Dairy Ingredients operates a joint venture with Corman SA, for the manufacture of butter fractions and dairy spreads in Ireland and has a sales and blending operation in Mexico.
Dairy Ingredients performance was severely impacted as raw material costs did not fully reflect the fall in product prices on global markets. Significant losses were incurred in the first half of the year with the rate of loss reduced as expected in the second half due to some recovery in markets and the impact of strategic cost reductions.
Operations review: Dairy Ireland
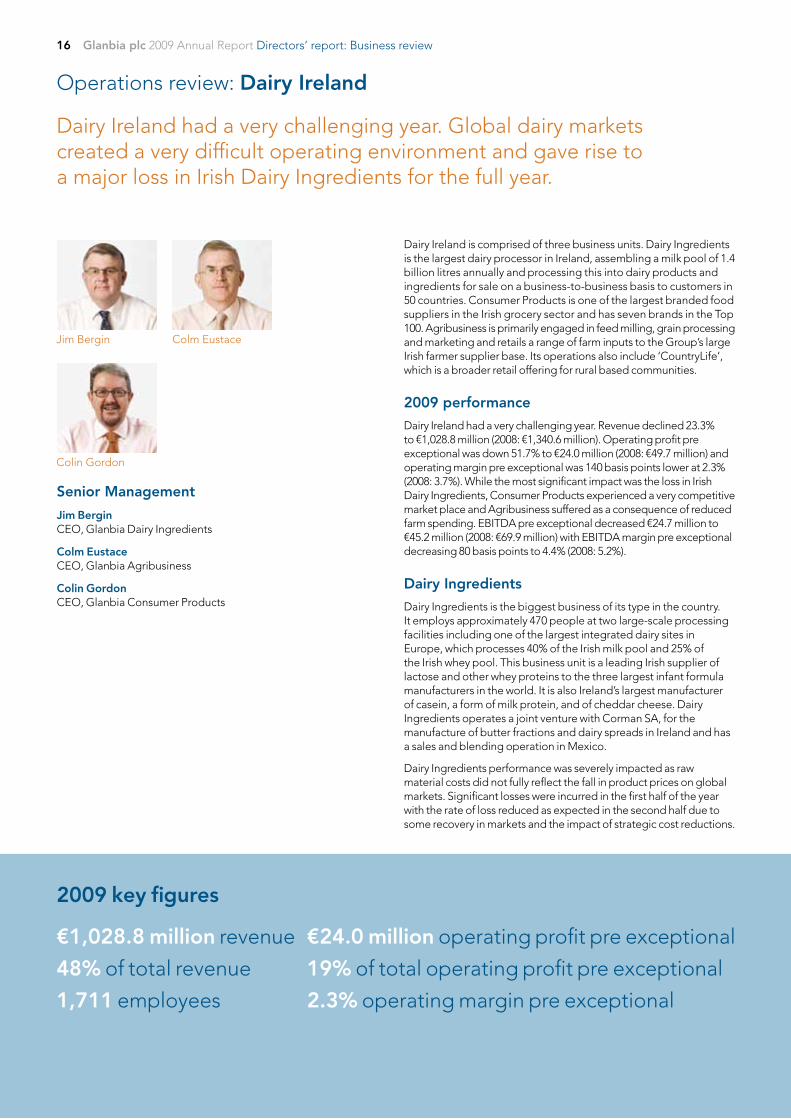
Senior Management
Jim BerginCEO, Glanbia Dairy Ingredients
Colm Eustace CEO, Glanbia Agribusiness
Colin GordonCEO, Glanbia Consumer Products
Jim Bergin Colm Eustace
Colin Gordon
€1,028.8 million revenue
48% of total revenue
1,711 employees
€24.0 million operating profit pre exceptional
19% of total operating profit pre exceptional
2.3% operating margin pre exceptional
2009 key figures
Glanbia plc 2009 Annual Report Directors’ report: Business review 17
During 2009, this business unit rationalised its production facilities and reduced the number of employees by 9%. This was facilitated by work practice changes and increased investment in automation and achieved significant cost savings. However, as it quickly became evident early in 2009 that the cost base at all levels of the industry could not be maintained, a further comprehensive review of Dairy Ingredients was completed mid-year with the objective to shape the business towards a sustainable position even in weak markets. As a result, an agreed strategic cost reduction programme is ongoing in 2010.
Notwithstanding the difficulties of 2009, Irish Dairy Ingredients continued to develop its product portfolio through diversification of its cheese product mix, entering new cheese markets and developing milk protein isolates for performance beverages and clinical nutrition sectors. In addition, the whey processing facility was commissioned during the year to ensure this business achieves the highest quality food and infant formula standards.
Consumer Products
Consumer Products has market leading positions in all sectors of fresh milk and cream, block cheddar cheese, grated cheddar cheese, fruit yogurts, kid’s fromage frais, drinking yogurt, fresh soup and smoothies. It employs approximately 720 people at 10 locations and processed 275 million litres of milk in 2009. Consumer Products supplies over 6,000 customers with 2.5 million consumer packs per day.
Consumer Products delivered a reasonable performance in a very competitive market place. The recession in Ireland led to a strong consumer focus on price and weaker sterling increased sterling-based competition. Consumer Products responded to this trading environment by reducing wholesale pricing, improving store-by-store sales force coverage, sustainable cost reduction initiatives and improving operational efficiency. In addition, major cost saving initiatives were undertaken including a 20% reduction in its workforce, reorganisation of production, administration and central support facilities and the introduction of a range of new technologies to improve operational efficiency. This programme is ongoing in 2010.
While volumes for the year declined broadly in line with the overall market decline of 7%, the rate of decline was significantly reduced by the fourth quarter through reshaping and increasing promotional plans and successfully launching new pack formats. New two litre milk formats were particularly successful in supporting volumes of branded milk products. Notable other successes during the year included winning new contracts in the foodservice sector and re-negotiating the Yoplait franchise for the Island of Ireland extending the term out to 2024.
Agribusiness
Agribusiness mills animal feed, processes and markets grain and retails a range of farm inputs to the Group’s large farmer supply base. It is the market leader in feed, fertiliser, seed grain, farm chemicals and veterinary products. It also includes CountryLife, which is a broader retail offering. The business employs over 510 people and currently operates at 53 locations. Four branches are set for closure in 2010, reducing the number of outlets to 49.
In 2009, reduced farm incomes led to a weaker sales performance from Agribusiness. As a result, revenue, operating profit and operating margin for this business unit were down on 2008. In response to market conditions and changing customer demands Agribusiness reshaped its sales organisation and developed a key account focus with dedicated individual sales staff for key commercial farm accounts.
2010 outlook
Dairy Ireland is expected to deliver a marked improvement this year mainly as a result of a recovery in Irish Dairy Ingredients and a continuation of the agreed strategic cost reduction programme.
Events after reporting period
In March 2010, Glanbia plc announced that Glanbia Co-operative Society Limited, its 54.6% shareholder, has expressed an interest in acquiring Glanbia’s Dairy Ireland operations. Further information is contained in the Chairman’s statement on page 7 and the Group Managing Director’s review on page 9, including a summary of Dairy Ireland’s strategy.
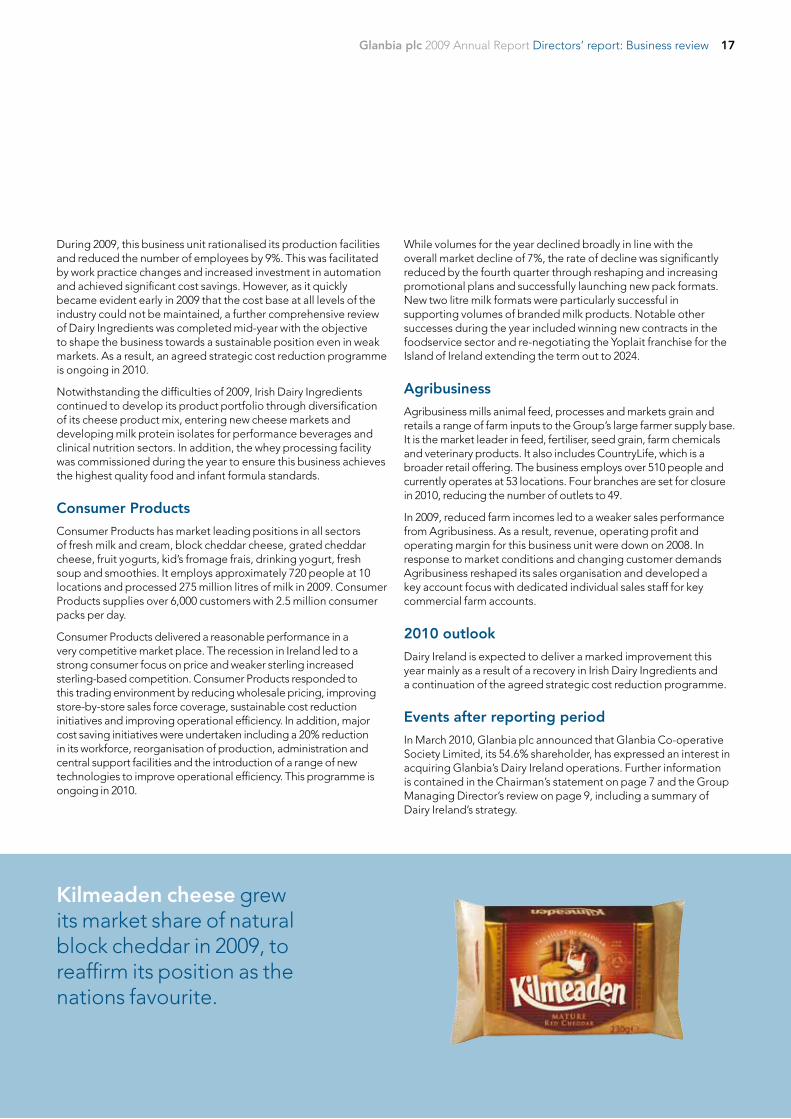
Kilmeaden cheese grew its market share of natural block cheddar in 2009, to reaffirm its position as the nations favourite.
Glanbia plc 2009 Annual Report Directors’ report: Business review18
Frank StephensonMel Glentzes
Glanbia’s share of the operating profit pre exceptional in the Joint Ventures & Associates at €17.4 million was marginally increased on 2008 levels.
Glanbia has three principal international joint ventures – Southwest Cheese in the USA, Glanbia Cheese in the UK and Nutricima in Nigeria and a number of smaller Irish based joint ventures and associates.
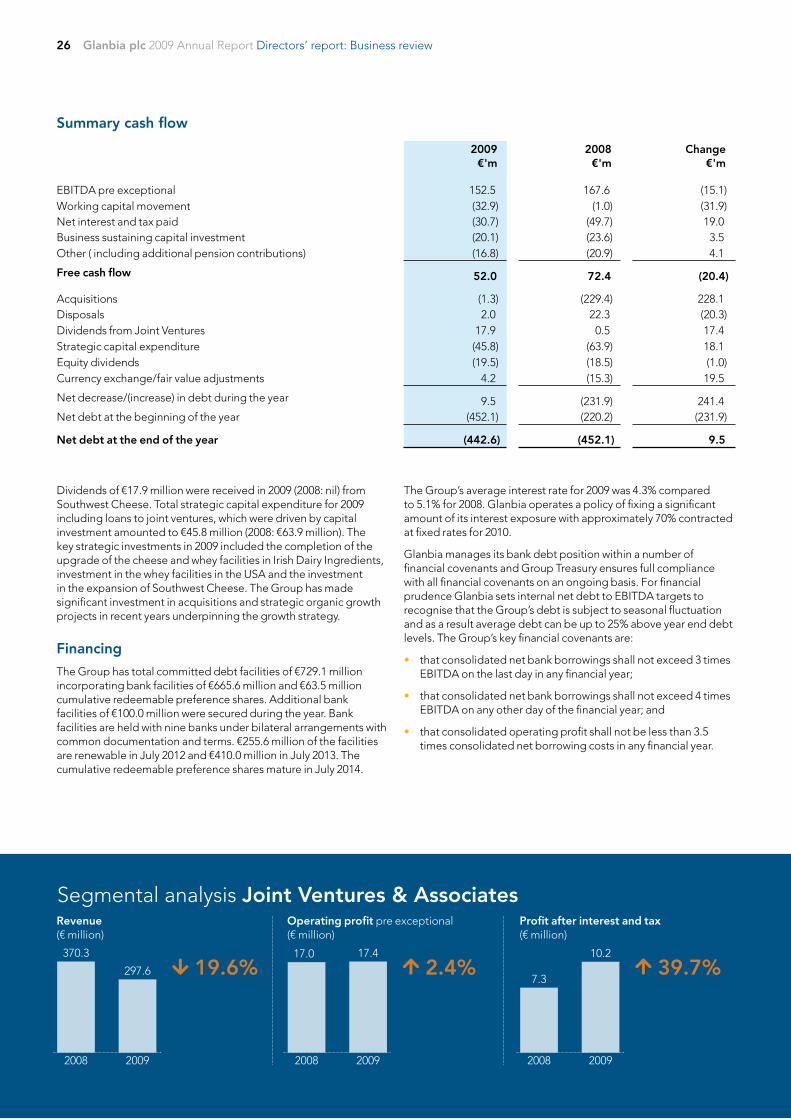
Glanbia’s share of revenue from Joint Ventures & Associates declined 19.6% to €297.6 million (2008: €370.3 million) mainly as a result of lower prices in US cheese markets and European mozzarella markets. Lower US cheese prices impacted Southwest Cheese. Weaker pricing for mozzarella cheese reduced revenue in Glanbia Cheese. Revenue at Nutricima in Nigeria was broadly flat year-on-year as double digit volume growth was offset by the impact of a depreciating Nigerian Naira:Euro exchange rate.
Glanbia’s share of the operating profit pre exceptional in the Joint Ventures & Associates at €17.4 million was marginally increased on 2008 levels. Operating profit pre exceptional in Southwest Cheese declined marginally in the year, which represented a robust performance in the context of an extremely low cheese price environment in the USA thoughout most of 2009. Operating profit in Glanbia Cheese in the UK also declined marginally due to weaker pricing for mozzarella cheese in its markets.
Operating margin pre exceptional in Joint Ventures & Associates grew 120 basis points to 5.8% (2008: 4.6%). Glanbia’s share of the EBITDA of Joint Ventures & Associates increased €0.7 million to €23.8 million (2008: €23.1 million) with EBITDA margins increasing 180 basis points to 8.0%. Southwest Cheese delivered a good performance including an increase in operating margin, albeit profit after tax was marginally lower when compared to a strong 2008. Glanbia Cheese in the UK experienced a decline in profit after tax although margins remained stable. Nutricima recorded a profit in 2009 representing an improved performance relative to the loss incurred in 2008. Glanbia’s share of profits - post interest and tax – was €10.2 million (2008: €7.3 million).
Operations review: Joint Ventures & Associates
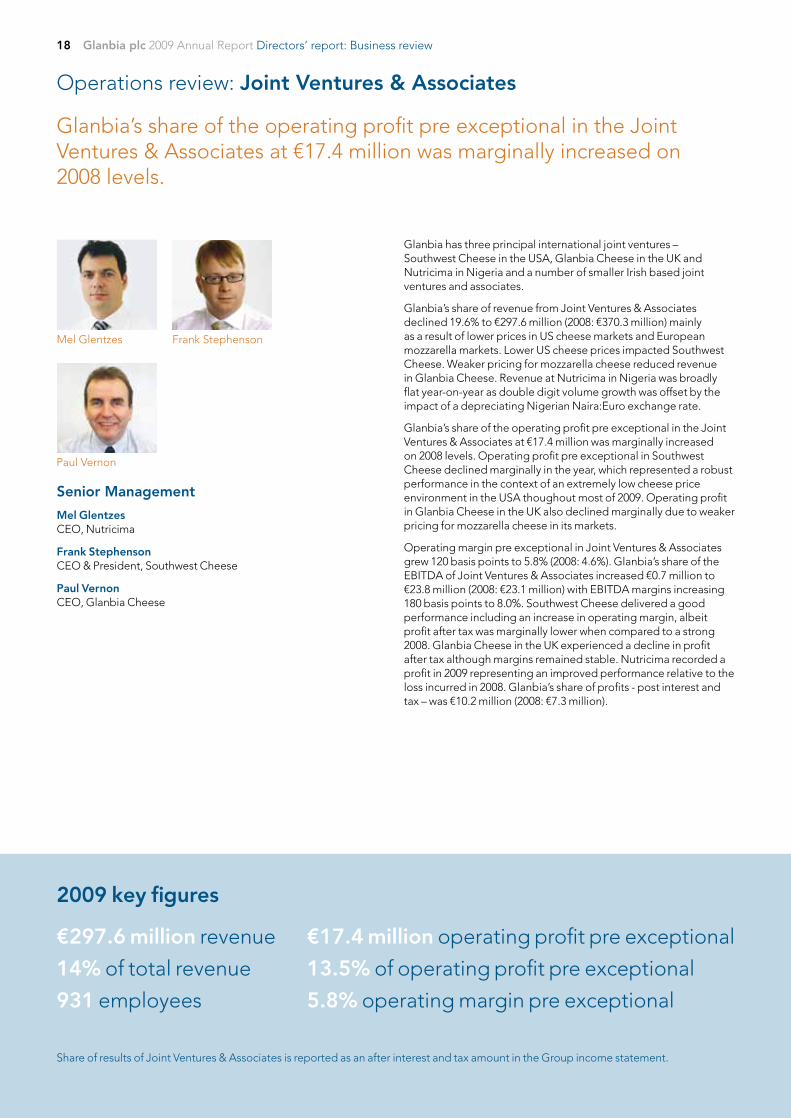
Senior Management
Mel GlentzesCEO, Nutricima
Frank StephensonCEO & President, Southwest Cheese
Paul VernonCEO, Glanbia Cheese
Paul Vernon
€297.6 million revenue
14% of total revenue
931 employees
€17.4 million operating profit pre exceptional
13.5% of operating profit pre exceptional
5.8% operating margin pre exceptional
Share of results of Joint Ventures & Associates is reported as an after interest and tax amount in the Group income statement.
2009 key figures
Glanbia plc 2009 Annual Report Directors’ report: Business review 19
Southwest Cheese
The largest business in the Group’s Joint Ventures & Associates segment is Southwest Cheese in the USA. In 2009, Southwest Cheese accounted for over 50% of the Group’s share of revenue of Joint Ventures & Associates and over 80% of Glanbia’s share of operating profit pre exceptional. All the output from Southwest Cheese is marketed by Glanbia in conjunction with the output from the Group’s wholly-owned US cheese and whey businesses. Combined, these businesses produced 340,000 tonnes of cheese in 2009, making Glanbia a leading supplier of American-style cheddar cheese in the US market today.
Southwest Cheese is located in Clovis, New Mexico, a major milk producing region in the USA. This business, a 50:50 joint venture between Glanbia and The Greater Southwest Agency, employs approximately 280 people. It is one of the largest natural cheese and high-protein whey processing plants in the world and is in its fourth year of operation. In 2009, Southwest Cheese produced 140,000 tonnes of American-style cheddar cheese and other American-style varieties of cheese and 9,000 tonnes of high protein whey.
Southwest Cheese delivered a consistently strong operating performance in 2009 and achieved stretch goals in terms of product throughput and quality. An expansion of the facility is currently underway which will increase output by 40% and is due to start processing milk by the end of the first quarter in 2010. This US$85 million project is currently on time and on budget and will consolidate Southwest Cheese’s position as the largest American-style cheddar cheese and whey facility in the world, processing 3.4 million litres of milk per day. The successful commissioning of this new facility is a critical milestone this year.
Southwest Cheese won three medals (one gold, one silver and one bronze) at the 2010 World Cheese Championships.
Glanbia Cheese
Glanbia has a 51% interest in Glanbia Cheese, which is a joint venture with Leprino Foods Company, USA. This business unit produces mozzarella cheese for the European pizza market in shredded, ribbon and string formats and is one of Europe’s leading suppliers of mozzarella cheese to the foodservice and retail pizza sector. Glanbia Cheese employs approximately 340 people at three locations, including two cheese processing facilities, one in Wales and one in Northern Ireland.
Nutricima
Nutricima is a 50:50 joint venture with PZ Cussons plc and is based in Nigeria. Nutricima is developing a portfolio of branded consumer products to serve all market segments including liquid, condensed and powdered milk-based products in the Nigerian market. Nigeria is a large and developing market with an estimated population of 150 million and a local oil industry. Undoubtedly the scale of the global economic downturn has impacted the pace of development of countries in Africa and created significant economic turmoil, but despite this, the business has performed satisfactorily in 2009. Nutricima employs approximately 315 people at its evaporated milk manufacturing and powder packing facility and its newly commissioned Ready-To-Drink factory near the capital, Lagos.
2010 outlook
Joint Ventures & Associates are expected to deliver a reasonable result, underpinned by a good year from Southwest Cheese.
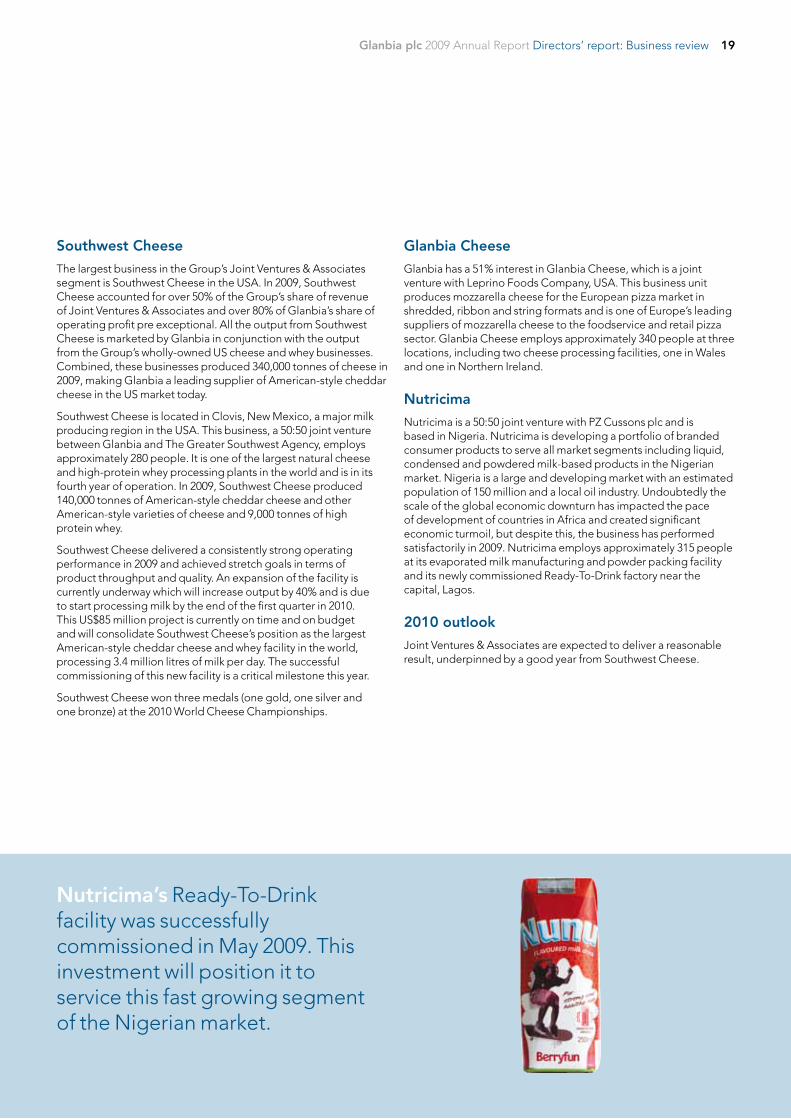
Nutricima’s Ready-To-Drink facility was successfully commissioned in May 2009. This investment will position it to service this fast growing segment of the Nigerian market.

2020
Established, scale businesses with market leading positions

2121
Focusing on cost competitiveness and operational
excellence
Glanbia plc 2009 Annual Report Directors’ report: Business review22
2009 highlights
The Group’s operating margin pre exceptional grew by 10 basis points to 6.1% (2008: 6.0%), reflecting an increased contribution by higher margin businesses. Our earnings before interest, tax, depreciation and amortisation (EBITDA) margin grew 80 basis points to 8.3%. We spent €45.8 million on strategic capital expenditure during the year ensuring that the business is sustained in the best possible position, despite an unprecedented year.
While adjusted EPS was in line with market expectations, it declined 14.4% to 30.68 cents per share (2008: 35.86 cents per share). Dividend per share increased 5.0% to 6.84 cents per share (2008: 6.51 cents per share).
A strategic review of the Group’s pension arrangements was completed during 2009, giving rise to a net reduction in the Group’s pension liabilities and an exceptional net gain of €79.0 million in 2009. Further details are included on page 27 of this review.
Throughout 2009 we focused on embedding strategic cost reductions and running our operations as effectively and efficiently as possible. This cost competitiveness focus will continue into 2010.
Finance review
Throughout the year we focused on embedding strategic cost reductions and running our operations as effectively and efficiently as possible. We contained the decline in our financial results with a strong performance by Global Nutritionals, a resilient performance by US Cheese and the benefits of strategic cost reductions.
Operating margin pre exceptional including Joint Ventures & Associates
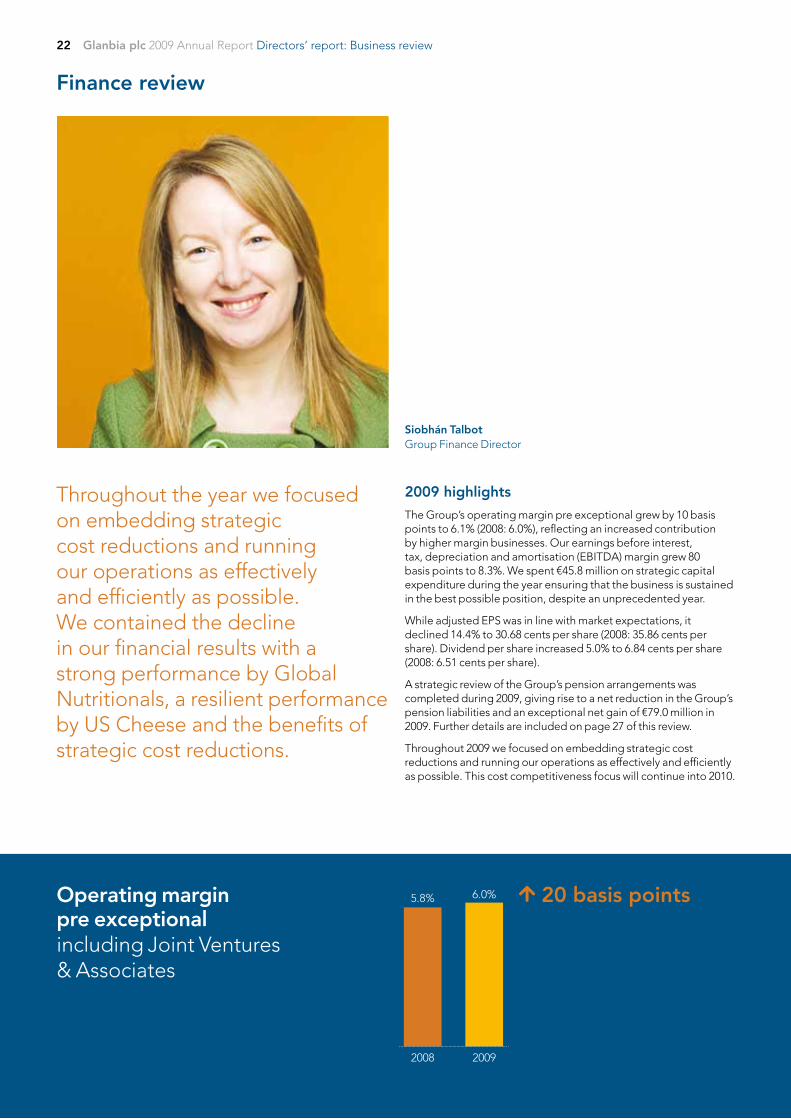
Siobhán Talbot Group Finance Director
6.0%
2008
5.8% 20 basis points
2009
Glanbia plc 2009 Annual Report Directors’ report: Business review 23
Financial summary
2009 2008
Group
Joint Ventures & Associates Total Group
Joint Ventures & Associates Total
Year-on-year change
Revenue €1,830.3m €297.6m €2,127.9m €2,232.2m €370.3m €2,602.5m (18.2%)Operating profit pre exceptional €111.2m €17.4m €128.6m €134.1m €17.0m €151.1m (14.9%)Net financing costs (€24.0m) (€3.5m) (€27.5m) (€21.1m) (€3.9m) (€25.0m) 10.0%Profit before tax pre exceptional €87.2m €13.9m €101.1m €113.0m €13.1m €126.1m (19.8%)Taxation pre exceptional (€19.1m) (€3.7m) (€22.8m) (€21.5m) (€5.8m) (€27.3m) (16.5%)Profit after tax pre exceptional €68.1m €10.2m €78.3m €91.5m €7.3m €98.8m (20.7%)Net exceptional items (post tax) €34.9m – €34.9m (€18.5m) (€0.9m) (€19.4m)
Operating margin pre exceptional 6.1% 5.8% 6.0% 6.0% 4.6% 5.8%EBITDA pre exceptional €152.5m €23.8m €176.3m €167.6m €23.1m €190.7mEBITDA margin pre exceptional 8.3% 8.0% 8.3% 7.5% 6.2% 7.3%
Basic earnings per share (cents) 38.46c 26.76c 43.7%Adjusted net income €89.9m €105.1m (14.4%)Adjusted earnings per share (cents) 30.68c 35.86c (14.4%)
€/US$ - average 1.3948 1.4704 €/US$ - closing rate 1.4406 1.3888 €/US$ - opening rate 1.3888 1.4711
Revenue
Total revenue including share of Joint Ventures & Associates, declined 18.2% to €2,127.9 million (2008: €2,602.5 million). Revenue in US Cheese & Global Nutritionals was down €51.8 million to €792.4 million. This reflects the impact of significantly lower US cheese markets, which were not fully offset by strong revenue growth in Global Nutritionals including the full year effect of the acquisition of Optimum Nutrition. Revenue in Dairy Ireland declined €311.8 million to €1,028.8 million (2008: €1,340.6 million). Weak global dairy markets reduced revenue directly in Dairy Ingredients and indirectly in Agribusiness while extremely challenging Irish consumer market conditions impacted Consumer Products. Revenue in Joint Ventures & Associates was down €72.7 million to €297.6 million (2008: €370.3 million) primarily due to a decline in revenue in Southwest Cheese driven by lower US cheese prices.
Profitability and margins
Operating profit pre exceptional including share of Joint Ventures & Associates declined 14.9% to €128.6 million (2008: €151.1 million), driven primarily by a loss in Dairy Ingredients. Operating margin pre exceptional including share of Joint Ventures & Associates increased 20 basis points to 6.0% (2008: 5.8%). US Cheese & Global Nutritionals delivered a significant increase in operating margin pre exceptional, primarily due to a strong performance by Global Nutritionals including the full year effect of the acquisition of Optimum Nutrition. Joint Ventures & Associates also delivered a robust performance. EBITDA including share of Joint Ventures & Associates declined 7.6% to €176.3 million (2008: €190.7 million). EBITDA margin including share of Joint Ventures & Associates increased 100 basis points to 8.3% (2008: 7.3%).
EBITDA margin pre exceptional including Joint Ventures & Associates
2008
7.3%8.3%
2009
100 basis points
Glanbia plc 2009 Annual Report Directors’ report: Business review24
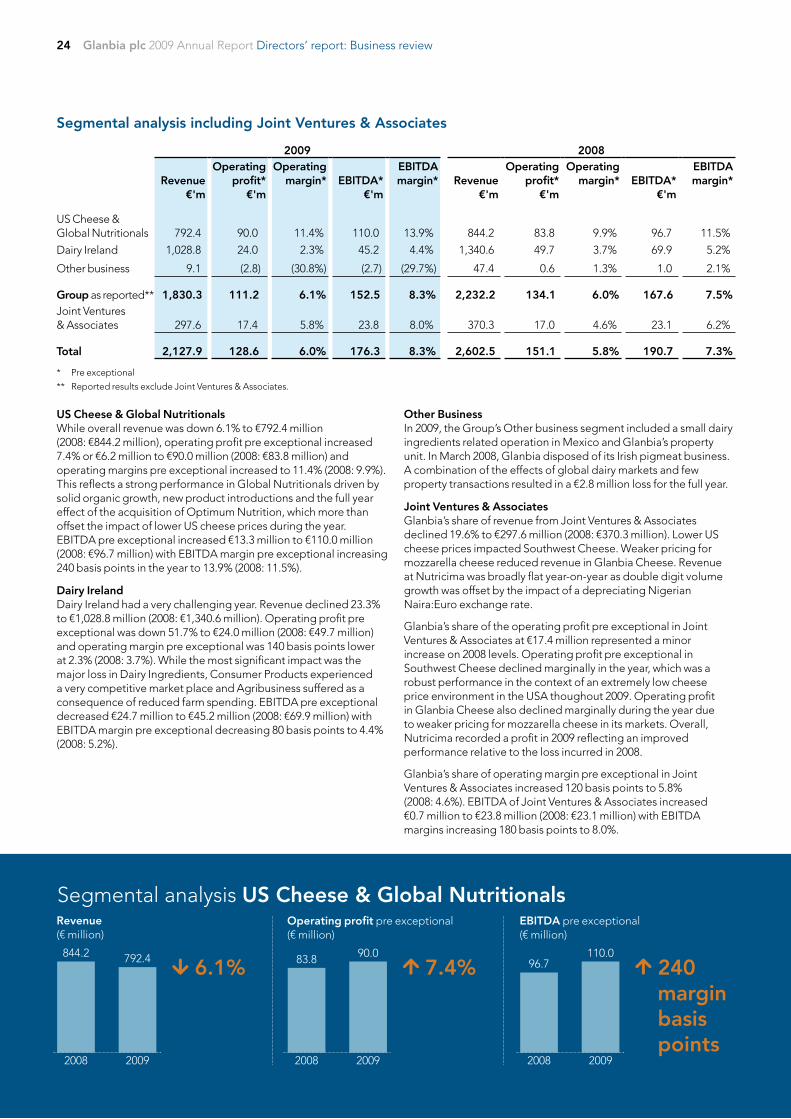
Segmental analysis including Joint Ventures & Associates
2009 2008
Revenue
€'m
Operating profit*
€'m
Operating margin* EBITDA*
€'m
EBITDA margin*
Revenue
€'m
Operating profit*
€'m
Operating margin*
EBITDA*
€'m
EBITDA margin*
US Cheese & Global Nutritionals 792.4 90.0 11.4% 110.0 13.9% 844.2 83.8 9.9% 96.7 11.5%
Dairy Ireland 1,028.8 24.0 2.3% 45.2 4.4% 1,340.6 49.7 3.7% 69.9 5.2%
Other business 9.1 (2.8) (30.8%) (2.7) (29.7%) 47.4 0.6 1.3% 1.0 2.1%
Group as reported** 1,830.3 111.2 6.1% 152.5 8.3% 2,232.2 134.1 6.0% 167.6 7.5%Joint Ventures & Associates 297.6 17.4 5.8% 23.8 8.0% 370.3 17.0 4.6% 23.1 6.2%
Total 2,127.9 128.6 6.0% 176.3 8.3% 2,602.5 151.1 5.8% 190.7 7.3% * Pre exceptional
** Reported results exclude Joint Ventures & Associates.
US Cheese & Global NutritionalsWhile overall revenue was down 6.1% to €792.4 million (2008: €844.2 million), operating profit pre exceptional increased 7.4% or €6.2 million to €90.0 million (2008: €83.8 million) and operating margins pre exceptional increased to 11.4% (2008: 9.9%). This reflects a strong performance in Global Nutritionals driven by solid organic growth, new product introductions and the full year effect of the acquisition of Optimum Nutrition, which more than offset the impact of lower US cheese prices during the year. EBITDA pre exceptional increased €13.3 million to €110.0 million (2008: €96.7 million) with EBITDA margin pre exceptional increasing 240 basis points in the year to 13.9% (2008: 11.5%).
Dairy IrelandDairy Ireland had a very challenging year. Revenue declined 23.3% to €1,028.8 million (2008: €1,340.6 million). Operating profit pre exceptional was down 51.7% to €24.0 million (2008: €49.7 million) and operating margin pre exceptional was 140 basis points lower at 2.3% (2008: 3.7%). While the most significant impact was the major loss in Dairy Ingredients, Consumer Products experienced a very competitive market place and Agribusiness suffered as a consequence of reduced farm spending. EBITDA pre exceptional decreased €24.7 million to €45.2 million (2008: €69.9 million) with EBITDA margin pre exceptional decreasing 80 basis points to 4.4% (2008: 5.2%).
Other BusinessIn 2009, the Group’s Other business segment included a small dairy ingredients related operation in Mexico and Glanbia’s property unit. In March 2008, Glanbia disposed of its Irish pigmeat business. A combination of the effects of global dairy markets and few property transactions resulted in a €2.8 million loss for the full year.
Joint Ventures & AssociatesGlanbia’s share of revenue from Joint Ventures & Associates declined 19.6% to €297.6 million (2008: €370.3 million). Lower US cheese prices impacted Southwest Cheese. Weaker pricing for mozzarella cheese reduced revenue in Glanbia Cheese. Revenue at Nutricima was broadly flat year-on-year as double digit volume growth was offset by the impact of a depreciating Nigerian Naira:Euro exchange rate.
Glanbia’s share of the operating profit pre exceptional in Joint Ventures & Associates at €17.4 million represented a minor increase on 2008 levels. Operating profit pre exceptional in Southwest Cheese declined marginally in the year, which was a robust performance in the context of an extremely low cheese price environment in the USA thoughout 2009. Operating profit in Glanbia Cheese also declined marginally during the year due to weaker pricing for mozzarella cheese in its markets. Overall, Nutricima recorded a profit in 2009 reflecting an improved performance relative to the loss incurred in 2008.
Glanbia’s share of operating margin pre exceptional in Joint Ventures & Associates increased 120 basis points to 5.8% (2008: 4.6%). EBITDA of Joint Ventures & Associates increased €0.7 million to €23.8 million (2008: €23.1 million) with EBITDA margins increasing 180 basis points to 8.0%.
Revenue (€ million)
844.2 792.4 6.1%
2008 2009
Operating profit pre exceptional(€ million)
83.8 90.0
7.4%
2008 2009
EBITDA pre exceptional (€ million)
96.7110.0
240 margin basis points
2008 2009
Segmental analysis US Cheese & Global Nutritionals
Glanbia plc 2009 Annual Report Directors’ report: Business review 25
Net financing costs
Financing costs increased 13.7% by €2.9 million to €24.0 million (2008: €21.1 million) due mainly to increased debt levels as a result of the acquisition of Optimum Nutrition in August 2008. EBIT to net financing cost interest cover was 4.6 times in 2009 compared to 6.4 times in 2008. EBITDA to net financing cost interest cover was 6.4 times compared to 7.9 times in the prior year.
Taxation
The 2009 pre exceptional tax charge decreased by €2.4 million to €19.1 million (2008: €21.5 million) reflecting the reduction in Group operating profit pre exceptional. The Group’s effective tax rate, excluding Joint Ventures & Associates increased to 21.9% (2008: 19.1%).
Exceptional items
In 2009 there was an overall net exceptional credit of €34.9 million (2008 net exceptional charge: €19.4 million). This net exceptional credit was €45.7 million pre tax (2008 net exceptional charge: €20.3 million pre tax). 2009 net exceptional items include:
• a provision of €15.1 million, mainly relating to redundancies. Glanbia is implementing a further significant cost reduction programme in 2010 in Dairy Ireland as part of ongoing improvements focused on achieving sustainable cost competitiveness.
• a strategic review of the Group’s pension arrangements which was completed in 2009. The revisions to the overall Group pension arrangements gave rise to a net reduction in pension liabilities and an exceptional gain of €79.0 million in 2009. More detailed information on Glanbia’s pension liability is on page 27 of this finance review; and
• a review of the internal corporate structures of the Group was also completed during the year. This gave rise to an exceptional non-cash foreign exchange loss of €18.2 million on the repayment of certain sterling inter-group loans in 2009. This loss, which was previously recognised in the Group’s currency reserve, is now recycled to the Group’s income statement.
Basic earnings per share
Basic earnings per share (EPS) increased 43.7% to 38.46 cents per share (2008: 26.76 cents per share) as the impact of the net exceptional gain in 2009 of €34.9 million, set out above, offset the effect of the decline in profit pre exceptional for the year relative to 2008.
Adjusted earnings per share
Adjusted EPS is calculated on the net profit attributable to the owners of the Parent pre exceptional items and amortisation of intangible assets (net of tax). Adjusted earnings per share declined by 14.4% to 30.68 cents per share (2008: 35.86 cents per share), driven by the decline in operating profit in Dairy Ireland.
Calculation of adjusted earnings per share
Reconciliation of profit attributable to owners of the Parent to adjusted net income used to calculate adjusted earnings per share
2009 €'m
2008 €'m
Profit attributable to owners of the Parent 112.7 78.4
Amortisation of intangible assets (net of tax) 12.1 7.3
Net exceptional items (34.9) 19.4
Adjusted net income 89.9 105.1
Weighted average number of ordinary shares in issue 292,985,630 293,018,610
Adjusted earnings per share (cents per share) 30.68 35.86
Dividends
The Board is recommending a final dividend of 3.95 cents per share (2008: final dividend 3.76 cents per share), an increase of 5.0%. This brings the total dividend in respect of the year to 6.84 cents per share (2008: 6.51 cents per share), representing a total increase of 5.0% for the year. Subject to shareholder approval, dividends will be paid on 2 June 2010 to shareholders on the register of members at 7 May 2010. Irish withholding tax will be deducted at the standard rate, where appropriate.
Cash flow
Net debt decreased by €9.5 million in the year to €442.6 million (2008: €452.1 million). The Group generated free cash flow of €52.0 million in the year (2008: €72.4 million). Free cash flow is after charging business sustaining capital expenditure and before acquisition costs, strategic capital expenditure and the payment of equity dividends. Free cash flow reduced in 2009 relative to 2008 due to the reduction in EBITDA driven by the decline in performance in the Dairy Ireland segment.
1,340.6
1,028.8 23.3%
2008 2009
49.7
24.0
51.7%
2008 2009
69.9
45.2 80 margin basis points
2008 2009
Segmental analysis Dairy IrelandRevenue (€ million)
Operating profit pre exceptional(€ million)
EBITDA pre exceptional (€ million)
Glanbia plc 2009 Annual Report Directors’ report: Business review26
Summary cash flow
2009 €'m
2008 €'m
Change €'m
EBITDA pre exceptional 152.5 167.6 (15.1)Working capital movement (32.9) (1.0) (31.9)Net interest and tax paid (30.7) (49.7) 19.0Business sustaining capital investment (20.1) (23.6) 3.5Other ( including additional pension contributions) (16.8) (20.9) 4.1
Free cash flow 52.0 72.4 (20.4)
Acquisitions (1.3) (229.4) 228.1Disposals 2.0 22.3 (20.3)Dividends from Joint Ventures 17.9 0.5 17.4Strategic capital expenditure (45.8) (63.9) 18.1Equity dividends (19.5) (18.5) (1.0)Currency exchange/fair value adjustments 4.2 (15.3) 19.5
Net decrease/(increase) in debt during the year 9.5 (231.9) 241.4Net debt at the beginning of the year (452.1) (220.2) (231.9)
Net debt at the end of the year (442.6) (452.1) 9.5
Dividends of €17.9 million were received in 2009 (2008: nil) from Southwest Cheese. Total strategic capital expenditure for 2009 including loans to joint ventures, which were driven by capital investment amounted to €45.8 million (2008: €63.9 million). The key strategic investments in 2009 included the completion of the upgrade of the cheese and whey facilities in Irish Dairy Ingredients, investment in the whey facilities in the USA and the investment in the expansion of Southwest Cheese. The Group has made significant investment in acquisitions and strategic organic growth projects in recent years underpinning the growth strategy.
Financing
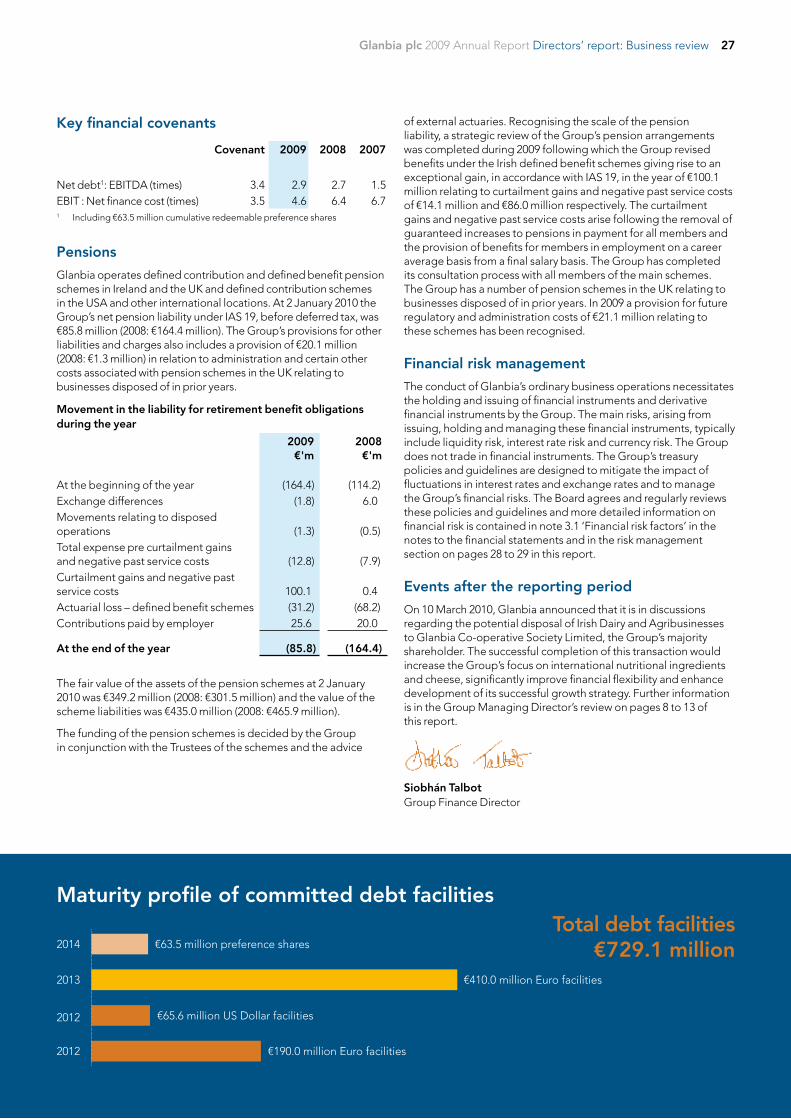
The Group has total committed debt facilities of €729.1 million incorporating bank facilities of €665.6 million and €63.5 million cumulative redeemable preference shares. Additional bank facilities of €100.0 million were secured during the year. Bank facilities are held with nine banks under bilateral arrangements with common documentation and terms. €255.6 million of the facilities are renewable in July 2012 and €410.0 million in July 2013. The cumulative redeemable preference shares mature in July 2014.
The Group’s average interest rate for 2009 was 4.3% compared to 5.1% for 2008. Glanbia operates a policy of fixing a significant amount of its interest exposure with approximately 70% contracted at fixed rates for 2010.
Glanbia manages its bank debt position within a number of financial covenants and Group Treasury ensures full compliance with all financial covenants on an ongoing basis. For financial prudence Glanbia sets internal net debt to EBITDA targets to recognise that the Group’s debt is subject to seasonal fluctuation and as a result average debt can be up to 25% above year end debt levels. The Group’s key financial covenants are:
• that consolidated net bank borrowings shall not exceed 3 times EBITDA on the last day in any financial year;
• that consolidated net bank borrowings shall not exceed 4 times EBITDA on any other day of the financial year; and
• that consolidated operating profit shall not be less than 3.5 times consolidated net borrowing costs in any financial year.
370.3
297.6 19.6%
2008 2009
17.0 17.4
2.4%
2008 2009
7.3
10.2
39.7%
2008 2009
Segmental analysis Joint Ventures & AssociatesRevenue (€ million)
Operating profit pre exceptional(€ million)
Profit after interest and tax (€ million)
Glanbia plc 2009 Annual Report Directors’ report: Business review 27
Key financial covenants
Covenant 2009 2008 2007
Net debt1: EBITDA (times) 3.4 2.9 2.7 1.5EBIT : Net finance cost (times) 3.5 4.6 6.4 6.71 Including €63.5 million cumulative redeemable preference shares
Pensions
Glanbia operates defined contribution and defined benefit pension schemes in Ireland and the UK and defined contribution schemes in the USA and other international locations. At 2 January 2010 the Group’s net pension liability under IAS 19, before deferred tax, was €85.8 million (2008: €164.4 million). The Group’s provisions for other liabilities and charges also includes a provision of €20.1 million (2008: €1.3 million) in relation to administration and certain other costs associated with pension schemes in the UK relating to businesses disposed of in prior years.
Movement in the liability for retirement benefit obligations during the year
2009 €'m
2008 €'m
At the beginning of the year (164.4) (114.2)Exchange differences (1.8) 6.0Movements relating to disposed operations (1.3) (0.5)Total expense pre curtailment gains and negative past service costs (12.8) (7.9)Curtailment gains and negative past service costs 100.1 0.4Actuarial loss – defined benefit schemes (31.2) (68.2)Contributions paid by employer 25.6 20.0
At the end of the year (85.8) (164.4)
The fair value of the assets of the pension schemes at 2 January 2010 was €349.2 million (2008: €301.5 million) and the value of the scheme liabilities was €435.0 million (2008: €465.9 million).
The funding of the pension schemes is decided by the Group in conjunction with the Trustees of the schemes and the advice
of external actuaries. Recognising the scale of the pension liability, a strategic review of the Group’s pension arrangements was completed during 2009 following which the Group revised benefits under the Irish defined benefit schemes giving rise to an exceptional gain, in accordance with IAS 19, in the year of €100.1 million relating to curtailment gains and negative past service costs of €14.1 million and €86.0 million respectively. The curtailment gains and negative past service costs arise following the removal of guaranteed increases to pensions in payment for all members and the provision of benefits for members in employment on a career average basis from a final salary basis. The Group has completed its consultation process with all members of the main schemes. The Group has a number of pension schemes in the UK relating to businesses disposed of in prior years. In 2009 a provision for future regulatory and administration costs of €21.1 million relating to these schemes has been recognised.
Financial risk management
The conduct of Glanbia’s ordinary business operations necessitates the holding and issuing of financial instruments and derivative financial instruments by the Group. The main risks, arising from issuing, holding and managing these financial instruments, typically include liquidity risk, interest rate risk and currency risk. The Group does not trade in financial instruments. The Group’s treasury policies and guidelines are designed to mitigate the impact of fluctuations in interest rates and exchange rates and to manage the Group’s financial risks. The Board agrees and regularly reviews these policies and guidelines and more detailed information on financial risk is contained in note 3.1 ‘Financial risk factors’ in the notes to the financial statements and in the risk management section on pages 28 to 29 in this report.
Events after the reporting period
On 10 March 2010, Glanbia announced that it is in discussions regarding the potential disposal of Irish Dairy and Agribusinesses to Glanbia Co-operative Society Limited, the Group’s majority shareholder. The successful completion of this transaction would increase the Group’s focus on international nutritional ingredients and cheese, significantly improve financial flexibility and enhance development of its successful growth strategy. Further information is in the Group Managing Director’s review on pages 8 to 13 of this report.
Siobhán Talbot Group Finance Director
2012 €190.0 million Euro facilities
2013 €410.0 million Euro facilities
€65.6 million US Dollar facilities
2014 €63.5 million preference shares
2012
Maturity profile of committed debt facilitiesTotal debt facilities
€729.1 million
Glanbia plc 2009 Annual Report Directors’ report: Business review28
Evolution of risk identification and management
The Board is ultimately responsible for risk management which includes the Group’s risk governance structure and maintaining an appropriate internal control framework. The Audit Committee Terms of Reference includes responsibility for reviewing the effectiveness of the Group internal control and risk management systems. This incorporates reporting to the Board on the effectiveness, efficiency and sustainability of the internal control system environment. A structured and consistent approach to identifying, assessing and responding to risk in relation to the Group’s strategic and business objectives is fundamental to continued growth and is a key element of creating and preserving shareholder value. Management’s responsibility is to manage risk on behalf of the Board.
In early 2009 the Audit Committee, in conjunction with members of the executive management team, including the Group Managing Director and Group Finance Director, reviewed the population of risks the business is exposed to and identified and evaluated the key areas of risk for Glanbia. Once identified a programme of key Group business and strategic risk reports were developed requiring the responsible individuals within the Group to present either to the Audit Committee or directly to the Board on the steps taken to manage such risks having due regard to the balance of risk, cost and opportunity. Risk reports typically included:
• the structure of the functional or business unit organisation;
• the functional role and responsibilities for key risk management;
• an evaluation assessing the likelihood, impact and velocity of potential negative events occurring within the relevant function which may effect the Group’s financial, operational or regulatory control objectives;
• management’s response to the identified risks (i.e. risk acceptance, reduction, avoidance or elimination);
• details of how the control activities encompassed in the Group’s policies and procedures are utilised effectively and efficiently to manage risk;
• the information and communication systems used to ensure management decision-making is properly supported; and
• the controls in place to allow consistent monitoring of business performance.
Group risk management presentations have included functional reviews; product safety and quality; business continuity risk; strategic and business risk assessment; human resource, succession planning and health and safety risks; business services and IT system risk; financial control and related controls; and treasury, liquidity and tax management.
The Audit Committee, following careful consideration, reported to the Board expressing their level of satisfaction with the processes and procedures in place to manage key Group business and strategic risks and how these are being implemented throughout the Group.
Principal risks and uncertainties
Under Irish Company law (Regulation 37 of the European Communities (Companies Group Accounts) Regulations 1992, as amended), the Group is required to give a description of the principal risks and uncertainties which it faces. Across the business, there is an ongoing process in place for identifying, assessing, managing, monitoring and reporting on the significant risks faced by individual business units and by the Group as a whole. This process has been in place for the year under review and up to and including the date of approval of the 2009 Annual Report. The principal strategic, financial, operational and regulatory risks identified are set out below in the following sections.
Strategic risks
• The performance of the Group is influenced by economic growth, global dairy and US cheese markets, consumer confidence and changes in commodity prices. Declining general economic conditions and dairy market volatility negatively impacted 2009 results and the pace and sustainability of an improvement in markets, which commenced in late 2009, may continue to impact Glanbia’s business. A deterioration or delay in economic recovery or acute volatility in dairy pricing represents a material risk to the operating performance and financial position of the Group. To help mitigate this, the Group has employed, particularly in the USA, a number of risk management tools to limit volatility. In addition, the Group has a portfolio of businesses and this approach, with a growing emphasis on international operations, mitigated some of the worst effects of the unprecedented trading environment experienced in 2009.
• Competitor product innovations technical advances and the intensification or consolidation of competition could adversely affect the Group. To combat competitive threats the Group has re-positioned the business with a focus on high growth, profitable market segments where the Group has market leadership positions, strong brands, excellent customer relationships and a solid platform for international growth. Glanbia also invests in research and development through its Irish and USA innovation centres as well as associations with a number of third level institution research programmes.
• Glanbia has a significant number of key customers across its portfolio of businesses and consequently there is a risk that business performance could be negatively impacted by the loss of one or more of these customers. The Group believes that it currently enjoys good relationships with major customers and continues to manage and develop these relationships by focusing on superior customer service, product innovation, quality assurance and cost competitiveness.
• Although demand for food products is expected to remain broadly stable, consumer purchasing patterns tend to change over time and especially when the economy is weak. The success of the Group depends on its ability to react to changing trends with appropriate innovation.
Risk management
This section of the report sets out a review of the evolution of risk identification and management undertaken during the year together with a description of the main risk factors facing the Group.
Glanbia plc 2009 Annual Report Directors’ report: Business review 29
• Failure to attract and retain qualified personnel could negatively impact the execution of Glanbia’s strategy. Glanbia strives to attract and retain the right quality of management and staff required to support its growth and customer relationship management requirements. Detailed management succession plans, strong recruitment processes, management development programmes, long-term incentives and retention initiatives have all been implemented and are routinely monitored to manage the risk.
• Risks inherent in the acquisition or disposal of businesses and brands may have an adverse impact on the Group’s business or financial results. The risks are partially mitigated by careful planning, significant pre acquisition due diligence and post acquisition integration experience built up by the Group’s senior management team.
Financial risks
• Lack of financial capacity could affect the Group’s ability to conduct its business, maintain capital investment programmes, pursue acquisitions, and make dividend payments and service debt commitments. The Group manages its bank debt position within a number of financial covenants that are closely monitored by Group Treasury. Strong banking relationships are maintained through regular meetings and updates. Close monitoring and management of cash flows and regular forecasting mitigates the risk exposure.
• The conduct of ordinary business operations necessitates the holding and issuing of financial instruments and derivative financial instruments by the Group. The main risks arising from issuing, holding and managing these financial instruments typically includes liquidity risk, interest rate risk and currency risk. The Group does not trade in financial instruments.The Group’s approach is to centrally manage financial and taxation risks against comprehensive policy guidelines, details of which are outlined in note 3.1 ‘Financial Risk Factors’ on page 77 of this report. The Board agrees and regularly reviews these policies.
Operational risks
• The loss or significant destruction of a key site could present operational and financial difficulties for Glanbia. All operations within the Group have business continuity and communication plans in place to manage the impact of the loss of a major site. The Group also monitors overall safety and loss prevention performance in line with safety, health and welfare legislation through its risk management system to assist operational management responsible for the day-to-day management of business risk. In addition, an insurance cover programme is in place for all significant insurable risks and major catastrophes to mitigate the potential financial consequences.
• In order to fulfil the demand for its products Glanbia needs to ensure an efficient supply chain is in place which complies with the highest health and safety standards. The Group mitigates supply chain risk by maintaining a broad supplier base and all of the Group’s key sites operate quality control assessments on products supplied to ensure world-class quality and food safety targets are maintained throughout the supply chain.
• There are a number of factors affecting the price of milk and it can be subject to potentially significant price fluctuations. The Group has a varying degree of control over these prices and may be unable to pass on increases to its customers in whole or part or without a period of delay. This can adversely affect the Group’s operating profits and cash flow. If the supply of milk from suppliers were constrained for any reason, the Group may not be able to obtain sufficient supplies, or supplies of a suitable quality, from other sources, which could have an adverse impact on its financial performance.
Regulatory risks
• Robust processes are in place to ensure the Group maintains the highest standards of food safety across all processing, packaging, labelling and distribution operations in the interest of the health and well being of its consumers and sustaining its strong reputation as a leading international nutritional ingredients and cheese group. Glanbia conforms to international and local food safety, quality and environmental regulations and employs best practice to maintain the highest standards and to develop a competitive advantage from the consistent supply of high quality products.
• While the Group could be at risk from product contamination and consequent liability, either through its products and/or raw materials, Glanbia employs best practice food safety and quality standards in its operations and supply chain management to mitigate this risk.
• The Group is subject to strict and developing environmental laws and regulations which could result in an increase in the cost of achieving compliance and that may impact the Group’s operational or financial performance. Glanbia currently believes that the Group is abreast of evolving environmental standards and operates energy efficiency, carbon reduction, recycling and emission programmes as a means of reducing costs in a sustainable fashion and gaining a long term competitive advantage in the market place.
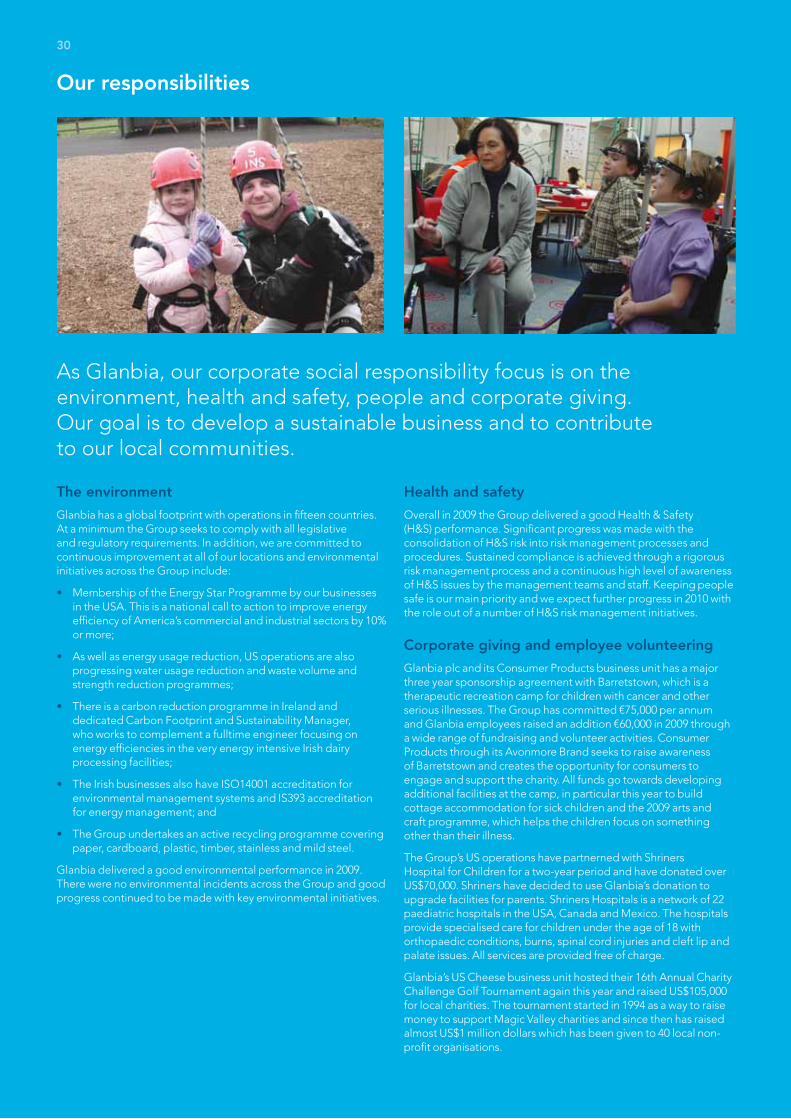
Glanbia plc 2009 Annual Report Overview of Glanbia30
Our responsibilities
The environment
Glanbia has a global footprint with operations in fifteen countries. At a minimum the Group seeks to comply with all legislative and regulatory requirements. In addition, we are committed to continuous improvement at all of our locations and environmental initiatives across the Group include:
• Membership of the Energy Star Programme by our businesses in the USA. This is a national call to action to improve energy efficiency of America’s commercial and industrial sectors by 10% or more;
• As well as energy usage reduction, US operations are also progressing water usage reduction and waste volume and strength reduction programmes;
• There is a carbon reduction programme in Ireland and dedicated Carbon Footprint and Sustainability Manager, who works to complement a fulltime engineer focusing on energy efficiencies in the very energy intensive Irish dairy processing facilities;
• The Irish businesses also have ISO14001 accreditation for environmental management systems and IS393 accreditation for energy management; and
• The Group undertakes an active recycling programme covering paper, cardboard, plastic, timber, stainless and mild steel.
Glanbia delivered a good environmental performance in 2009. There were no environmental incidents across the Group and good progress continued to be made with key environmental initiatives.
Health and safety
Overall in 2009 the Group delivered a good Health & Safety (H&S) performance. Significant progress was made with the consolidation of H&S risk into risk management processes and procedures. Sustained compliance is achieved through a rigorous risk management process and a continuous high level of awareness of H&S issues by the management teams and staff. Keeping people safe is our main priority and we expect further progress in 2010 with the role out of a number of H&S risk management initiatives.
Corporate giving and employee volunteering
Glanbia plc and its Consumer Products business unit has a major three year sponsorship agreement with Barretstown, which is a therapeutic recreation camp for children with cancer and other serious illnesses. The Group has committed €75,000 per annum and Glanbia employees raised an addition €60,000 in 2009 through a wide range of fundraising and volunteer activities. Consumer Products through its Avonmore Brand seeks to raise awareness of Barretstown and creates the opportunity for consumers to engage and support the charity. All funds go towards developing additional facilities at the camp, in particular this year to build cottage accommodation for sick children and the 2009 arts and craft programme, which helps the children focus on something other than their illness.
The Group’s US operations have partnerned with Shriners Hospital for Children for a two-year period and have donated over US$70,000. Shriners have decided to use Glanbia’s donation to upgrade facilities for parents. Shriners Hospitals is a network of 22 paediatric hospitals in the USA, Canada and Mexico. The hospitals provide specialised care for children under the age of 18 with orthopaedic conditions, burns, spinal cord injuries and cleft lip and palate issues. All services are provided free of charge.
Glanbia’s US Cheese business unit hosted their 16th Annual Charity Challenge Golf Tournament again this year and raised US$105,000 for local charities. The tournament started in 1994 as a way to raise money to support Magic Valley charities and since then has raised almost US$1 million dollars which has been given to 40 local non-profit organisations.
As Glanbia, our corporate social responsibility focus is on the environment, health and safety, people and corporate giving. Our goal is to develop a sustainable business and to contribute to our local communities.
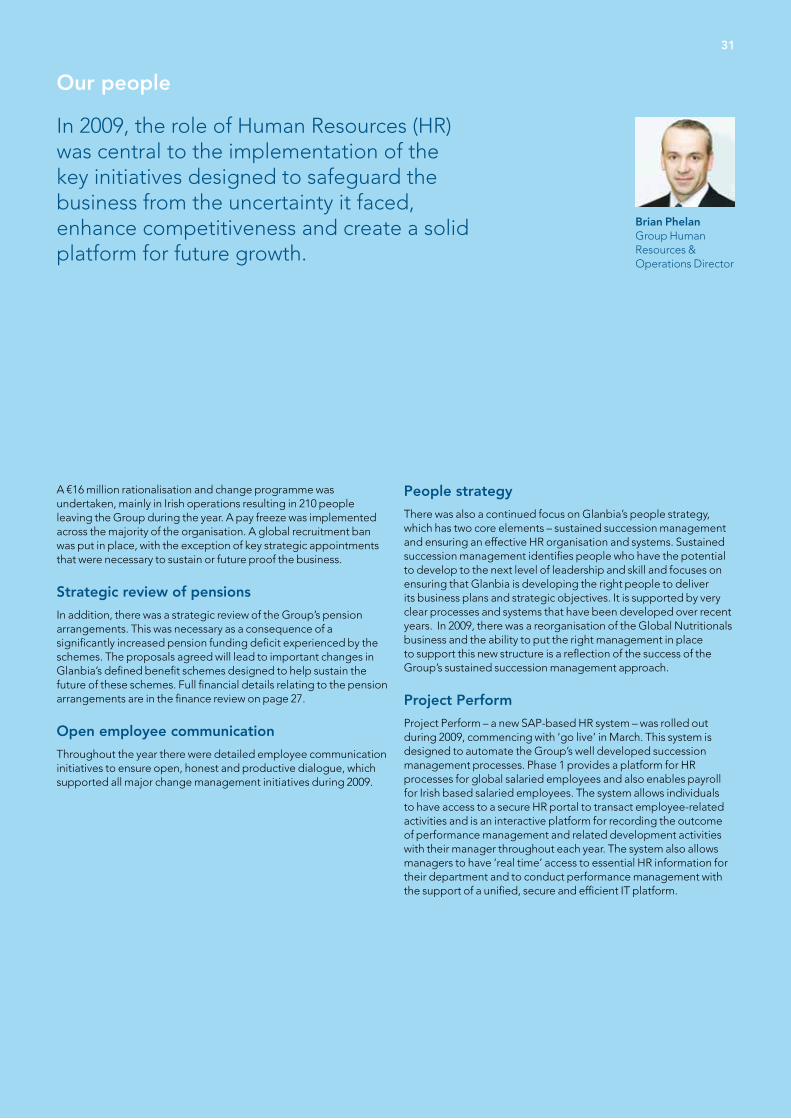
Glanbia plc 2009 Annual Report Overview of Glanbia 31
A €16 million rationalisation and change programme was undertaken, mainly in Irish operations resulting in 210 people leaving the Group during the year. A pay freeze was implemented across the majority of the organisation. A global recruitment ban was put in place, with the exception of key strategic appointments that were necessary to sustain or future proof the business.
Strategic review of pensions
In addition, there was a strategic review of the Group’s pension arrangements. This was necessary as a consequence of a significantly increased pension funding deficit experienced by the schemes. The proposals agreed will lead to important changes in Glanbia’s defined benefit schemes designed to help sustain the future of these schemes. Full financial details relating to the pension arrangements are in the finance review on page 27.
Open employee communication
Throughout the year there were detailed employee communication initiatives to ensure open, honest and productive dialogue, which supported all major change management initiatives during 2009.
People strategy
There was also a continued focus on Glanbia’s people strategy, which has two core elements – sustained succession management and ensuring an effective HR organisation and systems. Sustained succession management identifies people who have the potential to develop to the next level of leadership and skill and focuses on ensuring that Glanbia is developing the right people to deliver its business plans and strategic objectives. It is supported by very clear processes and systems that have been developed over recent years. In 2009, there was a reorganisation of the Global Nutritionals business and the ability to put the right management in place to support this new structure is a reflection of the success of the Group’s sustained succession management approach.
Project Perform
Project Perform – a new SAP-based HR system – was rolled out during 2009, commencing with ‘go live’ in March. This system is designed to automate the Group’s well developed succession management processes. Phase 1 provides a platform for HR processes for global salaried employees and also enables payroll for Irish based salaried employees. The system allows individuals to have access to a secure HR portal to transact employee-related activities and is an interactive platform for recording the outcome of performance management and related development activities with their manager throughout each year. The system also allows managers to have ‘real time’ access to essential HR information for their department and to conduct performance management with the support of a unified, secure and efficient IT platform.
Our people
Brian Phelan Group Human Resources & Operations Director
In 2009, the role of Human Resources (HR) was central to the implementation of the key initiatives designed to safeguard the business from the uncertainty it faced, enhance competitiveness and create a solid platform for future growth.
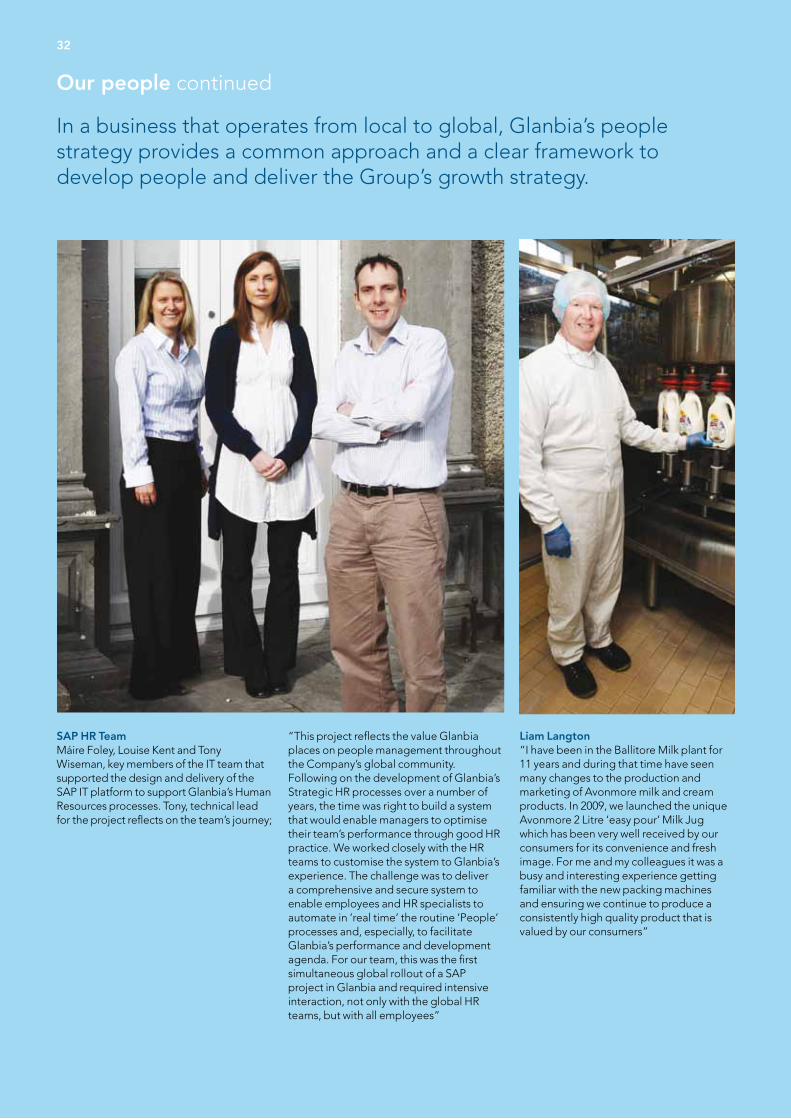
32 Glanbia plc 2009 Annual Report Overview of Glanbia32
In a business that operates from local to global, Glanbia’s people strategy provides a common approach and a clear framework to develop people and deliver the Group’s growth strategy.
Our people continued
SAP HR TeamMáire Foley, Louise Kent and Tony Wiseman, key members of the IT team that supported the design and delivery of the SAP IT platform to support Glanbia’s Human Resources processes. Tony, technical lead for the project reflects on the team’s journey;
“This project reflects the value Glanbia places on people management throughout the Company’s global community. Following on the development of Glanbia’s Strategic HR processes over a number of years, the time was right to build a system that would enable managers to optimise their team’s performance through good HR practice. We worked closely with the HR teams to customise the system to Glanbia’s experience. The challenge was to deliver a comprehensive and secure system to enable employees and HR specialists to automate in ‘real time’ the routine ‘People’ processes and, especially, to facilitate Glanbia’s performance and development agenda. For our team, this was the first simultaneous global rollout of a SAP project in Glanbia and required intensive interaction, not only with the global HR teams, but with all employees”
Liam Langton“I have been in the Ballitore Milk plant for 11 years and during that time have seen many changes to the production and marketing of Avonmore milk and cream products. In 2009, we launched the unique Avonmore 2 Litre ‘easy pour’ Milk Jug which has been very well received by our consumers for its convenience and fresh image. For me and my colleagues it was a busy and interesting experience getting familiar with the new packing machines and ensuring we continue to produce a consistently high quality product that is valued by our consumers”

33Glanbia plc 2009 Annual Report Overview of Glanbia 33
Denis O’Donoghue“I joined the Glanbia Graduate programme in September 2008 after completing a B.Sc in Accounting in UCC, Ireland. Since then I have been challenged with different assignments in Group Finance, Dairy Ingredients Ireland and, most recently, working for the Finance team in the Nutricima JV, based in Lagos, Nigeria. I am learning all the time particulary on the commercial side of the business from experienced people such as Lampe Omoyele, Marketing Director, Nutricima (pictured above) while also studying for my professional Accounting exams. It’s great to see how the total business works, especially in an interesting integrated business like Nutricima where we manufacture, distribute and sell branded consumer milk products to the Nigerian market. I am already looking forward to my next assignment in US Cheese, our cheese and whey business in Idaho, USA”
Sharon RokoshDuring my four years with Glanbia, I have developed my business skills and worked in the very exciting ‘Weight Management’ sector for Glanbia Nutritionals. Our Brand, Prolibra®, has become a key part of the formulations of some of the best known Global Nutrition companies. I am proud to have been part of a team that has leveraged our technical and clinical research for commercial success. I have also had the opportunity to utilise and build on my Business education at Purdue University and have participated in Glanbia’s Management Development Programme. During the programme, I had the opportunity to develop my leadership and strategic thinking capability and to share learning experiences and gain exposure to other business issues with many of my colleagues from the USA, Ireland and the UK”
Serena Lopez“I joined Southwest Cheese in Clovis, NM just a year ago. This is an amazing plant that has already added 40% more capacity just 4 years into its short life. I am responsible for operating the RO system which cleans the process water and allows it to be recovered for reuse in the plant, thereby ensuring energy saving and good environmental practice. During my time at SWC, I have enjoyed my work as part of a proud and committed member of the whey team and have also taken the opportunity to learn new skills through participation in technical and safety training.”

Glanbia plc 2009 Annual Report Directors’ report: Corporate governance34
Board of Directors
Chairman
Liam Herlihy1 (aged 58) is Chairman of Glanbia plc. He was appointed to the Board in 1997, Vice-Chairman in 2001 and Chairman in May 2008. He is also Chairman of Glanbia Co-operative Society Limited and a Director of Irish Co-operative Organisation Society Limited. He completed the Institute of Directors Development Programme (2006) and holds a certificate of merit in Corporate Governance at UCD. He farms at Headborough, Knockanore, Tallow, Co. Waterford.
Executive Directors
John Moloney B.Agr.Sc., MBA, (aged 55) is Group Managing Director since 2001, having been appointed to the Board in 1997. He joined the Group in 1987 and held a number of senior management positions including Chief Executive of Food Ingredients and Agribusiness. He was appointed Deputy Group Managing Director in 2000 and assumed the responsibilities of Chief Operating Officer in 2001. Prior to joining the Group he worked with the Department of Agriculture, Food and Forestry and in the meat industry in Ireland. He is a director of The Irish Dairy Board Co-operative Limited, DCC plc and a Council Member of the Irish Business and Employers Confederation.
Siobhán Talbot (B.Comm, FCA) (aged 46), joined the Board as Group Finance Director on 1 July 2009. She was appointed Deputy Group Finance Director of Glanbia plc in June 2005 and held the position of Group Finance Director Designate since March 2009. She was formerly Group Secretary and also held a number of senior finance positions, since she joined the Group in 1992. Prior to joining the Group she worked with PriceWaterhouseCoopers in Dublin and Sydney, Australia.
Kevin Toland FCMA, (aged 44) was appointed to the Board in 2003. He is CEO & President of Glanbia USA & Nutritionals, having previously held the positions of Group Development Director and Chief Executive of the Consumer Foods Division. Prior to joining Glanbia in 1999, he held a number of senior management positions with Coca-Cola Bottlers in Russia and with Grand Metropolitan plc in Ireland and Central Europe.
Audit Committee J Callaghan, Chairman H Corbally J Fitzgerald P Haran L Herlihy J Liston V Quinlan
Board Committees
Michael Horan B. Comm, FCAGroup Secretary
Liam HerlihyChairman
John MoloneyGroup Managing Director
Siobhán Talbot Group Finance Director
Kevin TolandCEO & President of Glanbia USA & Global Nutritionals
The Board of Directors of Glanbia, which stands at the apex of Glanbia’s governance structure, is committed to achieving the highest standards of corporate governance and being ethical in the conduct of all aspects of the business which they see as fundamental to discharging their stewardship responsibilities. The Board strives to provide the right leadership, strategic oversight and control environment to produce and sustain the delivery of value to shareholders and ensure maximum transparency and good communication between the Group and its shareholders.
Remuneration CommitteeJ Liston, Chairman J Callaghan P Haran L Herlihy J Fitzgerald V Quinlan
Nomination CommitteeL Herlihy, Chairman J Callaghan P Haran J Liston
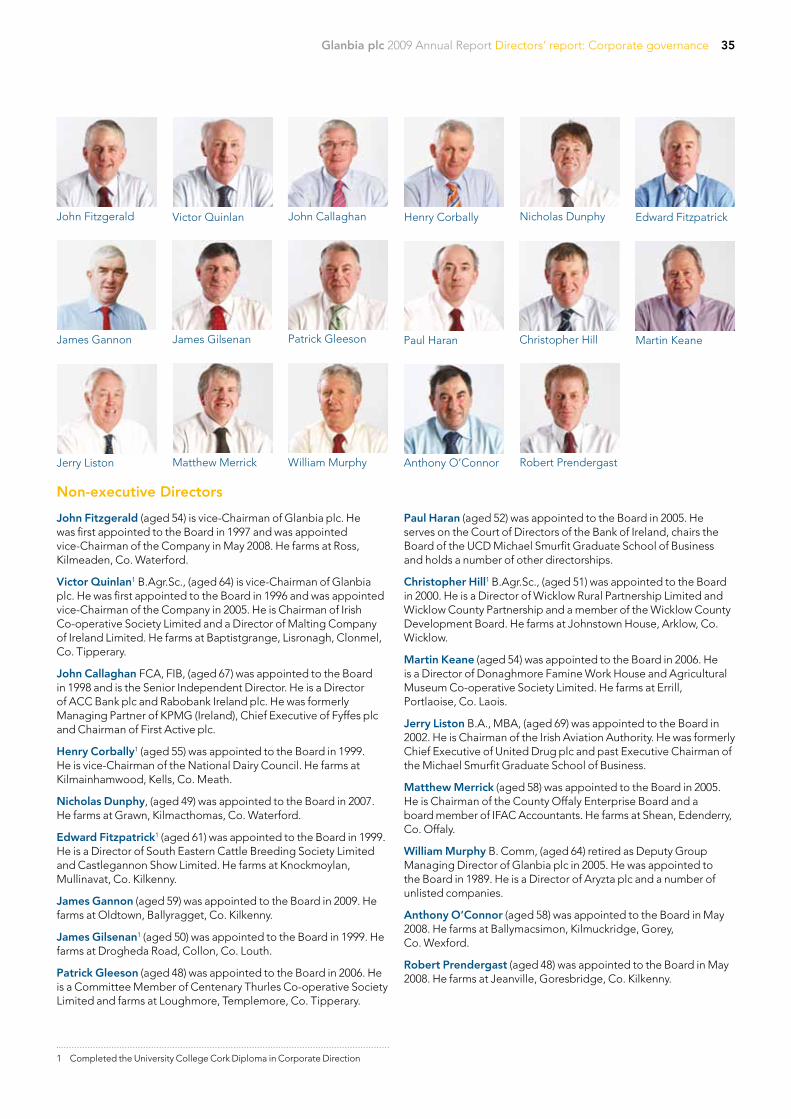
Glanbia plc 2009 Annual Report Directors’ report: Corporate governance 35
Anthony O’Connor Robert Prendergast
Victor Quinlan
John Fitzgerald (aged 54) is vice-Chairman of Glanbia plc. He was first appointed to the Board in 1997 and was appointed vice-Chairman of the Company in May 2008. He farms at Ross, Kilmeaden, Co. Waterford.
Victor Quinlan1 B.Agr.Sc., (aged 64) is vice-Chairman of Glanbia plc. He was first appointed to the Board in 1996 and was appointed vice-Chairman of the Company in 2005. He is Chairman of Irish Co-operative Society Limited and a Director of Malting Company of Ireland Limited. He farms at Baptistgrange, Lisronagh, Clonmel, Co. Tipperary.
John Callaghan FCA, FIB, (aged 67) was appointed to the Board in 1998 and is the Senior Independent Director. He is a Director of ACC Bank plc and Rabobank Ireland plc. He was formerly Managing Partner of KPMG (Ireland), Chief Executive of Fyffes plc and Chairman of First Active plc.
Henry Corbally1 (aged 55) was appointed to the Board in 1999. He is vice-Chairman of the National Dairy Council. He farms at Kilmainhamwood, Kells, Co. Meath.
Nicholas Dunphy, (aged 49) was appointed to the Board in 2007. He farms at Grawn, Kilmacthomas, Co. Waterford.
Edward Fitzpatrick1 (aged 61) was appointed to the Board in 1999. He is a Director of South Eastern Cattle Breeding Society Limited and Castlegannon Show Limited. He farms at Knockmoylan, Mullinavat, Co. Kilkenny.
James Gannon (aged 59) was appointed to the Board in 2009. He farms at Oldtown, Ballyragget, Co. Kilkenny.
James Gilsenan1 (aged 50) was appointed to the Board in 1999. He farms at Drogheda Road, Collon, Co. Louth.
Patrick Gleeson (aged 48) was appointed to the Board in 2006. He is a Committee Member of Centenary Thurles Co-operative Society Limited and farms at Loughmore, Templemore, Co. Tipperary.
Paul Haran (aged 52) was appointed to the Board in 2005. He serves on the Court of Directors of the Bank of Ireland, chairs the Board of the UCD Michael Smurfit Graduate School of Business and holds a number of other directorships.
Christopher Hill1 B.Agr.Sc., (aged 51) was appointed to the Board in 2000. He is a Director of Wicklow Rural Partnership Limited and Wicklow County Partnership and a member of the Wicklow County Development Board. He farms at Johnstown House, Arklow, Co. Wicklow.
Martin Keane (aged 54) was appointed to the Board in 2006. He is a Director of Donaghmore Famine Work House and Agricultural Museum Co-operative Society Limited. He farms at Errill, Portlaoise, Co. Laois.
Jerry Liston B.A., MBA, (aged 69) was appointed to the Board in 2002. He is Chairman of the Irish Aviation Authority. He was formerly Chief Executive of United Drug plc and past Executive Chairman of the Michael Smurfit Graduate School of Business.
Matthew Merrick (aged 58) was appointed to the Board in 2005. He is Chairman of the County Offaly Enterprise Board and a board member of IFAC Accountants. He farms at Shean, Edenderry, Co. Offaly.
William Murphy B. Comm, (aged 64) retired as Deputy Group Managing Director of Glanbia plc in 2005. He was appointed to the Board in 1989. He is a Director of Aryzta plc and a number of unlisted companies.
Anthony O’Connor (aged 58) was appointed to the Board in May 2008. He farms at Ballymacsimon, Kilmuckridge, Gorey, Co. Wexford.
Robert Prendergast (aged 48) was appointed to the Board in May 2008. He farms at Jeanville, Goresbridge, Co. Kilkenny.
John Fitzgerald
Christopher Hill
Jerry Liston
Patrick Gleeson
Non-executive Directors
John Callaghan Nicholas Dunphy
Paul Haran Martin KeaneJames Gilsenan
Matthew Merrick William Murphy
Henry Corbally Edward Fitzpatrick
James Gannon
1 Completed the University College Cork Diploma in Corporate Direction
Glanbia plc 2009 Annual Report Directors’ report: Corporate governance36
The Board and management are committed to achieving the highest standards of corporate governance and being ethical in the conduct of all aspects of the business. In this regard, the Board supports the principles of corporate governance contained in the Combined Code on corporate governance issued by the Financial Reporting Council (the “Combined Code”), which is referred to in the Listing Rules, applicable to Irish and UK listed companies and is publicly available on the Financial Reporting Council’s website www.frc.org.uk/corporate/combined code.cfm.
This Statement on corporate governance together with the Statement on Directors’ remuneration and Risk management report on pages 46 to 53 and 28 to 29 respectively are intended to explain how the Company has applied the principles of the Combined Code and provide an insight into how the Board and management run the business for the benefit of shareholders. The Chairman’s statement and the Group Managing Director’s review seek to present a balanced assessment of the Company’s position and prospects.
Compliance with Combined Code
It is the Board’s view that except in relation to the composition of the Board, the Company has been compliant throughout the accounting period with the provisions of the Combined Code.
The Board
The Board is responsible for the leadership, direction and control of the Company and its subsidiary companies and is accountable to shareholders for financial performance.
Key matters reserved to the Board include:
• Group strategy and business plans, including responsibility for the overall management of the Group, approval of the Group’s long-term objectives and commercial strategy, oversight of the Group’s operations and review of performance in the light of the Group’s strategy, objectives, business plans and budgets and ensuring that any necessary corrective action is taken;
• acquisitions, disposals and other transactions outside delegated limits. The Group has in place an Investment Committee which considers all major acquisitions, disposals and other transactions prior to presenting to the Board for consideration;
• financial reporting and controls, including approval of the half-yearly report, interim management statements and any preliminary announcement of the final results, approval of the annual report and accounts, including this Statement on corporate governance and Statement on Directors’ remuneration, approval of any significant changes in accounting policies or practices, ensuring maintenance of a reliable system of internal control and risk management including: receiving reports on, and reviewing the effectiveness of, the Group’s risk and control processes to support its strategy and objectives, undertaking an annual assessment of these processes and approving an appropriate statement for inclusion in this Annual report;
• capital expenditure, including the approval of the annual operating and capital expenditure budgets and any material changes to them and the implementation of a Group wide policy on capital expenditure which defines limits on expenditure;
• dividend policy, including the annual review of the Company’s dividend policy and declaration of the interim dividend and recommendation of the final dividend;
• shareholder documentation, including approval of resolutions and corresponding documentation to be put forward to shareholders at a general meeting, approval of all circulars, prospectuses and listing particulars and approval of all press releases concerning matters decided by the Board; and
• key business policies, including approval of the remuneration, treasury and risk management policies.
All Directors are equally accountable to the shareholders for the proper stewardship of the affairs and the success of the Company. By using their judgement, experience and independence, the non-executive Directors play a valuable role by critically reviewing and, where appropriate, challenging strategies proposed by management to further develop the Group’s business, effectively use resources and standards of conduct. This ensures the Board acts in the best long-term interests of the shareholders, while taking account of the wider community of interests represented by employees, customers and suppliers.
During the year matters considered by the Board included the evolving strategic direction of the business, review of Group funding arrangements and the potential effect of the recession including mitigating recessionary pressures.
Additionally, senior managers from across the business presented to the Board on key strategic issues. During the year the Board also considered and approved annual and medium-term plans and operating results.
By reviewing the Group’s operating performance at each Board meeting Directors are kept informed of its progress. Between Board meetings, Directors are supplied with monthly performance reports, including detailed commentary and analysis. To ensure Directors are fully informed on all Committee matters they receive reports and minutes from the Chairmen of the Board Committees.
The Board held ten scheduled Board meetings. Details of Directors’ attendance at those meetings are set out in the table on the next page.
Statement on corporate governance
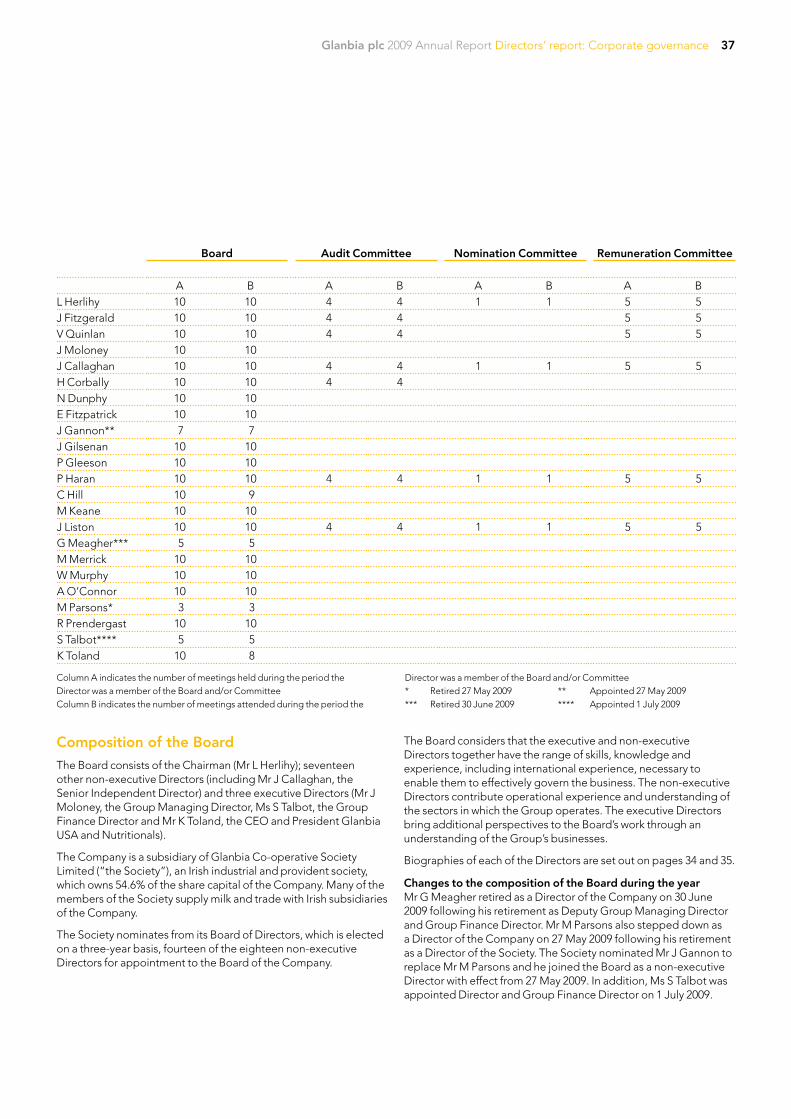
Glanbia plc 2009 Annual Report Directors’ report: Corporate governance 37
Board Audit Committee Nomination Committee Remuneration Committee
A B A B A B A BL Herlihy 10 10 4 4 1 1 5 5J Fitzgerald 10 10 4 4 5 5V Quinlan 10 10 4 4 5 5J Moloney 10 10J Callaghan 10 10 4 4 1 1 5 5H Corbally 10 10 4 4N Dunphy 10 10E Fitzpatrick 10 10J Gannon** 7 7J Gilsenan 10 10P Gleeson 10 10P Haran 10 10 4 4 1 1 5 5C Hill 10 9M Keane 10 10J Liston 10 10 4 4 1 1 5 5G Meagher*** 5 5M Merrick 10 10W Murphy 10 10A O’Connor 10 10M Parsons* 3 3R Prendergast 10 10S Talbot**** 5 5K Toland 10 8 Column A indicates the number of meetings held during the period the Director was a member of the Board and/or Committee Column B indicates the number of meetings attended during the period the
Director was a member of the Board and/or Committee * Retired 27 May 2009 ** Appointed 27 May 2009 *** Retired 30 June 2009 **** Appointed 1 July 2009
The Board considers that the executive and non-executive Directors together have the range of skills, knowledge and experience, including international experience, necessary to enable them to effectively govern the business. The non-executive Directors contribute operational experience and understanding of the sectors in which the Group operates. The executive Directors bring additional perspectives to the Board’s work through an understanding of the Group’s businesses.
Biographies of each of the Directors are set out on pages 34 and 35.
Changes to the composition of the Board during the yearMr G Meagher retired as a Director of the Company on 30 June 2009 following his retirement as Deputy Group Managing Director and Group Finance Director. Mr M Parsons also stepped down as a Director of the Company on 27 May 2009 following his retirement as a Director of the Society. The Society nominated Mr J Gannon to replace Mr M Parsons and he joined the Board as a non-executive Director with effect from 27 May 2009. In addition, Ms S Talbot was appointed Director and Group Finance Director on 1 July 2009.
Composition of the Board
The Board consists of the Chairman (Mr L Herlihy); seventeen other non-executive Directors (including Mr J Callaghan, the Senior Independent Director) and three executive Directors (Mr J Moloney, the Group Managing Director, Ms S Talbot, the Group Finance Director and Mr K Toland, the CEO and President Glanbia USA and Nutritionals).
The Company is a subsidiary of Glanbia Co-operative Society Limited (“the Society”), an Irish industrial and provident society, which owns 54.6% of the share capital of the Company. Many of the members of the Society supply milk and trade with Irish subsidiaries of the Company.
The Society nominates from its Board of Directors, which is elected on a three-year basis, fourteen of the eighteen non-executive Directors for appointment to the Board of the Company.
Glanbia plc 2009 Annual Report Directors’ report: Corporate governance38
Organisation of the Board and Group Secretary
Division of responsibilities The roles of the Chairman and Group Managing Director are split, with clear written guidance to support the division of responsibility.
Group Chairman Mr L Herlihy was appointed Chairman on 28 May 2008. The Chairman is responsible for the efficient and effective working of the Board. He ensures that Board agendas cover the key strategic issues confronting the Group and that Directors receive accurate, timely, clear and relevant information.
The Chairman is available to consult with shareholders throughout the year. The Board is kept informed of the views of shareholders through regular updates from the Chairman, the Group Secretary and the executive Directors, as well as through the inclusion in the Board papers of relevant reports and commentaries of, and exchanges with, shareholders and investor bodies.
While the Chairman holds a number of other directorships including Irish Co-operative Organisation Society Limited and farms at Headborough, Knockanore, Tallow, Co. Waterford, the Board considers that these do not interfere with the discharge of his duties to the Group.
Vice-ChairmenThe Company has two vice-Chairmen, Mr J Fitzgerald and Mr V Quinlan.
Group Managing DirectorMr J Moloney, as Group Managing Director, is responsible for all aspects of the operation and management of the Group and its business. His role includes developing, for Board approval, an appropriate business strategy and ensuring that the agreed strategy is implemented in a timely and effective manner. He is also responsible for ensuring an effective organisation structure, for the appointment and direction of the senior executive management and for the operational management of all the Group’s businesses.
Non-executive DirectorsThe non-executive Directors on the Board currently consists of the Chairman and seventeen other non-executive Directors. Mr J Callaghan is the Senior Independent Director.
In addition to their attendance at Board and, as appropriate, Committee meetings, the non-executive Directors also met formally on two occasions during 2009 without executive management present. At one of these meetings the non-executive Directors examined and reviewed the performance of the executive management while the remaining meeting was held without the presence of the Chairman at which, among other things, the performance of the Chairman was discussed.
Senior Independent DirectorThe Senior Independent Director is Mr J Callaghan. In this role Mr J Callaghan is available to shareholders if they have concerns which contact, through the normal channels, has failed to resolve. Mr J Callaghan is also available to fellow non-executive Directors, either individually or collectively, to discuss any matters of concern in a forum that does not include executive directors or the management of the Company.
Group SecretaryThe Group Secretary, Mr M Horan, through the Chairman, is responsible for advising the Board on governance matters and for ensuring good information flows within the Board. All Directors have access to the advice and services of the Group Secretary, as well as access to external advice, if required, at the expense of the Group. No such external advice was sought by any Director during the year.
Independence
The Board assesses and reviews the independence of each of the Directors annually, or at any other time where the circumstances of a director change such as to warrant reconsideration, having regard to the potential relevance and materiality of a director’s interests.
Following the 2009 assessment, the Board has determined that throughout the reporting period, Mr J Callaghan, Mr P Haran and Mr J Liston were independent. In particular, the Board reviewed the position of Messrs Callaghan and Liston in the context of the guidance in the Combined Code and determined that, notwithstanding their twelve years and seven years on the Board respectively, they remain independent. In the same manner as the other non-executive Directors, they discharge their duties in a proper and consistently independent manner and constructively and appropriately challenge the executive Directors and the Board.
Fourteen of the remaining fifteen non-executive Directors are nominated by the Board of the Society for appointment to the Board of the Company. Additionally, Mr W Murphy who retired as Deputy Group Managing Director in 2005 and remains on the Board as a non-executive Director. The Board recognises that these Directors do not meet the criteria for independence as specified in the Combined Code. The Board, however, considers that they are independent in character and judgement.
All of the non-executive Directors bring an independent perspective to their advisory and monitoring roles.
Information and professional development
The Board is supplied with information in a form and quality to enable it to take informed decisions and to discharge its duties. All Directors are encouraged to make further enquiries as they consider appropriate of the executive Directors or management. Directors are provided with detailed briefings on the Group’s businesses, the markets in which they operate and the overall economic and competitive environment. Other areas addressed include legal issues and responsibilities of Directors, the Group’s governance arrangements and its Investor Relations programme.
Directors are provided with a comprehensive information pack on joining the Company and advised of their legal and other duties and obligations as a director of a listed company. In addition, all new Directors receive induction on their appointment covering such matters as the operation and activities of the Company and the Group, the role of the Board and the Group’s corporate governance procedures. As part of this programme, major shareholders are offered an opportunity to meet new non-executive Directors.
Glanbia plc 2009 Annual Report Directors’ report: Corporate governance 39
Non-executive Directors are encouraged to visit the Group’s major facilities to enable them to gain a greater understanding of the Group’s activities. In addition, at least one board meeting each year is held at an ‘off-site’ location which incorporates a visit to one of the Group’s principal businesses or developments. During the year, the Board made visits to the Group’s businesses located in Orsingen-Nenzingen in Germany and Virginia in Co. Cavan. The Board also visited a number of other international food and ingredients companies operating in Europe and the Agricultural Commission of the European Parliament in Brussels where it received updates on European Union (“EU”) policy changes in relation to the agricultural sector in the EU.
Six of the Directors nominated to the Board by the Society have completed the ICOS Diploma in Corporate Direction. Two further Directors commenced the diploma in 2009 and three further Directors commenced the Smurfit Director Development Programme. In addition, members of the Audit Committee received a number of technical updates from the Group’s auditors.
Board performance evaluation
The effectiveness of the Board is vital to the success of the Group and the Company undertakes a rigorous evaluation each year in order to assess how well the Board, its Committees, the Directors and the Chairman are performing. The aim is to improve the effectiveness of the Board and its Committees and the Group’s performance. The process is led by the Chairman and supported by the Group Secretary. An external review of the Board’s effectiveness and the effectiveness of its Committees was undertaken in 2008/2009 by an independent consultancy firm. The evaluation considered the effectiveness of the Board and its committees under the following categories: Board structure and responsibilities, Board process and procedures, Board culture and relationships, Board composition and competencies, Board content and Board performance. As part of the evaluation, interviews were conducted with each Board member. All Directors also completed a questionnaire evaluating the Board and Committees’ processes, their effectiveness and where improvements may be considered. A report was prepared based on the interviews with the Directors and the questionnaire circulated and the overall results of the evaluation were presented to and reviewed by the Board.
The performance of the Chairman is also included in the above process and takes into account the views of both the executive and non-executive Directors. The Chairman’s evaluation is managed by the Senior Independent Director who provides feedback to the Chairman. As part of the Chairman’s evaluation the non-executive Directors meet separately under the chairmanship of the Senior Independent Director.
The Board evaluation process assesses the executive Directors in their capacities as directors of the Company. They are evaluated in respect of their executive duties through a separate process whereby the Chairman and the non-executive Directors assess the Group Managing Director and the Group Managing Director assesses the executive Directors.
Following this comprehensive review, the Directors have concluded that the Board and its Committees operate effectively and agreed a number of key changes which are being implemented. Additionally, the Chairman has concluded that each Director (including all Directors standing for re-election) contributes effectively and demonstrates full commitment to his/her duties. Mr J Callaghan, as Senior Independent Director, confirms that Mr L Herlihy, also standing for re-appointment at this year’s Annual General Meeting (“AGM”), continues to perform effectively and demonstrates commitment to his role.
Appointment and retirement of Directors
The Nomination Committee of the Company leads the process for Board appointments other than the fourteen non-executive Directors nominated by the Board of the Society for appointment to the Board of the Company. New Directors are subject to election at the first AGM following their appointment, and Directors are subject to retirement and re-appointment by shareholders every three years. The re-appointment of non-executive Directors is not automatic. The Board has determined that non-executive Directors who have served for nine years or more will be asked to stand for re-appointment annually provided that the Board remains satisfied both with the Director’s performance and that nine or more years’ continuous service does not compromise the Director’s continuing independence.
Terms of appointment
The terms and conditions of appointment of non-executive Directors are available for inspection at the Company’s registered office during normal business hours and at the AGM of the Company.
Share ownership and dealing
In order to maintain investor confidence in the stock markets, quoted companies have an obligation to ensure that their Directors and employees, and anyone closely associated or connected to them, do not place themselves in positions where investors might suspect them of abusing inside information. For this reason, the Company issued revised rules, in 2008, covering share dealings by Directors and employees who regularly, or even occasionally, have access to inside information.
The main principle underlying the rules is that no one should trade in shares of the Company while in possession of inside information about the Company. Likewise, no one should deal in the shares of the Company, if it would give rise to a suspicion that they are abusing inside information. As a safeguard against any actual or potential abuse of these rules, the Company has appointed as Compliance Officers, the Group Secretary and the Group Finance Director from whom approval must be obtained, in advance, for any share dealings by persons to whom the rules apply.
The interests of the Directors and Secretary and their spouses and minor children in the share capital of the Company, the holding Society and subsidiary companies/societies are set out in the Statement on Directors’ remuneration on pages 46 to 53.
Glanbia plc 2009 Annual Report Directors’ report: Corporate governance40
Board succession planning
The Board plans for its own succession with the assistance of the Nomination Committee. In so doing, the Board considers the knowledge and experience necessary to allow it to meet the strategic vision for the Company and the Group. During the year Ms S Talbot replaced Mr G Meagher as Group Finance Director following Mr Meagher’s retirement. Ms S Talbot was previously Deputy Finance Director. This process was assisted by the Nomination Committee.
External appointments
The Board supports executive Directors and members of the Executive Committee taking up non-executive directorships as part of their continuing development which will ultimately benefit the Company. Accordingly, executive Directors are permitted to accept external non-executive Board appointments, subject to the agreement of the Board, and are allowed to retain any fees received from that appointment. The Group Managing Director is a Director of The Irish Dairy Board Co-operative Limited and DCC plc for which he received fees of €12,000 and €61,000 respectively.
Non-executive Directors may serve on a number of outside Boards, provided they continue to demonstrate the requisite commitment to discharge effectively their duties to the Company. The Nomination Committee keeps the extent of Directors’ other interests under review to ensure that the effectiveness of the Board is not compromised.
Board Committees
The Board has in place a committee structure to assist it in the discharge of its responsibilities. The Committees of the Board are the Audit Committee, the Nomination Committee, the Remuneration Committee and the Finance Sub-Board. Each of the Committees has terms of reference under which authority is delegated by the Board. The terms of reference may be found at www.glanbia.com
The Group Secretary provides secretariat support for each of the Committees.
Nomination Committee
The Nomination Committee is chaired by Mr L Herlihy and its other members are Mr J Callaghan, Mr P Haran and Mr J Liston, all of whom are non-executive Directors.
The Nomination Committee of the Company leads the process for Board appointments other than the fourteen non-executive Directors nominated by the Board of the Society for appointment to the Board of the Company. The Nomination Committee also considers appointments to senior executive positions. The Nomination Committee met once during the year. Information on meeting attendance by Nomination Committee members is included in the table on page 37.
The Nomination Committee’s main responsibilities are to: • identify and nominate for the approval of the Board, candidates
to fill board vacancies as and when they arise;
• before making an appointment, evaluate the balance of skills, knowledge and experience on the Board and, in the light of this evaluation, prepare a description of the role and capabilities required for a particular appointment;
• review annually the time required from a non-executive Director. The performance evaluation procedures will be used to assess whether a non-executive Director is spending enough time to fulfil their duties;
• give full consideration to succession planning in the course of its work, taking into account the challenges and opportunities facing the company and what skills and expertise are therefore needed on the Board in the future;
• regularly review the structure, size and composition (including the skills, knowledge and experience) of the Board and make recommendations to the Board with regard to any changes; and
• keep under review the leadership needs of the organisation, both executive and non-executive, with a view to ensuring the continued ability of the organisation to compete effectively in the marketplace.
Key activities during the year• Recommendation on the appointment of new Finance Director
The Board accepted the Nomination Committee’s recommendations that Ms S Talbot join the Board following the retirement of Mr G Meagher. Ms S Talbot was previously Deputy Finance Director.
• Review of Directors’ independence The nomination for the re-appointment of the non-executive Directors, Mr J Callaghan, Mr H Corbally, Mr J Fitzgerald, Mr E Fitzpatrick, Mr J Gilsenan, Mr L Herlihy, Mr C Hill, Mr W Murphy and Mr V Quinlan respectively, was reviewed with particular rigour, as they have served as Directors for nine years or more (with each of Mr J Callaghan and Mr L Herlihy excusing themselves from the consideration of their own nomination for re-appointment). The Nomination Committee was satisfied that their re-appointment as Directors for a further term was warranted having regard to their continuing contribution and valuable experience on the Board, which in the Nomination Committee and the Board’s view enhanced their effectiveness and commitment to their roles.
• Review of the time required from a non-executive Director The Nomination Committee and the Board is satisfied that the Chairman and each of the non-executive Directors commit sufficient time to the fulfilment of their duties as Chairman and directors of the Company respectively.
• Review of Committee performance The Nomination Committee assessed its performance. As a result of that assessment, the Nomination Committee is satisfied that it is functioning effectively and it has met its terms of reference.
Glanbia plc 2009 Annual Report Directors’ report: Corporate governance 41
The Nomination Committee did not use an external search consultancy or open advertising in the appointment of the new non-executive Director, Mr J Gannon, as he was nominated by the Board of the Society for appointment to the Board.
Remuneration Committee
The Remuneration Committee is chaired by Mr J Liston and its other members are Mr L Herlihy, Mr V Quinlan, Mr J Callaghan, Mr J Fitzgerald and Mr P Haran, all of whom are non-executive Directors.
The Remuneration Committee determines, on behalf of the Board, the Group’s framework of executive remuneration and the specific packages and conditions of employment for each of the executive Directors and certain senior executives, as decided by the Board. The Remuneration Committee operates the Company’s share option and Long Term Incentive Schemes. The remuneration of the non-executive Directors is determined by the Remuneration Committee within the total amount approved by the Company’s shareholders.
The Remuneration Committee met five times during the year. Information on meeting attendance by Remuneration Committee members is included in the table on page 37.
The Remuneration Committee’s key objectives are to: • align senior executives’ remuneration with the interests of
shareholders and other stakeholders, including customers and employees;
• promote the achievement of both the Company’s annual plans and its strategic objectives by providing a remuneration package that contains appropriately motivating targets; and
• establish a competitive remuneration package to attract, retain and motivate high quality leaders.
Full details of the Remuneration Committee’s members, attendance, objectives, responsibilities and key activities during the year are set out in the Statement on Directors’ remuneration on pages 46 to 53.
Audit Committee
The Audit Committee is chaired by Mr J Callaghan and its other members are Mr L Herlihy, Mr V Quinlan, Mr H Corbally, Mr J Fitzgerald, Mr P Haran and Mr J Liston, all of whom are non-executive Directors.
The Audit Committee met four times during the year. Information on meeting attendance by Audit Committee members is included in the table on page 37.
The main role and responsibilities of the Audit Committee include:
• to monitor the integrity of the financial statements of the Group, and any formal announcements relating to the Group’s financial performance, reviewing significant financial reporting judgements contained in them;
• to review the Group’s internal financial controls and, unless expressly addressed by a separate Board risk committee composed of non-executive Directors, or by the Board itself, to review the Group’s internal control and risk management systems;
• to monitor and review the effectiveness of the Group’s internal audit function;
• to make recommendations to the Board, and to the shareholders for their approval in general meeting, in relation to the appointment, re-appointment and removal of the external auditors and to approve the remuneration and terms of engagement of the external auditors;
• to review and monitor the external auditors’ independence and objectivity and the effectiveness of the audit process, taking into consideration relevant Irish professional and regulatory requirements;
• to develop and implement policy on the engagement of the external auditors to supply non-audit services, taking into account relevant ethical guidance regarding the provision of non-audit services by the external audit firm; and to report to the Board, identifying any matters in respect of which it considers that action or improvement is needed and making recommendations as to the steps to be taken; and
• to review the arrangements by which staff of the Group may, in confidence, raise concerns about possible improprieties in matters of financial reporting or other matters.
Key activities during the year• Review of the integrity of the financial statements
The Audit Committee assisted the Board in assuring the integrity of the financial statements of the Group and any formal announcements by evaluating and making recommendations to the Board on the appropriateness of accounting policies and practices, areas of judgement, compliance with accounting standards and the results of external and internal audits prior to their submission to the Board for approval.
• Review of the Group’s internal control and risk management systemsThe Board is ultimately responsible for risk management which includes the Group’s risk governance structure and maintaining an appropriate internal control framework. The Audit Committee terms of reference includes responsibility for reviewing the effectiveness of the Group’s internal control and risk management systems. During 2009 the Audit Committee in conjunction with members of the executive management team reviewed the population of risks the business is exposed to and identified and evaluated the key areas of risk for the Group. Management presentations included detailed reviews of the key Group risks identified and of the systems for managing these risks. Further details of these reviews are outlined in the Risk management report on pages 28 to 29.
Glanbia plc 2009 Annual Report Directors’ report: Corporate governance42
• Review of auditors Independence The Audit Committee manages the relationship with the external auditors on behalf of the Board. In doing so it provided recommendations in relation to the re-appointment of the existing auditors and reviewed and approved their terms of engagement. It also assessed the performance of the auditors and their level of independence and objectivity in carrying out their duties in line with the Group auditor relationship and Independence policy.
• Review of the effectiveness of the Internal Audit function The Audit Committee reviewed and approved the annual Internal Audit Plan (the “Plan”) and ensured that the function was adequately staffed to perform its duties. The Audit Committee reviewed progress against the Plan and received an executive summary of all audit reports issued by the internal audit department.
• Review of Audit Committee Performance The Audit Committee assessed its performance and as a result of that assessment the Audit Committee is satisfied that it is functioning effectively in line with its terms of reference.
Relations with auditorsThe Company has in place a formal policy on auditor relationship and independence with which the external auditors are required to comply, to ensure that the independence of the auditors is not impaired by the nature of non-audit work. This policy provides that the Group shall not retain its independent auditors to provide services other than audit and audit-related services other than in exceptional circumstances.
The following services are prohibited unless approved under the terms of the policy:
• bookkeeping or other administrative services related to the Group’s accounting records or financial statements;
• financial information systems design and implementation;
• Internal Audit services;
• management functions;
• executive searches for the Group Managing Director or Group Finance Director; and
• legal services.
Details of the Auditor’s remuneration is set out in note 6 – operating expenses. The audit engagement partner rotates every five years.
Finance Sub-Board
The Finance Sub-Board is chaired by Mr L Herlihy and its other members are Mr V Quinlan, Mr J Fitzgerald, Mr J Callaghan, Mr E Fitzpatrick, Mr P Haran, M J Liston, Mr J Moloney and Ms S Talbot.
The Finance Sub-Board met once during the year.
The Finance Sub-Board’s key objective is to consider and, where appropriate, make recommendations to the Board in respect of any change in Group strategy or any acquisition or divestment above a certain level.
Activities during the year• Recommendation on pension strategy for Irish pension schemes.
US Advisory Board
The US Advisory Board was established to assist the Board in developing a greater awareness of activities and market trends in the relevant USA industry sectors. Mr L Herlihy, Chairman, is Chairman of the US Advisory Board. The membership of the Advisory Board currently comprises: Mr J Callaghan, Senior Independent Director; Mr K Toland, Executive Director; Messrs J Fitzgerald and V Quinlan, Vice-Chairmen; Mr M Walsh, Glanbia Chairman from 2005 to 2008; and Messrs J McCullough, P Rogers, W Seltzer and Ms S Davis, USA based members*. Mr J Moloney, Group Managing Director, also attends meetings of the US Advisory Board.
* Mr J McCullough, retired, was previously Chief Executive Officer of CRH Americas Products and Distribution. He joined CRH in 1979 and has held a number of senior management positions with that company.
* Mr P Rogers, retired, was previously President of Nabisco Foods Americas and held a variety of other senior positions in food companies.
* Mr W Seltzer recently retired as Chief Executive Officer of Seltzer Companies, Inc.
* Ms S Davis is Chairperson of Susan Davis International, a Washington D.C. based public affairs agency.
Internal control
The Board has overall responsibility for the group’s system of internal control, for reviewing its effectiveness and for confirming that a process exists for the identification, evaluation and management of risk in order to ensure that the Group’s strategic objectives are achieved. This process has been in place for the year covered in this Annual report and financial statements and up to the date of its approval. The Turnbull Guidance sets out best practice on internal control for Irish and UK listed companies to assist them in assessing the application of the Combined Code’s principles and compliance with the Combined Code’s provisions with regard to internal control. The Group’s systems of internal control are regularly reviewed by the Board and accord with the Turnbull Guidance which the Board has fully adopted.
Glanbia plc 2009 Annual Report Directors’ report: Corporate governance 43
While acknowledging its responsibility for the system of internal control, the Board is aware that such a system is designed to manage rather than eliminate the risk of failure to achieve business objectives, and can only provide reasonable and not absolute assurance against material misstatement or loss.
The Group’s key systems of internal control and risk management can be summarised as follows;
• a code of conduct that defines a set of agreed standards and guidelines for corporate behaviour;
• clearly defined organisation structures and lines of authority including appropriate terms of reference for Board Committees;
• a Group-wide risk assessment process which is maintained by business unit management reporting to the Group Executive and Board as required;
• the Audit Committee, a formally constituted committee of the Board comprising non-executive Directors only. It meets with internal and external auditors to satisfy itself that control procedures are in place and are being followed;
• a Group Internal Audit function which monitors financial, operational and regulatory controls and reports to the Audit Committee and management. The annual audit plan is approved by the Audit Committee;
• a control self assessment programme has been implemented which assesses internal control and fraud prevention processes; and
• Financial reporting process internal control and risk management systems which include the following main features:
- Board approval of the annual budget plan following Group and business unit strategy plan reviews;
- monitoring of performance against the annual budget through monthly board reports detailing actual versus budgeted results, analysis of material variances, review of key performance indicators and re-forecasting where required;
- Audit Committee review of the integrity of the half-year accounts and annual financial statements, interim management statements and any formal announcements. Any resulting recommendations are included in the Audit Committee Chairman’s Board report;
- Board review and approval of the group half-year accounts, annual accounts, interim management statements and any formal announcements;
- the establishment of clearly defined guidelines for capital expenditure, including detailed budgeting, appraisal and post-investment reviews;
- the use of a Group finance management manual that clearly sets out Group accounting policies and financial control procedures; and
- Board approved treasury risk management policies, designed to ensure that Group foreign exchange and interest rate exposures are managed within defined parameters.
The Board has reviewed the effectiveness of the current systems of internal control specifically for the purpose of this statement. In judging the effectiveness of the Group’s controls, the Board monitors the reports of the Audit Committee and management. Without diminishing its own responsibilities the Board has delegated certain acts to the Audit Committee. These include detailed reviews of key risks inherent in the business and of the systems for managing these risks. Further details of these reviews are outlined in the Risk management report on pages 28 to 29. The Chairman of the Audit Committee reports to the Board after each meeting of the Audit Committee. In addition to the Audit Committee reporting the Board has also taken assurance through the work of the various other Board Committees. The Board is satisfied that the Group internal controls systems are properly reviewed and effective.
The Directors, through the use of appropriate procedures and systems, have also ensured that measures are in place to secure compliance with the Company’s obligation to keep proper books of account. These books of account are kept at the registered office of the Company.
Memorandum and Articles of Association
The Company’s Memorandum and Articles of Association set out the objects and powers of the Company. The Articles detail the rights attaching to each share class; the method by which the Company’s shares can be purchased or re-issued; the provisions which apply to the holding of and voting at general meetings; and the rules relating to the Directors, including their appointment, retirement, re-election, duties and powers. A copy of the Memorandum and Articles of Association can be obtained from the Company’s website, www.glanbia.com.
Share capital
At 2 January 2010 the authorised share capital of the Company was 306,000,000 ordinary shares of €0.06 each and the issued share capital was 293,555,684 ordinary shares of €0.06 each, of which 54.6% was held by the Society. All the Company’s shares are fully paid up and quoted on the Irish and London Stock Exchanges. No shares were allotted during the year. Details of the Company’s share capital and shares under option or award at 2 January 2010 are given in note 23 to the financial statements.
Rights and obligations of ordinary sharesOn a show of hands at a general meeting every holder of ordinary shares present in person or by proxy and entitled to vote shall have one vote. On a poll, every member present in person or by proxy, shall have one vote for every ordinary share held. In accordance with the provisions of the Articles of Association, holders of ordinary shares are entitled to a dividend where declared or paid out of profits available for such purposes. On return of capital on a winding up, holders of ordinary shares are entitled to participate in such a return.
Glanbia plc 2009 Annual Report Directors’ report: Corporate governance44
Amendments to the Company’s Articles of Association will be proposed at the forthcoming AGM to take account of the provisions of The Shareholders’ Rights (Directive 2007/36/EC) Regulations 2009 and to permit future dividends to be made only by credit transfer into a nominated bank or building society account. The amendments to take account of the Shareholders’ Rights (Directive 2007/36/EC) Regualtions 2009 will include measures relating to the votes of proxies and multiple corporate representatives at general meetings of the Company. Further information can be found in the circular to shareholders accompanying the notice of the AGM.
Rights under the Shareholders’ Rights (Directive 2007/36/EC) Regulations 2009 Members have the right to ask questions related to items on the agenda of a general meeting and to receive answers, subject to certain qualifications.
Members (s) holding 3% of the issued share capital of the company, representing at least 3% of its total voting rights, will have the right to put items on the agenda and to table draft resolutions at AGMs. The request must be received by the company at least 42 days before the relevant meeting.
Further details of shareholders rights under the Shareholders’ Rights (Directive 2007/36/EC) Regulations 2009 are contained in the notice of the 2010 AGM available on the Group website www.glanbia.com and posted with this Report.
Exercise of rights of shares in employee share schemesAs detailed in note 23 to the financial statements at 2 January 2010, 570,054 ordinary shares were held in an employee benefit trust for the purpose of the Group’s employee share schemes. Whilst any shares in the Company are held by the Trustees, the Trustees shall refrain from exercising any voting rights which may attach to the shares save that, if the beneficial interest in any share has been vested in any beneficiary, the Trustees shall seek and comply with any direction from such beneficiary as to the exercise of voting rights attaching to such share.
Restrictions on transfer of sharesWith the exception of restrictions on transfer of shares under the Company’s share schemes while the shares are subject to the schemes, there are no restrictions on the voting rights attaching to the Company’s ordinary shares or the transfer of securities in the Company.
No person holds securities in the Company carrying special rights with regard to control of the Company. The Company is not aware of any agreements between holders of securities that may result in restrictions in the transfer of securities or voting rights.
Unless expressly specified to the contrary in the Articles of Association of the Company, the Company’s Articles of Association may be amended by special resolution of the Company’s shareholders.
Authority to purchase own sharesAt the Company’s AGM held on 13 May 2009, shareholders renewed the Company’s authorities to make market purchases of up to 10% of the aggregate nominal value of the issued share capital of the Company at close of business on that date. These authorities were not used during the year and, at the forthcoming AGM, shareholders will be asked to renew them for another year. Details are contained in the notice of AGM. As detailed in note 23 to the financial statements at 2 January 2010, 570,054 ordinary shares were held in an employee benefit trust for the purpose of the Group’s employee share schemes.
Substantial interestsAt 9 March, 2010, the Company has been advised of the following notifiable interests in its ordinary share capital:
Shareholder No. of ordinary shares
% of issued share capital
Glanbia Co-operative Society Limited
160,277,308
54.6%
Communication with shareholders
The Company places considerable importance on communication with shareholders and engages with them on a wide range of issues. The Group has an ongoing programme of dialogue and meetings between the executive Directors and institutional investors, fund managers and analysts. At these meetings a wide range of relevant issues including strategy, performance, management and governance are discussed within the constraints of information already made public.
The Group Finance Director facilitates communication with institutional investors. The Directors consider it important to understand the views of shareholders and, in particular, any issues which concern them. The Board receives reports on matters that have been raised with management at the regular meetings held with the large investors. During the year the Chairman held a meeting with the major institutional investors and attended investor meetings with management. In addition, the Senior Independent Director is available to meet with major shareholders to discuss any areas of concern that cannot be resolved through normal channels of investor communication and arrangements can be made to meet with the Senior Independent Director through the Group Secretary. Similarly, arrangements can be made for major shareholders to meet with newly appointed directors. In addition, the Board consults with shareholders in connection with specific issues where it considers appropriate.
The Board is equally interested in the concerns of private shareholders and, on its behalf the Group Secretary oversees communication with these investors. All material information reported to the regulatory news services is simultaneously published on the Company’s website affording all shareholders full access to Company announcements.
Glanbia plc 2009 Annual Report Directors’ report: Corporate governance 45
The Company has taken full advantage of the provisions within the Transparency (Directive 2004/109/EC) Regulations 2007 allowing communications to be made electronically to shareholders where they have not requested hard copy documentation. As a result the Company’s website has become the primary method of communication for the majority of its shareholders.
To ensure shareholders have time to consider the annual report and accounts and notice of the AGM and lodge their proxy votes they were mailed more than 20 working days prior to the meeting. The Group offers all shareholders the choice of submitting proxy votes either electronically or in paper format. It also offers them the ability to abstain.
The Company’s AGM, which is held in Ireland, provides a valuable opportunity for the Board to communicate with private investors. At the meeting, the Company complies with the Combined Code as it relates to voting, the separation of resolutions and the attendance of Committee chairmen. Whenever possible, all Directors attend the AGM and shareholders are invited to ask questions during the meeting and have an opportunity to meet with the Directors following the conclusion of the formal part of the meeting. In line with the Combined Code, details of proxy voting by shareholders, including votes withheld, are made available on request and are placed on the Company’s website following the meeting.
The Company’s annual report and accounts and annual review, together with the Company’s half-yearly reports, interim management statements and other public announcements are designed to present a balanced and understandable view of the Group’s activities and prospects and are available on the Company’s website. The Chairman’s statement, Group Managing Director’s review, and Business review provide an assessment of the Group’s affairs and they will be supported by a presentation to be made at the AGM.
Full details of the AGM to be held on Tuesday 25 May 2010, together with explanations of the resolutions to be proposed, are contained in the notice of the AGM available on the Group’s website www.glanbia.com and posted with this Report. In addition to the ordinary business of an AGM, shareholders are being asked to:
• renew the Directors’ authority to allot relevant securities, within the meaning of section 20 of the Companies (Amendment) Act, 1983, up to an aggregate nominal amount of equal to the authorised but unissued share capital of the Company of the date of the AGM;
• renew the authority to disapply the strict statutory pre-emption provisions in the event of a rights issue or in any other issue up to an aggregate amount of €746,658.96 in nominal value of ordinary shares, representing 4.24% of the nominal value of the Company’s issued ordinary share capital for the time being;
• extend the authority to purchase up to 10% of its own shares until the earlier of the close of business on 24 August 2011 or the date of the AGM of the Company in 2011;
• pass a resolution authorising the Company to reissue such shares purchased by it and not cancelled as treasury shares;
• give approval to call an Extraordinary General Meeting on 14 days notice; and
• amend the Articles of Association so as to update the Articles of Association in order to make them consistent with the Shareholders’ Rights (Directive 2007/36/EC) Regulations 2009 and permit future dividends to be made only by credit transfer into a nominated bank or building society account.
Change of control provisions
The Company has certain banking facilities which may require repayment in the event that a change in control occurs with respect to the Company. There are also a number of agreements that take effect, alter or terminate upon a change of control of the Company, such as commercial contracts and joint venture agreements. In addition, the Company’s long term incentive plans contain change of control provisions which can allow for the acceleration of the exercisability of share options and the vesting of share awards in the event that a change of control occurs with respect to the Company.
Corporate responsibility
As the Group grows and develops as a leading international cheese and nutritional ingredients Group, so also does the Group’s commitment to conducting its business in a way that is economically, socially and environmentally sustainable.
During 2009 the Group made further progress in its corporate citizenship objectives, more particular details of which are summarised in Our responsibilities section of this report on pages 30 to 33.
Accountability and audit
Financial reporting Directors’ responsibilities for preparing the financial statements for the Company and the Group are detailed on page 55. The auditors’ report details the respective responsibilities of Directors and auditors.
Going concernAfter making enquiries the Directors have a reasonable expectation that the Company and the Group have adequate resources to continue in operation and existence for the foreseeable future, and accordingly they continue to adopt a going concern basis in preparing the financial statements.
Glanbia plc 2009 Annual Report Directors’ report: Corporate governance46
This report sets out the remuneration policy for the Company’s Directors, describes its implementation and discloses the amounts earned in 2009.
This report covers the following:
• the Remuneration Committee’s objectives, membership and main activities in 2009;
• a review of the Company’s remuneration policy and practice;
• summary of basic salary benefits, performance related bonus, share-based incentive schemes and pension benefits;
• service contracts;
• external board appointments;
• remuneration policy for non-executive Directors; and
• tables summarising the 2009 position on: Directors’ remuneration and Directors’ and Secretary’s interests in shares.
Remuneration Committee objectives
The Remuneration Committee is a committee of the Board. Its terms of reference are available from the Group Secretary and can be found on the Company’s website www.glanbia.com.
The Remuneration Committee’s key objectives are to: • align senior executives’ remuneration with the interests of
shareholders and other stakeholders, including customers and employees;
• promote the achievement of both the Company’s annual plans and its strategic objectives by providing a remuneration package that contains appropriately motivating targets; and
• establish a competitive remuneration package to attract, retain and motivate high quality leaders.
The Remuneration Committee’s main responsibilities are to: • determine and agree with the Board the framework or broad
policy for the remuneration of the Group Managing Director, the Group Chairman, the executive Directors, the Group Secretary and such other members of the executive management as it is designated to consider;
• ensure that members of the executive management of the Company are provided with appropriate incentives to encourage enhanced performance and are, in a fair and responsible manner, rewarded for their individual contributions to the success of the Company;
• review the ongoing appropriateness and relevance of the remuneration policy;
• approve the design of, and determine targets for, any performance-related pay schemes operated by the Company and approve the total annual payments made under such schemes;
• review the design of all share incentive plans for approval by the Board and shareholders;
• determine each year whether share awards will be made, and if so, the overall amount of such share awards, the individual share awards to executive Directors and other senior executives and the performance targets to be achieved;
• determine the policy for, and scope of, pension arrangements for each executive Director and other senior executives;
• ensure that contractual terms on termination, and any payments made are fair to the individual, and the Company, that failure is not rewarded and that the duty to mitigate loss is fully recognised;
• within the terms of the agreed policy and in consultation with the Group Chairman and/or the Group Managing Director as appropriate, determine the total individual remuneration package of each executive Director and other senior executives including bonuses, incentive payments and share options or other share awards;
• review and note annually the remuneration trends across the Company or Group;
• oversee any major changes in employee benefits structures throughout the Company or Group;
• ensure that all provisions regarding disclosure of remuneration including pensions, as set out in the Combined Code on Corporate Governance issued by the Financial Reporting Council (the “Combined Code”), are fulfilled; and
• be exclusively responsible for establishing the selection criteria, selecting, appointing and setting the terms of reference for any remuneration consultants who advise the Remuneration Committee; and for obtaining reliable, up-to-date information about remuneration in other companies as appropriate.
Remuneration Committee membership
The Remuneration Committee is chaired by J Liston and its members are L Herlihy, V Quinlan, J Callaghan, J Fitzgerald and P Haran, all of whom are non-executive Directors.
The Remuneration Committee met on five occasions in 2009 and the meeting attendance record is set out in the Statement on corporate governance.
Remuneration Committee meetings are generally attended by Mr J Moloney, the Group Managing Director and Mr B Phelan, the Group Human Resources Director (other than when their own remuneration is being discussed). The Group Secretary acts as secretary to the Remuneration Committee.
Statement on Directors’ remuneration
Glanbia plc 2009 Annual Report Directors’ report: Corporate governance 47
The Remuneration Committee appointed Mercer to advise them on a review of senior executive remuneration which culminated in the introduction of the 2007 and 2008 Long Term Incentive Plans (the “LTIPs”). The Group Secretary and the Group Human Resources Director advised the Remuneration Committee in relation to the operation of the Company’s share plans.
In line with the Combined Code requirements, the Board undertook a review of the effectiveness of the Remuneration Committee during the year. The 2009 review concluded that the Remuneration Committee had fulfilled its role and responsibilities appropriately.
Remuneration Committee activities during 2009
The Remuneration Committee considers matters relating to the operation of the remuneration policy and emerging market practices. In 2009 the Remuneration Committee discussed, amongst others, the issues set out below:
• approval of Group Managing Director’s service contract;
• annual review of executive Directors’ basic salaries and benefits in kind ;
• annual consideration and approval of executive Directors’ bonus target for 2009;
• a review and approval of LTIP grants to the executive Directors’ and approval of the performance conditions for the 2009 grants;
• a performance test of existing options;
• senior management salary review for the Group; and
• strategic review of the ongoing funding of the Group’s defined benefit pension scheme.
During the year, the Group Managing Director and all other Directors and senior management reporting directly to the Group Managing Director volunteered to take a reduction in their basic salaries.
Remuneration policy and practice
The Remuneration Committee determines, on behalf of the Board, the Group’s framework of executive remuneration and the specific packages and conditions of employment for each of the executive Directors and certain senior executives, as decided by the Board. The Remuneration Committee consults the Group Managing Director regarding remuneration proposals and obtains internal and external professional advice as deemed appropriate. The Remuneration Committee operates the Company’s share option and Long Term Incentive Schemes.
Remuneration policyRemuneration policy is based on attracting, retaining and motivating executives to ensure that they perform in the best interests of the Group and its shareholders. Performance-related elements of remuneration form a significant proportion of the total remuneration package of executive Directors. The Remuneration Committee obtains external advice on remuneration in comparable companies as necessary and has given full consideration to the Combined Code.
Basic salaries and benefitsThe basic salaries of executive Directors are reviewed annually having regard to personal performance, competitive market practice or where a change of responsibility occurs. Benefits-in-kind consist principally of a company car. No fees are payable to executive Directors for their attendance at Board meetings.
Performance-related annual bonusThe Group operates a performance-related bonus scheme for executive Directors, senior executives and other management. Payments under the scheme for executive Directors depend on the achievement of pre-determined goals for Group performance and an assessment of individual performance against agreed objectives.
Share-based incentive schemesThe 2002 LTIPIn 2002 shareholders approved the introduction of the 2002 LTIP for selected Group employees in order to further align the interests of key Group personnel with those of shareholders. Under the 2002 LTIP options cannot be exercised before the expiration of three years from the date of grant and can only be exercised if a predetermined performance criterion for the Company has been achieved. The performance criterion is that there has been an increase in the adjusted EPS of the Company of at least the increase in the Consumer Price Index plus 5% compounded over a three-year period.
To encourage participating executives to hold the shares issued to them on the exercise of their options, share awards specified as a percentage of the shares held will be made on the second and fifth anniversaries of the exercise of the option. The number of shares which may be the subject of such awards may not exceed 20% and 10% of the number of shares so held on the respective anniversaries.
Benefits under the 2002 LTIP are not pensionable.
The 2008 LTIPThe 2008 LTIP has been designed so that any rewards will be dependent on a sustained improvement in the underlying financial performance of the Group in the period since the date of the grant of the relevant awards. Where there is sustained improvement in the underlying financial performance, the extent of vesting shall be determined by growth in the Company’s EPS (earnings per share) and the Company’s TSR (total shareholder return) performance (the “EPS condition” and the “TSR Performance Condition”, respectively). The vesting of 50% of the shares which are the subject of an award will be subject to the EPS Condition and the remaining 50% shall be subject to the TSR Performance Condition.
EPSEPS is the adjusted consolidated earnings or profit made by the Company divided by the number of shares outstanding (as shown in the annual report).
TSRTSR represents the change in capital value of a listed/quoted company over a period, plus dividends, expressed as a plus or minus percentage of the opening value.
Glanbia plc 2009 Annual Report Directors’ report: Corporate governance48
EPS ConditionUnder the EPS Condition, there must be an increase in the adjusted consolidated EPS of the Company of at least the increase in the Consumer Price Index plus 5% compounded over a three year period. The benefit which a participant can receive under the 2008 LTIP will depend on the annualised percentage increase in the Company’s EPS over the performance period.
There are three pre-defined levels of EPS performance, which will govern the percentage level of vesting that may occur under an award.
The 2008 LTIP provides that at the lowest level, no part of an award may vest unless the Company’s EPS performance over the performance period achieves at least the annualised percentage increase in the Consumer Price Index plus 5% compounded over the performance period.
Where the Company’s EPS performance over the performance period equals the annualised percentage increase in the Consumer Price Index plus 5% compounded over the performance period, then 25% of the award shall vest.
Where the Company’s EPS performance over the performance period equals or is greater than the annualised percentage increase in the Consumer Price Index plus 10% compounded over the performance period, then 50% of the award shall vest.
Where the Company’s EPS performance over the performance period is between the thresholds of the annualised percentage increase in the Consumer Price Index plus 5% and the annualised percentage increase in the Consumer Price Index plus 10% compounded, then a pro rata vesting on a straight line basis shall apply.
TSR Performance ConditionUnder the TSR Performance Condition, the Company’s TSR performance will be compared against the TSR performance of a peer group of food companies. The benefit which a participant can receive under the 2008 LTIP will depend on how well the Company’s TSR performance compares against this peer group over the performance period.
There are three pre-defined levels of TSR performance, which will govern the percentage level of vesting that may occur under an award.
The 2008 LTIP provides that at the lowest level, no part of an award may vest unless the Company’s TSR performance over the performance period achieves at least the median TSR performance of the peer group of food companies.
Where the Company’s TSR performance equals the median TSR performance of the peer group, then 15% of the award shall vest.
Where the Company’s TSR performance is equal to or above the top 25% of TSR performance of the peer group, then 50% of the award shall vest.
Where the Company’s TSR performance is between the median and top 25% of TSR performance of the peer group, then a pro rata vesting on a straight line basis shall apply.
The 2007 LTIPThe 2007 LTIP corresponds with the 2008 LTIP except that Directors were excluded from participating and the extent of vesting is determined only by reference to growth in the Company’s EPS and the Company’s TSR. The 2008 LTIP has since replaced the 2007 LTIP.
Pension benefits Pension benefits for executive Directors are calculated on basic salary only. Benefits are designed to provide a percentage of basic salary at retirement for full service.
Service contractsNo Director has a service contract with a notice period in excess of one year or with provisions for pre-determined compensation on termination which exceed one year’s salary and benefits-in-kind.
External Board appointments
Non-executive Directors may serve on a number of outside Boards, provided they continue to demonstrate the requisite commitment to discharge effectively their duties to the Company. The Nomination Committee keeps the extent of Directors’ other interests under review to ensure that the effectiveness of the Board is not compromised. The Board is satisfied that the Chairman and each of the non-executive Directors commit sufficient time to the fulfilment of their duties as Chairman and Directors of the Company respectively.
The Board believes, in principle, in the benefit of executive Directors and members of the executive Committee accepting non-executive directorships of other companies in order to broaden their experience and knowledge for the benefit of the Company. Accordingly, executive Directors are permitted to accept external non-executive Board appointments, subject to the agreement of the Board, and are allowed to retain any fees received from that appointment. The Group Managing Director, Mr J Moloney, is a Director of The Irish Dairy Board Co-operative Limited and DCC plc for which he received fees of €12,000 and €61,000, respectively, which he retained.
Non-executive DirectorsThe remuneration policy for non-executive Directors is to pay the market rate to secure persons of a suitable calibre for a group of this size. The remuneration of the non-executive Directors is determined by the Remuneration Committee within the total amount approved by the Company’s shareholders in general meeting from time to time. The responsibility of the role and international nature of the Group are fully considered when setting the fee levels. The Chairman of each Remuneration Committee receives an additional fee. The non-executive Directors’ fees are non-pensionable and non-executive Directors are not eligible to participate in any incentive plans. The non-executive Directors do not have service contracts with the Company, but are appointed to the Board under letters of appointment for an initial three-year period. They are subject to retirement and re-appointment by shareholders at the first Annual General Meeting following their appointment and every three years thereafter.
Directors’ remuneration
Details of Directors’ salary, fees and other benefits are set out in Table 1 on page 49 opposite.
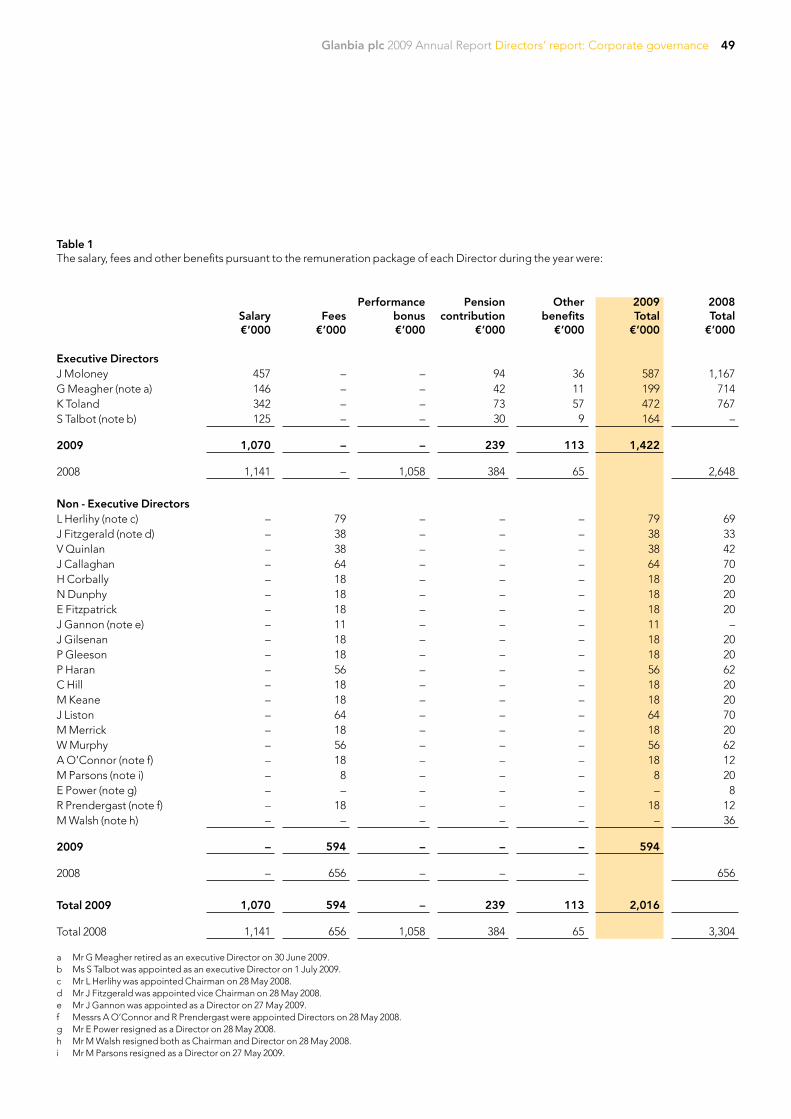
Glanbia plc 2009 Annual Report Directors’ report: Corporate governance 49
Table 1 The salary, fees and other benefits pursuant to the remuneration package of each Director during the year were:
Salary €’000
Fees €’000
Performance bonus €’000
Pension contribution
€’000
Other benefits
€’000
2009 Total
€’000
2008 Total
€’000
Executive DirectorsJ Moloney 457 – – 94 36 587 1,167G Meagher (note a) 146 – – 42 11 199 714K Toland 342 – – 73 57 472 767S Talbot (note b) 125 – – 30 9 164 –
2009 1,070 – – 239 113 1,422
2008 1,141 – 1,058 384 65 2,648
Non - Executive DirectorsL Herlihy (note c) – 79 – – – 79 69J Fitzgerald (note d) – 38 – – – 38 33V Quinlan – 38 – – – 38 42J Callaghan – 64 – – – 64 70H Corbally – 18 – – – 18 20N Dunphy – 18 – – – 18 20E Fitzpatrick – 18 – – – 18 20J Gannon (note e) – 11 – – – 11 –J Gilsenan – 18 – – – 18 20P Gleeson – 18 – – – 18 20P Haran – 56 – – – 56 62C Hill – 18 – – – 18 20M Keane – 18 – – – 18 20J Liston – 64 – – – 64 70M Merrick – 18 – – – 18 20W Murphy – 56 – – – 56 62A O’Connor (note f) – 18 – – – 18 12M Parsons (note i) – 8 – – – 8 20E Power (note g) – – – – – – 8R Prendergast (note f) – 18 – – – 18 12M Walsh (note h) – – – – – – 36
2009 – 594 – – – 594
2008 – 656 – – – 656
Total 2009 1,070 594 – 239 113 2,016
Total 2008 1,141 656 1,058 384 65 3,304 a Mr G Meagher retired as an executive Director on 30 June 2009. b Ms S Talbot was appointed as an executive Director on 1 July 2009. c Mr L Herlihy was appointed Chairman on 28 May 2008. d Mr J Fitzgerald was appointed vice Chairman on 28 May 2008. e Mr J Gannon was appointed as a Director on 27 May 2009. f Messrs A O’Connor and R Prendergast were appointed Directors on 28 May 2008. g Mr E Power resigned as a Director on 28 May 2008. h Mr M Walsh resigned both as Chairman and Director on 28 May 2008. i Mr M Parsons resigned as a Director on 27 May 2009.
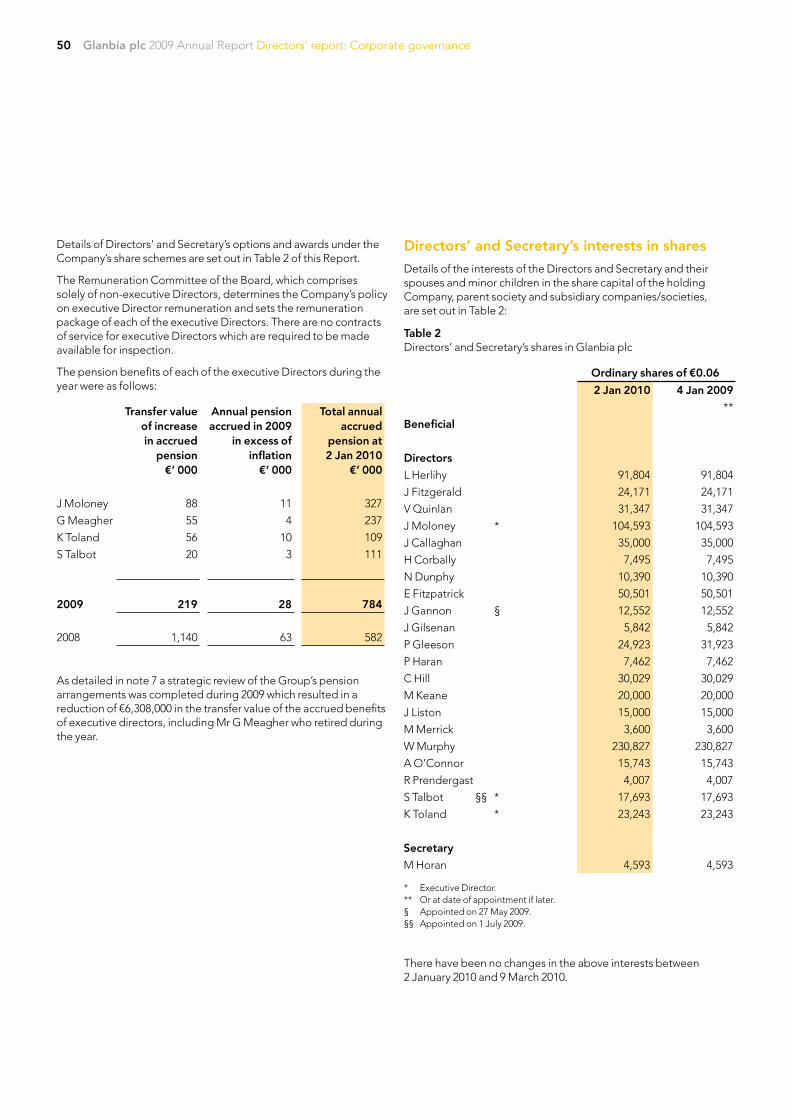
Glanbia plc 2009 Annual Report Directors’ report: Corporate governance50
Details of Directors’ and Secretary’s options and awards under the Company’s share schemes are set out in Table 2 of this Report.
The Remuneration Committee of the Board, which comprises solely of non-executive Directors, determines the Company’s policy on executive Director remuneration and sets the remuneration package of each of the executive Directors. There are no contracts of service for executive Directors which are required to be made available for inspection.
The pension benefits of each of the executive Directors during the year were as follows:
Transfer value of increase in accrued
pension€’ 000
Annual pension accrued in 2009
in excess of inflation
€’ 000
Total annual accrued
pension at 2 Jan 2010
€’ 000
J Moloney 88 11 327
G Meagher 55 4 237
K Toland 56 10 109
S Talbot 20 3 111
2009 219 28 784
2008 1,140 63 582
As detailed in note 7 a strategic review of the Group’s pension arrangements was completed during 2009 which resulted in a reduction of €6,308,000 in the transfer value of the accrued benefits of executive directors, including Mr G Meagher who retired during the year.
Directors’ and Secretary’s interests in shares
Details of the interests of the Directors and Secretary and their spouses and minor children in the share capital of the holding Company, parent society and subsidiary companies/societies, are set out in Table 2:
Table 2Directors’ and Secretary’s shares in Glanbia plc
Ordinary shares of €0.06
2 Jan 2010 4 Jan 2009
**
Beneficial
Directors
L Herlihy 91,804 91,804
J Fitzgerald 24,171 24,171
V Quinlan 31,347 31,347
J Moloney * 104,593 104,593
J Callaghan 35,000 35,000
H Corbally 7,495 7,495
N Dunphy 10,390 10,390
E Fitzpatrick 50,501 50,501
J Gannon § 12,552 12,552
J Gilsenan 5,842 5,842
P Gleeson 24,923 31,923
P Haran 7,462 7,462
C Hill 30,029 30,029
M Keane 20,000 20,000
J Liston 15,000 15,000
M Merrick 3,600 3,600
W Murphy 230,827 230,827
A O’Connor 15,743 15,743
R Prendergast 4,007 4,007
S Talbot §§ * 17,693 17,693
K Toland * 23,243 23,243
Secretary
M Horan 4,593 4,593 * Executive Director. ** Or at date of appointment if later. § Appointed on 27 May 2009. §§ Appointed on 1 July 2009.
There have been no changes in the above interests between 2 January 2010 and 9 March 2010.
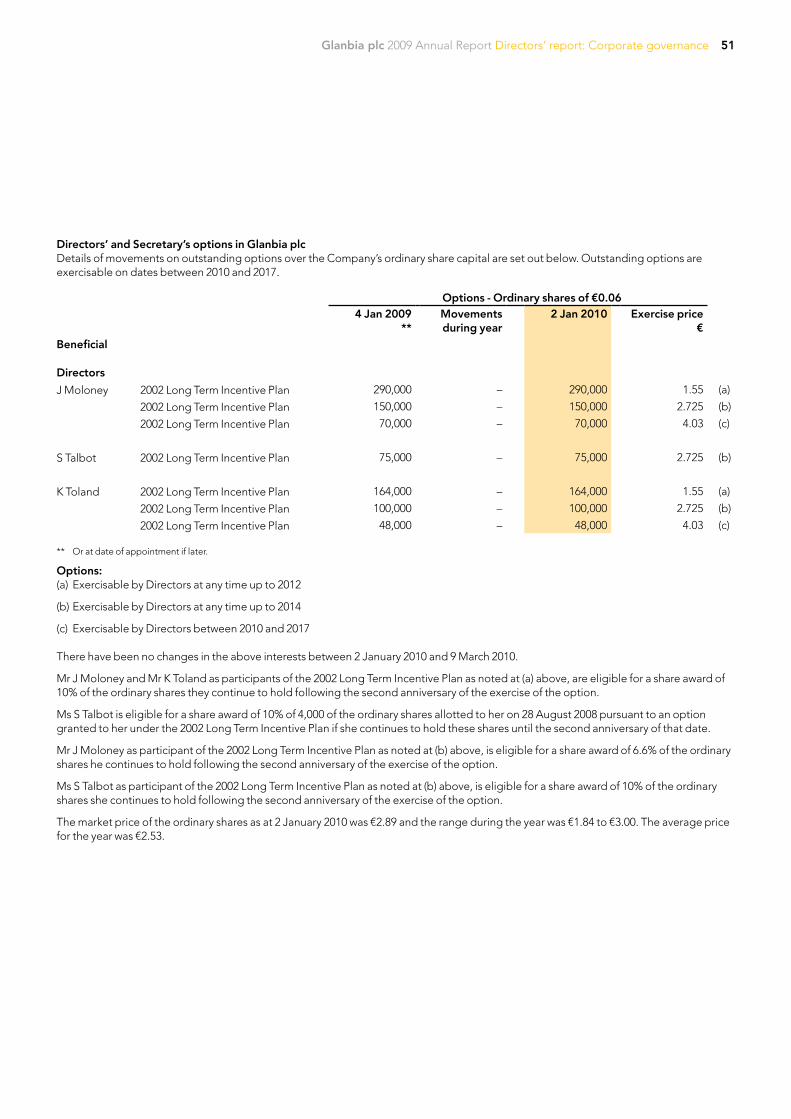
Glanbia plc 2009 Annual Report Directors’ report: Corporate governance 51
Directors’ and Secretary’s options in Glanbia plcDetails of movements on outstanding options over the Company’s ordinary share capital are set out below. Outstanding options are exercisable on dates between 2010 and 2017.
Options - Ordinary shares of €0.064 Jan 2009
**Movements during year
2 Jan 2010 Exercise price €
Beneficial
Directors
J Moloney 2002 Long Term Incentive Plan 290,000 – 290,000 1.55 (a)
2002 Long Term Incentive Plan 150,000 – 150,000 2.725 (b)
2002 Long Term Incentive Plan 70,000 – 70,000 4.03 (c)
S Talbot 2002 Long Term Incentive Plan 75,000 – 75,000 2.725 (b)
K Toland 2002 Long Term Incentive Plan 164,000 – 164,000 1.55 (a)
2002 Long Term Incentive Plan 100,000 – 100,000 2.725 (b)
2002 Long Term Incentive Plan 48,000 – 48,000 4.03 (c) ** Or at date of appointment if later.
Options:(a) Exercisable by Directors at any time up to 2012
(b) Exercisable by Directors at any time up to 2014
(c) Exercisable by Directors between 2010 and 2017 There have been no changes in the above interests between 2 January 2010 and 9 March 2010.
Mr J Moloney and Mr K Toland as participants of the 2002 Long Term Incentive Plan as noted at (a) above, are eligible for a share award of 10% of the ordinary shares they continue to hold following the second anniversary of the exercise of the option.
Ms S Talbot is eligible for a share award of 10% of 4,000 of the ordinary shares allotted to her on 28 August 2008 pursuant to an option granted to her under the 2002 Long Term Incentive Plan if she continues to hold these shares until the second anniversary of that date.
Mr J Moloney as participant of the 2002 Long Term Incentive Plan as noted at (b) above, is eligible for a share award of 6.6% of the ordinary shares he continues to hold following the second anniversary of the exercise of the option.
Ms S Talbot as participant of the 2002 Long Term Incentive Plan as noted at (b) above, is eligible for a share award of 10% of the ordinary shares she continues to hold following the second anniversary of the exercise of the option.
The market price of the ordinary shares as at 2 January 2010 was €2.89 and the range during the year was €1.84 to €3.00. The average price for the year was €2.53.
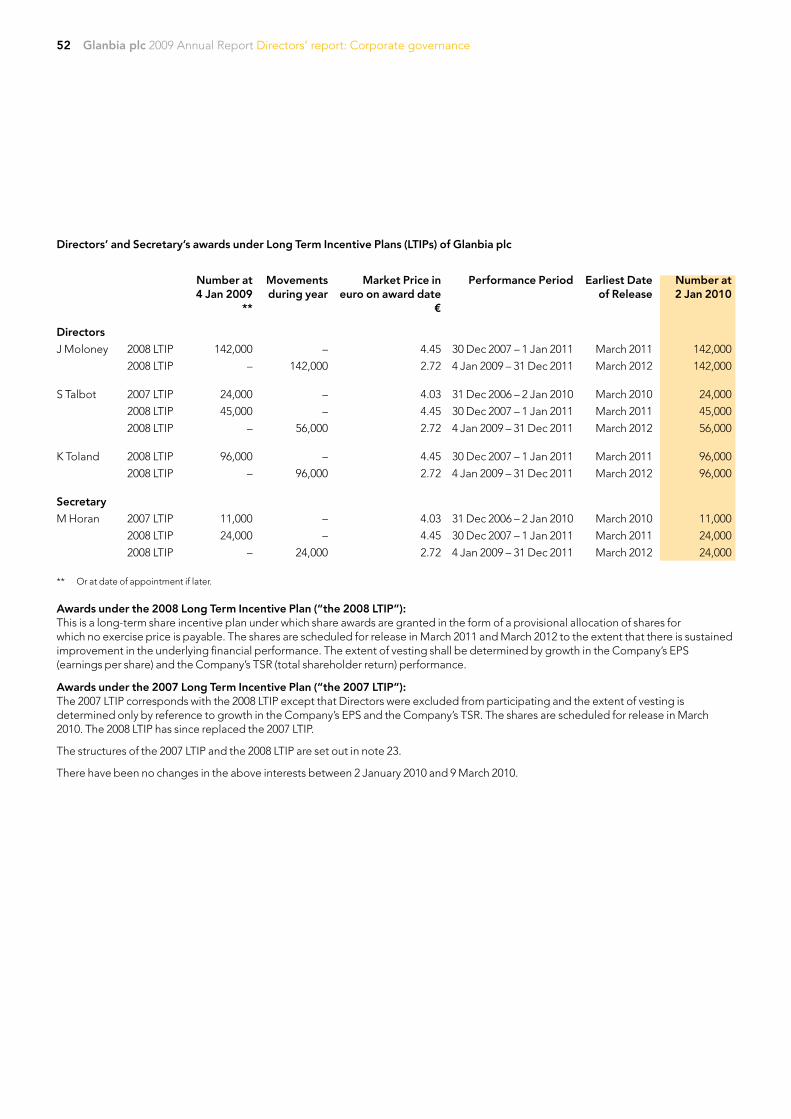
Glanbia plc 2009 Annual Report Directors’ report: Corporate governance52
Directors’ and Secretary’s awards under Long Term Incentive Plans (LTIPs) of Glanbia plc
Number at 4 Jan 2009
**
Movements during year
Market Price in euro on award date
€
Performance Period
Earliest Date of Release
Number at 2 Jan 2010
Directors
J Moloney 2008 LTIP 142,000 – 4.45 30 Dec 2007 – 1 Jan 2011 March 2011 142,000
2008 LTIP – 142,000 2.72 4 Jan 2009 – 31 Dec 2011 March 2012 142,000
S Talbot 2007 LTIP 24,000 – 4.03 31 Dec 2006 – 2 Jan 2010 March 2010 24,000
2008 LTIP 45,000 – 4.45 30 Dec 2007 – 1 Jan 2011 March 2011 45,000
2008 LTIP – 56,000 2.72 4 Jan 2009 – 31 Dec 2011 March 2012 56,000
K Toland 2008 LTIP 96,000 – 4.45 30 Dec 2007 – 1 Jan 2011 March 2011 96,000
2008 LTIP – 96,000 2.72 4 Jan 2009 – 31 Dec 2011 March 2012 96,000
Secretary
M Horan 2007 LTIP 11,000 – 4.03 31 Dec 2006 – 2 Jan 2010 March 2010 11,000
2008 LTIP 24,000 – 4.45 30 Dec 2007 – 1 Jan 2011 March 2011 24,000
2008 LTIP – 24,000 2.72 4 Jan 2009 – 31 Dec 2011 March 2012 24,000
** Or at date of appointment if later.
Awards under the 2008 Long Term Incentive Plan (“the 2008 LTIP”): This is a long-term share incentive plan under which share awards are granted in the form of a provisional allocation of shares for which no exercise price is payable. The shares are scheduled for release in March 2011 and March 2012 to the extent that there is sustained improvement in the underlying financial performance. The extent of vesting shall be determined by growth in the Company’s EPS (earnings per share) and the Company’s TSR (total shareholder return) performance.
Awards under the 2007 Long Term Incentive Plan (“the 2007 LTIP”): The 2007 LTIP corresponds with the 2008 LTIP except that Directors were excluded from participating and the extent of vesting is determined only by reference to growth in the Company’s EPS and the Company’s TSR. The shares are scheduled for release in March 2010. The 2008 LTIP has since replaced the 2007 LTIP.
The structures of the 2007 LTIP and the 2008 LTIP are set out in note 23.
There have been no changes in the above interests between 2 January 2010 and 9 March 2010.
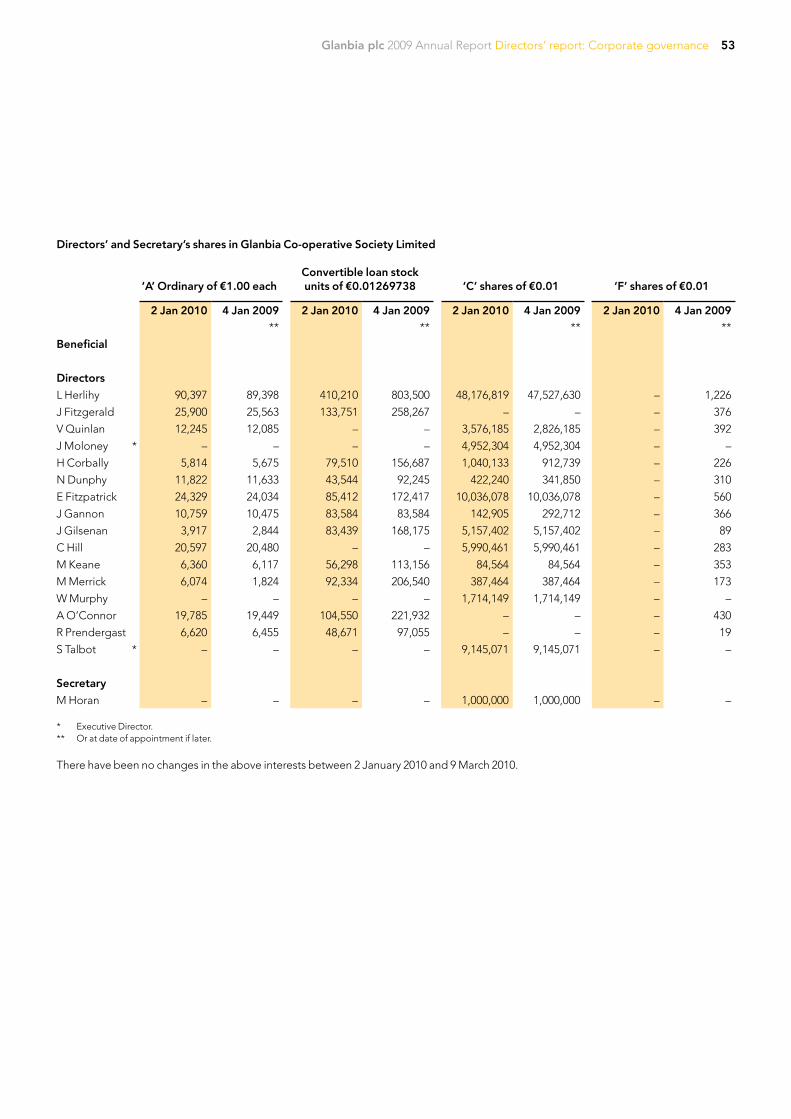
Glanbia plc 2009 Annual Report Directors’ report: Corporate governance 53
Directors’ and Secretary’s shares in Glanbia Co-operative Society Limited
‘A’ Ordinary of €1.00 eachConvertible loan stock units of €0.01269738 ‘C’ shares of €0.01 ‘F’ shares of €0.01
2 Jan 2010 4 Jan 2009 2 Jan 2010 4 Jan 2009 2 Jan 2010 4 Jan 2009 2 Jan 2010 4 Jan 2009 ** ** ** **
Beneficial
Directors
L Herlihy 90,397 89,398 410,210 803,500 48,176,819 47,527,630 – 1,226
J Fitzgerald 25,900 25,563 133,751 258,267 – – – 376
V Quinlan 12,245 12,085 – – 3,576,185 2,826,185 – 392
J Moloney * – – – – 4,952,304 4,952,304 – –
H Corbally 5,814 5,675 79,510 156,687 1,040,133 912,739 – 226
N Dunphy 11,822 11,633 43,544 92,245 422,240 341,850 – 310
E Fitzpatrick 24,329 24,034 85,412 172,417 10,036,078 10,036,078 – 560
J Gannon 10,759 10,475 83,584 83,584 142,905 292,712 – 366
J Gilsenan 3,917 2,844 83,439 168,175 5,157,402 5,157,402 – 89
C Hill 20,597 20,480 – – 5,990,461 5,990,461 – 283
M Keane 6,360 6,117 56,298 113,156 84,564 84,564 – 353
M Merrick 6,074 1,824 92,334 206,540 387,464 387,464 – 173
W Murphy – – – – 1,714,149 1,714,149 – –
A O’Connor 19,785 19,449 104,550 221,932 – – – 430
R Prendergast 6,620 6,455 48,671 97,055 – – – 19
S Talbot * – – – – 9,145,071 9,145,071 – –
Secretary
M Horan – – – – 1,000,000 1,000,000 – – * Executive Director.** Or at date of appointment if later.
There have been no changes in the above interests between 2 January 2010 and 9 March 2010.
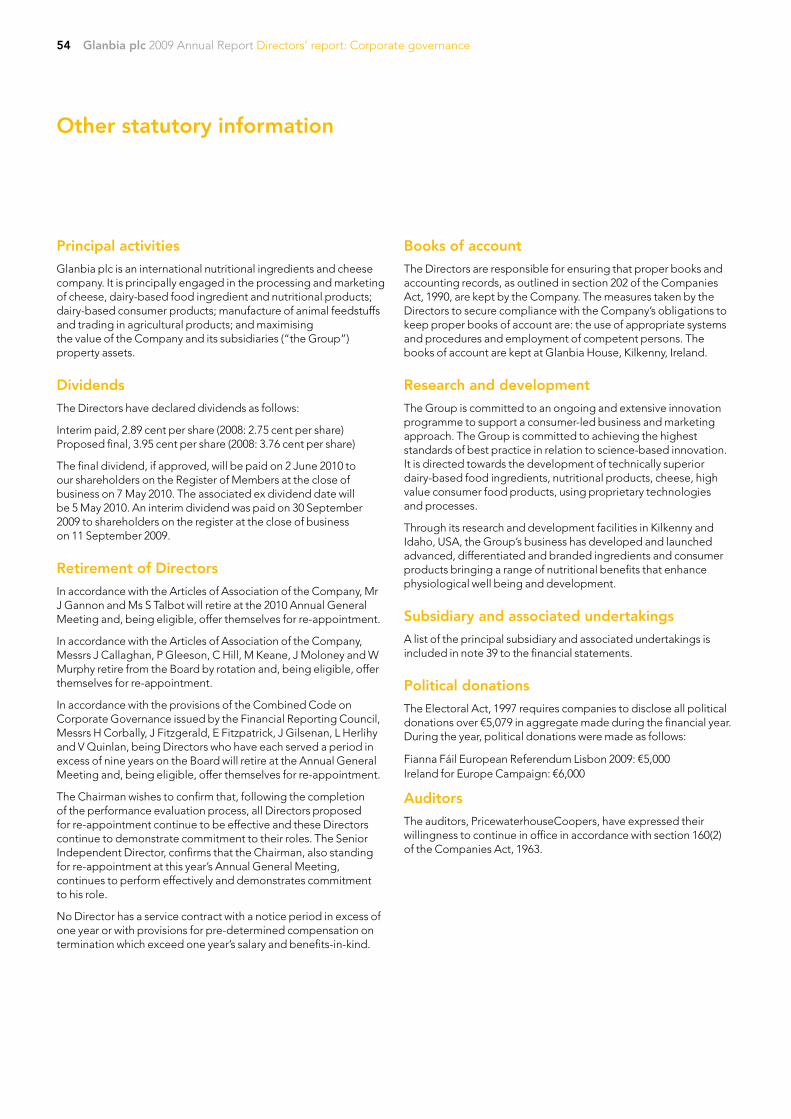
54 Glanbia plc 2009 Annual Report Directors’ report: Corporate governance
Principal activities
Glanbia plc is an international nutritional ingredients and cheese company. It is principally engaged in the processing and marketing of cheese, dairy-based food ingredient and nutritional products; dairy-based consumer products; manufacture of animal feedstuffs and trading in agricultural products; and maximising the value of the Company and its subsidiaries (“the Group”) property assets.
Dividends
The Directors have declared dividends as follows:
Interim paid, 2.89 cent per share (2008: 2.75 cent per share) Proposed final, 3.95 cent per share (2008: 3.76 cent per share)
The final dividend, if approved, will be paid on 2 June 2010 to our shareholders on the Register of Members at the close of business on 7 May 2010. The associated ex dividend date will be 5 May 2010. An interim dividend was paid on 30 September 2009 to shareholders on the register at the close of business on 11 September 2009.
Retirement of Directors
In accordance with the Articles of Association of the Company, Mr J Gannon and Ms S Talbot will retire at the 2010 Annual General Meeting and, being eligible, offer themselves for re-appointment.
In accordance with the Articles of Association of the Company, Messrs J Callaghan, P Gleeson, C Hill, M Keane, J Moloney and W Murphy retire from the Board by rotation and, being eligible, offer themselves for re-appointment.
In accordance with the provisions of the Combined Code on Corporate Governance issued by the Financial Reporting Council, Messrs H Corbally, J Fitzgerald, E Fitzpatrick, J Gilsenan, L Herlihy and V Quinlan, being Directors who have each served a period in excess of nine years on the Board will retire at the Annual General Meeting and, being eligible, offer themselves for re-appointment.
The Chairman wishes to confirm that, following the completion of the performance evaluation process, all Directors proposed for re-appointment continue to be effective and these Directors continue to demonstrate commitment to their roles. The Senior Independent Director, confirms that the Chairman, also standing for re-appointment at this year’s Annual General Meeting, continues to perform effectively and demonstrates commitment to his role.
No Director has a service contract with a notice period in excess of one year or with provisions for pre-determined compensation on termination which exceed one year’s salary and benefits-in-kind.
Books of account
The Directors are responsible for ensuring that proper books and accounting records, as outlined in section 202 of the Companies Act, 1990, are kept by the Company. The measures taken by the Directors to secure compliance with the Company’s obligations to keep proper books of account are: the use of appropriate systems and procedures and employment of competent persons. The books of account are kept at Glanbia House, Kilkenny, Ireland.
Research and development
The Group is committed to an ongoing and extensive innovation programme to support a consumer-led business and marketing approach. The Group is committed to achieving the highest standards of best practice in relation to science-based innovation. It is directed towards the development of technically superior dairy-based food ingredients, nutritional products, cheese, high value consumer food products, using proprietary technologies and processes.
Through its research and development facilities in Kilkenny and Idaho, USA, the Group’s business has developed and launched advanced, differentiated and branded ingredients and consumer products bringing a range of nutritional benefits that enhance physiological well being and development.
Subsidiary and associated undertakings
A list of the principal subsidiary and associated undertakings is included in note 39 to the financial statements.
Political donations
The Electoral Act, 1997 requires companies to disclose all political donations over €5,079 in aggregate made during the financial year. During the year, political donations were made as follows:
Fianna Fáil European Referendum Lisbon 2009: €5,000Ireland for Europe Campaign: €6,000
Auditors
The auditors, PricewaterhouseCoopers, have expressed their willingness to continue in office in accordance with section 160(2) of the Companies Act, 1963.
Other statutory information
Glanbia plc 2009 Annual Report Directors’ report: Corporate governance 55
The Directors are responsible for preparing the annual report and the financial statements in accordance with applicable law and regulations.
Irish company law requires the Directors to prepare financial statements for each financial year. Under that law the Directors have prepared the financial statements in accordance with International Financial Reporting Standards (IFRSs) as adopted by the European Union. The financial statements are required by law to give a true and fair view of the state of affairs of the Company and the Group and of the profit or loss of the Group.
In preparing these financial statements the Directors are required to:
• select suitable accounting policies and then apply them consistently;
• make judgements and estimates that are reasonable and prudent;
• state that the financial statements comply with IFRSs as adopted by the European Union; and
• prepare the financial statements on the going concern basis, unless it is inappropriate to presume that the Group will continue in business, in which case there should be supporting assumptions or qualifications as necessary.
The Directors are also required by applicable law and the Listing Rules issued by the Irish Stock Exchange to prepare a directors’ report and reports relating to Directors’ remuneration and corporate governance in accordance with the Transparency (Directive 2004/109/EC) Regulations 2007 and the Directors are required to include a management report containing a fair review of the business and a description of the principal risks and uncertainties facing the Group.
The Directors are responsible for keeping proper books of account that disclose with reasonable accuracy at any time the financial position of the Company and the Group and to enable them to ensure that the financial statements comply with the Companies Acts 1963 to 2009 and, as regards the group financial statements, article 4 of the IAS Regulation. They are also responsible for safeguarding the assets of the Company and the Group and hence for taking reasonable steps for the prevention and detection of fraud and other irregularities.
The Directors are responsible for the maintenance and integrity of the corporate and financial information included on the Company’s website. Legislation in the Republic of Ireland concerning the preparation and dissemination of financial statements may differ from legislation in other jurisdictions.
Directors’ statement pursuant to the Transparency (Directive 2004/109/EC) Regulations 2007
Each of the Directors, whose names and functions are listed on pages 34 to 35 confirms that to the best of each person’s knowledge and belief:
• the financial statements prepared in accordance with IFRSs as adopted by the EU give a true and fair view of the assets, liabilities and financial position of the Company and the Group and of the profit of the Group; and
• the Directors’ report contained in the annual report includes a fair review of the development and performance of the business and the position of the Company and Group, together with a description of the principal risks and uncertainties that they face.
Statement of Directors’ responsibilities
Directors’ Report
On behalf of the BoardL Herlihy J Moloney S TalbotDirectors
9 March 2010

Glanbia plc 2009 Annual Report Directors’ report: Business review56
Developing sustainable higher margin businesses
56

Glanbia plc 2009 Annual Report Directors’ report: Business review 57
Science-based innovation and
new product development
57

Glanbia plc 2009 Annual Report Directors’ report: Business review58
Financial statements
58
59Glanbia plc 2009 Annual Report Financial statements
Independent auditors’ report to the members of Glanbia plc 60
Group income statement 62
Group statement of comprehensive income 63
Group statement of changes in equity 64
Group statement of financial position 65
Group statement of cash flows 66
Company statement of financial position 67
Company statement of changes in equity 68
Company statement of comprehensive income and statement of cash flows 69
Notes to the financial statements
1. General information 70
2. Summary of significant accounting polices 70
3. Financial risk management 77
4. Critical accounting estimates and judgements 81
5. Segment information 82
6. Operating expenses 87
7. Exceptional items 88
8. Employee benefit expense 89
9. Directors’ remuneration 89
10. Finance income and costs 89
11. Income taxes 90
12. Earnings per share 91
13. Dividends 92
14. Property, plant and equipment 92
15. Intangible assets 93
16. Investments in associates 95
17. Investments in joint ventures 97
18. Available for sale financial assets 98
19. Trade and other receivables 99
20. Inventories 101
21. Cash and cash equivalents 101
22. Reconciliation of changes in equity 102
23. Share capital and share premium 104
24. Retained earnings 107
25. Minority interests 107
26. Borrowings 108
27. Deferred income taxes 110
28. Retirement benefit obligations 112
29. Provisions for other liabilities and charges 115
30. Capital grants 115
31. Trade and other payables 116
32. Derivative financial instruments 116
33. Contingent liabilities 117
34. Commitments 117
35. Cash generated from operations 118
36. Business combinations 118
37. Related party transactions 119
38. Events after the reporting period 120
39. Principal subsidiary and associated undertakings 121
60 Glanbia plc 2009 Annual Report Financial statements
We have audited the Group and Parent Company financialstatements (the “financial statements”) of Glanbia plc for the yearended 2 January 2010, which comprise the Group incomestatement, the Group and Parent Company statement of financialposition, the Group and Parent Company statement of changes inequity, the Group and Parent Company statement of cash flows,the Group and Parent Company statement of comprehensiveincome and the related notes. These financial statements havebeen prepared under the accounting policies set out therein.
Respective responsibilities of Directorsand auditors
The Directors’ responsibilities for preparing the Annual Reportand the financial statements, in accordance with applicable Irishlaw and International Financial Reporting Standards (IFRSs) asadopted by the European Union, are set out in the statementof Directors’ responsibilities.
Our responsibility is to audit the financial statements inaccordance with relevant legal and regulatory requirements andInternational Standards on Auditing (UK and Ireland). This report,including the opinion, has been prepared for and only for theCompany’s members as a body in accordance with section 193of the Companies Act, 1990 and for no other purpose. We do not,in giving this opinion, accept or assume responsibility for anyother purpose or to any other person to whom this report isshown or into whose hands it may come save where expresslyagreed by our prior consent in writing.
We report to you our opinion as to whether the Group financialstatements give a true and fair view, in accordance with IFRSs asadopted by the European Union. We report to you our opinionas to whether the Parent Company financial statements give atrue and fair view, in accordance with IFRSs as adopted by theEuropean Union, as applied in accordance with the provisionsof the Companies Acts, 1963 to 2009. We also report to youwhether the financial statements have been properly preparedin accordance with Irish statute comprising the Companies Acts,1963 to 2009 and Article 4 of the IAS Regulation. We state whetherwe have obtained all the information and explanations weconsider necessary for the purposes of our audit, and whetherthe Company statement of financial position is in agreement withthe books of account. We also report to you our opinion as to:
� whether the Company has kept proper books of account;
� whether the Directors’ report is consistent with the financialstatements; and
� whether at the reporting date there existed a financial situationwhich may require the Company to convene an extraordinarygeneral meeting of the Company; such a financial situation mayexist if the net assets of the Company, as stated in theCompany statement of financial position are not more than halfof its called-up share capital.
We also report to you if, in our opinion, any information specifiedby law or the Listing Rules of the Irish Stock Exchange regardingDirectors’ remuneration and Directors’ transactions is notdisclosed and, where practicable, include such information inour report.
We review whether the Directors’ statement of corporategovernance, which is included in the Directors' report, reflects theCompany's compliance with the nine provisions of the June 2008Combined Code specified for our review by the Listing Rules ofthe Irish Stock Exchange, and report if it does not. We are notrequired to consider whether the Board’s statements on internalcontrols cover all risks and controls, or form an opinion on theeffectiveness of the Group’s corporate governance proceduresor its risk and control procedures.
We read the other information contained in the Annual Reportand consider whether it is consistent with the audited financialstatements. The other information comprises only the Directors'report: business review and the Directors’ report: corporategovernance. We consider the implications for our report if webecome aware of any apparent misstatements or materialinconsistencies with the financial statements. Our responsibilitiesdo not extend to any other information.
Basis of audit opinion
We conducted our audit in accordance with InternationalStandards on Auditing (UK and Ireland) issued by the AuditingPractices Board. An audit includes examination, on a test basis, ofevidence relevant to the amounts and disclosures in the financialstatements. It also includes an assessment of the significantestimates and judgments made by the Directors in thepreparation of the financial statements, and of whether theaccounting policies are appropriate to the Group’s andCompany’s circumstances, consistently applied and adequatelydisclosed.
We planned and performed our audit so as to obtain all theinformation and explanations which we considered necessary inorder to provide us with sufficient evidence to give reasonableassurance that the financial statements are free from materialmisstatement, whether caused by fraud or other irregularity orerror. In forming our opinion we also evaluated the overalladequacy of the presentation of information in the financialstatements.
Opinion
In our opinion:
� the Group financial statements give a true and fair view, inaccordance with IFRSs as adopted by the European Union, ofthe state of the Group’s affairs as at 2 January 2010 and of itsprofit and cash flows for the year then ended;
� the Parent Company financial statements give a true and fairview, in accordance with IFRSs as adopted by the EuropeanUnion, as applied in accordance with the provisions of theCompanies Acts, 1963 to 2009 of the state of the ParentCompany’s affairs as at 2 January 2010 and cash flows for theyear then ended;
� the financial statements have been properly prepared inaccordance with the Companies Acts, 1963 to 2009 and Article4 of the IAS Regulation.
Independent auditors’ report to the members of Glanbia plc
61Glanbia plc 2009 Annual Report Financial statements
We have obtained all the information and explanations which weconsider necessary for the purposes of our audit. In our opinionproper books of account have been kept by the Company. TheCompany statement of financial position is in agreement with thebooks of account.
In our opinion the information given in the Directors’ report isconsistent with the financial statements.
The net assets of the Company, as stated in the Companystatement of financial position are more than half of the amountof its called-up share capital and, in our opinion, on that basisthere did not exist at 2 January 2010 a financial situation whichunder section 40 (1) of the Companies (Amendment) Act, 1983would require the convening of an extraordinary general meetingof the Company.
PricewaterhouseCoopersChartered Accountants and Registered AuditorsWaterford9 March 2010
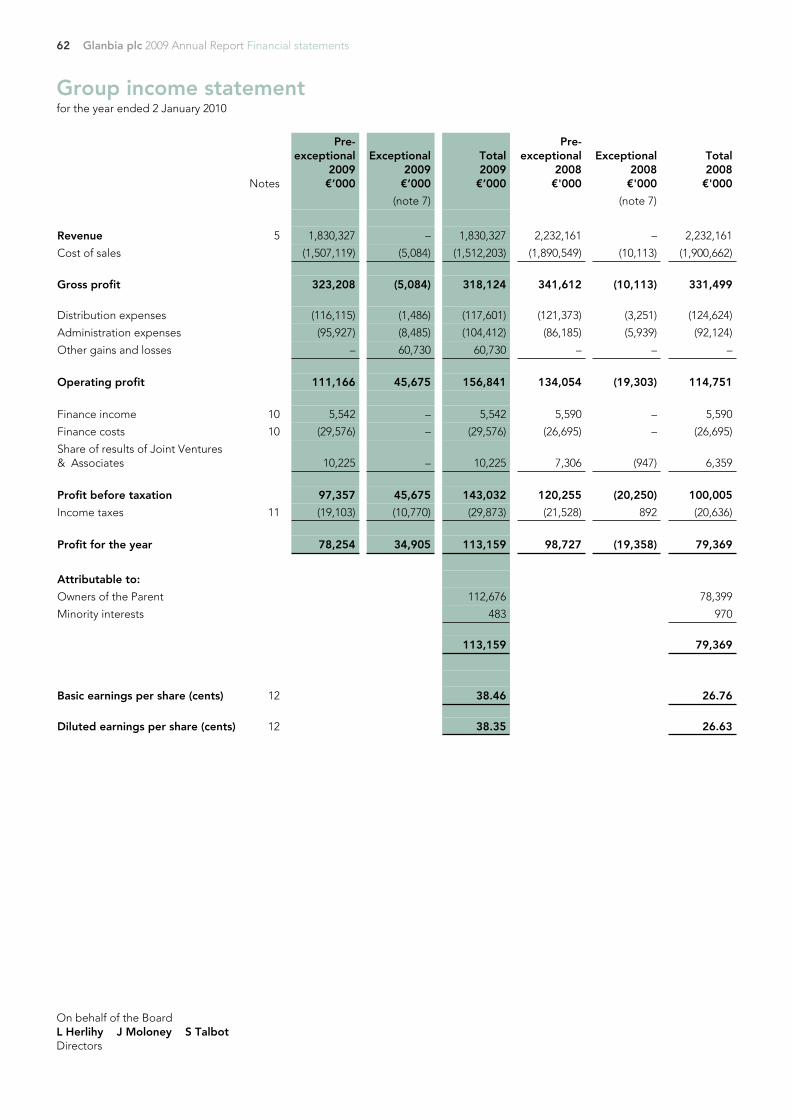
62 Glanbia plc 2009 Annual Report Financial statements
Notes
Pre-exceptional
2009€’000
Exceptional2009€’000
Total2009€’000
Pre-exceptional
2008€'000
Exceptional2008€'000
Total2008€'000
(note 7) (note 7)
Revenue 5 1,830,327 – 1,830,327 2,232,161 – 2,232,161
Cost of sales (1,507,119) (5,084) (1,512,203) (1,890,549) (10,113) (1,900,662)
Gross profit 323,208 (5,084) 318,124 341,612 (10,113) 331,499
Distribution expenses (116,115) (1,486) (117,601) (121,373) (3,251) (124,624)
Administration expenses (95,927) (8,485) (104,412) (86,185) (5,939) (92,124)
Other gains and losses – 60,730 60,730 – – –
Operating profit 111,166 45,675 156,841 134,054 (19,303) 114,751
Finance income 10 5,542 – 5,542 5,590 – 5,590
Finance costs 10 (29,576) – (29,576) (26,695) – (26,695)
Share of results of Joint Ventures& Associates 10,225 – 10,225 7,306 (947) 6,359
Profit before taxation 97,357 45,675 143,032 120,255 (20,250) 100,005
Income taxes 11 (19,103) (10,770) (29,873) (21,528) 892 (20,636)
Profit for the year 78,254 34,905 113,159 98,727 (19,358) 79,369
Attributable to:
Owners of the Parent 112,676 78,399
Minority interests 483 970
113,159 79,369
Basic earnings per share (cents) 12 38.46 26.76
Diluted earnings per share (cents) 12 38.35 26.63
Group income statementfor the year ended 2 January 2010
On behalf of the BoardL Herlihy J Moloney S TalbotDirectors
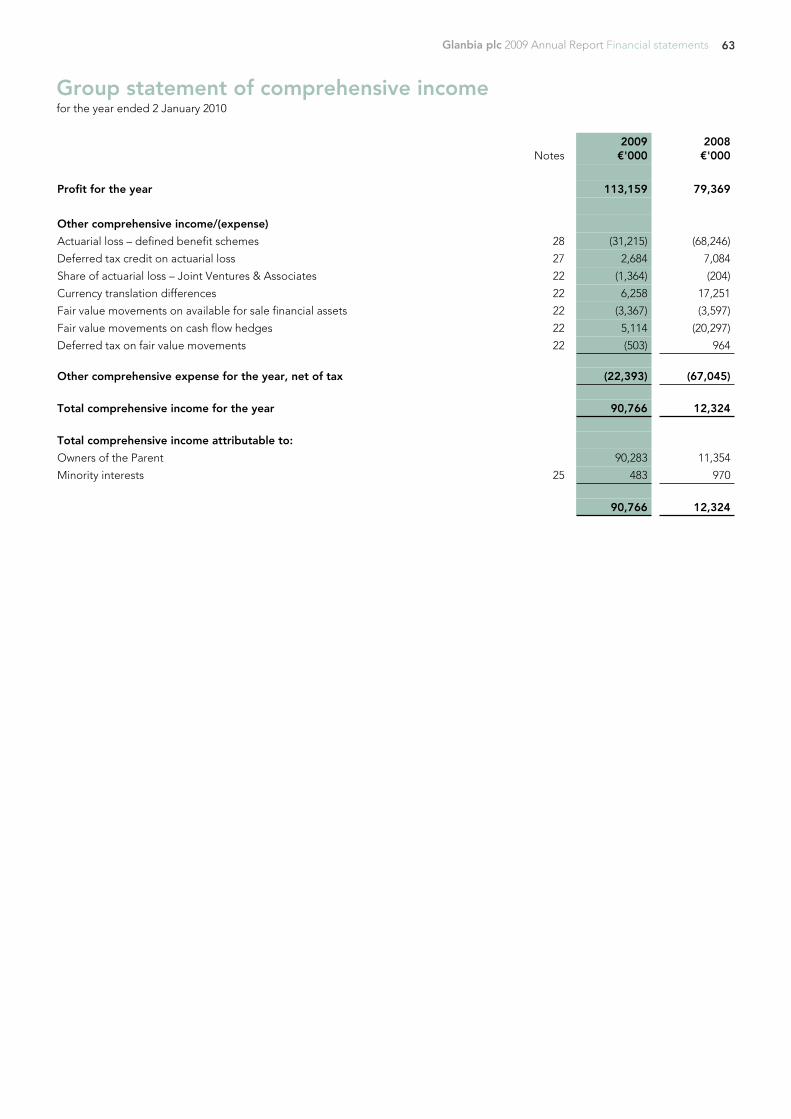
63Glanbia plc 2009 Annual Report Financial statements
Notes2009€'000
2008€'000
Profit for the year 113,159 79,369
Other comprehensive income/(expense)
Actuarial loss – defined benefit schemes 28 (31,215) (68,246)
Deferred tax credit on actuarial loss 27 2,684 7,084
Share of actuarial loss – Joint Ventures & Associates 22 (1,364) (204)
Currency translation differences 22 6,258 17,251
Fair value movements on available for sale financial assets 22 (3,367) (3,597)
Fair value movements on cash flow hedges 22 5,114 (20,297)
Deferred tax on fair value movements 22 (503) 964
Other comprehensive expense for the year, net of tax (22,393) (67,045)
Total comprehensive income for the year 90,766 12,324
Total comprehensive income attributable to:
Owners of the Parent 90,283 11,354
Minority interests 25 483 970
90,766 12,324
Group statement of comprehensive incomefor the year ended 2 January 2010
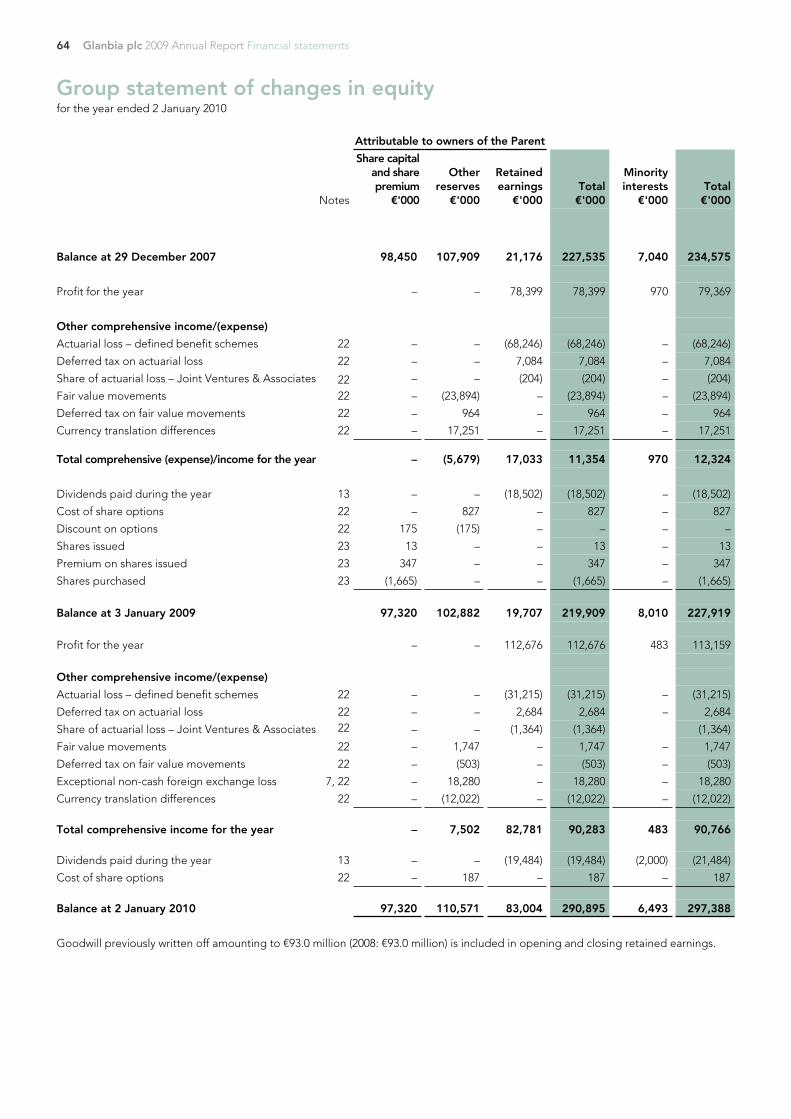
64 Glanbia plc 2009 Annual Report Financial statements
Attributable to owners of the Parent
Notes
Share capitaland sharepremium
€'000
Otherreserves
€'000
Retainedearnings
€'000Total€'000
Minorityinterests
€'000Total€'000
Balance at 29 December 2007 98,450 107,909 21,176 227,535 7,040 234,575
Profit for the year – – 78,399 78,399 970 79,369
Other comprehensive income/(expense)
Actuarial loss – defined benefit schemes 22 – – (68,246) (68,246) – (68,246)
Deferred tax on actuarial loss 22 – – 7,084 7,084 – 7,084
Share of actuarial loss – Joint Ventures & Associates 22 – – (204) (204) – (204)
Fair value movements 22 – (23,894) – (23,894) – (23,894)
Deferred tax on fair value movements 22 – 964 – 964 – 964
Currency translation differences 22 – 17,251 – 17,251 – 17,251
Total comprehensive (expense)/income for the year – (5,679) 17,033 11,354 970 12,324
Dividends paid during the year 13 – – (18,502) (18,502) – (18,502)
Cost of share options 22 – 827 – 827 – 827
Discount on options 22 175 (175) – – – –
Shares issued 23 13 – – 13 – 13
Premium on shares issued 23 347 – – 347 – 347
Shares purchased 23 (1,665) – – (1,665) – (1,665)
Balance at 3 January 2009 97,320 102,882 19,707 219,909 8,010 227,919
Profit for the year – – 112,676 112,676 483 113,159
Other comprehensive income/(expense)
Actuarial loss – defined benefit schemes 22 – – (31,215) (31,215) – (31,215)
Deferred tax on actuarial loss 22 – – 2,684 2,684 – 2,684
Share of actuarial loss – Joint Ventures & Associates 22 – – (1,364) (1,364) (1,364)
Fair value movements 22 – 1,747 – 1,747 – 1,747
Deferred tax on fair value movements 22 – (503) – (503) – (503)
Exceptional non-cash foreign exchange loss 7, 22 – 18,280 – 18,280 – 18,280
Currency translation differences 22 – (12,022) – (12,022) – (12,022)
Total comprehensive income for the year – 7,502 82,781 90,283 483 90,766
Dividends paid during the year 13 – – (19,484) (19,484) (2,000) (21,484)
Cost of share options 22 – 187 – 187 – 187
Balance at 2 January 2010 97,320 110,571 83,004 290,895 6,493 297,388
Goodwill previously written off amounting to €93.0 million (2008: €93.0 million) is included in opening and closing retained earnings.
Group statement of changes in equityfor the year ended 2 January 2010
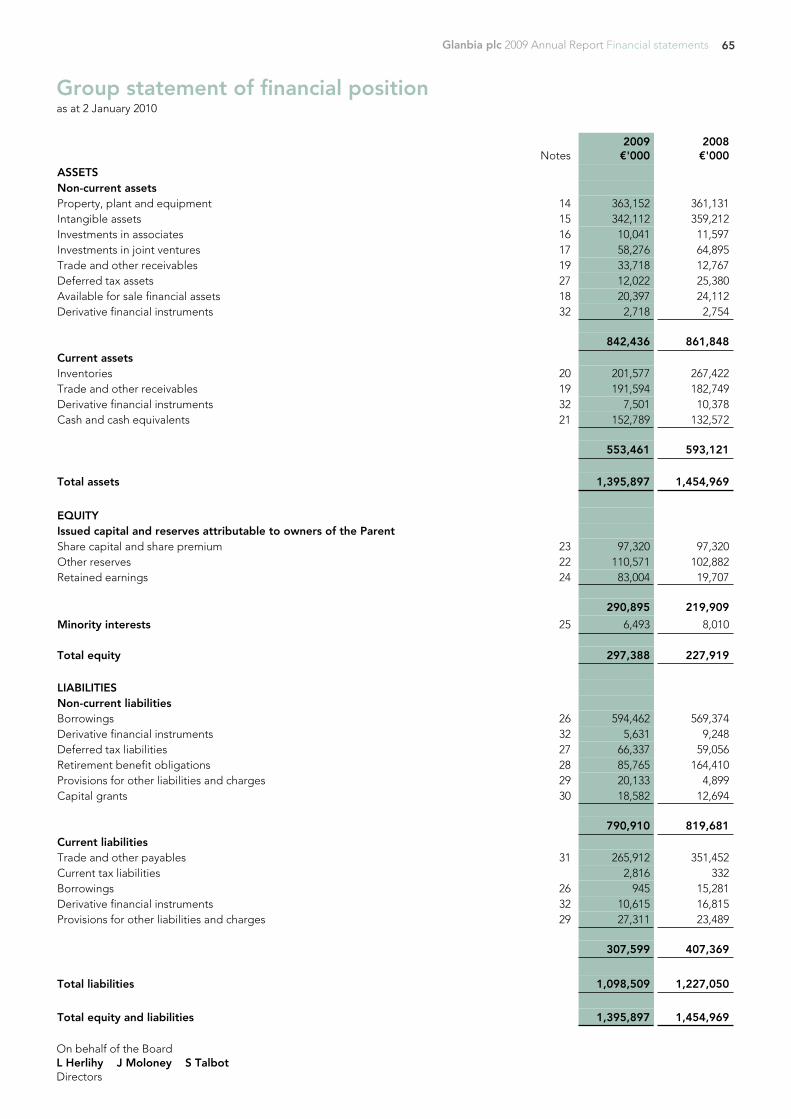
65Glanbia plc 2009 Annual Report Financial statements
Group statement of financial positionas at 2 January 2010
Notes2009€'000
2008€'000
ASSETSNon-current assetsProperty, plant and equipment 14 363,152 361,131Intangible assets 15 342,112 359,212Investments in associates 16 10,041 11,597Investments in joint ventures 17 58,276 64,895Trade and other receivables 19 33,718 12,767Deferred tax assets 27 12,022 25,380Available for sale financial assets 18 20,397 24,112Derivative financial instruments 32 2,718 2,754
842,436 861,848Current assetsInventories 20 201,577 267,422Trade and other receivables 19 191,594 182,749Derivative financial instruments 32 7,501 10,378Cash and cash equivalents 21 152,789 132,572
553,461 593,121
Total assets 1,395,897 1,454,969
EQUITYIssued capital and reserves attributable to owners of the ParentShare capital and share premium 23 97,320 97,320Other reserves 22 110,571 102,882Retained earnings 24 83,004 19,707
290,895 219,909
Minority interests 25 6,493 8,010
Total equity 297,388 227,919
LIABILITIESNon-current liabilitiesBorrowings 26 594,462 569,374Derivative financial instruments 32 5,631 9,248Deferred tax liabilities 27 66,337 59,056Retirement benefit obligations 28 85,765 164,410Provisions for other liabilities and charges 29 20,133 4,899Capital grants 30 18,582 12,694
790,910 819,681Current liabilitiesTrade and other payables 31 265,912 351,452Current tax liabilities 2,816 332Borrowings 26 945 15,281Derivative financial instruments 32 10,615 16,815Provisions for other liabilities and charges 29 27,311 23,489
307,599 407,369
Total liabilities 1,098,509 1,227,050
Total equity and liabilities 1,395,897 1,454,969
On behalf of the BoardL Herlihy J Moloney S TalbotDirectors
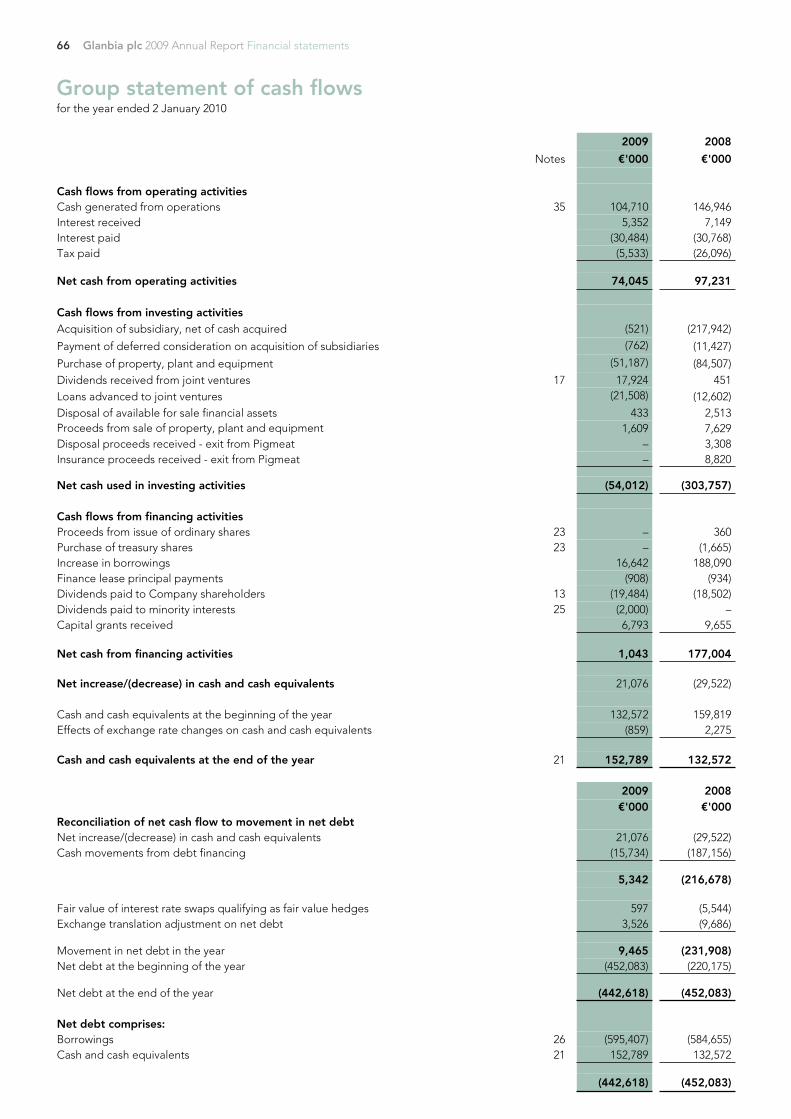
66 Glanbia plc 2009 Annual Report Financial statements
Group statement of cash flowsfor the year ended 2 January 2010
2009 2008
Notes €'000 €'000
Cash flows from operating activitiesCash generated from operations 35 104,710 146,946Interest received 5,352 7,149Interest paid (30,484) (30,768)Tax paid (5,533) (26,096)
Net cash from operating activities 74,045 97,231
Cash flows from investing activitiesAcquisition of subsidiary, net of cash acquired (521) (217,942)
Payment of deferred consideration on acquisition of subsidiaries (762) (11,427)
Purchase of property, plant and equipment (51,187) (84,507)Dividends received from joint ventures 17 17,924 451Loans advanced to joint ventures (21,508) (12,602)Disposal of available for sale financial assets 433 2,513Proceeds from sale of property, plant and equipment 1,609 7,629Disposal proceeds received - exit from Pigmeat – 3,308Insurance proceeds received - exit from Pigmeat – 8,820
Net cash used in investing activities (54,012) (303,757)
Cash flows from financing activitiesProceeds from issue of ordinary shares 23 – 360Purchase of treasury shares 23 – (1,665)Increase in borrowings 16,642 188,090Finance lease principal payments (908) (934)Dividends paid to Company shareholders 13 (19,484) (18,502)Dividends paid to minority interests 25 (2,000) –Capital grants received 6,793 9,655
Net cash from financing activities 1,043 177,004
Net increase/(decrease) in cash and cash equivalents 21,076 (29,522)
Cash and cash equivalents at the beginning of the year 132,572 159,819Effects of exchange rate changes on cash and cash equivalents (859) 2,275
Cash and cash equivalents at the end of the year 21 152,789 132,572
2009 2008€'000 €'000
Reconciliation of net cash flow to movement in net debtNet increase/(decrease) in cash and cash equivalents 21,076 (29,522)Cash movements from debt financing (15,734) (187,156)
5,342 (216,678)
Fair value of interest rate swaps qualifying as fair value hedges 597 (5,544)Exchange translation adjustment on net debt 3,526 (9,686)
Movement in net debt in the year 9,465 (231,908)Net debt at the beginning of the year (452,083) (220,175)
Net debt at the end of the year (442,618) (452,083)
Net debt comprises:Borrowings 26 (595,407) (584,655)Cash and cash equivalents 21 152,789 132,572
(442,618) (452,083)
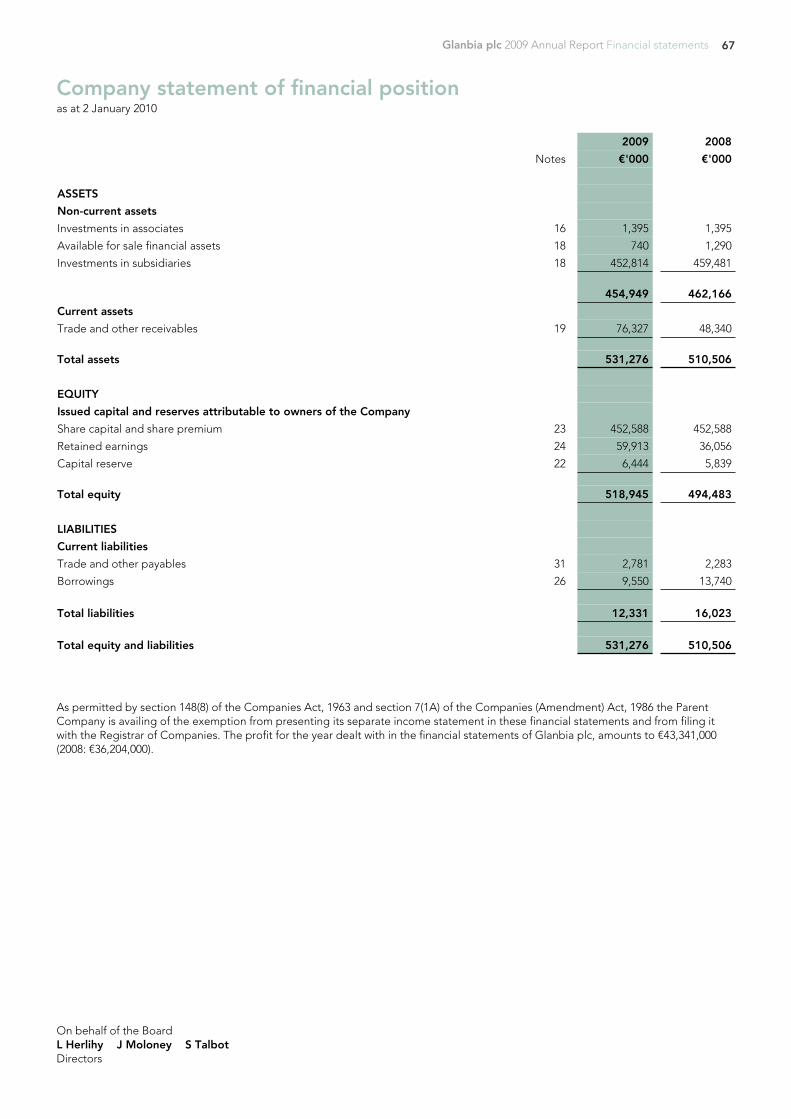
67Glanbia plc 2009 Annual Report Financial statements
2009 2008
Notes €'000 €'000
ASSETS
Non-current assets
Investments in associates 16 1,395 1,395
Available for sale financial assets 18 740 1,290
Investments in subsidiaries 18 452,814 459,481
454,949 462,166
Current assets
Trade and other receivables 19 76,327 48,340
Total assets 531,276 510,506
EQUITY
Issued capital and reserves attributable to owners of the Company
Share capital and share premium 23 452,588 452,588
Retained earnings 24 59,913 36,056
Capital reserve 22 6,444 5,839
Total equity 518,945 494,483
LIABILITIES
Current liabilities
Trade and other payables 31 2,781 2,283
Borrowings 26 9,550 13,740
Total liabilities 12,331 16,023
Total equity and liabilities 531,276 510,506
Company statement of financial positionas at 2 January 2010
As permitted by section 148(8) of the Companies Act, 1963 and section 7(1A) of the Companies (Amendment) Act, 1986 the ParentCompany is availing of the exemption from presenting its separate income statement in these financial statements and from filing itwith the Registrar of Companies. The profit for the year dealt with in the financial statements of Glanbia plc, amounts to €43,341,000(2008: €36,204,000).
On behalf of the BoardL Herlihy J Moloney S TalbotDirectors
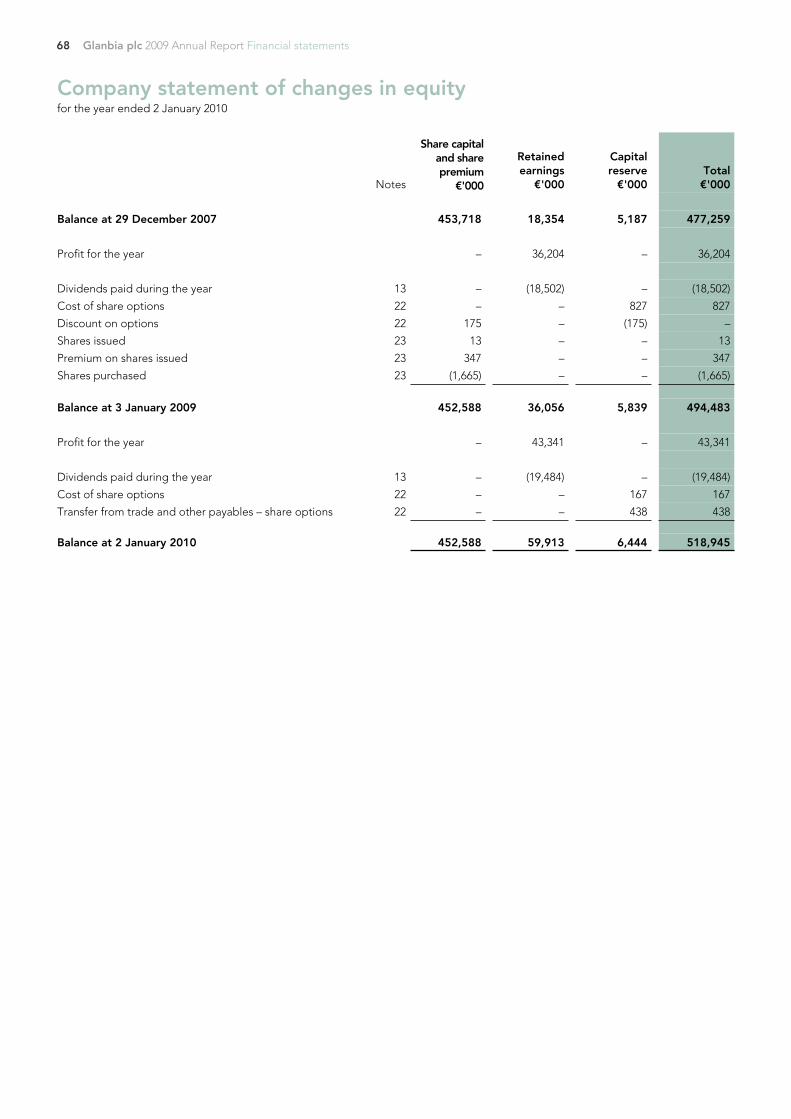
68 Glanbia plc 2009 Annual Report Financial statements
Notes
Share capitaland sharepremium
€'000
Retainedearnings
€'000
Capitalreserve
€'000Total€'000
Balance at 29 December 2007 453,718 18,354 5,187 477,259
Profit for the year – 36,204 – 36,204
Dividends paid during the year 13 – (18,502) – (18,502)
Cost of share options 22 – – 827 827
Discount on options 22 175 – (175) –
Shares issued 23 13 – – 13
Premium on shares issued 23 347 – – 347
Shares purchased 23 (1,665) – – (1,665)
Balance at 3 January 2009 452,588 36,056 5,839 494,483
Profit for the year – 43,341 – 43,341
Dividends paid during the year 13 – (19,484) – (19,484)
Cost of share options 22 – – 167 167
Transfer from trade and other payables – share options 22 – – 438 438
Balance at 2 January 2010 452,588 59,913 6,444 518,945
Company statement of changes in equityfor the year ended 2 January 2010
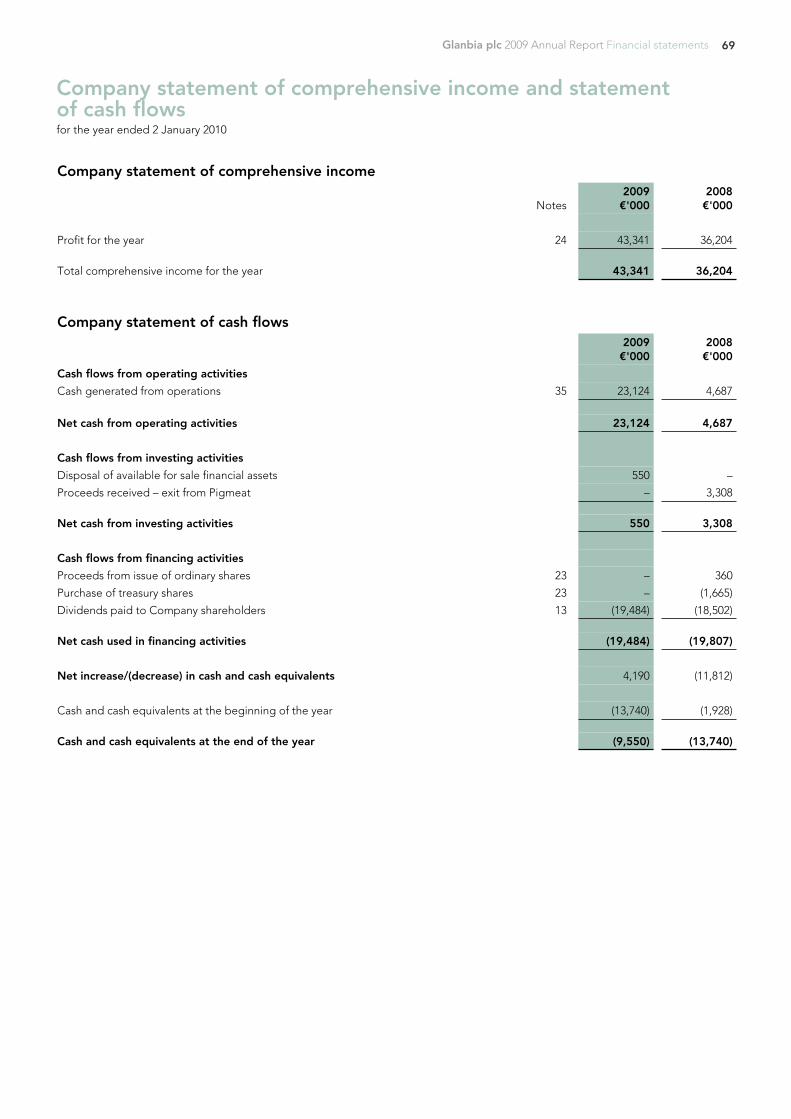
69Glanbia plc 2009 Annual Report Financial statements
Company statement of comprehensive income
Notes2009€'000
2008€'000
Profit for the year 24 43,341 36,204
Total comprehensive income for the year 43,341 36,204
Company statement of cash flows2009€'000
2008€'000
Cash flows from operating activities
Cash generated from operations 35 23,124 4,687
Net cash from operating activities 23,124 4,687
Cash flows from investing activities
Disposal of available for sale financial assets 550 –
Proceeds received – exit from Pigmeat – 3,308
Net cash from investing activities 550 3,308
Cash flows from financing activities
Proceeds from issue of ordinary shares 23 – 360
Purchase of treasury shares 23 – (1,665)
Dividends paid to Company shareholders 13 (19,484) (18,502)
Net cash used in financing activities (19,484) (19,807)
Net increase/(decrease) in cash and cash equivalents 4,190 (11,812)
Cash and cash equivalents at the beginning of the year (13,740) (1,928)
Cash and cash equivalents at the end of the year (9,550) (13,740)
Company statement of comprehensive income and statementof cash flowsfor the year ended 2 January 2010
70 Glanbia plc 2009 Annual Report Financial statements
1. General information
Glanbia plc (“the Company”) and its subsidiaries (together“the Group”) is an international nutritional ingredients and cheesegroup with operations in Ireland, Europe, the USA, Canada, Chinaand Nigeria.
The Company is a public limited company incorporated anddomiciled in Ireland. The address of its registered office is GlanbiaHouse, Kilkenny, Ireland. The Group is controlled by Glanbia Co-operative Society Limited (“the Society”), which holds 54.6% ofthe issued share capital of the Company and is the ultimate parentof the Group.
The Company shares are quoted on the Irish and London StockExchanges.
These consolidated financial statements have been approved forissue by the Board of Directors on 9 March 2010.
2. Summary of significant accounting polices
New accounting standards and IFRIC interpretations adopted bythe Group during the year ended 2 January 2010 are dealt with insection (aa) below. The adoption of these standards andinterpretations had no significant impact on the results or financialposition of the Group during the year. However, the adoption ofIFRS 8 – Operating Segments and IAS 1 – Presentation ofFinancial Statements has resulted in a change in the Group’sdisclosure requirements.
IFRS 8 replaces IAS 14 – Segment Reporting. The new standardrequires a ‘management approach’, under which the segmentinformation is presented on the same basis as that used forinternal reporting purposes. In addition, the segments arereported in a manner consistent with information provided tothe Chief Operating Decision Maker. On adoption of IFRS 8, thenumber of reportable segments presented by the Group hasincreased. The basis of segment reporting has changed fromIreland and International to US Cheese and Global Nutritionals,Dairy Ireland, Joint Ventures & Associates and Other. As a result,the Group has re-presented its segmental analysis for thecomparative 2008 financial information.
The other principal accounting policies adopted in thepreparation of these financial statements are set out below.These policies have been consistently applied to all yearspresented, unless otherwise stated.
(a) Basis of preparationThese consolidated financial statements have been prepared inaccordance with EU adopted International Financial ReportingStandards (IFRS), IFRIC interpretations and those parts of theCompanies Acts, 1963 to 2009 applicable to companies reportingunder IFRS. The consolidated financial statements have beenprepared under the historical cost convention as modified by useof fair values for available for sale financial assets and derivativefinancial instruments.
The preparation of the financial statements in conformity with IFRSrequires the use of estimates, judgements and assumptions thataffect the reported amounts of assets and liabilities at the date ofthe financial statements and the reported amounts of revenuesand expenses during the reporting period. Although theseestimates are based on management’s best knowledge of theamount, event or actions, actual results ultimately may differ fromthese estimates.
Amounts are stated in euro thousands (€’000) unless otherwisestated.
These financial statements are prepared for a 52 week periodending on 2 January 2010, comparatives are for the 53 weekperiod ended 3 January 2009. The statements of financialposition for 2009 and 2008 have been drawn up as at 2 January2010 and 3 January 2009 respectively.
(b) ConsolidationThe Group financial statements incorporate:
(i) The financial statements of Glanbia plc (“the Company”) andenterprises controlled by the Company (“its subsidiaries”).Control is achieved where the Company has the power togovern the financial and operating policies of an entity soas to obtain benefits from its activities.
Subsidiaries are consolidated from the date on which controlis transferred to the Group and are no longer consolidatedfrom the date that control ceases. The purchase method ofaccounting is used to account for the acquisition ofsubsidiaries. The cost of an acquisition is measured as thefair value of the assets given up, shares issued or liabilitiesincurred or assumed at the date of acquisition plus costsdirectly attributable to the acquisition. The excess of the costof acquisition over the fair value of the Group’s share of theidentifiable net assets is recorded as goodwill. If the cost ofacquisition is less than the fair value of the Group’s share ofthe identifiable net assets acquired, the difference isrecognised directly in the income statement.
Inter-company transactions, balances and unrealised gainson transactions between Group companies are eliminated.Where necessary, the accounting policies for subsidiarieshave been changed to ensure consistency with the policiesadopted by the Group.
(ii) The Group’s share of the results and net assets of associatedcompanies and joint ventures are included based on theequity method of accounting. An associate is an enterpriseover which the Group has significant influence, but notcontrol, through participation in the financial and operatingpolicy decisions of the investee. A joint venture is an entitysubject to joint control by the Group and other parties.Under the equity method of accounting, the Group’s shareof the post-acquisition profits and losses of associates andjoint ventures is recognised in the income statement and itsshare of post acquisition movements in reserves isrecognised directly in other comprehensive income. Thecumulative post acquisition movements are adjusted againstthe cost of the investment. Unrealised gains on transactionsbetween the Group and its associates and joint ventures areeliminated to the extent of the Group’s interest in theassociate or joint venture. Unrealised losses are alsoeliminated unless the transaction provides evidence of animpairment of the asset transferred. When the Group’s shareof losses in an associate or joint venture equals or exceedsits interest in the associate or joint venture, the Group doesnot recognise further losses, unless the Group has incurredobligations or made payments on behalf of the associate orjoint venture.
(c) Segment reportingIn accordance with the requirements of IFRS 8 – SegmentReporting, operating segments are reported in a mannerconsistent with the internal reporting provided to the ChiefOperating Decision Maker. The Chief Operating Decision Makerresponsible for allocating resources and assessing performanceof the operating segments has been identified as the GlanbiaExecutive Committee who make strategic decisions.
Notes to the financial statementsfor the year ended 2 January 2010
71Glanbia plc 2009 Annual Report Financial statements
Segment assets consist primarily of property, plant and equipment,intangible assets, inventories, derivatives designated as hedges offuture transactions and receivables. Unallocated amounts primarilyinclude taxation, cash and cash equivalents, available for salefinancial assets and derivatives.
Segment liabilities comprise operating liabilities. Unallocatedamounts primarily include taxation, borrowings and derivatives.
(d) Foreign currency translation(i) Functional and presentation currency
Items included in the financial statements of each of theGroup’s entities are measured using the currency of theprimary economic environment in which the entity operates(the ‘functional currency’). The consolidated financialstatements are presented in euro, which is the Company’sfunctional and presentation currency.
(ii) Transactions and balancesForeign currency transactions are translated into thefunctional currency using the exchange rates prevailing at thedate of the transactions. Foreign exchange gains and lossesresulting from the settlement of such transactions arerecognised in the income statement, except when deferredin equity as qualifying cash flow hedges. Monetary assets andliabilities denominated in foreign currencies are retranslatedat the rate of exchange ruling at the reporting date. Currencytranslation differences on monetary assets and liabilities aretaken to the income statement, except when deferred inequity in the currency translation reserve as (i) qualifying cashflow hedges or (ii) exchange gains or losses on long termintra-group loans and on foreign currency borrowings usedto finance or provide a hedge against Group equityinvestments in non-euro denominated operations to theextent that they are neither planned nor expected to berepaid in the foreseeable future or are expected to providean effective hedge of the net investment. When long termintra-group loans are repaid the related cumulative currencytranslation recognised in the currency reserve is recycledthrough the income statement.
Translation differences on non-monetary financial assets andliabilities held at fair value through profit or loss arerecognised in the income statement as part of the fair valuegain or loss. Translation differences on non-monetaryfinancial assets such as equities classified as available for saleare included in the fair value reserve in equity.
(iii) Group companiesThe income statement and statement of financial position ofGroup companies that have a functional currency differentfrom the presentation currency are translated into thepresentation currency as follows:
– assets and liabilities at each reporting date are translated atthe closing rate at the reporting date of the statement offinancial position.
– income and expenses in the income statement aretranslated at average exchange rates for the year, or for theperiod since acquisition, if appropriate.
Resulting exchange differences are taken to a separatecurrency reserve within equity. When a foreign entity is sold,such exchange differences are recognised in the incomestatement as part of the gain or loss on sale.
Goodwill and fair value adjustments arising on the acquisitionof a foreign entity are treated as local currency assets and
liabilities of the foreign entity and are translated at thestatement of financial position rate. In accordance with IFRS1, the cumulative translation differences on foreignsubsidiaries was set to zero on IFRS transition date (4January 2004).
The Group uses the direct method of consolidation forrevaluation of the net investments in foreign operationswhere the financial statements of the foreign operation aretranslated directly into the functional currency of theultimate parent.
(e) Property, plant and equipmentProperty, plant and equipment is stated at cost or deemed costless subsequent depreciation less any impairment loss. Historiccost includes expenditure that is directly attributable to theacquisition of the items. Cost may also include transfers fromequity of any gains/losses on qualifying cash flow hedges offoreign currency purchases of property, plant and equipment.
Certain items of property, plant and equipment that had beenrevalued prior to the date of transition to IFRS (4 January 2004)are measured on the basis of deemed cost, being the revaluedamount depreciated to date of transition. Items of property, plantand equipment that were fair valued at date of transition are alsomeasured at deemed cost, being the fair value at date oftransition.
Depreciation is calculated on the straight-line method to write-offthe cost of each asset over their estimated useful life at thefollowing rates:
%Land NilBuildings 2.5 – 5Plant and equipment 4 – 33Motor vehicles 20 – 25
The assets residual values and useful lives are reviewed, andadjusted if appropriate, at each reporting date.
Assets held under finance leases are depreciated over theirexpected useful lives on the same basis as owned assets or,where shorter, the term of the relevant lease.
Property, plant and equipment is tested for impairment whenindicators arise. Where the carrying amount of an asset is greaterthan its estimated recoverable amount, it is written downimmediately to its recoverable amount.
Gains and losses on disposals are determined by comparingproceeds with carrying amount and are included in operatingprofit.
Repairs and maintenance are charged to the income statementduring the financial period in which they are incurred. The cost ofmajor renovations is included in the carrying amount of the assetwhen it is probable that future economic benefits in excess of theoriginally assessed standard of performance of the existing assetwill flow to the Group. Major renovations are depreciated overthe remaining useful life of the related asset.
(f) Intangible assets(i) Goodwill
Goodwill represents the excess of the cost of an acquisitionover the fair value of the Group’s share of the netidentifiable assets of the acquired subsidiary or associate atthe date of acquisition. Goodwill on acquisitions ofsubsidiaries is included in intangible assets. Goodwillassociated with the acquisition of associates is included
72 Glanbia plc 2009 Annual Report Financial statements
within the investment in associates.
Goodwill is carried at cost less accumulated impairmentlosses, if applicable. Goodwill is tested for impairment onan annual basis. Goodwill impairments are not reversed.
In accordance with IFRS 1, goodwill written off to reservesprior to date of transition to IFRS remains written off. Inrespect of goodwill capitalised and amortised at transitiondate, its carrying value at date of transition to IFRS remainsunchanged. Goodwill is allocated to cash generating units forthe purpose of impairment testing. The allocation is made tothose cash generating units or groups of cash generatingunits that are expected to benefit from the businesscombination in which the goodwill arose.
(ii) Research and development costsResearch expenditure is recognised as an expense asincurred. Costs incurred on development projects (relatingto the design and testing of new or improved products) arerecognised as intangible assets when it is probable that theproject will be a success, considering its commercial andtechnological feasibility, and costs can be measured reliably.Development costs are amortised using the straight linemethod over their estimated useful lives, which is normally6 years.
(iii) Brands/know-how, customer relationships and otherintangiblesExpenditure to acquire brands/know-how, customerrelationships and other intangibles is capitalised andamortised using the straight-line method over its useful life,which is normally between 10 and 20 years. Indefinite lifeintangible assets are those for which there is no foreseeablelimit to their expected useful life. Indefinite life intangibleassets are carried at cost less accumulated impairment losses,if applicable, and are not amortised on an annual basis.
(iv) Computer softwareCosts incurred on the acquisition of computer software arecapitalised, as are costs directly associated with developingcomputer software programmes, if they meet the recognitioncriteria of IAS 38 – Intangible Assets. Computer softwarecosts recognised as assets are written off over their estimateduseful lives, which is normally between 5 and 10 years.
(g) Available for sale financial assetsAvailable for sale financial assets are non-derivatives that areeither designated in this category or not classified in any of theother categories. They are included in non-current assets unlessmanagement intends to dispose of the investment within 12months of the reporting date. They are initially recognised at fairvalue plus transaction costs and are subsequently adjusted to fairvalue at each reporting date. Unrealised gains and losses arisingfrom changes in the fair value of investments classified as availablefor sale are recognised in other comprehensive income. Whensuch investments are sold or impaired, the accumulated fair valueadjustments are included in the income statement as gains orlosses from investments.
The fair values of quoted investments are based on current bidprices. If the market for a financial asset is not active the Groupestablishes fair value using valuation techniques. Where the rangeof reasonable fair values is significant and the probability ofvarious estimates cannot be reasonably assessed, the Groupmeasures the investment at cost.
Investments in subsidiaries held by the Company are carriedat cost.
Impairment losses recognised in the income statement on equityinstruments are not reversed through the income statement.
(h) LeasesLeases of assets where the Group has substantially all the risksand rewards of ownership are classified as finance leases. Adetermination is also made as to whether the substance of anarrangement could equate to a finance lease, consideringwhether fulfilment of the arrangement is dependant upon the useof a specific asset and the arrangement contains the right to usean asset. If the specified criteria are met, the arrangement isclassified as a finance lease. Finance leases are capitalised at theinception of the lease at the lower of the fair value of the leasedasset or the present value of the minimum lease payments. Eachlease payment is allocated between the liability and financecharges so as to achieve a constant rate on the finance balanceoutstanding. The corresponding rental obligation, net of financecharges is included in borrowings and split between current andnon-current, as appropriate. The interest element of the financecost is charged to the income statement over the lease period.The property, plant and equipment acquired under financeleases is depreciated over the shorter of the useful life of theasset or the lease term.
Leases where a significant portion of the risks and rewards ofownership are retained by the lessor are classified as operatingleases. Payments made under operating leases (net of anyincentives received from the lessor) are charged to the incomestatement on a straight-line basis over the period of the lease.
(i) InventoriesInventories are stated at the lower of cost or net realisable value.Cost is determined by the first-in, first-out (“FIFO”) method. Thecost of finished goods and work in progress comprises rawmaterials, direct labour, other direct costs and related productionoverheads (based on normal capacity). Net realisable value is theestimated selling price in the ordinary course of business, less theestimated costs of completion and the costs of selling expenses.Costs of inventories include the transfer from equity of anygains/losses on qualifying cash flow hedges which relate topurchases of raw materials.
(j) Trade and other receivablesTrade receivables are recognised initially at fair value andsubsequently measured at amortised cost using the effectiveinterest method less provision for impairment. A provision forimpairment of trade receivables is established when there isobjective evidence that the Group will not be able to collect allamounts due according to the original terms of the receivables. Ifcollectability appears unlikely according to the original terms ofthe receivable the Group will determine the appropriateprovision based on the available evidence at that time.Significant financial difficulties of the debtor, probability that thedebtor will enter bankruptcy or financial reorganisation, anddefault or delinquency in payments are considered indicatorsthat the trade receivable is impaired. The amount of theprovision is the difference between the asset’s carrying value andthe estimated future cash flows. The carrying amount of the assetis reduced through the use of a provision account and theamount of the loss is recognised in the income statement withindistribution costs. When a trade receivable is uncollectible, it iswritten off against the provision account for trade receivables.Subsequent recoveries of amounts previously written off arecredited against distribution costs in the income statement.Where risks associated with receivables are transferred out of theGroup under debt purchase agreements, such receivables arerecognised on the statement of financial position to the extentof the Group’s continued involvement and retained risk.
73Glanbia plc 2009 Annual Report Financial statements
Loan receivables are initially recognised at fair value andsubsequently measured at amortised cost using the effectiveinterest method, less provision for impairment. These areclassified as non-current assets, except for those maturing within12 months of the reporting date.
(k) Cash and cash equivalentsCash and cash equivalents comprise cash on hand, deposits heldon call with banks, other short-term highly liquid investments withoriginal maturities of 3 months or less and bank overdrafts. In thestatement of financial position, bank overdrafts, if applicable, areincluded in borrowings in current liabilities.
(l) Income taxesCurrent tax represents the expected tax payable or recoverableon the taxable profit for the year, taking into account adjustmentsrelating to prior years.
Deferred income tax is provided in full, using the liability method,on temporary differences arising between the tax bases of assetsand liabilities and their carrying amounts in the financialstatements. Tax rates enacted or substantively enacted by thereporting date are used to determine deferred income tax.
Deferred tax assets are recognised to the extent that it isprobable that future taxable profit will be available against whichthe temporary differences can be utilised.
Deferred income tax is provided on temporary differences arisingon investments in subsidiaries, associates and joint ventures,except where the timing of the reversal of the temporarydifference can be controlled and it is probable that the temporarydifference will not reverse in the foreseeable future. Deferredincome tax is not accounted for if it arises from initial recognitionof an asset or liability in a transaction other than a businesscombination that at the time of the transaction affects neitheraccounting nor taxable profit or loss.
(m) Employee benefits(i) Pension obligations
Group companies operate various pension schemes. Theschemes are generally funded through payments to insurancecompanies or trustee-administered funds, determined byperiodic actuarial calculations. The Group has both definedbenefit and defined contribution plans.
The liability recognised in the statement of financial positionin respect of defined benefit pension plans is the presentvalue of the defined benefit obligation at the reporting dateless the fair value of the plan assets, together with adjustmentsfor unrecognised past-service costs. The defined benefitobligation is calculated annually by independent actuariesusing the projected unit credit method. The present value ofthe defined benefit obligation is determined by discountingthe estimated future cash outflows using interest rates of high-quality corporate bonds that are denominated in the currencyin which the benefits will be paid, and that have terms tomaturity approximating to the terms of the related pensionliability. The fair value of plan assets are measured at theirbid value.
Actuarial gains and losses arising from experience adjustmentsand changes in actuarial assumptions are charged or creditedto other comprehensive income. Past-service costs, negativeor positive, are recognised immediately in the incomestatement, unless the changes to the pension plan areconditional on the employees remaining in service for aspecified period of time (the vesting period). In this case,
the past-service costs are amortised on a straight line basisover the vesting period.
A curtailment arises where an event reduces the expectedyears of future service of employees or reduces the accrualof defined benefits for their future service. A past servicecost, negative or positive, arises following a change in thepresent value of the defined benefit obligation for employeeservice in prior periods, resulting in the current period fromthe introduction of, or changes to, post employment benefits.A settlement arises where the Group is relieved ofresponsibility for a pension obligation and eliminatessignificant risk relating to the obligation and the assets usedto effect the settlement. Losses arising on settlement orcurtailment not allowed for in the actuarial assumptions aremeasured at the date on which the Group becomesdemonstrably committed to the transaction. Gains arising ona settlement or curtailment are measured at the date onwhich all parties whose consent is required are irrevocablycommitted to the transaction. Curtailment and settlementgains and losses are dealt with in the income statement.
Payments to defined contribution schemes are charged asan expense when they fall due.
(ii) Share based paymentsThe Group operates a number of equity settled share basedcompensation plans which include executive share optionschemes and share awards.
The charge to the income statement in respect of share-based payments is based on the fair value of the equityinstruments granted and is spread over the vesting period ofthe instrument. The fair value of the instruments iscalculated using the Trinomial Model. In accordance withthe transition arrangements set out in IFRS 2 – Share BasedPayments, this standard has been applied in respect ofshare options granted after 7 November 2002 which had notvested by the date of transition to IFRS (4 January 2004).
Non-market vesting conditions are included in assumptionsabout the number of options that are expected to vest. Ateach reporting date, the Group revises its estimates of thenumber of options that are expected to vest. It recognisesthe impact of the revision to original estimates, if any, in theincome statement, with a corresponding adjustment toother comprehensive income. The proceeds received net ofany directly attributable transaction costs are credited toshare capital (nominal value) and share premium when theoptions are exercised.
In accordance with IFRS 2 (Amendment), vesting conditionsare service conditions and performance conditions only. Anyother features do not impact the number of awardsexpected to vest or valuation there of subsequent to grantdate. In addition, all cancellations, whether by entity or otherparties, receive the same accounting treatment.
(iii) Awards under the 2007 Long Term Incentive Plan and2008 Long Term Incentive PlanThe fair value of shares awarded under the 2007 LTIP and2008 LTIP schemes are determined using a Monte Carlosimulation technique. The performance share plan containsinter-alia a Total Shareholder Return (TSR) based (and hencemarket-based) vesting condition, and accordingly, the fairvalue assigned to the related equity instruments on initialapplication of IFRS 2 is adjusted so as to reflect the
74 Glanbia plc 2009 Annual Report Financial statements
anticipated likelihood at the grant date of achieving themarket-based vesting condition.
(n) Government grantsGrants from the government are recognised at their fair valuewhere there is a reasonable assurance that the grant will bereceived and the Group will comply with all attached conditions.Government grants relating to costs are deferred and recognisedin the income statement over the period necessary to match themwith the costs they are intended to compensate. Governmentgrants relating to the purchase of property, plant and equipmentare included in non-current liabilities and are credited to theincome statement on a straight-line basis over the expected livesof the related assets. Research and development taxation creditsare recognised at their fair value in operating profit where there isreasonable assurance that the credit will be received.
(o) Revenue recognitionRevenue comprises the fair value of the consideration receivablefor the sale of goods and services to external customers net ofvalue-added tax, rebates and discounts. The Group recognisesrevenue when the amount of revenue can be reliably measured, itis probable that future economic benefit will flow to the entity andwhen specific criteria have been met for each of the Group’sactivities. Revenue from the sale of goods is recognised whensignificant risks and rewards of ownership of the goods aretransferred to the buyer, in the ordinary course of the Group’sbusiness which generally arises on delivery, or in accordance withspecific terms and conditions agreed with customers. Serviceincome is recognised on a straight line basis over the life of thearrangement to which it relates. The timing of recognition ofservices revenue equals the timing of when the services arerendered. Interest income is recognised using the effectiveinterest method. Dividends are recognised when the right toreceive payment is established. Revenue from the sale of propertyis recognised when there is an unconditional and irrevocablecontract for sale.
(p) Impairment of assets(i) Financial assets
The Group assesses at each reporting date whether there isobjective evidence that a financial asset or a group offinancial assets is impaired. In the case of equity securitiesclassified as available for sale, a significant or prolongeddecline in the fair value of the security below its cost isconsidered an indicator that the securities are impaired. If anysuch evidence exists for available for sale financial assets, thecumulative loss is measured as the difference between theacquisition cost and the current fair value, less anyimpairment loss on that financial asset previously recognisedin the profit or loss is removed from equity and recognised inthe income statement. Impairment losses recognised in theincome statement on equity instruments are not reversedthrough the income statement. Impairment testing of tradereceivables is described in (j) above.
(ii) Non-financial assetsAssets that have an indefinite useful life are not subject toamortisation and are tested annually for impairment. Assetswhich have a finite useful life are subject to amortisation andreviewed for impairment when events or changes incircumstance indicate that the carrying value may not berecoverable. Goodwill is reviewed at least annually forimpairment. An impairment loss is recognised to the extentthat the carrying value of the assets exceed their recoverableamount. The recoverable amount is the higher of the assetsfair value less costs to sell and its value in use.
For the purposes of assessing impairment, assets aregrouped at the lowest levels for which there are separatelyidentifiable cash flows (cash generating units).
(q) Share capitalOrdinary shares are classified as equity. Incremental costs directlyattributable to the issue of new shares or options are shown inequity as a deduction from the proceeds.
Own sharesThe cost of own shares, held by an Employee Share Trust inconnection with the Company’s Sharesave Scheme, is deductedfrom equity. Ordinary shares purchased under the terms of the2007 LTIP and 2008 LTIP schemes are accounted for as ownshares and recorded as a deduction from equity.
(r) DividendsDividends to the Company’s shareholders are recognised asa liability of the Company when approved by the Company’sshareholders.
(s) Derivative financial instrumentsThe activities of the Group expose it primarily to the financialrisks of changes in foreign currency exchange rates and interestrates. The Group uses derivative financial instruments such asforeign exchange contracts and options, interest rate swapcontracts and forward rate agreements to hedge theseexposures.
The Group accounts for financial instruments under IAS 32(Amendment), ‘Financial Instruments: Presentation’, IAS 39(Amendment), ‘Financial Instruments: Recognition andMeasurement’ and IFRS 7 – Financial Instruments Disclosures.Derivatives are initially recognised at fair value on the date aderivative contract is entered into and are subsequentlyremeasured at their fair value at the reporting date.
The fair value of forward foreign currency contracts is estimatedby discounting the difference between the contractual forwardprice and the current forward price for the residual maturity ofthe contract using the European Central Bank interest rate.
The fair value of interest rate swaps is based on discountingestimated future cash flows based on the terms and maturityof each contract and using market interest rates for a similarinstrument at the measurement date.
The fair value of commodity contracts is estimated bydiscounting the difference between the contracted futures priceand the current forward price for the residual maturity of thecontracts using the European Central Bank and US FederalReserve interest rates.
The method of recognising the resulting gain or loss depends onwhether the derivative is designated as a hedging instrument,and if so, the nature of the item being hedged. The Groupdesignates certain derivatives as either: (1) hedges of the fairvalue of recognised assets or liabilities or a firm commitment (fairvalue hedge); (2) hedges of a particular risk associated with arecognised asset or liability or a highly probable forecasttransaction (cash flow hedge).
The Group documents at the inception of the transaction therelationship between hedging instruments and hedged items,as well as its risk management objective and strategy forundertaking various hedge transactions. The Group alsodocuments its assessment, both at hedge inception and on anongoing basis, of whether the derivatives that are used inhedging transactions are highly effective in offsetting changesin fair values or cash flows of hedged items.
75Glanbia plc 2009 Annual Report Financial statements
The fair values of various derivative instruments used for hedgingpurposes are disclosed in note 32. Movements on the fair valuereserve are shown in note 22. The full fair value of a hedgingderivative is classified as a non-current asset or liability if theremaining maturity of the hedged item is more than 12 months,and as a current asset or liability, if the remaining maturity of thehedged item is less than 12 months. Trading derivatives areclassified as a current asset or liability.
(i) Fair value hedgeChanges in the fair value of derivatives that are designated
and qualify as fair value hedges are recorded in the income statement, together with any changes in the fair value of the hedged asset or liability that are attributable to the hedged risk. If the hedge no longer meets the criteria for hedge accounting, the adjustment to the carrying amount of a hedged item for which the effective interest method is used is amortised to profit or loss over the period to maturity.
(ii) Cash flow hedgeThe effective portion of changes in the fair value ofderivatives that are designated and qualify as cash flowhedges are recognised in other comprehensive income. Thegain or loss relating to the ineffective portion is recognisedimmediately in the income statement.
Amounts accumulated in equity are recycled in the incomestatement in the periods when the hedged item affects profitor loss (for instance when the forecast sale that is hedgedtakes place). The recycled gain or loss relating to the effectiveportion of interest rate swaps hedging variable interest rateson borrowings is recognised in the income statement within‘finance costs’. The recycled gain or loss relating to theeffective portion of forward foreign exchange contractshedging export sales is recognised in the income statementwithin revenue. However, when the forecast transaction thatis hedged results in the recognition of a non-financial asset(for example, inventory) or a non-financial liability, the gainsand losses previously deferred in equity are transferred fromequity and included in the initial measurement of the cost ofthe asset or liability.
When a hedging instrument expires or is sold, or when ahedge no longer meets the criteria for hedge accounting, anycumulative gain or loss existing in equity at that time remainsin equity and is recognised when the forecast transaction isultimately recognised in the income statement. When aforecast transaction is no longer expected to occur, thecumulative gain or loss that was reported in othercomprehensive income is immediately transferred to theincome statement.
(iii) Derivatives that do not qualify for hedge accountingCertain derivative instruments do not qualify for hedgeaccounting. Changes in the fair value of any derivativeinstruments that do not qualify for hedge accounting arerecognised immediately in the income statement.
(iv) Financial guarantee contractsFinancial guarantee contracts are issued to bankinginstitutions by the entity Glanbia plc on behalf of certain of itssubsidiaries. These subsidiaries engage in ongoing financingarrangements with these banking institutions. Under theterms of IAS 39 – Financial Instruments: Recognition andMeasurement,financial guarantee contracts are required tobe recognised at fair value at inception and subsequentlymeasured as a provision under IAS 37 – Provisions,
Contingent Liabilities and Contingent Assets on the Glanbiaplc company statement of financial position.
Guarantees provided by Glanbia plc, the entity, over thepayment of employer contributions in respect of the UKdefined benefit pension schemes are treated as insurancecontracts.
(t) Earnings per shareEarnings per share represents the profit in cents attributable toshareholders of the Company, divided by the weighted averagenumber of ordinary shares in issue in respect of the period.
Adjusted earnings per share is calculated on the net profitattributable to the owners of the Parent, pre exceptional itemsand intangible asset amortisation (net of related tax). Dilutedearnings per share is calculated by adjusting the weightedaverage number of ordinary shares outstanding to assumeconversion of all dilutive potential ordinary shares.
(u) Borrowing costsIn accordance with IAS 23 (Revised), ‘Borrowing Costs’, borrowingcosts directly attributable to the acquisition, construction orproduction of a qualifying asset are capitalised. Other borrowingcosts are expensed.
(v) BorrowingsBorrowings are recognised initially at fair value, net of transactioncosts incurred. Borrowings are subsequently stated at amortisedcost; any difference between the proceeds (net of transactioncosts) and the redemption value is recognised in the incomestatement over the period of the borrowings using the effectiveinterest method.
Preference shares, which are mandatorily redeemable on aspecific date, are classified as liabilities. The dividends on thesepreference shares are recognised in the income statement as afinance cost. Borrowings are classified as current liabilities unlessthe Group has an unconditional right to defer settlement of theliability for at least 12 months after the reporting date.
(w) ProvisionsProvisions are recognised when the Group has a constructive orlegal obligation as a result of past events, it is more likely thannot that an outflow of resources will be required to settle theobligation and the amount has been reliably estimated.Provisions are measured at the present value of the expendituresexpected to be required to settle the obligation using a pre-taxrate that reflects current market assessments of the time value ofmoney and the risks specific to the obligation. The increase inprovision due to passage of time is recognised as an interestexpense.
(x) Termination benefitsTermination benefits are payable when employment isterminated by the Group before the normal retirement date, orwhenever an employee accepts voluntary redundancy inexchange for these benefits. The Group recognises terminationbenefits when it is demonstrably committed to either terminatingthe employment of current employees according to a detailedformal plan without possibility of withdrawal; or providingtermination benefits as a result of an offer made to encouragevoluntary redundancy.
(y) Exceptional itemsThe Group has adopted an income statement format, which seeksto highlight significant items within the Group results for the year.Such items may include restructuring, impairment of assets, profitor loss on disposal or termination of operations, litigationsettlements, legislative changes and profit or loss on disposal of
76 Glanbia plc 2009 Annual Report Financial statements
investments. Judgement is used by the Group in assessing theparticular items, which by virtue of their scale and nature, should bedisclosed in the income statement and notes as exceptional items.
(z) Business combinationsThe purchase method of accounting is employed in accountingfor the acquisition of subsidiaries by the Group.
The cost of a business combination is measured as the aggregateof the fair values at the date of exchange of assets given, liabilitiesincurred or assumed and equity instruments issued in exchangefor control. To the extent that settlement of all or any part of abusiness combination is deferred, the fair value of the deferredcomponent is determined through discounting the amountspayable to their present value at the date of exchange. Thediscount component is unwound as an interest charge in theincome statement over the life of the obligation.
Where a business combination agreement provides for anadjustment to the cost of the combination contingent on futureevents, the amount of the adjustment is included in the cost at theacquisition date if the adjustment can be reliably measured.Contingent consideration is included in the statement of financialposition on a discounted basis.
The assets, liabilities and contingent liabilities of a subsidiary aremeasured at their fair values at the date of acquisition. When theinitial accounting for a business combination is determinedprovisionally, any adjustments to the provisional values allocatedto the identifiable assets, liabilities and contingent liabilities aremade within 12 months of the acquisition date.
Intangible assets acquired as part of a business combination arecapitalised separately from goodwill if the intangible asset meetsthe definition of an asset and the fair value can be reliablymeasured on initial recognition.
In accordance with IFRS 1, business combinations that took placebefore the transition date to IFRS (4 January 2004) have not beenrestated. All goodwill written off to reserves or amortised prior tothe transition date remains written off.
(aa) New accounting standards and IFRIC interpretationsThe Group’s assessment of the impact of these new standards andinterpretations is set out below;
The following standards and interpretations, issued by the IASB andthe International Financial Reporting Interpretations Committee(‘IFRIC’), are effective for the Group for the first time in the yearended 2 January 2010 and have been adopted by the Group:
� IFRS 2 (Amendment), ‘Share Based Payment’
� IFRS 8, ‘Operating Segments’
� IAS 1 (Revised), ‘Presentation of Financial Statements’
� IAS 23 (Revised), ‘Borrowing Costs’
� IAS 32 (Amendment), ‘Financial Instruments: Presentation’
� IAS 39 (Amendment), ‘Financial Instruments: Recognition andMeasurement’
� IFRIC 16, ‘Hedges of a Net Investment in a Foreign Operation’
� IAS 39 and IFRS 7 (Amendments), ‘Reclassification of FinancialAssets’
Except for IFRS 8, ‘Operating Segments’ adoption of thestandards and interpretations above had no significant impact onthe results or financial position of the Group during the yearended 2 January 2010. Refer to (c) - segment reporting above and
note 5 - segment information for a detailed analysis of the impactof IFRS 8 adoption.
Standards, amendments and interpretations effective in2009, reviewed by the Group and determined not applicableby the Group for the year ended 2 January 2010:The following standards, amendments and interpretations aremandatory for the Group for accounting periods beginning onor after 4 January 2009 but are not relevant to the Group’scurrent operations:
� IFRIC 9 and IAS 39 (Amendments), ‘Embedded Derivatives’.
� IFRIC 13, ‘Customer Loyalty Programmes’
� IFRIC 15, ‘Agreements for Construction of Real Estates.’
� IFRS 1 (Amendment), ‘First time adoption of IFRS’ and IAS 27‘Consolidated and Separate Financial Statements’.
� IAS 1 (Amendment), ‘Presentation of Financial Statements’ –‘Puttable Financial Instruments and Obligations arising onLiquidation’.
The following standards, amendments and interpretations aremandatory for the Group for accounting periods beginning on orafter 1 July 2009 but are not relevant to the Group’s operations:
� IFRIC 17, ‘Distributions of Non–cash Assets to Owners.
� IFRIC 18, ‘Transfers of Assets from Customers’.
The following standards, amendments and interpretations aremandatory for the Group for accounting periods beginning on orafter the date indicated below but are not relevant to theGroup’s operations:
� Amendments to IFRS 1 – ‘Additional Exemptions for First –time Adopters’ (1 January 2010)
� Amendments to IAS 32 – Classification of Rights Issues (1February 2010)
The following standards, amendments and interpretations toexisting standards have been published. They are mandatoryfor future accounting periods but are not yet effective andhave not been early adopted by the Group:
Improvements to IFRSs, (effective for financial periods beginningon various dates and for companies using IFRS for the yearended 31 December 2010).The IASB has issued the 'Improvements to IFRS 2009' standardwhich amends ten standards, basis of conclusions and guidance,and two interpretations based on the exposure drafts issued inOctober 2007 and August 2008. The improvements includechanges in presentation, recognition and measurement plusterminology and editorial changes. The improvements aresubject to EU endorsement. The Group has reviewed theimprovements to IFRS’ and will apply the revisions to applicablestandards from the effective date and is currently assessing theirimpact on the Group’s financial statements.
IFRS 1 (Revised), ‘First-time adoption of International FinancialReporting Standards’, (effective for financial periods beginningon or after 1 July 2009).The revised standard is still subject to EU endorsement. Thecurrent IFRS 1 has been amended many times to accommodatefirst time adoption requirements of new and amended IFRSs. Thisrevised version retains the substance of the original standard butwith a changed structure. The revised IFRS 1 is not applicable tothe group as it has already adopted IFRS, however it would beapplicable to other entities should they transition to IFRS in the
77Glanbia plc 2009 Annual Report Financial statements
future, subject to EU endorsement. The Group will apply thisrevised standard if applicable from the effective date and iscurrently assessing the impact on the Group’s financial statements.
IFRS 2 (Amendment), ‘Group Cash-settled share-based paymenttransactions’, (effective for financial periods beginning on or after1 January 2010).The amendment is still subject to EU endorsement. Theamendment clarifies the scope and the accounting for group cash-settled share-based payment transactions in the separate financialstatements of the entity receiving the goods or services when thatentity has no obligation to settle the share-based paymenttransactions. The amendment also incorporates the guidancecontained in IFRIC 8 and IFRIC 11. As a result IFRIC 8 and IFRIC 11have been withdrawn. The Group will apply the amendment fromthe effective date and is currently assessing the impact on theGroup’s financial statements.
IFRS 3 (Revised), ‘Business combinations’ (effective for financialperiods beginning on or after 1 July 2009).The revised standard continues to apply the acquisition method tobusiness combinations, with some significant changes. Forexample, all payments to purchase a business are to be recordedat fair value at the acquisition date, with contingent paymentsclassified as debt subsequently re-measured through the incomestatement. There is a choice on an acquisition-by-acquisition basisto measure the non-controlling interest in the acquiree either atfair value or at the non-controlling interest’s proportionate shareof the acquiree’s net assets. All acquisition-related costs should beexpensed. The Group will apply this revised standard from theeffective date and is currently assessing the impact on the Group’sfinancial statements.
Amendment to IAS 24 – Related Party Disclosures (effectivefor financial periods beginning on or after 1 January 2011).This amendment is subject to EU endorsement. The amendmentsimplifies the definition of a related party and provides a partialexemption from the disclosure requirements for government-related entities. The Group will apply this revised standard fromthe effective date and is currently assessing the impact on theGroup’s financial statements.
IAS 27 (Revised), ‘Consolidated and separate financial statements’,(effective for financial periods beginning onor after 1 July 2009.The revised standard requires the effects of all transactions withnon-controlling interests to be recorded in equity if there is nochange in control and these transactions will no longer result ingoodwill on acquisitions from non-controlling interests or gainsand losses on disposals to non-controlling interests. The standardalso specifies the accounting when control is lost. Any remaininginterest in the entity is re-measured to fair value, and a gain or lossis recognised in profit or loss. The Group will apply this revisedstandard from the effective date and is currently assessing theimpact on the Group’s financial statements.
IAS 39 (Amendment) – Eligible Hedged Items, ‘FinancialInstruments: Recognition and Measurement’ (effective for annualperiods beginning on or after 1 July 2009).This amendment to IAS 39 clarifies how the principles thatdetermine whether a hedged risk or portions of cash flows iseligible for designation should be applied. The Group will applythis revised standard from the effective date and is currentlyassessing the impact on the Group’s financial statements.
3. Financial risk management
3.1 Financial risk factorsThe conduct of its ordinary business operations necessitates theholding and issuing of financial instruments and derivativefinancial instruments by the Group. The main risks arising fromissuing, holding and managing these financial instrumentstypically include liquidity risk, interest rate risk, credit risk andcurrency risk. The Group approach is to centrally manage theserisks against comprehensive policy guidelines, which aresummarised below.
The Group does not engage in holding or issuing speculativefinancial instruments or derivatives thereof. The Group financesits operations by a mixture of retained profits, preference shares,medium-term committed bank borrowings and short-termuncommitted bank borrowings. The Group borrows in the majorglobal debt markets in a range of currencies at both fixed andfloating rates of interest, using derivatives where appropriate togenerate the desired effective currency profile and interest ratebasis.
Risk management, other than credit risk, is carried out by a centraltreasury department (Group Treasury) under policies approved bythe Board of Directors. Credit risk is discussed below. GroupTreasury identifies, evaluates and hedges financial risks in closeco-operation with the Group’s operating units.
The Board provides written principles for overall riskmanagement, as well as written policies covering specific areas,such as liquidity risk, foreign exchange risk, interestrate risk, credit risk, use of derivative financial instrumentsand non-derivative financial instruments, and investment ofexcess liquidity.
Market risk(a) Currency riskAlthough the Group is based in Ireland and has extensiveeuro operations, it has significant investment in overseasundertakings, primarily in the USA. As a result movements in USdollar/euro exchange rates can significantly affect the Group’seuro statement of financial position and income statement. TheGroup seeks to match, to a certain extent, the currency of itsborrowings, with that of its assets. The Group also hastransactional currency exposures that arise from sales orpurchases by an operating unit in currencies other than theoperating unit’s functional currency. Management has set up apolicy to require Group companies to manage their foreignexchange risk against their functional currency. The Groupcompanies are required to hedge foreign exchange risk exposurethrough Group Treasury.
Group Treasury reviews exposure reports on a regular basis. Tomanage their foreign exchange risk arising from futurecommercial transactions, recognised assets and liabilities andprofits earned in foreign currency entities, the Group use forwardcontracts or currency options, administered by Group Treasury.Foreign exchange risk arises when future commercial transactionsor recognised assets or liabilities are denominated in a currencythat is not the entity’s functional currency.
Group Treasury’s risk management practice is to hedge upto 100% of anticipated cash flows (mainly export sales andpurchase of inventory) in each major foreign currency to whichthe Group is exposed for the following financial year. The Groupdoes not take out cover unless the prospective sale or purchaseis highly probable.
78 Glanbia plc 2009 Annual Report Financial statements
The Group has certain investments in foreign operations, whosenet assets are exposed to foreign currency translation risk.Currency exposure arising from the net assets of the Group’sforeign operations is managed primarily through borrowingsdenominated in the relevant foreign currencies.
At 2 January 2010 and 3 January 2009, if the euro hadweakened/strengthened by 5% against the US dollar with all othervariables held constant, post-tax profit for the year would not havebeen materially impacted as a result of foreign exchangegains/losses on translation of US dollar denominated non-hedgedtrade receivables, and cash and cash equivalents.
A weakening/strengthening of the euro against the US dollar by5% as at 2 January 2010 would have resulted in a currencytranslation gain/loss of approximately €16.1 million (2008: €8.5million), which would be recognised directly in othercomprehensive income.
At 2 January 2010 and 3 January 2009, if the euro hadweakened/strengthened by 5% against the UK pound with allother variables held constant, post-tax profit for the year wouldnot have been materially impacted as a result of foreign exchangegains/losses on translation of UK pound-denominated non-hedged trade receivables, and cash and cash equivalents.
A weakening/strengthening of the euro against the UK pound by5% as at 2 January 2010 would have resulted in a currencytranslation gain/loss of approximately €7.0 million (2008: €3.0million), which would be recognised directly in othercomprehensive income.
(b) Interest rate riskThe Group’s objective in relation to interest rate management isto minimise the impact of interest rate volatility on interest costs inorder to protect reported profitability. This is achieved bydetermining a long-term strategy against a number of policyguidelines, which focus on (a) the amount of floating rateindebtedness anticipated over such a period and (b) theconsequent sensitivity of interest costs to interest rate movementson this indebtedness and the resultant impact on reportedprofitability. The Group borrows at both fixed and floating rates ofinterest and uses interest rate swaps to manage the Group’sexposure to interest rate fluctuations.
Borrowings issued at floating rates expose the Group to cash flowinterest rate risk. Borrowings issued at fixed rates expose theGroup to fair value interest rate risk. Group policy is to maintainno more than one third of its projected debt exposure on afloating rate basis over any succeeding 12 month period.
The Group, on a continuous basis, maintains a level of fixed ratecover dependent on prevailing fixed market rates, projected debtand market informed interest rate outlook.
Based on the Group’s unhedged variable rate debt in allcurrencies throughout 2009, a 1% increase in prevailing marketinterest rates would have resulted in a €1.3 million loss (2008: €1.8million loss), with no impact on other comprehensive income.
The Group manages its cash flow interest rate risk by usingfloating to fixed interest rate swaps. Such interest rate swapshave the economic effect of converting borrowings from floatingrates to fixed rates. Under these interest rate swaps, the Groupagrees with other parties to exchange at specified intervals,the difference between fixed interest rate amounts and floatingrate interest amounts calculated by reference to the agreednotional amounts.
Occasionally the Group enters into fixed to floating interest rateswaps to hedge the fair value interest rate risk arising where ithas borrowed at fixed rates.
(c) Price RiskThe Group is exposed to equity securities price risk becauseof investments held by the Group in listed and unlisted securitiesand classified on the consolidated statement of financial positionas available for sale. Certain securities are carried at cost andtherefore are not exposed to price risk.
To manage its price risk arising from investments in listed equitysecurities, the Group does not maintain a significant balance withany one entity.
Diversification of the portfolio must be done in accordance withthe limits set by the Group. The impact of a 5% increase ordecrease in equity indexes across the eurozone countries wouldnot have any significant impact on Group operating profit.
To manage its exposure to certain commodity markets the Groupenters commodity future contracts. Such commodity futures aresubject to fair value changes which are recognised in the incomestatement.
Liquidity and cash flow riskThe Group’s objective is to maintain a balance between thecontinuity of funding and flexibility through the use of borrowingswith a range of maturities. In order to preserve continuity offunding, the Group’s policy is that, at a minimum, committedfacilities should be available at all times to meet the full extent ofits anticipated finance requirements, arising in the ordinarycourse of business, during the succeeding 12 month period. Thismeans that at any time the lenders providing facilities in respectof this finance requirement are required to give at least 12months notice of their intention to seek repayment of suchfacilities. At the year end, the Group had multi-currencycommitted term facilities of €729.1 million (2008: €661.5 million)of which €138.8 million (2008: €82.9 million) was undrawn. Theweighted average maturity of these facilities was 3.2 years (2008:4.2 years).
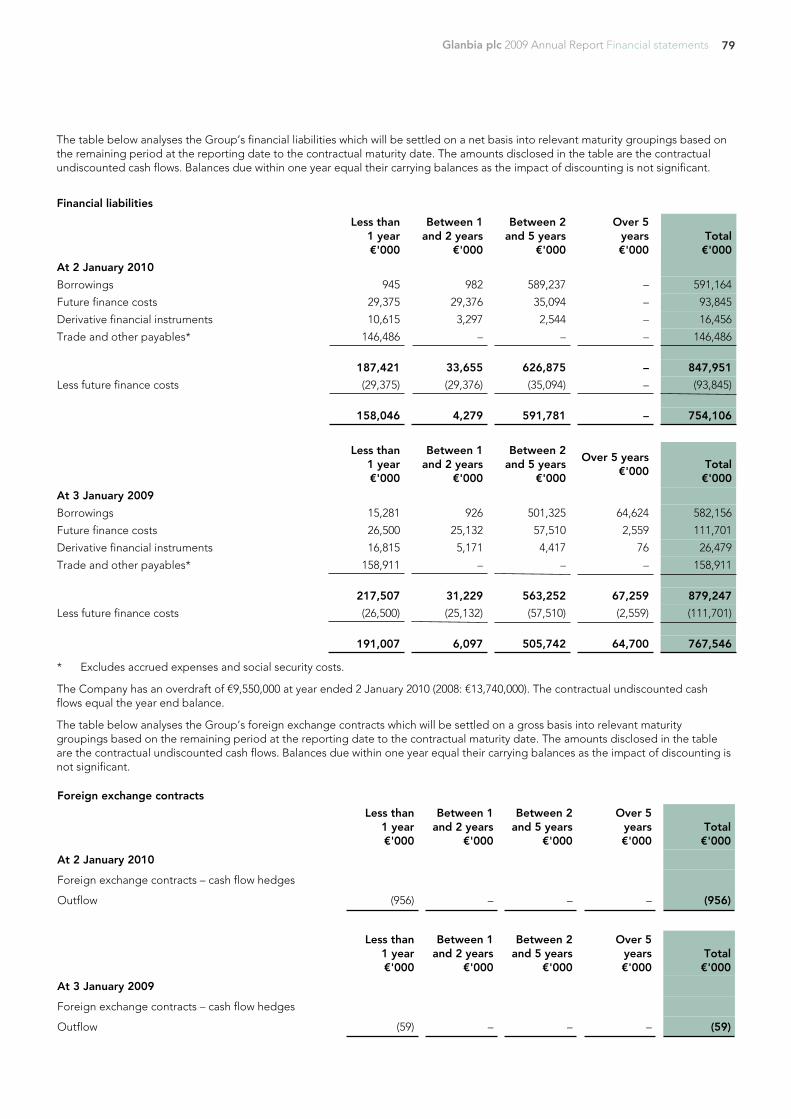
79Glanbia plc 2009 Annual Report Financial statements
The table below analyses the Group’s financial liabilities which will be settled on a net basis into relevant maturity groupings based onthe remaining period at the reporting date to the contractual maturity date. The amounts disclosed in the table are the contractualundiscounted cash flows. Balances due within one year equal their carrying balances as the impact of discounting is not significant.
Financial liabilities
Less than1 year€'000
Between 1and 2 years
€'000
Between 2and 5 years
€'000
Over 5years€'000
Total€'000
At 2 January 2010
Borrowings 945 982 589,237 – 591,164
Future finance costs 29,375 29,376 35,094 – 93,845
Derivative financial instruments 10,615 3,297 2,544 – 16,456
Trade and other payables* 146,486 – – – 146,486
187,421 33,655 626,875 – 847,951Less future finance costs (29,375) (29,376) (35,094) – (93,845)
158,046 4,279 591,781 – 754,106
Less than1 year€'000
Between 1and 2 years
€'000
Between 2and 5 years
€'000
Over 5 years€'000
Total€'000
At 3 January 2009
Borrowings 15,281 926 501,325 64,624 582,156
Future finance costs 26,500 25,132 57,510 2,559 111,701
Derivative financial instruments 16,815 5,171 4,417 76 26,479
Trade and other payables* 158,911 – – – 158,911
217,507 31,229 563,252 67,259 879,247Less future finance costs (26,500) (25,132) (57,510) (2,559) (111,701)
191,007 6,097 505,742 64,700 767,546
* Excludes accrued expenses and social security costs.
The Company has an overdraft of €9,550,000 at year ended 2 January 2010 (2008: €13,740,000). The contractual undiscounted cashflows equal the year end balance.
The table below analyses the Group’s foreign exchange contracts which will be settled on a gross basis into relevant maturitygroupings based on the remaining period at the reporting date to the contractual maturity date. The amounts disclosed in the tableare the contractual undiscounted cash flows. Balances due within one year equal their carrying balances as the impact of discounting isnot significant.
Foreign exchange contracts
Less than1 year€'000
Between 1and 2 years
€'000
Between 2and 5 years
€'000
Over 5years€'000
Total€'000
At 2 January 2010
Foreign exchange contracts – cash flow hedges
Outflow (956) – – – (956)
Less than1 year€'000
Between 1and 2 years
€'000
Between 2and 5 years
€'000
Over 5years€'000
Total€'000
At 3 January 2009
Foreign exchange contracts – cash flow hedges
Outflow (59) – – – (59)
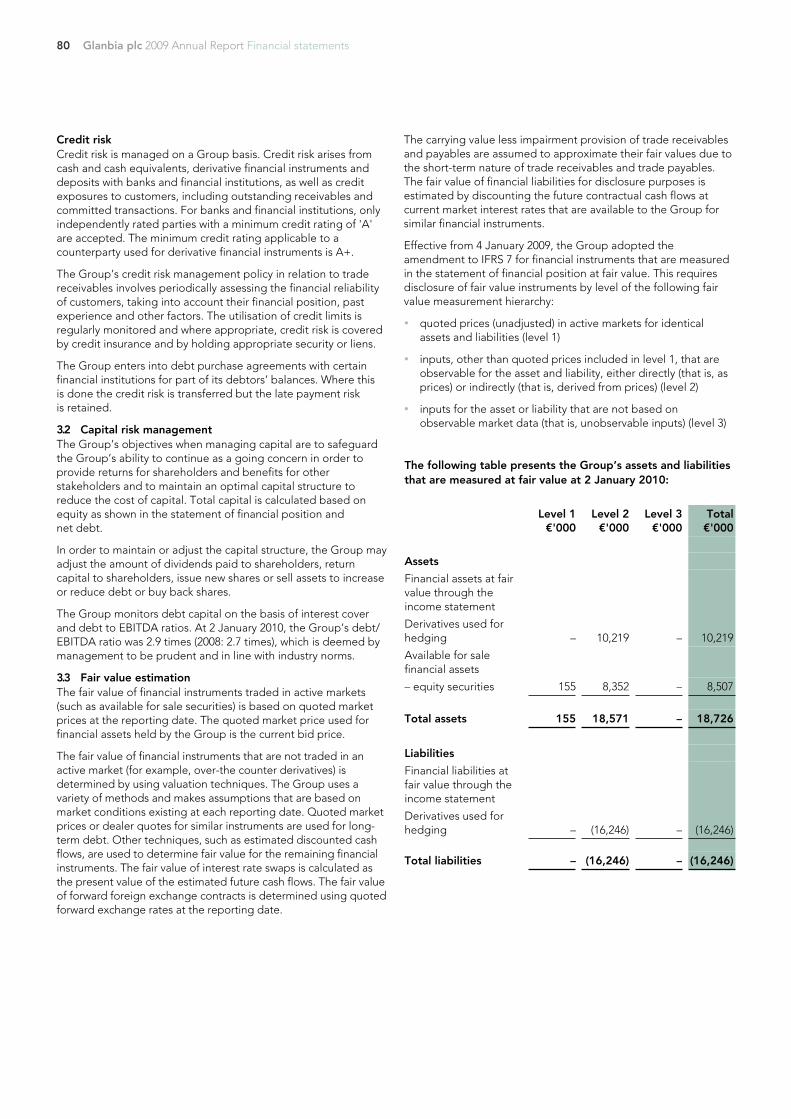
80 Glanbia plc 2009 Annual Report Financial statements
Credit riskCredit risk is managed on a Group basis. Credit risk arises fromcash and cash equivalents, derivative financial instruments anddeposits with banks and financial institutions, as well as creditexposures to customers, including outstanding receivables andcommitted transactions. For banks and financial institutions, onlyindependently rated parties with a minimum credit rating of 'A'are accepted. The minimum credit rating applicable to acounterparty used for derivative financial instruments is A+.
The Group’s credit risk management policy in relation to tradereceivables involves periodically assessing the financial reliabilityof customers, taking into account their financial position, pastexperience and other factors. The utilisation of credit limits isregularly monitored and where appropriate, credit risk is coveredby credit insurance and by holding appropriate security or liens.
The Group enters into debt purchase agreements with certainfinancial institutions for part of its debtors’ balances. Where thisis done the credit risk is transferred but the late payment riskis retained.
3.2 Capital risk managementThe Group’s objectives when managing capital are to safeguardthe Group’s ability to continue as a going concern in order toprovide returns for shareholders and benefits for otherstakeholders and to maintain an optimal capital structure toreduce the cost of capital. Total capital is calculated based onequity as shown in the statement of financial position andnet debt.
In order to maintain or adjust the capital structure, the Group mayadjust the amount of dividends paid to shareholders, returncapital to shareholders, issue new shares or sell assets to increaseor reduce debt or buy back shares.
The Group monitors debt capital on the basis of interest coverand debt to EBITDA ratios. At 2 January 2010, the Group’s debt/EBITDA ratio was 2.9 times (2008: 2.7 times), which is deemed bymanagement to be prudent and in line with industry norms.
3.3 Fair value estimationThe fair value of financial instruments traded in active markets(such as available for sale securities) is based on quoted marketprices at the reporting date. The quoted market price used forfinancial assets held by the Group is the current bid price.
The fair value of financial instruments that are not traded in anactive market (for example, over-the counter derivatives) isdetermined by using valuation techniques. The Group uses avariety of methods and makes assumptions that are based onmarket conditions existing at each reporting date. Quoted marketprices or dealer quotes for similar instruments are used for long-term debt. Other techniques, such as estimated discounted cashflows, are used to determine fair value for the remaining financialinstruments. The fair value of interest rate swaps is calculated asthe present value of the estimated future cash flows. The fair valueof forward foreign exchange contracts is determined using quotedforward exchange rates at the reporting date.
The carrying value less impairment provision of trade receivablesand payables are assumed to approximate their fair values due tothe short-term nature of trade receivables and trade payables.The fair value of financial liabilities for disclosure purposes isestimated by discounting the future contractual cash flows atcurrent market interest rates that are available to the Group forsimilar financial instruments.
Effective from 4 January 2009, the Group adopted theamendment to IFRS 7 for financial instruments that are measuredin the statement of financial position at fair value. This requiresdisclosure of fair value instruments by level of the following fairvalue measurement hierarchy:
� quoted prices (unadjusted) in active markets for identicalassets and liabilities (level 1)
� inputs, other than quoted prices included in level 1, that areobservable for the asset and liability, either directly (that is, asprices) or indirectly (that is, derived from prices) (level 2)
� inputs for the asset or liability that are not based onobservable market data (that is, unobservable inputs) (level 3)
The following table presents the Group’s assets and liabilitiesthat are measured at fair value at 2 January 2010:
Level 1€'000
Level 2€'000
Level 3€'000
Total€'000
Assets
Financial assets at fairvalue through theincome statement
Derivatives used forhedging – 10,219 – 10,219
Available for salefinancial assets
– equity securities 155 8,352 – 8,507
Total assets 155 18,571 – 18,726
Liabilities
Financial liabilities atfair value through theincome statement
Derivatives used forhedging – (16,246) – (16,246)
Total liabilities – (16,246) – (16,246)
81Glanbia plc 2009 Annual Report Financial statements
4. Critical accounting estimates and judgements
Estimates and judgements are continually evaluated and arebased on historical experience and other factors, includingexpectations of future events that are believed to be reasonableunder the circumstances.
The Group makes estimates and assumptions concerning thefuture. The resulting accounting estimates will, by definition,seldom equal the related actual results. The estimates andassumptions that could have a significant risk of causing a materialadjustment to the carrying amounts of assets and liabilities withinthe next financial year are discussed below.
(a) Impairment reviews of goodwill and indefinite life intangiblesThe Group tests annually whether goodwill has suffered anyimpairment, in accordance with the accounting policy stated innote 2 (f). The recoverable amounts of cash generating units havebeen determined based on value in use calculations. Thesecalculations require the use of estimates.
The assets of Glanbia Nutritionals (NA), Inc. (formerly SeltzerCompanies, Inc.), Optimum Nutrition, Inc. and GlanbiaNutritionals Deutschland GmbH, including goodwill arising onacquisition of €227.3 million, were tested for impairment usingprojected cash flows over a 10 year period.A reduction in projected EBITDA of 10% or an increase in thediscount factor used from 6.5% to 7.5% would not result in animpairment of the assets. A rate of zero percent has been used toestimate cash flow growth between 3 and 10 years. Indefinite lifeintangible assets are those for which there is no foreseeable limitto their expected useful life. The classification of intangible assetsas indefinite is reviewed annually.
(b) Income taxesThe Group is subject to income tax in numerous jurisdictions.Significant judgement is required in determining the worldwideprovision for income taxes. There are many transactions andcalculations for which the ultimate tax determination is uncertainduring the ordinary course of business. The Group recognisesliabilities for anticipated tax audit issues based on estimates ofwhether additional taxes will be due. Where the final tax outcomeof these matters is different from the amounts that were initiallyrecorded, such differences will impact the income tax and deferredtax provisions in the period in which such determination is made.Were the actual final outcome of these matters to differ by 10%from management’s estimates, the Group would need to revise itstax liabilities by approximately €1.4 million (2008: €1.0 million).
Deferred tax assets are recognised to the extent that it is probablethat future taxable profit will be available against which the unusedtax losses and unused tax credits can be utilised. The Groupestimates the most probable amount of future taxable profits,using assumptions consistent with those employed in impairmentcalculations, and taking into consideration applicable tax legislationin the relevant jurisdiction. These calculations require the use ofestimates. An increase in the Group’s effective tax rate by 1%would reduce profit after tax by €1.3 million (2008: €1.1 million).
(c) Post-employment benefitsThe Group operates a number of post employment definedbenefit plans. The rates of contributions payable, the pension costand the Group’s total obligation in respect of defined benefitplans is calculated and determined by independent qualifiedactuaries and updated at least annually. The Group has planassets totalling €349.2 million giving a net pension liability of €85.8million for the Group. The size of the obligation and cost of thebenefits are sensitive to actuarial assumptions. These includedemographic assumptions covering mortality and longevity, andeconomic assumptions covering price inflation, benefit and salary
increases together with the discount rate used. The Group hasreviewed the impact of a change in the discount rate used andconcluded that based on the pension deficit at 2 January 2010,an increase in the discount rates applied of 10 basis points acrossthe various defined benefit plans, would have the impact ofdecreasing the pension deficit for the Group by €5.2 million.
The curtailment gains and negative past service costs have beencalculated by management using certain estimates andjudgements, primary among these being the inflation rate,investment strategy approach and discount rate assumed, thefinal determination of which may be different as actual resultsbecome certain. The curtailment gains and negative past servicecosts are also based on management’s assumption regardinghow benefit reductions will be achieved. The benefit reductionscan be achieved in a number of different ways and therefore thefinal figures may ultimately vary from those estimated.
(d) Establishing lives for depreciation of property, plantand equipment and intangible assetsLong-lived assets comprising primarily property, plant andequipment and intangible assets, represent a significant portionof total assets. The annual depreciation and amortisation chargedepends primarily on the estimated lives of each type of assetand, in certain circumstances, estimates of fair values and residualvalues. The Directors regularly review these useful lives andchange them as necessary to reflect current thinking onremaining lives in light of technological change, pattern ofconsumption, the physical condition and expected economicutilisation of the asset. Changes in the useful lives can have asignificant impact on the depreciation and amortisation chargefor the period. Details of the useful lives are included in theaccounting policies 2 (e) and 2 (f) above. The impact of anychange could vary significantly depending on the individualchanges in assets and the classes of assets impacted. The Grouphas reviewed the impact of a change in useful lives on land andbuildings and a one year reduction in useful lives would have a€2.1 million reduction impact on operating profit. The Group hasalso reviewed the impact of a change in useful lives in plant andequipment and a one year reduction in useful lives would have a€0.2 million reduction impact on operating profit.
The Group has reviewed the impact on indefinite life intangibleassets of assigning a finite life to these assets and a 20 year usefullife estimate would have a €4.4 million reduction impact onoperating profit.
(e) Fair value of derivatives and other financial instruments.The fair value of financial instruments that are not traded in anactive market (for example, over-the-counter derivatives) isdetermined by using valuation techniques. The Group uses itsjudgement to select a variety of methods and make assumptionsthat are mainly based on market conditions existing at eachreporting date. The Group has used discounted cash flowanalysis for various available for sale financial assets that are nottraded in active markets. The carrying amount of available forsale financial assets would not be materially different were thediscounted rate used in the discounted cash flow analysis todiffer by 10% from management’s estimates.
(f) ProvisionsProvisions are recognised when the Group has a constructive orlegal obligation as a result of past events; it is more likely thannot that an outflow of resources will be required to settle theobligation; and the amount has been reliably estimated. Theamount recognised as a provision is the best estimate of theamount required to settle the present obligation at the reportingdate, taking account of the risks and uncertainties surroundingthe obligation.
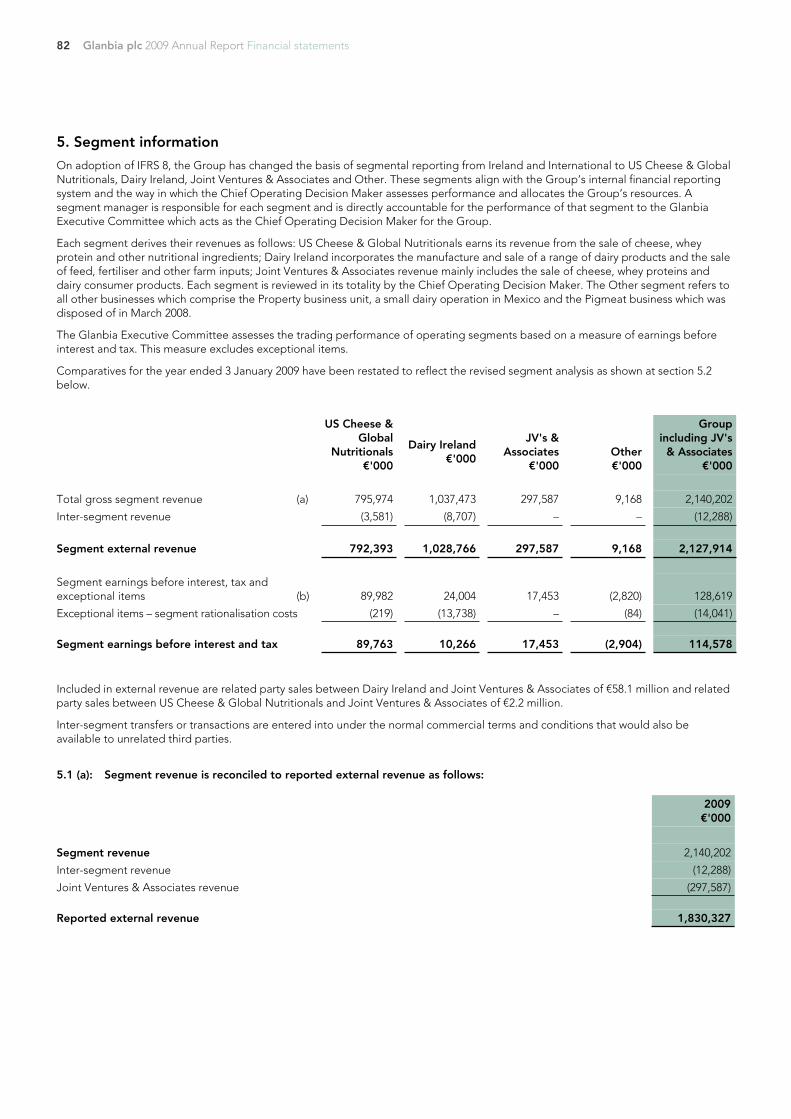
82 Glanbia plc 2009 Annual Report Financial statements
5. Segment information
On adoption of IFRS 8, the Group has changed the basis of segmental reporting from Ireland and International to US Cheese & GlobalNutritionals, Dairy Ireland, Joint Ventures & Associates and Other. These segments align with the Group’s internal financial reportingsystem and the way in which the Chief Operating Decision Maker assesses performance and allocates the Group’s resources. Asegment manager is responsible for each segment and is directly accountable for the performance of that segment to the GlanbiaExecutive Committee which acts as the Chief Operating Decision Maker for the Group.
Each segment derives their revenues as follows: US Cheese & Global Nutritionals earns its revenue from the sale of cheese, wheyprotein and other nutritional ingredients; Dairy Ireland incorporates the manufacture and sale of a range of dairy products and the saleof feed, fertiliser and other farm inputs; Joint Ventures & Associates revenue mainly includes the sale of cheese, whey proteins anddairy consumer products. Each segment is reviewed in its totality by the Chief Operating Decision Maker. The Other segment refers toall other businesses which comprise the Property business unit, a small dairy operation in Mexico and the Pigmeat business which wasdisposed of in March 2008.
The Glanbia Executive Committee assesses the trading performance of operating segments based on a measure of earnings beforeinterest and tax. This measure excludes exceptional items.
Comparatives for the year ended 3 January 2009 have been restated to reflect the revised segment analysis as shown at section 5.2below.
US Cheese &Global
Nutritionals€'000
Dairy Ireland€'000
JV's &Associates
€'000Other€'000
Groupincluding JV's
& Associates€'000
Total gross segment revenue (a) 795,974 1,037,473 297,587 9,168 2,140,202
Inter-segment revenue (3,581) (8,707) – – (12,288)
Segment external revenue 792,393 1,028,766 297,587 9,168 2,127,914
Segment earnings before interest, tax andexceptional items (b) 89,982 24,004 17,453 (2,820) 128,619
Exceptional items – segment rationalisation costs (219) (13,738) – (84) (14,041)
Segment earnings before interest and tax 89,763 10,266 17,453 (2,904) 114,578
Included in external revenue are related party sales between Dairy Ireland and Joint Ventures & Associates of €58.1 million and relatedparty sales between US Cheese & Global Nutritionals and Joint Ventures & Associates of €2.2 million.
Inter-segment transfers or transactions are entered into under the normal commercial terms and conditions that would also beavailable to unrelated third parties.
5.1 (a): Segment revenue is reconciled to reported external revenue as follows:
2009€'000
Segment revenue 2,140,202
Inter-segment revenue (12,288)
Joint Ventures & Associates revenue (297,587)
Reported external revenue 1,830,327
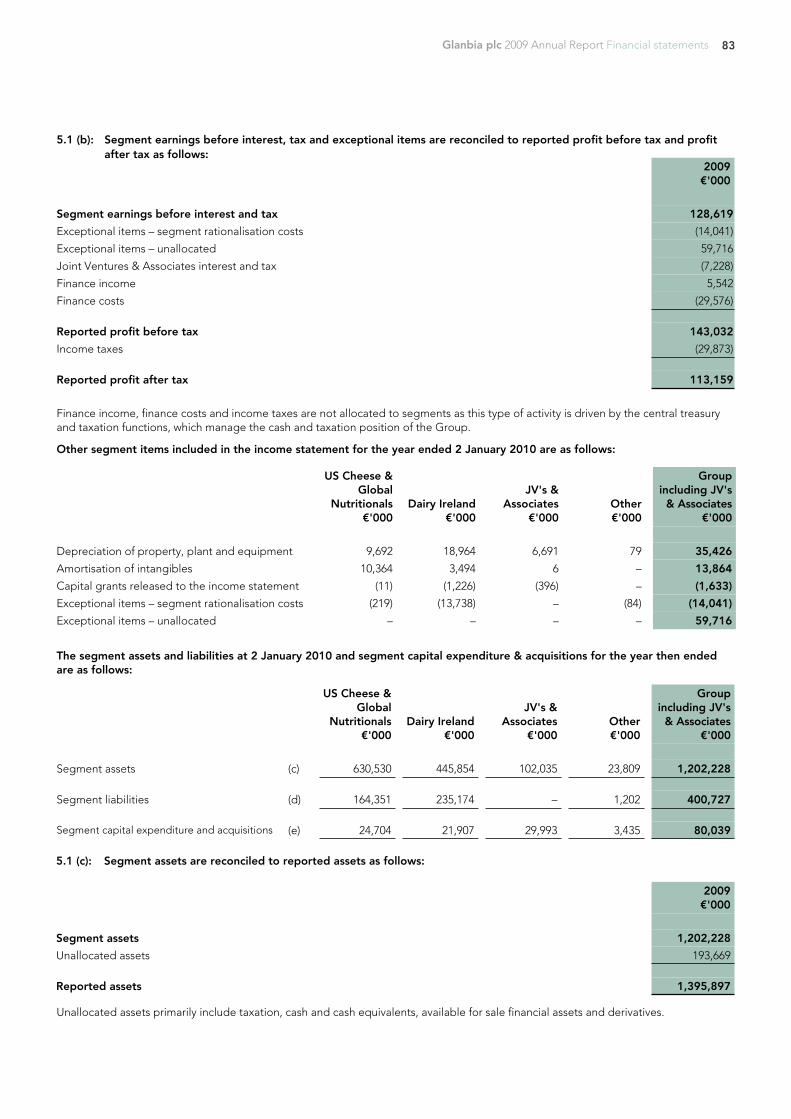
83Glanbia plc 2009 Annual Report Financial statements
5.1 (b): Segment earnings before interest, tax and exceptional items are reconciled to reported profit before tax and profit after tax as follows:
2009€'000
Segment earnings before interest and tax 128,619
Exceptional items – segment rationalisation costs (14,041)
Exceptional items – unallocated 59,716
Joint Ventures & Associates interest and tax (7,228)
Finance income 5,542
Finance costs (29,576)
Reported profit before tax 143,032
Income taxes (29,873)
Reported profit after tax 113,159
Finance income, finance costs and income taxes are not allocated to segments as this type of activity is driven by the central treasuryand taxation functions, which manage the cash and taxation position of the Group.
Other segment items included in the income statement for the year ended 2 January 2010 are as follows:
US Cheese &Global
Nutritionals€'000
Dairy Ireland€'000
JV's &Associates
€'000Other€'000
Groupincluding JV's
& Associates€'000
Depreciation of property, plant and equipment 9,692 18,964 6,691 79 35,426
Amortisation of intangibles 10,364 3,494 6 – 13,864
Capital grants released to the income statement (11) (1,226) (396) – (1,633)
Exceptional items – segment rationalisation costs (219) (13,738) – (84) (14,041)
Exceptional items – unallocated – – – – 59,716
The segment assets and liabilities at 2 January 2010 and segment capital expenditure & acquisitions for the year then endedare as follows:
US Cheese &Global
Nutritionals€'000
Dairy Ireland€'000
JV's &Associates
€'000Other€'000
Groupincluding JV's
& Associates€'000
Segment assets (c) 630,530 445,854 102,035 23,809 1,202,228
Segment liabilities (d) 164,351 235,174 – 1,202 400,727
Segment capital expenditure and acquisitions (e) 24,704 21,907 29,993 3,435 80,039
5.1 (c): Segment assets are reconciled to reported assets as follows:
2009€'000
Segment assets 1,202,228
Unallocated assets 193,669
Reported assets 1,395,897
Unallocated assets primarily include taxation, cash and cash equivalents, available for sale financial assets and derivatives.
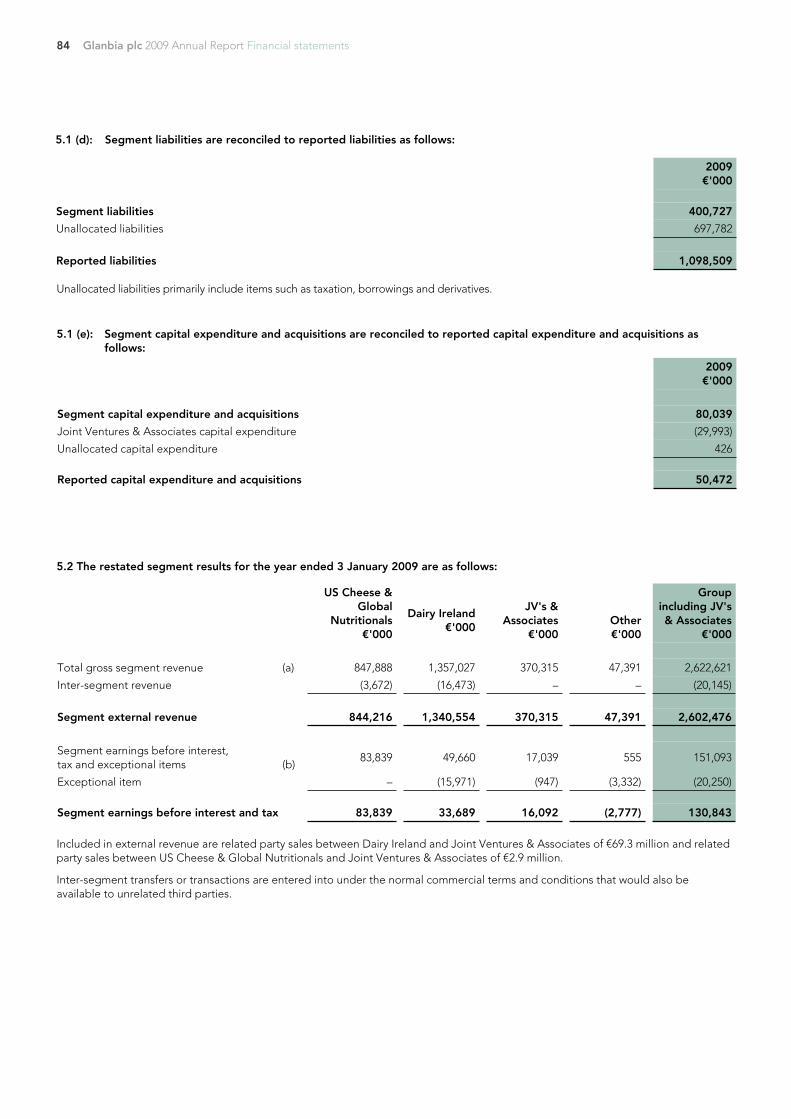
84 Glanbia plc 2009 Annual Report Financial statements
2009€'000
Segment liabilities 400,727
Unallocated liabilities 697,782
Reported liabilities 1,098,509
Unallocated liabilities primarily include items such as taxation, borrowings and derivatives.
US Cheese &Global
Nutritionals€'000
Dairy Ireland€'000
JV's &Associates
€'000Other€'000
Groupincluding JV's& Associates
€'000
Total gross segment revenue (a) 847,888 1,357,027 370,315 47,391 2,622,621
Inter-segment revenue (3,672) (16,473) – – (20,145)
Segment external revenue 844,216 1,340,554 370,315 47,391 2,602,476
Segment earnings before interest,tax and exceptional items (b)
83,839 49,660 17,039 555 151,093
Exceptional item – (15,971) (947) (3,332) (20,250)
Segment earnings before interest and tax 83,839 33,689 16,092 (2,777) 130,843
Included in external revenue are related party sales between Dairy Ireland and Joint Ventures & Associates of €69.3 million and relatedparty sales between US Cheese & Global Nutritionals and Joint Ventures & Associates of €2.9 million.
Inter-segment transfers or transactions are entered into under the normal commercial terms and conditions that would also beavailable to unrelated third parties.
5.1 (d): Segment liabilities are reconciled to reported liabilities as follows:
5.2 The restated segment results for the year ended 3 January 2009 are as follows:
2009€'000
Segment capital expenditure and acquisitions 80,039
Joint Ventures & Associates capital expenditure (29,993)
Unallocated capital expenditure 426
Reported capital expenditure and acquisitions 50,472
5.1 (e): Segment capital expenditure and acquisitions are reconciled to reported capital expenditure and acquisitions as follows:
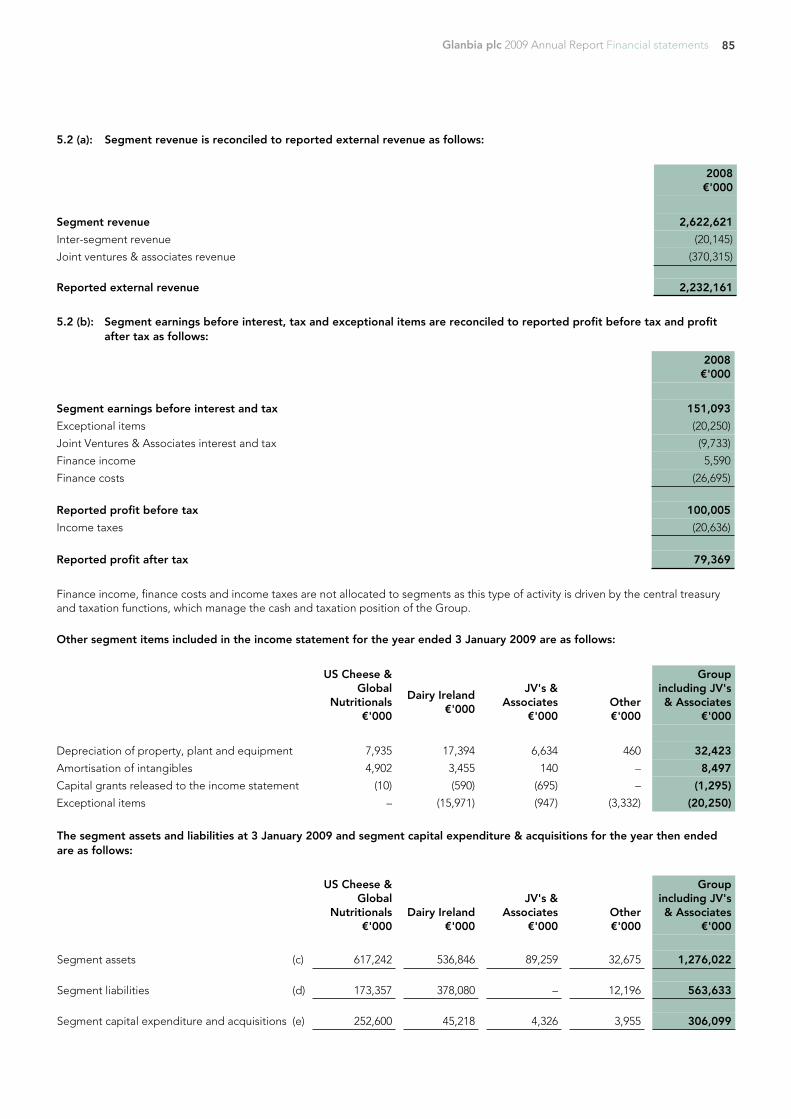
85Glanbia plc 2009 Annual Report Financial statements
5.2 (a): Segment revenue is reconciled to reported external revenue as follows:
2008€'000
Segment revenue 2,622,621
Inter-segment revenue (20,145)
Joint ventures & associates revenue (370,315)
Reported external revenue 2,232,161
5.2 (b): Segment earnings before interest, tax and exceptional items are reconciled to reported profit before tax and profit after tax as follows:
2008€'000
Segment earnings before interest and tax 151,093
Exceptional items (20,250)
Joint Ventures & Associates interest and tax (9,733)
Finance income 5,590
Finance costs (26,695)
Reported profit before tax 100,005
Income taxes (20,636)
Reported profit after tax 79,369
Finance income, finance costs and income taxes are not allocated to segments as this type of activity is driven by the central treasuryand taxation functions, which manage the cash and taxation position of the Group.
Other segment items included in the income statement for the year ended 3 January 2009 are as follows:
US Cheese &Global
Nutritionals€'000
Dairy Ireland€'000
JV's &Associates
€'000Other€'000
Groupincluding JV's& Associates
€'000
Depreciation of property, plant and equipment 7,935 17,394 6,634 460 32,423
Amortisation of intangibles 4,902 3,455 140 – 8,497
Capital grants released to the income statement (10) (590) (695) – (1,295)
Exceptional items – (15,971) (947) (3,332) (20,250)
The segment assets and liabilities at 3 January 2009 and segment capital expenditure & acquisitions for the year then endedare as follows:
US Cheese &Global
Nutritionals€'000
Dairy Ireland€'000
JV's &Associates
€'000Other€'000
Groupincluding JV's& Associates
€'000
Segment assets (c) 617,242 536,846 89,259 32,675 1,276,022
Segment liabilities (d) 173,357 378,080 – 12,196 563,633
Segment capital expenditure and acquisitions (e) 252,600 45,218 4,326 3,955 306,099
86 Glanbia plc 2009 Annual Report Financial statements
5.2 (c): Segment assets are reconciled to reported assets as follows:
2008€'000
Segment assets 1,276,022
Unallocated assets 178,947
Reported assets 1,454,969
Unallocated assets primarily include taxation, cash and cash equivalents, available for sale financial assets and derivatives.
5.2 (d): Segment liabilities are reconciled to reported liabilities as follows:
2008€'000
Segment liabilities 563,633
Unallocated liabilities 663,417
Reported liabilities 1,227,050
Unallocated liabilities primarily include items such as taxation, borrowings and derivatives.
2009€'000
2008€'000
Ireland 703,217 1,055,597
UK 116,194 69,981
Rest of Europe 244,294 112,450
USA 583,718 859,234
Other 182,904 134,899
1,830,327 2,232,161
Revenue of approximately €231.1 million (2008: €320.2 million) is derived from a single external customer.
The total of non-current assets, other than financial instruments and deferred tax assets, located in Ireland is €289.1 million and locatedin other countries, mainly the USA is €538.6 million.
5.3 Entity wide disclosuresRevenue from external customers for each group of similar product in the US Cheese & Global Nutritionals, Dairy Ireland, JointVentures & Associates and Other segments are outlined at section 5.1 and 5.2 above.
Geographical informationRevenue by geographical destination is reviewed by the Chief Operating Decision Maker. The breakdown of revenue by geographicaldestination is as follows:
2008€'000
Segment capital expenditure and acquisitions 306,099
Joint Ventures & Associates capital expenditure (4,326)
Unallocated capital expenditure 2,841
Reported capital expenditure and acquisitions 304,614
5.2 (e): Segment capital expenditure and acquisitions are reconciled to reported capital expenditure and acquisitions as follows:
87Glanbia plc 2009 Annual Report Financial statements
6. Operating expenses
The following items have been included in arriving at operating profit:
2009€'000
2008€'000
Depreciation of property, plant and equipment (note 14)
– Owned assets 27,221 24,149
– Leased assets under finance leases 1,514 1,640
Profit on disposal of property, plant and equipment (716) (5,319)
Repairs and maintenance expenditure on property, plant and equipment 26,903 25,698
Exceptional items (pre tax)
– Exit from Pigmeat – 3,332
– Rationalisation costs 15,055 15,971
– Non-cash foreign exchange loss 18,280 –
– UK defined benefit schemes 21,088 –
– Irish defined benefit schemes (100,098)
Net foreign exchange gains (excluding exceptional items) (2,543) (4,019)
Amortisation of intangible assets (note 15)
– Software costs 4,163 3,685
– Other intangible assets 9,695 4,672
(Decrease)/increase in inventories (65,845) 42,365
Raw materials and consumables used 1,364,843 1,619,992
Energy costs 26,753 39,714
Sales and marketing 51,735 54,110
Trade receivables – impairment charge for bad and doubtful debts 5,172 1,384
Amortisation of government grants received (note 30) (1,237) (600)
Operating lease rentals (note 14)
– Plant and machinery 6,606 4,775
– Other 3,923 5,582
Employee benefit expense – pre exceptional (note 8) 175,231 185,401
Auditors' remuneration 546 639
Research and development costs 7,686 6,880
Other expenses 77,511 87,359
Total operating expenses 1,673,486 2,117,410
2009€'000
2008€'000
Reconciliation of total operating expenses to income statement
Cost of sales 1,512,203 1,900,662
Distribution expenses 117,601 124,624
Administration expenses 104,412 92,124
Other gains and losses (60,730) –
Total operating expenses 1,673,486 2,117,410
88 Glanbia plc 2009 Annual Report Financial statements
7. Exceptional items
Notes2009€'000
2008€'000
Rationalisation costs (a) (15,055) (15,971)Non-cash foreign exchange loss (b) (18,280) –Defined benefit schemes– Irish defined benefit schemes (c) 100,098 –– UK defined benefit schemes (d) (21,088) –Exit from Pigmeat – (3,332)Joint venture – deferred tax charge – (947)
Total exceptional credit/(charge) before tax 45,675 (20,250)
Exceptional tax (charge)/credit (note 11) (10,770) 892
Net exceptional credit/(charge) 34,905 (19,358)
(a) An exceptional charge of €15.1 million was incurred during the year, primarily relating to redundancy costs due to the on-going rationalisation programmes in the Dairy Ireland segment.
(b) During the year, a review of the internal corporate structures of the Group was completed. This gave rise to an exceptional non- cash charge of €18.3 million on the repayment of certain sterling inter-group loans. This loss, which was previously recognised in the Group’s currency reserve is now recycled to the Group’s income statement.
(c) A strategic review of the Group’s pension arrangements was completed during 2009, following which the Group revised benefits under the Irish defined benefit schemes giving rise to an exceptional gain, in accordance with IAS 19, in the year of €100.1 million relating to curtailment gains and negative past service costs of €14.1 million and €86.0 million respectively. The curtailment gains and negative past service costs arise following the removal of guaranteed increases to pensions in payment for all members and the provision of benefits for members in employment on a career average basis from a final salary basis. The Group has completed its consultation process with all members of the main schemes.
(d) The Group’s UK defined benefit schemes exceptional charge of €21.1 million relates to the scheme’s administration and certain other costs associated with businesses disposed of in prior years. As outlined in note 33 – contingent liabilities, the Company has guaranteed the payment of a proportion of employer contributions in respect of these UK pension schemes.
89Glanbia plc 2009 Annual Report Financial statements
8. Employee benefit expense2009€'000
2008€'000
Wages and salaries 144,518 157,510Termination costs – 708Social security costs 15,613 17,036Cost of share options 187 515Pension costs – defined contribution plans (note 28) 2,146 1,719Pension costs – defined benefit plans (note 28) 12,767 7,913
175,231 185,401
Exceptional item – negative past service costs (60,400) (376)
Exceptional item – rationalisation costs (note 7 (a)) 15,055 15,068
129,886 200,093
The average number of employees, excluding the Group's Joint Ventures & Associates in 2009 was 3,418 (2008: 3,400) and is analysedinto the following categories:
2009 2008
US Cheese & Global Nutritionals 1,471 1,194Dairy Ireland 1,852 2,136
Other 95 70
3,418 3,400
10. Finance income and costs
2009€'000
2008€'000
Finance income
Interest income 4,662 5,164
Interest income on deferred consideration 880 426
Total finance income 5,542 5,590
Finance costs
Bank borrowings repayable within five years (16,756) (21,471)
Interest cost on deferred consideration (67) (22)
Finance lease costs (241) (360)
Interest rate swaps, transfer from equity (8,163) (477)
Interest rate swaps, fair value hedges 1,524 (1,295)
Fair value adjustment to borrowings attributable to interest rate risk (1,524) 1,295
Finance cost of preference shares (4,349) (4,365)
Total finance costs (29,576) (26,695)
Net finance costs (24,034) (21,105)
9. Directors’ remuneration
The audited Directors’ remuneration information is shown on pages 49 to 53 of the statement on Directors’ remuneration.
Net finance costs exclude borrowing costs attributable to the acquisition, construction or production of a qualifying asset which hasbeen capitalised, as disclosed in note 14.
The average number of employees in US Cheese & Global Nutritionals increased due to the acquisition of Optimum Nutrition in August2008 and the average number of employees in Dairy Ireland decreased due to the on-going rationalisation programme in this segment.
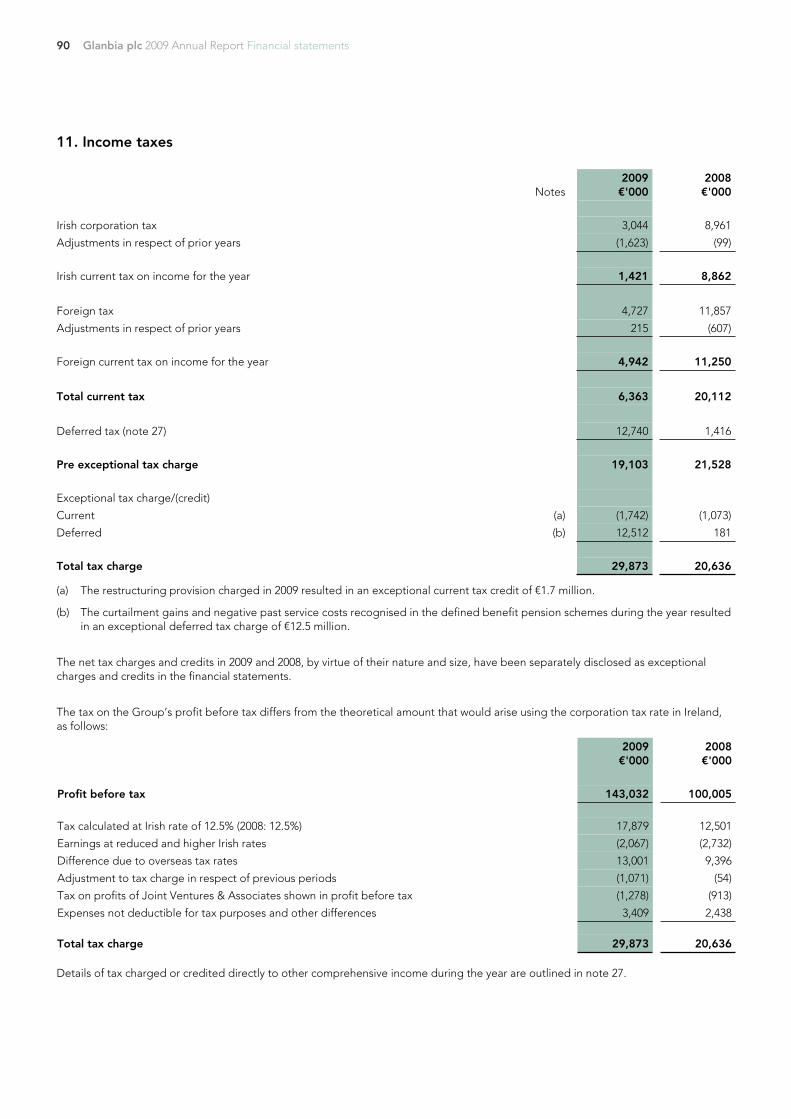
90 Glanbia plc 2009 Annual Report Financial statements
11. Income taxes
Notes2009€'000
2008€'000
Irish corporation tax 3,044 8,961
Adjustments in respect of prior years (1,623) (99)
Irish current tax on income for the year 1,421 8,862
Foreign tax 4,727 11,857
Adjustments in respect of prior years 215 (607)
Foreign current tax on income for the year 4,942 11,250
Total current tax 6,363 20,112
Deferred tax (note 27) 12,740 1,416
Pre exceptional tax charge 19,103 21,528
Exceptional tax charge/(credit)
Current (a) (1,742) (1,073)
Deferred (b) 12,512 181
Total tax charge 29,873 20,636
(a) The restructuring provision charged in 2009 resulted in an exceptional current tax credit of €1.7 million.
(b) The curtailment gains and negative past service costs recognised in the defined benefit pension schemes during the year resulted in an exceptional deferred tax charge of €12.5 million.
The net tax charges and credits in 2009 and 2008, by virtue of their nature and size, have been separately disclosed as exceptionalcharges and credits in the financial statements.
The tax on the Group’s profit before tax differs from the theoretical amount that would arise using the corporation tax rate in Ireland,as follows:
2009€'000
2008€'000
Profit before tax 143,032 100,005
Tax calculated at Irish rate of 12.5% (2008: 12.5%) 17,879 12,501
Earnings at reduced and higher Irish rates (2,067) (2,732)
Difference due to overseas tax rates 13,001 9,396
Adjustment to tax charge in respect of previous periods (1,071) (54)
Tax on profits of Joint Ventures & Associates shown in profit before tax (1,278) (913)
Expenses not deductible for tax purposes and other differences 3,409 2,438
Total tax charge 29,873 20,636
Details of tax charged or credited directly to other comprehensive income during the year are outlined in note 27.
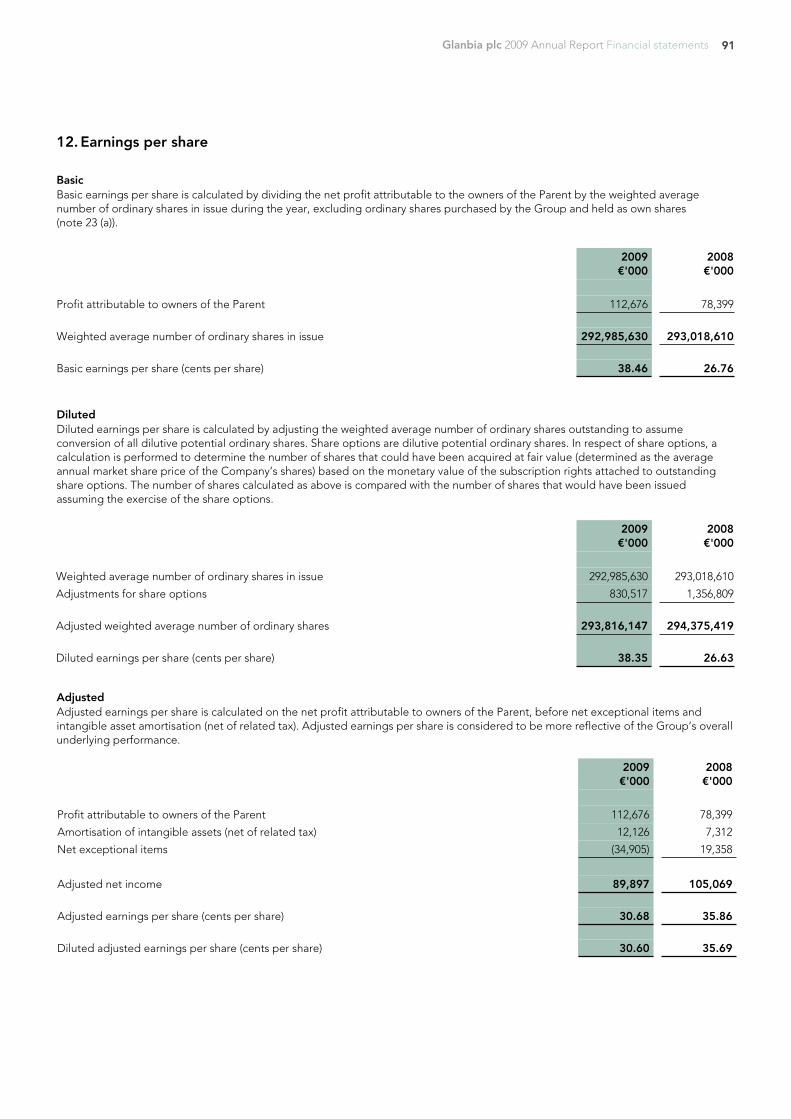
91Glanbia plc 2009 Annual Report Financial statements
12. Earnings per share
BasicBasic earnings per share is calculated by dividing the net profit attributable to the owners of the Parent by the weighted averagenumber of ordinary shares in issue during the year, excluding ordinary shares purchased by the Group and held as own shares(note 23 (a)).
2009€'000
2008€'000
Profit attributable to owners of the Parent 112,676 78,399
Weighted average number of ordinary shares in issue 292,985,630 293,018,610
Basic earnings per share (cents per share) 38.46 26.76
DilutedDiluted earnings per share is calculated by adjusting the weighted average number of ordinary shares outstanding to assumeconversion of all dilutive potential ordinary shares. Share options are dilutive potential ordinary shares. In respect of share options, acalculation is performed to determine the number of shares that could have been acquired at fair value (determined as the averageannual market share price of the Company’s shares) based on the monetary value of the subscription rights attached to outstandingshare options. The number of shares calculated as above is compared with the number of shares that would have been issuedassuming the exercise of the share options.
2009€'000
2008€'000
Weighted average number of ordinary shares in issue 292,985,630 293,018,610
Adjustments for share options 830,517 1,356,809
Adjusted weighted average number of ordinary shares 293,816,147 294,375,419
Diluted earnings per share (cents per share) 38.35 26.63
AdjustedAdjusted earnings per share is calculated on the net profit attributable to owners of the Parent, before net exceptional items andintangible asset amortisation (net of related tax). Adjusted earnings per share is considered to be more reflective of the Group’s overallunderlying performance.
2009€'000
2008€'000
Profit attributable to owners of the Parent 112,676 78,399
Amortisation of intangible assets (net of related tax) 12,126 7,312
Net exceptional items (34,905) 19,358
Adjusted net income 89,897 105,069
Adjusted earnings per share (cents per share) 30.68 35.86
Diluted adjusted earnings per share (cents per share) 30.60 35.69
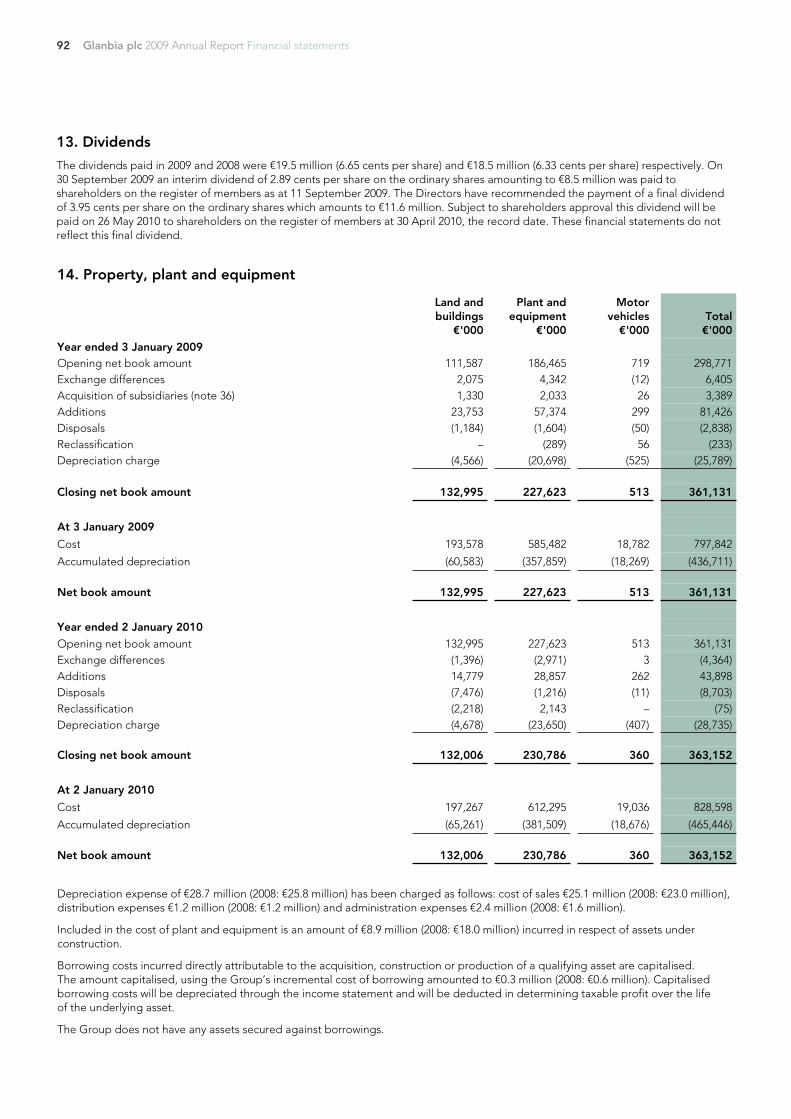
92 Glanbia plc 2009 Annual Report Financial statements
13. Dividends
The dividends paid in 2009 and 2008 were €19.5 million (6.65 cents per share) and €18.5 million (6.33 cents per share) respectively. On30 September 2009 an interim dividend of 2.89 cents per share on the ordinary shares amounting to €8.5 million was paid toshareholders on the register of members as at 11 September 2009. The Directors have recommended the payment of a final dividendof 3.95 cents per share on the ordinary shares which amounts to €11.6 million. Subject to shareholders approval this dividend will bepaid on 26 May 2010 to shareholders on the register of members at 30 April 2010, the record date. These financial statements do notreflect this final dividend.
14. Property, plant and equipment
Land andbuildings
€'000
Plant andequipment
€'000
Motorvehicles
€'000Total€'000
Year ended 3 January 2009Opening net book amount 111,587 186,465 719 298,771Exchange differences 2,075 4,342 (12) 6,405Acquisition of subsidiaries (note 36) 1,330 2,033 26 3,389Additions 23,753 57,374 299 81,426Disposals (1,184) (1,604) (50) (2,838)Reclassification – (289) 56 (233)Depreciation charge (4,566) (20,698) (525) (25,789)
Closing net book amount 132,995 227,623 513 361,131
At 3 January 2009
Cost 193,578 585,482 18,782 797,842
Accumulated depreciation (60,583) (357,859) (18,269) (436,711)
Net book amount 132,995 227,623 513 361,131
Year ended 2 January 2010Opening net book amount 132,995 227,623 513 361,131Exchange differences (1,396) (2,971) 3 (4,364)Additions 14,779 28,857 262 43,898Disposals (7,476) (1,216) (11) (8,703)Reclassification (2,218) 2,143 – (75)Depreciation charge (4,678) (23,650) (407) (28,735)
Closing net book amount 132,006 230,786 360 363,152
At 2 January 2010
Cost 197,267 612,295 19,036 828,598
Accumulated depreciation (65,261) (381,509) (18,676) (465,446)
Net book amount 132,006 230,786 360 363,152
Depreciation expense of €28.7 million (2008: €25.8 million) has been charged as follows: cost of sales €25.1 million (2008: €23.0 million),distribution expenses €1.2 million (2008: €1.2 million) and administration expenses €2.4 million (2008: €1.6 million).
Included in the cost of plant and equipment is an amount of €8.9 million (2008: €18.0 million) incurred in respect of assets underconstruction.
Borrowing costs incurred directly attributable to the acquisition, construction or production of a qualifying asset are capitalised.The amount capitalised, using the Group’s incremental cost of borrowing amounted to €0.3 million (2008: €0.6 million). Capitalisedborrowing costs will be depreciated through the income statement and will be deducted in determining taxable profit over the lifeof the underlying asset.
The Group does not have any assets secured against borrowings.
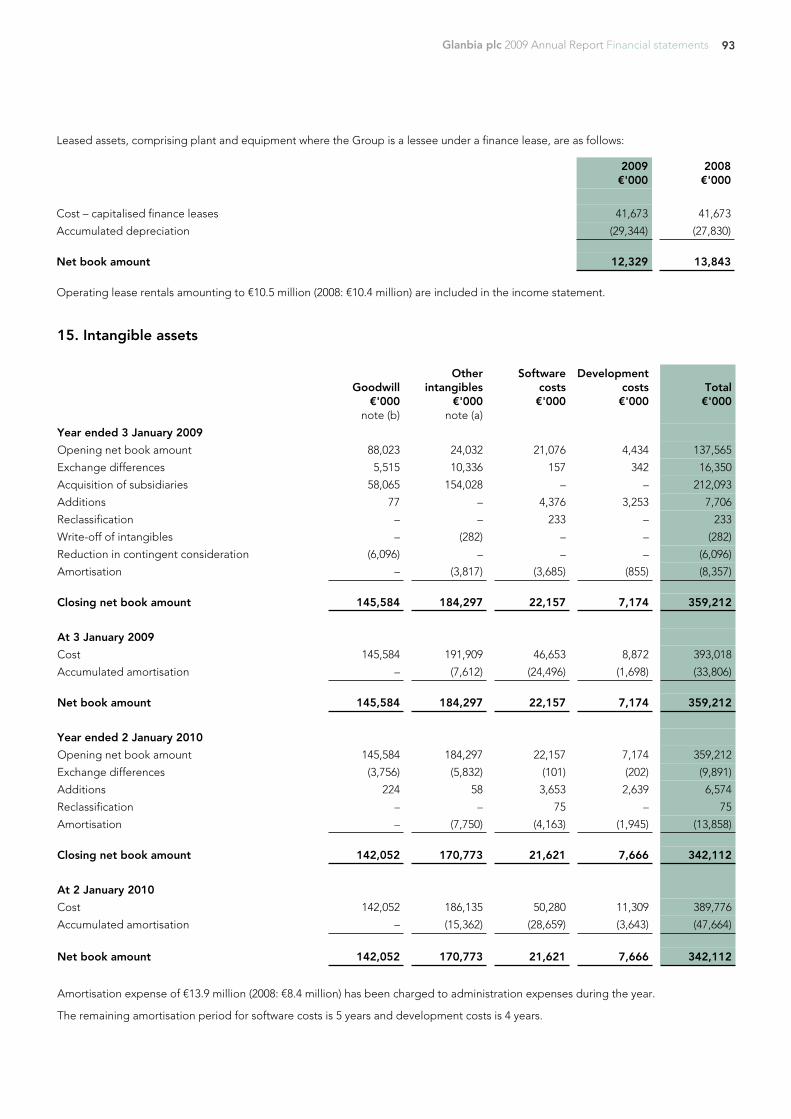
93Glanbia plc 2009 Annual Report Financial statements
Leased assets, comprising plant and equipment where the Group is a lessee under a finance lease, are as follows:
2009€'000
2008€'000
Cost – capitalised finance leases 41,673 41,673
Accumulated depreciation (29,344) (27,830)
Net book amount 12,329 13,843
Operating lease rentals amounting to €10.5 million (2008: €10.4 million) are included in the income statement.
15. Intangible assets
Goodwill€'000
note (b)
Otherintangibles
€'000note (a)
Softwarecosts€'000
Developmentcosts€'000
Total€'000
Year ended 3 January 2009
Opening net book amount 88,023 24,032 21,076 4,434 137,565
Exchange differences 5,515 10,336 157 342 16,350
Acquisition of subsidiaries 58,065 154,028 – – 212,093
Additions 77 – 4,376 3,253 7,706
Reclassification – – 233 – 233
Write-off of intangibles – (282) – – (282)
Reduction in contingent consideration (6,096) – – – (6,096)
Amortisation – (3,817) (3,685) (855) (8,357)
Closing net book amount 145,584 184,297 22,157 7,174 359,212
At 3 January 2009
Cost 145,584 191,909 46,653 8,872 393,018
Accumulated amortisation – (7,612) (24,496) (1,698) (33,806)
Net book amount 145,584 184,297 22,157 7,174 359,212
Year ended 2 January 2010
Opening net book amount 145,584 184,297 22,157 7,174 359,212
Exchange differences (3,756) (5,832) (101) (202) (9,891)
Additions 224 58 3,653 2,639 6,574
Reclassification – – 75 – 75
Amortisation – (7,750) (4,163) (1,945) (13,858)
Closing net book amount 142,052 170,773 21,621 7,666 342,112
At 2 January 2010
Cost 142,052 186,135 50,280 11,309 389,776
Accumulated amortisation – (15,362) (28,659) (3,643) (47,664)
Net book amount 142,052 170,773 21,621 7,666 342,112
Amortisation expense of €13.9 million (2008: €8.4 million) has been charged to administration expenses during the year.
The remaining amortisation period for software costs is 5 years and development costs is 4 years.
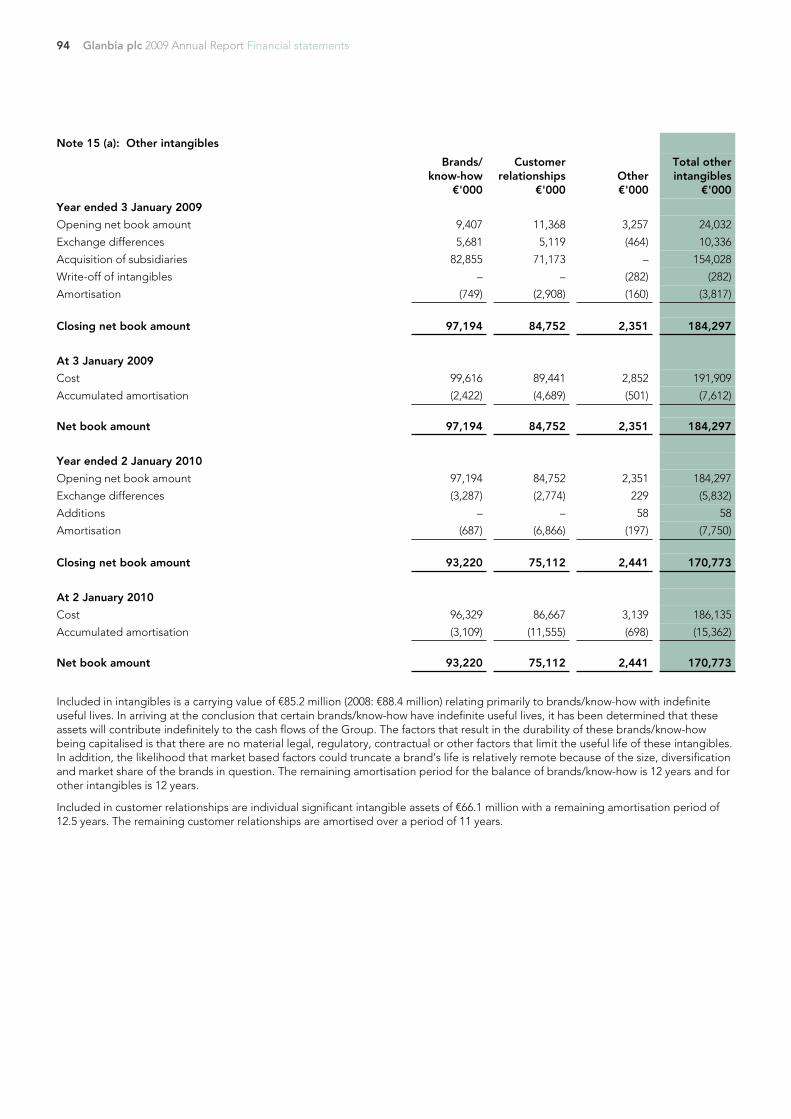
94 Glanbia plc 2009 Annual Report Financial statements
Note 15 (a): Other intangibles
Brands/know-how
€'000
Customerrelationships
€'000Other€'000
Total otherintangibles
€'000
Year ended 3 January 2009
Opening net book amount 9,407 11,368 3,257 24,032
Exchange differences 5,681 5,119 (464) 10,336
Acquisition of subsidiaries 82,855 71,173 – 154,028
Write-off of intangibles – – (282) (282)
Amortisation (749) (2,908) (160) (3,817)
Closing net book amount 97,194 84,752 2,351 184,297
At 3 January 2009
Cost 99,616 89,441 2,852 191,909
Accumulated amortisation (2,422) (4,689) (501) (7,612)
Net book amount 97,194 84,752 2,351 184,297
Year ended 2 January 2010
Opening net book amount 97,194 84,752 2,351 184,297
Exchange differences (3,287) (2,774) 229 (5,832)
Additions – – 58 58
Amortisation (687) (6,866) (197) (7,750)
Closing net book amount 93,220 75,112 2,441 170,773
At 2 January 2010
Cost 96,329 86,667 3,139 186,135
Accumulated amortisation (3,109) (11,555) (698) (15,362)
Net book amount 93,220 75,112 2,441 170,773
Included in intangibles is a carrying value of €85.2 million (2008: €88.4 million) relating primarily to brands/know-how with indefiniteuseful lives. In arriving at the conclusion that certain brands/know-how have indefinite useful lives, it has been determined that theseassets will contribute indefinitely to the cash flows of the Group. The factors that result in the durability of these brands/know-howbeing capitalised is that there are no material legal, regulatory, contractual or other factors that limit the useful life of these intangibles.In addition, the likelihood that market based factors could truncate a brand’s life is relatively remote because of the size, diversificationand market share of the brands in question. The remaining amortisation period for the balance of brands/know-how is 12 years and forother intangibles is 12 years.
Included in customer relationships are individual significant intangible assets of €66.1 million with a remaining amortisation period of12.5 years. The remaining customer relationships are amortised over a period of 11 years.
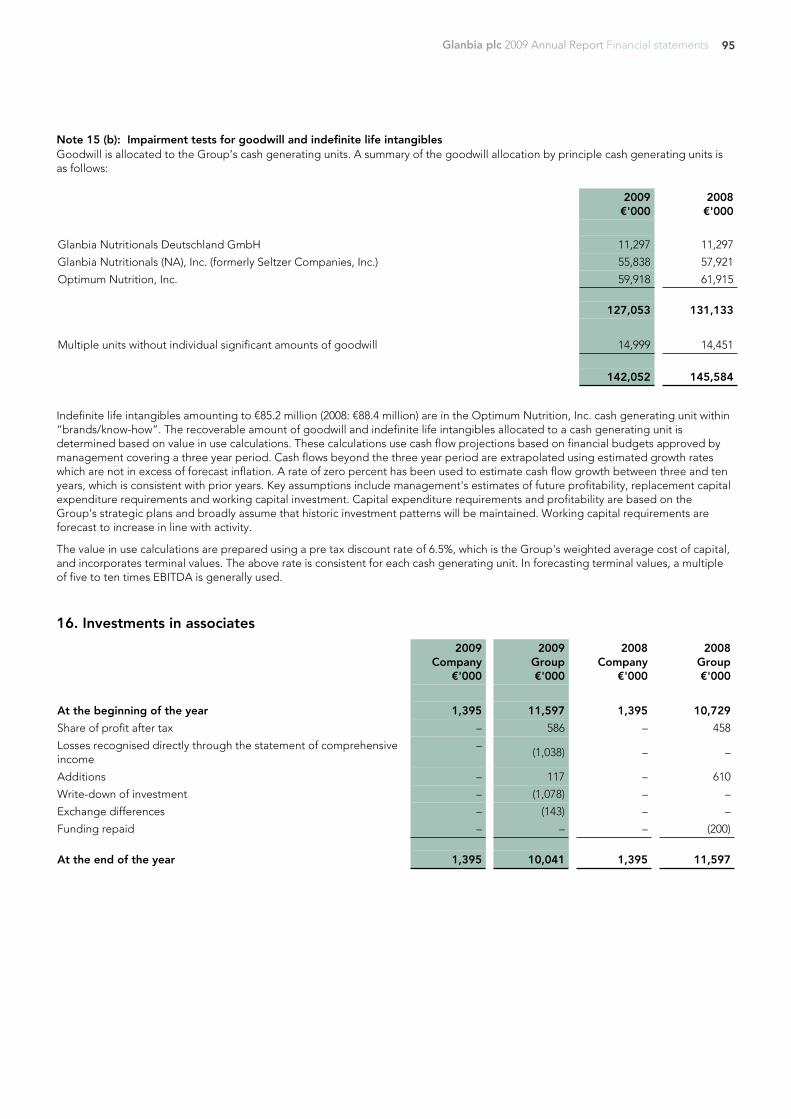
95Glanbia plc 2009 Annual Report Financial statements
Note 15 (b): Impairment tests for goodwill and indefinite life intangiblesGoodwill is allocated to the Group’s cash generating units. A summary of the goodwill allocation by principle cash generating units isas follows:
2009€'000
2008€'000
Glanbia Nutritionals Deutschland GmbH 11,297 11,297
Glanbia Nutritionals (NA), Inc. (formerly Seltzer Companies, Inc.) 55,838 57,921
Optimum Nutrition, Inc. 59,918 61,915
127,053 131,133
Multiple units without individual significant amounts of goodwill 14,999 14,451
142,052 145,584
Indefinite life intangibles amounting to €85.2 million (2008: €88.4 million) are in the Optimum Nutrition, Inc. cash generating unit within“brands/know-how”. The recoverable amount of goodwill and indefinite life intangibles allocated to a cash generating unit isdetermined based on value in use calculations. These calculations use cash flow projections based on financial budgets approved bymanagement covering a three year period. Cash flows beyond the three year period are extrapolated using estimated growth rateswhich are not in excess of forecast inflation. A rate of zero percent has been used to estimate cash flow growth between three and tenyears, which is consistent with prior years. Key assumptions include management's estimates of future profitability, replacement capitalexpenditure requirements and working capital investment. Capital expenditure requirements and profitability are based on theGroup's strategic plans and broadly assume that historic investment patterns will be maintained. Working capital requirements areforecast to increase in line with activity.
The value in use calculations are prepared using a pre tax discount rate of 6.5%, which is the Group's weighted average cost of capital,and incorporates terminal values. The above rate is consistent for each cash generating unit. In forecasting terminal values, a multipleof five to ten times EBITDA is generally used.
16. Investments in associates
2009Company
€'000
2009Group€'000
2008Company
€'000
2008Group€'000
At the beginning of the year 1,395 11,597 1,395 10,729
Share of profit after tax – 586 – 458
Losses recognised directly through the statement of comprehensiveincome
–(1,038) – –
Additions – 117 – 610
Write-down of investment – (1,078) – –
Exchange differences – (143) – –
Funding repaid – – – (200)
At the end of the year 1,395 10,041 1,395 11,597
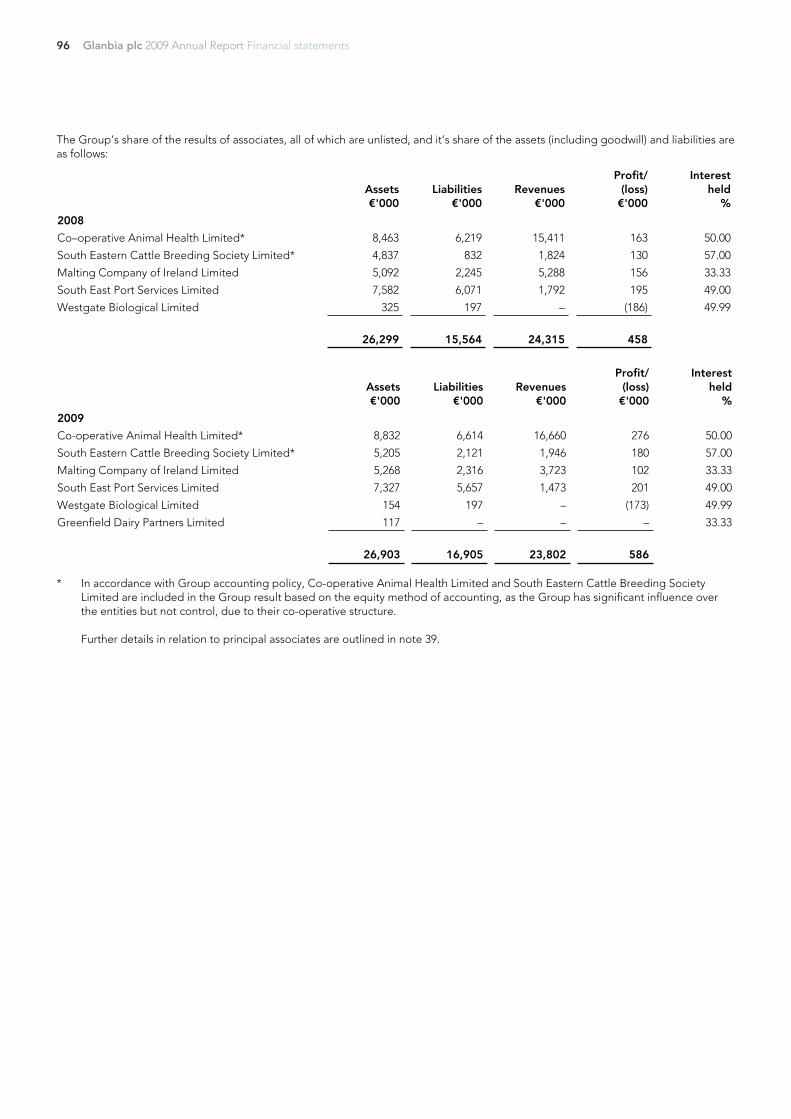
96 Glanbia plc 2009 Annual Report Financial statements
The Group’s share of the results of associates, all of which are unlisted, and it’s share of the assets (including goodwill) and liabilities areas follows:
Assets€'000
Liabilities€'000
Revenues€'000
Profit/(loss)
€'000
Interestheld
%
2008
Co–operative Animal Health Limited* 8,463 6,219 15,411 163 50.00
South Eastern Cattle Breeding Society Limited* 4,837 832 1,824 130 57.00
Malting Company of Ireland Limited 5,092 2,245 5,288 156 33.33
South East Port Services Limited 7,582 6,071 1,792 195 49.00
Westgate Biological Limited 325 197 – (186) 49.99
26,299 15,564 24,315 458
Assets€'000
Liabilities€'000
Revenues€'000
Profit/(loss)
€'000
Interestheld
%
2009
Co-operative Animal Health Limited* 8,832 6,614 16,660 276 50.00
South Eastern Cattle Breeding Society Limited* 5,205 2,121 1,946 180 57.00
Malting Company of Ireland Limited 5,268 2,316 3,723 102 33.33
South East Port Services Limited 7,327 5,657 1,473 201 49.00
Westgate Biological Limited 154 197 – (173) 49.99
Greenfield Dairy Partners Limited 117 – – – 33.33
26,903 16,905 23,802 586
* In accordance with Group accounting policy, Co-operative Animal Health Limited and South Eastern Cattle Breeding SocietyLimited are included in the Group result based on the equity method of accounting, as the Group has significant influence overthe entities but not control, due to their co-operative structure.
Further details in relation to principal associates are outlined in note 39.
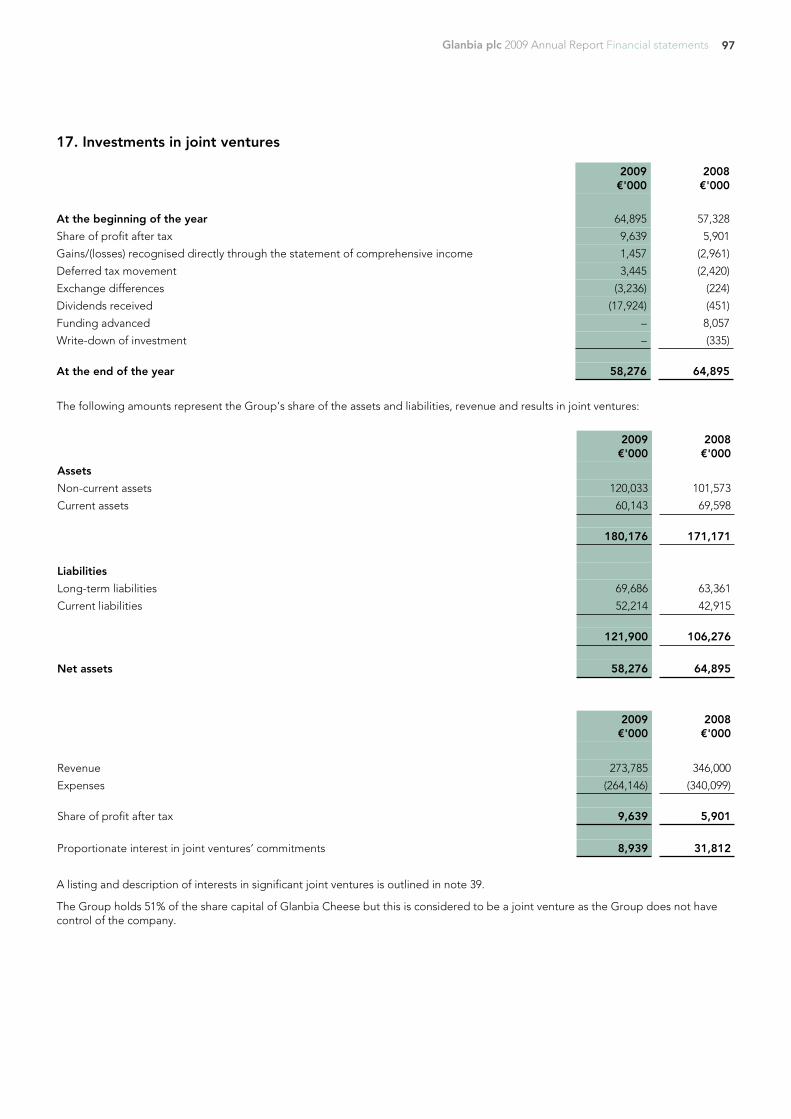
97Glanbia plc 2009 Annual Report Financial statements
17. Investments in joint ventures
2009€'000
2008€'000
At the beginning of the year 64,895 57,328
Share of profit after tax 9,639 5,901
Gains/(losses) recognised directly through the statement of comprehensive income 1,457 (2,961)
Deferred tax movement 3,445 (2,420)
Exchange differences (3,236) (224)
Dividends received (17,924) (451)
Funding advanced – 8,057
Write-down of investment – (335)
At the end of the year 58,276 64,895
The following amounts represent the Group’s share of the assets and liabilities, revenue and results in joint ventures:
2009€'000
2008€'000
Assets
Non-current assets 120,033 101,573
Current assets 60,143 69,598
180,176 171,171
Liabilities
Long-term liabilities 69,686 63,361
Current liabilities 52,214 42,915
121,900 106,276
Net assets 58,276 64,895
2009€'000
2008€'000
Revenue 273,785 346,000
Expenses (264,146) (340,099)
Share of profit after tax 9,639 5,901
Proportionate interest in joint ventures’ commitments 8,939 31,812
A listing and description of interests in significant joint ventures is outlined in note 39.
The Group holds 51% of the share capital of Glanbia Cheese but this is considered to be a joint venture as the Group does not havecontrol of the company.
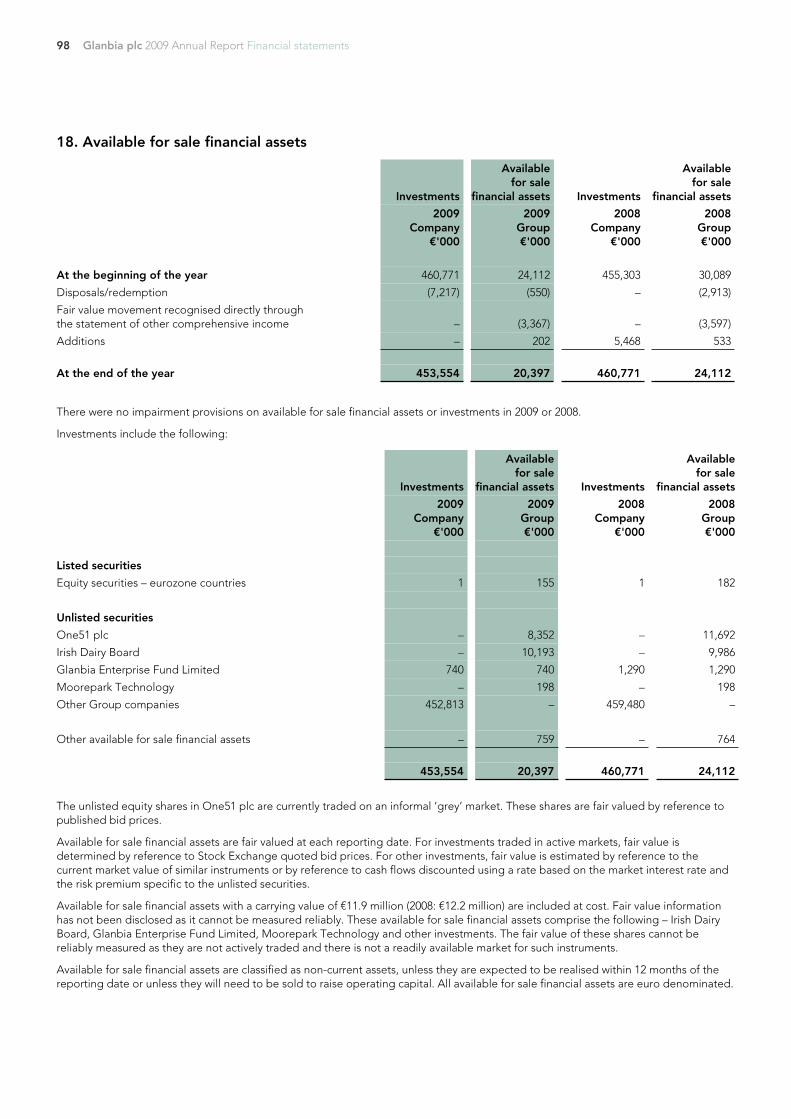
98 Glanbia plc 2009 Annual Report Financial statements
18. Available for sale financial assets
Investments
Availablefor sale
financial assets Investments
Availablefor sale
financial assets
2009Company
€'000
2009Group€'000
2008Company
€'000
2008Group€'000
At the beginning of the year 460,771 24,112 455,303 30,089
Disposals/redemption (7,217) (550) – (2,913)
Fair value movement recognised directly throughthe statement of other comprehensive income – (3,367) – (3,597)
Additions – 202 5,468 533
At the end of the year 453,554 20,397 460,771 24,112
There were no impairment provisions on available for sale financial assets or investments in 2009 or 2008.
Investments include the following:
Investments
Availablefor sale
financial assets Investments
Availablefor sale
financial assets
2009Company
€'000
2009Group€'000
2008Company
€'000
2008Group€'000
Listed securities
Equity securities – eurozone countries 1 155 1 182
Unlisted securities
One51 plc – 8,352 – 11,692
Irish Dairy Board – 10,193 – 9,986
Glanbia Enterprise Fund Limited 740 740 1,290 1,290
Moorepark Technology – 198 – 198
Other Group companies 452,813 – 459,480 –
Other available for sale financial assets – 759 – 764
453,554 20,397 460,771 24,112
The unlisted equity shares in One51 plc are currently traded on an informal ‘grey’ market. These shares are fair valued by reference topublished bid prices.
Available for sale financial assets are fair valued at each reporting date. For investments traded in active markets, fair value isdetermined by reference to Stock Exchange quoted bid prices. For other investments, fair value is estimated by reference to thecurrent market value of similar instruments or by reference to cash flows discounted using a rate based on the market interest rate andthe risk premium specific to the unlisted securities.
Available for sale financial assets with a carrying value of €11.9 million (2008: €12.2 million) are included at cost. Fair value informationhas not been disclosed as it cannot be measured reliably. These available for sale financial assets comprise the following – Irish DairyBoard, Glanbia Enterprise Fund Limited, Moorepark Technology and other investments. The fair value of these shares cannot bereliably measured as they are not actively traded and there is not a readily available market for such instruments.
Available for sale financial assets are classified as non-current assets, unless they are expected to be realised within 12 months of thereporting date or unless they will need to be sold to raise operating capital. All available for sale financial assets are euro denominated.
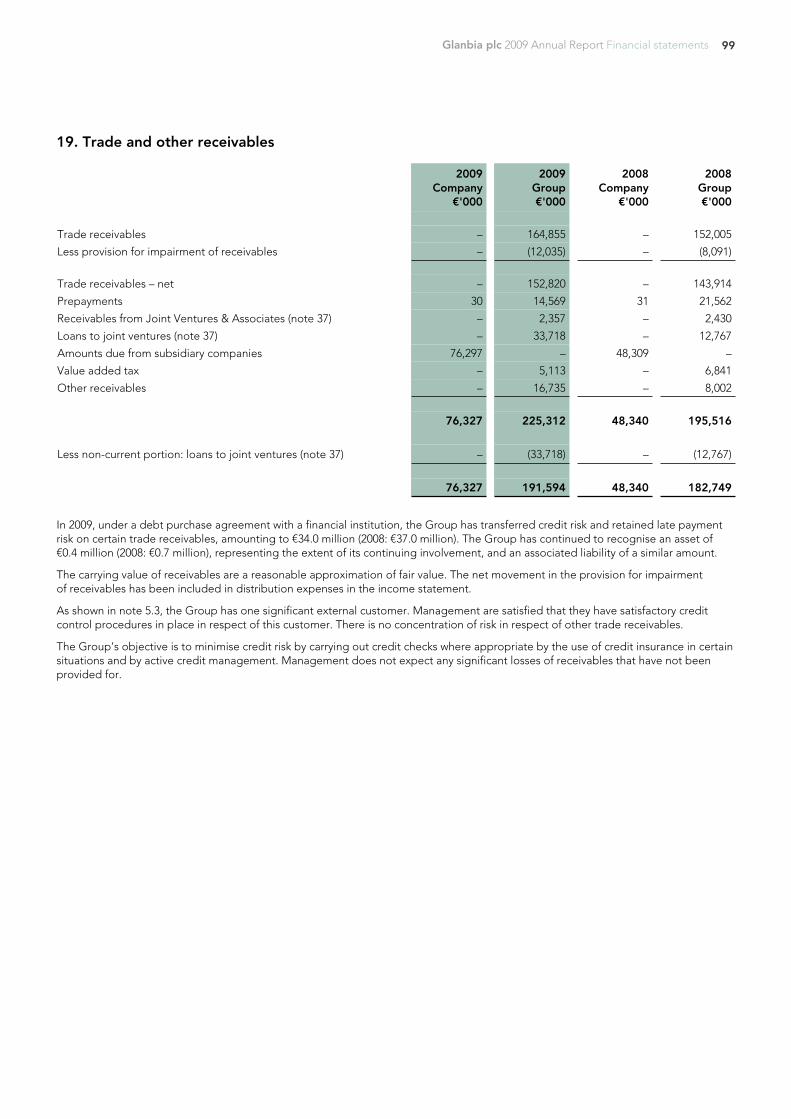
99Glanbia plc 2009 Annual Report Financial statements
19. Trade and other receivables
2009Company
€'000
2009Group€'000
2008Company
€'000
2008Group€'000
Trade receivables – 164,855 – 152,005
Less provision for impairment of receivables – (12,035) – (8,091)
Trade receivables – net – 152,820 – 143,914
Prepayments 30 14,569 31 21,562
Receivables from Joint Ventures & Associates (note 37) – 2,357 – 2,430
Loans to joint ventures (note 37) – 33,718 – 12,767
Amounts due from subsidiary companies 76,297 – 48,309 –
Value added tax – 5,113 – 6,841
Other receivables – 16,735 – 8,002
76,327 225,312 48,340 195,516
Less non-current portion: loans to joint ventures (note 37) – (33,718) – (12,767)
76,327 191,594 48,340 182,749
In 2009, under a debt purchase agreement with a financial institution, the Group has transferred credit risk and retained late paymentrisk on certain trade receivables, amounting to €34.0 million (2008: €37.0 million). The Group has continued to recognise an asset of€0.4 million (2008: €0.7 million), representing the extent of its continuing involvement, and an associated liability of a similar amount.
The carrying value of receivables are a reasonable approximation of fair value. The net movement in the provision for impairmentof receivables has been included in distribution expenses in the income statement.
As shown in note 5.3, the Group has one significant external customer. Management are satisfied that they have satisfactory creditcontrol procedures in place in respect of this customer. There is no concentration of risk in respect of other trade receivables.
The Group’s objective is to minimise credit risk by carrying out credit checks where appropriate by the use of credit insurance in certainsituations and by active credit management. Management does not expect any significant losses of receivables that have not beenprovided for.
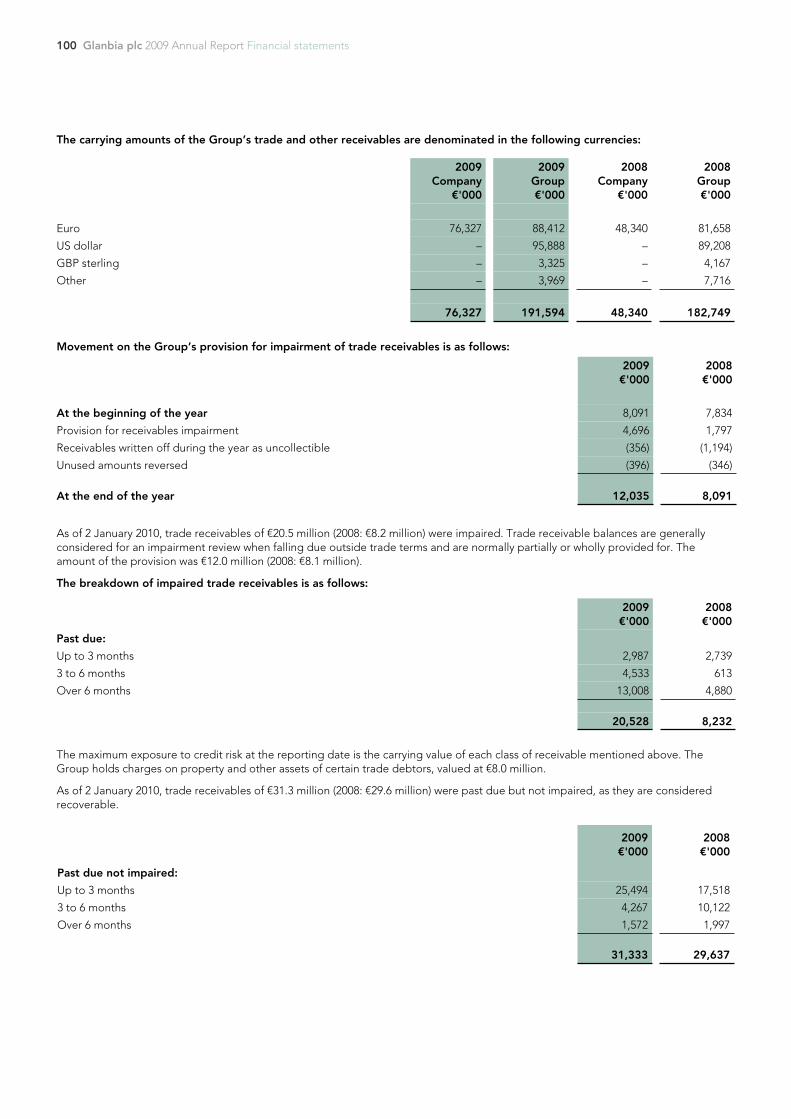
100 Glanbia plc 2009 Annual Report Financial statements
The carrying amounts of the Group’s trade and other receivables are denominated in the following currencies:
2009Company
€'000
2009Group€'000
2008Company
€'000
2008Group€'000
Euro 76,327 88,412 48,340 81,658
US dollar – 95,888 – 89,208
GBP sterling – 3,325 – 4,167
Other – 3,969 – 7,716
76,327 191,594 48,340 182,749
Movement on the Group’s provision for impairment of trade receivables is as follows:
2009€'000
2008€'000
At the beginning of the year 8,091 7,834
Provision for receivables impairment 4,696 1,797
Receivables written off during the year as uncollectible (356) (1,194)
Unused amounts reversed (396) (346)
At the end of the year 12,035 8,091
As of 2 January 2010, trade receivables of €20.5 million (2008: €8.2 million) were impaired. Trade receivable balances are generallyconsidered for an impairment review when falling due outside trade terms and are normally partially or wholly provided for. Theamount of the provision was €12.0 million (2008: €8.1 million).
The breakdown of impaired trade receivables is as follows:
2009€'000
2008€'000
Past due:
Up to 3 months 2,987 2,739
3 to 6 months 4,533 613
Over 6 months 13,008 4,880
20,528 8,232
The maximum exposure to credit risk at the reporting date is the carrying value of each class of receivable mentioned above. TheGroup holds charges on property and other assets of certain trade debtors, valued at €8.0 million.
As of 2 January 2010, trade receivables of €31.3 million (2008: €29.6 million) were past due but not impaired, as they are consideredrecoverable.
2009€'000
2008€'000
Past due not impaired:
Up to 3 months 25,494 17,518
3 to 6 months 4,267 10,122
Over 6 months 1,572 1,997
31,333 29,637
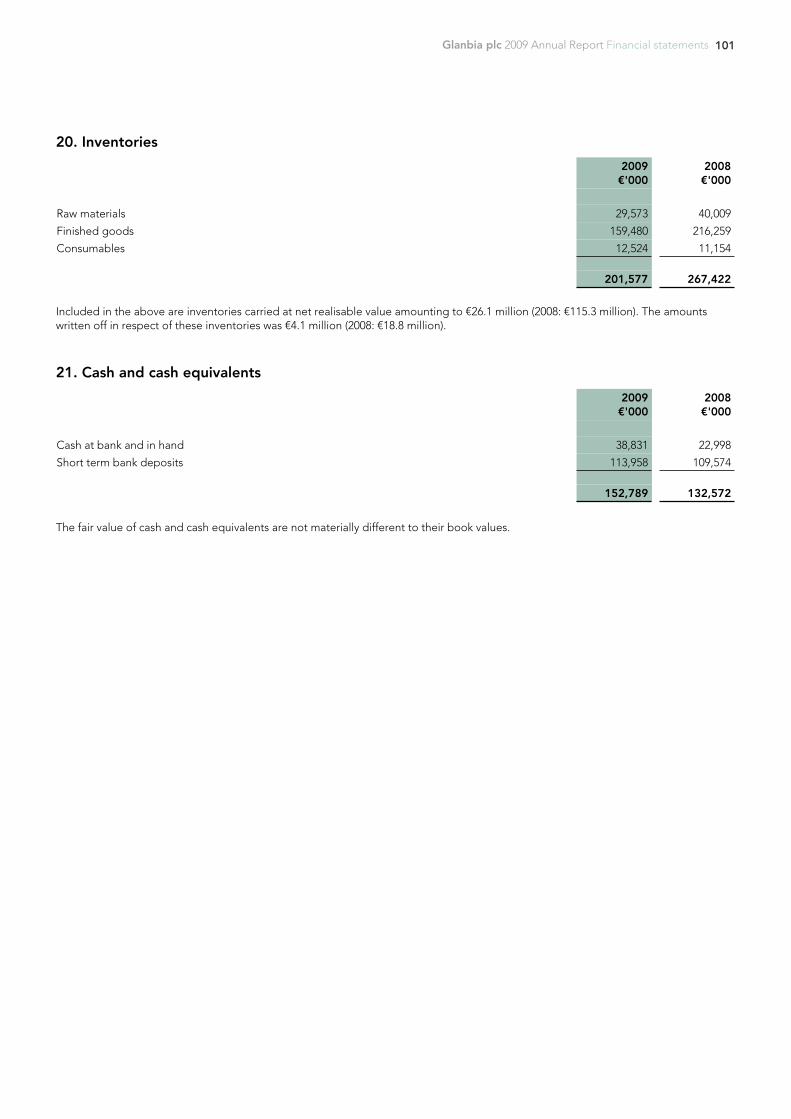
101Glanbia plc 2009 Annual Report Financial statements
20. Inventories
2009€'000
2008€'000
Raw materials 29,573 40,009
Finished goods 159,480 216,259
Consumables 12,524 11,154
201,577 267,422
21. Cash and cash equivalents
2009€'000
2008€'000
Cash at bank and in hand 38,831 22,998
Short term bank deposits 113,958 109,574
152,789 132,572
The fair value of cash and cash equivalents are not materially different to their book values.
Included in the above are inventories carried at net realisable value amounting to €26.1 million (2008: €115.3 million). The amountswritten off in respect of these inventories was €4.1 million (2008: €18.8 million).
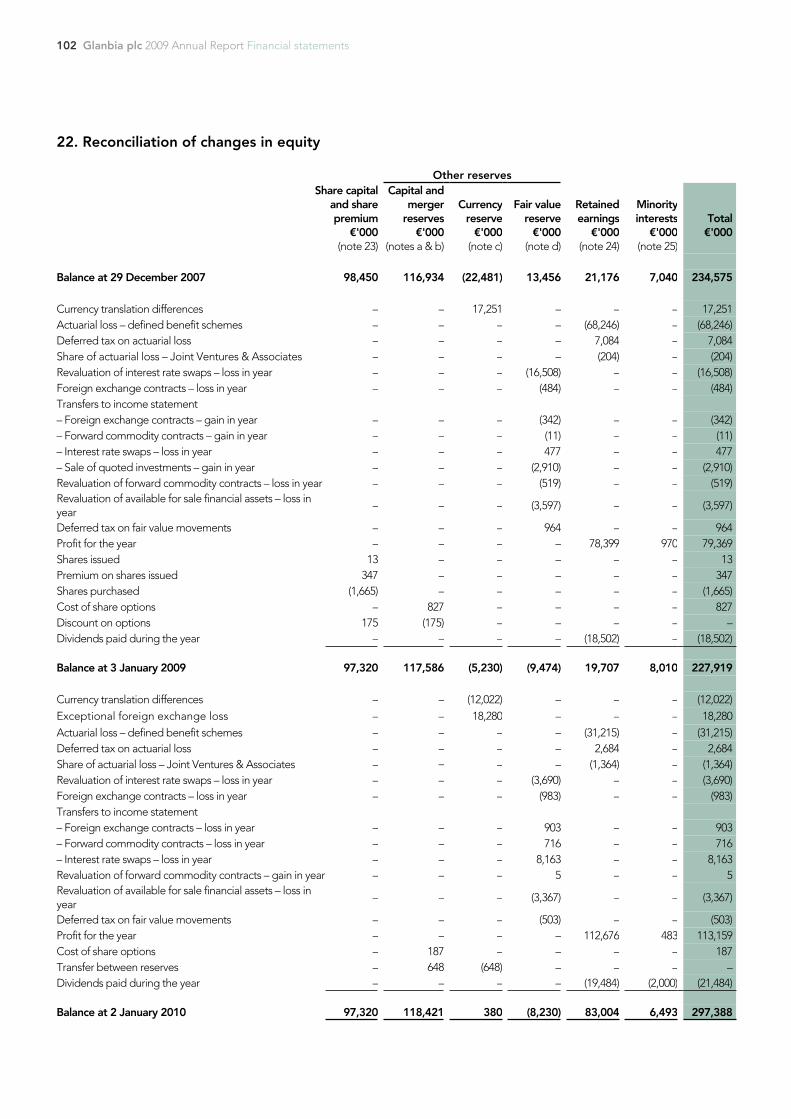
102 Glanbia plc 2009 Annual Report Financial statements
22. Reconciliation of changes in equity
Other reservesShare capital
and share premium
€'000(note 23)
Capital andmerger
reserves€'000
(notes a & b)
Currencyreserve
€'000(note c)
Fair valuereserve
€'000(note d)
Retainedearnings
€'000(note 24)
Minorityinterests
€'000(note 25)
Total€'000
Balance at 29 December 2007 98,450 116,934 (22,481) 13,456 21,176 7,040 234,575
Currency translation differences – – 17,251 – – – 17,251Actuarial loss – defined benefit schemes – – – – (68,246) – (68,246)Deferred tax on actuarial loss – – – – 7,084 – 7,084Share of actuarial loss – Joint Ventures & Associates – – – – (204) – (204)Revaluation of interest rate swaps – loss in year – – – (16,508) – – (16,508)Foreign exchange contracts – loss in year – – – (484) – – (484)Transfers to income statement– Foreign exchange contracts – gain in year – – – (342) – – (342)– Forward commodity contracts – gain in year – – – (11) – – (11)– Interest rate swaps – loss in year – – – 477 – – 477– Sale of quoted investments – gain in year – – – (2,910) – – (2,910)Revaluation of forward commodity contracts – loss in year – – – (519) – – (519)Revaluation of available for sale financial assets – loss inyear
– – – (3,597) – – (3,597)
Deferred tax on fair value movements – – – 964 – – 964Profit for the year – – – – 78,399 970 79,369Shares issued 13 – – – – – 13Premium on shares issued 347 – – – – – 347Shares purchased (1,665) – – – – – (1,665)Cost of share options – 827 – – – – 827Discount on options 175 (175) – – – – –Dividends paid during the year – – – – (18,502) – (18,502)
Balance at 3 January 2009 97,320 117,586 (5,230) (9,474) 19,707 8,010 227,919
Currency translation differences – – (12,022) – – – (12,022)Exceptional foreign exchange loss – – 18,280 – – – 18,280Actuarial loss – defined benefit schemes – – – – (31,215) – (31,215)Deferred tax on actuarial loss – – – – 2,684 – 2,684Share of actuarial loss – Joint Ventures & Associates – – – – (1,364) – (1,364)Revaluation of interest rate swaps – loss in year – – – (3,690) – – (3,690)Foreign exchange contracts – loss in year – – – (983) – – (983)Transfers to income statement– Foreign exchange contracts – loss in year – – – 903 – – 903– Forward commodity contracts – loss in year – – – 716 – – 716– Interest rate swaps – loss in year – – – 8,163 – – 8,163Revaluation of forward commodity contracts – gain in year – – – 5 – – 5Revaluation of available for sale financial assets – loss inyear
– – – (3,367) – – (3,367)
Deferred tax on fair value movements – – – (503) – – (503)Profit for the year – – – – 112,676 483 113,159Cost of share options – 187 – – – – 187Transfer between reserves – 648 (648) – – – –Dividends paid during the year – – – – (19,484) (2,000) (21,484)
Balance at 2 January 2010 97,320 118,421 380 (8,230) 83,004 6,493 297,388
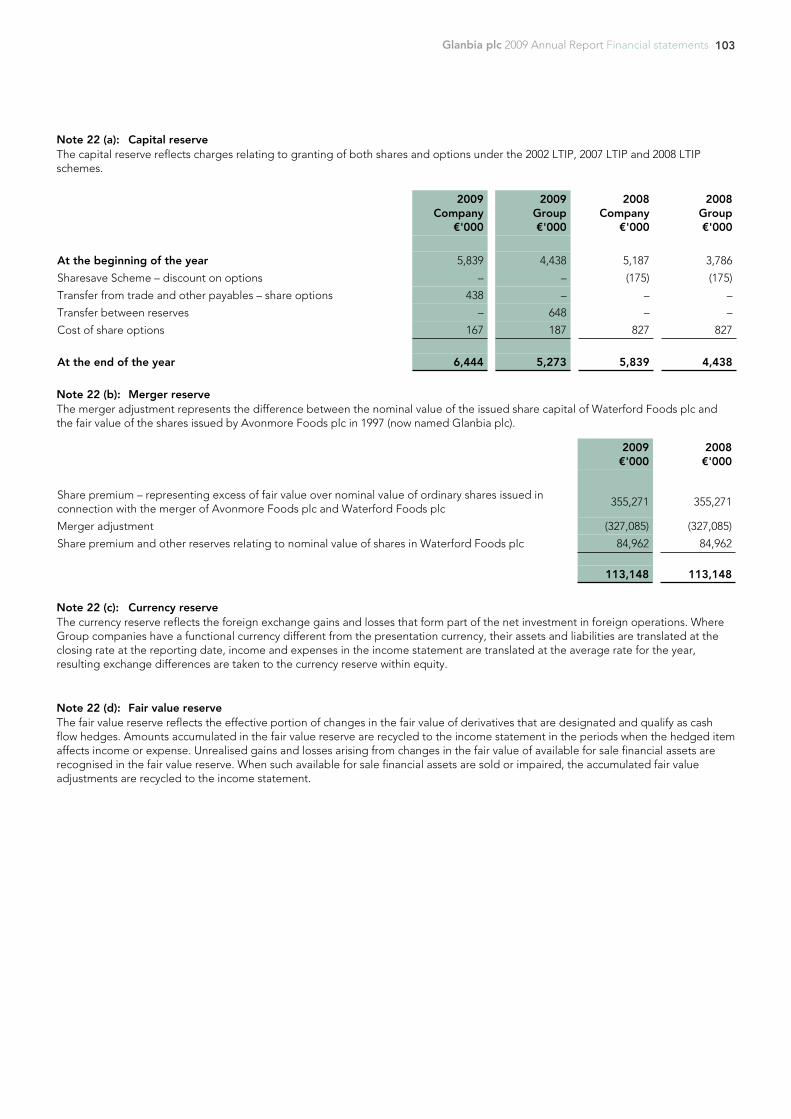
103Glanbia plc 2009 Annual Report Financial statements
Note 22 (a): Capital reserveThe capital reserve reflects charges relating to granting of both shares and options under the 2002 LTIP, 2007 LTIP and 2008 LTIPschemes.
2009Company
€'000
2009Group€'000
2008Company
€'000
2008Group€'000
At the beginning of the year 5,839 4,438 5,187 3,786
Sharesave Scheme – discount on options – – (175) (175)
Transfer from trade and other payables – share options 438 – – –
Transfer between reserves – 648 – –
Cost of share options 167 187 827 827
At the end of the year 6,444 5,273 5,839 4,438
2009€'000
2008€'000
Share premium – representing excess of fair value over nominal value of ordinary shares issued inconnection with the merger of Avonmore Foods plc and Waterford Foods plc
355,271 355,271
Merger adjustment (327,085) (327,085)
Share premium and other reserves relating to nominal value of shares in Waterford Foods plc 84,962 84,962
113,148 113,148
Note 22 (b): Merger reserveThe merger adjustment represents the difference between the nominal value of the issued share capital of Waterford Foods plc andthe fair value of the shares issued by Avonmore Foods plc in 1997 (now named Glanbia plc).
Note 22 (c): Currency reserveThe currency reserve reflects the foreign exchange gains and losses that form part of the net investment in foreign operations. WhereGroup companies have a functional currency different from the presentation currency, their assets and liabilities are translated at theclosing rate at the reporting date, income and expenses in the income statement are translated at the average rate for the year,resulting exchange differences are taken to the currency reserve within equity.
Note 22 (d): Fair value reserveThe fair value reserve reflects the effective portion of changes in the fair value of derivatives that are designated and qualify as cashflow hedges. Amounts accumulated in the fair value reserve are recycled to the income statement in the periods when the hedged itemaffects income or expense. Unrealised gains and losses arising from changes in the fair value of available for sale financial assets arerecognised in the fair value reserve. When such available for sale financial assets are sold or impaired, the accumulated fair valueadjustments are recycled to the income statement.
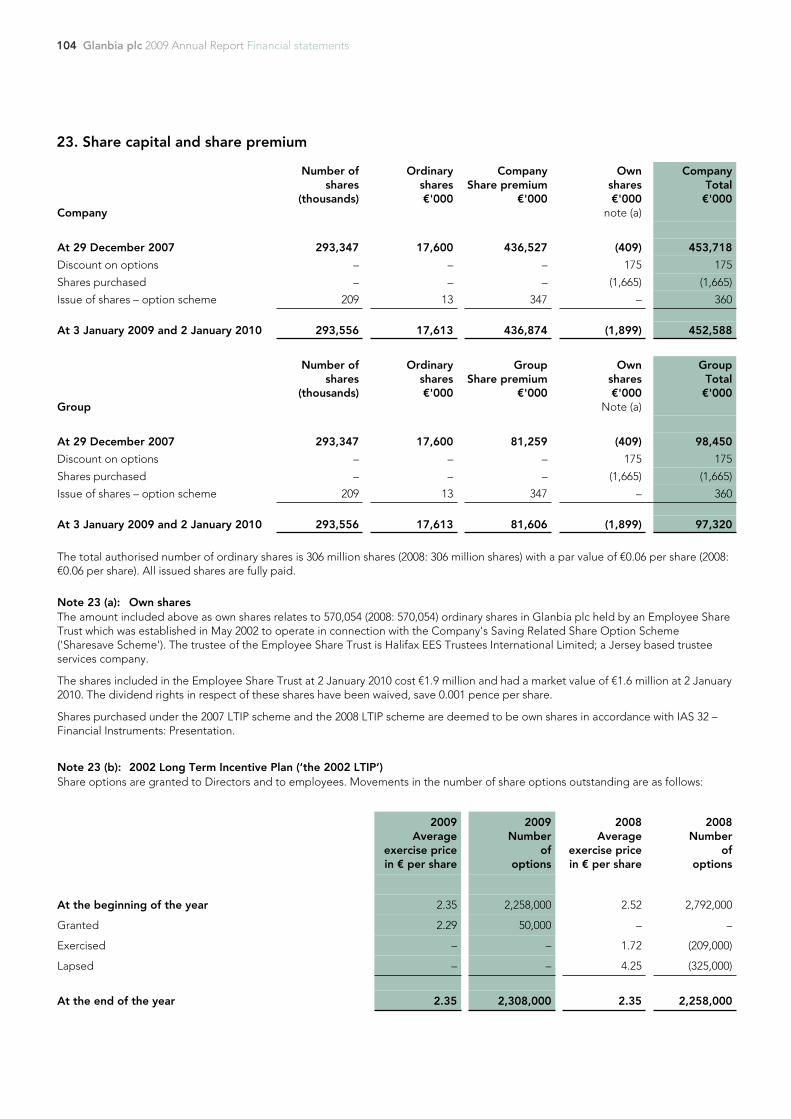
104 Glanbia plc 2009 Annual Report Financial statements
Company
Number ofshares
(thousands)
Ordinaryshares€'000
CompanyShare premium
€'000
Ownshares€'000
note (a)
CompanyTotal€'000
At 29 December 2007 293,347 17,600 436,527 (409) 453,718
Discount on options – – – 175 175
Shares purchased – – – (1,665) (1,665)
Issue of shares – option scheme 209 13 347 – 360
At 3 January 2009 and 2 January 2010 293,556 17,613 436,874 (1,899) 452,588
Group
Number ofshares
(thousands)
Ordinaryshares€'000
GroupShare premium
€'000
Ownshares€'000
Note (a)
GroupTotal€'000
At 29 December 2007 293,347 17,600 81,259 (409) 98,450
Discount on options – – – 175 175
Shares purchased – – – (1,665) (1,665)
Issue of shares – option scheme 209 13 347 – 360
At 3 January 2009 and 2 January 2010 293,556 17,613 81,606 (1,899) 97,320
23. Share capital and share premium
The total authorised number of ordinary shares is 306 million shares (2008: 306 million shares) with a par value of €0.06 per share (2008:€0.06 per share). All issued shares are fully paid.
Note 23 (a): Own sharesThe amount included above as own shares relates to 570,054 (2008: 570,054) ordinary shares in Glanbia plc held by an Employee ShareTrust which was established in May 2002 to operate in connection with the Company's Saving Related Share Option Scheme('Sharesave Scheme'). The trustee of the Employee Share Trust is Halifax EES Trustees International Limited; a Jersey based trusteeservices company.
The shares included in the Employee Share Trust at 2 January 2010 cost €1.9 million and had a market value of €1.6 million at 2 January2010. The dividend rights in respect of these shares have been waived, save 0.001 pence per share.
Shares purchased under the 2007 LTIP scheme and the 2008 LTIP scheme are deemed to be own shares in accordance with IAS 32 –Financial Instruments: Presentation.
Note 23 (b): 2002 Long Term Incentive Plan (‘the 2002 LTIP’)Share options are granted to Directors and to employees. Movements in the number of share options outstanding are as follows:
2009Average
exercise pricein € per share
2009Number
ofoptions
2008Average
exercise pricein € per share
2008Number
ofoptions
At the beginning of the year 2.35 2,258,000 2.52 2,792,000
Granted 2.29 50,000 – –
Exercised – – 1.72 (209,000)
Lapsed – – 4.25 (325,000)
At the end of the year 2.35 2,308,000 2.35 2,258,000
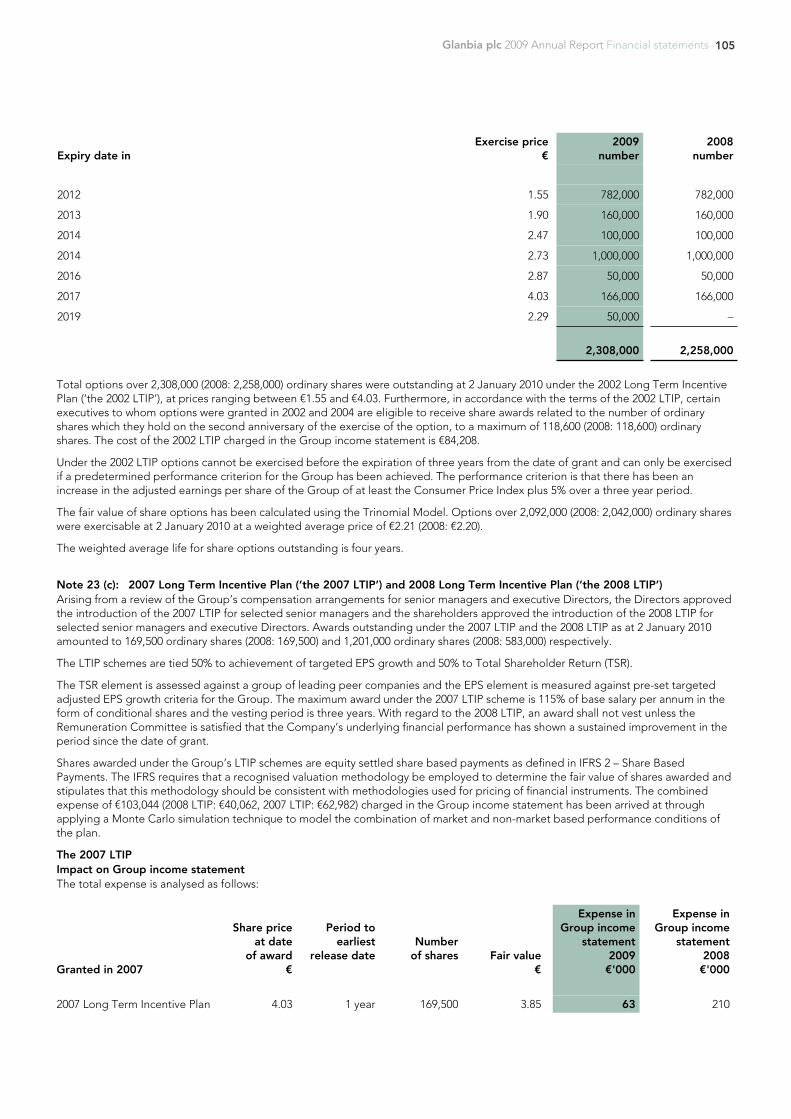
105Glanbia plc 2009 Annual Report Financial statements
Expiry date inExercise price
€2009
number2008
number
2012 1.55 782,000 782,000
2013 1.90 160,000 160,000
2014 2.47 100,000 100,000
2014 2.73 1,000,000 1,000,000
2016 2.87 50,000 50,000
2017 4.03 166,000 166,000
2019 2.29 50,000 –
2,308,000 2,258,000
Total options over 2,308,000 (2008: 2,258,000) ordinary shares were outstanding at 2 January 2010 under the 2002 Long Term IncentivePlan (‘the 2002 LTIP’), at prices ranging between €1.55 and €4.03. Furthermore, in accordance with the terms of the 2002 LTIP, certainexecutives to whom options were granted in 2002 and 2004 are eligible to receive share awards related to the number of ordinaryshares which they hold on the second anniversary of the exercise of the option, to a maximum of 118,600 (2008: 118,600) ordinaryshares. The cost of the 2002 LTIP charged in the Group income statement is €84,208.
Under the 2002 LTIP options cannot be exercised before the expiration of three years from the date of grant and can only be exercisedif a predetermined performance criterion for the Group has been achieved. The performance criterion is that there has been anincrease in the adjusted earnings per share of the Group of at least the Consumer Price Index plus 5% over a three year period.
The fair value of share options has been calculated using the Trinomial Model. Options over 2,092,000 (2008: 2,042,000) ordinary shareswere exercisable at 2 January 2010 at a weighted average price of €2.21 (2008: €2.20).
The weighted average life for share options outstanding is four years.
Note 23 (c): 2007 Long Term Incentive Plan (‘the 2007 LTIP’) and 2008 Long Term Incentive Plan (‘the 2008 LTIP’)Arising from a review of the Group’s compensation arrangements for senior managers and executive Directors, the Directors approvedthe introduction of the 2007 LTIP for selected senior managers and the shareholders approved the introduction of the 2008 LTIP forselected senior managers and executive Directors. Awards outstanding under the 2007 LTIP and the 2008 LTIP as at 2 January 2010amounted to 169,500 ordinary shares (2008: 169,500) and 1,201,000 ordinary shares (2008: 583,000) respectively.
The LTIP schemes are tied 50% to achievement of targeted EPS growth and 50% to Total Shareholder Return (TSR).
The TSR element is assessed against a group of leading peer companies and the EPS element is measured against pre-set targetedadjusted EPS growth criteria for the Group. The maximum award under the 2007 LTIP scheme is 115% of base salary per annum in theform of conditional shares and the vesting period is three years. With regard to the 2008 LTIP, an award shall not vest unless theRemuneration Committee is satisfied that the Company’s underlying financial performance has shown a sustained improvement in theperiod since the date of grant.
Shares awarded under the Group’s LTIP schemes are equity settled share based payments as defined in IFRS 2 – Share BasedPayments. The IFRS requires that a recognised valuation methodology be employed to determine the fair value of shares awarded andstipulates that this methodology should be consistent with methodologies used for pricing of financial instruments. The combinedexpense of €103,044 (2008 LTIP: €40,062, 2007 LTIP: €62,982) charged in the Group income statement has been arrived at throughapplying a Monte Carlo simulation technique to model the combination of market and non-market based performance conditions ofthe plan.
The 2007 LTIPImpact on Group income statementThe total expense is analysed as follows:
Granted in 2007
Share priceat date
of award€
Period toearliest
release dateNumber
of shares Fair value€
Expense inGroup income
statement2009€'000
Expense inGroup income
statement2008
€'000
2007 Long Term Incentive Plan 4.03 1 year 169,500 3.85 63 210
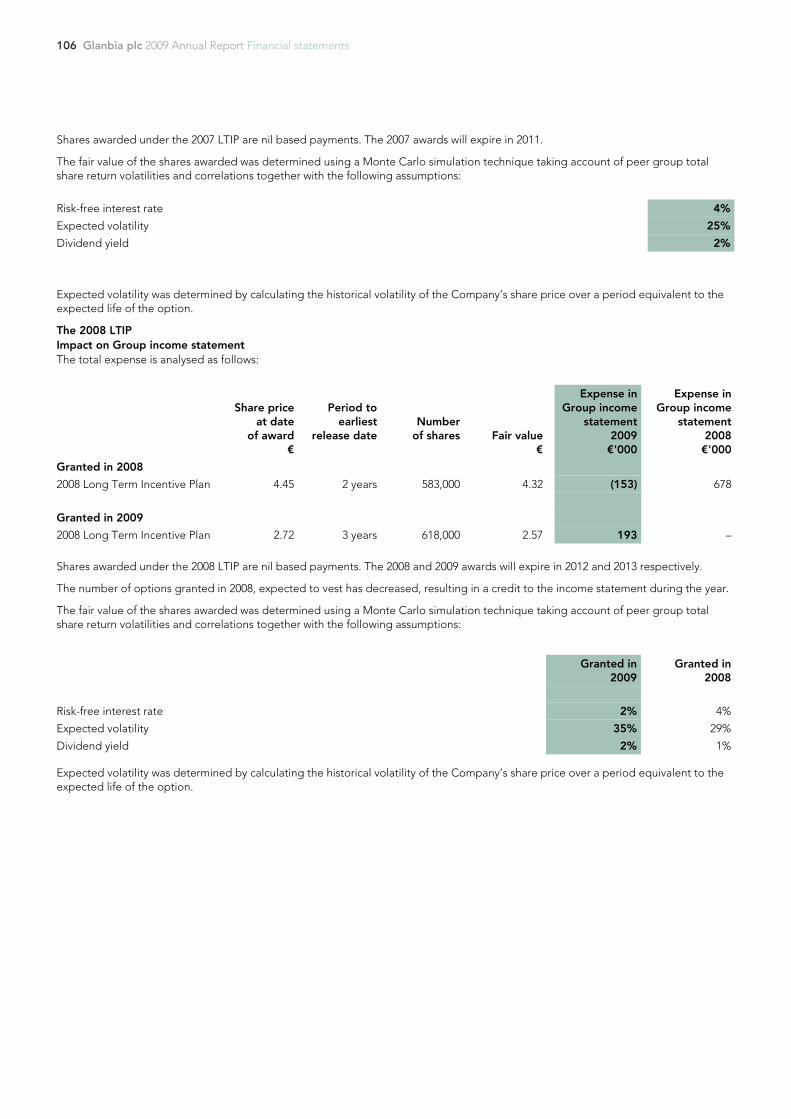
106 Glanbia plc 2009 Annual Report Financial statements
Shares awarded under the 2007 LTIP are nil based payments. The 2007 awards will expire in 2011.
The fair value of the shares awarded was determined using a Monte Carlo simulation technique taking account of peer group totalshare return volatilities and correlations together with the following assumptions:
Risk-free interest rate 4%
Expected volatility 25%
Dividend yield 2%
Expected volatility was determined by calculating the historical volatility of the Company’s share price over a period equivalent to theexpected life of the option.
The 2008 LTIPImpact on Group income statementThe total expense is analysed as follows:
Share priceat date
of award€
Period toearliest
release dateNumber
of shares Fair value€
Expense inGroup income
statement2009€'000
Expense inGroup income
statement2008€'000
Granted in 2008
2008 Long Term Incentive Plan 4.45 2 years 583,000 4.32 (153) 678
Granted in 2009
2008 Long Term Incentive Plan 2.72 3 years 618,000 2.57 193 –
Shares awarded under the 2008 LTIP are nil based payments. The 2008 and 2009 awards will expire in 2012 and 2013 respectively.
The number of options granted in 2008, expected to vest has decreased, resulting in a credit to the income statement during the year.
The fair value of the shares awarded was determined using a Monte Carlo simulation technique taking account of peer group totalshare return volatilities and correlations together with the following assumptions:
Granted in2009
Granted in2008
Risk-free interest rate 2% 4%
Expected volatility 35% 29%
Dividend yield 2% 1%
Expected volatility was determined by calculating the historical volatility of the Company’s share price over a period equivalent to theexpected life of the option.
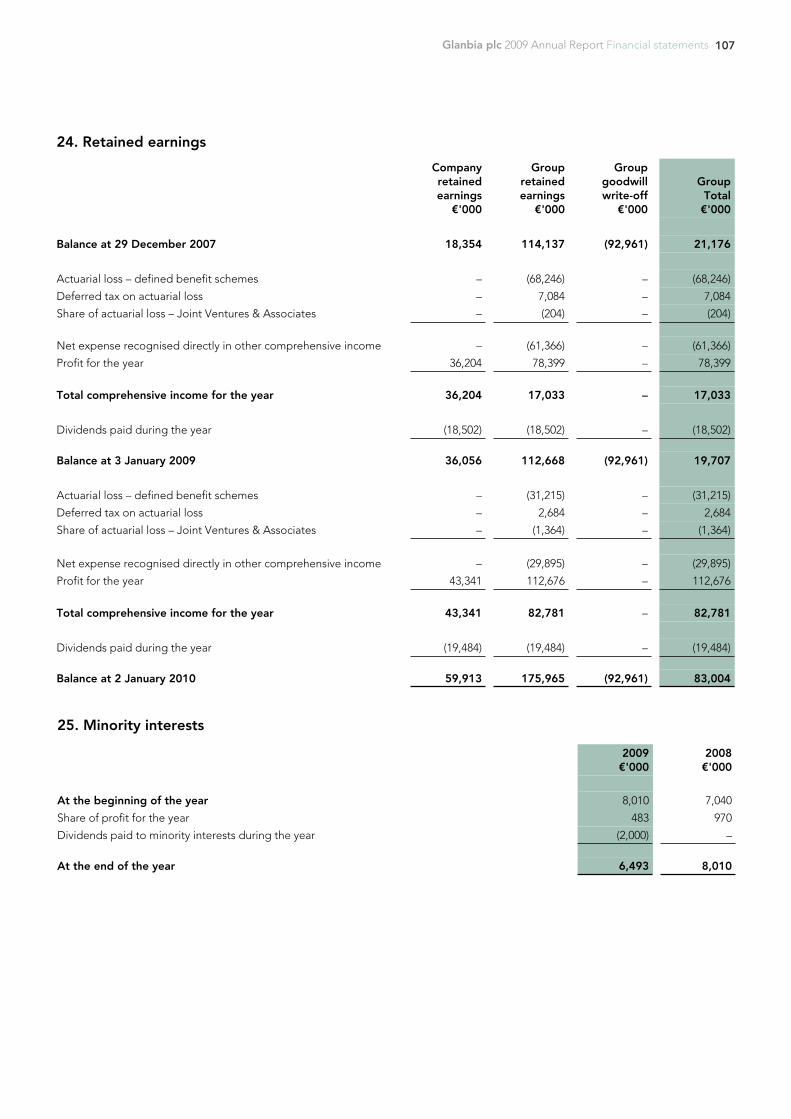
107Glanbia plc 2009 Annual Report Financial statements
24. Retained earnings
Companyretainedearnings
€'000
Groupretainedearnings
€'000
Groupgoodwillwrite-off
€'000
GroupTotal€'000
Balance at 29 December 2007 18,354 114,137 (92,961) 21,176
Actuarial loss – defined benefit schemes – (68,246) – (68,246)
Deferred tax on actuarial loss – 7,084 – 7,084
Share of actuarial loss – Joint Ventures & Associates – (204) – (204)
Net expense recognised directly in other comprehensive income – (61,366) – (61,366)
Profit for the year 36,204 78,399 – 78,399
Total comprehensive income for the year 36,204 17,033 – 17,033
Dividends paid during the year (18,502) (18,502) – (18,502)
Balance at 3 January 2009 36,056 112,668 (92,961) 19,707
Actuarial loss – defined benefit schemes – (31,215) – (31,215)
Deferred tax on actuarial loss – 2,684 – 2,684
Share of actuarial loss – Joint Ventures & Associates – (1,364) – (1,364)
Net expense recognised directly in other comprehensive income – (29,895) – (29,895)
Profit for the year 43,341 112,676 – 112,676
Total comprehensive income for the year 43,341 82,781 – 82,781
Dividends paid during the year (19,484) (19,484) – (19,484)
Balance at 2 January 2010 59,913 175,965 (92,961) 83,004
25. Minority interests
2009€'000
2008€'000
At the beginning of the year 8,010 7,040
Share of profit for the year 483 970
Dividends paid to minority interests during the year (2,000) –
At the end of the year 6,493 8,010
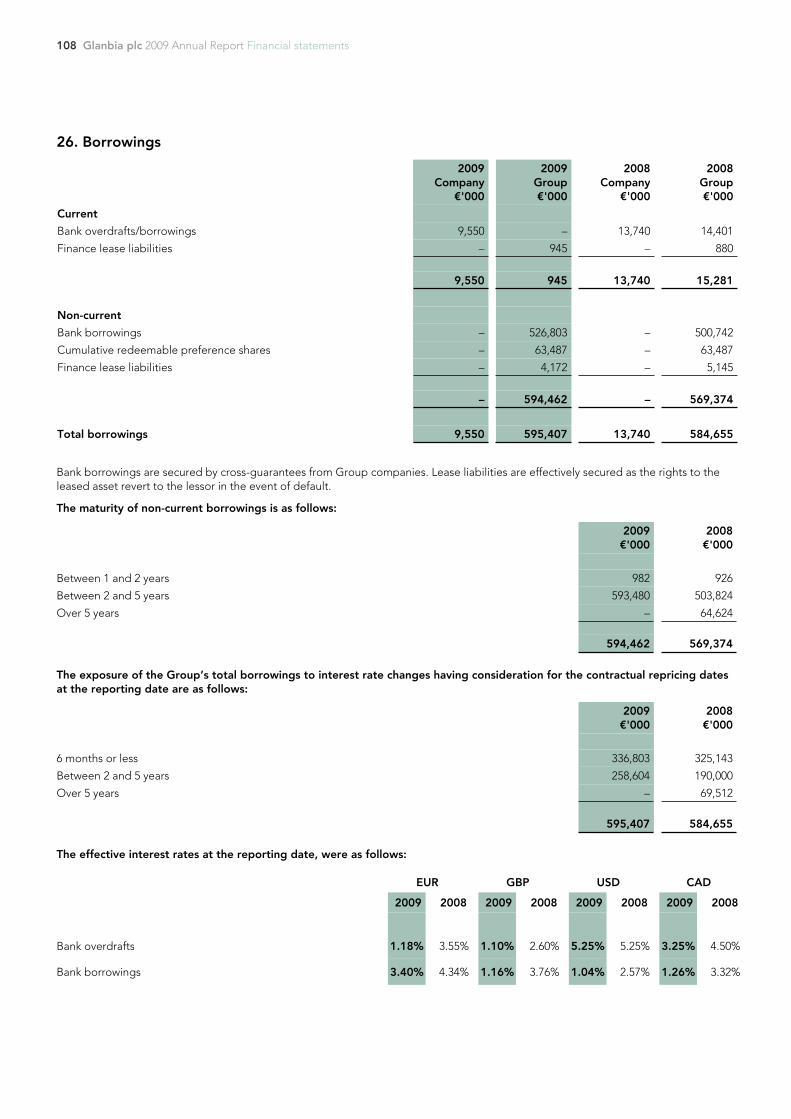
108 Glanbia plc 2009 Annual Report Financial statements
26. Borrowings
2009Company
€'000
2009Group€'000
2008Company
€'000
2008Group€'000
Current
Bank overdrafts/borrowings 9,550 – 13,740 14,401
Finance lease liabilities – 945 – 880
9,550 945 13,740 15,281
Non-current
Bank borrowings – 526,803 – 500,742
Cumulative redeemable preference shares – 63,487 – 63,487
Finance lease liabilities – 4,172 – 5,145
– 594,462 – 569,374
Total borrowings 9,550 595,407 13,740 584,655
Bank borrowings are secured by cross-guarantees from Group companies. Lease liabilities are effectively secured as the rights to theleased asset revert to the lessor in the event of default.
The maturity of non-current borrowings is as follows:
2009€'000
2008€'000
Between 1 and 2 years 982 926
Between 2 and 5 years 593,480 503,824
Over 5 years – 64,624
594,462 569,374
The exposure of the Group’s total borrowings to interest rate changes having consideration for the contractual repricing datesat the reporting date are as follows:
2009€'000
2008€'000
6 months or less 336,803 325,143
Between 2 and 5 years 258,604 190,000
Over 5 years – 69,512
595,407 584,655
The effective interest rates at the reporting date, were as follows:
EUR GBP USD CAD
2009 2008 2009 2008 2009 2008 2009 2008
Bank overdrafts 1.18% 3.55% 1.10% 2.60% 5.25% 5.25% 3.25% 4.50%
Bank borrowings 3.40% 4.34% 1.16% 3.76% 1.04% 2.57% 1.26% 3.32%
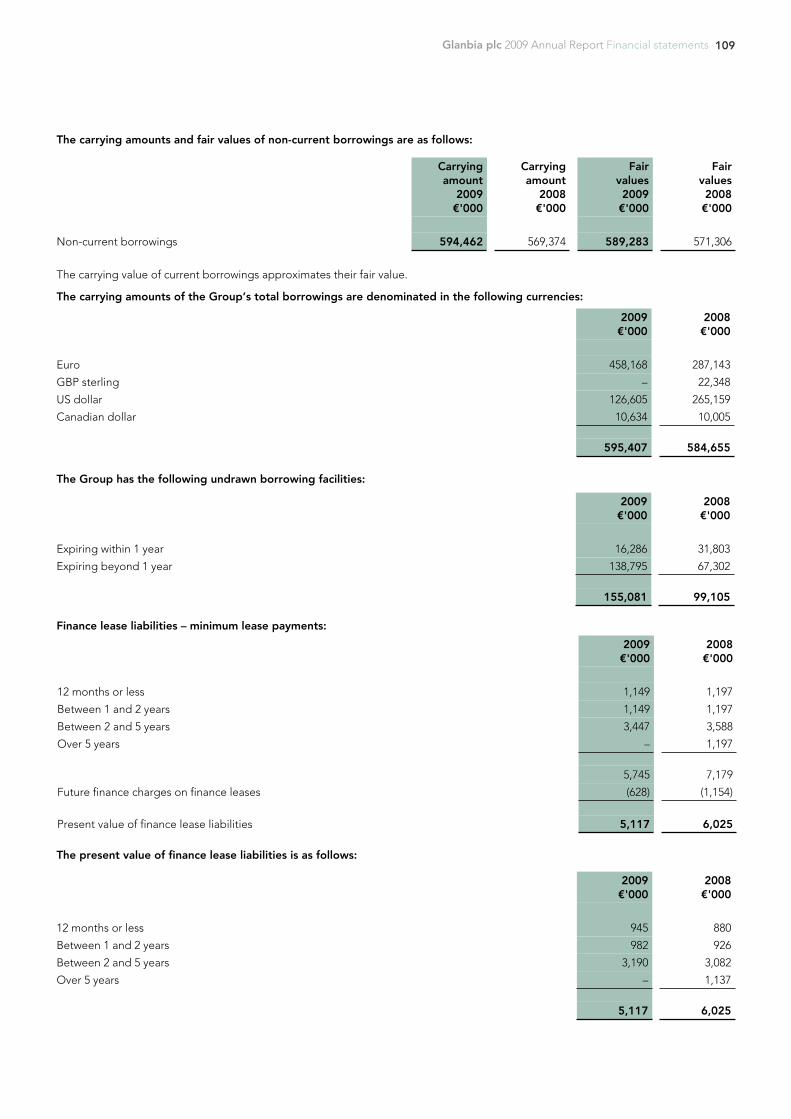
109Glanbia plc 2009 Annual Report Financial statements
The carrying amounts and fair values of non-current borrowings are as follows:
Carryingamount
2009€'000
Carryingamount
2008€'000
Fairvalues2009€'000
Fairvalues2008€'000
Non-current borrowings 594,462 569,374 589,283 571,306
The carrying value of current borrowings approximates their fair value.
The carrying amounts of the Group’s total borrowings are denominated in the following currencies:
2009€'000
2008€'000
Euro 458,168 287,143
GBP sterling – 22,348
US dollar 126,605 265,159
Canadian dollar 10,634 10,005
595,407 584,655
The Group has the following undrawn borrowing facilities:
2009€'000
2008€'000
Expiring within 1 year 16,286 31,803
Expiring beyond 1 year 138,795 67,302
155,081 99,105
Finance lease liabilities – minimum lease payments:
2009€'000
2008€'000
12 months or less 1,149 1,197
Between 1 and 2 years 1,149 1,197
Between 2 and 5 years 3,447 3,588
Over 5 years – 1,197
5,745 7,179
Future finance charges on finance leases (628) (1,154)
Present value of finance lease liabilities 5,117 6,025
The present value of finance lease liabilities is as follows:
2009€'000
2008€'000
12 months or less 945 880
Between 1 and 2 years 982 926
Between 2 and 5 years 3,190 3,082
Over 5 years – 1,137
5,117 6,025
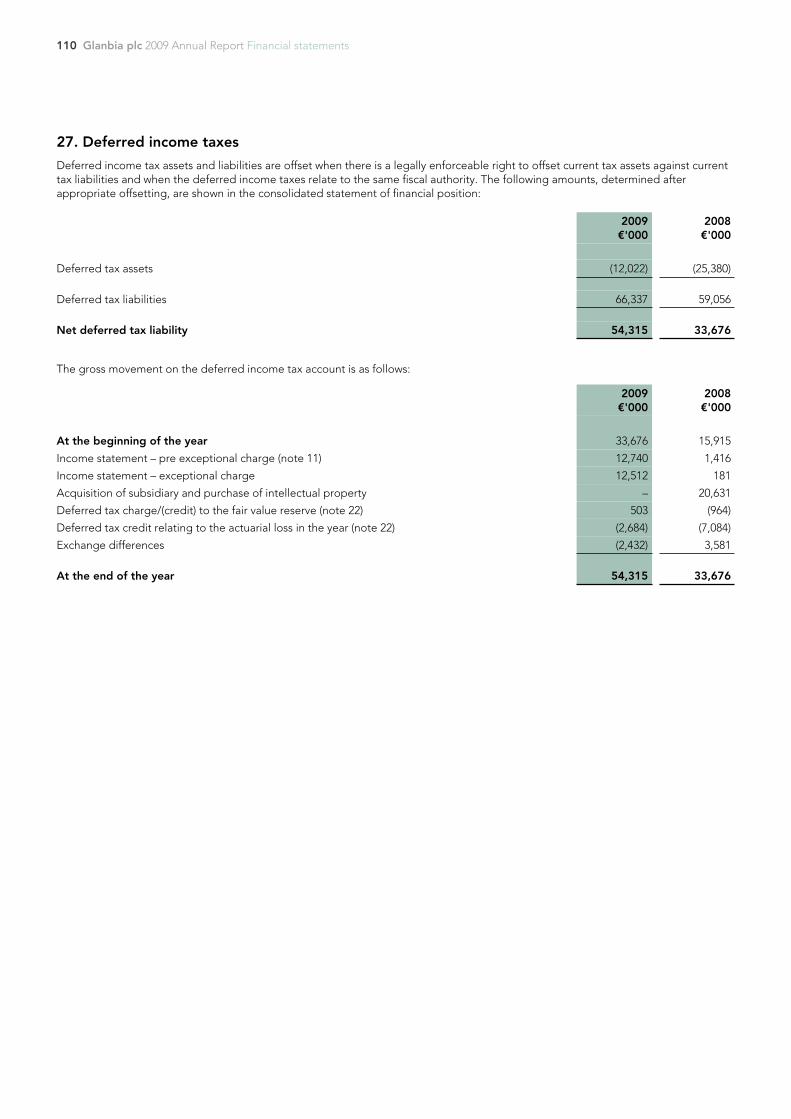
110 Glanbia plc 2009 Annual Report Financial statements
27. Deferred income taxes
Deferred income tax assets and liabilities are offset when there is a legally enforceable right to offset current tax assets against currenttax liabilities and when the deferred income taxes relate to the same fiscal authority. The following amounts, determined afterappropriate offsetting, are shown in the consolidated statement of financial position:
2009€'000
2008€'000
Deferred tax assets (12,022) (25,380)
Deferred tax liabilities 66,337 59,056
Net deferred tax liability 54,315 33,676
The gross movement on the deferred income tax account is as follows:
2009€'000
2008€'000
At the beginning of the year 33,676 15,915
Income statement – pre exceptional charge (note 11) 12,740 1,416
Income statement – exceptional charge 12,512 181
Acquisition of subsidiary and purchase of intellectual property – 20,631
Deferred tax charge/(credit) to the fair value reserve (note 22) 503 (964)
Deferred tax credit relating to the actuarial loss in the year (note 22) (2,684) (7,084)
Exchange differences (2,432) 3,581
At the end of the year 54,315 33,676
111Glanbia plc 2009 Annual Report Financial statements
The movement in deferred tax assets and liabilities during the year, without taking into consideration the offsetting of balances withinthe same tax jurisdiction, is as follows:
Deferred tax liabilities Acceleratedtax
depreciation€'000
Fair valuegains€'000
Deferreddevelopment
costs€'000
Other€'000
Total€'000
At 29 December 2007 26,653 3,933 532 6,469 37,587
(Credited)/charged to income statement (1,798) – 309 2,147 658
Credited to other comprehensive income (note 22) – (964) – – (964)
Acquisition of subsidiaries and intellectual property – – – 20,631 20,631
Exchange differences 831 – 45 268 1,144
At 3 January 2009 25,686 2,969 886 29,515 59,056
Charged/(credited) to income statement 9,271 – 130 (861) 8,540
Charged to other comprehensive income (note 22) – 503 – – 503
Exchange differences (787) – (20) (955) (1,762)
At 2 January 2010 34,170 3,472 996 27,699 66,337
Deferred tax assets Retirementobligations
€'000
Taxlosses€'000
Total€'000
At 29 December 2007 (11,199) (10,473) (21,672)
Charged/(credited) to income statement 1,196 (257) 939
Credited to other comprehensive income (note 22) (7,084) – (7,084)
Exchange differences – 2,437 2,437
At 3 January 2009 (17,087) (8,293) (25,380)
Charged to income statement 13,684 3,028 16,712
Credited to other comprehensive income (note 22) (2,684) – (2,684)
Exchange differences – (670) (670)
At 2 January 2010 (6,087) (5,935) (12,022)
The deferred tax credited to other comprehensive income during the year is as follows:
2009€'000
2008€'000
Fair value reserve in equity
– Available for sale financial assets (427) (752)
– Hedging reserve 930 (212)
Impact of increase in retirement benefit obligations due to actuarial loss (2,684) (7,084)
(2,181) (8,048)
The decrease in the retirement benefit obligation has given rise to a decrease in the related deferred tax asset. A deferred tax assethas been recognised on the basis that the realisation of the related tax benefit through future taxable profits is probable.
Deferred tax assets are recognised for tax losses carry forwards to the extent that realisation of the related tax benefit through futuretaxable profits is probable. The Group has unrecognised tax losses of €14.8 million (2008: €11.1 million) to carry forward against futuretaxable income. Deferred tax liabilities have not been recognised for withholding tax and other taxes that would be payable on theunremitted earnings of certain subsidiaries, associates and joint ventures.
112 Glanbia plc 2009 Annual Report Financial statements
28. Retirement benefit obligations
Pension benefitsThe Group operates a number of defined benefit and defined contribution schemes which provide retirement and death benefits forthe majority of employees. The schemes are funded through separate Trustee controlled funds.
The contributions paid to the defined benefit schemes are in accordance with the advice of professionally qualified actuaries. The latestactuarial valuation reports for these schemes, which are not available for public inspection, are dated between 1 October 2006 and 1January 2009. The contributions paid to the scheme in 2009 are in accordance with the contribution rates recommended in the actuarialvaluation reports.
The amounts recognised in the statement of financial position are determined as follows:
2009€'000
2008€'000
Present value of funded obligations (435,010) (465,909)
Fair value of plan assets 349,245 301,499
Liability in the Group statement of financial position (85,765) (164,410)
The amounts recognised in the Group income statement are as follows:
2009€'000
2008€'000
Service costs – current (5,515) (7,594)
Interest costs (23,635) (23,147)
Expected return on plan assets 16,383 22,828
Total expense pre curtailment (12,767) (7,913)
Exceptional item – curtailment gains and negative past service cost (note 7 and note 8) 100,098 376
Total gain/(loss) 87,331 (7,537)
Defined contribution (2,146) (1,719)
The actual return on plan assets was a profit of €28.7 million (2008: €81.4 million loss).
The movement in the liability recognised in the Group statement of financial position over the year is as follows:
2009€'000
2008€'000
At the beginning of the year (164,410) (114,248)
Exchange differences (1,821) 6,101
Movements relating to disposed operations (1,280) (500)
Total expense pre curtailment gains and negative past service costs (12,767) (7,913)
Curtailment gains and negative past service costs 100,098 376
Actuarial loss - defined benefit schemes (31,215) (68,246)
Contributions paid by employer 25,630 20,020
At the end of the year (85,765) (164,410)
113Glanbia plc 2009 Annual Report Financial statements
The movement in obligations during the year is as follows:
2009€'000
2008€'000
At the beginning of the year (465,909) (496,769)
Exchange differences (4,800) 17,833
Movements relating to disposed operations (4,131) (4,208)
Current service costs (5,515) (7,594)
Interest costs (23,635) (23,147)
Actuarial gains/(losses)
– Experience gains/(losses) 5,366 (3,175)
– Change in assumptions (48,895) 39,158
Contributions by plan participants (3,796) (4,163)
Curtailment gains and negative past service costs 100,098 376
Benefits paid 16,207 15,780
At the end of the year (435,010) (465,909)
The movement in the fair value of plan assets over the year is as follows:
2009€'000
2008€'000
At the beginning of the year 301,499 382,521
Exchange differences 2,979 (11,732)
Movements relating to disposed operations 2,851 3,708
Expected return on plan assets 16,383 22,828
Actuarial gain/(loss) 12,314 (104,229)
Contributions by plan participants 3,796 4,163
Contributions by employer 25,630 20,020
Benefits paid (16,207) (15,780)
At the end of the year 349,245 301,499
The principal actuarial assumptions used were as follows:
2009IRL
2009UK
2008IRL
2008UK
Discount rate 5.65% 5.80% 5.90% 6.60%
Expected return on plan assets
– Equities 7.75% 8.25% 8.25% 8.70%
– Corporate bonds 5.80% 5.80% 4.25% 6.70%
– Government bonds and gilts 4.45% 4.50% 4.25% 3.90%
– Cash 2.50% 4.10% 3.25% 3.50%
– Property 6.50% 8.00% 7.25% 7.80%
– Other assets 7.75% n/a 7.25% 7.80%
Inflation rate 2.25% 3.45% 2.50% 3.10%
Future salary increases 2.25%–3.25% 4.20% 3.50% 3.85%
Future pension increases 0%–3.50% 3.25% 1.50%–3.50% 3.00%
Cumulative actuarial losses:2009€'000
2008€'000
Actuarial loss for the year 31,215 68,246
Cumulative actuarial losses 155,206 123,991
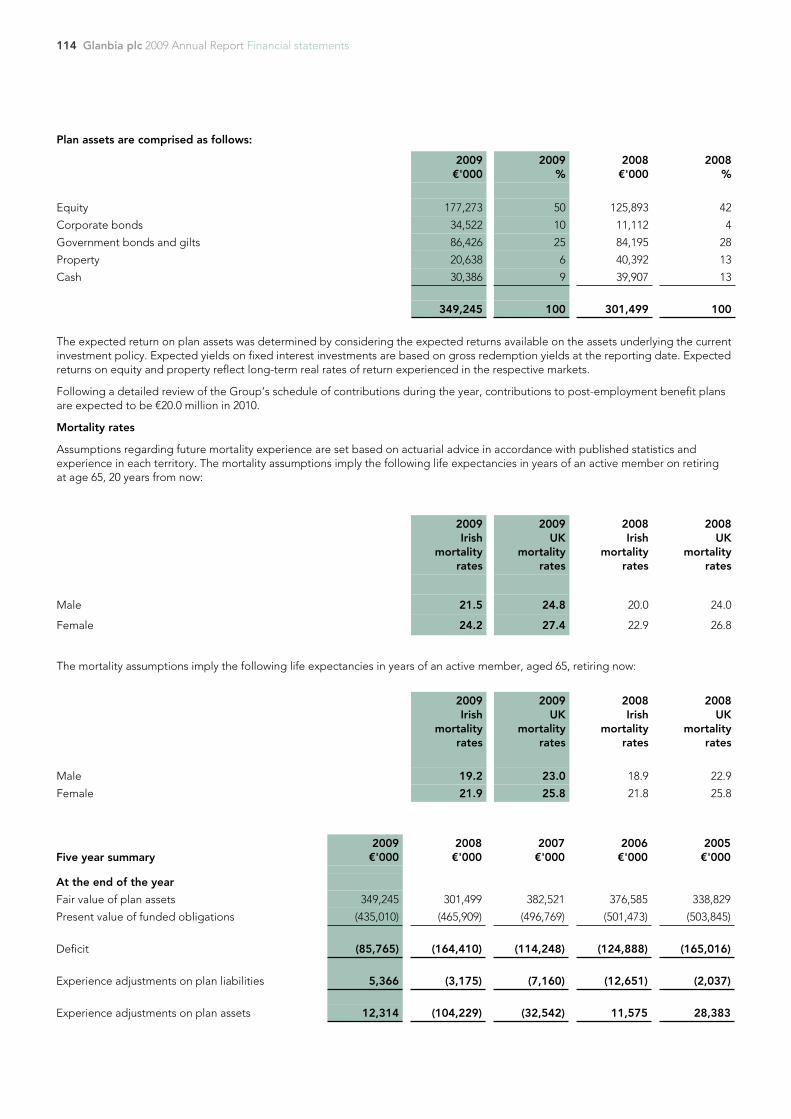
114 Glanbia plc 2009 Annual Report Financial statements
Plan assets are comprised as follows:
2009€'000
2009%
2008€'000
2008%
Equity 177,273 50 125,893 42
Corporate bonds 34,522 10 11,112 4
Government bonds and gilts 86,426 25 84,195 28
Property 20,638 6 40,392 13
Cash 30,386 9 39,907 13
349,245 100 301,499 100
The expected return on plan assets was determined by considering the expected returns available on the assets underlying the currentinvestment policy. Expected yields on fixed interest investments are based on gross redemption yields at the reporting date. Expectedreturns on equity and property reflect long-term real rates of return experienced in the respective markets.
Following a detailed review of the Group’s schedule of contributions during the year, contributions to post-employment benefit plansare expected to be €20.0 million in 2010.
Mortality rates
Assumptions regarding future mortality experience are set based on actuarial advice in accordance with published statistics andexperience in each territory. The mortality assumptions imply the following life expectancies in years of an active member on retiringat age 65, 20 years from now:
2009Irish
mortalityrates
2009UK
mortalityrates
2008Irish
mortalityrates
2008UK
mortalityrates
Male 21.5 24.8 20.0 24.0
Female 24.2 27.4 22.9 26.8
The mortality assumptions imply the following life expectancies in years of an active member, aged 65, retiring now:
2009Irish
mortalityrates
2009UK
mortalityrates
2008Irish
mortalityrates
2008UK
mortalityrates
Male 19.2 23.0 18.9 22.9
Female 21.9 25.8 21.8 25.8
Five year summary2009€'000
2008€'000
2007€'000
2006€'000
2005€'000
At the end of the year
Fair value of plan assets 349,245 301,499 382,521 376,585 338,829
Present value of funded obligations (435,010) (465,909) (496,769) (501,473) (503,845)
Deficit (85,765) (164,410) (114,248) (124,888) (165,016)
Experience adjustments on plan liabilities 5,366 (3,175) (7,160) (12,651) (2,037)
Experience adjustments on plan assets 12,314 (104,229) (32,542) 11,575 28,383
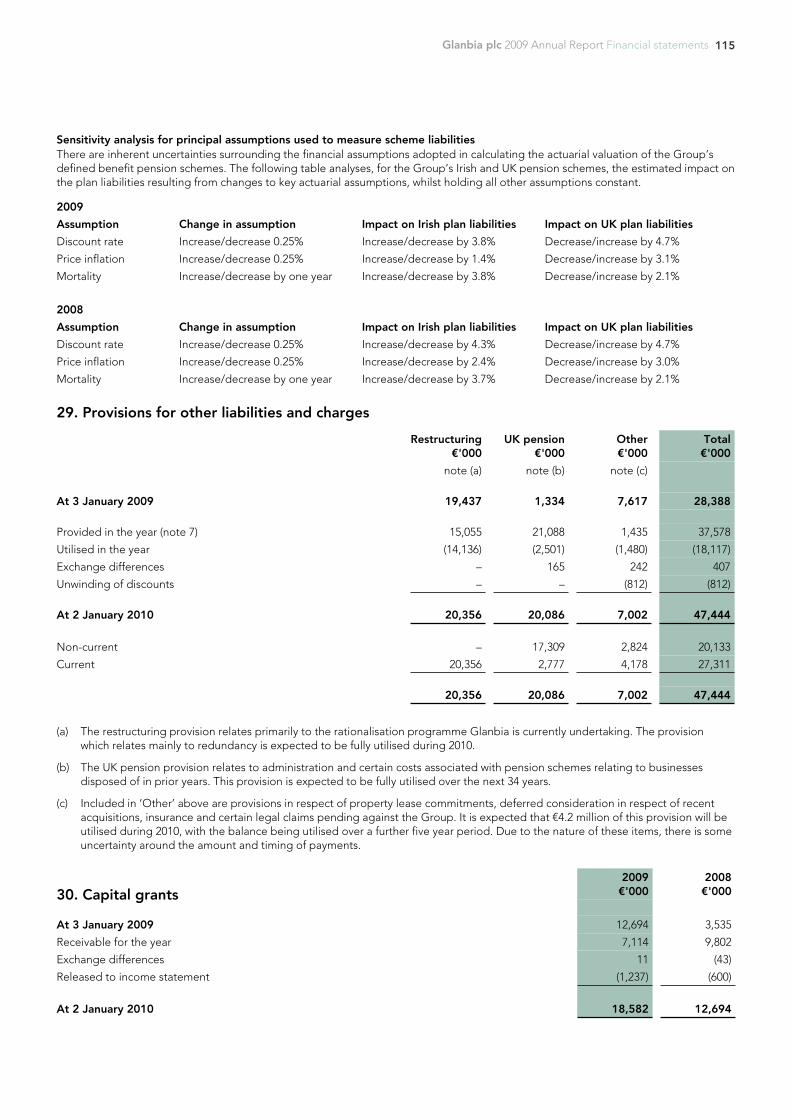
115Glanbia plc 2009 Annual Report Financial statements
Sensitivity analysis for principal assumptions used to measure scheme liabilitiesThere are inherent uncertainties surrounding the financial assumptions adopted in calculating the actuarial valuation of the Group’sdefined benefit pension schemes. The following table analyses, for the Group’s Irish and UK pension schemes, the estimated impact onthe plan liabilities resulting from changes to key actuarial assumptions, whilst holding all other assumptions constant.
2009
Assumption Change in assumption Impact on Irish plan liabilities Impact on UK plan liabilities
Discount rate Increase/decrease 0.25% Increase/decrease by 3.8% Decrease/increase by 4.7%
Price inflation Increase/decrease 0.25% Increase/decrease by 1.4% Decrease/increase by 3.1%
Mortality Increase/decrease by one year Increase/decrease by 3.8% Decrease/increase by 2.1%
2008
Assumption Change in assumption Impact on Irish plan liabilities Impact on UK plan liabilities
Discount rate Increase/decrease 0.25% Increase/decrease by 4.3% Decrease/increase by 4.7%
Price inflation Increase/decrease 0.25% Increase/decrease by 2.4% Decrease/increase by 3.0%
Mortality Increase/decrease by one year Increase/decrease by 3.7% Decrease/increase by 2.1%
29. Provisions for other liabilities and charges
Restructuring€'000
UK pension€'000
Other€'000
Total€'000
note (a) note (b) note (c)
At 3 January 2009 19,437 1,334 7,617 28,388
Provided in the year (note 7) 15,055 21,088 1,435 37,578
Utilised in the year (14,136) (2,501) (1,480) (18,117)
Exchange differences – 165 242 407
Unwinding of discounts – – (812) (812)
At 2 January 2010 20,356 20,086 7,002 47,444
Non-current – 17,309 2,824 20,133
Current 20,356 2,777 4,178 27,311
20,356 20,086 7,002 47,444
(a) The restructuring provision relates primarily to the rationalisation programme Glanbia is currently undertaking. The provisionwhich relates mainly to redundancy is expected to be fully utilised during 2010.
(b) The UK pension provision relates to administration and certain costs associated with pension schemes relating to businessesdisposed of in prior years. This provision is expected to be fully utilised over the next 34 years.
(c) Included in ‘Other’ above are provisions in respect of property lease commitments, deferred consideration in respect of recentacquisitions, insurance and certain legal claims pending against the Group. It is expected that €4.2 million of this provision will beutilised during 2010, with the balance being utilised over a further five year period. Due to the nature of these items, there is someuncertainty around the amount and timing of payments.
30. Capital grants2009€'000
2008€'000
At 3 January 2009 12,694 3,535
Receivable for the year 7,114 9,802
Exchange differences 11 (43)
Released to income statement (1,237) (600)
At 2 January 2010 18,582 12,694
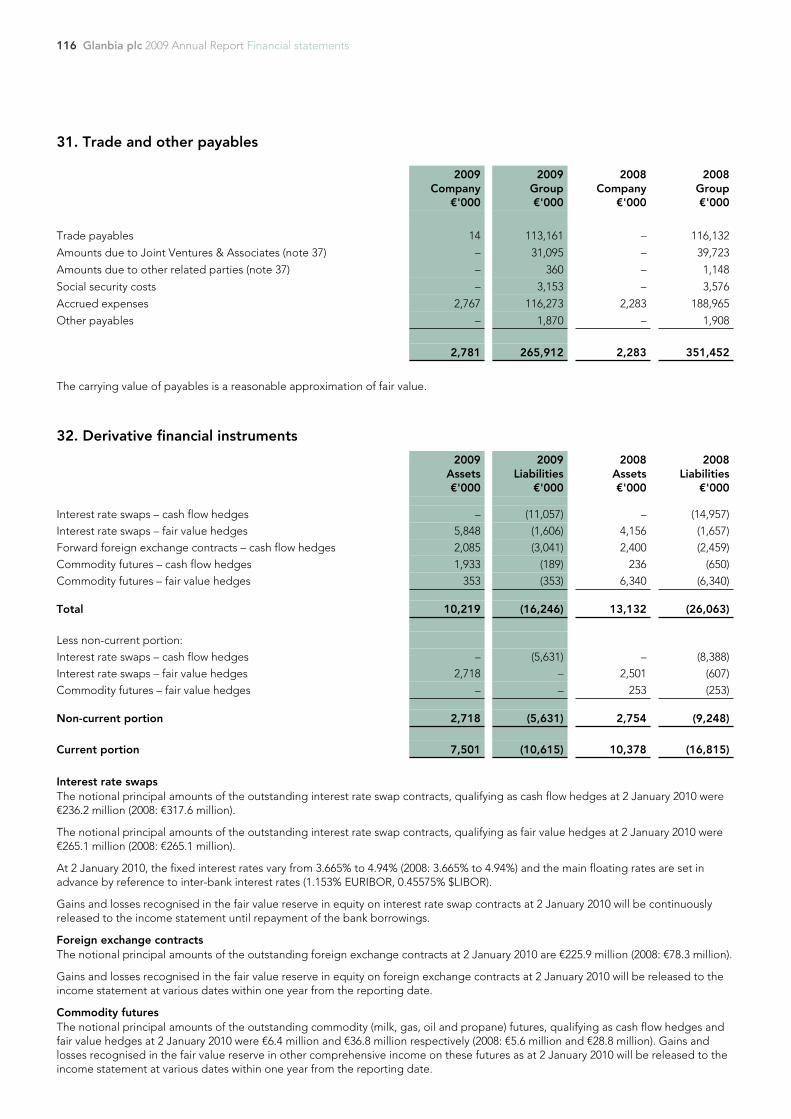
116 Glanbia plc 2009 Annual Report Financial statements
31. Trade and other payables
2009Company
€'000
2009Group€'000
2008Company
€'000
2008Group€'000
Trade payables 14 113,161 – 116,132
Amounts due to Joint Ventures & Associates (note 37) – 31,095 – 39,723
Amounts due to other related parties (note 37) – 360 – 1,148
Social security costs – 3,153 – 3,576
Accrued expenses 2,767 116,273 2,283 188,965
Other payables – 1,870 – 1,908
2,781 265,912 2,283 351,452
The carrying value of payables is a reasonable approximation of fair value.
32. Derivative financial instruments
2009Assets€'000
2009Liabilities
€'000
2008Assets€'000
2008Liabilities
€'000
Interest rate swaps – cash flow hedges – (11,057) – (14,957)Interest rate swaps – fair value hedges 5,848 (1,606) 4,156 (1,657)Forward foreign exchange contracts – cash flow hedges 2,085 (3,041) 2,400 (2,459)Commodity futures – cash flow hedges 1,933 (189) 236 (650)Commodity futures – fair value hedges 353 (353) 6,340 (6,340)
Total 10,219 (16,246) 13,132 (26,063)
Less non-current portion:Interest rate swaps – cash flow hedges – (5,631) – (8,388)Interest rate swaps – fair value hedges 2,718 – 2,501 (607)Commodity futures – fair value hedges – – 253 (253)
Non-current portion 2,718 (5,631) 2,754 (9,248)
Current portion 7,501 (10,615) 10,378 (16,815)
Interest rate swapsThe notional principal amounts of the outstanding interest rate swap contracts, qualifying as cash flow hedges at 2 January 2010 were€236.2 million (2008: €317.6 million).
The notional principal amounts of the outstanding interest rate swap contracts, qualifying as fair value hedges at 2 January 2010 were€265.1 million (2008: €265.1 million).
At 2 January 2010, the fixed interest rates vary from 3.665% to 4.94% (2008: 3.665% to 4.94%) and the main floating rates are set inadvance by reference to inter-bank interest rates (1.153% EURIBOR, 0.45575% $LIBOR).
Gains and losses recognised in the fair value reserve in equity on interest rate swap contracts at 2 January 2010 will be continuouslyreleased to the income statement until repayment of the bank borrowings.
Foreign exchange contractsThe notional principal amounts of the outstanding foreign exchange contracts at 2 January 2010 are €225.9 million (2008: €78.3 million).
Gains and losses recognised in the fair value reserve in equity on foreign exchange contracts at 2 January 2010 will be released to theincome statement at various dates within one year from the reporting date.
Commodity futuresThe notional principal amounts of the outstanding commodity (milk, gas, oil and propane) futures, qualifying as cash flow hedges andfair value hedges at 2 January 2010 were €6.4 million and €36.8 million respectively (2008: €5.6 million and €28.8 million). Gains andlosses recognised in the fair value reserve in other comprehensive income on these futures as at 2 January 2010 will be released to theincome statement at various dates within one year from the reporting date.
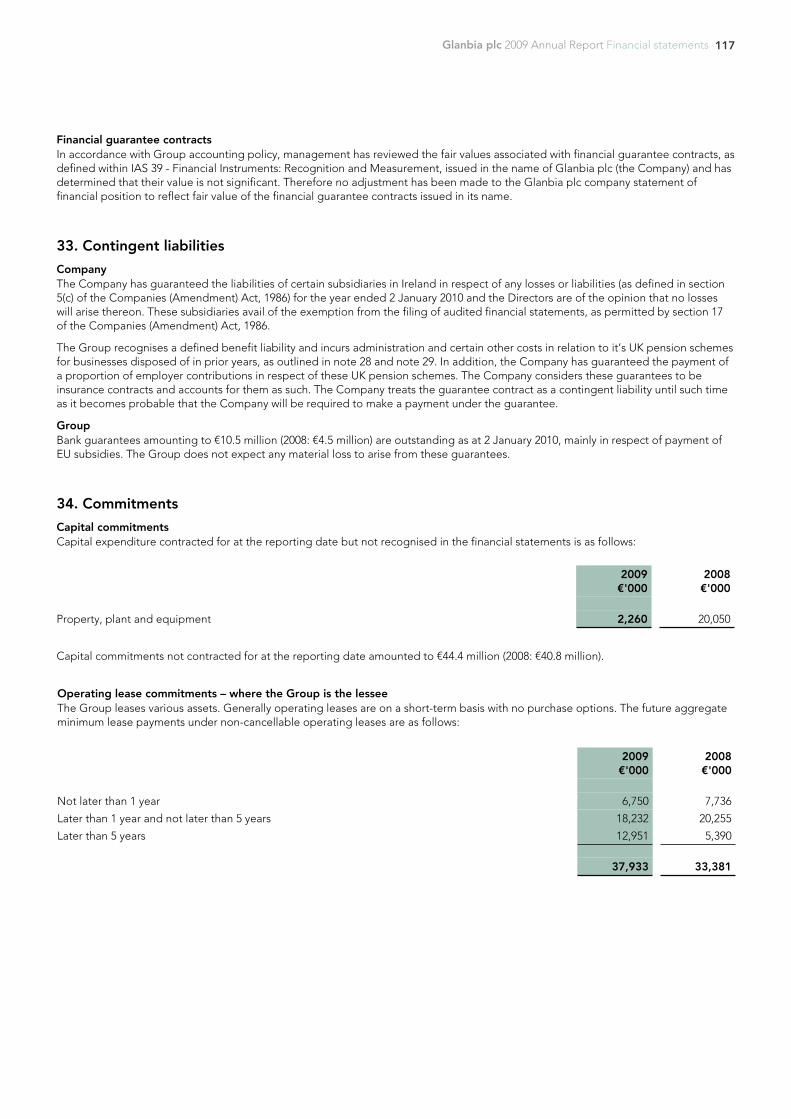
117Glanbia plc 2009 Annual Report Financial statements
Financial guarantee contractsIn accordance with Group accounting policy, management has reviewed the fair values associated with financial guarantee contracts, asdefined within IAS 39 - Financial Instruments: Recognition and Measurement, issued in the name of Glanbia plc (the Company) and hasdetermined that their value is not significant. Therefore no adjustment has been made to the Glanbia plc company statement offinancial position to reflect fair value of the financial guarantee contracts issued in its name.
33. Contingent liabilities
CompanyThe Company has guaranteed the liabilities of certain subsidiaries in Ireland in respect of any losses or liabilities (as defined in section5(c) of the Companies (Amendment) Act, 1986) for the year ended 2 January 2010 and the Directors are of the opinion that no losseswill arise thereon. These subsidiaries avail of the exemption from the filing of audited financial statements, as permitted by section 17of the Companies (Amendment) Act, 1986.
The Group recognises a defined benefit liability and incurs administration and certain other costs in relation to it’s UK pension schemesfor businesses disposed of in prior years, as outlined in note 28 and note 29. In addition, the Company has guaranteed the payment ofa proportion of employer contributions in respect of these UK pension schemes. The Company considers these guarantees to beinsurance contracts and accounts for them as such. The Company treats the guarantee contract as a contingent liability until such timeas it becomes probable that the Company will be required to make a payment under the guarantee.
GroupBank guarantees amounting to €10.5 million (2008: €4.5 million) are outstanding as at 2 January 2010, mainly in respect of payment ofEU subsidies. The Group does not expect any material loss to arise from these guarantees.
34. Commitments
Capital commitmentsCapital expenditure contracted for at the reporting date but not recognised in the financial statements is as follows:
2009€'000
2008€'000
Property, plant and equipment 2,260 20,050
Capital commitments not contracted for at the reporting date amounted to €44.4 million (2008: €40.8 million).
Operating lease commitments – where the Group is the lesseeThe Group leases various assets. Generally operating leases are on a short-term basis with no purchase options. The future aggregateminimum lease payments under non-cancellable operating leases are as follows:
2009€'000
2008€'000
Not later than 1 year 6,750 7,736
Later than 1 year and not later than 5 years 18,232 20,255
Later than 5 years 12,951 5,390
37,933 33,381
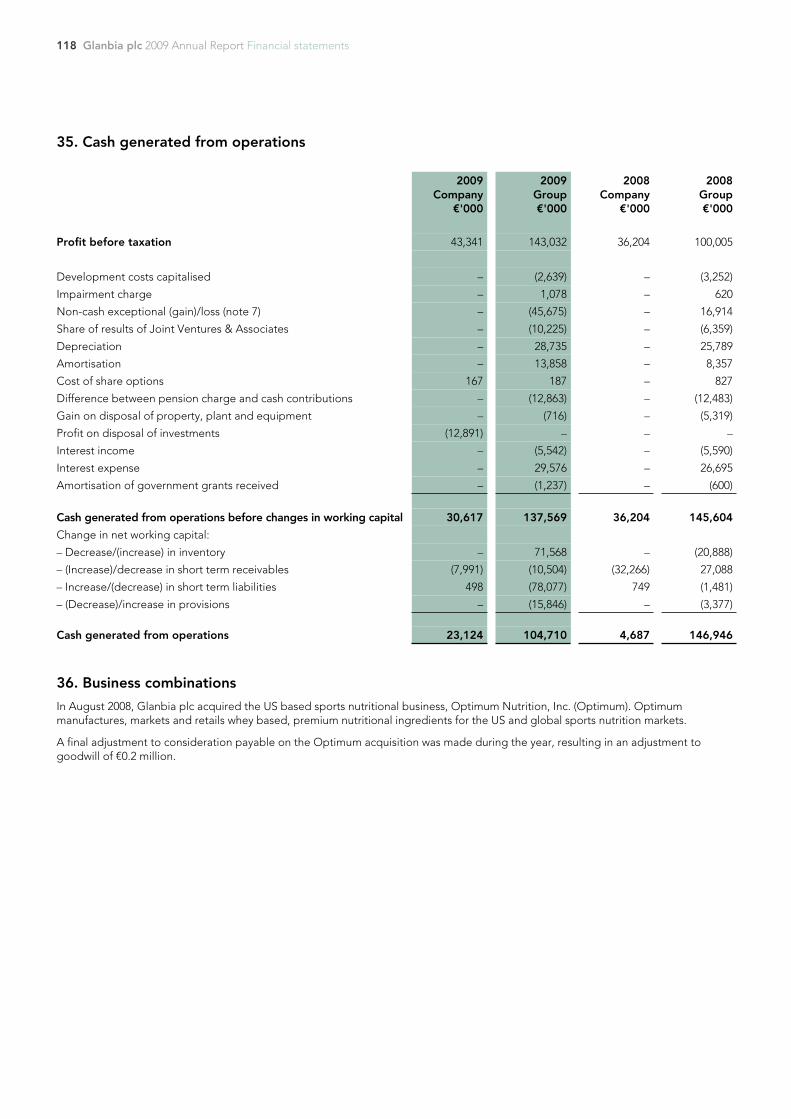
118 Glanbia plc 2009 Annual Report Financial statements
35. Cash generated from operations
2009Company
€'000
2009Group€'000
2008Company
€'000
2008Group€'000
Profit before taxation 43,341 143,032 36,204 100,005
Development costs capitalised – (2,639) – (3,252)
Impairment charge – 1,078 – 620
Non-cash exceptional (gain)/loss (note 7) – (45,675) – 16,914
Share of results of Joint Ventures & Associates – (10,225) – (6,359)
Depreciation – 28,735 – 25,789
Amortisation – 13,858 – 8,357
Cost of share options 167 187 – 827
Difference between pension charge and cash contributions – (12,863) – (12,483)
Gain on disposal of property, plant and equipment – (716) – (5,319)
Profit on disposal of investments (12,891) – – –
Interest income – (5,542) – (5,590)
Interest expense – 29,576 – 26,695
Amortisation of government grants received – (1,237) – (600)
Cash generated from operations before changes in working capital 30,617 137,569 36,204 145,604
Change in net working capital:
– Decrease/(increase) in inventory – 71,568 – (20,888)
– (Increase)/decrease in short term receivables (7,991) (10,504) (32,266) 27,088
– Increase/(decrease) in short term liabilities 498 (78,077) 749 (1,481)
– (Decrease)/increase in provisions – (15,846) – (3,377)
Cash generated from operations 23,124 104,710 4,687 146,946
36. Business combinations
In August 2008, Glanbia plc acquired the US based sports nutritional business, Optimum Nutrition, Inc. (Optimum). Optimummanufactures, markets and retails whey based, premium nutritional ingredients for the US and global sports nutrition markets.
A final adjustment to consideration payable on the Optimum acquisition was made during the year, resulting in an adjustment togoodwill of €0.2 million.
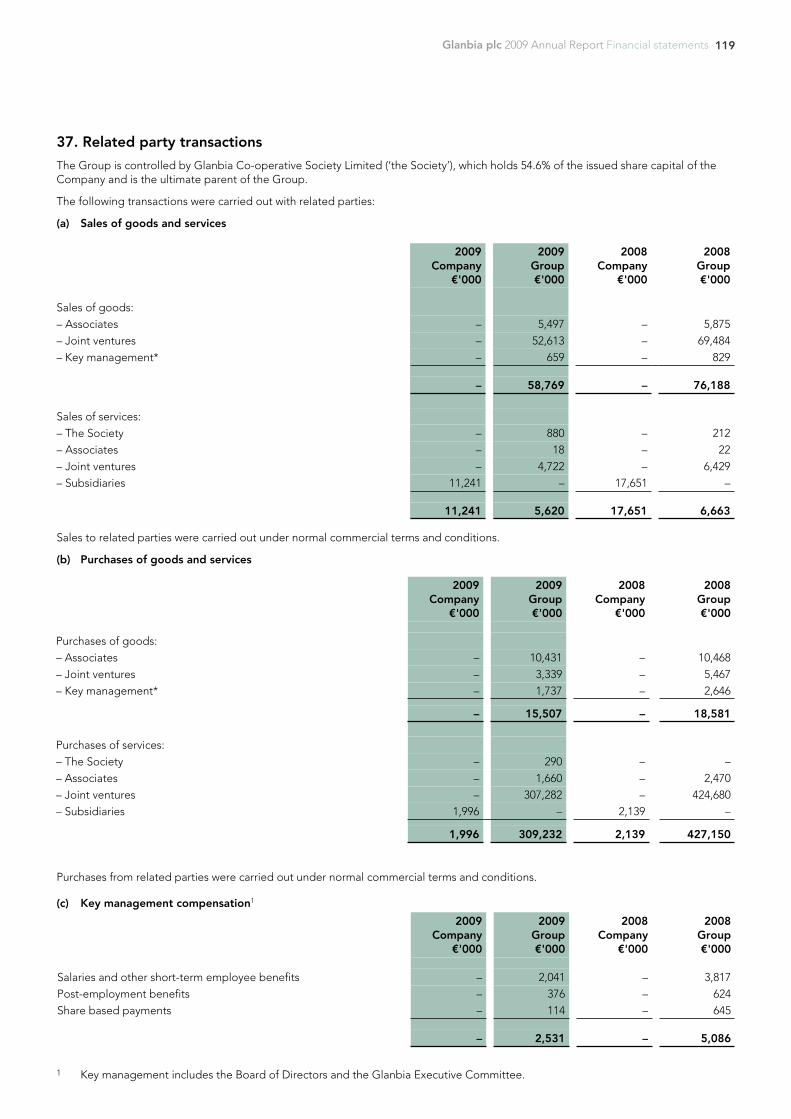
119Glanbia plc 2009 Annual Report Financial statements
37. Related party transactions
The Group is controlled by Glanbia Co-operative Society Limited (‘the Society’), which holds 54.6% of the issued share capital of theCompany and is the ultimate parent of the Group.
The following transactions were carried out with related parties:
(a) Sales of goods and services
2009Company
€'000
2009Group€'000
2008Company
€'000
2008Group€'000
Sales of goods:– Associates – 5,497 – 5,875– Joint ventures – 52,613 – 69,484– Key management* – 659 – 829
– 58,769 – 76,188
Sales of services:– The Society – 880 – 212– Associates – 18 – 22– Joint ventures – 4,722 – 6,429– Subsidiaries 11,241 – 17,651 –
11,241 5,620 17,651 6,663
Sales to related parties were carried out under normal commercial terms and conditions.
(b) Purchases of goods and services
2009Company
€'000
2009Group€'000
2008Company
€'000
2008Group€'000
Purchases of goods:– Associates – 10,431 – 10,468– Joint ventures – 3,339 – 5,467– Key management* – 1,737 – 2,646
– 15,507 – 18,581
Purchases of services:– The Society – 290 – –– Associates – 1,660 – 2,470– Joint ventures – 307,282 – 424,680– Subsidiaries 1,996 – 2,139 –
1,996 309,232 2,139 427,150
Purchases from related parties were carried out under normal commercial terms and conditions.
(c) Key management compensation1
2009Company
€'000
2009Group€'000
2008Company
€'000
2008Group€'000
Salaries and other short-term employee benefits – 2,041 – 3,817Post-employment benefits – 376 – 624Share based payments – 114 – 645
– 2,531 – 5,086
1 Key management includes the Board of Directors and the Glanbia Executive Committee.
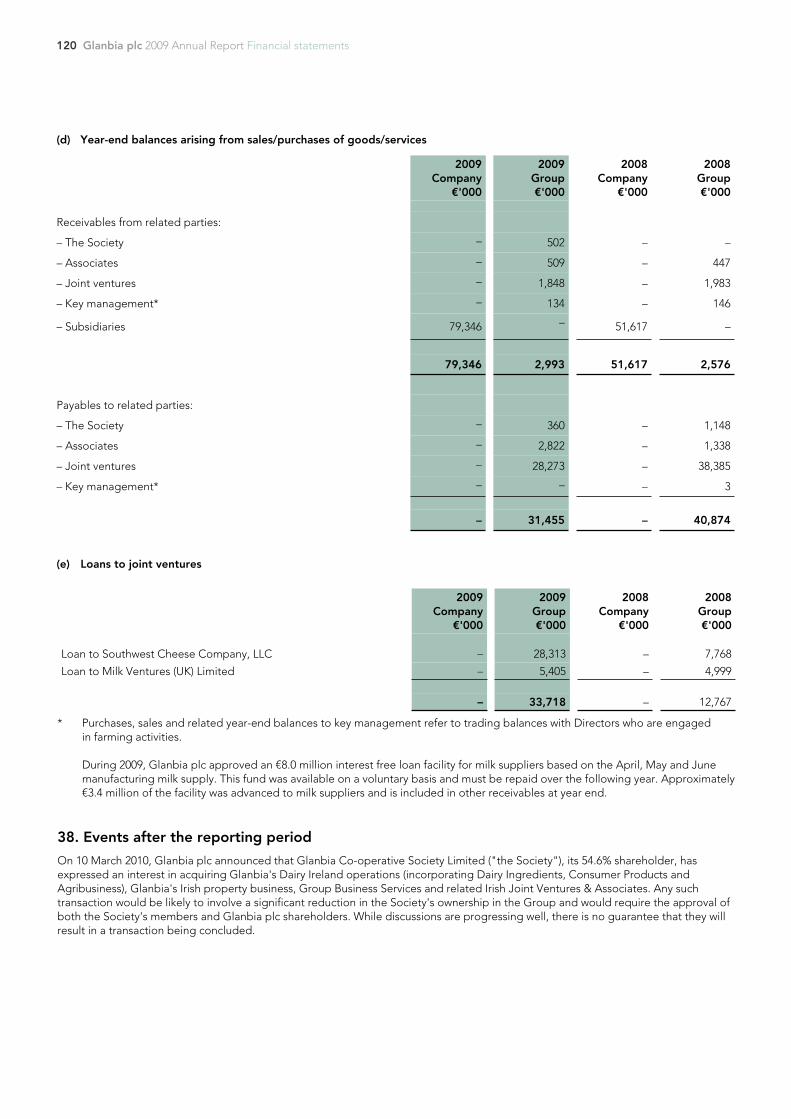
120 Glanbia plc 2009 Annual Report Financial statements
(d) Year-end balances arising from sales/purchases of goods/services
2009Company
€'000
2009Group€'000
2008Company
€'000
2008Group€'000
Receivables from related parties:
– The Society – 502 – –
– Associates – 509 – 447
– Joint ventures – 1,848 – 1,983
– Key management* – 134 – 146
– Subsidiaries 79,346 – 51,617 –
79,346 2,993 51,617 2,576
Payables to related parties:
– The Society – 360 – 1,148
– Associates – 2,822 – 1,338
– Joint ventures – 28,273 – 38,385
– Key management* – – – 3
– 31,455 – 40,874
(e) Loans to joint ventures
2009Company
€'000
2009Group€'000
2008Company
€'000
2008Group€'000
Loan to Southwest Cheese Company, LLC – 28,313 – 7,768
Loan to Milk Ventures (UK) Limited – 5,405 – 4,999
– 33,718 – 12,767
* Purchases, sales and related year-end balances to key management refer to trading balances with Directors who are engagedin farming activities.
During 2009, Glanbia plc approved an €8.0 million interest free loan facility for milk suppliers based on the April, May and Junemanufacturing milk supply. This fund was available on a voluntary basis and must be repaid over the following year. Approximately€3.4 million of the facility was advanced to milk suppliers and is included in other receivables at year end.
38. Events after the reporting period
On 10 March 2010, Glanbia plc announced that Glanbia Co-operative Society Limited ("the Society"), its 54.6% shareholder, hasexpressed an interest in acquiring Glanbia's Dairy Ireland operations (incorporating Dairy Ingredients, Consumer Products andAgribusiness), Glanbia's Irish property business, Group Business Services and related Irish Joint Ventures & Associates. Any suchtransaction would be likely to involve a significant reduction in the Society's ownership in the Group and would require the approval ofboth the Society's members and Glanbia plc shareholders. While discussions are progressing well, there is no guarantee that they willresult in a transaction being concluded.
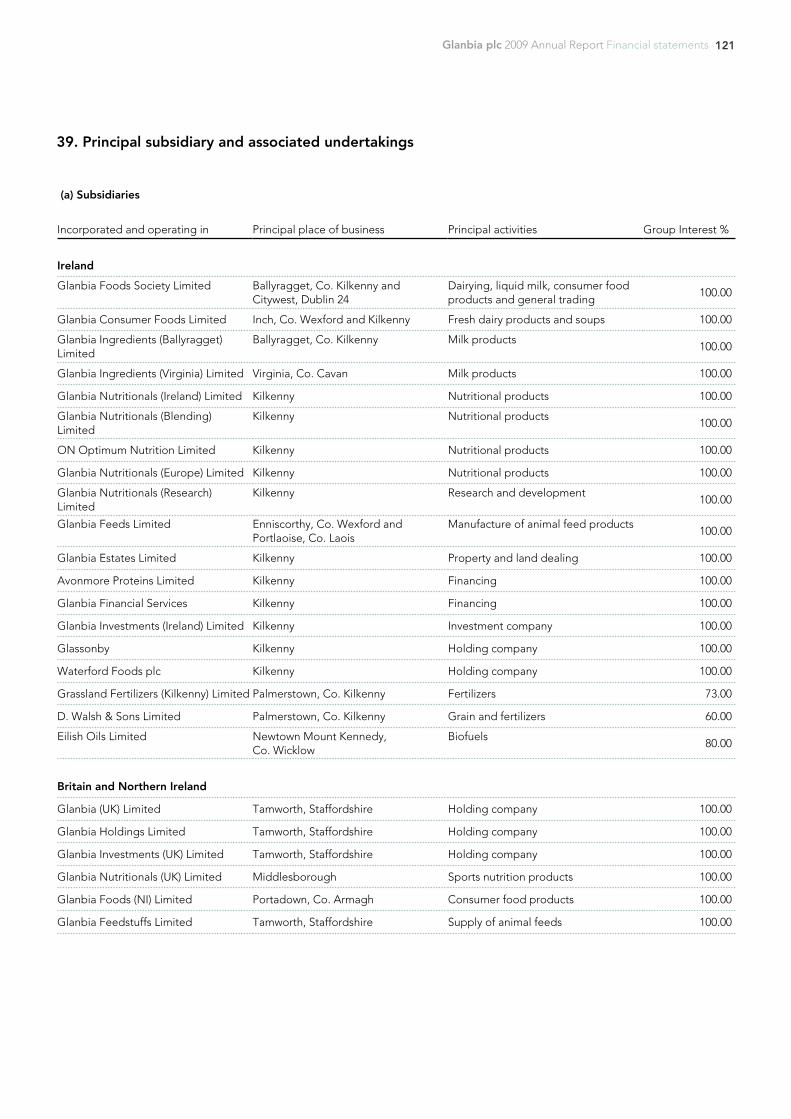
121Glanbia plc 2009 Annual Report Financial statements
(a) Subsidiaries
Incorporated and operating in Principal place of business Principal activities Group Interest %
Ireland
Glanbia Foods Society Limited Ballyragget, Co. Kilkenny andCitywest, Dublin 24
Dairying, liquid milk, consumer foodproducts and general trading
100.00
Glanbia Consumer Foods Limited Inch, Co. Wexford and Kilkenny Fresh dairy products and soups 100.00
Glanbia Ingredients (Ballyragget)Limited
Ballyragget, Co. Kilkenny Milk products100.00
Glanbia Ingredients (Virginia) Limited Virginia, Co. Cavan Milk products 100.00
Glanbia Nutritionals (Ireland) Limited Kilkenny Nutritional products 100.00
Glanbia Nutritionals (Blending)Limited
Kilkenny Nutritional products100.00
ON Optimum Nutrition Limited Kilkenny Nutritional products 100.00
Glanbia Nutritionals (Europe) Limited Kilkenny Nutritional products 100.00
Glanbia Nutritionals (Research)Limited
Kilkenny Research and development100.00
Glanbia Feeds Limited Enniscorthy, Co. Wexford andPortlaoise, Co. Laois
Manufacture of animal feed products100.00
Glanbia Estates Limited Kilkenny Property and land dealing 100.00
Avonmore Proteins Limited Kilkenny Financing 100.00
Glanbia Financial Services Kilkenny Financing 100.00
Glanbia Investments (Ireland) Limited Kilkenny Investment company 100.00
Glassonby Kilkenny Holding company 100.00
Waterford Foods plc Kilkenny Holding company 100.00
Grassland Fertilizers (Kilkenny) Limited Palmerstown, Co. Kilkenny Fertilizers 73.00
D. Walsh & Sons Limited Palmerstown, Co. Kilkenny Grain and fertilizers 60.00
Eilish Oils Limited Newtown Mount Kennedy,Co. Wicklow
Biofuels80.00
Britain and Northern Ireland
Glanbia (UK) Limited Tamworth, Staffordshire Holding company 100.00
Glanbia Holdings Limited Tamworth, Staffordshire Holding company 100.00
Glanbia Investments (UK) Limited Tamworth, Staffordshire Holding company 100.00
Glanbia Nutritionals (UK) Limited Middlesborough Sports nutrition products 100.00
Glanbia Foods (NI) Limited Portadown, Co. Armagh Consumer food products 100.00
Glanbia Feedstuffs Limited Tamworth, Staffordshire Supply of animal feeds 100.00
39. Principal subsidiary and associated undertakings
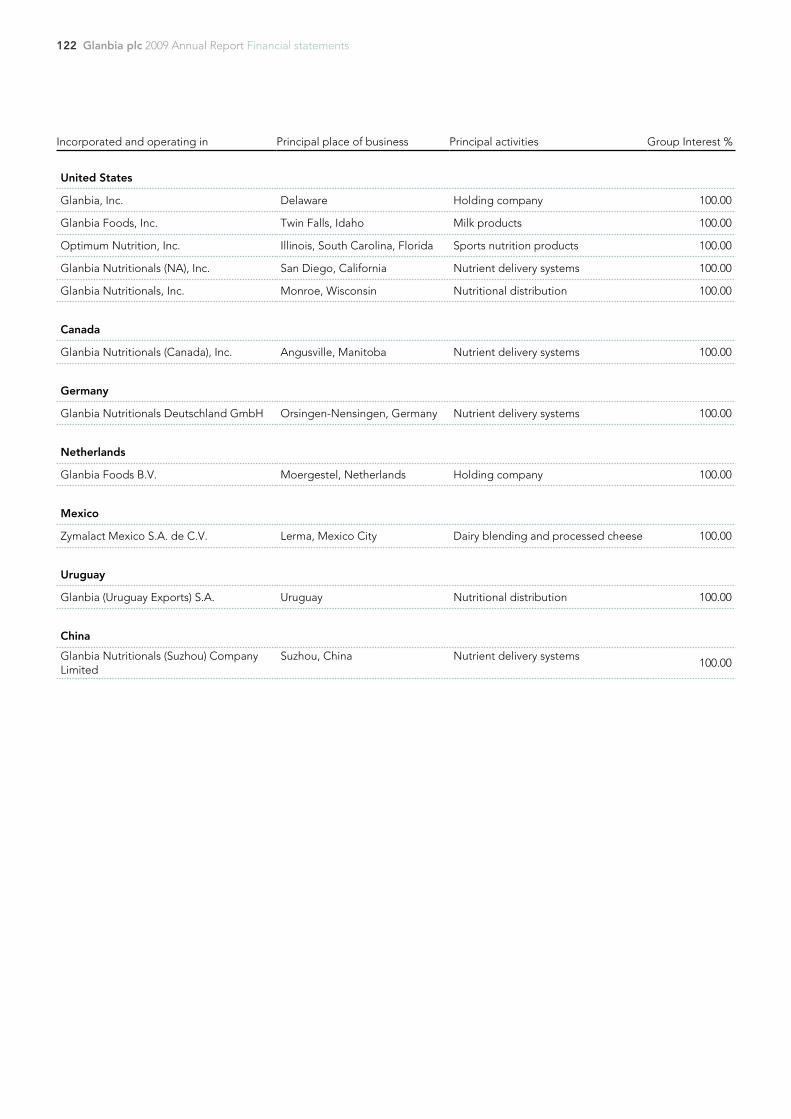
122 Glanbia plc 2009 Annual Report Financial statements
Incorporated and operating in Principal place of business Principal activities Group Interest %
United States
Glanbia, Inc. Delaware Holding company 100.00
Glanbia Foods, Inc. Twin Falls, Idaho Milk products 100.00
Optimum Nutrition, Inc. Illinois, South Carolina, Florida Sports nutrition products 100.00
Glanbia Nutritionals (NA), Inc. San Diego, California Nutrient delivery systems 100.00
Glanbia Nutritionals, Inc. Monroe, Wisconsin Nutritional distribution 100.00
Canada
Glanbia Nutritionals (Canada), Inc. Angusville, Manitoba Nutrient delivery systems 100.00
Germany
Glanbia Nutritionals Deutschland GmbH Orsingen-Nensingen, Germany Nutrient delivery systems 100.00
Netherlands
Glanbia Foods B.V. Moergestel, Netherlands Holding company 100.00
Mexico
Zymalact Mexico S.A. de C.V. Lerma, Mexico City Dairy blending and processed cheese 100.00
Uruguay
Glanbia (Uruguay Exports) S.A. Uruguay Nutritional distribution 100.00
China
Glanbia Nutritionals (Suzhou) CompanyLimited
Suzhou, China Nutrient delivery systems100.00
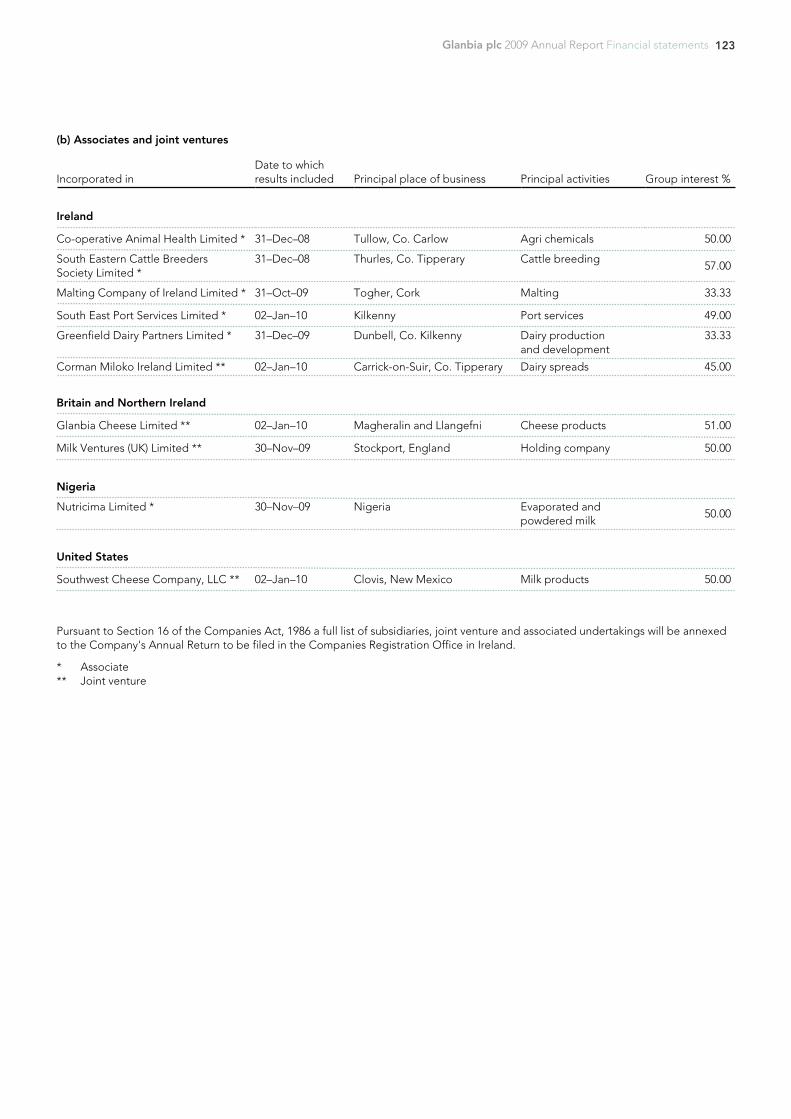
123Glanbia plc 2009 Annual Report Financial statements
(b) Associates and joint ventures
Incorporated inDate to whichresults included Principal place of business Principal activities Group interest %
Ireland
Co-operative Animal Health Limited * 31–Dec–08 Tullow, Co. Carlow Agri chemicals 50.00
South Eastern Cattle BreedersSociety Limited *
31–Dec–08 Thurles, Co. Tipperary Cattle breeding57.00
Malting Company of Ireland Limited * 31–Oct–09 Togher, Cork Malting 33.33
South East Port Services Limited * 02–Jan–10 Kilkenny Port services 49.00
Greenfield Dairy Partners Limited * 31–Dec–09 Dunbell, Co. Kilkenny Dairy productionand development
33.33
Corman Miloko Ireland Limited ** 02–Jan–10 Carrick-on-Suir, Co. Tipperary Dairy spreads 45.00
Britain and Northern Ireland
Glanbia Cheese Limited ** 02–Jan–10 Magheralin and Llangefni Cheese products 51.00
Milk Ventures (UK) Limited ** 30–Nov–09 Stockport, England Holding company 50.00
Nigeria
Nutricima Limited * 30–Nov–09 Nigeria Evaporated andpowdered milk
50.00
United States
Southwest Cheese Company, LLC ** 02–Jan–10 Clovis, New Mexico Milk products 50.00
Pursuant to Section 16 of the Companies Act, 1986 a full list of subsidiaries, joint venture and associated undertakings will be annexedto the Company's Annual Return to be filed in the Companies Registration Office in Ireland.
* Associate** Joint venture
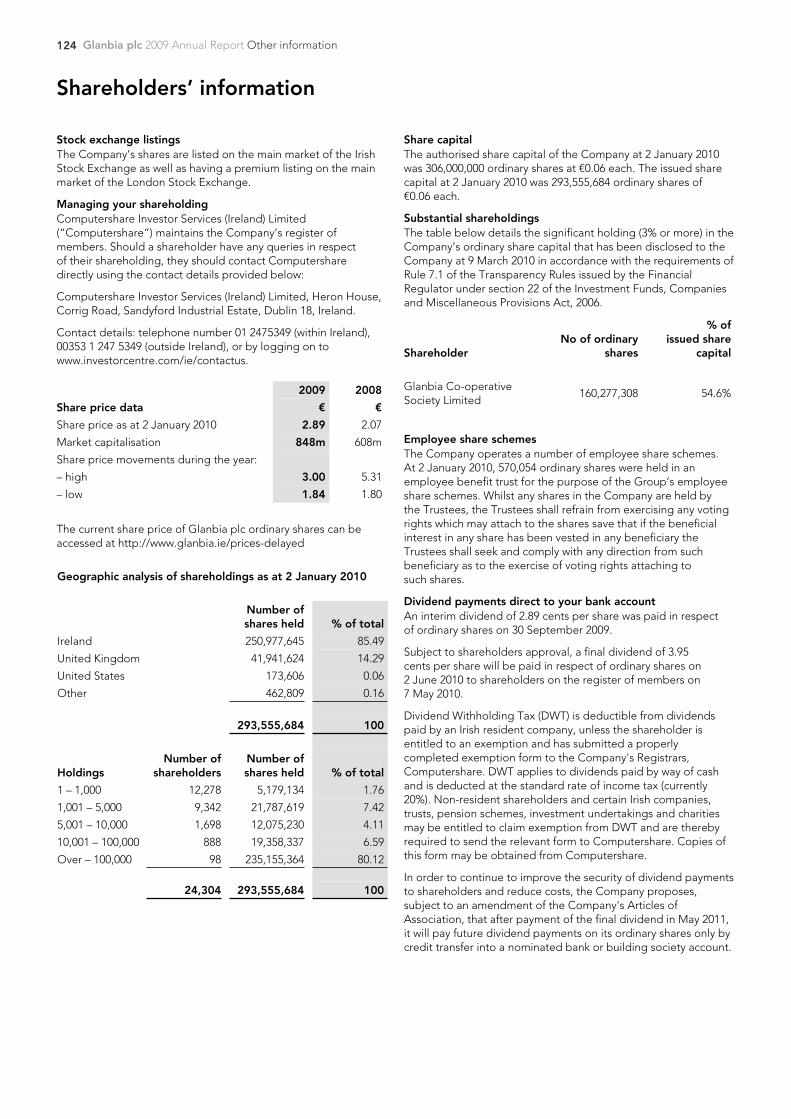
124 Glanbia plc 2009 Annual Report Other information
Stock exchange listingsThe Company’s shares are listed on the main market of the IrishStock Exchange as well as having a premium listing on the mainmarket of the London Stock Exchange.
Managing your shareholdingComputershare Investor Services (Ireland) Limited(“Computershare”) maintains the Company’s register ofmembers. Should a shareholder have any queries in respectof their shareholding, they should contact Computersharedirectly using the contact details provided below:
Computershare Investor Services (Ireland) Limited, Heron House,Corrig Road, Sandyford Industrial Estate, Dublin 18, Ireland.
Contact details: telephone number 01 2475349 (within Ireland),00353 1 247 5349 (outside Ireland), or by logging on towww.investorcentre.com/ie/contactus.
Share capitalThe authorised share capital of the Company at 2 January 2010was 306,000,000 ordinary shares at €0.06 each. The issued sharecapital at 2 January 2010 was 293,555,684 ordinary shares of€0.06 each.
Substantial shareholdingsThe table below details the significant holding (3% or more) in theCompany’s ordinary share capital that has been disclosed to theCompany at 9 March 2010 in accordance with the requirements ofRule 7.1 of the Transparency Rules issued by the FinancialRegulator under section 22 of the Investment Funds, Companiesand Miscellaneous Provisions Act, 2006.
ShareholderNo of ordinary
shares
% ofissued share
capital
Glanbia Co-operativeSociety Limited
160,277,308 54.6%2009 2008
Share price data € €
Share price as at 2 January 2010 2.89 2.07
Market capitalisation 848m 608m
Share price movements during the year:
– high 3.00 5.31
– low 1.84 1.80
The current share price of Glanbia plc ordinary shares can beaccessed at http://www.glanbia.ie/prices-delayed
Geographic analysis of shareholdings as at 2 January 2010
Number ofshares held % of total
Ireland 250,977,645 85.49
United Kingdom 41,941,624 14.29
United States 173,606 0.06
Other 462,809 0.16
293,555,684 100
HoldingsNumber of
shareholdersNumber ofshares held % of total
1 – 1,000 12,278 5,179,134 1.76
1,001 – 5,000 9,342 21,787,619 7.42
5,001 – 10,000 1,698 12,075,230 4.11
10,001 – 100,000 888 19,358,337 6.59
Over – 100,000 98 235,155,364 80.12
24,304 293,555,684 100
Employee share schemesThe Company operates a number of employee share schemes.At 2 January 2010, 570,054 ordinary shares were held in anemployee benefit trust for the purpose of the Group’s employeeshare schemes. Whilst any shares in the Company are held bythe Trustees, the Trustees shall refrain from exercising any votingrights which may attach to the shares save that if the beneficialinterest in any share has been vested in any beneficiary theTrustees shall seek and comply with any direction from suchbeneficiary as to the exercise of voting rights attaching tosuch shares.
Dividend payments direct to your bank accountAn interim dividend of 2.89 cents per share was paid in respectof ordinary shares on 30 September 2009.
Subject to shareholders approval, a final dividend of 3.95cents per share will be paid in respect of ordinary shares on2 June 2010 to shareholders on the register of members on7 May 2010.
Dividend Withholding Tax (DWT) is deductible from dividendspaid by an Irish resident company, unless the shareholder isentitled to an exemption and has submitted a properlycompleted exemption form to the Company's Registrars,Computershare. DWT applies to dividends paid by way of cashand is deducted at the standard rate of income tax (currently20%). Non-resident shareholders and certain Irish companies,trusts, pension schemes, investment undertakings and charitiesmay be entitled to claim exemption from DWT and are therebyrequired to send the relevant form to Computershare. Copies ofthis form may be obtained from Computershare.
In order to continue to improve the security of dividend paymentsto shareholders and reduce costs, the Company proposes,subject to an amendment of the Company's Articles ofAssociation, that after payment of the final dividend in May 2011,it will pay future dividend payments on its ordinary shares only bycredit transfer into a nominated bank or building society account.
Shareholders’ information
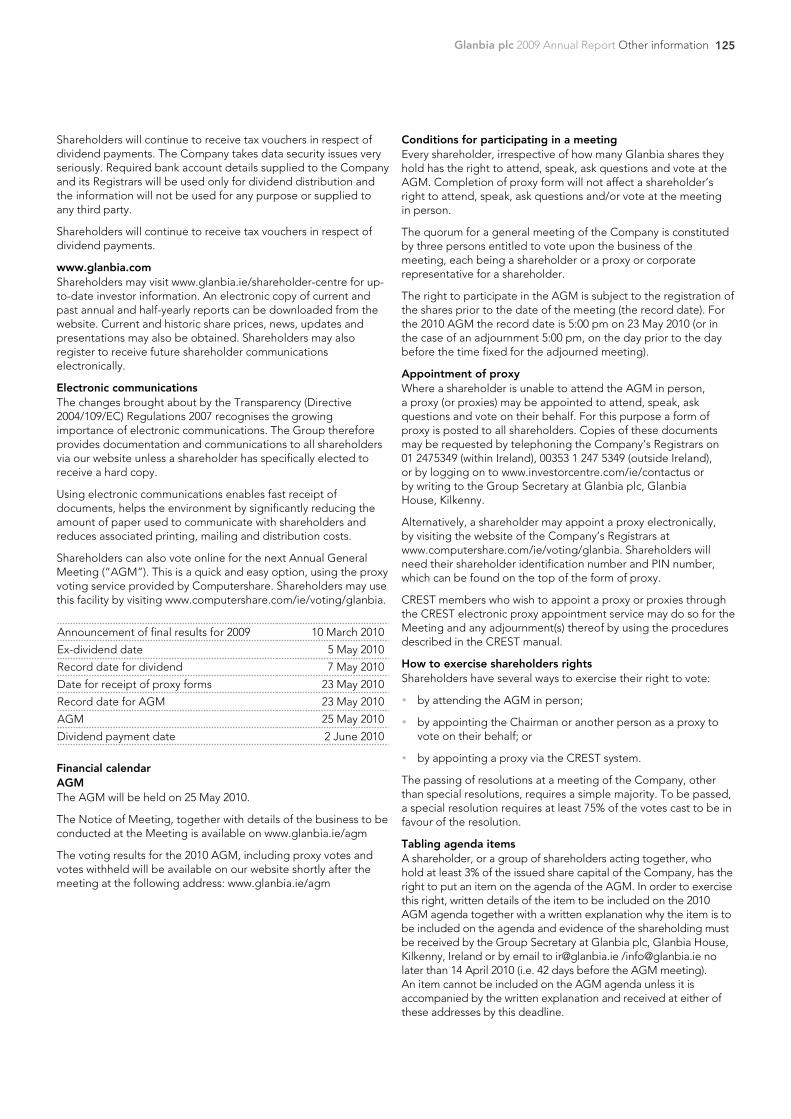
125Glanbia plc 2009 Annual Report Other information
Shareholders will continue to receive tax vouchers in respect ofdividend payments. The Company takes data security issues veryseriously. Required bank account details supplied to the Companyand its Registrars will be used only for dividend distribution andthe information will not be used for any purpose or supplied toany third party.
Shareholders will continue to receive tax vouchers in respect ofdividend payments.
www.glanbia.comShareholders may visit www.glanbia.ie/shareholder-centre for up-to-date investor information. An electronic copy of current andpast annual and half-yearly reports can be downloaded from thewebsite. Current and historic share prices, news, updates andpresentations may also be obtained. Shareholders may alsoregister to receive future shareholder communicationselectronically.
Electronic communicationsThe changes brought about by the Transparency (Directive2004/109/EC) Regulations 2007 recognises the growingimportance of electronic communications. The Group thereforeprovides documentation and communications to all shareholdersvia our website unless a shareholder has specifically elected toreceive a hard copy.
Using electronic communications enables fast receipt ofdocuments, helps the environment by significantly reducing theamount of paper used to communicate with shareholders andreduces associated printing, mailing and distribution costs.
Shareholders can also vote online for the next Annual GeneralMeeting (“AGM”). This is a quick and easy option, using the proxyvoting service provided by Computershare. Shareholders may usethis facility by visiting www.computershare.com/ie/voting/glanbia.
Financial calendarAGMThe AGM will be held on 25 May 2010.
The Notice of Meeting, together with details of the business to beconducted at the Meeting is available on www.glanbia.ie/agm
The voting results for the 2010 AGM, including proxy votes andvotes withheld will be available on our website shortly after themeeting at the following address: www.glanbia.ie/agm
Conditions for participating in a meetingEvery shareholder, irrespective of how many Glanbia shares theyhold has the right to attend, speak, ask questions and vote at theAGM. Completion of proxy form will not affect a shareholder’sright to attend, speak, ask questions and/or vote at the meetingin person.
The quorum for a general meeting of the Company is constitutedby three persons entitled to vote upon the business of themeeting, each being a shareholder or a proxy or corporaterepresentative for a shareholder.
The right to participate in the AGM is subject to the registration ofthe shares prior to the date of the meeting (the record date). Forthe 2010 AGM the record date is 5:00 pm on 23 May 2010 (or inthe case of an adjournment 5:00 pm, on the day prior to the daybefore the time fixed for the adjourned meeting).
Appointment of proxyWhere a shareholder is unable to attend the AGM in person,a proxy (or proxies) may be appointed to attend, speak, askquestions and vote on their behalf. For this purpose a form ofproxy is posted to all shareholders. Copies of these documentsmay be requested by telephoning the Company’s Registrars on01 2475349 (within Ireland), 00353 1 247 5349 (outside Ireland),or by logging on to www.investorcentre.com/ie/contactus orby writing to the Group Secretary at Glanbia plc, GlanbiaHouse, Kilkenny.
Alternatively, a shareholder may appoint a proxy electronically,by visiting the website of the Company’s Registrars atwww.computershare.com/ie/voting/glanbia. Shareholders willneed their shareholder identification number and PIN number,which can be found on the top of the form of proxy.
CREST members who wish to appoint a proxy or proxies throughthe CREST electronic proxy appointment service may do so for theMeeting and any adjournment(s) thereof by using the proceduresdescribed in the CREST manual.
How to exercise shareholders rightsShareholders have several ways to exercise their right to vote:
� by attending the AGM in person;
� by appointing the Chairman or another person as a proxy tovote on their behalf; or
� by appointing a proxy via the CREST system.
The passing of resolutions at a meeting of the Company, otherthan special resolutions, requires a simple majority. To be passed,a special resolution requires at least 75% of the votes cast to be infavour of the resolution.
Tabling agenda itemsA shareholder, or a group of shareholders acting together, whohold at least 3% of the issued share capital of the Company, has theright to put an item on the agenda of the AGM. In order to exercisethis right, written details of the item to be included on the 2010AGM agenda together with a written explanation why the item is tobe included on the agenda and evidence of the shareholding mustbe received by the Group Secretary at Glanbia plc, Glanbia House,Kilkenny, Ireland or by email to [email protected] /[email protected] nolater than 14 April 2010 (i.e. 42 days before the AGM meeting).An item cannot be included on the AGM agenda unless it isaccompanied by the written explanation and received at either ofthese addresses by this deadline.
Announcement of final results for 2009 10 March 2010
Ex-dividend date 5 May 2010
Record date for dividend 7 May 2010
Date for receipt of proxy forms 23 May 2010
Record date for AGM 23 May 2010
AGM 25 May 2010
Dividend payment date 2 June 2010
126 Glanbia plc 2009 Annual Report Other information
Tabling draft resolutionsA shareholder, or a group of shareholders acting together, whohold at least 3% of the issued share capital of the Company, hasthe right to table a draft resolution for inclusion on the agenda ofthe 2010 AGM subject to any contrary provision in company law
In order to exercise this right, the text of the draft resolutionand evidence of shareholding must be received by no later than14 April 2010 (i.e. 42 days before the AGM meeting) by post tothe Company Secretary at Glanbia plc, Glanbia House, Kilkenny,Ireland or by email to [email protected] /[email protected]. A resolutioncannot be included on the 2010 AGM agenda unless it is receivedat either of these addresses by this deadline. Furthermore,shareholders are reminded that there are provisions in companylaw which impose other conditions on the right of shareholders topropose resolutions at the general meeting of a company.
How to ask a question before or at the meetingThe AGM is an opportunity for shareholders to put a question tothe Chairman during the question and answer session. Before the2010 AGM, a shareholder may also submit a question in writing bysending a letter, and evidence of your shareholding at least fourbusiness days before the 2010 AGM (i.e. 19 May 2010) to theGroup Secretary, Glanbia plc, Glanbia House, Kilkenny, Ireland orby email to [email protected] /[email protected].
Advisors:AuditorsPricewaterhouseCoopers, Ballycar House, Newtown,Waterford, Ireland.
Principal bankersABN AMRO Bank N.V., Allied Irish Banks, plc., The Governor &Company of the Bank of Ireland, BNP Paribas S.A., Barclays BankIreland plc, Citibank Europe plc, KBC Bank Ireland plc, DanskeBank A/S trading as National Irish Bank, Rabobank Ireland plc,Ulster Bank Ireland Limited.
SolicitorsArthur Cox, Earlsfort Centre, Earlsfort Terrace, Dublin 2, Ireland.
Pinsent Masons, 3 Colmore Circus, Birmingham B4 6BH, UK.
StockbrokersDavy Stockbrokers, 49 Dawson Street, Dublin 2, Ireland (jointbroker).
RBS Hoare Govett Limited, 250 Bishopsgate, London EC2M 4AA(joint broker).
Additional shareholder information
Dividend rightsThe Company may, by ordinary resolution declare dividends inaccordance with the respective rights of shareholders, but nodividend shall exceed the amount recommended by the Directors.The Directors may also declare and pay interim dividends if itappears to them that they are justified by the profits of theCompany available for distribution.
Distribution on winding upIf the Company shall be wound up and the assets available fordistribution among shareholders as such shall be insufficient torepay the whole of the paid up or credited as paid up sharecapital, such assets shall be distributed so that, as nearly as maybe, the losses shall be borne by shareholders in proportion to thecapital paid up or credited as paid up at the commencement ofthe winding up on the shares held by them respectively. Further if,in a winding up, the assets available for distribution amongshareholders shall be more than sufficient to repay the whole ofthe share capital paid up or credited as paid up at thecommencement of the winding up, the excess shall be distributedamong shareholders in proportion to the capital at thecommencement of the winding up paid up or credited as paid upon the said shares held by them respectively.
127Glanbia plc 2009 Annual Report Other information
Summary income statement
2009 2008 2007 2006 2005
Revenue €1,830.3m €2,232.2m €2,206.6m €1,853.4m €1,830.0m
Operating profit pre exceptional €111.2m €134.1m €115.8m €85.6m €80.9m
Operating margin pre exceptional 6.1% 6.0% 5.2% 4.6% 4.4%
Net financing costs (€24.0m) (€21.1m) (€17.3m) (€14.0m) (€13.1m)
Share of results of Joint Ventures & Associates* €10.2m €7.3m €1.0m €2.8m €0.9m
Profit before tax pre exceptional €97.4m €120.3m €99.5m €74.4m €68.7m
Taxation pre exceptional (€19.1m) (€21.5m) (€16.4m) (€8.0m) (€7.6m)
Profit after tax pre exceptional €78.3m €98.8m €83.1m €66.4m €61.1m
Net exceptional items (post tax) €34.9m (€19.4m) (€22.8m) (€0.1m) (€3.4m)
Basic earnings per share 38.46c 26.76c 20.42c 22.51c 19.69c
Adjusted earnings per share 30.68c 35.86c 30.25c 23.89c 21.86c
Dividend per share in respect of the full year 6.84c 6.51c 6.08c 5.79c 5.51c
* Share of results in Joint Ventures & Associates is an after interest and tax amount.
Adjusted earnings per share
2009 2008 2007 2006 2005
Profit attributable to owners of the Parent 112,676 78,399 59,833 65,964 57,396
Amortisation of intangible assets (net of related tax) 12,126 7,312 5,964 3,896 2,899
Net exceptional items (34,905) 19,358 22,846 134 3,410
Adjusted net income 89,897 105,069 88,643 69,994 63,705
Weighted average number of ordinary shares in issues 292,985,630 293,018,610 293,012,540 292,958,667 291,469,902
Adjusted earnings per share (cents per share) 30.68 35.86 30.25 23.89 21.86
Five year trends
AAt a glance 4 Available for sale financial assets 98
BBoard of Directors 34 Borrowings 108 Business combinations 118
CCapital grants 115 Cash and cash equivalents 101 Cash generated from operations 118 Chairman’s statement 6 Commitments 117 Company statement of changes in equity 68 Company statement of comprehensive income 69 Company statement of cash flows 69 Company statement of financial position 67 Contents 1 Contingent liabilities 117 Critical accounting estimates and judgements 81
DDeferred income taxes 110 Derivative financial instruments 116 Directors’ remuneration 89 Dividends 92
EEarnings per share 91 Employee benefit expense 89 Exceptional items 88 Events after the reporting date 120
FFinance income and costs 89 Financial results 3 Finance review 22 Financial risk management 77 Financial statements 58 Five year trends 127
GGeneral information 70 Group income statement 62 Group Managing Director’s review 8 Group statement of cash flows 66 Group statement of changes in equity 64 Group statement of comprehensive income 63 Group statement of financial position 65
IIncome taxes 90 Independent auditors’ report 60 Intangible assets 93 International growth strategy 10 Introduction 2 Inventories 101 Investments in associates 95 Investments in joint ventures 97
MMinority interests 107
NNotes to the financial statements 70
OOperating expenses 87 Operations review – Dairy Ireland 16 Operations review – Joint Ventures & Associates 18 Operations review – US Cheese & Global Nutritionals 14 Other statutory information 54 Our people 31 Our responsibilities 30
PPrincipal subsidiary and associated undertakings 121 Property, plant and equipment 92 Provisions for other liabilities and charges 115
RReconciliation of changes in equity 102 Related party transactions 119 Retained earnings 107 Retirement benefit obligations 112 Risk management 28
SSegment information 82 Share capital and share premium 104 Shareholders’ information 124 Statement on corporate governance 36 Statement on Directors’ remuneration 46 Statement of Directors’ responsibilities 55 Summary of significant accounting policies 70
TTrade and other receivables 99 Trade and other payables 116
Index
128 Glanbia plc 2009 Annual Report Other information

Glanbia plc 2009 Annual Report
Glanb
ia plc 2009 A
nnual Rep
ort
Glanbia plc, Glanbia House, Kilkenny, Ireland.
Tel +353 56 777 2200Fax +353 56 777 2222 www.glanbia.com