2008AR Walgreens
41
2008 Annu al Report Chicago Cubs broadcaster Ron Santo Care & Convenience …in Communities across America
Transcript of 2008AR Walgreens
8/6/2019 2008AR Walgreens
http://slidepdf.com/reader/full/2008ar-walgreens 1/40
2008 Annual Report
Chicago Cubs broadcaster Ron Santo
Care &Convenience …in Communities across America

8/6/2019 2008AR Walgreens
http://slidepdf.com/reader/full/2008ar-walgreens 2/40
• Walgreens is the nation’s largest drugstore chain, with fiscal 2008 sales of $59 billion. The company has 237,000 employees.
• This is the company’s 34th consecutive yearof record sales and earnings. It’s also the 33rdconsecutive year Walgreens has raised its quarterly dividend – paid every quarter since 1933.
• Walgreens forms its Health & Wellness divisionto bring together in-store clinics and worksitehealth centers following the acquisitions of I-traxand Whole Health Management.
• More than one million people enroll in WalgreensPrescription Savings Club, which provides prescription
discounts for uninsured and underinsured patients.
• Walgreens reduces organic drugstore growth from
9 percent to a long-term target rate of 5 percent.This will provide flexibility to invest in core strategiesand improve shareholder value.
• The company prices a $1.3 billion, five-year bondoffering to be used for repayment of short-term debt incurred under its commercial paper program andgeneral corporate purposes.
• Walgreens fills 617 million prescriptions – 17.6 percent of the U.S. retail market. Pharmacy is 65 percent of our business.
• The company signs a specialty pharmacy contract withPrime Therapeutics, a pharmacy benefits managerowned by 10 Blue Cross Blue Shield plans covering20 million lives.
• Walgreens is named to Fortune magazine’s Most AdmiredCompanies in America list for the 15th consecutive year, and is ranked 40th on the Fortune 500 list of thelargest U.S.-based companies.
2008 Milestones
About the CoverLegendary Chicago Cub Ron Santo is the color commentator for Cubs’
radio broadcasts and one of millions of people who use Walgreens for
their prescription needs. In 1959, the 18-year-old Santo was diagnosed
with juvenile diabetes. He had just signed his first professional contract.
As he rose to fame as a five-time Gold Glove winner and All-Star third
baseman, no one knew he had diabetes. In 1971, he finally revealed
his secret to the crowd at Wrigley Field.
Today, Santo is a spokesperson for the disease and raises $5–6 million
each year for the Juvenile Diabetes Research Foundation (JDRF) through
the Ron Santo Walk to Cure Diabetes. Walgreens – the official pharmacy
of the Chicago Cubs – is a major fundraiser for JDRF. Every time a Cub
earned a base on balls during their divisional championship 2008 season,
Walgreens donated an additional $100 to JDRF.
Ron Santo’s pharmacists, Linda Riegelhaupt (below, left) and
Nancy Davis in Bannockburn, Illinois, treasure the Juvenile Diabetes
Research Foundation paper sneaker that Santo signed and presented
to their pharmacy.
We will provide the most convenient access to consumer goods and services…and pharmacy,health and wellness services…in America.
We will earn the trust of our customers and build shareholder value.
We will treat each other with respect and dignity and do the same for all we serve.
We will offer employees of all backgrounds a place to build careers.
WALGREEN S MISSION STATEMEN T

8/6/2019 2008AR Walgreens
http://slidepdf.com/reader/full/2008ar-walgreens 3/40
2008 2007 Increase
Net Sales $59,034 $53,762 9.8%
Net Earnings $ 2,157 $ 2,041 5.7%
Net Earnings per Common Share (diluted) $ 2.17 $ 2.03 6.9%
Shareholders’ Equity $12,869 $ 11,104 15.9%
Return on Average Shareholders’ Equity 18.0% 19.2%
Closing Stock Price per Common Share $ 36.43 $ 45.07
Total Market Value of Common Stock $36,036 $44,671
Dividends Declared per Common Share $ .40 $ .33
Average Shares Outstanding (diluted) 996 1,006
F I N A N C I A L H I G H L I G H T S For the years ended August 31, 2008 and 2007 (In millions, except per share amounts)
W a lg r e e n s F isc a l Ye a r S t o c k P e r f o r ma n c e Fiscal year-end closing price per share in dollars Prices are adjusted for a two-for-one stock split in 1999
2008 Walgreens Annual Report Page 1
2008 2007 2006 2005 2004
Locations Openings
New Locations 608 501 475 436 429
Acquisitions 423 120 95 4 14
Closings 94 85 94 68 82
Net Openings 937 536 476 372 361
Locations (1) 6,934 5,997 5,461 4,985 4,613
Sales Area (2) 72,585 66,386 60,795 55,385 50,926
Product Class Sales Prescription Drugs 65% 65% 64% 64% 63%
Non-prescription Drugs (3) 10% 10% 11% 11% 12%General Merchandise (3) 25% 25% 25% 25% 25%
(1) Includes drugstores, in-store and worksite health centers, home care facilities, specialty pharmacies and mail service facilities.
. (2) In thousands of square feet.
(3) Based on store scanning information.
COMPANY HIGHLIGHTS

8/6/2019 2008AR Walgreens
http://slidepdf.com/reader/full/2008ar-walgreens 4/40
Walgreens reported its 34th consecutive year of recordsales and earnings in 2008, a track record matched by only one other Fortune 500 company. During the year, we madestrategic investments to broaden our health and wellness
offerings, while outperforming the retail drugstore industry inboth pharmacy and front-end sales. We have a strong balancesheet, solid credit rating and financial flexibility, and havetaken prudent steps to ensure our continued success in theface of a weakening economy.
Our strategy is to transform Walgreens into a more efficient and customer-focused company, both for drugstore customersand for patients and payors seeking quality pharmacy, healthand wellness services that are accessible and affordable. Our
focus is to improve both top and bottom line performanceand value creation. Change is never easy…but it is absolutely imperative, and Walgreens is committed to becoming a morenimble and profitable company.
Following are the key milestones accomplished in fiscal 2008.
We focused on serving our customers better
In this economy, consumers are looking for low-cost alternativesand the best overall value. We offer patients a way to stretchtheir dollars and maintain their prescriptions in one place
without sacrificing the safety, service or convenience of theirnearby neighborhood drugstore.
One example of this customer-centered philosophy has beenthe successful introduction of our Prescription Savings Club,
which now has more than one million members and goes wellbeyond the discount generic programs offered at other retailers.Members receive savings on more than 5,000 name brand andgeneric medications, including 400 generics that are availablefor less than a dollar a week. They also receive a 10 percent
rebate on all Walgreens branded products that can be usedfor future store purchases.
We’re also working to improve our customers’ experience.Over the past few years, we’ve seen the number of items carriedin our stores expand from approximately 18,000 to more than25,000 – a breadth that can lead to complexity and confusionfor customers. We intend to streamline our merchandiseselection in fiscal 2009 to improve the overall Walgreens
Page 2 2008 Walgreens Annual Report
Alan G. McNally
Chairman and acting Chief Executive Officer
Gregory D. Wasson
President and Chief Operating Officer
L E T T E R T O S H A R E H O L D E R S
We will provide the most convenient access to consumer goods and
services…and pharmacy,health and wellness services…in America.

8/6/2019 2008AR Walgreens
http://slidepdf.com/reader/full/2008ar-walgreens 5/40
store experience and increase sales. As the architect Mies vander Rohe said, “Less is more.”
Meanwhile, we have expanded our private brand product
offerings, which provide value to customers and higher profit margins to our stores. We continue to offer competitively priced consumables, whose sales have been very strong,particularly for fast, easy, midweek fill-in needs in ourconveniently located retail stores.
We contained costs and are launchingnew cost initiatives
During the year, we launched an aggressive – and successful –
cost control effort that delivered solid bottom line results. We’re very proud of Walgreen people across our organizationfor their perseverance in this initiative. Our store managershave proven their ability to quickly adjust to evolving conditions
while maintaining a strong focus on customer service.
Over the course of fiscal 2008, we reduced the rate of growth of expenses by six percentage points, even with the costs associated
with opening 561 net new drugstores this year, versus 468 last year. This was an outstanding result. And we see plenty of
opportunity for even greater efficiencies. We are currently conducting a company-wide initiative to alignour costs, culture and capabilities to our strategy and to therealities of the current economic environment. As this report
went to press, we announced plans that target approximately $1 billion in annual cost reductions by 2011 through moreefficient processes, strategic sourcing and plans to reducecorporate overhead and work throughout our stores.
Our pharmacies are working to fill prescriptions more efficiently.
We’re in the early stages of rolling out a new initiative to trans-form – and advance – the practice of community pharmacy.Currently, we’ve focused on 300 Florida stores where we’re
moving tasks such as phone calls, data entry and insurance verification from individual stores to more efficient centralprocessing facilities.
These centers will also fill approximately one-third of prescriptions for delivery to the store when patients request next-day pickup. We’re creating a hybrid approach that blends the best of community pharmacy practices and centralfulfillment. These efforts will not only reduce our cost to fillprescriptions, but will give our pharmacists more time to offerexpanded counseling services that improve patient complianceand help people better manage chronic conditions such asdiabetes and hypertension. In many states, the government
already pays for these additional, valuable services. We adjusted our organic store growth
Walgreens remains among the fastest growing retailers in thecountry, even with our planned slowdown of organic growthfrom the current 9 percent rate to 5 percent by 2011. Slowergrowth offers two big positives: first, more time to developour management ranks and focus on improving the customerexperience; and second, greater flexibility to invest inopportunities that will strengthen our core base and deliver
attractive returns to our shareholders.
While organic growth was once our primary growth strategy,today it anchors a much broader strategy, which you willfind discussed throughout these pages.
We’re growing our health clinics and specialty pharmacy business to complement our drugstores
We now operate more than 600 health and wellness clinics inour stores and on employer worksites. Since acquiring two
worksite health center companies last spring, we’ve integratedthese services into our new Health & Wellness division,
which plans to expand to 800 sites by the end of fiscal 2009.
2008 Walgreens Annual Report Page 3
SalesIn billions of dollars
EarningsIn billions of dollars
8/6/2019 2008AR Walgreens
http://slidepdf.com/reader/full/2008ar-walgreens 6/40
These facilities will position us as one of the nation’s foremost providers of health and wellness services. They are highly complementary to our retail pharmacies and increase awareness
of our Walgreen brand.The satisfaction of both patients and nurse practitioners in ourTake Care in-store clinics is very high. The clinics are bringingnew people into the health care system by offering high quality,accessible and affordable solutions. A study by the nonprofit Rand Corp. found retail health clinics are attracting patients whoare not “routine users of the current health care system,” and donot have a primary care physician. Take Care’s nurse practi-tioners regularly refer patients who need more in-depth care
to physicians, keeping them out of high-cost emergency rooms.Our Health & Wellness division is also the largest operator of
worksite health centers and pharmacies in the country. At fiscal year-end, we had 364 clinics on or near employer campuses,offering diverse services including primary and acute care;
wellness, pharmacy and disease management services; andhealth and fitness programming. Employers recognize thesignificant value and cost savings these centers can provide.
Specialty pharmacy is the fastest growing sector of pharmacy,
expanding at about 15 percent a year. It is also very complementary to our core retail pharmacies. Of the newproducts awaiting FDA approval in 2008, 80 percent arespecialty drugs, according to IMS Health. We’ve built ourspecialty business primarily through acquisitions, the largest of which was our 2007 purchase of OptionCare, which wasaccretive to earnings in its first year of operation.
Our discussions with current and potential clients indicatethat our independence from a major PBM (pharmacy benefits
manager) is a significant factor in winning business, such asthe specialty pharmacy contract we signed earlier this year
with Prime Therapeutics, a PBM owned by 10 Blue CrossBlue Shield plans covering 20 million lives.
We’ve built the foundation of the most patient friendly pharmacy, health and wellness delivery network in thecountry – one that offers an affordable, accessible, quality solution to managed care, government and large employers.This includes 6,400-plus retail stores nationwide; our fast-expanding health and wellness clinics in stores and onemployer campuses; drug infusion centers; and the largest independent specialty pharmacy business in the country.
Walgreens mission is to provide the most convenient accessto consumer goods and services…and pharmacy, health and
wellness services – to our customers, patients, employersand payors – in communities where people live and workacross America. This will build brand loyalty, sales, profitsand shareholder value.
We’ve expanded our management team andinvestor communications
We’ve expanded our leadership team to help drive bold,creative and innovative responses to a rapidly changing retail
and health care environment. In the past six months, WadeMiquelon joined our team as CFO, Sona Chawla as senior VPof E-commerce, and Kim Feil as chief marketing officer. We
welcome the new ideas and challenges that they’re bringingto our organization.
In 2008, we held regular quarterly earnings conference calls,providing clarity to our communication with investors. And inlate October, we hosted an Analysts’ Day to share our visionof how – and why – Walgreens is changing and growing to
offer Americans a compelling solution to their shopping andpharmacy, health and wellness needs.
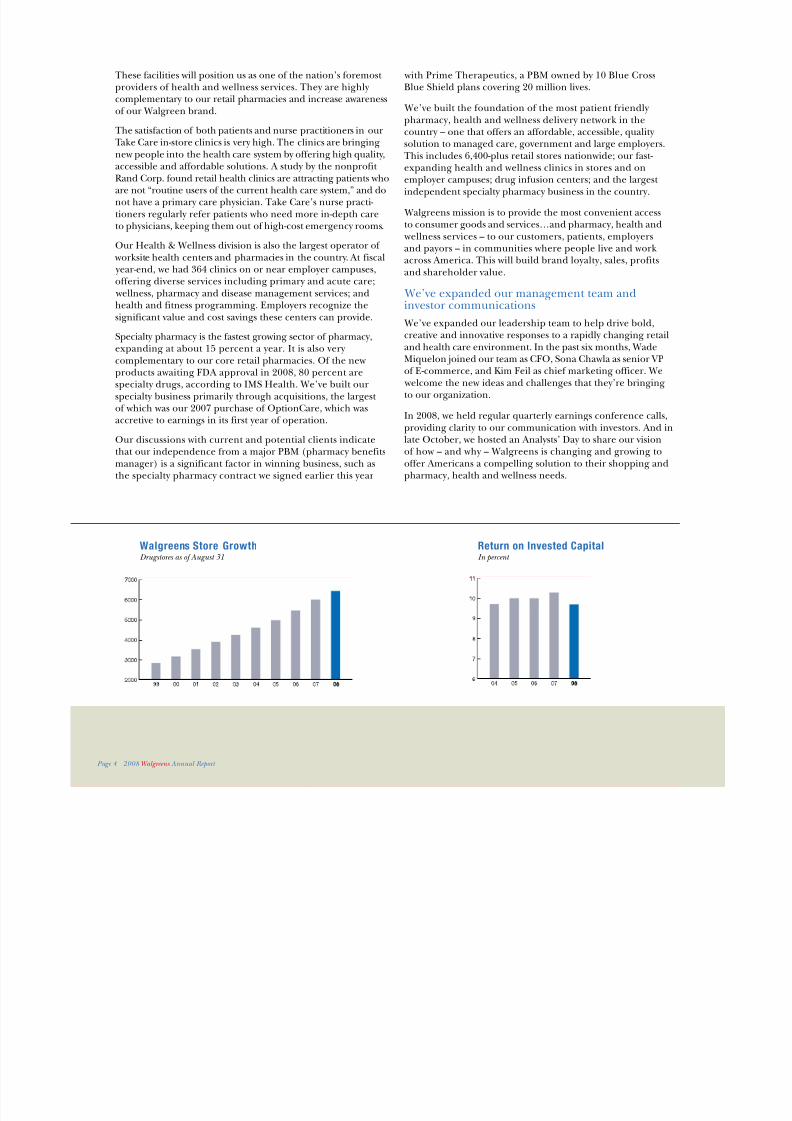
Walgreens Store Growth Drugstores as of August 31
Return on Invested CapitalIn percent
Page 4 2008 Walgreens Annual Report

8/6/2019 2008AR Walgreens
http://slidepdf.com/reader/full/2008ar-walgreens 7/40
2008 Walgreens Annual Report Page 5
The challenges
Industry-wide, prescriptions are growing at the slowest pace in47 years, according to IMS Health. Several factors drove thisslowdown in 2008, including the switch of the allergy drug Zyrtecfrom prescription to over-the-counter status, fewer new drugintroductions and safety concerns over newer medications.The good news is that we continue to gain prescription market
share and now fill 17.6 percent of all retail prescriptions inthe country, up from 16.8 percent last fiscal year.
According to a July survey by the National Association of Insurance Commissioners, 22 percent of Americans arereducing doctor visits and 11 percent are scaling back onmedication use. While the drugstore business historically hasbeen recession resistant, no retailer is immune to the impact of rising unemployment, inflation and wealth erosion onmillions of cash- and credit-strapped consumers.
When it comes to the holidays, we believe we’re well-positioned.Few people “cancel” Christmas and other major holidays, but they do “buy down.” We’ve performed well in past recessionsas people seek value in our lower priced toys, electronicsand seasonal décor. We also bought carefully for 2008 as weanticipated a prudent consumer. Overall, we remain cautiousin our outlook for fiscal 2009.
Looking ahead
We’re working within Walgreens and through our industry groups to mitigate proposed reductions in prescriptionreimbursement. Aggressive cuts in Medicaid prescriptionpayments for those on state aid can reduce access for patients
who need care the most.
Over the longer term, we foresee strong demand for our healthand wellness offerings as baby boomers age. Prescriptions areprojected to represent just 10.3 percent of American health care
spending in 2008, and are one of the most important factors inpreventing far costlier care in hospitals and emergency rooms.Employers, insurance companies and government have anenormous stake in keeping people on their medication andout of high-cost care.
Our Board of Directors has formed a special committee that iscurrently conducting a nationwide search for a permanent CEO. The committee is considering both internal and externalcandidates. Meanwhile, we thank retired CEO Jeff Rein for his
outstanding contributions to the company over the past 26 years. From his days as an assistant manager to his years in topmanagement, Jeff worked tirelessly to make Walgreens betterfor shareholders, customers and employees. His respect forindividuals is a lesson – and a gift – which he has left to somany here at Walgreens.
In closing, thank you to our investors for your commitment andsupport. And a special thanks to our 237,000 employees who arethe face of Walgreens to millions of customers every day.
Sincerely,
Alan G. McNally
Chairman and acting Chief Executive Officer
Gregory D. Wasson
President and Chief Operating Officer
November 17, 2008
Room to growBrandon Mayberry, management trainee
in Dallas, is training to become a store
manager. “My goal is to have my own
store by next year,” says Mayberry, who
joined Walgreens in 2003. The company
promoted nearly 900 trainees to store
manager in fiscal 2008. The top growth
areas for hiring store employees in 2008
were New York, Puerto Rico, California,
Texas and Georgia.

8/6/2019 2008AR Walgreens
http://slidepdf.com/reader/full/2008ar-walgreens 8/40
Page 6 2008 Walgreens Annual Report
…for our patients
C A R E & C O N V E N I E N C E
Rene Wolf (seated) and her study
group in Asheville, North Carolina,are mastering French. Wolf, 85, alsostudies Spanish, acts in a theater group
and handles publicity for a community organization. She and her husbandare two of millions of Walgreenpharmacy patients.
8/6/2019 2008AR Walgreens
http://slidepdf.com/reader/full/2008ar-walgreens 9/40
2008 Walgreens Annual Report Page 7
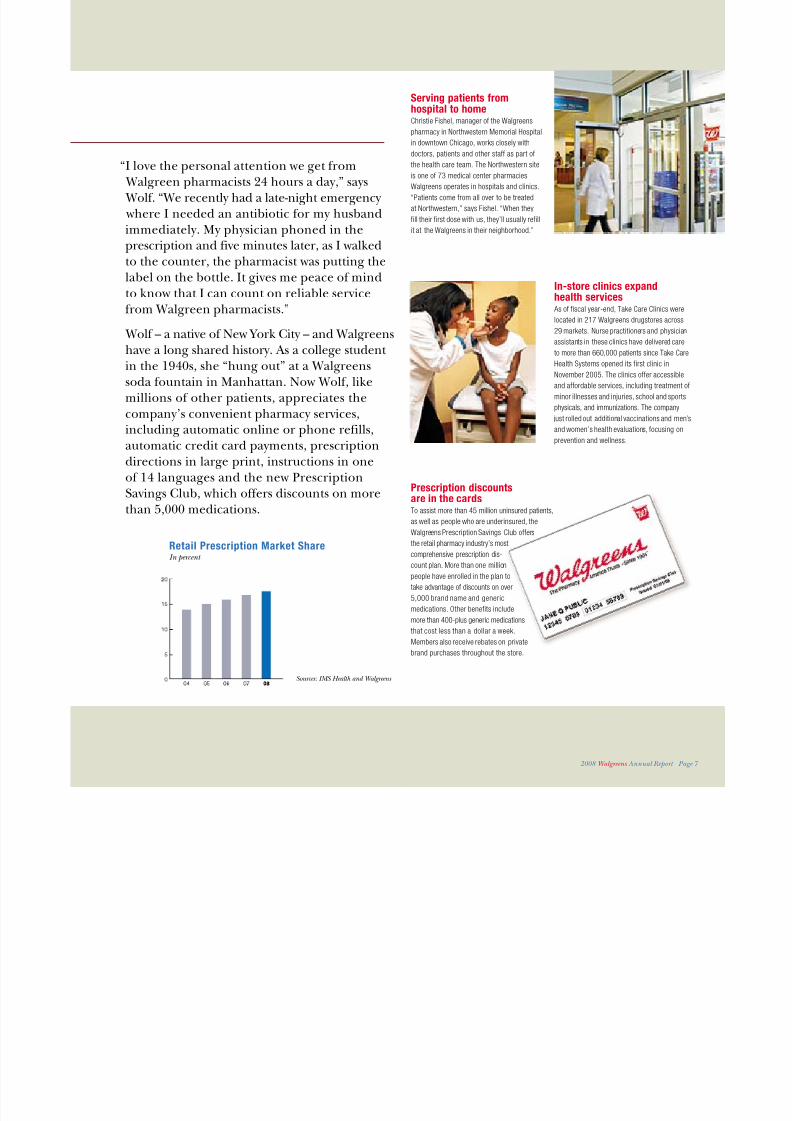
Serving patients fromhospital to homeChristie Fishel, manager of the Walgreens
pharmacy in Northwestern Memorial Hospital
in downtown Chicago, works closely with
doctors, patients and other staff as part of
the health care team. The Northwestern site
is one of 73 medical center pharmacies
Walgreens operates in hospitals and clinics.
“Patients come from all over to be treated
at Northwestern,” says Fishel. “When they
fill their first dose with us, they’ll usually refill
it at the Walgreens in their neighborhood.”
In-store clinics expandhealth services
As of fiscal year-end, Take Care Clinics were
located in 217 Walgreens drugstores across
29 markets. Nurse practitioners and physician
assistants in these clinics have delivered care
to more than 660,000 patients since Take Care
Health Systems opened its first clinic in
November 2005. The clinics offer accessible
and affordable services, including treatment of
minor illnesses and injuries, school and sports
physicals, and immunizations. The company
just rolled out additional vaccinations and men’s
and women’s health evaluations, focusing on
prevention and wellness.
Sources: IMS Health and Walgreens
“I love the personal attention we get from Walgreen pharmacists 24 hours a day,” says Wolf. “We recently had a late-night emergency where I needed an antibiotic for my husband
immediately. My physician phoned in theprescription and five minutes later, as I walkedto the counter, the pharmacist was putting thelabel on the bottle. It gives me peace of mindto know that I can count on reliable servicefrom Walgreen pharmacists.”
Wolf – a native of New York City – and Walgreens
have a long shared history. As a college student in the 1940s, she “hung out” at a Walgreenssoda fountain in Manhattan. Now Wolf, likemillions of other patients, appreciates thecompany’s convenient pharmacy services,including automatic online or phone refills,automatic credit card payments, prescription
directions in large print, instructions in oneof 14 languages and the new PrescriptionSavings Club, which offers discounts on morethan 5,000 medications.
Retail Prescription Market ShareIn percent
Prescription discountsare in the cardsTo assist more than 45 million uninsured patients,
as well as people who are underinsured, the
Walgreens Prescription Savings Club offers
the retail pharmacy industry’s most
comprehensive prescription dis-
count plan. More than one million
people have enrolled in the plan totake advantage of discounts on over
5,000 brand name and generic
medications. Other benefits include
more than 400-plus generic medications
that cost less than a dollar a week.
Members also receive rebates on private
brand purchases throughout the store.

8/6/2019 2008AR Walgreens
http://slidepdf.com/reader/full/2008ar-walgreens 10/40
…for our customers
C A R E & C O N V E N I E N C E
Walgreens is the closest retail store to
Boston Latin Academy, a public magnet school in Dorchester, Massachusetts, that enrolls students with top grades from
the entire Boston area. These varsity soccer team members put togethera summer group to hone their skillsbefore the regular fall season. Walgreens
is a part of their daily routine as themost convenient spot to pick up snacks,beverages and school supplies.
Page 8 2008 Walgreens Annual Report

8/6/2019 2008AR Walgreens
http://slidepdf.com/reader/full/2008ar-walgreens 11/40
2008 Walgreens Annual Report Page 9
Gift cards drive salesNewly designed Walgreen gift cards for
seasonal merchandise and toys have been
added to a line of private brand cards for
birthdays, photo gifts and the “perfect gift”
for women. These offer gift-giving options
targeted toward different customer groups.
Within the first five weeks of introduction,
customers loaded the new cards with
approximately 20 percent higher values
than placed on previous designs.
“SaturDate” fever catches onOne Saturday a month, beauty advisors have
a “SaturDate with Beauty,” dedicated to selling
a selected beauty product or line. “I love the
one-on-one interaction with customers,” saysStephanie Farley (left), senior beauty advisor
in Hickory, North Carolina. The effects of
a struggling economy have changed the
shopping habits of many cosmetics customers
who have cut back on expensive trips to
department stores and beauty salons.
Instead, they’re purchasing hair color,
skincare and nail products at Walgreens
to use at home.
Outselling the CompetitionSales trends for Walgreens top 60 categories In percent, for 52 weeks ending August 31, 2008
The company’s 6,400-plus retail locationsoffer services such as printer cartridgerefills, Redbox DVD rentals and a broadassortment of consumable merchandise
to attract these students, their familiesand the 5.3 million customers who visit Walgreens every day.
Customers are also attracted to productssuch as “Yes to Carrots,” the fastest growingbrand in our natural skincare category.In toys, the company sold more than one
million Webkinz in the last half of 2008. Walgreens was the first drugstore retailerto offer these top-selling plush animals.In over-the-counter (OTC) medications, Walgreens led the marketplace in sales when the allergy drug Zyrtec switchedto OTC status in 2008.
Source: The Nielsen Company
Propelling privatebrand salesThe company rebranded the
“Walgreens” and “W” brand
lines in 2008. Redesigned
packaging for both brands –
almost 2,000 products – has
a clean, streamlined and
consistent design. Consumers
are attracted to the quality and
value of these products, especially
as they wrestle with today’s
economic challenges, includinghigher costs for food and fuel.

8/6/2019 2008AR Walgreens
http://slidepdf.com/reader/full/2008ar-walgreens 12/40
…where people work
C A R E & C O N V E N I E N C E
Tammy Porter has worked in assembly
at the BMW manufacturing plant inSpartanburg, South Carolina, for eight years. Her employer houses one of
Walgreens worksite pharmacy locations where Porter can pick up prescriptions.“It’s the best of both worlds,” says Porter.“I can use the pharmacy at the factory
for emergency prescriptions, but havethe convenience of a Walgreens openseven days a week near my home.”
Page 10 2008 Walgreens Annual Report

8/6/2019 2008AR Walgreens
http://slidepdf.com/reader/full/2008ar-walgreens 13/40
2008 Walgreens Annual Report Page 11
Worksite clinics producehealthy growthEmployees and their families at The Scotts
Miracle-Gro Company headquarters in
Marysville, Ohio, benefit from Walgreens
on-site fitness, nutrition, primary care,
urgent care, occupational health and
physical therapy services. Here, trainer
Chris Slagle helps the spouse of an
employee stay in shape in conjunction
with his physical therapy treatments.
At fiscal year-end, Walgreens operated
clinics on 364 employer campuses acrossmore than 180 clients in 42 states,
the District of Columbia and Guam.
Building a blue-chipclient baseThrough the March acquisitions of I-trax
in Pennsylvania and Whole Health
Management in Cleveland, Walgreens
now operates worksite health centersin corporations including the blue-chip
names below.
Today, Walgreens is the largest operatorof worksite health centers in the country through its Take Care Health EmployerSolutions group. The group is part of the
company’s new Health & Wellness division,formed last spring to operate Walgreensin-store Take Care Clinics and employer worksite health centers.
Worksite health centers redefine “Main andMain” to include places of employment. Thegoal is to provide access to high-quality health
and wellness programs for our clients and theiremployees, while generating new patients,incremental revenue and additional profits.
Research shows that these facilities loweroverall employer health costs. DarrellDouglas, a former health care specialist forBlue Ridge Paper (now part of EvergreenPackaging), found that over a five-yearperiod the factory’s worksite health centerreduced costs by 6 percent, or more than$17.5 million. Short-term disability casesat the facility declined by 30 percent andsick days dropped by nearly 50 percent.

8/6/2019 2008AR Walgreens
http://slidepdf.com/reader/full/2008ar-walgreens 14/40
…to enhance pharmacy services
C A R E & C O N V E N I E N C E
Joe MacDonald and his sons Julian(12) and Caeleb (2) enjoy a family tripto Red Rock State Park in Denver.Both boys have severe hemophiliaand use Walgreens Home Care servicesfor infusions about three times a week.“We want our sons to live full andhappy lives,” says Joe. “And Walgreensis helping us do that.”
Page 12 2008 Walgreens Annual Report

8/6/2019 2008AR Walgreens
http://slidepdf.com/reader/full/2008ar-walgreens 15/40
2008 Walgreens Annual Report Page 13
Specialty pharmacy buildshealth and wellness servicesSpecialty pharmacy – comprised of high-cost
biologic, infusible, injectable and cancer drugs
requiring enhanced care – accounts for one-fifth
of the $280 billion Americans spend annually on
pharmaceuticals. By 2010, half of all Food &
Drug Administration drug approvals will be for
specialty medications. As a result of Walgreens
recent acquisitions of providers such as
Medmark, Schraft’s and OptionCare, today the
company is the largest independent specialty
pharmacy provider in the country.
“We knew nothing about hemophilia until Julian was born,” says their mother, CazandraMacDonald. “Now these treatments are just part of our lives. Julian infuses himself with
the blood factor that helps the clottingprocess, and my husband and I infuseCaeleb. Our care coordinator makes sure we’re supplied with enough blood factor,as well as ancillary supplies.”
A 2006 study showed that hemophiliapatients receiving care from Walgreens
Home Care had a 27 percent lower rateof hospitalization than hemophilia patientscared for elsewhere. Other conditionsfor which Walgreens provides specializedservices include treatments for cancer,immune deficiency, infertility, multiplesclerosis, nutritional disorders and
rheumatoid arthritis.
Placing pharmaciesnear physiciansDistrict manager Rod Andrews (left) and
district pharmacy supervisor Joseph Moy
visit Walgreens new store in Garden City,
New York, which is on the first floor of a
two-story wellness center. The building
includes cardiology, fertility and orthopedic
clinics serving patients who can now
conveniently fill their prescriptions at
Walgreens. “This location fits perfectly
with our strategy to expand specialty
pharmacy,” says Andrews. “We have anarrangement where patients from the
fertility clinic can order medications from
Schraft’s, the specialty pharmacy we
acquired in 2005.”
Providing home infusionand respiratory therapyRose Holt (left) in Asheville, North Carolina,
is one of 44 million American caregivers.
She helps Addie Thomas (right) five days
a week by cleaning, cooking and runningerrands. Caregivers like Holt rely on more
than 100 Walgreens Home Care facilities in
36 states for products, services and health
information. The company provides infusion
medications and services and respiratory
care. Walgreens also sells home medical
equipment, including walkers, canes and
sleep apnea products.
Total Specialty PharmacyDrug ExpendituresIn billions of dollars, projected
Sources: National Association of Chain Drug Stores and Walgreens

8/6/2019 2008AR Walgreens
http://slidepdf.com/reader/full/2008ar-walgreens 16/40
…for the community
C A R E & C O N V E N I E N C E
Disaster struck the lives of many Walgreen employees in eastern Iowa when heavy rains flooded their homesin June. Julia Harris, senior beauty advisor in Cedar Rapids, was one of many people who received assistancefrom the Walgreen Benefit Fund foremergency expenses such as food,hotel and clothes.
Page 14 2008 Walgreens Annual Report

8/6/2019 2008AR Walgreens
http://slidepdf.com/reader/full/2008ar-walgreens 17/40
2008 Walgreens Annual Report Page 15
Committed to schoolsand scholarsViridiana Fajardo, a junior at St. Martin
de Porres High School in Waukegan, Illinois,
works in the Marketing Services department
at Walgreens corporate headquarters in
Deerfield, Illinois, five days a month. She
participates in her high school’s work
study program, which pays for part of her
education. This is one of several mentoring
programs Walgreen sponsors to help
students. To support pharmacy student
programs in 2008, the company donated$1 million to help pharmacy schools
become more diverse.
“I’d lived in the house for only two-and-a-half years when the flood destroyed everything,”says Harris. “I moved in with relatives, sent my dog to stay with a friend and started to
rebuild my life. My co-workers providedtremendous hope and support, and thecompany’s Benefit Fund allowed me to start needed repairs right away.”
The Fund, a tax-exempt foundation, wasstarted during the Great Depression whenfounder Charles Walgreen Sr. set aside
emergency monies for employees andretirees. In 2008, the fund granted$1.5 million to employees or retireesin distress.
Putting the “green”in Walgreens
Walgreen sold more than one million recyclable“green” bags in the first year the product was
carried. If those bags stop customers from
using a plastic bag just every other week, they
keep more than 26 million plastic bags out of
landfills in a year. Other environmental projects
include energy-efficient lighting in stores and
the recycling of cardboard and shrink wrap in
distribution centers. Solar energy now powers
up to 10 percent of two distribution centers’
electricity needs. Walgreens also opened itsfirst “green roof” store last summer in Chicago.
Using drought-tolerant plants contained in
movable trays, green roofs absorb less of
the sun’s heat, keeping buildings cooler
and saving energy.
A special employeebrings his store joyLouis Kline, a Walgreens service clerk with
Down syndrome in Lakeland, Tennessee,stocks shelves and makes customers and
employees smile. “When Louis arrives at the
store, he starts by greeting everyone by
name,” says store manager Mark Lehner.
“We look forward to those times because
he’s a joy to be with.” In addition to employing
approximately 500 people with physical or
cognitive disabilities in 18 distribution facilities,
the company is welcoming more people
with disabilities into the retail workforce.
Wellness tour wheels free
screenings across AmericaWalgreens fleet of 10 wellness buses travels
across the United States and Puerto Rico to
provide free health care screenings and educa-
tional materials to underserved neighborhoods.
Each bus offers five screenings – blood glucose,
total cholesterol, blood pressure, body mass
index and bone density. The tour’s goal,
through February 2009, is to stop at more
than 2,400 stores and special events and to
provide $35 million worth of free screenings.

8/6/2019 2008AR Walgreens
http://slidepdf.com/reader/full/2008ar-walgreens 18/40
Board of DirectorsAs of November 17, 2008
OfficersAs of November 17, 2008
Chairman and actingChief Executive Officer
Alan G. McNally
President andChief Operating OfficerGregory D. Wasson
Executive Vice Presidents
George J. Riedl
Merchandising
Mark A. WagnerStore Operations
Senior Vice Presidents
Stanley B. Blaylock President Walgreens Health Services
R. Bruce BryantWestern Store Operations
Sona ChawlaE-commerce
Kermit R. CrawfordPharmacy
Debra M. FergusonMidwest Store Operations
Dana I. GreenGeneral Counsel and Corporate Secretary
William M. HandalEastern Store Operations
Donald C. HuonkerHealth Care Innovation
J. Randolph Lewis
Distribution & Logistics
Wade D. MiquelonChief Financial Officer
Hal F. RosenbluthPresident Health & Wellness
William M. RudolphsenChief Risk Officer
William A. ShielFacilities Development
Kevin P. Walgreen
Southern Store Operations
Kenneth R. WeigandHuman Resources
Vice Presidents
Kimberly L. FeilChief Marketing Officer
Mia M. ScholzChief Accounting Officer Controller
David A. Van HowePurchasing
Denise K. WongChief Information Officer
Robert G. ZimmermanCorporate Development
General AuditorChester G. Young
TreasurerJohn W. Spina
Page 16 2008 Walgreens Annual Report
Charles R. Walgreen IIIChairman EmeritusElected 1963 (3)
Marilou M. von FerstelFormer ExecutiveVice Presidentand General Manager –Ogilvy Public RelationsWorldwideElected 1987 (1) (4)
William C. FooteChairman of the Board andChief Executive Officer –USG CorporationElected 1997 (2) (4*)
Cordell ReedFormer Senior VicePresident –Commonwealth Edison Co.Elected 1994 (2) (3)
James A. SkinnerVice Chairman andChief Executive Officer –McDonald’s CorporationElected 2005 (1) (2 * ) (3)
Alejandro SilvaChairman andChief Executive Officer –Evans Food Group, Inc.Elected 2008 (1) (4)
David Y. SchwartzFormer Partner –
Arthur Andersen LLPElected 2000 (1*) (3*)
Nancy M. SchlichtingPresident andChief Executive Officer –Henry Ford Health SystemElected 2006 (1) (2)
(Back row – left to right)
(Front row – left to right)
(1) Audit Committee (2) Compensation Committee (3) Finance Committee (4) Nominating and Governance Committee * Committee Chair
Alan G. McNallyChairman of the Board –Walgreen Co.Special Advisor –Harris Financial CorporationElected 1999

8/6/2019 2008AR Walgreens
http://slidepdf.com/reader/full/2008ar-walgreens 19/40
Five-Year Summary of Selected Consolidated Financial Data Walgreen Co. and Subsidiaries (Dollars in millions, except per share amounts)
Fiscal Year 2008 2007 2006 2005 2004
Net Sales $59,034 $53,762 $47,409 $42,202 $ 37,508Costs and Deductions Cost of sales 42,391 38,518 34,240 30,414 27,310
Selling, general and administrative (1) 13,202 12,093 10,467 9,364 8,055
Other income (expense) (11) 38 52 32 17
Total Costs and Deductions 55,604 50,573 44,655 39,746 35,348
Earnings Earnings Before Income Tax Provision 3,430 3,189 2,754 2,456 2,160
Income tax provision 1,273 1,148 1,003 896 810
Net Earnings $ 2,157 $ 2,041 $ 1,751 $ 1,560 $ 1,350
Per Common Share Net earnings
Basic $ 2.18 $ 2.04 $ 1.73 $ 1.53 $ 1.32
Diluted 2.17 2.03 1.72 1.52 1.31
Dividends declared .40 .33 .27 .22 .18
Book value 13.01 11.20 10.04 8.77 7.95
Non-Current Liabilities Long-term debt $ 1,337 $ 22 $ 3 $ 12 $ 12
Deferred income taxes 150 158 141 240 274
Other non-current liabilities 1,410 1,285 1,116 986 838
Assets and Equity Total assets $22,410 $19,314 $ 17,131 $14,609 $13,342
Shareholders’ equity 12,869 11,104 10,116 8,890 8,140
Return on average shareholders’ equity 18.0% 19.2% 18.4% 18.3% 17.7%
Locations Year-end (2) 6,934 5,997 5,461 4,985 4,613
(1) Fiscal 2008 included a positive pre-tax adjustment of $79 million ($.050 per share, diluted), which corrected for historically over-accruing the company’s vacation liability. Fiscal 2008 and fiscal 2007 had insignificant pre-tax income from litigation settlement gains. Fiscal 2006,2005 and 2004 included pre-tax income of $7 million ($.005 per share, diluted), $26 million ($.016 per share, diluted) and $16 million ($.010 per share, diluted) respectively, from litigation settlements. Fiscal 2006 included a $12 million ($.008 per share, diluted) downward adjustment of the fiscal 2005 pre-tax expenses of $55 million ($.033 per share, diluted) related to Hurricane Katrina.
(2) Locations include drugstores, worksite facilities, home care facilities, specialty pharmacies and mail service facilities.
2008 Walgreens Annual Report Page 17
M ’ Di i d A l i f R l f O i

8/6/2019 2008AR Walgreens
http://slidepdf.com/reader/full/2008ar-walgreens 20/40
Management’s Discussion and Analysis of Results of Operationsand Financial Condition
Operating Statistics
Percentage Increases
Fiscal Year 2008 2007 2006
Net Sales 9.8 13.4 12.3
Net Earnings 5.7 16.6 12.3
Comparable Drugstore Sales 4.0 8.1 7.7
Prescription Sales 9.7 14.7 13.3
Comparable Drugstore Prescription Sales 3.9 9.5 9.2
Front-End Sales 10.0 12.2 10.9
Comparable Drugstore Front-End Sales 4.2 5.8 5.3
Gross Profit 9.2 15.8 11.7
Selling, General and Administrative Expenses 9.2 15.5 11.8
Percent to Net Sales
Fiscal Year 2008 2007 2006
Gross Margin 28.2 28.4 27.8
Selling, General and Administrative Expenses 22.4 22.5 22.1
Other Statistics
Fiscal Year 2008 2007 2006
Prescription Sales as a % of Net Sales 64.9 65.0 64.3
Third Party Sales as a % of TotalPrescription Sales 95.3 94.8 93.1
Total Number of Prescriptions (In millions) 617 583 530
Total Number of Locations 6,934 5,997 5,461
Results of Operations
Fiscal year 2008 net earnings increased 5.7% to $2,157 million, or $2.17 per
share (diluted), versus last year’s earnings of $2,041 million, or $2.03 per share
(diluted). The net earnings increase resulted from improved sales, which were
partially offset by lower gross margins and higher interest expense. The current
year was also benefited by a positive adjustment of $79 million, which correctedfor historically over-accruing the company’s vacation liability.
Net sales increased by 9.8% to $59,034 million in fiscal 2008 compared to
increases of 13.4% in 2007 and 12.3% in 2006. Drugstore sales increases resulted
from sales gains in existing stores and added sales from new stores, each of
which include an indeterminate amount of market-driven price changes. Sales in
comparable drugstores were up 4.0% in 2008, 8.1% in 2007 and 7.7% in 2006.
Comparable drugstores are defined as those that have been open for at least
twelve consecutive months without closure for seven or more consecutive days
and without a major remodel or a natural disaster in the past twelve months.Relocated and acquired stores are not included as comparable stores for the
first twelve months after the relocation or acquisition. We operated 6,934 locations
as of August 31, 2008, compared to 5,997 at August 31, 2007, and 5,461
at August 31, 2006.
Prescription sales increased 9.7% in 2008, 14.7% in 2007 and 13.3% in 2006.
Comparable drugstore prescription sales were up 3.9% in 2008 compared to
increases of 9.5% in 2007 and 9.2% in 2006. Prescription sales as a percent of
total net sales were 64.9% in 2008, 65.0% in 2007 and 64.3% in 2006. The
effect of generic drugs introduced during the fiscal year, which replaced higher
priced retail brand name drugs, reduced prescription sales by 3.5% for 2008,
4.2% for 2007 and 2.0% for 2006, while the effect on total sales was 2.2% for
2008, 2.5% for 2007 and 1.2% for 2006. Third party sales, where reimbursement
is received from managed care organizations, the government or private insurers,
Introduction
Walgreens is principally a retail drugstore chain that sells prescription and non-
prescription drugs and general merchandise. General merchandise includes,among other things, beauty care, personal care, household items, candy,
photofinishing, greeting cards, convenience foods and seasonal items. Customers
can have prescriptions filled in retail pharmacies, as well as through the
mail, by telephone and via the Internet. As of August 31, 2008, we operated
6,934 locations in 49 states, the District of Columbia, Guam and Puerto Rico.
Total locations do not include 217 convenient care clinics operated by
Take Care Health Systems, Inc.
Number of Locations
Location Type 2008 2007 2006Drugstores 6,443 5,882 5,414
Worksite Facilities 364 3 –
Home Care Facilities 115 101 38
Specialty Pharmacies 10 8 6
Mail Service Facilities 2 3 3
Total 6,934 5,997 5,461
The drugstore industry is highly competitive. In addition to other drugstore chains,
independent drugstores and mail order prescription providers, we compete with
various other retailers including grocery stores, convenience stores, mass merchantsand dollar stores.
The long-term outlook for prescription utilization is strong due in part to the aging
population and the continued development of innovative drugs that improve quality
of life and control health care costs. Certain provisions of the Deficit Reduction Act
of 2005 seek to reduce federal spending by altering the Medicaid reimbursement
formula for multi-source (i.e., generic) drugs. These changes are expected to result
in reduced Medicaid reimbursement rates for our retail pharmacies.
Front-end sales have continued to grow due to strengthening core categories, such
as over-the-counter non-prescription drugs, beauty care, household and personalcare products. Walgreens strong name recognition continues to drive private brand
sales, which are included in these core categories.
We continue to expand into new markets and increase penetration in existing
markets. To support our growth, we are investing significantly in prime locations,
technology and customer service initiatives. Retail organic growth continues to be
our primary growth vehicle; however, consideration is given to retail and other
acquisitions that provide unique opportunities and fit our business strategies, such
as the acquisitions of I-trax, Inc. and Whole Health Management, operators of
worksite health centers, including primary and acute care, wellness, pharmacyand disease management services and health and fitness programming.
We are engaged in company-wide strategic initiatives to broaden access to our
products and services, enhance the customer experience for our shoppers,
patients and payors, and reduce costs to improve productivity. These strategies
are intended to enable us to provide the most convenient access to consumer
goods and services, and pharmacy, health and wellness services; offer a consistent
customer experience across all channels; and ensure that cost, culture and
capabilities support and enable our strategies. On October 30, 2008, we
announced an initiative to improve efficiency and effectiveness, which targets
$1 billion in annual cost savings by fiscal 2011. In conjunction with this initiative,we anticipate incurring total costs of approximately $300 million to $400 million
over fiscal 2009 and 2010.
Page 18 2008 Walgreens Annual Report

8/6/2019 2008AR Walgreens
http://slidepdf.com/reader/full/2008ar-walgreens 21/40
Interest was a net expense of $11 million for fiscal 2008 as compared to net interest
income of $38 million and $52 million in fiscal 2007 and 2006, respectively.
The change in net interest over the prior year is attributed to higher short-termborrowings, the issuance of long-term debt and lower short-term investments
available for sale. Interest expense for the current year is net of $19 million, which
was capitalized to construction projects. Last year we capitalized $6 million of
interest to construction projects. As a result of our long-term bond offering, interest
expense and the amount capitalized to construction projects was higher than the
prior year. The reduction in net interest income from fiscal 2006 to fiscal 2007 was
due to lower short-term investment balances as cash was used to fund business
acquisitions and stock repurchases.
The effective income tax rate was 37.1% for fiscal 2008, 36.0% for 2007 and
36.4% for 2006. Fiscal 2007 reflects the favorable resolution of a multiyear state
tax matter and a lower effective state tax rate as compared to the prior year.
Fiscal 2006 reflects the favorable settlement of prior years’ Internal Revenue
Service matters.
Critical Accounting Policies
The consolidated financial statements are prepared in accordance with accounting
principles generally accepted in the United States of America and include amounts
based on management’s prudent judgments and estimates. Actual results may differ
from these estimates. Management believes that any reasonable deviation from
those judgments and estimates would not have a material impact on our consoli-dated financial position or results of operations. To the extent that the estimates
used differ from actual results, however, adjustments to the statement of earnings
and corresponding balance sheet accounts would be necessary. These adjustments
would be made in future statements. Some of the more significant estimates
include goodwill and other intangible asset impairment, allowance for doubtful
accounts, vendor allowances, liability for closed locations, liability for insurance
claims, cost of sales and income taxes. We use the following methods to
determine our estimates:
Goodwill and other intangible asset impairment – Goodwill and other indefinite-livedintangible assets are not amortized, but are evaluated for impairment annually or
whenever events or changes in circumstances indicate that the value of a certain
asset may be impaired. The process of evaluating goodwill for impairment involves
the determination of fair value. Inherent in such fair value determinations are certain
judgments and estimates, including the interpretation of economic indicators and
market valuations and assumptions about our business plans. We have not made
any material changes to the method of evaluating goodwill and intangible asset
impairments during the last three years. Based on current knowledge, we do not
believe there is a reasonable likelihood that there will be a material change in the
estimate or assumptions used to determine impairment.
Allowance for doubtful accounts – The provision for bad debt is based on both
specific receivables and historic write-off percentages. We have not made any
material changes to the method of estimating our allowance for doubtful accounts
during the last three years. Based on current knowledge, we do not believe there
is a reasonable likelihood that there will be a material change in the estimate or
assumptions used to determine the allowance.
Vendor allowances – Vendor allowances are principally received as a result of
purchase levels, sales or promotion of vendors’ products. Allowances are generally
recorded as a reduction of inventory and are recognized as a reduction of cost of
sales when the related merchandise is sold. Those allowances received for promoting
vendors’ products are offset against advertising expense and result in a reduction
of selling, general and administrative expenses to the extent of advertising incurred,
were 95.3% of prescription sales in 2008, 94.8% in 2007 and 93.1% in 2006.
The total number of prescriptions filled was approximately 617 million in 2008,
583 million in 2007 and 530 million in 2006.Front-end sales increased 10.0% in 2008, 12.2% in 2007 and 10.9% in 2006.
Front-end sales were 35.1% of total sales in fiscal 2008, 35.0% in 2007 and
35.7% in 2006. The increase is due in part to improved sales dollars related to
non-prescription drugs, beauty, household, personal care products and convenience
foods. Comparable drugstore front-end sales increased 4.2% in 2008, 5.8% in
2007 and 5.3% in 2006.
Gross margin as a percent of sales decreased to 28.2% in 2008 from 28.4% in
2007. Overall margins were negatively impacted by non-retail businesses, including
specialty pharmacy, which have lower margins and are becoming a greater partof the total business. This was partially offset by an improvement in retail pharmacy
margins, which were positively influenced by generic drug sales, but to a lesser
extent negatively influenced by the growth in third party pharmacy sales. Front-end
margins remained essentially flat from the prior year as a positive shift in sales mix
was offset by increased promotions. Gross margin as a percent of sales increased
to 28.4% in 2007 from 27.8% in 2006. Retail pharmacy margins increased as a
result of growth in generic drug sales. Front-end margins increased as a result
of a shift in sales mix to higher margin items. These increases were partially
offset by the growth in Medicare Part D and third party pharmacy sales. In addition,
the continuing shift toward the pharmacy business, which carries a lower marginthan front-end merchandise, also negatively impacted margins.
We use the last-in, first-out (“LIFO”) method of inventory valuation. The LIFO provision
is dependent upon inventory levels, inflation rates and merchandise mix. The effective
LIFO inflation rates were 1.28% in 2008, 1.04% in 2007 and 1.53% in 2006,
which resulted in charges to cost of sales of $99 million in 2008, $69 million in
2007 and $95 million in 2006. Inflation on prescription inventory was 2.65% in
2008, .71% in 2007 and 2.37% in 2006. In all three fiscal years, we experienced
deflation in some non-prescription inventories.
Gross profit increased 9.2% in 2008 compared to increases of 15.8% in 2007 and
11.7% in 2006. The decrease from the prior year is due to lower sales growth in
comparison to last year and lower gross profit contribution from generic versions
of the name brand drugs Zocor and Zoloft. The increase in 2007 from 2006 was
attributed to higher gross profit contributions from generic versions of Zocor and
Zoloft along with increased sales growth.
Selling, general and administrative expenses were 22.4% of sales in fiscal 2008,
22.5% in fiscal 2007 and 22.1% in fiscal 2006. In the current year, lower provisions
for legal matters were offset by higher store level expenses as a percentage of
sales. The current year was also benefited by a positive adjustment of $79 million,which corrected for historically over-accruing the company’s vacation liability. The
increase in fiscal 2007 as compared to fiscal 2006 was due to higher store level
salaries and expenses, provisions for legal matters and higher intangible asset
amortization and administrative costs related to acquisitions.
Selling, general and administrative expenses increased 9.2% in fiscal 2008,
15.5% in fiscal 2007 and 11.8% in fiscal 2006. Although store level salaries and
expenses increased at a faster rate than sales, the rate of growth for the current
year was lower than fiscal 2007. Lower provisions for legal matters and insurance
also contributed to the improvement for the current year. In fiscal 2007, the rate ofgrowth for store level salaries and expenses was higher than fiscal 2006. In addition,
higher provisions for legal matters, amortization and administrative costs related to
acquisitions drove the increase from 2006.
2008 Walgreens Annual Report Page 19
Management’s Discussion and Analysis of Results of Operations
8/6/2019 2008AR Walgreens
http://slidepdf.com/reader/full/2008ar-walgreens 22/40
with the excess treated as a reduction of inventory costs. We have not made any
material changes to the method of estimating our vendor allowances during the
last three years. Based on current knowledge, we do not believe there is a reasonablelikelihood that there will be a material change in the estimate or assumptions used
to determine vendor allowances.
Liability for closed locations – The liability is based on the present value of future
rent obligations and other related costs (net of estimated sublease rent) to the first
lease option date. We have not made any material changes to the method of
estimating our liability for closed locations during the last three years. Based on
current knowledge, we do not believe there is a reasonable likelihood that there will
be a material change in the estimate or assumptions used to determine the liability.
Liability for insurance claims – The liability for insurance claims is recorded based
on estimates for claims incurred and is not discounted.The provisions are estimated
in part by considering historical claims experience, demographic factors and other
actuarial assumptions. We have not made any material changes to the method of
estimating our liability for insurance claims during the last three years. Based on
current knowledge, we do not believe there is a reasonable likelihood that there will
be a material change in the estimate or assumptions used to determine the liability.
Cost of sales – Drugstore cost of sales is derived based on point-of-sale scanning
information with an estimate for shrinkage and adjusted based on periodic
inventories. Inventories are valued at the lower of cost or market determined by
the last-in, first-out (LIFO) method. We have not made any material changes to themethod of estimating cost of sales during the last three years. Based on current
knowledge, we do not believe there is a reasonable likelihood that there will be a
material change in the estimate or assumptions used to determine cost of sales.
Income taxes – We are subject to routine income tax audits that occur periodically
in the normal course of business. U.S. federal, state and local and foreign tax
authorities raise questions regarding our tax filing positions, including the timing
and amount of deductions and the allocation of income among various tax jurisdic-
tions. In evaluating the tax benefits associated with our various tax filing positions,
we record a tax benefit for uncertain tax positions using the highest cumulative taxbenefit that is more likely than not to be realized. Adjustments are made to our
liability for unrecognized tax benefits in the period in which we determine the issue
is effectively settled with the tax authorities, the statute of limitations expires for
the return containing the tax position or when more information becomes available.
Our liability for unrecognized tax benefits, including accrued penalties and interest,
is included in other long-term liabilities on our consolidated balance sheets and
in income tax expense in our consolidated statements of earnings.
In determining our provision for income taxes, we use an annual effective income tax
rate based on full year income, permanent differences between book and tax income,
and statutory income tax rates. The effective income tax rate also reflects our assess-ment of the ultimate outcome of tax audits. Discrete events such as audit settlements
or changes in tax laws are recognized in the period in which they occur.
We adopted the provisions of Financial Accounting Standards Board (“FASB”)
Interpretation (“FIN”) No. 48, “Accounting for Uncertainty in Income Taxes –
an Interpretation of FASB Statement No. 109,” effective September 1, 2007. The
adoption of FIN No. 48 resulted in the reclassification of certain tax liabilities
from current to long-term and a decrease in our liability for unrecognized tax
benefits, which was accounted for as an increase to the August 31, 2007,
retained earnings balance. Based on current knowledge, we do not believe thereis a reasonable likelihood that there will be a material change in the estimate
or assumptions used to determine income taxes.
Management’s Discussion and Analysis of Results of Operationsand Financial Condition (continued)
Liquidity and Capital Resources
Cash and cash equivalents were $443 million at August 31, 2008, compared to
$255 million at August 31, 2007. Short-term investment objectives are to minimizerisk, maintain liquidity and maximize after-tax yields. To attain these objectives,
investment limits are placed on the amount, type and issuer of securities.
Investments are principally in U.S. Treasury market funds.
Net cash provided by operating activities was $3,039 million in fiscal 2008 and
$2,357 million in fiscal 2007. Higher net earnings and increased cash from payables
and inventories were partially offset by a decrease in cash from accounts receivable.
The decrease in cash from accounts receivable and the increase in cash from trade
accounts payable are primarily attributed to the loss of the UnitedHealth Group’s
Ovations unit contract in our pharmacy benefit management business as of
December 31, 2006. Cash provided by operations is the principal source of funds forexpansion, acquisitions, remodeling programs, dividends to shareholders and stock
repurchases. In fiscal 2008, we supplemented cash provided by operations with
short-term borrowings and long-term debt.
Net cash used for investing activities was $2,818 million versus $2,396 million last
year. We did not engage in auction rate security sales or purchases in the current
year. Proceeds from the sale of auction rate securities exceeded the purchases of
such securities by $429 million a year ago.
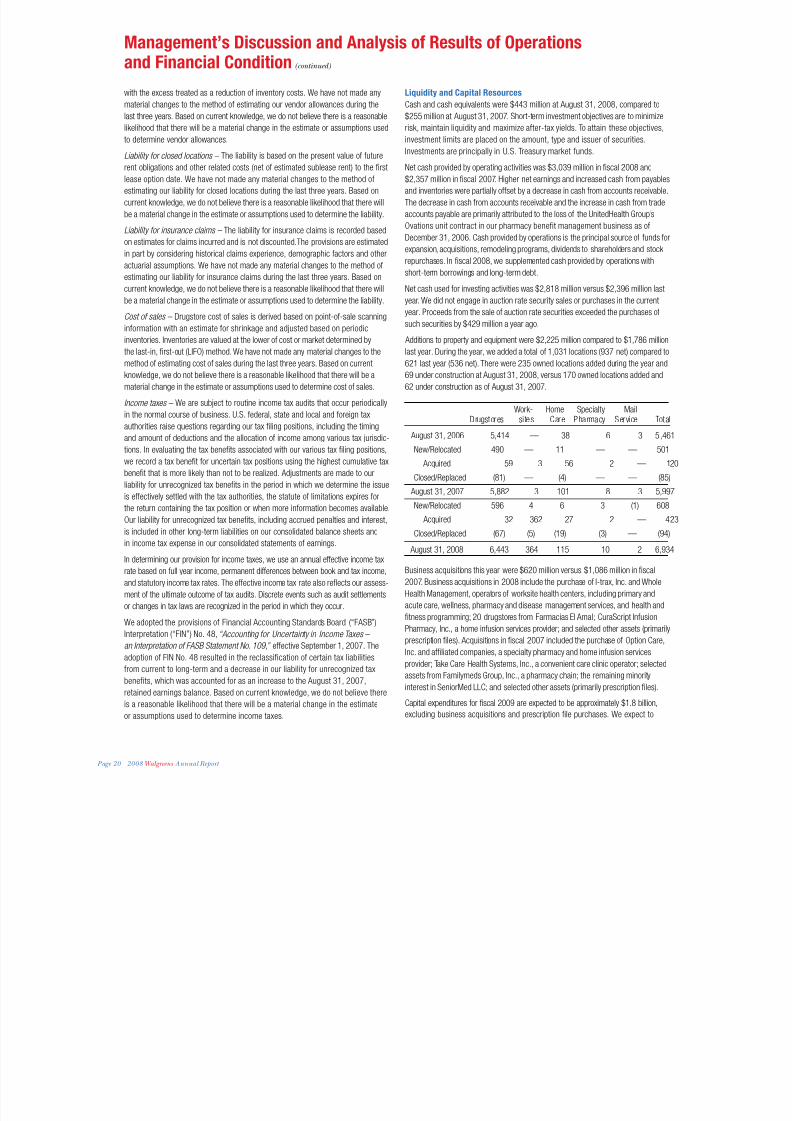
Additions to property and equipment were $2,225 million compared to $1,786 million
last year. During the year, we added a total of 1,031 locations (937 net) compared to621 last year (536 net). There were 235 owned locations added during the year and
69 under construction at August 31, 2008, versus 170 owned locations added and
62 under construction as of August 31, 2007.
Work- Home Specialty MailDrugstores sites Care Pharmacy Service Total
August 31, 2006 5,414 — 38 6 3 5,461
New/Relocated 490 — 11 — — 501
Acquired 59 3 56 2 — 120Closed/Replaced (81) — (4) — — (85)
August 31, 2007 5,882 3 101 8 3 5,997
New/Relocated 596 4 6 3 (1) 608
Acquired 32 362 27 2 — 423
Closed/Replaced (67) (5) (19) (3) — (94)
August 31, 2008 6,443 364 115 10 2 6,934
Business acquisitions this year were $620 million versus $1,086 million in fiscal
2007. Business acquisitions in 2008 include the purchase of I-trax, Inc. and WholeHealth Management, operators of worksite health centers, including primary and
acute care, wellness, pharmacy and disease management services, and health and
fitness programming; 20 drugstores from Farmacias El Amal; CuraScript Infusion
Pharmacy, Inc., a home infusion services provider; and selected other assets (primarily
prescription files). Acquisitions in fiscal 2007 included the purchase of Option Care,
Inc. and affiliated companies, a specialty pharmacy and home infusion services
provider; Take Care Health Systems, Inc., a convenient care clinic operator; selected
assets from Familymeds Group, Inc., a pharmacy chain; the remaining minority
interest in SeniorMed LLC; and selected other assets (primarily prescription files).
Capital expenditures for fiscal 2009 are expected to be approximately $1.8 billion,
excluding business acquisitions and prescription file purchases. We expect to
Page 20 2008 Walgreens Annual Report
8/6/2019 2008AR Walgreens
http://slidepdf.com/reader/full/2008ar-walgreens 23/40
open approximately 540 new drugstores in fiscal 2009, with a net increase of
approximately 475 drugstores, and anticipate having a total of more than 7,000
drugstores by fiscal 2010. We intend to increase new drugstore organic growth by
6 percent and 5 percent in fiscal 2010 and 2011, respectively. During the current
fiscal year we added a total of 1,031 locations, of which 596 were new or relocated
drugstores, with a net gain of 561 drugstores after relocations and closings. We
are continuing to relocate stores to more convenient and profitable freestanding
locations. In addition to new stores, expenditures are planned for distribution
centers and technology. A new distribution center in Windsor, Connecticut, has
an anticipated opening date in fiscal 2009.
Net cash used for financing activities was $33 million compared to $626 million last
year. On July 17, 2008, we issued $1,300 million of 4.875% notes due in 2013.
The notes were issued at a discount. The net proceeds after deducting the discount,underwriting fees and issuance costs were $1,286 million. These proceeds were used
to pay down short-term borrowings. Short-term borrowings paid during the current
fiscal year were $802 million as compared to $850 million of proceeds in the previous
year. Shares totaling $294 million were purchased to support the needs of the
employee stock plans during the current period as compared to $376 million a year
ago. Also included in the prior year was the purchase of $343 million of company
shares for the 2004 stock repurchase program. On January 10, 2007, a new stock
repurchase program (“2007 repurchase program”) of up to $1,000 million was
announced, to be executed over four years. Purchases of company shares relating
to the 2007 repurchase program made in the prior year were $345 million. Norepurchases were made during the current year. We currently do not anticipate stock
repurchases under the 2007 repurchase program in 2009, except to support the
needs of the employee stock plans. We had proceeds related to employee stock
plans of $210 million during the current fiscal year as compared to $266 million a
year ago. Cash dividends paid were $376 million during the current fiscal year versus
$310 million a year ago. A $214 million wire transfer made on August 31, 2006, was
not accepted by our disbursement bank until September 1, 2006, resulting in a bank
overdraft at fiscal 2006 year-end and subsequent repayment on September 1, 2006.
We had $70 million of commercial paper outstanding at a weighted-average interest
rate of 2.10% at August 31, 2008. In connection with our commercial paper
program, we maintained two unsecured backup syndicated lines of credit that total
$1,200 million. The first $600 million facility expires on August 10, 2009; the second
expires on August 12, 2012. Our ability to access these facilities is subject to our
compliance with the terms and conditions of the credit facilities, including financial
covenants. The covenants require us to maintain certain financial ratios related to
minimum net worth and priority debt, along with limitations on the sale of assets and
purchases of investments. As of August 31, 2008, we were in compliance with all
such covenants. On October 12, 2007, we entered into an additional $100 million
unsecured line of credit facility and on November 30, 2007, that credit facility was
amended and increased to include an additional $200 million, for a total of $300 million
unsecured credit. That facility expired on December 31, 2007. On May 15, 2008, we
entered into an additional $500 million unsecured line of credit facility. That facility
expired on July 31, 2008.These lines of credit were subject to similar covenants as
the syndicated lines of credit. The company pays a facility fee to the financing bank to
keep our lines of credit active.As of August 31, 2008, there have been no borrowings
against the credit facilities. We do not expect any borrowings under these facilities,
together with our outstanding commercial paper, to exceed $1,200 million.
In connection with the Option Care, Inc. and affiliated companies acquisition,
$118 million of convertible debt was retired prior to August 31, 2007, while
$28 million remained outstanding as of that date. On September 6, 2007,
the $28 million was retired.
Our current credit ratings are as follows:
Long-Term Commercial
Rating Agency Debt Rating Outlook Paper Rating Outlook
Moody’s A2 Stable P-1 Stable
Standard & Poor’s A+ Stable A-1 Stable
In assessing our credit strength, both Moody’s and Standard & Poor’s consider our
business model, capital structure, financial policies and financial statements. Our credit
ratings impact our borrowing costs, access to capital markets and operating lease costs.
2008 Walgreens Annual Report Page 21
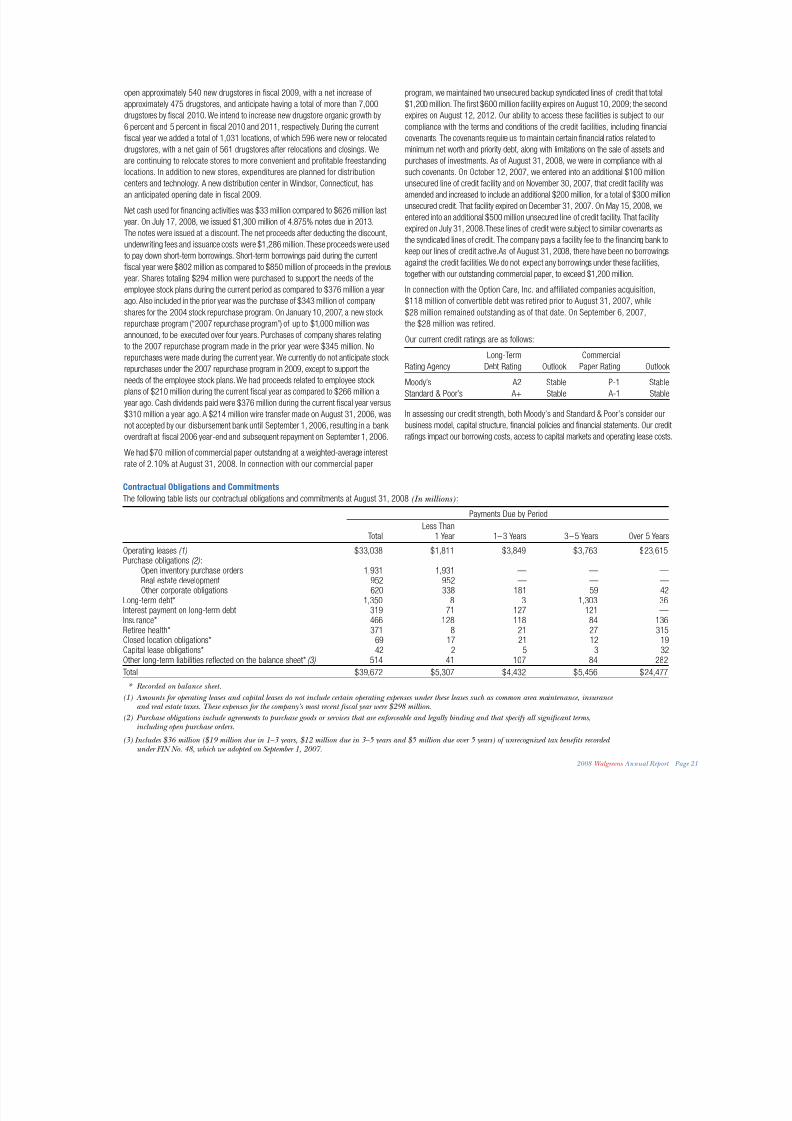
Contractual Obligations and Commitments
The following table lists our contractual obligations and commitments at August 31, 2008 (In millions) :
Payments Due by Period
Less ThanTotal 1 Year 1–3 Years 3–5 Years Over 5 Years
Operating leases (1) $33,038 $1,811 $3,849 $3,763 $23,615Purchase obligations (2) :
Open inventory purchase orders 1,931 1,931 — — —
Real estate development 952 952 — — —Other corporate obligations 620 338 181 59 42
Long-term debt* 1,350 8 3 1,303 36Interest payment on long-term debt 319 71 127 121 —Insurance* 466 128 118 84 136Retiree health* 371 8 21 27 315Closed location obligations* 69 17 21 12 19Capital lease obligations* 42 2 5 3 32Other long-term liabilities reflected on the balance sheet* (3) 514 41 107 84 282
Total $39,672 $5,307 $4,432 $5,456 $24,477
* Recorded on balance sheet.
(1) Amounts for operating leases and capital leases do not include certain operating expenses under these leases such as common area maintenance, insurance and real estate taxes. These expenses for the company’s most recent fiscal year were $298 million.
(2) Purchase obligations include agreements to purchase goods or services that are enforceable and legally binding and that specify all significant terms,including open purchase orders.
(3) Includes $36 million ($19 million due in 1–3 years, $12 million due in 3–5 years and $5 million due over 5 years) of unrecognized tax benefits recorded under FIN No. 48, which we adopted on September 1, 2007.
Management’s Discussion and Analysis of Results of Operations
8/6/2019 2008AR Walgreens
http://slidepdf.com/reader/full/2008ar-walgreens 24/40
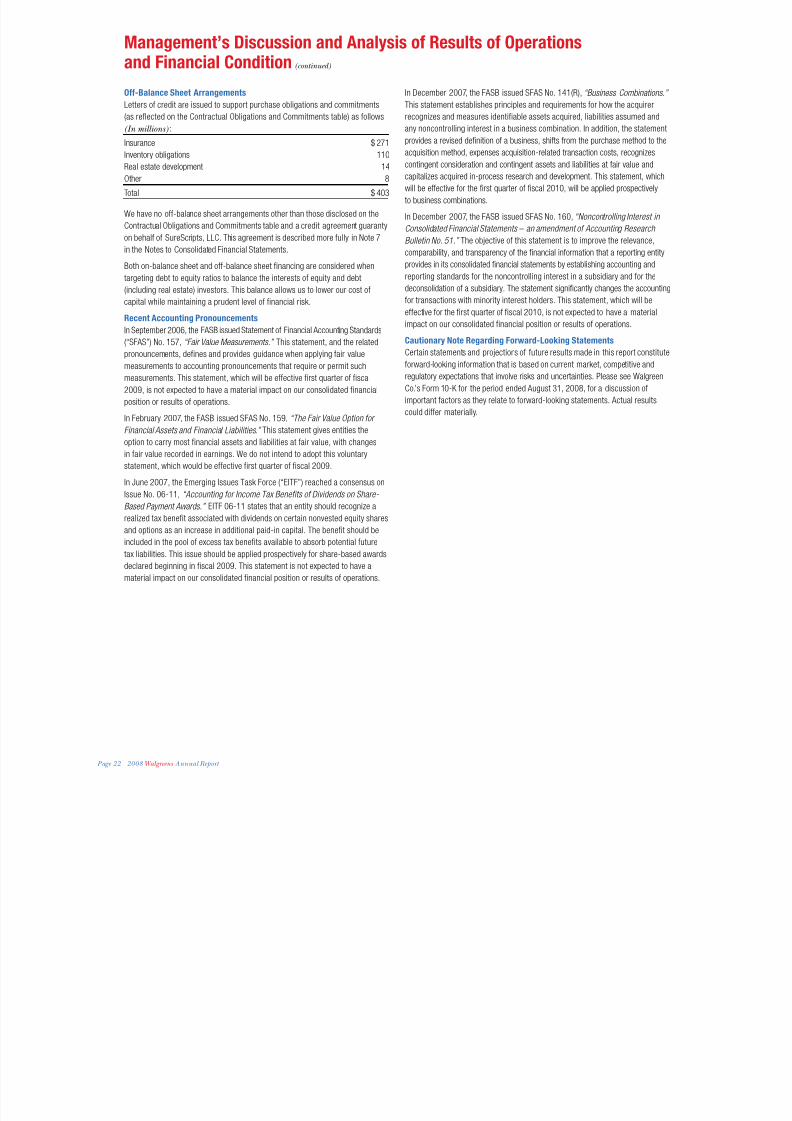
Off-Balance Sheet Arrangements
Letters of credit are issued to support purchase obligations and commitments
(as reflected on the Contractual Obligations and Commitments table) as follows(In millions) :
Insurance $ 271
Inventory obligations 110
Real estate development 14
Other 8
Total $ 403
We have no off-balance sheet arrangements other than those disclosed on the
Contractual Obligations and Commitments table and a credit agreement guaranty
on behalf of SureScripts, LLC. This agreement is described more fully in Note 7in the Notes to Consolidated Financial Statements.
Both on-balance sheet and off-balance sheet financing are considered when
targeting debt to equity ratios to balance the interests of equity and debt
(including real estate) investors. This balance allows us to lower our cost of
capital while maintaining a prudent level of financial risk.
Recent Accounting Pronouncements
In September 2006, the FASB issued Statement of Financial Accounting Standards
(“SFAS”) No. 157, “Fair Value Measurements.” This statement, and the related
pronouncements, defines and provides guidance when applying fair value
measurements to accounting pronouncements that require or permit such
measurements. This statement, which will be effective first quarter of fiscal
2009, is not expected to have a material impact on our consolidated financial
position or results of operations.
In February 2007, the FASB issued SFAS No. 159, “The Fair Value Option for
Financial Assets and Financial Liabilities.” This statement gives entities the
option to carry most financial assets and liabilities at fair value, with changes
in fair value recorded in earnings. We do not intend to adopt this voluntary
statement, which would be effective first quarter of fiscal 2009.
In June 2007, the Emerging Issues Task Force (“EITF”) reached a consensus on
Issue No. 06-11, “Accounting for Income Tax Benefits of Dividends on Share-
Based Payment Awards.” EITF 06-11 states that an entity should recognize a
realized tax benefit associated with dividends on certain nonvested equity shares
and options as an increase in additional paid-in capital. The benefit should be
included in the pool of excess tax benefits available to absorb potential future
tax liabilities. This issue should be applied prospectively for share-based awards
declared beginning in fiscal 2009. This statement is not expected to have a
material impact on our consolidated financial position or results of operations.
Management s Discussion and Analysis of Results of Operationsand Financial Condition (continued)
In December 2007, the FASB issued SFAS No. 141(R), “Business Combinations.”
This statement establishes principles and requirements for how the acquirer
recognizes and measures identifiable assets acquired, liabilities assumed andany noncontrolling interest in a business combination. In addition, the statement
provides a revised definition of a business, shifts from the purchase method to the
acquisition method, expenses acquisition-related transaction costs, recognizes
contingent consideration and contingent assets and liabilities at fair value and
capitalizes acquired in-process research and development. This statement, which
will be effective for the first quarter of fiscal 2010, will be applied prospectively
to business combinations.
In December 2007, the FASB issued SFAS No. 160, “Noncontrolling Interest in
Consolidated Financial Statements – an amendment of Accounting Research
Bulletin No. 51.” The objective of this statement is to improve the relevance,
comparability, and transparency of the financial information that a reporting entity
provides in its consolidated financial statements by establishing accounting and
reporting standards for the noncontrolling interest in a subsidiary and for the
deconsolidation of a subsidiary. The statement significantly changes the accounting
for transactions with minority interest holders. This statement, which will be
effective for the first quarter of fiscal 2010, is not expected to have a material
impact on our consolidated financial position or results of operations.
Cautionary Note Regarding Forward-Looking Statements
Certain statements and projections of future results made in this report constituteforward-looking information that is based on current market, competitive and
regulatory expectations that involve risks and uncertainties. Please see Walgreen
Co.’s Form 10-K for the period ended August 31, 2008, for a discussion of
important factors as they relate to forward-looking statements. Actual results
could differ materially.
Page 22 2008 Walgreens Annual Report
Consolidated Statements of Earnings

8/6/2019 2008AR Walgreens
http://slidepdf.com/reader/full/2008ar-walgreens 25/40
Consolidated Statements of Earnings Walgreen Co. and Subsidiaries for the years ended August 31, 2008, 2007 and 2006 (In millions, except shares and per share amounts)
2008 Walgreens Annual Report Page 23
Earnings 2008 2007 2006
Net sales $59,034 $53,762 $47,409Cost of sales 42,391 38,518 34,240
Gross Profit 16,643 15,244 13,169
Selling, general and administrative expenses 13,202 12,093 10,467
Operating Income 3,441 3,151 2,702
Interest (expense) income, net (11) 38 52
Earnings Before Income Tax Provision 3,430 3,189 2,754
Income tax provision 1,273 1,148 1,003
Net Earnings $ 2,157 $ 2,041 $ 1,751
Net earnings per common share – basic $ 2.18 $ 2.04 $ 1.73
Net earnings per common share – diluted 2.17 2.03 1.72
Average shares outstanding 990,609,865 998,633,559 1,010,252,562
Dilutive effect of stock options 4,933,681 7,706,509 9,148,162
Average shares outstanding assuming dilution 995,543,546 1,006,340,068 1,019,400,724
The accompanying Notes to Consolidated Financial Statements are integral parts of these statements.
Consolidated Statements of Shareholders’ Equity

8/6/2019 2008AR Walgreens
http://slidepdf.com/reader/full/2008ar-walgreens 26/40
Consolidated Statements of Shareholders Equity Walgreen Co. and Subsidiaries for the years ended August 31, 2008, 2007 and 2006 (In millions, except shares and per share amounts)
AccumulatedCommon Employee Other Treasury
Common Stock Paid-In Stock Loan Retained Comprehensive Stock Stock Shares Amount Capital Receivable Earnings Income (Loss) Amount
Balance, August 31, 2005 1,013,512,047 $80 $565 $(77) $ 8,836 $ — $ (515)
Net earnings — — — — 1,751 — —Cash dividends declared
($.2725 per share) — — — — (275) — —Treasury stock purchases (15,033,000) — — — — — (669)Employee stock purchase
and option plans 9,383,072 — (159) — — — 420Stock-based compensation — — 153 — — — —
Employee stock loanreceivable — — — 7 — — —
Balance, August 31, 2006 1,007,862,119 80 559 (70) 10,312 — (764)
Net earnings — — — — 2,041 — —Cash dividends declared
($.3275 per share) — — — — (326) — —Treasury stock purchases (23,842,749) — — — — — (1,064)Employee stock purchase
and option plans 7,121,987 — (98) — — — 322Stock-based compensation — — 98 — — — —
Employee stock loanreceivable — — — 18 — — —
Adjustment to initially applySFAS No.158, net of tax — — — — — (4) —
Balance, August 31, 2007 991,141,357 80 559 (52) 12,027 (4) (1,506)
Net earnings — — — — 2,157 — —Cash dividends declared
($.3975 per share) — — — — (394) — —Treasury stock purchases (8,000,000) — — — — — (294)
Employee stock purchaseand option plans 6,034,861 — (55) — — — 249Stock-based compensation — — 71 — — — —Employee stock loan
receivable — — — 16 — — —FIN No. 48 adoption impact — — — — 2 — — Additional minimum postretirement
liability, net of tax — — — — — 13 —
Balance, August 31, 2008 989,176,218 $80 $575 $(36) $13,792 $ 9 $(1,551)
The accompanying Notes to Consolidated Financial Statements are integral parts of these statements.
Page 24 2008 Walgreens Annual Report
Consolidated Balance Sheets

8/6/2019 2008AR Walgreens
http://slidepdf.com/reader/full/2008ar-walgreens 27/40
Walgreen Co. and Subsidiaries at August 31, 2008 and 2007 (In millions, except shares and per share amounts)
Assets 2008 2007
Current Assets Cash and cash equivalents $ 443 $ 255
Accounts receivable, net 2,527 2,237
Inventories 7,249 6,790
Other current assets 214 229
Total Current Assets 10,433 9,511
Non-Current Assets Property and equipment, at cost,
less accumulated depreciation and amortization 9,775 8,204
Goodwill 1,438 1,060
Other non-current assets 764 539
Total Non-Current Assets 11,977 9,803
Total Assets $22,410 $19,314
Liabilities and Shareholders’ Equity
Current Liabilities Short-term borrowings $ 83 $ 884
Trade accounts payable 4,289 3,734
Accrued expenses and other liabilities 2,272 2,099
Income taxes — 28
Total Current Liabilities 6,644 6,745
Non-Current Liabilities Long-term debt 1,337 22
Deferred income taxes 150 158
Other non-current liabilities 1,410 1,285
Total Non-Current Liabilities 2,897 1,465
Shareholders’ Equity Preferred stock, $.0625 par value;
authorized 32 million shares; none issued — —
Common stock, $.078125 par value; authorized 3.2 billion shares;
issued 1,025,400,000 shares in 2008 and 2007 80 80
Paid-in capital 575 559
Employee stock loan receivable (36) (52)
Retained earnings 13,792 12,027
Accumulated other comprehensive income (loss) 9 (4)
Treasury stock at cost, 36,223,782 shares in 2008
and 34,258,643 shares in 2007 (1,551) (1,506)
Total Shareholders’ Equity 12,869 11,104
Total Liabilities and Shareholders’ Equity $22,410 $19,314
The accompanying Notes to Consolidated Financial Statements are integral parts of these statements.
2008 Walgreens Annual Report Page 25
Consolidated Statements of Cash Flows

8/6/2019 2008AR Walgreens
http://slidepdf.com/reader/full/2008ar-walgreens 28/40
Walgreen Co. and Subsidiaries for the years ended August 31, 2008, 2007 and 2006 (In millions)
2008 2007 2006
Cash Flows from Net earnings $ 2,157 $ 2,041 $ 1,751
Operating Activities Adjustments to reconcile net earnings to net
cash provided by operating activities –
Depreciation and amortization 840 676 572
Deferred income taxes (61) 23 (104)
Stock compensation expense 68 74 103
Income tax savings from employee stock plans 3 6 8
Other 11 3 (20)
Changes in operating assets and liabilities –
Accounts receivable, net (365) (40) (619)
Inventories (412) (676) (376)
Other assets (24) (28) (9)
Trade accounts payable 550 (128) 876
Accrued expenses and other liabilities 84 277 205
Income taxes 80 25 (68)
Other non-current liabilities 108 104 121
Net cash provided by operating activities 3,039 2,357 2,440
Cash Flows from Purchases of short-term investments
Investing Activities – available for sale — (6,397) (12,282)
Proceeds from sale of short-term investments
– available for sale — 6,826 12,388
Additions to property and equipment (2,225) (1,786) (1,338)
Proceeds from sale of assets 17 41 23
Business and intangible asset acquisitions,
net of cash received (620) (1,086) (485)
Net proceeds from corporate-owned life insurance policies 10 6 10
Net cash used for investing activities (2,818) (2,396) (1,684)
Cash Flows from Net (payment) proceeds from short-term borrowings (802) 850 —
Financing Activities Net proceeds from issuance of long-term debt 1,286 — —
Payments of long-term debt (28) (141) —
Stock purchases (294) (1,064) (669)
Proceeds related to employee stock plans 210 266 319
Cash dividends paid (376) (310) (263)Bank overdrafts — (214) 214
Other (29) (13) (14)
Net cash used for financing activities (33) (626) (413)
Changes in Cash and Net increase (decrease) in cash and cash equivalents 188 (665) 343
Cash Equivalents Cash and cash equivalents, September 1 255 920 577
Cash and cash equivalents, August 31 $ 443 $ 255 $ 920
The accompanying Notes to Consolidated Financial Statements are integral parts of these statements.
Page 26 2008 Walgreens Annual Report
Notes to Consolidated Financial Statements

8/6/2019 2008AR Walgreens
http://slidepdf.com/reader/full/2008ar-walgreens 29/40
1. Summary of Major Accounting Policies
Description of Business
The company is principally in the retail drugstore business and its operations are
within one reportable segment. At August 31, 2008, there were 6,934 drugstoreand other locations in 49 states, the District of Columbia, Guam and Puerto Rico.
Prescription sales were 64.9% of total sales for fiscal 2008 compared to 65.0%
in 2007 and 64.3% in 2006.
Basis of Presentation
The consolidated statements include the accounts of the company and its
subsidiaries. All intercompany transactions have been eliminated. The consolidated
financial statements are prepared in accordance with accounting principles
generally accepted in the United States of America and include amounts based
on management’s prudent judgments and estimates. Actual results may differ
from these estimates.
We have changed the income statement caption selling, occupancy and adminis-
tration, to selling, general and administrative expenses. The change was made
to better align income statement captions to our industry.
The prior year balance sheet reflects the reclassification of debt, which was
previously condensed within the accrued expenses and other liabilities line and
other non-current liabilities line. In addition, in the prior year, software development
costs were reclassified from other non-current assets to property and equipment.
Cash and Cash EquivalentsCash and cash equivalents include cash on hand and all highly liquid investments
with an original maturity of three months or less. Included in cash and cash
equivalents are credit card and debit card receivables from banks, which
generally settle within two business days, of $166 million at August 31, 2008,
and $67 million at August 31, 2007. The company’s cash management policy
provides for controlled disbursement. As a result, the company had outstanding
checks in excess of funds on deposit at certain banks. These amounts, which
were $374 million as of August 31, 2008, and $303 million as of August 31,
2007, are included in trade accounts payable in the accompanying consolidated
balance sheets.Financial Instruments
The company had $110 million and $77 million of outstanding letters of
credit at August 31, 2008, and 2007, respectively, which guarantee foreign trade
purchases. Additional outstanding letters of credit of $271 million and
$277 million at August 31, 2008, and 2007, respectively, guarantee payments
of insurance claims. The insurance claim letters of credit are annually renewable
and will remain in place until the insurance claims are paid in full. Letters of
credit of $14 million and $12 million were outstanding at August 31, 2008, and
August 31, 2007, respectively, to guarantee performance of construction contracts.
The company pays a facility fee to the financing bank to keep these letters of creditactive. The company had real estate development purchase commitments of
$952 million and $980 million at August 31, 2008, and 2007, respectively.
There were no investments in derivative financial instruments during fiscal 2008
and 2007 except for the embedded derivative contained with the conversion
features of the $28 million of convertible debt acquired in the Option Care, Inc.
and affiliated companies acquisition. The value of such derivative was not materialand the debt was retired on September 6, 2007.
Inventories
Inventories are valued on a lower of last-in, first-out (LIFO) cost or market basis.
At August 31, 2008, and 2007, inventories would have been greater by
$1,067 million and $969 million, respectively, if they had been valued on a lower
of first-in, first-out (FIFO) cost or market basis. Inventory includes product cost,
inbound freight, warehousing costs and vendor allowances that are not included
as a reduction of advertising expense.
Cost of Sales
Cost of sales is derived based upon point-of-sale scanning information with an
estimate for shrinkage and is adjusted based on periodic inventories. In addition to
product cost, cost of sales includes warehousing costs, purchasing costs, freight
costs, cash discounts and vendor allowances that are not included as a reduction
of advertising expense.
Selling, General and Administrative Expenses
Selling, general and administrative expenses mainly consist of store salaries,
occupancy costs, and direct store related expenses. Other administrative costs
include headquarters expenses, advertising costs (net of advertising revenue)
and insurance.Vendor Allowances
Vendor allowances are principally received as a result of purchase levels, sales or
promotion of vendors’ products. Allowances are generally recorded as a reduction
of inventory and are recognized as a reduction of cost of sales when the related
merchandise is sold. Those allowances received for promoting vendors’ products
are offset against advertising expense and result in a reduction of selling, general
and administrative expenses to the extent of advertising costs incurred, with the
excess treated as a reduction of inventory costs.
Property and Equipment
Depreciation is provided on a straight-line basis over the estimated useful lives
of owned assets. Leasehold improvements and leased properties under capital
leases are amortized over the estimated physical life of the property or over the
term of the lease, whichever is shorter. Estimated useful lives range from 12 1 / 2
to 39 years for land improvements, buildings and building improvements; and
3 to 121 / 2 years for equipment. Major repairs, which extend the useful life
of an asset, are capitalized in the property and equipment accounts. Routine
maintenance and repairs are charged against earnings. The majority of the
business uses the composite method of depreciation for equipment. Therefore,
gains and losses on retirement or other disposition of such assets are included
in earnings only when an operating location is closed, completely remodeled
or impaired. Fully depreciated property and equipment are removed from
the cost and related accumulated depreciation and amortization accounts.
2008 Walgreens Annual Report Page 27
Notes to Consolidated Financial Statements (continued)

8/6/2019 2008AR Walgreens
http://slidepdf.com/reader/full/2008ar-walgreens 30/40
Impaired Assets and Liabilities for Store Closings
The company tests long-lived assets for impairment whenever events or circum-
stances indicate that a certain asset may be impaired. Store locations that have
been open at least five years are reviewed for impairment indicators at least annually.
Once identified, the amount of the impairment is computed by comparing the carrying
value of the assets to the fair value, which is based on the discounted estimated
future cash flows. Impairment charges included in selling, general and administrative
expenses were $12 million in 2008, $10 million in 2007 and $22 million in 2006.
The company also provides for future costs related to closed locations. The liability
is based on the present value of future rent obligations and other related costs
(net of estimated sublease rent) to the first lease option date.
Insurance
The company obtains insurance coverage for catastrophic exposures as well asthose risks required by law to be insured. It is the company’s policy to retain a
significant portion of certain losses related to workers’ compensation, property,
comprehensive general, pharmacist and vehicle liability. Liabilities for these losses
are recorded based upon the company’s estimates for claims incurred and are not
discounted. The provisions are estimated in part by considering historical claims
experience, demographic factors and other actuarial assumptions.
Pre-Opening Expenses
Non-capital expenditures incurred prior to the opening of a new or remodeled store
are expensed as incurred.
Advertising Costs
Advertising costs, which are reduced by the portion funded by vendors, are expensed
as incurred. Net advertising expenses, which are included in selling, general and
administrative expenses, were $341 million in 2008, $356 million in 2007 and $307
million in 2006. Included in net advertising expenses were vendor advertising
allowances of $180 million in 2008, $170 million in 2007 and $175 million in 2006.
Stock-Based Compensation Plans
In accordance with SFAS No. 123(R), “Share-Based Payment,” the company
recognizes compensation expense on a straight-line basis over the employee’s
vesting period or to the employee’s retirement eligible date, if earlier.
In November 2005, the Financial Accounting Standards Board (“FASB”) issued Financial
Statement of Position (“FSP”) No. 123(R)-3,“Transition Election Related to Accounting
for the Tax Effects of Share-Based Payment Awards.” This pronouncement provides
an alternative transition method of calculating the excess tax benefits available
to absorb any tax deficiencies recognized subsequent to the adoption of SFAS
No. 123(R). The company elected to adopt the alternative transition method in
the fourth quarter of fiscal 2006.
Total stock-based compensation expense for fiscal 2008, 2007 and 2006 was
$68 million, $74 million and $103 million, respectively. The recognized tax benefit
was $23 million, $26 million and $37 million for fiscal 2008, 2007 and 2006,
respectively.
As of August 31, 2008, there was $47 million of total unrecognized compensation
cost related to nonvested awards. This cost is expected to be recognized over a
weighted average of 1.7 years.
Income Taxes
We account for income taxes according to the asset and liability method of accounting
for income taxes. Under this method, deferred tax assets and liabilities are recognized
based upon the estimated future tax consequences attributable to differences
between the financial statement carrying amounts of existing assets and liabilities
Property and equipment consists of (In millions) :
2008 2007
Land and land improvements
Owned locations $ 2,567 $ 2,012Distribution centers 103 103
Other locations 222 212
Buildings and building improvements
Owned locations 2,790 2,245
Leased locations (leasehold improvements only) 724 582
Distribution centers 583 553
Other locations 309 270
Equipment
Locations 4,056 3,604
Distribution centers 978 879
Other locations 282 266
Capitalized system development costs 258 212
Capital lease properties 46 43
12,918 10,981
Less: accumulated depreciation and amortization 3,143 2,777
$ 9,775 $ 8,204
The company capitalizes application stage development costs for significant
internally developed software projects, including “Ad Planning,” an advertising
system, and “Capacity Management Logistics Enhancements,” upgrades to
merchandise ordering systems. These costs are amortized over a five-year period.
Amortization was $36 million in 2008, $29 million in 2007 and $24 million in
2006. Unamortized costs as of August 31, 2008, and 2007 were $173 million
and $148 million, respectively.
Goodwill and Other Intangible Assets
Goodwill represents the excess of the purchase price over the fair value of assets
acquired and liabilities assumed. The company accounts for goodwill and intangibles
under Statement of Financial Accounting Standards (“SFAS”) No. 142, “Goodwill and
Other Intangible Assets,” which does not permit amortization, but requires the
company to test goodwill and other indefinite-lived assets for impairment annuallyor whenever events or circumstances indicate there may be an impairment.
Revenue Recognition
The company recognizes revenue at the time the customer takes possession
of the merchandise. Customer returns are immaterial. Sales taxes are not
included in revenue.
Gift Cards
The company sells Walgreens gift cards to our customers in our retail stores and
through our website. We do not charge administrative fees on unused gift cards
and our gift cards do not have an expiration date. We recognize income from gift
cards when (1) the gift card is redeemed by the customer; or (2) the likelihood of
the gift card being redeemed by the customer is remote (“gift card breakage”)
and we determine that we do not have a legal obligation to remit the value of
unredeemed gift cards to the relevant jurisdictions. We determine our gift card
breakage rate based upon historical redemption patterns. Gift card breakage
income, which is included in selling, general and administrative expenses,
was not significant in fiscal 2008, 2007 or 2006.
Page 28 2008 Walgreens Annual Report
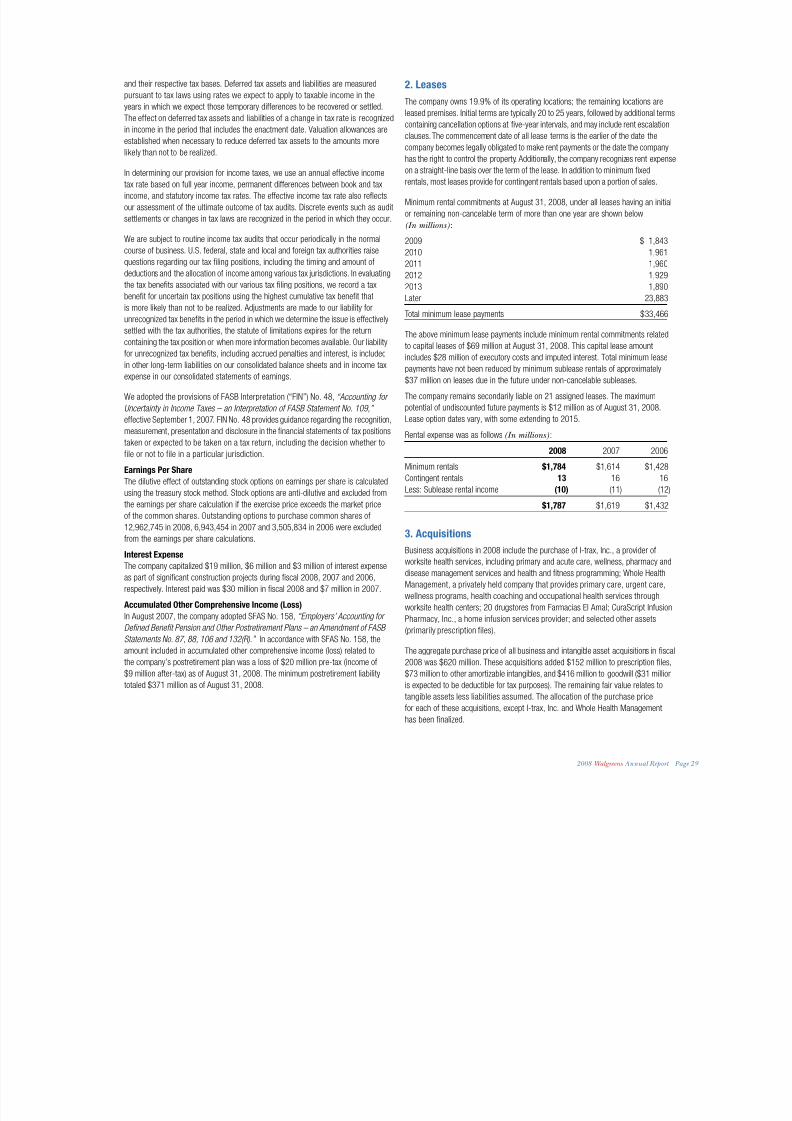
8/6/2019 2008AR Walgreens
http://slidepdf.com/reader/full/2008ar-walgreens 31/40
and their respective tax bases. Deferred tax assets and liabilities are measured
pursuant to tax laws using rates we expect to apply to taxable income in the
years in which we expect those temporary differences to be recovered or settled.
The effect on deferred tax assets and liabilities of a change in tax rate is recognized
in income in the period that includes the enactment date. Valuation allowances are
established when necessary to reduce deferred tax assets to the amounts more
likely than not to be realized.
In determining our provision for income taxes, we use an annual effective income
tax rate based on full year income, permanent differences between book and tax
income, and statutory income tax rates. The effective income tax rate also reflects
our assessment of the ultimate outcome of tax audits. Discrete events such as audit
settlements or changes in tax laws are recognized in the period in which they occur.
We are subject to routine income tax audits that occur periodically in the normalcourse of business. U.S. federal, state and local and foreign tax authorities raise
questions regarding our tax filing positions, including the timing and amount of
deductions and the allocation of income among various tax jurisdictions. In evaluating
the tax benefits associated with our various tax filing positions, we record a tax
benefit for uncertain tax positions using the highest cumulative tax benefit that
is more likely than not to be realized. Adjustments are made to our liability for
unrecognized tax benefits in the period in which we determine the issue is effectively
settled with the tax authorities, the statute of limitations expires for the return
containing the tax position or when more information becomes available. Our liability
for unrecognized tax benefits, including accrued penalties and interest, is includedin other long-term liabilities on our consolidated balance sheets and in income tax
expense in our consolidated statements of earnings.
We adopted the provisions of FASB Interpretation (“FIN”) No. 48, “Accounting for
Uncertainty in Income Taxes – an Interpretation of FASB Statement No. 109,”
effective September 1, 2007. FIN No. 48 provides guidance regarding the recognition,
measurement, presentation and disclosure in the financial statements of tax positions
taken or expected to be taken on a tax return, including the decision whether to
file or not to file in a particular jurisdiction.
Earnings Per ShareThe dilutive effect of outstanding stock options on earnings per share is calculated
using the treasury stock method. Stock options are anti-dilutive and excluded from
the earnings per share calculation if the exercise price exceeds the market price
of the common shares. Outstanding options to purchase common shares of
12,962,745 in 2008, 6,943,454 in 2007 and 3,505,834 in 2006 were excluded
from the earnings per share calculations.
Interest Expense
The company capitalized $19 million, $6 million and $3 million of interest expense
as part of significant construction projects during fiscal 2008, 2007 and 2006,
respectively. Interest paid was $30 million in fiscal 2008 and $7 million in 2007.
Accumulated Other Comprehensive Income (Loss)
In August 2007, the company adopted SFAS No. 158, “Employers’ Accounting for
Defined Benefit Pension and Other Postretirement Plans – an Amendment of FASB
Statements No. 87, 88, 106 and 132(R).” In accordance with SFAS No. 158, the
amount included in accumulated other comprehensive income (loss) related to
the company’s postretirement plan was a loss of $20 million pre-tax (income of
$9 million after-tax) as of August 31, 2008. The minimum postretirement liability
totaled $371 million as of August 31, 2008.
2. Leases
The company owns 19.9% of its operating locations; the remaining locations are
leased premises. Initial terms are typically 20 to 25 years, followed by additional terms
containing cancellation options at five-year intervals, and may include rent escalationclauses. The commencement date of all lease terms is the earlier of the date the
company becomes legally obligated to make rent payments or the date the company
has the right to control the property. Additionally, the company recognizes rent expense
on a straight-line basis over the term of the lease. In addition to minimum fixed
rentals, most leases provide for contingent rentals based upon a portion of sales.
Minimum rental commitments at August 31, 2008, under all leases having an initial
or remaining non-cancelable term of more than one year are shown below
(In millions) :
2009 $ 1,8432010 1,961
2011 1,960
2012 1,929
2013 1,890
Later 23,883
Total minimum lease payments $33,466
The above minimum lease payments include minimum rental commitments related
to capital leases of $69 million at August 31, 2008. This capital lease amount
includes $28 million of executory costs and imputed interest. Total minimum lease
payments have not been reduced by minimum sublease rentals of approximately
$37 million on leases due in the future under non-cancelable subleases.
The company remains secondarily liable on 21 assigned leases. The maximum
potential of undiscounted future payments is $12 million as of August 31, 2008.
Lease option dates vary, with some extending to 2015.
Rental expense was as follows (In millions) :
2008 2007 2006
Minimum rentals $1,784 $1,614 $1,428Contingent rentals 13 16 16
Less: Sublease rental income (10) (11) (12)
$1,787 $1,619 $1,432
3. Acquisitions
Business acquisitions in 2008 include the purchase of I-trax, Inc., a provider of
worksite health services, including primary and acute care, wellness, pharmacy and
disease management services and health and fitness programming; Whole Health
Management, a privately held company that provides primary care, urgent care,wellness programs, health coaching and occupational health services through
worksite health centers; 20 drugstores from Farmacias El Amal; CuraScript Infusion
Pharmacy, Inc., a home infusion services provider; and selected other assets
(primarily prescription files).
The aggregate purchase price of all business and intangible asset acquisitions in fiscal
2008 was $620 million. These acquisitions added $152 million to prescription files,
$73 million to other amortizable intangibles, and $416 million to goodwill ($31 million
is expected to be deductible for tax purposes). The remaining fair value relates to
tangible assets less liabilities assumed. The allocation of the purchase pricefor each of these acquisitions, except I-trax, Inc. and Whole Health Management,
has been finalized.
2008 Walgreens Annual Report Page 29
Notes to Consolidated Financial Statements (continued)

8/6/2019 2008AR Walgreens
http://slidepdf.com/reader/full/2008ar-walgreens 32/40
The preliminary allocation of the purchase price of I-trax, Inc. and Whole Health
Management was accounted for under the purchase method of accounting
with the company as the acquirer in accordance with SFAS No. 141, “Business
Combinations.” Any adjustments to the preliminary purchase price allocation are
not expected to be material. Goodwill and other intangible assets recorded in
connection with the acquisition totaled $372 million and $50 million, respectively.
Operating results of the businesses acquired have been included in the consolidated
statements of income for their respective acquisition dates forward. Pro forma results
of the company, assuming all of the acquisitions had occurred at the beginning of
each period presented, would not be materially different from the results reported.
4. Goodwill and Other Intangible Assets
Goodwill is evaluated annually during the fourth quarter of the company’s fiscal
year or when indications of potential impairment exist. The impairment calculationcompares the implied fair value of reporting unit goodwill with the carrying amount
of that goodwill. If the carrying amount of reporting unit goodwill exceeds the
implied fair value of that goodwill, an impairment loss is recognized in an amount
equal to that excess. During fiscal 2008 we recorded an impairment of $9 million
to our Institutional Pharmacy reporting unit. The impairment was the result of lower
financial projections of the reporting unit. No impairment related to goodwill
occurred in fiscal 2007.
The carrying amount and accumulated amortization of goodwill and intangible assets
consists of the following (In millions) :
2008 2007
Purchased prescription files $ 444 $ 302
Purchasing and payor contracts 263 175
Trade name 40 26
Other amortizable intangible assets 108 83
Goodwill 1,438 1,060
Gross carrying amount 2,293 1,646
Accumulated amortization – prescription files (145) (83)
Purchasing and payor contracts (25) (9)
Trade name (17) (6) Accumulated amortization – other (25) (16)
Total accumulated amortization (212) (114)
Total intangible assets, net $2,081 $1,532
Changes to goodwill for fiscal 2008 included additions related to acquisitions, an
impairment to our Institutional Pharmacy reporting unit and the final purchase price
allocation of our acquisition of Option Care, Inc. which decreased goodwill and
increased intangible assets by $60 million. The change in goodwill for fiscal 2007
was all related to acquisitions.
Amortization expense for intangible assets was $107 million in 2008, $62 million
in 2007 and $46 million in 2006. The weighted-average amortization period for
purchased prescription files was six years for fiscal 2008 and fiscal 2007. The
weighted-average amortization period for purchasing and payor contracts was
thirteen years for fiscal 2008 and fiscal 2007. The weighted-average amortization
period for trade names was three years for fiscal 2008 and fiscal 2007. The
weighted-average amortization period for other intangible assets was eleven years
for fiscal 2008 and fiscal 2007.
Expected amortization expense for intangible assets recorded at August 31, 2008,
is as follows (In millions) :2009 2010 2011 2012 2013
$121 $106 $91 $71 $45
5. Income Taxes
The provision for income taxes consists of the following (In millions) :
2008 2007 2006
Current provision –
Federal $1,201 $ 1,028 $ 970
State 133 97 137
1,334 1,125 1,107
Deferred provision –
Federal (59) 18 (89)
State (2) 5 (15)
(61) 23 (104)
$1,273 $1,148 $1,003
The difference between the statutory federal income tax rate and the effective tax
rate is as follows: (In millions) :
2008 2007 2006
Federal statutory rate 35.0% 35.0% 35.0 %
State income taxes, net of federal benefit 2.4 2.5 2.9
Other (0.3) (1.5) (1.5)
Effective income tax rate 37.1% 36.0% 36. 4%
The deferred tax assets and liabilities included in the Consolidated Balance Sheets
consist of the following (In millions) :2008 2007
Deferred tax assets –
Compensation and benefits $ 189 $ 204
Insurance 184 191
Postretirement benefits 196 179
Accrued rent 138 135
Stock compensation 80 22
Inventory 54 45
Other 146 140
987 916
Deferred tax liabilities –
Accelerated depreciation 796 703
Inventory 177 199
Intangible assets 37 43
Other 69 72
1,079 1,017
Net deferred tax liabilities $ 92 $ 101
Income taxes paid were $1,235 million, $1,204 million and $1,111 million duringthe fiscal years ended August 31, 2008, 2007 and 2006, respectively.
FIN No. 48 provides guidance regarding the recognition, measurement, presenta-
tion and disclosure in the financial statements of tax positions taken or expected to
be taken on a tax return, including the decision whether to file or not to file in a
particular jurisdiction. The adoption of FIN No. 48 resulted in the reclassification of
$55 million of certain tax liabilities from current to long-term and a $2 million
decrease in our liability for unrecognized tax benefits, which was accounted for as
an increase to the August 31, 2007 retained earnings balance. All unrecognized
benefits at August 31, 2008, were classified as long-term liabilities on our
consolidated balance sheet.
Page 30 2008 Walgreens Annual Report
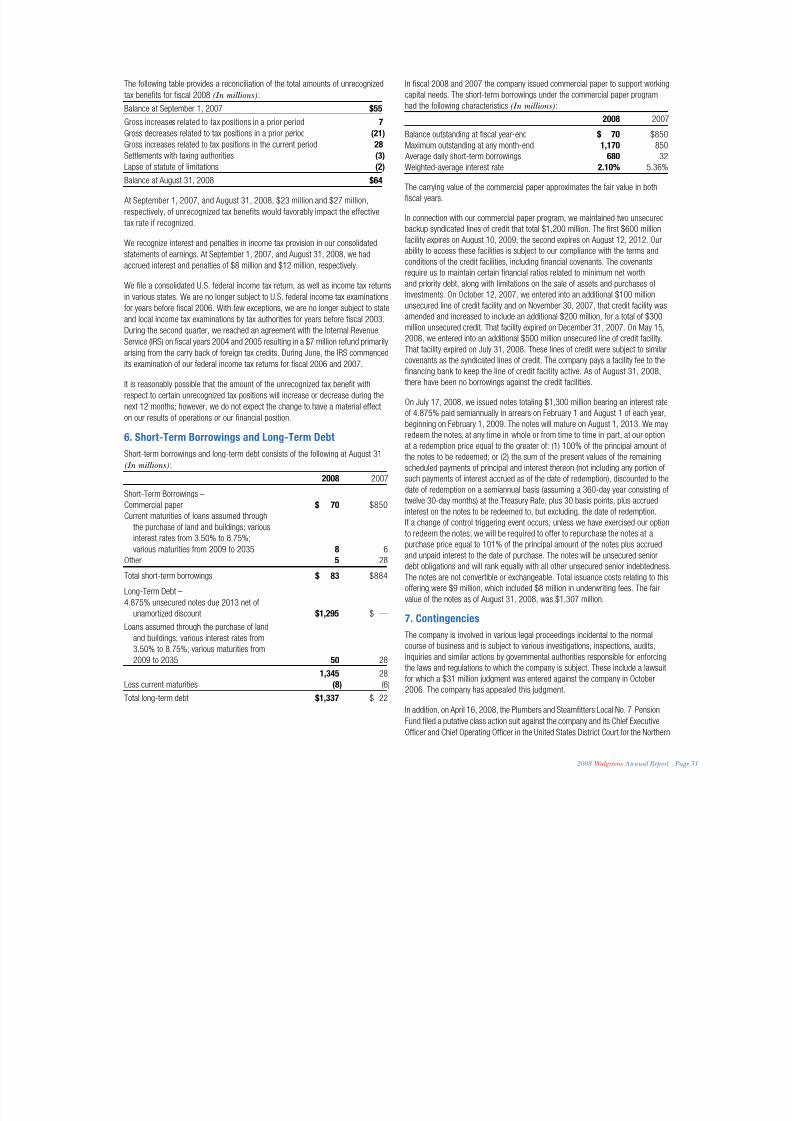
8/6/2019 2008AR Walgreens
http://slidepdf.com/reader/full/2008ar-walgreens 33/40
In fiscal 2008 and 2007 the company issued commercial paper to support working
capital needs. The short-term borrowings under the commercial paper program
had the following characteristics (In millions) :
2008 2007
Balance outstanding at fiscal year-end $ 70 $850
Maximum outstanding at any month-end 1,170 850
Average daily short-term borrowings 680 32
Weighted-average interest rate 2.10% 5.36%
The carrying value of the commercial paper approximates the fair value in both
fiscal years.
In connection with our commercial paper program, we maintained two unsecured
backup syndicated lines of credit that total $1,200 million. The first $600 million
facility expires on August 10, 2009; the second expires on August 12, 2012. Ourability to access these facilities is subject to our compliance with the terms and
conditions of the credit facilities, including financial covenants. The covenants
require us to maintain certain financial ratios related to minimum net worth
and priority debt, along with limitations on the sale of assets and purchases of
investments. On October 12, 2007, we entered into an additional $100 million
unsecured line of credit facility and on November 30, 2007, that credit facility was
amended and increased to include an additional $200 million, for a total of $300
million unsecured credit. That facility expired on December 31, 2007. On May 15,
2008, we entered into an additional $500 million unsecured line of credit facility.
That facility expired on July 31, 2008. These lines of credit were subject to similarcovenants as the syndicated lines of credit. The company pays a facility fee to the
financing bank to keep the line of credit facility active. As of August 31, 2008,
there have been no borrowings against the credit facilities.
On July 17, 2008, we issued notes totaling $1,300 million bearing an interest rate
of 4.875% paid semiannually in arrears on February 1 and August 1 of each year,
beginning on February 1, 2009. The notes will mature on August 1, 2013. We may
redeem the notes, at any time in whole or from time to time in part, at our option
at a redemption price equal to the greater of: (1) 100% of the principal amount of
the notes to be redeemed; or (2) the sum of the present values of the remaining
scheduled payments of principal and interest thereon (not including any portion ofsuch payments of interest accrued as of the date of redemption), discounted to the
date of redemption on a semiannual basis (assuming a 360-day year consisting of
twelve 30-day months) at the Treasury Rate, plus 30 basis points, plus accrued
interest on the notes to be redeemed to, but excluding, the date of redemption.
If a change of control triggering event occurs, unless we have exercised our option
to redeem the notes, we will be required to offer to repurchase the notes at a
purchase price equal to 101% of the principal amount of the notes plus accrued
and unpaid interest to the date of purchase. The notes will be unsecured senior
debt obligations and will rank equally with all other unsecured senior indebtedness.
The notes are not convertible or exchangeable. Total issuance costs relating to this
offering were $9 million, which included $8 million in underwriting fees. The fair
value of the notes as of August 31, 2008, was $1,307 million.
7. Contingencies
The company is involved in various legal proceedings incidental to the normal
course of business and is subject to various investigations, inspections, audits,
inquiries and similar actions by governmental authorities responsible for enforcing
the laws and regulations to which the company is subject. These include a lawsuit
for which a $31 million judgment was entered against the company in October
2006. The company has appealed this judgment.
In addition, on April 16, 2008, the Plumbers and Steamfitters Local No. 7 Pension
Fund filed a putative class action suit against the company and its Chief Executive
Officer and Chief Operating Officer in the United States District Court for the Northern
The following table provides a reconciliation of the total amounts of unrecognized
tax benefits for fiscal 2008 (In millions) :
Balance at September 1, 2007 $55
Gross increases related to tax positions in a prior period 7Gross decreases related to tax positions in a prior period (21)
Gross increases related to tax positions in the current period 28
Settlements with taxing authorities (3)
Lapse of statute of limitations (2)
Balance at August 31, 2008 $64
At September 1, 2007, and August 31, 2008, $23 million and $27 million,
respectively, of unrecognized tax benefits would favorably impact the effective
tax rate if recognized.
We recognize interest and penalties in income tax provision in our consolidated
statements of earnings. At September 1, 2007, and August 31, 2008, we had
accrued interest and penalties of $8 million and $12 million, respectively.
We file a consolidated U.S. federal income tax return, as well as income tax returns
in various states. We are no longer subject to U.S. federal income tax examinations
for years before fiscal 2006. With few exceptions, we are no longer subject to state
and local income tax examinations by tax authorities for years before fiscal 2003.
During the second quarter, we reached an agreement with the Internal Revenue
Service (IRS) on fiscal years 2004 and 2005 resulting in a $7 million refund primarily
arising from the carry back of foreign tax credits. During June, the IRS commencedits examination of our federal income tax returns for fiscal 2006 and 2007.
It is reasonably possible that the amount of the unrecognized tax benefit with
respect to certain unrecognized tax positions will increase or decrease during the
next 12 months; however, we do not expect the change to have a material effect
on our results of operations or our financial position.
6. Short-Term Borrowings and Long-Term Debt
Short-term borrowings and long-term debt consists of the following at August 31
(In millions) :2008 2007
Short-Term Borrowings –
Commercial paper $ 70 $850
Current maturities of loans assumed through
the purchase of land and buildings; various
interest rates from 3.50% to 8.75%;
various maturities from 2009 to 2035 8 6
Other 5 28
Total short-term borrowings $ 83 $884
Long-Term Debt –
4.875% unsecured notes due 2013 net of
unamortized discount $1,295 $ —
Loans assumed through the purchase of land
and buildings; various interest rates from
3.50% to 8.75%; various maturities from
2009 to 2035 50 28
1,345 28
Less current maturities (8) (6)
Total long-term debt $1,337 $ 22
2008 Walgreens Annual Report Page 31
Notes to Consolidated Financial Statements (continued)

8/6/2019 2008AR Walgreens
http://slidepdf.com/reader/full/2008ar-walgreens 34/40
District of Illinois. The suit was filed on behalf of purchasers of company common stock
during the period between June 25, 2007, and November 29, 2007. The complaint
charges the company and its Chief Executive Officer and Chief Operating Officer with
violations of Section 10(b) of the Securities Exchange Act of 1934, claiming that the
company misled investors by failing to disclose declining rates of growth in generic
drug sales and a contract dispute with a pharmacy benefits manager that allegedly
had a negative impact on earnings. The company and the officers named in the suit
believe the allegations are without merit, and intend to defend against them vigorously.
Management is of the opinion that although the outcome of these and other
litigation and investigations cannot be forecast with certainty, the final dispositions
should not have a material adverse effect on the company’s consolidated financial
position or results of operations.
The company guarantees a credit agreement on behalf of SureScripts-RxHub, LLC,which provides electronic prescription data services. This credit agreement, for which
SureScripts-RxHub, LLC is primarily liable, has an expiration date of June 30, 2011.
The liability was $8 million at August 31, 2008, and $3 million at August 31, 2007.
The maximum amount of future payments that could be required to be paid
under the guaranty is $25 million, of which $13 million may be recoverable from
another guarantor. In addition, under certain circumstances the company may be
required to provide an additional guarantee of up to $10 million, of which $8 million
may be recoverable from other guarantors.
8. Capital Stock
On January 10, 2007, the Board of Directors approved a new stock repurchase
program (“2007 repurchase program”), pursuant to which up to $1,000 million of
the company’s common stock may be purchased prior to the expiration date of the
program on January 10, 2011. This program was announced in the company’s
report on Form 8-K, which was filed on January 11, 2007. During fiscal 2008, the
company purchased no shares related to the 2007 repurchase program, compared
to $345 million of shares purchased in 2007.
On July 14, 2004, the Board of Directors announced a stock repurchase program
(“2004 repurchase program”) of up to $1,000 million, which has been completely
executed. The company purchased $343 million of shares related to the 2004repurchase program in fiscal 2007. An additional $294 million of shares were
purchased to support the long-term needs of the employee stock plans, which
compares to $375 million in fiscal 2007.
At August 31, 2008, 62,301,790 shares of common stock were reserved for
future stock issuances under the company’s various employee benefit plans.
9. Stock Compensation Plans
The Walgreen Co. Stock Purchase/Option Plan (Share Walgreens) provides for the
granting of options to purchase common stock over a ten-year period to eligiblenon-executive employees upon the purchase of company shares, subject to certain
restrictions. Employees may purchase the company shares through cash purchases
or loans. For options granted on or after October 1, 2005, the option price is the
closing price of a share of common stock on the grant date. Options may be granted
under this Plan until September 30, 2012, for an aggregate of 42,000,000 shares
of common stock. At August 31, 2008, there were 30,997,441 shares available
for future grants. The options granted during fiscal 2008, 2007 and 2006 have a
two-year vesting period.
The Walgreen Co. Executive Stock Option Plan provides for the granting of options
to eligible key employees to purchase common stock over a ten-year period,at a price not less than the fair market value on the date of the grant. Under this
Plan, options may be granted until January 11, 2016, for an aggregate of
38,400,000 shares of common stock. As of August 31, 2008, 10,849,029 shares
were available for future grants. The options granted during fiscal 2008, 2007
and 2006 have a three-year vesting period.
The Walgreen Co. Option 3000 Plan offered a stock option award to all non-executiveemployees who were employed on May 11, 2000. Each eligible employee, in
conjunction with opening the company’s 3,000th store, received a stock option award
to purchase from 75 to 500 shares, based on years of service. The Plan authorized the
grant of options, issued at fair market value on May 11, 2000, to purchase up to an
aggregate of 15,500,000 shares of common stock and 14,892,200 shares were
granted. The options vested and became exercisable on May 11, 2003, and any
unexercised options will expire on May 10, 2010, subject to earlier termination if the
optionee’s employment ends.
The Walgreen Co. Broad Based Employee Stock Option Plan provides for the granting
of options to eligible non-executive employees to purchase common stock over aten-year period, at a price not less than the fair market value on the date of the
grant, in connection with the achievement of store opening milestones. Under this
Plan, on March 11, 2003, substantially all non-executive employees, in conjunction
with the opening of the company’s 4,000th store, were granted a stock option to
purchase 100 shares. The Plan authorized the grant of an aggregate of 15,000,000
shares of common stock. As of August 31, 2008, 7,407,510 shares were available
for future grants. The options vested and became exercisable on March 11, 2006,
and any unexercised options will expire on March 10, 2013, subject to earlier
termination if the optionee’s employment ends.
The Walgreen Co. 1982 Employees Stock Purchase Plan permits eligible employeesto purchase common stock at 90% of the fair market value at the date of purchase.
Employees may purchase shares through cash purchases, loans or payroll deductions
up to certain limits. The aggregate number of shares that may be purchased under
this Plan is 74,000,000. At August 31, 2008, 3,242,237 shares were available for
future purchase.
The Walgreen Co. Long-Term Performance Incentive Plan (amended and restated
Restricted Performance Share Plan) was approved by the shareholders on January
10, 2007. The Plan offers performance-based incentive awards and equity-based
awards to key employees. The fiscal 2007 awards are subject to restrictions as to
continuous employment except in the case of death, normal retirement or total andpermanent disability. Restrictions generally lapse over a multiyear period from the
date of grant. The Long-Term Performance Incentive Plan was authorized to grant an
aggregate of 10,000,000 shares of common stock (which constituted a significant
reduction from the then remaining authorized shares under the Restricted
Performance Share Plan). At August 31, 2008, 9,805,573 shares were available for
future issuance under the Long-Term Performance Incentive Plan. Compensation
expense is recognized in the year of grant. There was no compensation expense
related to the Plan in fiscal 2008, compared to $12 million in fiscal 2007 and
$9 million in fiscal 2006.
The Walgreen Co. Nonemployee Director Stock Plan provides that each nonemployee
director receives an equity grant of shares each year on November 1. Through fiscal
year 2008, the Plan determined the number of shares granted by dividing $120,000
by the price of a share of common stock on November 1. Each nonemployee director
may elect to receive this annual share grant in the form of shares or deferred stock
units. During the term of the Plan, each nonemployee director will also receive 50%
of his or her quarterly retainer in the form of shares, which may be deferred into an
equal number of stock units. In addition, a nonemployee director may elect to defer
all or a portion of the cash component of his or her quarterly retainer and committee
chair retainer in the form of deferred stock units or to have such amounts placed in
a deferred cash compensation account. Each nonemployee director received a grantof 3,075 shares in fiscal 2008, 2,375 shares in fiscal 2007 and 1,771 shares in
fiscal 2006. New directors in any of the fiscal years were given a prorated amount.
Page 32 2008 Walgreens Annual Report

8/6/2019 2008AR Walgreens
http://slidepdf.com/reader/full/2008ar-walgreens 35/40
A summary of information relative to the company’s stock option plans follows:
Weighted-
Weighted- Average Aggregate
Average Remaining Intr insicExercise Contractual Value
Options Shares Price Term(Years) (In millions)
Outstanding
at August 31, 2007 35,001,752 $ 35.04 5.57 $ 368
Granted 4,313,877 44.32
Exercised (3,590,982) 26.28
Expired/Forfeited (742,084) 37.23
Outstanding
at August 31, 2008 34,982,563 $37.03 5.37 $ 92
Vested or expected to vestat August 31, 2008 34,806,841 $36.99 5.35 $ 92
Exercisable
at August 31, 2008 24,473,164 $33.07 4.16 $ 92
The intrinsic value for options exercised in fiscal 2008, 2007 and 2006 was
$42 million, $105 million and $173 million, respectively. The total fair value of
options vested in fiscal 2008, 2007 and 2006 was $46 million, $102 million
and $116 million, respectively.
Cash received from the exercise of options in fiscal 2008 was $94 million compared
to $142 million in the prior year. The related tax benefit realized was $16 million infiscal 2008 compared to $40 million in the prior year. The company has a practice of
repurchasing shares on the open market to satisfy share-based payment arrangements
and expects to repurchase approximately five million shares during fiscal 2009.
A summary of information relative to the company’s restricted stock awards follows:
Weighted-
Average
Grant-Date
Nonvested Shares Shares Fair Value
Nonvested at August 31, 2007 279,674 $45.63Granted 178,623 36.36
Forfeited (2,719) 45.60
Vested (138,168) 44.93
Nonvested at August 31, 2008 317,410 $40.72
The fair value of each option grant was determined using the Black-Scholes option
pricing model with weighted-average assumptions used in fiscal 2008, 2007
and 2006:
2008 2007 2006
Risk-free interest rate (1) 4.41% 4.71% 4.10% Average life of option (years) (2) 7.2 7.2 7.2
Volatility (3) 27.61% 25.77% 32.12%
Dividend yield (4) .81% .50% .45%
Weighted-average grant-date fair value
Granted at market price $16.11 $18.05 $18.82
(1) Represents the U.S. Treasury security rates for the expected term of the option.
(2) Represents the period of time that options granted are expected to be outstanding.The company analyzed separate groups of employees with similar exercise behavior to determine the expected term.
(3) Beginning with fiscal 2007, volatility was based on historical and implied volatility of the company’s common stock. Prior to fiscal 2007, it was based on historical volatility of the company’s common stock.
(4) Represents the company’s cash dividend for the expected term.
10. Retirement Benefits
The principal retirement plan for employees is the Walgreen Profit-Sharing
Retirement Plan to which both the company and the employees contribute. The
company’s contribution, which is determined annually at the discretion of the Boardof Directors, has historically been based on pre-tax income; however, beginning
January 1, 2008, a portion of that contribution will be in the form of a guaranteed
match. The profit-sharing provision was $305 million in 2008, $284 million in 2007
and $245 million in 2006. The company’s contributions were $261 million for
2008, $253 million for 2007 and $216 million for 2006.
The company provides certain health insurance benefits for retired employees
who meet eligibility requirements, including age, years of service and date of hire.
The costs of these benefits are accrued over the period earned. The company’s
postretirement health benefit plans are not funded.
Components of net periodic benefit costs (In millions) :
2008 2007 2006
Service cost $14 $14 $18
Interest cost 24 22 21
Amortization of actuarial loss 5 5 9
Amortization of prior service cost (4) (4) (4)
Total postretirement benefit cost $39 $37 $44
Change in benefit obligation (In millions) :
2008 2007
Benefit obligation at September 1 $ 370 $ 356
Service cost 14 14
Interest cost 24 22
Amendments — —
Actuarial gain (29) (14)
Benefit payments (11) (11)
Participants contributions 3 3
Benefit obligation at August 31 $ 371 $ 370
Change in plan assets (In millions) :
2008 2007
Plan assets at fair value at September 1 $ — $ —
Plan participants contributions 3 3
Employer contributions 8 8
Benefits paid (11) (11)
Plan assets at fair value at August 31 $ — $ —
Funded status (In millions) :
2008 2007Funded status $(371) $(370)
Unrecognized actuarial gain — —
Unrecognized prior service cost — —
Accrued benefit cost at August 31 $(371) $(370)
Amounts recognized in the Consolidated Balance Sheets (In millions) :
2008 2007
Current liabilities (present value of expected
2009 net benefit payments) $ (8) $ (8)
Non-current liabilities (363) (362)Net liability recognized at August 31 $(371) $(370)
2008 Walgreens Annual Report Page 33
Notes to Consolidated Financial Statements (continued)

8/6/2019 2008AR Walgreens
http://slidepdf.com/reader/full/2008ar-walgreens 36/40
Page 34 2008 Walgreens Annual Report
Amounts recognized in accumulated other comprehensive loss (In millions) :
2008 2007
Prior service cost (credit) $(57) $ (62)
Net actuarial loss 77 111
Amounts expected to be recognized as components of net periodic costs
for fiscal year 2009 (In millions) :
2009
Prior service cost (credit) $ (4)
Net actuarial loss 4
The measurement date used to determine postretirement benefits is August 31.
The discount rate assumption used to compute the postretirement benefit obligation
at year-end was 7.30% for 2008 and 6.5% for 2007. The discount rate assumptionused to determine net periodic benefit cost was 6.50%, 6.25%, and 5.50% for fiscal
years ending 2008, 2007, and 2006, respectively.
Future benefit costs were estimated assuming medical costs would increase at a
8.50% annual rate, gradually decreasing to 5.25% over the next six years and
then remaining at a 5.25% annual growth rate thereafter. A one percentage point
change in the assumed medical cost trend rate would have the following effects
(In millions) :
1% Increase 1% Decrease
Effect on service and interest cost $ — $ —Effect on postretirement obligation 14 (14)
Estimated future benefit payments and federal subsidy (In millions) :
Estimated Estimated
Future Benefit Federal
Payments Subsidy
2009 $ 9 $ 1
2010 11 1
2011 12 12012 14 1
2013 16 2
2014–2018 119 15
The expected contribution to be paid during fiscal year 2009 is $8 million.
11. Supplementary Financial Information
Non-cash transactions in fiscal 2008 included the identification of $74 million in
accrued liabilities related to the purchase of property and equipment; $24 million of
deferred taxes associated with amortizable intangible assets related to acquisitions;and $17 million in dividends declared.
Non-cash transactions in fiscal 2007 included the identification of $86 million of
deferred taxes associated with amortizable intangible assets related to acquisitions;
$49 million in postretirement benefit liabilities related to the adoption of SFAS No. 158;
$83 million in accrued liabilities related to the purchase of property and equipment;
$5 million of incurred direct acquisition costs; $4 million related to a leasehold
interest and $16 million in dividends declared.
Included in the Consolidated Balance Sheets captions are the following assets
and liabilities (In millions) :
2008 2007
Accounts receivable – Accounts receivable $2,623 $2,306
Allowance for doubtful accounts (96) (69)
$2,527 $2,237
Accrued expenses and other liabilities –
Accrued salaries $ 664 $ 652
Taxes other than income taxes 406 359
Profit sharing 211 185
Insurance 128 144
Other 863 759$2,272 $2,099
Other non-current liabilities –
Postretirement health care benefits $ 363 $ 362
Insurance 337 339
Other 710 584
$1,410 $1,285
Summary of Quarterly Results (Unaudited) Quarter Ended
(In millions, except per share amounts) November February May August Fiscal Year

8/6/2019 2008AR Walgreens
http://slidepdf.com/reader/full/2008ar-walgreens 37/40
Fiscal 2008 Net sales $ 14,028 $15,394 $ 15,015 $14,597 $ 59,034Gross profit 3,921 4,442 4,245 4,035 16,643Net earnings 456 686 572 443 2,157
Per Common Share – Basic $ .46 $ .69 $ .58 $ .45 $ 2.18– Diluted .46 .69 .58 .45 2.17
Cash Dividends Declared Per Common Share $ .0950 $ .0950 $ .0950 $ .1125 $ .3975
Fiscal 2007 Net sales $ 12,708 $13,934 $ 13,699 $ 13,421 $53,762Gross profit 3,576 4,036 3,878 3,754 15,244Net earnings 432 652 561 396 2,041
Per Common Share – Basic $ .43 $ .65 $ .56 $ .40 $ 2.04– Diluted .43 .65 .56 .40 2.03
Cash Dividends Declared Per Common Share $ .0775 $ .0775 $ .0775 $ .0950 $ .3275
COMMENTS ON QUARTERLY RESULTS: Included in fourth quarter net earnings is an adjustment decreasing selling, general and
administrative expenses by $79 million, which corrected for historically over-accruing the company’s vacation liability. The first three quarters of fiscal 2008 gross profit have been adjusted to reflect the reclassification of certain expenses between cost of sales and selling,general and administrative expenses.
Common Stock PricesQuarter Ended
Below is the Consolidated Transaction Reporting System high and low sales price for each quarter of fiscal 2008 and 2007. November February May August Fiscal Year
Fiscal 2008 High $47.93 $39.02 $38.93 $37.27 $47.93Low 36.59 33.01 34.85 31.39 31.39
Fiscal 2007 High $ 51.60 $47.28 $49.10 $47.72 $51.60Low 39.91 40.05 43.23 43.31 39.91
2003 2004 2005 2006 2007 2008
Walgreen Co. $100.00 $112.48 $143.70 $154.34 $141.68 $115.76
S&P 500 Index 100.00 111.46 125.45 136.59 157.27 139.75
Value Line Pharmacy Services Industry Index 100.00 112.10 158.61 181.05 194.71 188.11
Comparison of Five-Year Cumulative Total Return
The following graph compares the five-year cumulative total return of the company’s common stock with the S&P 500 Index and the Value Line Pharmacy Services Industry Index. The graph assumes a $100 investment made August 31, 2003,and the reinvestment of all dividends.
2008 Walgreens Annual Report Page 35
Source: Standard & Poor’s
Value of Investment at August 31,
Management’s Report on Internal Control
Our management is responsible for establishing and maintaining adequate internalt l fi i l ti h t i d fi d i E h A t R l 13 15(f)

8/6/2019 2008AR Walgreens
http://slidepdf.com/reader/full/2008ar-walgreens 38/40
Page 36 2008 Walgreens Annual Report
recorded as necessary to permit preparation of financial statements in accordancewith generally accepted accounting principles, and that receipts and expenditures ofthe company are being made only in accordance with authorizations of managementand directors of the company; and (3) provide reasonable assurance regardingprevention or timely detection of unauthorized acquisition, use, or disposition of
the company’s assets that could have a material effect on the financial statements.Because of the inherent limitations of internal control over financial reporting,including the possibility of collusion or improper management override of controls,material misstatements due to error or fraud may not be prevented or detectedon a timely basis. Also, projections of any evaluation of the effectiveness of theinternal control over financial reporting to future periods are subject to the risk that the controls may become inadequate because of changes in conditions, or
that the degree of compliance with the policies or procedures may deteriorate.
In our opinion, the consolidated financial statements referred to above present fairly,in all material respects, the financial position of Walgreen Co. and Subsidiaries as
of August 31, 2008 and 2007, and the results of their operations and their cashflows for each of the three years in the period ended August 31, 2008, in conformitywith accounting principles generally accepted in the United States of America.
Also, in our opinion, the Company maintained, in all material respects, effectiveinternal control over financial reporting as of August 31, 2008, based on thecriteria established in Internal Control – Integrated Framework issued by theCommittee of Sponsoring Organizations of the Treadway Commission.
As discussed in Note 1 to the consolidated financial statements, effectiveSeptember 1, 2007, the Company changed its method of accounting for uncertaintax benefits upon adoption of Financial Accounting Standards Board InterpretationNo. 48, Accounting for Uncertainty in Income Taxes – an interpretation of FASB
Statement No. 109, and effective August 31, 2007, the Company adopted therecognition and disclosure provisions of Statement of Financial AccountingStandards No. 158, Employers’ Accounting for Defined Benefit Pension and
Other Postretirement Plans – an amendment of FASB Statements No. 87, 88,106, and 132(R).
DELOITTE & TOUCHE LLP
Chicago, IllinoisOctober 28, 2008
Alan G. McNally
Chairman and
acting Chief Executive Officer
To the Board of Directors and Shareholders of Walgreen Co.:
We have audited the accompanying consolidated balance sheets of Walgreen Co.and Subsidiaries (the “Company”) as of August 31, 2008 and 2007, and the relatedconsolidated statements of earnings, shareholders’ equity, and cash flows for eachof the three years in the period ended August 31, 2008. We also have audited the
Company’s internal control over financial reporting as of August 31, 2008, basedon criteria established in Internal Control – Integrated Framework issued by theCommittee of Sponsoring Organizations of the Treadway Commission. The Company’s
management is responsible for these financial statements, for maintainingeffective internal control over financial reporting, and for its assessment ofthe effectiveness of internal control over financial reporting, included in theaccompanying Management’s Report on Internal Control. Our responsibilityis to express an opinion on these financial statements and an opinion on theCompany’s internal control over financial reporting based on our audits.
We conducted our audits in accordance with the standards of the Public Company Accounting Oversight Board (United States). Those standards require that we plan
and perform the audit to obtain reasonable assurance about whether the financialstatements are free of material misstatement and whether effective internal controlover financial reporting was maintained in all material respects. Our audits of thefinancial statements included examining, on a test basis, evidence supporting theamounts and disclosures in the financial statements, assessing the accountingprinciples used and significant estimates made by management, and evaluating
the overall financial statement presentation. Our audit of internal control overfinancial reporting included obtaining an understanding of internal control overfinancial reporting, assessing the risk that a material weakness exists, and testingand evaluating the design and operating effectiveness of internal control based onthe assessed risk. Our audits also included performing such other procedures aswe considered necessary in the circumstances. We believe that our audits providea reasonable basis for our opinions.
A company’s internal control over financial reporting is a process designed by, orunder the supervision of, the company’s principal executive and principal financialofficers, or persons performing similar functions, and effected by the company’sboard of directors, management, and other personnel to provide reasonableassurance regarding the reliability of financial reporting and the preparation offinancial statements for external purposes in accordance with generally acceptedaccounting principles. A company’s internal control over financial reporting includes
those policies and procedures that (1) pertain to the maintenance of records that,
in reasonable detail, accurately and fairly reflect the transactions and dispositionsof the assets of the company; (2) provide reasonable assurance that transactions are
control over financial reporting, as such term is defined in Exchange Act Rule 13a-15(f).Under the supervision and with the participation of our management, including ourprincipal executive officer and principal financial officer, we conducted an evaluation ofthe effectiveness of our internal control over financial reporting based on the framework in Internal Control – Integrated Framework issued by the Committee of Sponsoring
Organizations of the Treadway Commission (COSO). Based on our evaluation, manage-ment concluded that our internal control over financial reporting was effective as of
August 31, 2008. Deloitte & Touche LLP, the company’s independent registered publicaccounting firm, has audited our internal control over financial reporting, as stated in
its report which is included herein.
Wade D. Miquelon
Senior Vice President and
Chief Financial Officer
Report of Independent Registered Public Accounting Firm
For Our Shareholders

8/6/2019 2008AR Walgreens
http://slidepdf.com/reader/full/2008ar-walgreens 39/40
Corporate HeadquartersWalgreen Co.
200 Wilmot Road
Deerfield, Illinois 60015
(847) 914-2500
Stock Market ListingsNew York Stock Exchange
The NASDAQ Stock Market LLC
Chicago Stock Exchange
Symbol: WAG
Investor ContactsRick J. Hans, CFA (847) 914-2385
John W. Spina (847) 914-3008
Annual Shareholders’ Meeting You are cordially invited to attend the meeting to be held Wednesday,
January 14, 2009, at 10 a.m. CST, in the Grand Ballroom, Navy Pier,
Chicago, Illinois. Formal notice of the meeting, with proxy card
and proxy statement, was mailed to all shareholders of record as
of November 17, 2008.
Investor Information As of September 30, 2008, Walgreens had approximately 97,000
shareholders of record.
Investor information is available at http://investor.walgreens.com.
This includes corporate governance guidelines, charters of all committees
of the Board of Directors, quarterly reports, press releases, proxy statements,
the company’s Code of Ethics for Financial Executives and Ethics Policy
Statement and the 2008 Annual Report on Form 10-K filed with the
Securities and Exchange Commission. These and other financial reports
may also be obtained without charge upon request to:
Shareholder Relations
Walgreen Co. – Mail Stop #2261
200 Wilmot Road
Deerfield, Illinois 60015
(847) 914-2972
http://investor.walgreens.com/InvestorKit.cfm
Walgreens has provided certifications by the acting Chief Executive Officer
and Chief Financial Officer regarding the quality of the company’s public
disclosure, as required by Section 302 of the Sarbanes-Oxley Act, on
Exhibit 31 to its Annual Report on Form 10-K. Our Chief Executive Officer
made an unqualified certification to the New York Stock Exchange
(“the NYSE”) with respect to our compliance with NYSE corporate
governance listing standards in January 2008.
Electronic ReportsTo receive proxy statements, annual reports and related materials
electronically, please refer to the proxy mailed to shareholders with
this annual report. After January 14, 2009, call (847) 914-2361
or go to http://investor.walgreens.com/InvestorKit.cfm to request
electronic delivery.
Quarterly Reporting DatesQuarterly earnings release dates for fiscal 2009 are December 22,
March 23, June 22 and September 28. Results are released to the press
and posted on the Walgreen website at http://investor.walgreens.com.
Dividend Payment DatesWalgreens pays dividends in March, June, September and December.
Checks are customarily mailed on the 12th of each of these months.
Transfer Agent and RegistrarFor assistance on matters such as lost shares or name changes on shares,
please contact:
Computershare Investor Services
250 Royall Street
Canton, Massachusetts 02021www.computershare.com/contactus
(888) 368-7346
Direct Stock Purchase PlanComputershare Investor Services sponsors and administers a direct stock
purchase plan as a convenient method of acquiring Walgreen stock by
cash payments, reinvestment of dividends or both. For an information
booklet and enrollment form, please call (888) 368-7346. General
inquiries to Computershare Investor Services regarding your Walgreen
stock should also be directed to (888) 368-7346.
D e s i g n :
C a g n e y +
A s s o c i a t e s ,
I n c .
M a j o r
p h o t o g r a p h
y : M i c h a e l M
a u n e y
P a g e
5 : K
a r e n
C a m
p b e l l
C A R E & C O N V E N I E N C E

8/6/2019 2008AR Walgreens
http://slidepdf.com/reader/full/2008ar-walgreens 40/40
109
499
68
55
27
8
8
36
232 54
607
93
58138
50
13
1117
63
174
50
125
60 85 160
757
78
84
96
153
6
25
135
23
76
109
62
1(DC)
42131
228
79
536
206
189
204
231
4
2
Puerto Rico – 95
Hawaii – 1
Walgreen Co.
200 Wilmot Road, Deerfield, Illinois 60015
Walgreens.com • WalgreensEspañol.com • Diversity.Walgreens.com RECYCLED
This report is printed on paper that meets FSC certification standards.
Printing of this report was executed by an environmentally sustainable printer
that is FSC-certified and has a zero landfill, 100 percent recycling policy for
all hazardous and non-hazardous waste by-products. The company generates
all of its own electricity and thermal power and is the only Air Quality Management
District (AQMD)-certified “totally enclosed” commercial printing facility in the U.S.
This process results in virtually zero volatile organic compound (VOC) emissions
being released into the atmosphere.
E
Walgreens Points of CareAs of August 31, 2008
Drugstores (Numbers shown on map) 6,443
In-Store and Worksite Health Centers 581*
Home Care Facilities 115
Specialty Pharmacies 10
Mail Service Facilities 2
* Number includes 217 in-store clinics located within drugstores.
…where you live and work