2008 Year End Review and 2009 Forecast – An … Year End Review and 2009 Forecast – An Analysis...
13
2008 Year End Review and 2009 Forecast – An Analysis AIA Research Center Following four years of remarkable expansion, the U.S. aerospace industry continued to see growth in 2008, although at a more moderate rate. The Aerospace Industries Association (AIA) estimates that aerospace sales will reach $204.4 billion in 2008, following sales of $200.3 billion in 2007. This year had more than its share of challenges for aerospace manufacturing, but the industry has successfully faced challenges before, and the fundamentals that drive aerospace remain extremely resilient. Indeed, as the global financial crisis continues to bring many industries to their knees, aerospace is largely flying above the storm. In recent years, aerospace companies have gained more solid financial footing in a number of ways, such as paying down debt and increasing solvency. These responsible strategies are now paying off, enabling aerospace companies to meet financial obligations and to continue to produce goods and services, maintaining their critical role of steady support to the U.S. economy. For positive economic indicators, look no further than employment, which continued to increase in 2008 for aerospace manufacturing, an accomplishment few other industries have been able to match in recent times. Civil Aircraft Sales The civil sector saw moderate growth in 2008, up almost $400 million to $80.6 billion. Transport aircraft made up the most significant portion of civil aircraft sales by value in 2008, and dipped temporarily due to the Boeing work-stoppage. Helicopters and general aviation aircraft shipments were up considerably over previous years, resulting in a net positive trend. The U.S. civil aviation market has grown tremendously in recent years on the strength of global economic expansion, world trade, and aircraft innovations. However, airlines worldwide are facing an increasingly difficult business environment. While strategies such as cutting capacity and increasing ticket prices have positioned airlines to meet current economic troubles, the market conditions forebode weakening demand for air transportation. International and domestic passenger traffic has slid in recent months, with the global economic upheaval effecting even booming markets like China and the Middle East. Air transportation, strongly correlated with economic growth, is clearly poised for long term expansion, but the near-term may bring difficult times as passengers struggle with overall poor economic conditions. Airlines have tempered their fleet replacement and expansion plans due to softening demand, bringing new aircraft orders down significantly and extending delivery dates. Orders began to slow in early 2008, and as the year progressed, rapidly deteriorating market conditions hastened the decline. Slumping corporate profits and customer financing problems have impacted short term demand for business jets. Large civil aircraft are also affected, with airlines facing tighter credit terms. However, aircraft backlogs provide a measure of longer-term optimism for the industry; Boeing alone has a backlog approximately seven times the current production rate. Military Aircraft Sales Sales of military aircraft were up in 2008 to $54.7 billion. This segment reflected the gradual rise in aircraft research and development, aftermarket labor and materials, and UAV production and support.
Transcript of 2008 Year End Review and 2009 Forecast – An … Year End Review and 2009 Forecast – An Analysis...
2008 Year End Review and 2009 Forecast – An Analysis
AIA Research Center Following four years of remarkable expansion, the U.S. aerospace industry continued to see growth in 2008, although at a more moderate rate. The Aerospace Industries Association (AIA) estimates that aerospace sales will reach $204.4 billion in 2008, following sales of $200.3 billion in 2007. This year had more than its share of challenges for aerospace manufacturing, but the industry has successfully faced challenges before, and the fundamentals that drive aerospace remain extremely resilient. Indeed, as the global financial crisis continues to bring many industries to their knees, aerospace is largely flying above the storm. In recent years, aerospace companies have gained more solid financial footing in a number of ways, such as paying down debt and increasing solvency. These responsible strategies are now paying off, enabling aerospace companies to meet financial obligations and to continue to produce goods and services, maintaining their critical role of steady support to the U.S. economy. For positive economic indicators, look no further than employment, which continued to increase in 2008 for aerospace manufacturing, an accomplishment few other industries have been able to match in recent times. Civil Aircraft Sales The civil sector saw moderate growth in 2008, up almost $400 million to $80.6 billion. Transport aircraft made up the most significant portion of civil aircraft sales by value in 2008, and dipped temporarily due to the Boeing work-stoppage. Helicopters and general aviation aircraft shipments were up considerably over previous years, resulting in a net positive trend. The U.S. civil aviation market has grown tremendously in recent years on the strength of global economic expansion, world trade, and aircraft innovations. However, airlines worldwide are facing an increasingly difficult business environment. While strategies such as cutting capacity and increasing ticket prices have positioned airlines to meet current economic troubles, the market conditions forebode weakening demand for air transportation. International and domestic passenger traffic has slid in recent months, with the global economic upheaval effecting even booming markets like China and the Middle East. Air transportation, strongly correlated with economic growth, is clearly poised for long term expansion, but the near-term may bring difficult times as passengers struggle with overall poor economic conditions. Airlines have tempered their fleet replacement and expansion plans due to softening demand, bringing new aircraft orders down significantly and extending delivery dates. Orders began to slow in early 2008, and as the year progressed, rapidly deteriorating market conditions hastened the decline. Slumping corporate profits and customer financing problems have impacted short term demand for business jets. Large civil aircraft are also affected, with airlines facing tighter credit terms. However, aircraft backlogs provide a measure of longer-term optimism for the industry; Boeing alone has a backlog approximately seven times the current production rate. Military Aircraft Sales Sales of military aircraft were up in 2008 to $54.7 billion. This segment reflected the gradual rise in aircraft research and development, aftermarket labor and materials, and UAV production and support.

For aircraft production, fighter planes are responsible for the largest share of revenues, followed by helicopters and military transports. U.S. defense spending, a broad driver of aerospace sales, continued to rise in 2008. Since fiscal year (FY) 2003, supplemental spending to support troops in Iraq and Afghanistan has boosted the baseline budget and has led to large increases in procurement for additional equipment, spares, and maintenance services. Overall, U.S. weapons procurement grew from $54 billion in FY 2001 to $146 in FY 2008. Moving forward, supplemental funding is likely to decrease as operations in Iraq scale back. Weaker R&D funding is also expected, which will likely have long term consequences for the competitiveness of the overall U.S. manufacturing industry. Historically, defense spending has been somewhat insulated from trends in the overall economy, but spiraling government deficits related to recent federal bailouts and reduced tax revenue may lead to downward pressure on defense budgets. However, the delay between defense funding and the actual shipment of the purchased equipment can take several years, which would cause a lag between any future budget declines and current outlays. Since new procurement spending is basically committed for FY 2009, and the new administration will have limited impact on FY 2010, aerospace companies will likely see defense sales growth continue on-pace through calendar year 2012. Missile Sales The missile segment enjoyed strong growth in 2008, up 6.7 percent to $13.2 billion. The U.S. remains the largest buyer of missiles and is heavily committed to missile research and development. U.S. Army, Navy, Air Force and Department of Defense-wide spending on missile research and development increased 11 percent this year. Procurement stayed fairly level, up slightly to $7.9 billion total. Space Sales Space sales, made up primarily of research and development, and production and services, were up 4.2 percent to $33.4 billion. Although research and development in the space sector was fairly flat in 2008, production and services was up 15 percent, accounting for most of the segment’s growth. U.S. commercial satellites and launch services business grew dramatically, with NASA and Defense Department space contracts up only slightly. Exports To maintain their competitive edge, U.S. aerospace companies have also become more geographically balanced in recent years, thereby reducing their reliance on any one market. As such, foreign trade has become increasingly important to the industry. Over the last year, foreign customers bought U.S. aerospace products in record numbers. Further, the relative depreciation of the U.S. dollar made U.S. aerospace exports more affordable to overseas purchasers. As the dollar strengthens, U.S. aerospace products may lose some price advantage, but not to a significant degree. Exports of U.S. aerospace products are expected to increase modestly in 2008 to $99.2 billion. Civil transport aircraft, well over a third of total industry exports, will be lower this year due to the Boeing work-stoppage, coming in at $37.5 billion for the year. However, 2008 was another big year for general aviation aircraft, which were exported at record levels. Foreign demand for military aircraft, engines, and parts also increased. Japan remains the biggest market for the industry, buying roughly 8.5% of aerospace exports. For the first half of 2008, Canada and the U.K. rounded out the top three export markets. Imports Although the U.S. will import fewer civil transports and general aviation aircraft this year, total aerospace imports are expected to increase by $2 billion to $38.6 billion. Imports of helicopters and aircraft engines are on track for big increases, and aircraft engines and parts make up well over half of U.S. aerospace

imports. France, Canada, the U.K., Japan, and Germany will be the top five aerospace suppliers to the U.S. for the year, accounting for three fourths of all aerospace imports. Trade Balance International trade has continued to flourish in 2008, with record aerospace exports and imports expected. The positive trade balance for aerospace products will stay in record territory in 2008, with a surplus of over $60.6 billion. While the overall U.S. chronic trade deficit will continue in 2008, the aerospace industry will make a significant positive impact on the nation’s trade balance. Foreign suppliers of aerospace products imported to the U.S. are more concentrated than U.S. export markets, illustrating the broad reach of U.S. aerospace around the world. Orders & Backlog Orders for aircraft and parts and search and navigation equipment decreased 14 percent from last year’s record number to $233.7 billion. Despite this drop in new orders, the backlog in 2008 will be higher than ever, at $404.5 billion. This backlog is comprised largely of civil transport aircraft, valued at $293.4 billion for 3,721 aircraft as of September 30th. The backlog is buoyed by unfilled orders from foreign customers, 81 percent of the backlog value with 2,878 aircraft on order. The growing importance of foreign orders reflects the trend towards a more globally-spread customer base. Employment The aerospace industry is predicted to add 10,000 workers to its ranks in 2008, closing the year with 655,500 direct employees. Aerospace employment has risen steadily since 2003, with data up to the third quarter 2008 reflecting increased employment opportunities. Aircraft manufacturing makes up roughly one third of industry employment, and has grown by 5,000 employees since last year. Production workers, approximately half of the total workforce, will take home $29.58 per hour, and log 43.5 hours of work weekly. Profit According to preliminary data from the U.S. Census Bureau, the aerospace industry will have profits of $20.9 billion in 2008. This is an increase from last year’s figures, with profits as a percent of sales increasing to 8.6 percent. Aerospace manufacturing profits as a percent of sales, assets, and equity remain healthier than for the manufacturing industry at large, which has experienced faltering profit margins in recent years. Outlook Despite an uncertain economy, the outlook for the U.S. aerospace industry remains strong. The current upturn, begun in 2004, has been the strongest and broadest since World War II. Additionally, the commercial and military segments are prospering simultaneously, an almost unprecedented occurrence. The industry’s key advantages position aerospace as one of the few U.S. manufacturing industries with visible long-term demand growth, solid prospects which promise to propel the industry to new heights. Following the Boeing work-stoppage, which compressed overall industry sales in 2008, production rates are expected to normalize in 2009, pushing industry growth up 4.8 percent from the current year. Defense sales will likely continue to increase in the near term, as Defense Department budgets are mostly in place. For the next twelve months, many orders for large civil aircraft are locked into the system, with financing in place, alleviating concerns that the tight credit market will have a significant impact on aerospace sales next year.
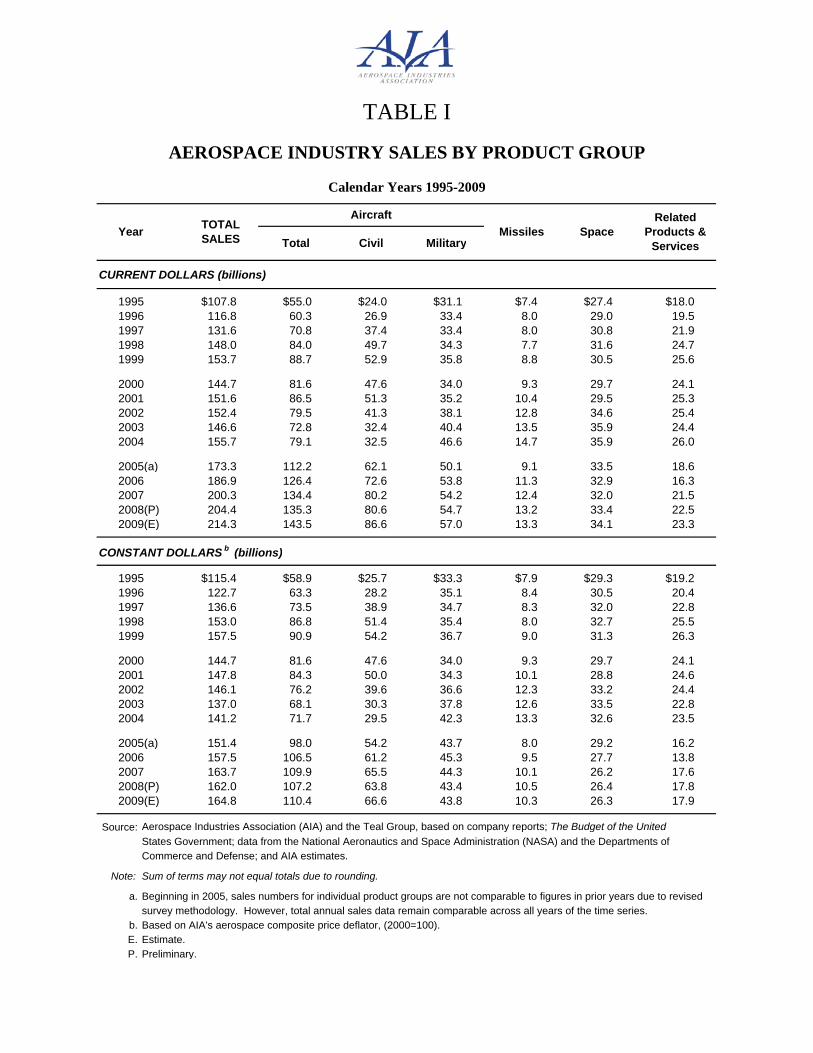
TABLE I
AEROSPACE INDUSTRY SALES BY PRODUCT GROUPAEROSPACE INDUSTRY SALES BY PRODUCT GROUP
C l d Y 1995 2009Calendar Years 1995-2009
Aircraft R l t d
Civil MilitaryTOTALSALES
AircraftMissiles Space
Related Products &
ServicesTotalYear
CURRENT DOLLARS (billions)
Civil Military ServicesTotal
CURRENT DOLLARS (billions)
$107.8 $55.0 $24.0 $31.1 $7.4 $27.4 $18.01995116.8 60.3 26.9 33.4 8.0 29.0 19.5131.6 70.8 37.4 33.4 8.0 30.8 21.9
19961997
148.0 84.0 49.7 34.3 7.7 31.6 24.7153.7 88.7 52.9 35.8 8.8 30.5 25.6
19981999
144.7 81.6 47.6 34.0 9.3 29.7 24.1151 6 86 5 51 3 35 2 10 4 29 5 25 3
20002001 151.6 86.5 51.3 35.2 10.4 29.5 25.3
152.4 79.5 41.3 38.1 12.8 34.6 25.4146.6 72.8 32.4 40.4 13.5 35.9 24.4
200120022003 146.6 72.8 32.4 40.4 13.5 35.9 24.4
155.7 79.1 32.5 46.6 14.7 35.9 26.020032004
173.3 112.2 62.1 50.1 9.1 33.5 18.6186.9 126.4 72.6 53.8 11.3 32.9 16.3200 3 134 4 80 2 54 2 12 4 32 0 21 5
20062007
2005(a)
200.3 134.4 80.2 54.2 12.4 32.0 21.5204.4 135.3 80.6 54.7 13.2 33.4 22.5214 3 143 5 86 6 57 0 13 3 34 1 23 3
20072008(P)2009(E) 214.3 143.5 86.6 57.0 13.3 34.1 23.3
CONSTANT DOLLARS b (billions)
2009(E)
CONSTANT DOLLARS (billions)
$115.4 $58.9 $25.7 $33.3 $7.9 $29.3 $19.21995122.7 63.3 28.2 35.1 8.4 30.5 20.4136.6 73.5 38.9 34.7 8.3 32.0 22.8
19961997
153.0 86.8 51.4 35.4 8.0 32.7 25.5157.5 90.9 54.2 36.7 9.0 31.3 26.3
19981999
144.7 81.6 47.6 34.0 9.3 29.7 24.1147 8 84 3 50 0 34 3 10 1 28 8 24 6
20002001 147.8 84.3 50.0 34.3 10.1 28.8 24.6
146.1 76.2 39.6 36.6 12.3 33.2 24.4137.0 68.1 30.3 37.8 12.6 33.5 22.82003
20012002
137.0 68.1 30.3 37.8 12.6 33.5 22.8141.2 71.7 29.5 42.3 13.3 32.6 23.52004
2003
151.4 98.0 54.2 43.7 8.0 29.2 16.2157.5 106.5 61.2 45.3 9.5 27.7 13.8163 7 109 9 65 5 44 3 10 1 26 2 17 6
2005(a)20062007 163.7 109.9 65.5 44.3 10.1 26.2 17.6
162.0 107.2 63.8 43.4 10.5 26.4 17.8164 8 110 4 66 6 43 8 10 3 26 3 17 92009(E)
20072008(P)
164.8 110.4 66.6 43.8 10.3 26.3 17.9
Source: Aerospace Industries Association (AIA) and the Teal Group, based on company reports; The Budget of the United
2009(E)
Source: p ( ) p, p y p ; gStates Government; data from the National Aeronautics and Space Administration (NASA) and the Departments of Commerce and Defense; and AIA estimates.
Note: Sum of terms may not equal totals due to rounding.
a. Beginning in 2005, sales numbers for individual product groups are not comparable to figures in prior years due to revisedsurvey methodology. However, total annual sales data remain comparable across all years of the time series.
b B d AIA' it i d fl t (2000 100)b. Based on AIA's aerospace composite price deflator, (2000=100).E. Estimate.P PreliminaryP. Preliminary.

TABLE II
AEROSPACE INDUSTRY SALES BY CUSTOMERAEROSPACE INDUSTRY SALES BY CUSTOMER
Calendar Years 1995-2009
Aerospace Products and ServicesR l d
Calendar Years 1995 2009
NASAand other Other Year TOTAL
SALES
Related Products &
Ser icesTotal Department and otherAgencies Customers ServicesTotal of Defense
CURRENT DOLLARS (billions)
$107 8 $89 8 $42 4 $11 4 $36 0 $18 01995 $107.8 $89.8 $42.4 $11.4 $36.0 $18.0116.8 97.3 42.5 12.4 42.4 19.5131 6 109 7 43 7 12 8 53 2 21 9
199519961997 131.6 109.7 43.7 12.8 53.2 21.9
148.0 123.3 42.9 13.3 67.0 24.7153.7 128.1 45.7 13.4 69.0 25.6
199719981999
144.7 120.6 47.5 13.4 59.7 24.1151 6 126 4 50 1 14 5 61 8 25 3
20002001 151.6 126.4 50.1 14.5 61.8 25.3
152.3 127.0 57.7 16.4 52.9 25.4146 6 122 2 64 0 15 5 42 7 24 42003
20012002
146.6 122.2 64.0 15.5 42.7 24.4155.7 129.8 70.1 16.0 43.7 26.02004
2003
173.3 154.8 80.0 11.0 63.7 18.6186.9 170.6 86.8 9.5 74.3 16.32006
2005(a,b)
200.3 178.8 87.6 9.9 81.3 21.5204.4 181.9 89.3 10.4 82.2 22.5214 3 191 0 91 8 10 7 88 5 23 3
20072008(P)2009(E) 214.3 191.0 91.8 10.7 88.5 23.3
CONSTANT DOLLARS c (billions)
2009(E)
CONSTANT DOLLARS (billions)
$115.4 $96.1 $45.4 $12.2 $38.5 $19.21995122.6 102.2 44.7 13.0 44.5 20.4136.6 113.9 45.4 13.2 55.2 22.8153 0 127 5 44 4 13 8 69 3 25 5
199619971998 153.0 127.5 44.4 13.8 69.3 25.5
157.5 131.3 46.8 13.7 70.7 26.319991998
144.7 120.6 47.5 13.4 59.7 24.1147.8 123.2 48.9 14.1 60.2 24.6
20002001
146.1 121.8 55.3 15.7 50.7 24.4137.0 114.2 59.8 14.5 39.9 22.8
20022003
141.2 117.6 63.5 14.5 39.6 23.5
151 4 135 1 69 9 9 6 55 7 16 2
2004
2005(a b) 151.4 135.1 69.9 9.6 55.7 16.2157.5 143.8 73.1 8.0 62.7 13.8163.7 146.2 71.7 8.1 66.4 17.6
20062007
2005(a,b)
162.0 144.1 70.7 8.2 65.2 17.8164.8 146.9 70.6 8.2 68.1 17.92009(E)
2008(P)
Source: Aerospace Industries Association (AIA) and the Teal Group, based on company reports; The Budget of the United States Government; data from the National Aeronautics and Space Administration (NASA) and the Departments ofStates Government; data from the National Aeronautics and Space Administration (NASA) and the Departments of Commerce and Defense; and AIA estimates.
Note: Sum of terms may not equal totals due to rounding.
a. Beginning in 2005, sales numbers for individual product groups are not comparable to figures in prior years due torevised survey methodology. However, total annual sales data remain comparable across all years of the time series.
b. Beginning in 2005, NASA sales were reported separately from other agencies. c. Based on AIA's aerospace composite price deflator, (2000=100).E. Estimate.P PreliminarP. Preliminary.

TABLE IIITABLE III
SHIPMENTS, ORDERS, AND BACKLOG:Aircraft & Parts and Search & Navigation Equipment
As of End-of-Year 1984-2008
(Millions of Dollars)
Year Shipments Orders Backlogp g
1984 $79 135 $91 620 $118 6641984 $79,135 $91,620 $118,6641985 91,337 100,889 128,2161986 101 832 107 993 134 3771986 101,832 107,993 134,3771987 103,590 114,835 145,6221988 107 955 137 443 175 1101988 107,955 137,443 175,110
1989 110,603 153,430 217,9371990 125,822 150,329 242,4441991(1) 132,182 132,645 242,9071992 137,114 118,369 220,233, , ,1993 123,850 100,815 197,198
1994 112,511 98,621 183,3081995 110 928 115 279 187 6591995 110,928 115,279 187,6591996 110,840 134,142 210,9611997 132 787 143 071 221 2451997 132,787 143,071 221,2451998 150,077 138,407 209,575
1999 152,728 140,329 197,1762000 144,740 165,994 218,4302001 153,571 146,897 211,7562002 140,889 129,635 200,5022003 135,955 132,524 197,071003 35,955 3 ,5 9 ,0
2004 145 305 148 335 200 1012004 145,305 148,335 200,1012005 152,081 184,119 232,1392006 165 036 213 773 280 8762006 165,036 213,773 280,8762007 184,334 271,177 367,7192008(P) 196 903 233 653 404 4692008(P) 196,903 233,653 404,469
Source: U S Census Bureau "Manufacturers' Shipments Inventories and Orders " and AIA estimatesSource: U.S. Census Bureau, "Manufacturers' Shipments, Inventories, and Orders," and AIA estimates.
Note: Not seasonally adjusted; includes aircraft engine and parts manufacturing.y j ; g p g
1. Data prior to 1992 reported using previous industrial classification system, and equals aircraft,i il d hi l f t i tmissiles, and space vehicles manufacturing sectors.
P. Preliminary.

TABLE IVTABLE IV
CIVIL TRANSPORT AIRCRAFT BACKLOGAs of End-of-Year
2004 2005 2006 2007 20081
TOTAL BACKLOG:Number of Aircraft 1 062 1 791 2 451 3 427 3 721Number of Aircraft 1,062 1,791 2,451 3,427 3,721 Value (in millions) $76,345 $133,197 $184,610 $270,728 $293,414
Boeing:B-717 (MD-95) 18 5 - - - ( )B-737 771 1,123 1,560 2,076 2,292 B-747 27 58 116 125 115B 747 27 58 116 125 115 B-757 2 - - - - B 767 25 30 28 52 64B-767 25 30 28 52 64 B-777 167 288 299 357 359 B 787 52 287 448 817 891B-787 52 287 448 817 891
Foreign Order Backlog:Foreign Order Backlog:Percent of Total Backlog:
Number of Aircraft 53 5% 69 2% 70 6% 75 3% 77 3%Number of Aircraft 53.5% 69.2% 70.6% 75.3% 77.3%Value 63.0% 75.8% 75.6% 78.8% 80.5%
Number of Aircraft 568 1,239 1,730 2,581 2,878 V l (i illi ) $48 109 $100 971 $139 554 $213 418 $236 260Value (in millions) $48,109 $100,971 $139,554 $213,418 $236,260
Boeing:Boeing:B-717 (MD-95) 2 - - - - B 737 347 684 1 008 1 493 1 712B-737 347 684 1,008 1,493 1,712 B-747 27 44 85 101 98 B 757 2B-757 2 - - - - B-767 24 29 27 24 36 B-777 114 240 233 284 279 B-787 52 242 377 679 753
U.S. Order Backlog:N b f Ai ft 494 552 721 846 843Number of Aircraft 494 552 721 846 843 Value (in millions) $28,236 $32,226 $45,055 $57,310 $57,154
Boeing:B 717 (MD 95) 16 5B-717 (MD-95) 16 5 - - - B-737 424 439 552 583 580 B 747 14 31 24 17B-747 - 14 31 24 17 B-757 - - - - - B-767 1 1 1 28 28 B-777 53 48 66 73 80 B-787 - 45 71 138 138
Source: Aerospace Industries Association, based on company reports.
1 As of end of third quarter1. As of end of third quarter.

TABLE VTABLE V
CIVIL AIRCRAFT SHIPMENTSCIVIL AIRCRAFT SHIPMENTSCalendar Years 1995-2009
Year TOTALTransportAircraft1 Helicopters General
Aviation
NUMBER OF AIRCRAFT SHIPPED
Aircraft Aviation
NUMBER OF AIRCRAFT SHIPPED
1995 1,625 256 292 1,0771996 1,662 269 278 1,1151997 2,269 374 346 1,5491998 3,115 559 363 2,1931999 3,456 620 361 2,475
2000 3,780 485 493 2,8022001 3,559 526 415 2,6182002 2,893 379 318 2,1962003 2,928 281 517 2,1302004 3,432 283 805 2,344
2005 4,087 290 947 2,8502006 4 443 398 898 3 1472006 4,443 398 898 3,1472007 4,729 441 1,009 3,2792008(P) 4 976 433 1 214 3 3292008(P) 4,976 433 1,214 3,3292009(E) 5,348 493 1,387 3,468
VALUE (millions of dollars)
1995 $18,299 $15,263 $194 $2,8421996 20,805 17,564 193 3,0481997 31,753 26,929 231 4,5931998 41,449 35,663 252 5,5341999 45,161 38,171 187 6,803
2000 38 637 30 327 270 8 0402000 38,637 30,327 270 8,0402001 42,399 34,155 247 7,9972002 35 000 27 574 157 7 2692002 35,000 27,574 157 7,2692003 27,523 21,033 366 6,1242004 27 089 20 484 515 6 0902004 27,089 20,484 515 6,090
2005 31 082 21 941 816 8 3252005 31,082 21,941 816 8,3252006 36,425 25,875 832 9,7182007 42 485 29 160 1 385 11 9402007 42,485 29,160 1,385 11,9402008(P) 43,240 27,393 1,666 14,1812009(E) 47 855 31 175 1 904 14 7752009(E) 47,855 31,175 1,904 14,775
Source: Aerospace Industries Association, based on company reports, data from the General AviationSource: Aerospace Industries Association, based on company reports, data from the General AviationManufacturers Association (GAMA), and AIA estimates.
1 I l d ll U S f t d i il j t t t i ft l th t b d L kh d L 1001. Includes all U.S.-manufactured civil jet transport aircraft plus the turboprop-powered Lockheed L-100.P. Preliminary.E E ti tE. Estimate.

TABLE VITABLE VI
AEROSPACE BALANCE OF TRADE
Calendar Years 2004-2008Calendar Years 2004 2008
(Millions of Dollars)
2004 2005 2006 2007 2008P
(Millions of Dollars)
2004 2005 2006 2007 2008
BALANCE OF TRADE:Current Dollars $31,002 $39,783 $54,809 $60,614 $60,633$ , $ , $ , $ , $ ,Constant Dollars 1 28,106 34,739 46,201 49,556 48,045
AEROSPACE EXPORTS:Current Dollars $56,817 $67,432 $85,262 $97,224 $99,237Constant Dollars 1 51 510 58 882 71 872 79 487 78 635Constant Dollars 51,510 58,882 71,872 79,487 78,635
AEROSPACE IMPORTSAEROSPACE IMPORTS:Current Dollars $25,815 $27,649 $30,453 $36,610 $38,604Constant Dollars 1 23,404 24,143 25,670 29,931 30,590
Source: Aerospace Industries Association, based on data from the U.S. Department of Commerce and AIA estimates.
Note: Trade balances may not equal the difference between exports and imports due to rounding.
1 Based on AIA's aerospace composite price deflator (2000=100)1. Based on AIA s aerospace composite price deflator, (2000=100).P. Preliminary.

TABLE VIITABLE VII
U.S. IMPORTS OF AEROSPACE PRODUCTS
Calendar Years 2004-2008Calendar Years 2004 2008
(Millions of Dollars)
2004 2005 2006 2007 2008P
(Millions of Dollars)
2004 2005 2006 2007 2008
TOTAL IMPORTS $25 815 $27 649 $30 453 $36 610 $38 604TOTAL IMPORTS $25,815 $27,649 $30,453 $36,610 $38,604
Aircraft: 11,655 10,891 10,775 13,296 12,533
Milit 10 40 2 12 35Military 10 40 2 12 35
Civil: 11 645 10 851 10 772 13 284 12 498Civil: 11,645 10,851 10,772 13,284 12,498Transports 5,248 5,988 4,946 6,916 6,604General Aviation 4,602 3,680 3,986 4,532 4,161Helicopters 492 513 682 889 1 052Helicopters 492 513 682 889 1,052Other1 1,304 670 1,159 947 682
Aircraft Engines: 2,629 3,271 3,739 3,880 4,544
Turbine 2,600 3,183 3,650 3,812 4,418Piston 29 88 90 69 126
Aircraft and Engine Parts 10,841 12,707 15,055 18,528 20,734
Spacecraft, Missiles, Rockets,and Parts 691 779 884 905 793
Source: Aerospace Industries Association, based on data from the U.S. Department of Commerce and AIA estimates.
Notes: Import data include non military aircraft parts and aerospace products previously exported from the United StatesNotes: Import data include non-military aircraft parts and aerospace products previously exported from the United States.Totals may not equal sum of terms due to rounding.
1. Includes used aircraft, gliders, balloons, and airships.P. Preliminary.P. Preliminary.

TABLE VIII
EXPORTS OF U S AEROSPACE PRODUCTSEXPORTS OF U.S. AEROSPACE PRODUCTS
(Milli f D ll )
Calendar Years 2004-2008
2004 2005 2006 2007 P
(Millions of Dollars)
2004 2005 2006 2007 2008P
TOTAL EXPORTS $56 817 $67 432 $85 262 $97 224 $99 237TOTAL EXPORTS $56,817 $67,432 $85,262 $97,224 $99,237
TOTAL CIVIL EXPORTS $47,771 $57,588 $71,857 $83,979 $86,512O C O S $ , $5 ,588 $ ,85 $83,9 9 $86,5
Complete Aircraft: 22,568 28,104 39,461 47,559 46,881p , , , , ,Transports 18,577 21,888 32,897 40,297 37,525General Aviation 1,486 2,443 3,349 3,911 4,924Helicopters 313 565 671 1,117 934Used Aircraft 2,164 3,185 2,511 2,197 3,455Other Aircraft 28 24 33 37 44
Aircraft Engines: 5,271 6,762 6,202 7,127 8,534Turbine 5,081 6,564 6,032 6,953 8,350Piston 191 198 170 174 183
Ai ft & E i P tAircraft & Engine Parts,Including Spares 19,267 22,248 25,588 28,469 30,473
Missiles, Rockets, & Parts 20 21 28 13 25
Spacecraft, Satellites, & Parts 645 453 578 811 600
TOTAL MILITARY EXPORTS $9,046 $9,844 $13,405 $13,246 $12,725
Complete Aircraft: 2,289 2,392 4,464 4,174 4,797Transports 332 171 375 789 1,984p ,Helicopters 158 156 618 791 182Fighters & Fighter Bombers 1,674 1,976 3,351 2,303 1,744g gUsed Aircraft 86 45 20 119 745Other Aircraft 39 43 101 172 143
Aircraft Engines: 280 411 414 414 408Turbine 198 302 312 277 323Piston 82 109 102 137 85
Aircraft and Engine Parts,I l di S 5 362 5 811 6 936 7 185 6 082Including Spares 5,362 5,811 6,936 7,185 6,082
Mi il R k t & P t 998 1 084 1 452 1 359 1 316Missiles, Rockets, & Parts 998 1,084 1,452 1,359 1,316
Spacecraft Satellites & Parts 117 146 139 114 122Spacecraft, Satellites, & Parts 117 146 139 114 122
Source: Aerospace Industries Association based on data from the U S Department of Commerce and AIA estimatesSource: Aerospace Industries Association, based on data from the U.S. Department of Commerce and AIA estimates.
Note: Totals may not equal sum of terms due to rounding.
P. Preliminary.

TABLE IX
AEROSPACE RELATED EMPLOYMENT
Calendar Years 1997-2008
Thousands of Workers
Search,Detection, &
Aircraft, Engines, and Parts
P i d Total Guided Missiles,S V hi lAircraft Other Aircraft Detection, &
NavigationInstruments
Period TotalEmployment Space Vehicles,
& PartsAircraft
Engines &Engine Parts
AircraftTotalOther Aircraft
Parts &Equipment
ALL WORKERSEngine Parts Equipment
1997 713.6 471.9 270.8 97.1 104.0 83.0 158.71998 741.1 495.0 281.5 100.5 113.0 83.6 162.51999 708.5 468.0 263.3 98.5 106.2 79.2 161.42000 666.1 438.4 242.7 98.1 97.6 78.4 149.4
2001 660.7 434.5 241.3 95.6 97.6 76.5 149.82002 618 4 396 7 220 2 87 9 88 6 73 6 148 12002 618.4 396.7 220.2 87.9 88.6 73.6 148.12003 587.1 371.9 209.1 81.3 81.5 70.2 145.02004 592.0 369.9 207.2 79.2 83.5 71.6 150.5
2005 611.7 380.0 211.3 81.9 86.8 75.1 156.62006 631 8 398 5 221 7 84 4 92 4 75 5 157 72006 631.8 398.5 221.7 84.4 92.4 75.5 157.72007 645.6 411.7 228.6 85.1 98.0 75.3 158.62008(P) 655 5 422 9 233 7 85 3 104 0 75 8 156 72008(P) 655.5 422.9 233.7 85.3 104.0 75.8 156.7
3Q07 648.0 413.3 229.4 85.2 98.7 75.5 159.2Q4Q07 651.5 417.6 231.4 86.2 100.0 75.4 158.51Q08 652.3 419.8 232.6 85.8 101.4 75.3 157.22Q08 656.7 424.1 234.6 85.2 104.3 75.9 156.73Q08 657.4 424.9 233.8 84.9 106.2 76.3 156.2
1997 345 8 260 5 132 4 60 1 68 0 23 0 62 3
PRODUCTION WORKERS1997 345.8 260.5 132.4 60.1 68.0 23.0 62.31998 360.8 274.6 138.9 60.6 75.1 23.2 63.01999 336 6 252 1 127 3 55 3 69 5 21 6 62 91999 336.6 252.1 127.3 55.3 69.5 21.6 62.92000 304.1 227.2 110.3 54.1 62.8 20.6 56.3
2001 297.4 225.7 108.5 53.6 63.6 18.7 53.02002 263.3 203.7 97.2 49.9 56.6 15.7 43.92003 249.5 189.3 92.8 45.4 51.1 15.1 45.12004 244.2 185.4 89.4 43.8 52.2 12.9 45.9
2005 270.0 191.9 90.4 45.5 56.0 20.9 57.22006 326.9 214.1 99.9 54.1 60.1 39.3 73.52006 326.9 214.1 99.9 54.1 60.1 39.3 73.52007 358.7 241.7 110.4 63.1 68.2 46.9 70.12008(P) 366.3 301.0 112.3 D 74.6 N/A 65.3 (b)
3Q07 363.7 245.5 112.0 64.1 69.4 47.7 70.54Q07 369 9 252 3 114 5 66 4 71 4 48 2 69 54Q07 369.9 252.3 114.5 66.4 71.4 48.2 69.51Q08(a) 300.7 300.7 113.5 D 72.6 N/A D2Q08 301 7 301 7 113 1 D 74 8 N/A D2Q08 301.7 301.7 113.1 D 74.8 N/A D3Q08 300.5 300.5 110.4 D 76.3 N/A D
Source: Aerospace Industries Association, based on data from the Bureau of Labor Statistics (BLS).
a. Beginning in 2008, quarterly total for production workers does not include the series: Search, Detection, andNavigation Instruments.
b. AIA estimate (series discontinued by BLS).D S i di ti d b BLSD. Series discontinued by BLS.P. Preliminary.

TABLE XTABLE X
NET PROFIT AFTER TAXESCalendar Years 1984-2008
AEROSPACE INDUSTRY PROFITS ALL MANUFACTURING
Year
AEROSPACE INDUSTRY PROFITS CORPORATIONS
Sales Assets Equity Sales Assets EquityMillions of
DollarsAs a Percent of: Profits as a Percent of:
Sales Assets Equity Sales Assets Equity
1984 $3 639 4 1 4 7 14 1 4 6 6 0 12 5
Dollars
1984 $3,639 4.1 4.7 14.1 4.6 6.0 12.51985 3,274 3.1 3.6 11.1 3.8 4.6 10.11986 3 093 2 8 3 1 9 4 3 7 4 2 9 51986 3,093 2.8 3.1 9.4 3.7 4.2 9.51987 4,582 4.1 4.4 14.6 4.9 5.6 12.81988 4 883 4 3 4 4 14 9 6 0 6 9 16 21988 4,883 4.3 4.4 14.9 6.0 6.9 16.2
1989 3 866 3 3 3 3 10 7 5 0 5 6 13 71989 3,866 3.3 3.3 10.7 5.0 5.6 13.71990 4,487 3.4 3.4 11.5 4.0 4.3 10.71991 2 484(a) 1 8 1 9 6 1 2 5 2 6 6 41991 2,484(a) 1.8 1.9 6.1 2.5 2.6 6.41992 (1,836) (1.4) (1.2) (5.2) 1.0 1.0 2.61993 4 621 3 6 3 5 13 2 2 8 2 9 8 11993 4,621 3.6 3.5 13.2 2.8 2.9 8.1
1994 5 655 4 7 4 3 14 8 5 4 5 8 15 61994 5,655 4.7 4.3 14.8 5.4 5.8 15.61995 4,633 3.8 3.5 11.1 5.7 6.2 16.21996 7 150 5 6 5 1 17 1 6 0 6 5 16 81996 7,150 5.6 5.1 17.1 6.0 6.5 16.81997 7,221 5.2 4.8 17.3 6.2 6.6 16.61998 7 701 5 0 4 8 18 0 6 0 6 1 15 71998 7,701 5.0 4.8 18.0 6.0 6.1 15.7
1999 6 5 6 2 21 8 6 2 6 1 16 510 214(b)1999 6.5 6.2 21.8 6.2 6.1 16.52000 7,260 4.7 4.3 14.2 6.1 5.9 15.22001 6 565 3 9 3 6 11 6 0 8 0 8 1 9
10,214(b)
2001 6,565 3.9 3.6 11.6 0.8 0.8 1.92002 6,547(c) 4.1 3.7 11.7 3.3 2.9 7.72003 7 243 4 2 3 3 12 3 5 4 4 7 12 22003 7,243 4.2 3.3 12.3 5.4 4.7 12.2
2004 9 504 5 2 4 0 14 3 7 1 6 5 15 92004 9,504 5.2 4.0 14.3 7.1 6.5 15.92005 12,572 6.4 4.7 16.8 7.4 6.9 16.42006 14 106 6 7 5 1 18 4 8 1 7 6 17 52006 14,106 6.7 5.1 18.4 8.1 7.6 17.52007 18,715 8.2 6.7 24.5 7.3 6.7 15.12008(P) 20 856 8 6 6 7 23 5 6 6 6 2 14 32008(P) 20,856 8.6 6.7 23.5 6.6 6.2 14.3
S B f th C Q t l Fi i l R t f M f t i Mi i d T d C tiSource: Bureau of the Census, Quarterly Financial Report for Manufacturing, Mining, and Trade Corporationsand AIA estimates.
a. Reflects unusually large non-operating expenses totaling $3.4 billion and $8.7 billion in 1991 and 1992, respectively,due to restructuring charges and the implementation of a change in accounting for future retirement benefit costs.due to restructuring charges and the implementation of a change in accounting for future retirement benefit costs.
b. Includes non-operating income (less interest expense) totaling $4.4 billion.c Includes non-operating expenses (less interest expense) totaling $3 5 billionc. Includes non-operating expenses (less interest expense) totaling $3.5 billion.p. Preliminary.( ) Denotes net loss( ) Denotes net loss.