2008 Energy Efficiency and Load Management Plan Sundin Testimony
53
BEFORE THE NEW MEXICO PUBLIC REGULATION COMMISSION IN THE MATTER OF SOUTHWESTERN PUBLIC SERVICE COMPANY’S APPLICATION FOR APPROVAL OF ELECTRIC ENERGY EFFICIENCY AND LOAD MANAGEMENT PROGRAMS AND PROGRAM COST TARIFF RIDERS PURSUANT TO THE NEW MEXICO PUBLIC UTILITY ACT AND EFFICIENT USE OF ENERGY ACT, SOUTHWESTERN PUBLIC SERVICE COMPANY, Applicant. ) ) ) ) ) ) ) ) ) ) ) ) ) ) Case No. 07-_____-UT DIRECT TESTIMONY of DEBRA L. SUNDIN on behalf of SOUTHWESTERN PUBLIC SERVICE COMPANY
Transcript of 2008 Energy Efficiency and Load Management Plan Sundin Testimony

BEFORE THE NEW MEXICO PUBLIC REGULATION COMMISSION
IN THE MATTER OF SOUTHWESTERN PUBLIC SERVICE COMPANY’S APPLICATION FOR APPROVAL OF ELECTRIC ENERGY EFFICIENCY AND LOAD MANAGEMENT PROGRAMS AND PROGRAM COST TARIFF RIDERS PURSUANT TO THE NEW MEXICO PUBLIC UTILITY ACT AND EFFICIENT USE OF ENERGY ACT, SOUTHWESTERN PUBLIC SERVICE COMPANY, Applicant.
) ) ) ) ) ) ) ) ) ) ) ) ) )
Case No. 07-_____-UT
DIRECT TESTIMONY
of
DEBRA L. SUNDIN
on behalf of
SOUTHWESTERN PUBLIC SERVICE COMPANY

TABLE OF CONTENTS GLOSSARY OF ACRONYMS AND DEFINED TERMS............................................... iii LIST OF ATTACHMENTS ............................................................................................... v I. INTRODUCTION AND QUALIFICATIONS ...................................................... 1 II. ASSIGNMENT....................................................................................................... 4 III. DEFINITIONS........................................................................................................ 5 IV. OVERVIEW AND EXPERIENCE WITH ENERGY EFFICIENCY ................... 9 V. PROGRAM DETAIL ........................................................................................... 13
Residential Segment......................................................................................... 13 Low-Income Segment ...................................................................................... 13 Business Segment ............................................................................................ 14 Large Customer Segment................................................................................. 14
VI. PROGRAM DESIGN, ADMINISTRATION AND MARKETING.................... 25 VII. PUBLIC PARTICIPATION PROCESS............................................................... 29 VIII. MEASUREMENT AND VERIFICATION PLAN .............................................. 31 IX. PROPOSED METHOD FOR REMOVING DISINCENTIVES.......................... 33 X. CONCLUSION..................................................................................................... 46 VERIFICATION............................................................................................................... 48
ii

GLOSSARY OF ACRONYMS AND DEFINED TERMS
Acronym/Defined Term Meaning
CANM Community Action of New Mexico
DSM Demand-Side Management
EUEA Efficient Use of Energy Act
KEMA Study KEMA New Mexico DSM Potential Assessment Report
M&V Measurement and Verification
NARUC National Association of Regulatory Utility Commissioners
NSP Northern States Power Company
Plan 2008 Energy Efficiency and Load Management Plan
PSCo Public Service Company of Colorado
R Residential
RAP Resource Action Programs
Rule 17.7.2 NMAC
SAC Service Availability Charge
SEER Seasonal Energy Efficiency Ratio
SG Secondary General – Demand Billed
SGS Small General Service
SPS Southwestern Public Service Company
Wiese Wiese Research Associates, Inc.
iii

Xcel Energy Xcel Energy Inc.
iv
LIST OF ATTACHMENTS
Attachment
Description
DLS-1
SPS’s 2008 Energy Efficiency and Load Management Program Plan
DLS-2 KEMA New Mexico DSM Potential Assessment Report
DLS-3
Lost Opportunities Calculation Example
1
v

Direct Testimony of
Debra L. Sundin
I. INTRODUCTION AND QUALIFICATIONS 1
2
3
4
5
6
7
8
9
10
11
12
13
14
15
16
17
18
19
Q. PLEASE STATE YOUR NAME AND BUSINESS ADDRESS.
A. My name is Debra L. Sundin. My business address is 414 Nicollet Mall,
Minneapolis, Minnesota.
Q. BY WHOM ARE YOU EMPLOYED AND IN WHAT POSITION?
A. I am employed by Xcel Energy Services Inc., the service company subsidiary of
Xcel Energy Inc. (“Xcel Energy”), as Director, Business Product Marketing &
CIP/DSM.
Q. ON WHOSE BEHALF ARE YOU TESTIFYING?
A. I am testifying in support of Southwestern Public Service Company (“SPS”),
which is an electric utility operating company that is wholly owned by Xcel
Energy.
Q. PLEASE BRIEFLY OUTLINE YOUR DUTIES AS DIRECTOR,
BUSINESS PRODUCT MARKETING & CIP/DSM.
A. I provide strategic marketing and regulatory strategy for Xcel Energy’s utility
operating companies’ energy efficiency and load management product portfolios
in the business and consumer markets. I lead two teams of employees that
provide product management activities for energy efficiency and load
management programs in New Mexico, Texas, Colorado and Minnesota. I lead
1

Direct Testimony of
Debra L. Sundin
1
2
3
4
5
6
7
8
9
10
11
12
13
14
15
16
17
18
19
another team of employees that provides support for energy efficiency and load
management strategy, planning and regulatory compliance.
Q. DESCRIBE YOUR EDUCATIONAL BACKGROUND.
A. I graduated from Bemidji State University with a Bachelor of Science degree in
Business Administration and also from the University of St. Thomas with a
Masters of Business Administration in Management.
Q. PLEASE DESCRIBE YOUR PROFESSIONAL EXPERIENCE.
A. I joined Northern States Power Company (“NSP”), Xcel Energy’s wholly owned
Minnesota electric and gas utility operating company, in October 1979. From
1979 to 1992, I worked in the market research department providing qualitative
and quantitative research as an analyst and later as a supervisor. From 1992 to
1997, I was the Manager, Residential Marketing for NSP. Between 1998 and
2000, I continued to work for NSP Marketing as the Manager, Energy
Management. My duties included business product marketing and energy
efficiency regulatory requirements. Since the August 2000 merger between NSP
and New Century Energies, Inc. that created Xcel Energy, I have been working in
the Xcel Energy Marketing department. I began as a manager responsible for
marketing business products including energy efficiency and, in 2002, was
promoted to director and assumed additional responsibilities related to energy
2

Direct Testimony of
Debra L. Sundin
1
2
3
4
5
6
7
8
9
10
11
efficiency and load management programs offered by Xcel Energy’s operating
companies.
Q. ARE YOU ASSOCIATED WITH ANY GROUPS OR ORGANIZATIONS
RELATED TO ENERGY EFFICIENCY?
A. Yes. I am currently serving on the leadership committee of the National Action
Plan for Energy Efficiency and I am a member of the Consortium for Energy
Efficiency board of directors.
Q. HAVE YOU TESTIFIED BEFORE ANY REGULATORY AUTHORITIES?
A. Yes. I have filed testimony with the North Dakota Public Service Commission
and the Colorado Public Utilities Commission.
II.
3
Direct Testimony of
Debra L. Sundin
ASSIGNMENT 1
2
3
4
5
6
7
8 9
10 11 12 13 14 15 16 17 18 19 20 21 22
23
Q. WHAT IS THE PURPOSE OF YOUR TESTIMONY?
A. SPS is submitting this testimony in accordance with the Efficient Use of Energy
Act, as amended (§§62-17-1 through 62-17-11 NMSA 1978 , “EUEA”), and the
New Mexico Public Regulation Commission’s (“Commission” or “NMPRC”)
Energy Efficiency Rule (17.7.2 NMAC, “Rule”). The purpose of my testimony is
to:
a. Provide a summary of SPS’s proposed 2008 Energy Efficiency and Load Management Plan (“Plan”);
b. Describe SPS’s and Xcel Energy’s previous experience with energy
efficiency and load management programs;
c. Introduce the proposed programs, their budgets, goals, and cost-effectiveness test results;
d. Describe the proposed marketing and outreach, and measurement and
verification plans; and
e. Identify the disincentives to offering energy efficiency and load management programs and detail SPS’s proposal to mitigate these disincentives.
III.
4

Direct Testimony of
Debra L. Sundin
DEFINITIONS 1
2
3
4
5
6 7 8 9
10 11 12 13 14 15 16 17 18 19 20 21 22 23 24 25 26 27 28 29 30 31 32 33 34
Q. IN THE REMAINDER OF YOUR TESTIMONY WILL YOU BE USING
CERTAIN TERMS?
A. Yes. For ease of reading and reference, I have defined the following terms that
will be used throughout my testimony and in the Plan:
• Customer (meter) kWh – energy efficiency or load management program energy savings as measured at the customer site.
• Decoupling – the disassociation of a utility profits from its sales of the energy
commodity. Instead, a rate of return is aligned with meeting revenue targets, and rates are trued up or down to meet the target at the end of the adjustment period. This makes the utility indifferent to selling less product and improves the ability of energy efficiency and distributed generation to operate within the utility environment.
• Deemed Savings – “expected energy and demand savings attributed to well-
known or commercially available energy efficiency and load management devices or measures based on standard engineering calculations, ratings, simulation models or field measurement studies, periodically adjusted as appropriate for New Mexico specific data, including building and household characteristics, and climate conditions in pertinent region(s) within the state” (17.7.2.7(G) NMAC).
• Demand-Side Management (“DSM”) – the methods used to manage customer
energy usage including energy efficiency, load management, fuel substitution and load building.
• Direct Impact – an energy efficiency or load management program that shows
measurable, quantifiable energy and/or demand savings.
• Energy Conservation – “the management of energy resources through: (1) the efficient allocation and use of (a) existing and planned facilities and (b) nonrenewable energy resources; (2) the reduction in demand of energy consumption where appropriate; (3) the minimization of waste of any energy
5
Direct Testimony of
Debra L. Sundin
1 2 3 4 5 6 7 8 9
10 11 12 13 14 15 16 17 18 19 20 21 22 23 24 25 26 27 28 29 30 31 32 33 34 35 36 37 38 39
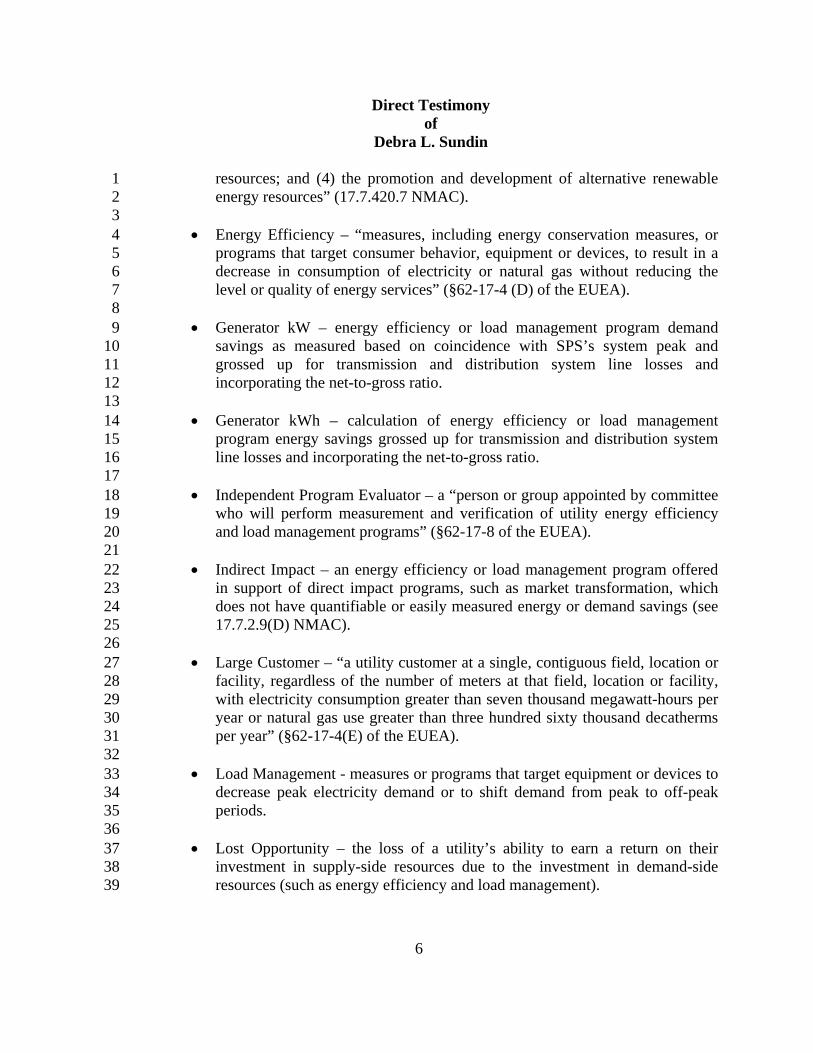
resources; and (4) the promotion and development of alternative renewable energy resources” (17.7.420.7 NMAC).
• Energy Efficiency – “measures, including energy conservation measures, or
programs that target consumer behavior, equipment or devices, to result in a decrease in consumption of electricity or natural gas without reducing the level or quality of energy services” (§62-17-4 (D) of the EUEA).
• Generator kW – energy efficiency or load management program demand
savings as measured based on coincidence with SPS’s system peak and grossed up for transmission and distribution system line losses and incorporating the net-to-gross ratio.
• Generator kWh – calculation of energy efficiency or load management
program energy savings grossed up for transmission and distribution system line losses and incorporating the net-to-gross ratio.
• Independent Program Evaluator – a “person or group appointed by committee
who will perform measurement and verification of utility energy efficiency and load management programs” (§62-17-8 of the EUEA).
• Indirect Impact – an energy efficiency or load management program offered
in support of direct impact programs, such as market transformation, which does not have quantifiable or easily measured energy or demand savings (see 17.7.2.9(D) NMAC).
• Large Customer – “a utility customer at a single, contiguous field, location or
facility, regardless of the number of meters at that field, location or facility, with electricity consumption greater than seven thousand megawatt-hours per year or natural gas use greater than three hundred sixty thousand decatherms per year” (§62-17-4(E) of the EUEA).
• Load Management - measures or programs that target equipment or devices to
decrease peak electricity demand or to shift demand from peak to off-peak periods.
• Lost Opportunity – the loss of a utility’s ability to earn a return on their
investment in supply-side resources due to the investment in demand-side resources (such as energy efficiency and load management).
6

Direct Testimony of
Debra L. Sundin
1 2 3 4 5 6 7 8 9
10 11 12 13 14 15 16 17 18 19 20 21 22 23 24 25 26 27 28 29 30 31 32 33 34 35 36 37 38 39
• Lost Revenues – reduction in utility revenues due to utility energy efficiency and/or load management programs.
• Low-Income – “residential customers with household income of less than 200
percent of the federal poverty guideline” (17.7.2.7(R) NMAC).
• Market Potential Assessment – a study of the size of the current and future market potential (i.e., implementation probabilities) for energy efficiency and load management measures.
• Market Transformation – strategic intervention to achieve a lasting, significant
share of energy-efficient products and services through fundamental, enduring changes in targeted markets.
• Measurement & Verification (“M&V”) – activities to determine or
approximate with a high degree of certainty the actual demand and energy reductions from energy efficiency and load management programs (see §62-17-8 of the EUEA).
• Net Benefits – from the Total Resource Cost (“TRC”), avoided supply-side
monetary costs (benefits) minus the monetary costs of the demand-side programs borne by both the utility and the participants (costs).
• Net-to-Gross – the percent of customers who purchase energy efficient
equipment who would not have done so without the existence of the utility’s energy efficiency and load management programs.
• Program Design – the method by which an objective is met through an energy
efficiency program.
• Self-Direct Program Administrator – the utility appointee responsible for reviewing and approving large customer self-direct project and exemption applications, energy and demand savings, and project costs.
• TRC Test – means a cost-effectiveness standard that is met if, for an
investment in energy efficiency or load management, on a life-cycle basis the avoided supply-side monetary costs are greater than the monetary costs of the demand-side programs borne by both the utility and the participants (see §62-17-4(H) of the EUEA).
7

Direct Testimony of
Debra L. Sundin
1 IV.
8

Direct Testimony of
Debra L. Sundin
OVERVIEW AND EXPERIENCE WITH ENERGY EFFICIENCY 1
2
3
4
5
6
7
8
9
10
11
12
13
14
15
Q. PLEASE PROVIDE A BRIEF OVERVIEW OF SPS’S PROPOSED
ENERGY EFFICIENCY PROGRAM PORTFOLIO.
A. As discussed in detail in the Plan, SPS has developed a set of energy efficiency
programs that target measures with low performance risk and with which SPS and
its affiliated operating companies have had success. The programs will use
proven program delivery methods to provide opportunities for broad participation
within each customer class. Each of the proposed programs meets the cost-
effectiveness requirements of §62-17-5(B) of the EUEA and 17.7.2.9(c)(1)
NMAC. SPS’s proposed Plan seeks to achieve 11,257,276 kWh in first-year
energy savings at the generator, and demand savings of 1,166 system peak
(generator) kW. The proposed budget for 2007 and 2008 combined is
$1,819,720. This includes estimated 2007 costs of $52,000 for product
development and $60,000 for planning and administration.
9
Direct Testimony of
Debra L. Sundin
1
2
3
4
5 6 7 8 9
10 11 12 13 14 15 16 17
18 19 20 21 22 23 24
25
26
27
28
Q. HAVE YOU INCLUDED ANY ATTACHMENTS IN SUPPORT OF YOUR
TESTIMONY?
A. Yes. I have included as Attachment DLS-1, SPS’s Plan which provides detailed
information regarding each proposed program, including:
• Energy and demand savings, budget and participation goals; • Cost-effectiveness results (including inputs and assumptions);
• Rebate structure;
• Program administration;
• Marketing and outreach plan; and
• M &V plan.
In addition, at the portfolio level, the Plan provides:
• Energy and demand savings, budget and participation goals by segment;
• A description of programs reviewed but not proposed at this time; and
• A description of conservation programs SPS offered through 2006.
In addition, I have also included the KEMA New Mexico DSM Potential
Assessment Study (“KEMA Study”) as Attachment DLS-2 and a calculation of
lost earnings opportunities as Attachment DLS-3. Each of these Attachments is
discussed in more detail later in my testimony.
10
Direct Testimony of
Debra L. Sundin
1
2
3
4
5
6
7
8
9
10
11
12
13
14
15
16
17
18
19
20
Q. DID SPS PREVIOUSLY OFFER ENERGY EFFICIENCY PROGRAMS IN
NEW MEXICO?
A. Yes. SPS previously offered energy efficiency programs to its New Mexico
customers. SPS closed these programs in 2006 in anticipation of the need to file
new programs that comply with the requirements of the EUEA. In the Plan, SPS
provides a brief history of these programs dating back to the early 1980s. These
programs were primarily focused on encouraging residential customers to install
more energy efficient electric heat pumps and business customers to install more
energy efficient lighting. In 2005 and 2006, SPS distributed free packages of
compact fluorescent light bulbs to low-income customers through the state Low-
Income Home Energy Assistance Program agencies in SPS’s service territory.
Q. DO SPS’S AFFILIATED OPERATING UTILITIES HAVE EXPERIENCE
RUNNING ENERGY EFFICIENCY AND LOAD MANAGEMENT
PROGRAMS IN OTHER JURISDICTIONS?
A. Yes. SPS’s affiliated operating utilities have considerable experience and success
designing and operating energy efficiency and load management programs in
Minnesota and Colorado. Xcel Energy’s Minnesota operating company, NSP, is
legislatively mandated to spend 2 percent of its electric and 0.5 percent of its gas
gross operating revenues (retail sales to ultimate consumers) on energy efficiency
and load management programs. In 2007, this translates into an approved budget
11

Direct Testimony of
Debra L. Sundin
1
2
3
4
5
6
of $47 million for electric programs and $5 million for gas programs in
Minnesota. In addition, Xcel Energy’s Colorado operating company, Public
Service Company of Colorado (“PSCo”), entered into a settlement agreement as
part of its 2003 Least Cost Planning process, which committed PSCo to achieve
electric efficiency savings of 320 MW and 800 GWh at a cost of no more than
$196 million between 2006 and 2013.
12

Direct Testimony of
Debra L. Sundin
V. PROGRAM DETAIL 1
2
3
4
5
6
7
Q. PLEASE DESCRIBE THE PROGRAMS SPS IS PROPOSING TO OFFER.
A. As discussed in detail in the Plan (Attachment DLS-1), SPS proposes to offer
eight programs grouped into four customer segments: Residential, Low-Income,
Business, and Large Customer, as described below. A fifth segment consists of
Planning & Research, which includes the functions and costs for providing
support for the direct impact programs.
8
9
10 11 12 13 14 15 16 17 18 19 20 21 22
Residential Segment
Within the Residential Segment, SPS is proposing:
• Air-Source Heat Pump Rebates – The Air-Source Heat Pump program offers customers rebates for purchase of air-source heat pumps rated 14 Seasonal Energy Efficiency Ratio (“SEER”) or higher.
• Home Lighting – The Home Lighting program promotes, through direct
sales and in-store rebates, customer purchase and installation of energy efficiency compact fluorescent bulbs for their homes.
• LivingWise® – LivingWise® combines a set of classroom activities with
projects in the home to encourage 5th grade students to install energy efficient products. SPS will partner with Resource Action Programs®
(“RAP”) to offer the LivingWise® program.
23
24
25 26 27 28
Low-Income Segment
Within the Low-Income Segment, SPS is proposing:
• Low-Income Program – This program is designed to help low-income residential customers to lower their energy bills. It will include the following components:
13
Direct Testimony of
Debra L. Sundin
1 2 3 4 5
o Electric Heat Weatherization; o Home Lighting Giveaway; and o Energy Efficient Refrigerator Upgrade and Old Refrigerator
Recycling.
6
7
8 9
10 11 12 13 14 15 16 17 18 19 20 21 22
Business Segment
Within the Business Segment, SPS is proposing:
• Business Cooling Efficiency – Business Cooling Efficiency will provide rebates for customer purchases of energy efficient electric cooling equipment.
• Business Custom Efficiency – Business Custom Efficiency provides
rebates for energy efficient customer projects not covered by SPS’s Business Cooling Efficiency or Business Lighting Efficiency programs. This program addresses the unique needs of our customers and encourages them to develop and implement innovative, cost-effective energy efficient measures and process changes.
• Business Lighting Efficiency – The Business Lighting Efficiency program
provides customer rebates for purchase and installation of energyefficient lighting equipment
23
24
25
26 27 28 29 30 31 32 33 34
Large Customer Segment
Within the Large Customer Segment, SPS is proposing the following to customers
with electricity consumption greater than 7,000 MWh:
• Self-Direct – The Self-Direct opportunity offers large customers the option to implement their own energy efficiency projects and receive credits against paying up to 70 percent of the tariff rider.
• Exemption – The Exemption opportunity allows a large customer who can
demonstrate to the satisfaction of the Self-Direct Program Administrator that they have exhausted all cost-effective efficiency opportunities to receive a two-year exemption from 70 percent of the tariff rider.
14
Direct Testimony of
Debra L. Sundin
1
2
3
4
5 6 7 8 9
10 11 12 13 14 15 16 17 18 19 20 21 22 23
24
25
26
27
28
29
Planning & Research Segment
The Planning & Research Segment consists of internal functions (not customer-
facing), which support the direct impact programs. This segment includes energy
efficiency and load management program-related expenses for:
• Planning & Administration – Includes labor for coordination of all New Mexico energy efficiency and load management related regulatory filings, tracking of program achievements, reporting on cost recovery, and cost-effectiveness calculations.
• Product Development – Internal labor for the group who identifies,
assesses, and develops new energy efficiency and load management programs.
• General Advertising – Allows for energy efficiency and load management
advertising that is not targeted at a single program.
• Market Research – Provides internal management of large-scale assessment studies like the Home Use Study and efforts to gauge awareness and interest around energy efficiency. This budget also provides for comprehensive program-specific research, including evaluations of individual programs.
Q. HOW DID SPS CHOOSE THE PROGRAMS THAT MAKE UP ITS
ENERGY EFFICIENCY PORTFOLIO?
A. In developing this proposal, SPS used a comprehensive product development
process to analyze, prioritize, and select the programs to include in its energy
efficiency portfolio. The product development process utilizes traditional
stage/gate methods in order to develop sound ideas that meet customer needs,
both internal and external. The process begins by analyzing service territory
15
Direct Testimony of
Debra L. Sundin
1
2
3
4
5
6
7
8
9
10
11
12
13
14
15
16
17
18
19
20
characteristics (e.g., number and types of customers, climate, and market
potential) to develop a list of suitable programs that have been successfully
operated in other jurisdictions. The specific stages that the product development
process then follows are: Ideation, Framing, Design, Build, Test, and Launch.
Management reviews ideas at the transition points between each stage, which
allows for proper culling of less effective ideas early in the process before
significant work is done. This product development process was originally
developed for use with energy efficiency and load management programs in
Minnesota and Colorado.
As part of its program selection process, SPS used two sources of data: the
KEMA Study (refer to Attachment DLS-2) to assess its long-term energy
efficiency and load management goals, and the Wiese Research Associates
(“Wiese”) 2005 Home Use Study database for general service territory
characteristics.
Q. PLEASE EXPLAIN THE KEMA STUDY AND HOW IT WAS
DEVELOPED?
A. In each jurisdiction with active energy efficiency and load management programs,
the Xcel Energy operating utilities periodically perform market potential studies
to determine the amount of efficiency potential in their service territory. In early
2006, PSCo contracted with KEMA Consulting to conduct a comprehensive
16
Direct Testimony of
Debra L. Sundin
1
2
3
4
5
6
7 8 9
10 11 12 13 14 15 16 17 18 19
20
21
22
23
24
25
26
market potential study for the Colorado territory. When the energy efficiency
rulemaking was approved in New Mexico, SPS saw value in having a market
potential study performed for New Mexico. However, in order to keep costs low,
SPS and KEMA Consulting did not collect any primary field data, but were able
to leverage and adapt the Colorado study to determine high-level New Mexico
market potential. The objectives of the KEMA Study were to:
• Identify long-term (2006-2015) energy efficiency and load management potential for SPS’s New Mexico service territory, specifically for the Residential, Commercial, Industrial and Potentially Exempt customer classes;
• Determine customer sensitivities to different rebate levels including
scenarios of rebates at 33, 50, and 75 percent of the incremental measure costs; and
• Limit study to measures that are presently commercially available and that
are cost-effective, with a TRC Test ratio above 1.0.
Q. HOW DID THE KEMA STUDY FACTOR INTO SPS’S SELECTION OF
PROGRAMS?
A. The KEMA Study was completed after SPS had already completed the majority
of its product development work. Although this study was not completed before
the Plan was developed, the results show consistency with the portfolio and
support the types of programs proposed. Therefore, SPS has used and will
continue to use the study for long-term planning and determining how to best
achieve the legislative goals of the EUEA. In the future, SPS will use the KEMA
17

Direct Testimony of
Debra L. Sundin
1
2
3
4
5
6
7
8
9
10
11
12
13
14
15
16
17
18
19
20
Study to provide directional indications of the types of programs that might be
successful in the marketplace.
Xcel Energy’s operating companies have found that nothing substitutes for
true, on the ground experience in implementing programs in its service territories.
Further, the operating companies have found that, as with any new market, there
is a learning period during which the utility, vendors, contractors, participants,
and regulators develop a better understanding of the opportunities and difficulties
associated with operating such programs. So, although the KEMA Study may be
used in guiding selection of its program offerings, SPS knows that the portfolio
will require periodic modification and augmentation to adapt programs to meet
the specific service territory’s needs.
Q. WHAT INFORMATION WAS USED TO DETERMINE THE CUSTOMER
CHARACTERISTICS OF SPS’S NEW MEXICO SERVICE TERRITORY?
A. SPS contracted with Wiese to collect data on residential household characteristics
and demographics for the 2005 Home Use Study. Wiese interviewed a total of
400 SPS New Mexico residential customers by telephone to determine details on:
dwelling type, square footage, age of home, household composition, household
income, age, marital status, education levels, Internet access, number and type of
appliances used in the home, the main fuel sources used, and average
temperatures maintained during heating and cooling months.
18

Direct Testimony of
Debra L. Sundin
1
2
3
4
5
6
7
8
9
10
11
12
13
14
15
16
17
18
19
20
The Home Use Study reported that 93 percent of survey participants had
some type of air conditioning, with 23 percent using an air-source heat pump and
another 23 percent using evaporative cooling. The high percentage of customers
with some sort of cooling equipment indicated that it is important for SPS to offer
a cooling rebate program, which led SPS to include an Air-Source Heat Pump
program in the current filing and to conduct further research on other cooling
technologies such as evaporative cooling for possible inclusion in future filings.
Further, the Home Use Study reported that 18 percent of survey respondents use
air-source heat pumps to heat their homes. This helped SPS determine that,
despite recent increases in federal minimum standards for cooling measures
(which has made it difficult to develop cost-effective central air conditioning
programs), air-source heat pumps would be a good program addition because the
combined heating and cooling benefits of this equipment make the installation of
14+ SEER units cost-effective in this service territory. As discussed in more
detail below, SPS is also looking at electric heat weatherization, electric water
heating and refrigerator recycling for future programs.
Q. WHAT ENERGY EFFICIENCY PROGRAMS WERE STUDIED AND
REJECTED?
A. There was only one program that SPS studied and decided not to offer at this time
— the Refrigerated Air Conditioning program. This program offers customers
19
Direct Testimony of
Debra L. Sundin
1
2
3
4
5
6
7
8
9
10
11
12
13
14
15
16
17
18
19
rebates for purchasing air conditioning equipment of SEER 14 and higher.
However, due to the recent increase in minimum federal efficiency standards from
SEER 10 to 13 for cooling equipment, the incremental savings of a SEER 14 or
higher do not justify the incremental costs to purchase such units, making the
program non-cost-effective at this time for both residential and business
customers. Therefore, despite the interest in achieving energy and demand
savings from cooling equipment, SPS was unable to include a central air
conditioning rebate program in its portfolio. SPS will reconsider this program
offering should the incremental cost of SEER 14 and higher units decrease.
Since much of the effort in developing the Plan focused on measures and
programs that SPS knows through experience work well, no other programs were
rejected.
Q. DOES SPS HAVE PLANS FOR ANY OTHER PROGRAM OFFERINGS IN
THE FUTURE?
A. SPS has several potential Residential programs under consideration for inclusion
in future energy efficiency filings, including: Electric Heat Weatherization,
Electric Water Heating, Evaporative Cooling, Refrigerator Recycling, and Saver’s
Switch (air conditioning load control). SPS did not have the technical
information finalized at the time of this filing to include these programs in the
20
Direct Testimony of
Debra L. Sundin
1
2
3
4
5
6
7
8
9
10
11
12
13
14
15
16
17
18
19
20
Plan; however, these programs are currently under consideration and will be
discussed further in future filings.
In the Business Segment, most cost-effective opportunities can be handled
through SPS’s existing proposed program offerings, as the Custom Efficiency
program provides rebate opportunities for cost-effective measures not covered
through the prescriptive programs. However, if a new end-use becomes more
popular or feasible within the Custom Efficiency program, SPS will evaluate
adding it to the portfolio as a stand-alone prescriptive program.
Q. WHY ARE LOAD MANAGEMENT PROGRAMS NOT INCLUDED IN
SPS’S PROPOSED PLAN?
A. Although SPS does not include any load management in its Plan, SPS presently
offers an Industrial Interruptible tariff program in New Mexico, which has six
industrial participants. In that program, automatic controls are triggered and
customers are notified to lower their demand to a contract level during peak
demand periods. Currently, the costs associated with the Industrial Interruptible
tariff are dealt with through the base ratemaking process.
In addition, as stated earlier in my testimony, SPS is considering the
inclusion of the Saver’s Switch air conditioning load control program in future
filings. SPS’s affiliated operating companies have successfully operated both
residential and commercial/industrial load management programs (mainly air
21
Direct Testimony of
Debra L. Sundin
1
2
3
4
5
6
7
8
9
10
11
12
13
14
15
16
17
18
19
conditioning cycling programs) in other jurisdictions for many years. Due to the
dependence of such programs on weather and climate conditions, SPS is gathering
more data to determine how best to operate load management in the New Mexico
service territory. SPS expects to provide further information on these programs in
its 2009 Energy Efficiency and Load Management Plan.
Q. WHAT ARE THE ENERGY AND DEMAND SAVINGS, BUDGETS,
PARTICIPANT NUMBERS AND TOTAL RESOURCE COST TEST
RESULTS FOR EACH OF SPS’S PROPOSED PROGRAMS?
A. Table 1 provides the estimated participation, budgets, energy and demand
savings, and TRC Test results for the proposed programs. Included in this table
are estimated 2007 costs of $112,000 associated with program development, and
planning and administration. Please note that this table does not include any
values for its Large Customer Segment. SPS has identified approximately 29
large customers at 44 customer sites who may qualify for the Large Customer
Segment, however it is unknown at this time who will choose to participate.
Although the program requires that customers notify SPS by November 30th of
the year prior to their self-directed project or exemption, SPS intends to waive this
requirement for 2008 and will accept applications throughout the year.
22

Direct Testimony of
Debra L. Sundin
1 Table 1: 2007/2008 Proposed Goals and Budget
Program # of
Participants Budget Gen kW Gen kWh
(1st yr) TRC Test
Residential Home Lighting 20,000 $284,644 99 1,509,753 1.40Residential Air-Source Heat Pumps 200 $130,880 90 292,827 1.47Residential LivingWise® 3,018 $134,285 25 1,055,961 2.33Residential Total 23,218 $549,809 214 2,858,541 1.62
Low-Income Total 16,200 $197,089 82 1,555,576 1.99
Business Cooling Efficiency 90 $130,335 86 249,303 1.16Business Custom Efficiency 49 $263,486 382 4,609,451 2.15Business Lighting Efficiency 73 $319,073 403 1,984,406 2.21Business Total 212 $712,893 871 6,843,159 2.07
Large Customer Total TBD TBD TBD TBD TBD
Market Research N/A $107,500 N/A N/A N/AGeneral Advertising N/A $58,000 N/A N/A N/AProduct Development N/A $42,000 N/A N/A N/APlanning & Administration N/A $40,429 N/A N/A N/APlanning & Research Total N/A $247,929 N/A N/A N/A
2008 Sub-Total 39,630 $1,707,720 1,166 11,257,276 N/A
2007 Product Development N/A $52,000 N/A N/A N/A2007 Planning & Admin. N/A $60,000 N/A N/A N/A
2007 Sub-Total N/A $112,000 N/A N/A N/A
2007/2008 TOTAL 39,630 $1,819,720 1,166 11,257,276 1.78 2
3
23

Direct Testimony of
Debra L. Sundin
1
2
3
4
5
6
7
8
9
10
11
12
13
14
15
16
17
18
Q. HOW WERE SPS’S PROPOSED BUDGET AND PARTICIPATION
LEVELS DETERMINED?
A. SPS took a number of factors into consideration when developing its energy
efficiency program goals and budgets for the Plan. These factors included: the
historical and expected participation levels, the incremental cost of the energy
efficient equipment replacement, the Home Use Study, and the cost-effectiveness
of measures at different participation rates.
Q. ARE THESE APPROPRIATE TARGETS FOR EACH OF THE
PROPOSED PROGRAMS?
A. SPS believes that these goals are a good starting point for the proposed programs.
However, SPS and its affiliated operating companies experience operating energy
efficiency and load management programs has demonstrated that there is no good
substitute for actual program experience in a service territory. Therefore, SPS
proposes only its first-year program goals at this time. With more experience in
New Mexico, SPS may offer multi-year goals in future Plans. Further, in an
effort to meet the overall first-year goals, SPS may shift budgets between
programs within a particular customer segment to match customer demand.
VI.
24
Direct Testimony of
Debra L. Sundin
PROGRAM DESIGN, ADMINISTRATION AND MARKETING 1
2
3
4
5
6
7
8
9
10
11
12
13
14
15
16
17
18
19
20
Q. WHAT METHODS WILL SPS USE TO ENCOURAGE CUSTOMERS TO
PARTICIPATE IN ITS ENERGY EFFICIENCY AND LOAD
MANAGEMENT PROGRAMS?
A. SPS has found rebates to be an extremely effective and flexible tool in marketing
and selling energy efficiency to its customers and plans to employ similar
strategies in the future. Depending on consumer response to a particular rebate
level, SPS can vary rebates to either increase or reduce customer participation.
SPS’s affiliated operating companies have used this mechanism for over twenty
years in other jurisdictions to help influence consumer behavior toward purchase
and implementation of more energy efficient measures.
Q. HOW DOES SPS PLAN TO ADMINISTER ITS PROPOSED
PROGRAMS?
A. For the most part, SPS intends to self-administer its proposed programs, meaning
that internal staff will handle product development, program planning, technical
analysis, sales and marketing, rebate processing, and regulatory support. This
will be true for the business programs (Cooling Efficiency, Custom Efficiency
and Lighting Efficiency), as well as residential Home Lighting and Air-Source
Heat Pump Rebates. Actual sale and delivery of energy efficiency measures to
end-use customers will be provided through either retail suppliers or vendors.
25

Direct Testimony of
Debra L. Sundin
1
2
3
4
5
6
7
8
9
10
11
12
13
14
15
16
17
18
19
20
SPS has generally found this approach to be both the most effective and efficient
for operating energy efficiency and load management programs.
The three programs that will use different approaches are the
LivingWise®, Low-Income, and Large Customer programs. The LivingWise®
program will be administered by RAP, which will design, market and deliver the
program. Similarly, SPS will contract with local community action agencies
(Community Action Agency of Southern New Mexico and Eastern Plains Council
of Governments) to administer its Low-Income program. Partnering with
community groups enables SPS to leverage existing infrastructure, knowledge,
and relationships to deliver the program benefits of residential programs. Finally,
unlike the other programs, the Large Customer program will not require as much
administration due to its design as a self-direct or exemption opportunity. SPS
will designate a Self-Direct Program Administrator who will review and approve
customer applications and project savings and will rely on the committee
appointed by the Commission to select an Independent Program Evaluator to
perform measurement and verification of the projects.
Q. WHAT IS SPS’S MARKETING AND OUTREACH STRATEGY?
A. SPS has developed an extensive marketing and outreach plan to target business,
residential, and low-income customers throughout the service territory. In
general, SPS will place targeted newspaper and radio advertisements in English
26
Direct Testimony of
Debra L. Sundin
1
2
3
4
5
6
7
8
9
10
11
12
13
14
15
16
17
and Spanish throughout the service territory. In addition, SPS intends to staff
booths at local community events to deliver brochures for both residential and
business programs. Further, SPS will seek to collaborate on outreach with
regional environmental organizations to the extent feasible. SPS has developed
specific marketing and outreach plans for each customer segment, which are
discussed in more detail in the Plan.
Q. WHAT IS THE PURPOSE OF SPS’S PLANNING & RESEARCH
SEGMENT?
A. The Planning and Research Segment includes energy efficiency program-related
expenses for Planning & Administration, Product Development, General
Advertising, and Market Research. These activities support the direct impact
programs and activities contained in the remainder of SPS’s portfolio. They
comply with the requirements of 17.7.2.9(D) NMAC, which dictate that these
activities “are permissible to the extent that those measures do not negate the
overall cost effectiveness of the utility’s energy efficiency portfolio.” SPS’s
overall portfolio is cost-effective with these activities included.
27

Direct Testimony of
Debra L. Sundin
1
2
3
4
Q. HAS SPS ALLOCATED THE COSTS OF THE PLANNING & RESEARCH
SEGMENT TO THE DIRECT IMPACT PROGRAMS FOR THE
PURPOSE OF CALCULATING THE PROGRAM TRC TEST?
A. No. 17.7.2.9(H) NMAC provides that such costs “shall be allocated to individual
programs in proportion to the direct costs assigned to those programs, unless
(emphasis added) a utility demonstrates that another allocation method is more
appropriate.” SPS believes that placing these costs in their own segment is a
preferable allocation method for several reasons:
5
6
7
8
9 10 11 12 13 14 15 16 17 18 19 20 21 22 23 24 25 26 27 28 29 30
31
• Such costs are often not directly related to individual programs. Therefore, to use the direct costs of those particular programs as an allocation method would not be accurate.
• These types of costs are often irregular, with large expenses in some years and almost no expenditures in other years. If SPS must allocate these charges to the programs, regardless of magnitude, it may result in the program becoming non-cost-effective.
• Given the variation in these costs from year-to-year, and the suggested method
to allocate based on direct program costs, it would be very difficult for SPS to manage individual program budgets and ensure their cost-effectiveness because program managers will never know how much to expect from these indirect programs.
• It is administratively most efficient for SPS to manage the indirect costs
outside of the individual programs. SPS’s internal accounting system uses individual accounting codes for market research, planning, and product development, as well as for each direct-impact program offering. These costs could not be allocated directly to the programs, but would first be charged to their subject area, and then allocated to the programs, creating a two-step process instead of one.
VII.
28
Direct Testimony of
Debra L. Sundin
PUBLIC PARTICIPATION PROCESS 1
2
3
4
5
6
7
8
9
10
11
12
13
14
15
16
17
18
19
20
Q. PLEASE PROVIDE INFORMATION ABOUT THE PUBLIC
PARTICIPATION PROCESS.
A. In accordance with 17.7.2.8(A) NMAC, SPS invited the general public, the
Commission Staff, large customers, the New Mexico Attorney General, the New
Mexico Energy, Minerals and Natural Resources Department, environmental
group representatives, and consumer advocates to a public meeting to solicit non-
binding recommendations on the design and implementation of the proposed Plan.
Invitations were sent out on January 2, 2007, and the meeting was scheduled for
January 25, 2007, in Roswell, New Mexico. Upon learning that the majority of
potential attendees were likely to be in Santa Fe at that time because the
Legislature was in session, SPS changed the public meeting to be a conference
call to provide the most access possible. A PowerPoint® presentation was sent
out on January 23, 2007. On the day of the meeting, the following organizations
attended the call: Kathryn Turnipseed and Jami Porter Lara from Community
Action of New Mexico (“CANM”), Jake Arnold of the Commission Staff, Joe
Doubraza from Chevron, Steve McCutcheon from Intrepid, and Keith Wagner
from Mosaic. SPS presented the proposed programs and potential cost recovery,
and answered questions. SPS received specific written feedback from CANM.
Following the meeting, SPS individually contacted the Southwest Energy
29
Direct Testimony of
Debra L. Sundin
1
2
3
4
5
6
7
8
9
10
11
12
13
14
15
16
17
Efficiency Project, Eastern Plains Council of Governments, Community Action
Agency of Southern New Mexico, and six of our largest commercial and
industrial customers in order to receive their feedback on the proposed Plan. SPS
also met on two occasions with Commission Staff to further discuss the details of
the proposed portfolio and issues related to cost recovery.
Q. DID YOU RECEIVE FEEDBACK ABOUT SPS’S PROPOSED LOW-
INCOME PROGRAM AS PART OF THE PUBLIC PARTICIPATION
PROCESS?
A. Yes, as stated previously, CANM attended SPS’s presentation of its proposed
program on January 25, 2007, and provided comments that were generally
supportive of the portfolio. They requested that SPS increase its participation
goals and SPS responded with an increase of approximately 50 percent. In
addition, CANM asked that SPS coordinate its program with the federally-funded
Weatherization Assistance Program. SPS will ensure that such coordination is
incorporated into the request for proposals used to select community agencies and
that such coordination occurs in practice.
VIII.
30
Direct Testimony of
Debra L. Sundin
MEASUREMENT AND VERIFICATION PLAN 1
2
3
4
5
6
7
8
9
10
11
12
13
14
15 16 17 18 19 20 21 22
Q. PLEASE DESCRIBE SPS’S PLANS FOR MEASUREMENT AND
VERIFICATION OF THE PROPOSED PROGRAMS.
A. SPS’s M&V plan covers two areas: (1) plans and procedures for program-level
M&V, i.e., estimating energy and demand savings for each of the respective
programs; and (2) a procedure for selecting the Independent Program Evaluator
(17.7.2.13(E)(1) NMAC) and facilitating the review of the entire portfolio. The
program-level M&V will include efforts such as spot checks of rebate forms for
accuracy of inputs and sampling of lighting installations to ensure consistency
with claimed savings. Generally, the proposed residential and business programs
will use a “deemed savings” approach for estimating energy and demand savings
associated with individual programs. M&V plans are detailed further in the Plan.
The exceptions to this approach apply to the LivingWise® program, the
Business Custom Efficiency program, and the Large Customer program.
• The LivingWise® program contractor, RAP, will utilize student and teacher surveys regarding installations to calculate the resulting energy savings. RAP’s annual report will summarize knowledge gained, measures installed, self-audit information, participant satisfaction, and resource savings results.
• The Business Custom Efficiency program will use a pre-approval process
wherein the participant submits applications that provide the specific details of the proposed energy efficiency measure before such a measure is installed. This approach helps reduce free-riders by ensuring that the participant’s decision to install the more energy efficient measure was influenced by the program rebate. SPS engineering staff will review and
23 24 25 26
31
Direct Testimony of
Debra L. Sundin
1 2 3 4 5 6 7 8 9
10 11
12
13
14
15
16
17
18 19
approve these applications based on program criteria and provide their own engineering-based estimates of the savings that will result from the measure. Projects that do not use deemed savings to determine their impact will receive pre-and post-project monitoring to validate engineering estimates.
• For the Large Customer program, SPS will utilize internal resources to
review and approve customer applications, similar to the review undertaken for the Custom Efficency program.
Q. PLEASE DESCRIBE SPS’S PROPOSAL FOR THE PROCESS TO
SELECT THE EVALUATOR.
A. With respect to engaging the Evaluator, SPS will participate in the Commission’s
efforts to establish evaluation committees for New Mexico utilities as part of Case
No. 07-00365-UT. A proposed timeline for this process follows from the recent
Order for Solicitation and Appointment of Energy Efficiency Evaluation
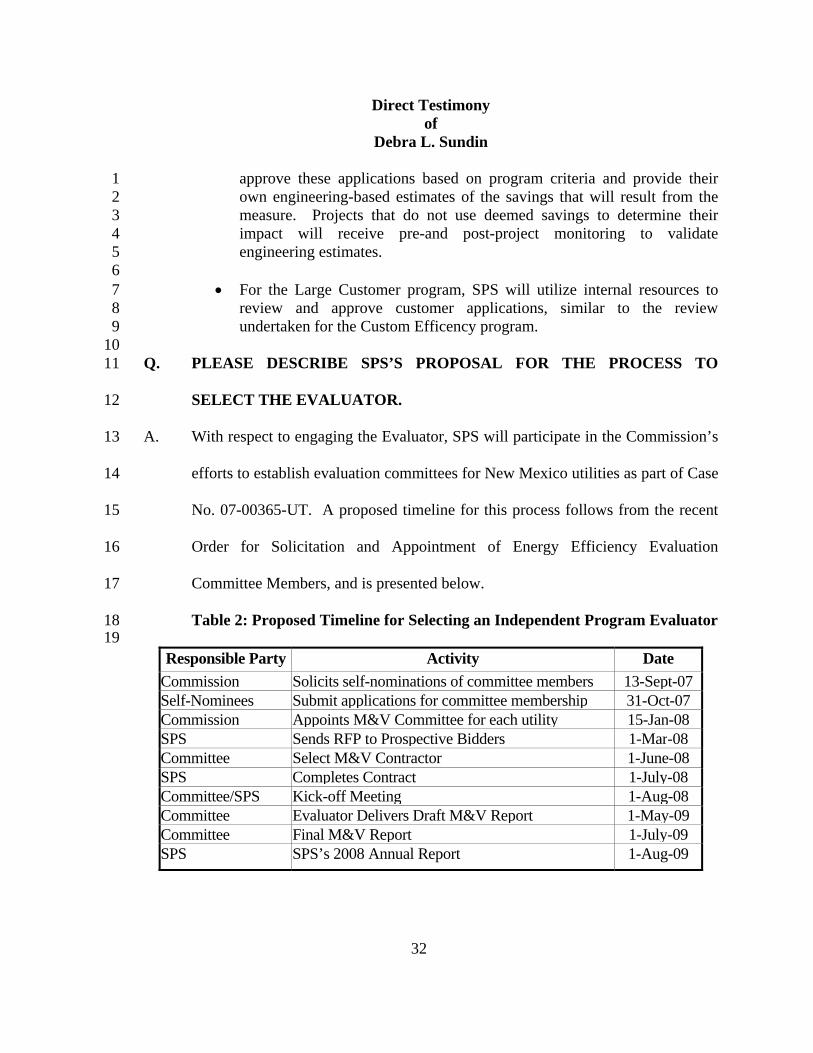
Committee Members, and is presented below.
Table 2: Proposed Timeline for Selecting an Independent Program Evaluator
Responsible Party Activity Date Commission Solicits self-nominations of committee members 13-Sept-07Self-Nominees Submit applications for committee membership 31-Oct-07Commission Appoints M&V Committee for each utility 15-Jan-08SPS Sends RFP to Prospective Bidders 1-Mar-08Committee Select M&V Contractor 1-June-08SPS Completes Contract 1-July-08Committee/SPS Kick-off Meeting 1-Aug-08Committee Evaluator Delivers Draft M&V Report 1-May-09Committee Final M&V Report 1-July-09SPS SPS’s 2008 Annual Report 1-Aug-09
32
Direct Testimony of
Debra L. Sundin
IX. PROPOSED METHOD FOR REMOVING DISINCENTIVES 1
2
3
4
5
6
7
8
9
10
11
12
13
14
15
16
17
18
19
20
Q. DO UTILITIES HAVE DISINCENTIVES TO INVESTING IN ENERGY
EFFICIENCY PROGRAMS?
A Yes. The regulated utility is no different from other businesses in that its
shareholders benefit from increased sales and revenues, as long as it can generate
those revenues in a manner that covers its costs. In this way, the traditional
regulated utility model discourages investments in energy efficiency. More than
two decades of research and public policy support this contention. For example,
in 1989, the National Association of Regulatory Utility Commissioners
(“NARUC”) adopted a resolution that explicitly recognized the fact that utilities
lose revenues and profits when they or their customers invest in cost-effective
energy efficiency programs.
More recently, in 2006, NARUC endorsed the principles embodied in the
Resolution Supporting the National Action Plan on Energy Efficiency, including
its recommendations that utility commissions “modify policies to align utility
incentives with the delivery of cost-effective energy efficiency and modify
ratemaking practices to promote energy efficiency investments.”
A recent U.S. Department of Energy report, State and Regional Policies
that Promote Energy Efficiency Programs Carried Out by Electric and Gas
Utilities: A Report to the United States Congress Pursuant to Section 139 of the
33

Direct Testimony of
Debra L. Sundin
1
2
3
4
5
6
7
8
9
Energy Policy Act of 2005 (March 2007) further supported this observation. The
report states, “Investor-owned electric and gas utilities may face a variety of
disincentives to implementing energy efficiency programs rather than investing in
physical assets such as power plants and transmission lines. Under traditional
ratemaking practices, retail rates are determined in periodic regulatory
proceedings called “rate cases,” based on a projection of utility operating costs
and an allowable rate of return on investments” (pages 15-16). This report
describes three types of disincentives: lost revenues, lost opportunities, and cost
recovery, each of which is described in more detail below.
• Lost revenues refer to the fact that under normal operating conditions, utility shareholders are financially rewarded for increasing electricity and gas sales. Conversely, if utilities’ electricity and gas sales are decreased by offering energy efficiency programs, the results is a loss of revenues for the utility.
10 11 12 13 14 15
• Lost opportunities refer to the fact that under normal operating conditions, a utility’s shareholders earn a rate of return on prudently incurred capital investments (e.g., power plants). In contrast, utilities often do not have any opportunity to earn a return on comparable demand-side (energy efficiency) spending because such expenditures are typically expensed. In addition, even if energy efficiency investments were afforded such a return, due to their relatively low cost per kWh and kW as compared with supply-side investments, the size of the earnings opportunity, would be significantly smaller.
16 17 18 19 20 21 22 23 24
1
1 As the California Division of Ratepayer Advocates stated in 1991, “Had this type of earnings comparison been made in the past, we would have seen very clearly that previous DSM mechanisms offered significantly lower earnings opportunity for DSM than for supply-side alternatives.” (California Public Utilities Commission, Decision 91-10-059, p. 52).
34

Direct Testimony of
Debra L. Sundin
• Cost recovery refers to the fact that certainty and timeliness of cost recovery are important to a utility because unrecovered costs lower the utility’s earnings.
1 2 3 4 5
6
7
8
Q. WHY IS SPS FILING TO REMOVE DISINCENTIVES?
A. From SPS’s perspective, a successful long-term commitment to energy efficiency
programs is not possible without timely cost recovery and a workable mechanism
for eliminating disincentives. This position is entirely consistent with the EUEA.
The EUEA seeks to encourage utilities to implement cost-effective energy
efficiency and load management programs by providing cost recovery and
facilitating Commission approval of mechanisms to eliminate disincentives to
offering such programs. SPS considers its proposals to recover costs and
eliminate disincentives to be essential elements of its Plan.
9
10
11
12
13
14
15
16
17
18
19
20
21
22
Q. DOES THE EUEA PROVIDE A WAY TO ADDRESS THESE
DISINCENTIVES?
A. Yes. The EUEA references disincentives in three places (§§62-17-2(E), 62-17-3,
and 62-17-5(F)). The most pointed reference is contained in §62-17-5(F) which
states, “[t]he commission shall, upon petition or its own motion, open a docket to
identify any disincentives or barriers that may exist for public utility expenditures
on energy efficiency and load management measures and, if found, ensure that
they are eliminated and that an appropriate ratemaking treatment and
performance-based, financial or other incentives are considered in order that
35
Direct Testimony of
Debra L. Sundin
1
2
3
4
5
public utilities are financially neutral in their preference for acquiring demand- or
supply-side utility resources.”
Q. IS THE COMMISSION GUIDED BY ANY OTHER PROVISIONS OF
LAW OR REGULATION RELATING TO DISINCENTIVES?
A. Yes. 17.7.2.9(K) NMAC provides further detail on how disincentives should be
addressed. This section of the Rule states that: “(1) the utility shall file (emphasis
added) a proposal for the commission to remove any disincentives or barriers to
utility-provided energy efficiency or load management
6
7
which the utility believes 8
to exist.” (emphasis added) In other words, if SPS believes disincentives or
barriers to investing in energy efficiency exist, it is obligated to file a proposal to
remove them.
9
10
11
12
13
14
15
16
17
18
19
Q. HAS SPS QUANTIFIED ANY FINANCIAL LOSSES FOR WHICH IT
WOULD SEEK COMPENSATION?
A. Yes, SPS has identified the disincentives and estimated the financial losses for
which it seeks compensation. The following discussion: (1) identifies the
disincentives for loss of revenues and for lost earnings opportunities; (2) estimates
the financial losses for which SPS seeks compensation; (3) proposes the preferred
method for mitigating such disincentives; (4) demonstrates why the disincentives
are not offset; and (5) shows why the method for mitigating disincentives helps
36

Direct Testimony of
Debra L. Sundin
1
2
3
4
5
6
7
8
9
10
11
12
13
14
15
16
17
18
assure that SPS is financially neutral in its preference for acquiring demand- or
supply-side utility resources.
Q. HAS SPS ESTIMATED THE FINANCIAL LOSSES RELATING TO LOST
REVENUES?
A. Yes. Using information from SPS’s recently filed general rate case (Case No.
07-00319-UT), SPS calculated the reduction in revenues that would result from
implementation of the proposed energy efficiency programs during 2008. As
shown in Table 3, the reduction in revenues is $855,357 per year. Assuming SPS
files a rate case every three years, and therefore updates its revenue requirements
based on a 2009 test year, the revenue reductions occur for three years.
Multiplying $855,357 by three results in lost revenues of $2,566,072. However, a
simple focus on lost revenues ignores the fact that certain costs (variable costs)
decline with lower sales. The primary variable cost is fuel. Therefore, it is
important to analyze the portion of revenues designated to recover fixed costs.
This information is also presented in Table 3, rows 10 through 12. The revenues
related to fixed cost recovery equal $312,768 for one year and $947,305 for three
years.
37

Direct Testimony of
Debra L. Sundin
1 2
Table 3: 2008 Energy Efficiency and Load Management Plan Lost Revenues
Customer Class
Residential Business -SGS
Business - SG TOTAL
1 2008 Energy (kWh) a 3,928,564 3,113,637 3,113,637 10,155,839Proposed Savings (at the customer) 2 2008 Demand (kW) a 2,805 659 659 3,967
3 Per kWh b $0.086 $0.087 $0.0774 Per kW b N/A N/A $ 16.71 5 1 year (row 1* row 3) $336,314 $269,696 $249,347 $855,3576 2 year (row 5 * 2) $672,629 $539,392 $498,694 $1,710,715
Total Revenues
7 3 year (row 5 * 3) $1,008,943 $809,088 $748,041 $2,566,0728 Per kWh b $0.033 $0.032 N/A 9 Per kW b N/A N/A $ 10.74
10 1 year (row 1 * row 8) c $130,282 $100,596 $84,890 $315,76811 2 year (row 10 * 2) $260,564 $201,192 $169,781 $631,537
Revenues to Cover Fixed Costs
12 3 year (row 10 * 3) $390,846 $301,788 $254,671 $947,305 3
4 5 6 7 8 9
10
11
12
13
14
15
16
17
a Source: 2008 Energy Efficiency and Load Management Plan, Attachment DLS-1, Table 4. b Direct Testimony of Daniel J. James, In the Matter of Southwestern Public Service Company’s
Application for Revision of its Retail Electric Rates Pursuant to Advice Notice Nos. 208 and 209 and all Associated Approvals (Case No. 07-00319-UT), Attachment DJJ-2.
c The Business - SG column = (row 2 * row 9 * 12) Q. PLEASE EXPLAIN HOW THE VALUES IN THIS TABLE WERE
CALCULATED.
A. Using the proposed rates from the general rate case, SPS calculated per kWh and
per kW factors for three rate classes divided between: revenues to recover fixed
costs, revenues to recover variable costs and revenues from the Service
Availability Charge (“SAC”).2 Although the energy efficiency programs are
available to all classes of customers, to simplify the calculation, SPS isolated
three classes: Residential (“R”), Small General Service (“SGS”) and Secondary
2 The SAC recovers fixed customer charges; however, energy efficiency and load management program savings do not affect these revenues because the SAC is based on number of customers.
38
Direct Testimony of
Debra L. Sundin
1
2
3
4
5 6 7
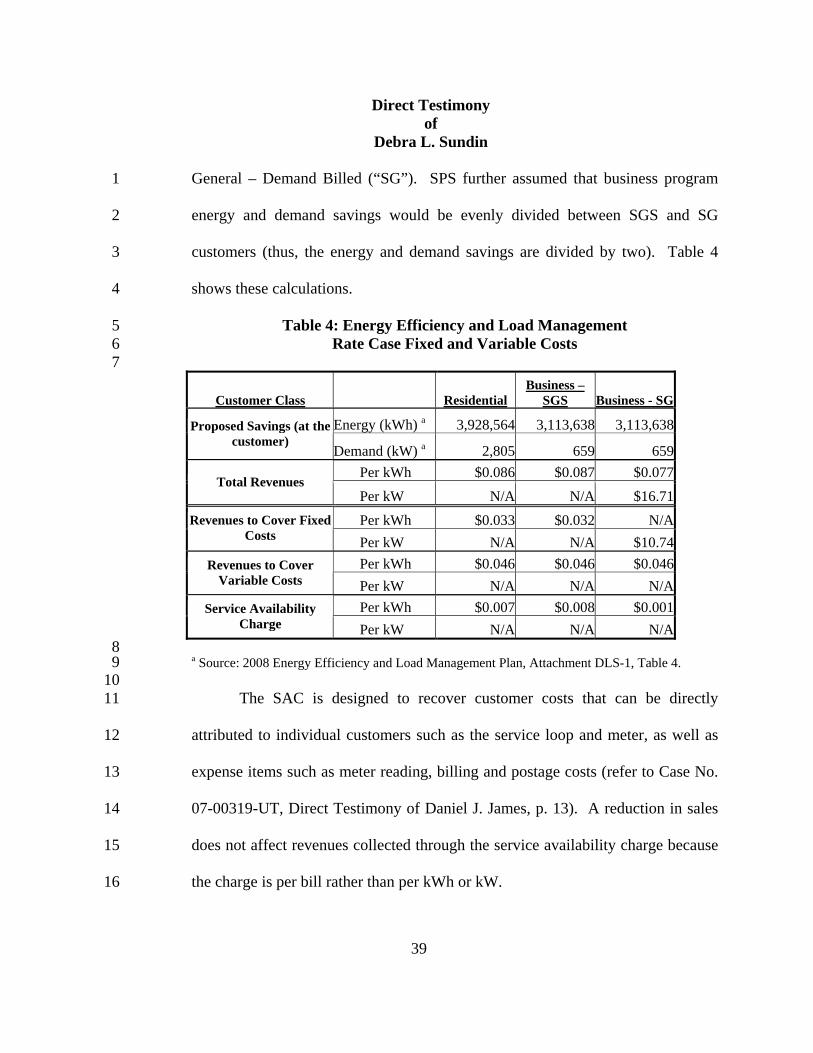
General – Demand Billed (“SG”). SPS further assumed that business program
energy and demand savings would be evenly divided between SGS and SG
customers (thus, the energy and demand savings are divided by two). Table 4
shows these calculations.
Table 4: Energy Efficiency and Load Management Rate Case Fixed and Variable Costs
Customer Class ResidentialBusiness –
SGS Business - SG
Energy (kWh) a 3,928,564 3,113,638 3,113,638 Proposed Savings (at the customer)
Demand (kW) a 2,805 659 659Per kWh $0.086 $0.087 $0.077
Total Revenues Per kW N/A N/A $16.71Per kWh $0.033 $0.032 N/ARevenues to Cover Fixed
Costs Per kW N/A N/A $10.74Per kWh $0.046 $0.046 $0.046Revenues to Cover
Variable Costs Per kW N/A N/A N/A Per kWh $0.007 $0.008 $0.001Service Availability
Charge Per kW N/A N/A N/A 8 9
10 11
12
13
14
15
16
a Source: 2008 Energy Efficiency and Load Management Plan, Attachment DLS-1, Table 4.
The SAC is designed to recover customer costs that can be directly
attributed to individual customers such as the service loop and meter, as well as
expense items such as meter reading, billing and postage costs (refer to Case No.
07-00319-UT, Direct Testimony of Daniel J. James, p. 13). A reduction in sales
does not affect revenues collected through the service availability charge because
the charge is per bill rather than per kWh or kW.
39
Direct Testimony of
Debra L. Sundin
1
2
3
4
5
6
7
8
9
10
11
12
13
14
15
16
17
18
19
Q. HAVE YOU ESTIMATED THE FINANCIAL LOSSES RELATING TO
LOST EARNINGS OPPORTUNITIES?
A. Yes. One can calculate such lost earnings opportunities by: (1) determining the
portion of the investment in power plants and transmission and distribution
infrastructure that the energy efficiency and load management program avoids
and (2) determining the shareholder earnings opportunities associated with this
investment.
SPS’s Plan has goals of 11.3 GWh and 1.2 MW (at the generator), and
10.2 GWh and 3.97 MW (at the customer). The weighted average lifetime of the
measures is 13 years. The amount of energy saved through SPS’s programs
would be approximately equivalent to a 4.3 MW combustion turbine operating at
a 30 percent capacity factor, with corresponding energy output of 11.3 GWh per
year for 13 years.
Using this information and the revenue requirements for a generic 143
MW combustion turbine (this is the smallest generic resource used for resource
planning due to modeling constraints), SPS calculated the foregone earnings
opportunities associated with its proposed energy efficiency proposal. The
analysis resulted in a net present value as of January 1, 2008, of after-tax profit
for SPS shareholders of $893,449, calculated based on what would have been
40
Direct Testimony of
Debra L. Sundin
1
2
3
4
5
6
7
8
9
10
11
12
13
14
15
16
17
18
19
20
earned on a comparable supply side investment. Refer to Attachment DLS-3 for
the detail of this calculation.
Q. WHAT IS SPS’S PREFERRED METHOD FOR MITIGATING SUCH
DISINCENTIVES?
A. SPS’s proposes a “Shared Savings” method for mitigating disincentives based on
sharing the net benefits associated with energy efficiency and load management
investments between customers and shareholders in an 85/15 ratio. In other
words, 85 percent of the net benefits associated with SPS’s energy efficiency
programs would stay with SPS’s New Mexico customers and 15 percent would go
to shareholders. Assuming energy and demand savings as proposed in the Plan
(see Table 4, page 12 of the Plan), such an approach would divide the $2,932,325
in estimated net benefits between customers ($2,492,477) and shareholders
($439,849). This approach would encourage SPS to maximize the efficiency of
its delivered savings from energy efficiency programs since net benefits increase
with the cost-effectiveness of the programs.
Q. HOW DID YOU ARRIVE AT AN 85/15 SHARED SAVINGS RATIO?
The shared savings mechanism is intended to approximate the financial losses
associated with offering energy efficiency and load management programs.
Although the shareholders’ percentage – 15 percent equating to $439,849 – is less
than the estimate of financial losses using lost revenues and lost opportunities
41

Direct Testimony of
Debra L. Sundin
1
2
3
4
5
6
7
8
9
10
11
12
13
14
15
16
17
18
19
analyses, it is a fair, if not conservative, apportioning of the net benefits between
customers and shareholders. It also is generally consistent with legislation
recently adopted in Colorado which places a cap of 20 percent on the portion of
net benefits retained by shareholders (see Colorado House Bill 1037, signed by
Governor Bill Ritter on May 22, 2007).
Q. IS THIS A REASONABLE APPROACH?
A. Yes. A reasonable approach to mitigating disincentives would be to compensate
the utility for its lost revenues and/or lost opportunities. Various forms of lost
revenue adjustment mechanisms were popular in the 1990s (about 22 states and
the District of Columbia had such mechanisms in 1995 according to Oak Ridge
Laboratory’s Assessment of Net Lost Revenue Adjustment Mechanisms for Utility
DSM Programs, January 1995). However, this approach fell out of favor for a
variety of reasons, including: (1) it led to very contentious reconciliation
proceedings; (2) these mechanisms were designed to work within a context of
frequent rate cases (and these stopped during the 1990s); and (3) energy
efficiency programs declined with the advent of electric restructuring. Instead,
SPS proposes a more measured approach, one that is inherently “performance
based” and encourages investment in cost-effective energy efficiency by sharing
the savings between customers and shareholders. The approach is inherently
42

Direct Testimony of
Debra L. Sundin
1
2
3
4
5
6
7
8
9
10
11
12
13
14
15
16
17
18
19
20
performance-based because a utility can earn more for its shareholders by
producing energy and demand savings at a lower cost.
In comparison to lost revenues and lost earnings opportunities methods
described above, the shared savings method is both modest and reasonable. As
stated earlier, the approximate losses based on a lost revenues approach equal
$947,305 over three years and the approximate losses based on a lost earnings
opportunities approach equal $893,449. In fact, these losses are additive. In
comparison, the $439,849 of the shared savings methodology constitutes a
measured approach to mitigating the disincentives associated with investments in
energy efficiency. This approach is also transparent in that it is easily calculated
and verified, as ‘net benefits’ must be calculated in order to demonstrate cost
effectiveness.
Q. PLEASE EXPLAIN WHY SPS IS NOT PROPOSING OTHER
MECHANISMS TO MITIGATE DISINCENTIVES.
A. SPS examined a number of alternative mechanisms before selecting its shared
savings approach. These other mechanisms included: (1) percentage of
expenditures; (2) currently authorized or increased rate of return on investments
in energy efficiency and load management programs; (3) increase in SPS’s overall
rate of return based on energy efficiency and load management program
performance; (4) decoupling; and (5) some form of performance-based
43

Direct Testimony of
Debra L. Sundin
1
2
3
4
5
6
7
8
9
10
11
12
13
14
15
16
17
18
19
mechanism linked to specific energy and demand savings goals. SPS rejected
these other approaches mainly because they either did not reward superior
performance (with the exception of alternative (5)) or were not applicable to a
utility with increasing sales per customer (i.e., decoupling). Although SPS
generally prefers performance-based approaches based on energy and demand
savings goals, it feels that such an approach may be more applicable after a few
years of program operating experience wherein annual goals could be more
reliably developed.
Q. HOW DOES THIS APPROACH COMPARE TO THE WAY
INVESTMENTS IN ENERGY EFFICIENCY ARE TREATED IN XCEL
ENERGY’S OTHER OPERATING UTILITY JURISDICTIONS?
In Minnesota, NSP has operated its programs under a shared savings incentive
mechanism since 2000. In Colorado, a new law (H.B.1037) requires the Colorado
Public Utilities Commission to provide an opportunity for utility investments in
energy efficiency and load management to be more profitable than other utility
investments and includes a shared savings approach as one of the available
options.
Q. PLEASE EXPLAIN HOW THE PROPOSED METHOD FOR
MITIGATING DISINCENTIVES HELPS ASSURE THAT SPS IS
44

Direct Testimony of
Debra L. Sundin
1
2
3
4
5
6
7
8
9
10
11
12
13
14
15
16
17
18
19
20
FINANCIALLY NEUTRAL IN ITS PREFERENCE FOR ACQUIRING
DEMAND- OR SUPPLY-SIDE UTILITY RESOURCES.
A. SPS’s method for mitigating disincentives places demand-side resources on a
more level playing field with supply-side resources by allowing the utility’s
shareholders to share the benefits the utility’s customers derive from investments
in energy efficiency. NSP’s experience running successful and aggressive energy
efficiency and load management programs in Minnesota is a testament to the
benefits the utility system, its customers, and its shareholders can derive from a
well-crafted mechanism to mitigate disincentives.
Q. WHY AREN’T YOU FILING THE DISINCENTIVE MITIGATION AS A
SEPARATE PROPOSAL?
A. SPS is filing this proposal to remove disincentives as part of its overall program
filing to: (1) provide the Commission with a comprehensive picture of its energy
efficiency and load management proposal; (2) emphasize the fact that SPS
considers its mechanism to remove disincentives an essential element of the
program proposal, and (3) ensure compliance with 17.7.2.9(K)(4) NMAC, which
states that failure to file a proposal to remove disincentives at the time of a
program filing would preclude the utility from recovering costs to eliminate
barriers or disincentives associated with its proposed programs in the future.
X.
45

Direct Testimony of
Debra L. Sundin
CONCLUSION 1
2
3
4
5 6 7 8 9
10 11 12 13 14
15
16
17
18
19
20
21
22
23
Q. PLEASE SUMMARIZE YOUR TESTIMONY.
A. Consistent with the EUEA and Rule, SPS is proposing eight new energy
efficiency programs to be launched following Commission approval:
• Residential Home Lighting; • Residential Air Source Heat Pump Rebates; • Residential LivingWise®; • Low-Income; • Business Cooling Efficiency; • Business Custom Efficiency; • Business Lighting Efficiency; and • Large Customer.
These programs were designed to offer SPS’s customers opportunities for
broad participation and the ability to reduce their energy consumption and peak
demand. Each of the programs passes the TRC Test with a ratio greater than one,
while the overall portfolio results in a ratio of 1.84.
SPS sought public input on its proposal from interested stakeholders,
including large customers, environmental and low-income advocates, and
modified the Plan accordingly. The Plan represents the first year of SPS’s
commitment to meet the legislative goals of reducing retail sales by five percent
by 2020.
46
Direct Testimony of
Debra L. Sundin
1
2
3
4
5
Q. WERE ATTACHMENTS DLS-1 THROUGH DLS-3 PREPARED BY YOU
OR UNDER YOUR DIRECT SUPERVISION?
A. Yes.
Q. DOES THIS CONCLUDE YOUR TESTIMONY?
A. Yes.
47

VERIFICATION
STATE OF MINNESOTA ) ) ss. COUNTY OF HENNEPIN ) Debra L. Sundin being first duly sworn on oath, deposes and states that she is the witness identified in the foregoing prepared testimony, that she has read the testimony and is familiar with its contents, and that the facts set forth are true to the best of her knowledge, information, and belief. ______________________________________ SUBSCRIBED AND SWORN TO before me this ______ day of September, 2007.
_________________________________ Notary Public My Commission Expires:_____________
48