2008 ANNUAL REPORT - s3.amazonaws.comAnnual+Report.pdf · In 2008 we saw intense competitive...
116
2008 ANNUAL REPORT
Transcript of 2008 ANNUAL REPORT - s3.amazonaws.comAnnual+Report.pdf · In 2008 we saw intense competitive...

2008 ANNUAL REPORT

Dear Fellow Shareowners,
I was pleased to accept the appointment as Cott’s Chief Executive Officer in February of this year. I amoptimistic that with tighter controls and a more disciplined approach we will improve our cash flow and profitmargins. My enthusiasm, however, is tempered by the many challenges that lie ahead for the beverage industryand the global economy.
In 2008 we saw intense competitive pressure from the national brands, historic commodity cost volatility andchallenging macroeconomic conditions. In response to these challenges, we implemented a plan to refocus on ourprivate label business. During the fourth quarter of 2008, our carbonated soft drink business in North Americabegan to improve. This was primarily due to a more rational pricing and promotional approach from the nationalbrands, moderating commodity prices, and an increasing sales trend, particularly in the U.S., as consumerslooked for value in these difficult economic times. We also saw the first signs that our refocus plan was startingto produce results.
At Cott, we are committed to being a disciplined, focused, low cost supplier to our retailer partners. Our toppriority is strengthening our customer relationships while reducing our cost structure. Our goal as a private labelsupplier is to help our retailer partners improve category profitability and long-term consumer loyalty with theirretailer brands. To that end, we will focus on the following four areas of emphasis, which we call the “4 Cs”:
Customers: Customer relationships are important for any business, but at Cott, where our products bear ourcustomers’ brand names, we must forge close partnerships with our customers and make their success our toppriority. We will continue to provide our retailer partners with high quality products and great service at anattractive value that will help them provide superior value to consumers. We have now refocused our efforts onprivate label and away from the brand initiatives of 2007 and early 2008. As we go forward we will continue tofocus on our high customer service levels as well as core private label innovations through the introduction ofnew packs, flavors and varieties of CSDs.
Costs: As a retailer brand producer, we understand that our long-term success will be closely tied to our ability toremain a low-cost supplier. Our 2008 refocus plan included significant cost reductions, such as lower headcountin our headquarters office and reduced operating costs through improved manufacturing efficiencies. We willcontinue to look for additional ways to reduce our cost structure in 2009.
Capital Expenditures: Consistent with our status as a low-cost supplier, we will both reduce and carefullyprioritize our capital investments. We will focus on those expenditures that provide the best financial returns forCott and for our retailer partners, while maintaining safety, efficiency and superior product quality. I commit toyou that any additional investment will be rigorously reviewed in light of our current circumstances.
Cash Flow: Improving cash flow will continue to be central to any decision that we make. Teams have been putin place in all business units to review and improve the effectiveness of our cash management processes. Cashflow should naturally improve as we reduce costs and optimize our capital expenditures. Further improvementwill come from the actions of our teams in each business unit as we manage every dollar as if it were our ownhard-earned money. We will strive to reduce working capital by collecting our receivables sooner, diligentlymanaging our payables, and taking other actions designed to improve cash flow.
I would like to thank David Gibbons, our Chairman, for his leadership during 2008 and his appropriate vision torefocus Cott on its private label business at a critical time.
Our refocus on private label will be the foundation for Cott’s sustainable improvement into the future. As theworld’s largest supplier of retailer brand carbonated soft drinks, and with our renewed commitment to strengthenour positions with our retailer partners, I believe we have a strong base on which to build our long-term success.
Cott is a company full of passionate and dedicated men and women. We will pursue our opportunities withtighter controls and a more disciplined and rigorous approach, and I look forward to this resulting in theimproved performance that our investors, employees and customers deserve.
Signature: Jerry FowdenChief Executive Officer

United StatesSecurities and Exchange Commission
Washington, D.C. 20549
Form 10-KÈ Annual Report Pursuant to Section 13 or 15(d) of the Securities Exchange Act of 1934
For the fiscal year ended December 27, 2008
‘ Transition Report Pursuant to Section 13 or 15(d) of the Securities Exchange Act of 1934For the transition period from to
Commission file number 001-31410
COTT CORPORATION(Exact name of registrant as specified in its charter)
CANADA 98-0154711(State or Other Jurisdiction
of Incorporation or Organization)(IRS Employer
Identification No.)
6525 VISCOUNT ROADMISSISSAUGA, ONTARIO
L4V 1H6
5519 WEST IDLEWILD AVENUETAMPA, FLORIDA, UNITED STATES 33634
(Address of principal executive offices) (Zip Code)
Registrant’s telephone number, including area code: (905) 672-1900 and (813) 313-1800Securities registered pursuant to Section 12(b) of the Act:
Title of each class Name of each exchange on which registered
COMMON SHARES WITHOUT NOMINAL OR NEW YORK STOCK EXCHANGEPAR VALUE TORONTO STOCK EXCHANGE
Securities registered pursuant to Section 12(g) of the Act: NONE
Indicate by check mark if the registrant is a well-known seasoned issuer, as defined in Rule 405 of the SecuritiesAct. Yes ‘ No È
Indicate by check mark if the registrant is not required to file reports pursuant to Section 13 or Section 15(d) of theAct. Yes ‘ No È
Indicate by check mark whether the registrant: (1) has filed all reports required to be filed by Section 13 or 15(d) of theSecurities Exchange Act of 1934 during the preceding 12 months (or for such shorter period that the registrant was required to filesuch reports), and (2) has been subject to such filing requirements for the past 90 days. Yes È No ‘
Indicate by check mark if disclosure of delinquent filers pursuant to Item 405 of Regulation S-K is not contained herein, andwill not be contained, to the best of the registrant’s knowledge, in definitive proxy or information statements incorporated byreference in Part III of this form 10-K or any amendment to this form 10-K. ‘
Indicate by check mark whether the registrant is a large accelerated filer, an accelerated filer, or a non-accelerated filer, or asmaller reporting company. See the definitions of “large accelerated filer,” “accelerated filer” and “smaller reporting company” inRule 12b-2 of the Exchange Act. (Check one):
Large accelerated filer ‘ Accelerated filer È Non-accelerated filer ‘ Smaller reporting company ‘
Indicate by check mark if the registrant is a shell company (as defined in Rule 12b-12 of the Act). Yes ‘ No È
The aggregate market value of the common equity held by non-affiliates of the registrant as of June 28, 2008 (based on theclosing sale price of $3.05 for the registrant’s common stock as reported on the New York Stock Exchange on June 27, 2008) was$198.9 million
(Reference is made to the last paragraph of Part II, Item 5 for a statement of assumptions upon which the calculation is made).
The number of shares outstanding of the registrant’s common stock as of February 28, 2009 was 71,871,330.
Documents incorporated by referencePortions of our definitive proxy circular for the 2009 Annual Meeting of Shareowners, to be filed within 120 days of
December 27, 2008, are incorporated by reference in Part III. Such proxy circular, except for the parts therein which have beenspecifically incorporated by reference, shall not be deemed “filed” for the purposes of this Annual Report on Form 10-K.


TABLE OF CONTENTS
PART I . . . . . . . . . . . . . . . . . . . . . . . . . . . . . . . . . . . . . . . . . . . . . . . . . . . . . . . . . . . . . . . . . . . . . . . . . . . . 2
ITEM 1. BUSINESS . . . . . . . . . . . . . . . . . . . . . . . . . . . . . . . . . . . . . . . . . . . . . . . . . . . . . . . . . . . . . . . 2
ITEM 1A. RISK FACTORS . . . . . . . . . . . . . . . . . . . . . . . . . . . . . . . . . . . . . . . . . . . . . . . . . . . . . . . . . . . 8
ITEM 1B. UNRESOLVED STAFF COMMENTS . . . . . . . . . . . . . . . . . . . . . . . . . . . . . . . . . . . . . . . . . 19
ITEM 2. PROPERTIES . . . . . . . . . . . . . . . . . . . . . . . . . . . . . . . . . . . . . . . . . . . . . . . . . . . . . . . . . . . . . 19
ITEM 3. LEGAL PROCEEDINGS . . . . . . . . . . . . . . . . . . . . . . . . . . . . . . . . . . . . . . . . . . . . . . . . . . . . 19
ITEM 4. SUBMISSION OF MATTERS TO A VOTE OF SECURITY HOLDERS . . . . . . . . . . . . . . 20
SUPPLEMENTAL ITEM PART I. EXECUTIVE OFFICERS OF THE REGISTRANT . . . . . . . . . . . . . 21
PART II . . . . . . . . . . . . . . . . . . . . . . . . . . . . . . . . . . . . . . . . . . . . . . . . . . . . . . . . . . . . . . . . . . . . . . . . . . . . 22
ITEM 5. MARKET FOR THE REGISTRANT’S COMMON EQUITY AND RELATEDSHAREOWNER MATTERS . . . . . . . . . . . . . . . . . . . . . . . . . . . . . . . . . . . . . . . . . . . . . . . 22
ITEM 6. SELECTED FINANCIAL DATA . . . . . . . . . . . . . . . . . . . . . . . . . . . . . . . . . . . . . . . . . . . . . . 24
ITEM 7. MANAGEMENT’S DISCUSSION AND ANALYSIS OF FINANCIAL CONDITIONAND RESULTS OF OPERATIONS . . . . . . . . . . . . . . . . . . . . . . . . . . . . . . . . . . . . . . . . . 25
ITEM 7A. QUANTITATIVE AND QUALITATIVE DISCLOSURES ABOUT MARKET RISK . . . . 44
ITEM 8. FINANCIAL STATEMENTS AND SUPPLEMENTARY DATA . . . . . . . . . . . . . . . . . . . . 45
ITEM 9. CHANGES IN AND DISAGREEMENTS WITH ACCOUNTANTS ON ACCOUNTINGAND FINANCIAL DISCLOSURE . . . . . . . . . . . . . . . . . . . . . . . . . . . . . . . . . . . . . . . . . . 45
ITEM 9A. CONTROLS AND PROCEDURES . . . . . . . . . . . . . . . . . . . . . . . . . . . . . . . . . . . . . . . . . . . . 45
ITEM 9B. OTHER INFORMATION . . . . . . . . . . . . . . . . . . . . . . . . . . . . . . . . . . . . . . . . . . . . . . . . . . . . 47
PART III . . . . . . . . . . . . . . . . . . . . . . . . . . . . . . . . . . . . . . . . . . . . . . . . . . . . . . . . . . . . . . . . . . . . . . . . . . . 48
ITEM 10. DIRECTORS AND EXECUTIVE OFFICERS OF THE REGISTRANT . . . . . . . . . . . . . . . 48
ITEM 11. EXECUTIVE COMPENSATION . . . . . . . . . . . . . . . . . . . . . . . . . . . . . . . . . . . . . . . . . . . . . 48
ITEM 12. SECURITY OWNERSHIP OF CERTAIN BENEFICIAL OWNERS ANDMANAGEMENT AND RELATED SHAREOWNER MATTERS . . . . . . . . . . . . . . . . . . 48
ITEM 13. CERTAIN RELATIONSHIPS AND RELATED TRANSACTIONS . . . . . . . . . . . . . . . . . . 48
ITEM 14. PRINCIPAL ACCOUNTANT FEES AND SERVICES . . . . . . . . . . . . . . . . . . . . . . . . . . . . 48
PART IV . . . . . . . . . . . . . . . . . . . . . . . . . . . . . . . . . . . . . . . . . . . . . . . . . . . . . . . . . . . . . . . . . . . . . . . . . . . 49
ITEM 15. EXHIBITS AND FINANCIAL STATEMENT SCHEDULES . . . . . . . . . . . . . . . . . . . . . . . 49
INDEX TO CONSOLIDATED FINANCIAL STATEMENTS . . . . . . . . . . . . . . . . . . . . . . . . . . . . . . . . . F-1
SCHEDULE II—VALUATION AND QUALIFYING ACCOUNTS . . . . . . . . . . . . . . . . . . . . . . . . . . . . SCH-1

Our consolidated financial statements are prepared in accordance with United States (“U.S.”) generallyaccepted accounting principles (“GAAP”) in U.S. dollars. Unless otherwise indicated, all amounts in this reportare in U.S. dollars and U.S. GAAP.
Any reference to 2008, 2007 and 2006 corresponds to our fiscal years ended December 27, 2008,December 29, 2007, and December 30, 2006, respectively.
Forward-looking statements
In addition to historical information, this report and the reports and documents incorporated by reference inthis report contain statements relating to future events and our future results. These statements are “forward-looking” within the meaning of the Private Securities Litigation Reform Act of 1995 and applicable Canadiansecurities legislation and include, but are not limited to, statements that relate to projections of sales, earnings,earnings per share, cash flows, capital expenditures or other financial items, discussions of estimated futurerevenue enhancements and cost savings. These statements also relate to our business strategy, goals andexpectations concerning our market position, future operations, margins, profitability, liquidity and capitalresources. Generally, words such as “anticipate,” “believe,” “continue,” “could,” “endeavor,” “estimate,”“expect,” “intend,” “may,” “plan,” “predict,” “project,” “should” and similar terms and phrases are used toidentify forward-looking statements in this report and in the documents incorporated in this report by reference.These forward-looking statements are made as of the date of this report.
The forward-looking statements are based on certain interest and foreign exchange rates, expected growth,results of operations, performance, business prospects and opportunities and effective income tax rates. Althoughwe believe the assumptions underlying these forward-looking statements are reasonable, any of theseassumptions could prove to be inaccurate and, as a result, the forward-looking statements based on thoseassumptions could be incorrect. Our operations involve risks and uncertainties, many of which are outside of ourcontrol, and any one or any combination of these risks and uncertainties could also affect whether theforward-looking statements ultimately prove to be correct. These risks and uncertainties include, but are notlimited to, those described in Part I, “Item 1A. Risk Factors” and elsewhere in this report and those describedfrom time to time in our future reports filed with the Securities and Exchange Commission (“SEC”) andCanadian securities regulatory authorities.
We undertake no obligation to update any information contained in this report or to publicly release theresults of any revisions to forward-looking statements to reflect events or circumstances of which we maybecome aware of after the date of this report. Undue reliance should not be placed on forward-lookingstatements.
All future written and oral forward-looking statements attributable to us or persons acting on our behalf areexpressly qualified in their entirety by the foregoing.
1
PART I
ITEM 1. BUSINESS
Our Company
Cott Corporation, together with its consolidated subsidiaries (“Cott,” “the Company,” “our Company,”“Cott Corporation,” “we,” “us,” or “our”), is one of the world’s largest non-alcoholic beverage companies andthe world’s largest retailer brand soft drink provider. In addition to carbonated soft drinks (“CSDs”), our productlines include clear, still and sparkling flavored waters, juice-based products, bottled water, energy drinks andready-to-drink teas.
We operate in five operating segments—North America (which includes the U.S. reporting unit and Canadareporting unit), United Kingdom (“U.K.”) (which includes our United Kingdom reporting unit and ourContinental European reporting unit), Mexico, Royal Crown International (“RCI”) and All Other (which includesour Asia reporting unit and our international corporate expenses). We closed our active Asian operations at theend of fiscal year 2008. We changed our operating segments in the third quarter of 2008 to reflect a change in ourmanagement structure and how information is reported to management.
We incorporated in 1955 and are governed by the Canada Business Corporations Act. Our registeredCanadian office is located at 333 Avro Avenue, Pointe-Claire, Quebec, Canada H9R 5W3 and our principalexecutive offices are located at 5519 W. Idlewild Avenue, Tampa, Florida, United States 33634 and 6525Viscount Road, Mississauga, Ontario, Canada L4V 1H6.
Principal markets and products
Based on industry information compiled from Nielsen, we estimate that as of December 27, 2008 weproduce (either directly or through third party manufacturers with whom we have co-packing agreements)approximately 67% of all retailer brand carbonated soft drinks (“CSDs”) sold in North America. In addition toCSDs, our product lines include clear, still and sparkling flavored waters, juice-based products, bottled water,energy drinks and ready-to-drink teas.
We measure the volume of products sold in 8-ounce equivalent cases (“case volume”), which is a standardindustry measure equaling 24 8-ounce servings (192 U.S. fluid ounces), and does not equate to physical cases. In2008, sales of CSDs represented approximately 43% of our case volume and sales of concentrate and bottledwater represented approximately 30% and 8% of our case volume, respectively. The balance of approximately19% was comprised of sales of ready-to-drink teas, still and sparkling flavored waters and other non-carbonatedbeverages.
We believe that opportunities exist to increase sales of beverages in our markets by leveraging existingcustomer relationships, obtaining new customers, exploring new channels of distribution and introducing newproducts.
Restructuring Initiatives
From 2006 through 2007, we implemented our North American Realignment and Cost Reduction Plan (the“North American Plan”) to realign the management of our Canadian and U.S. businesses to a North Americanbasis, rationalize product offerings, eliminate underperforming assets and increase focus on high potentialaccounts. As part of the North American Plan, we also closed several plants and warehouses in North Americaand in an effort to further align company resources, we also decided to dispose of one of our water productionfacilities in Canada and certain hot-filled production assets at one of our co-packers. As part of the NorthAmerican Plan, we also realigned our reporting units in the United Kingdom, Mexico, RCI and Asian businessinto a combined International business to focus on cohesive customer management, channel development, andsales and marketing. In 2007, we completed the implementation of the North American Plan.
2
In 2008, we implemented a plan to refocus on retailer brands and reduce costs in the operation of ourbusiness (the “Refocus Plan”). The Refocus Plan resulted in a partial reduction of our workforce in 2008.
Financial information about segments
For financial information about operating segments and geographic areas, see Note 9 to the consolidatedfinancial statements contained in this Annual Report on Form 10-K.
Manufacturing and distribution network
Approximately 95% of our beverages produced in North America are manufactured in facilities that we, orthird-party manufacturers with whom we have long-term co-packing agreements, either own or lease. Wemanufacture virtually all of our United Kingdom and Mexican reporting units’ beverages in facilities that weeither own or lease. We rely on third parties to produce and distribute products in areas or markets where we donot have our own production facilities, such as in Continental Europe, or when additional production capacity isrequired.
Our products are either picked up by our customers at our facilities or delivered by us, a common carrier, orthird-party distributors to our customer’s distribution centers or to retail locations.
Ingredient and packaging supplies
In addition to water, the principal raw materials required to produce our products are polyethyleneterephthalate (“PET”) bottles, PET caps and preforms, aluminum cans and ends, labels, cartons and trays,concentrates and sweeteners.
We rely on our ongoing relationships with key suppliers to support our operations. We generally enter intoannual supply arrangements rather than long-term contracts with our suppliers, which means that our suppliersare obligated to continue to supply us with materials for one-year periods, at the end of which we will eitherrenegotiate the contracts with our incumbent suppliers or find alternative sources. With respect to some of ourkey packaging supplies, such as aluminum cans and ends, and some of our key ingredients, such as artificialsweeteners, we have entered into long-term supply agreements, the remaining terms of which range from 1 to 3years. We believe that we will be able to either renegotiate contracts with these suppliers when they expire orfind alternative sources for supply. We also believe there is adequate supply of the ingredient and packagingmaterials used to produce or package our products. We have entered into 12 to 24-month supply agreements forelectricity and natural gas for certain of our manufacturing facilities in the United Kingdom and we have enteredinto 12-month supply agreements for natural gas for certain of our manufacturing facilities in North America.The remaining terms of these energy contracts range from 8 to 21 months.
Generally, we bear the risk of increases in the costs of the ingredient and packaging materials used toproduce our products, including the underlying costs of the commodities that they are comprised of and, to someextent, the costs of converting those commodities into finished products. We do not currently use derivatives tomanage this risk; however, we continue to evaluate whether it would be appropriate to do so in the future.
Aluminum for cans, resin for PET bottles, preforms and caps, and corn for high fructose corn syrup(“HFCS”) are examples of underlying commodities for which we bear the risk of increases in costs. In addition,the contracts for certain of our ingredient and packaging materials permit our suppliers to increase the costs theycharge us based on increases in their cost of converting the underlying commodities into the materials wepurchase. In certain cases those increases are subject to negotiated limits. Changes in the prices we pay foringredient and packaging materials occur at times that vary by product and supplier, but take place principally ona monthly, semi-annual and annual basis.
3

Crown Cork & Seal USA, Inc. (“CCS”) supplies us with aluminum cans and ends under a contract thatexpires on December 31, 2011. The contract provides that CCS will supply our entire aluminum cans and endsrequirements worldwide, subject to certain exceptions. The contract contains a pricing mechanism for certainmaterials, standard representations, warranties, indemnities and termination events (including termination eventsrelated to bankruptcy or insolvency of either party). In 2007, the market price paid for aluminum increasedsignificantly to reflect increased worldwide demand, but declined significantly in 2008 primarily due to thedownturn in the U.S. economy. In 2008, we locked in a majority of our forecasted 2009 aluminum requirements,with the remaining requirements to be purchased at the prevailing 2009 market prices.
PET resin prices have fluctuated significantly in recent years as the price of oil fluctuated. Because PETresin is not a traded commodity, we have limited ability to obtain price protection.
HFCS has a history of volatile price changes. We expect that HFCS market prices will continue to fluctuateas a result of the worldwide economic turmoil, which has impacted the demand for corn-related products. In2008, we locked in a majority of our forecasted 2009 HFCS requirements, with the remaining requirements to bepurchased at the prevailing 2009 market prices.
Trade secrets, copyrights, trademarks and licenses
We sell the majority of our beverages under retailer brands to customers who own the trademarks associatedwith those products. We also own registrations, or applications to register, various trademarks that are importantto our worldwide business, including Cott® and Orient Emporium Tea Co.™ in the U.S., Canada and the U.K.,Stars & Stripes®, Vess®, Vintage® and So Clear® in the U.S., Red Rain® and Red Rave™ in the U.S. and Canada,Red Rooster®, Ben Shaw’s® and the H2 family of brands in the U.K., Stars & Stripes® and Vintage® inMexico, and RC® in more than 100 countries outside of North America. Moreover, we are licensed to use certaintrademarks, including Carters® in the U.K., Jarritos® in Mexico, and RC® in certain regions of Canada. Thelicenses to which we are a party are of varying terms, including some that are perpetual. Trademark ownership isgenerally of indefinite duration when marks are properly maintained in commercial use.
Our success depends in part on our intellectual property, which includes trade secrets in the form ofconcentrate formulas for our beverages and trademarks for the names of the beverages we sell. To protect thisintellectual property, we rely principally on registration of trademarks, contractual responsibilities andrestrictions in agreements (such as indemnification, nondisclosure and confidentiality agreements) withemployees, consultants and customers, and on the common law and statutory protections afforded to trademarks,copyrights, trade secrets and proprietary “know-how.” We also closely monitor the use of our trademarks andvigorously pursue any party that infringes on our trademarks, using all available legal remedies.
Seasonality of sales
Sales of our products tend to be seasonal, with the second and third quarters accounting for higher unit salesof our products than the first and fourth quarters. The seasonality of our sales volume, combined with theaccounting for fixed costs, such as depreciation, amortization, rent and interest expense, impacts our results on aquarterly basis.
Customers
A significant portion of our revenue is concentrated in a small number of customers. Our customers includemany large national and regional grocery, mass-merchandise, drugstore, wholesale and convenience store chains.For the year ended December 27, 2008, sales to Wal-Mart Stores, Inc. and its affiliates (collectively,“Wal-Mart”) accounted for 35.7% of total revenue, 42.5% of our North American operating segment revenue,21.0% of our U.K. operating segment revenue and 22.2% of our Mexico operating segment revenue. Wal-Martwas the only customer that accounted for more than 10% of our total revenue in that period. For the same period,
4

our top ten customers accounted for 60.9% of total revenue. We expect that sales of our products to a limitednumber of customers will continue to account for a high percentage of revenue for the foreseeable future. Theloss of any customers that individually or in the aggregate represent a significant portion of our revenue, or adecline in sales to these customers, would have a material adverse effect on our operating results and cash flow.
On January 27, 2009, we received written notice from Wal-Mart stating that Wal-Mart was exercising itsright to terminate, without cause, our exclusive supply contract dated December 21, 1998, between CottBeverages Inc., a wholly-owned subsidiary of the Company, and Wal-Mart (the “Exclusive Supply Contract”).The termination is effective on January 28, 2012. Pursuant to the terms of the Exclusive Supply Contract, we areWal-Mart’s exclusive supplier of retailer brand CSDs in the United States. The termination provision of theExclusive Supply Contract provides for exclusivity to be phased out over a period of three years following noticeof termination (the “Notice Period”). Accordingly, we have the exclusive right to supply at least two-thirds ofWal-Mart’s total CSD volume in the United States during the first 12 months of the Notice Period, and we havethe exclusive right to supply at least one-third of Wal-Mart’s total CSD volume in the United States during thesecond 12 months of the Notice Period. Notwithstanding the termination of the Exclusive Supply Contract, wecontinue to supply Wal-Mart and its affiliated companies, under annual non-exclusive supply agreements, with avariety of products in the United States, Canada, United Kingdom and Mexico, including CSDs, clear, still andsparkling flavored waters, juice-based products, bottled water, energy drinks and ready-to-drink teas.
At the end of April 2008, Wal-Mart began reducing shelf space in its United States stores dedicated to itsretailer brand CSDs. Our revenue to Wal-Mart declined 15.4% during 2008 as compared to 2007. However, weattribute the decline in revenue in large part to (i) the increased competitive nature of the CSD marketplacearising from national competitors that have expended greater resources for product placement and promotionalsupport and (ii) the continued decline of CSDs in general, rather than the reduction in shelf space.
In addition, a long-term contract with Wal-Mart for the lease and maintenance of vending machines expiredin June 2008 as Wal-Mart implemented a different approach to soft drink vending. That program was designed tosupport Wal-Mart’s brands.
Research and Development
We engage in a variety of research and development activities. These activities principally involve thedevelopment of new products, improvement in the quality of existing products, improvement and modernizationof production processes, and the development and implementation of new technologies to enhance the qualityand value of both current and proposed product lines. Consumer research is excluded from research anddevelopment costs and included in other marketing costs. Research and development costs were $2.2 million in2008, $2.4 million in 2007 and $1.3 million in 2006 and are reported as selling, general and administrativeexpenses.
Competition
We compete against a wide range of companies that produce and sell non-alcoholic beverages includingCSDs, bottled, sparkling and flavored waters, teas, coffees and juice-based beverages. While CSDs and CSDconcentrate account for 72.6% of our 2008 case volume, they account for 61.1% of our 2008 revenue. Thenon-CSD products generated 27.4% of our 2008 case volume and 38.9% of our 2008 revenue.
The non-alcoholic beverage category is highly competitive in each region in which we operate, andcompetition for incremental volume is intense. The brands owned by the four major national soft drinkcompanies, Coca-Cola, Pepsi, Nestle Waters North America and Dr Pepper Snapple (formerly CadburySchweppes), control approximately 85% of the aggregate take-home volume of the liquid refreshment beveragecategory in the North America operating segment. These companies have significant financial resources andspend heavily on promotional programs. They also have direct store delivery systems in North America, whichenable their personnel to visit retailers frequently to promote new items, stock shelves and build displays.
5

In addition, we face competition in the U.S., United Kingdom and Mexico from regional soft drinkmanufacturers who sell aggressively-priced brands and, in many cases, also supply retailer brand products. A fewlarger U.S. retailers also self-manufacture products for their own needs and consistently approach other retailersseeking additional business.
We seek to differentiate ourselves from our competitors by offering our customers efficient distributionmethods, high-quality products, category management strategies, packaging and marketing strategies, andsuperior service.
Government regulation and environmental matters
The production, distribution and sale in the United States of many of our products are subject to the FederalFood, Drug, and Cosmetic Act, the Federal Trade Commission Act, the Lanham Act, state consumer protectionlaws, federal, state and local workplace health and safety laws, various federal, state and local environmentalprotection laws and various other federal, state and local statutes and regulations applicable to the production,transportation, sale, safety, advertising, labeling and ingredients of such products. Outside the United States, theproduction, distribution and sale of our many products and related operations are also subject to numeroussimilar and other statutes and regulations.
A California law requires that a specific warning appear on any product that contains a component listed bythe state as having been found to cause cancer or birth defects. The law exposes all food and beverage producersto the possibility of having to provide warnings on their products. This is because the law recognizes no generallyapplicable quantitative thresholds below which a warning is not required. Consequently, even trace amounts oflisted components can expose affected products to the prospect of warning labels. Products containing listedsubstances that occur naturally or that are contributed to such products solely by a municipal water supply aregenerally exempt from the warning requirement. None of the beverages produced for sale in California arecurrently required to display warnings under this law. We are unable to predict whether a component found inone of our products might be added to the California list in the future, although the state has initiated a regulatoryprocess in which caffeine will be evaluated for listing. Furthermore, we are also unable to predict when orwhether the increasing sensitivity of detection methodology that may become applicable under this law andrelated regulations as they currently exist, or as they may be amended, might result in the detection of aninfinitesimal quantity of a listed substance in one of our beverages produced for sale in California.
We currently offer and use non-refillable, recyclable containers in the United States and various othermarkets around the world. We also offer and use refillable containers, which are also recyclable. Legalrequirements apply in various jurisdictions in the United States and overseas requiring that deposits or certainecotaxes or fees be charged for the sale, marketing and use of certain non-refillable beverage containers. Theprecise requirements imposed by these measures vary. Other types of beverage container-related deposit,recycling, ecotax and/or product stewardship statutes and regulations also apply in various jurisdictions in theUnited States and overseas. We anticipate that additional, similar legal requirements may be proposed or enactedin the future at local, state and federal levels, both in the United States and elsewhere.
All of our manufacturing facilities and other operations are subject to various environmental protectionstatutes and regulations, including those of the U.S. Environmental Protection Agency, which pertain to the useof water resources and the discharge of waste water. Failure to comply with these regulations can have seriousconsequences, including civil and administrative penalties. Our policy is to comply with all such legalrequirements. Compliance with these provisions has not had, and we do not expect such compliance to have, anymaterial adverse effect on our Company’s capital expenditures, net income or competitive position. However, asdiscussed below, changes in how the Ontario Ministry of the Environment enforces the Ontario EnvironmentalProtection Act could result in us having to make material expenditures for environmental compliance.
6

Subject to the terms and conditions of the applicable policies, we are insured against product liability claimsand product recalls that could result from the injury, illness or death of consumers using our products,contamination of our products, or damage to or mislabeling of our products. We believe that our insurancecoverage is adequate.
The Ontario Environmental Protection Act (“OEPA”)
OEPA regulations provide that a minimum percentage of a bottler’s soft drink sales within specified areas inOntario must be made in refillable containers. The penalty for non-compliance is a fine of $50,000 per daybeginning upon when the first offense occurs and continues until the first conviction, and then increasing to$100,000 per day for each subsequent conviction. These fines may be increased to equal the amount of monetarybenefit acquired by the offender as a result of the commission of the offense.
We, and we believe other industry participants, are currently not in compliance with the requirements of theOEPA. To comply with these requirements we, and we believe many other industry participants, would have tosignificantly increase sales in refillable containers to a minimum refillable sales ratio of 30%. We are not incompliance with these regulations and do not expect to be in the foreseeable future. Ontario is not enforcing theOEPA at this time, despite the fact that it is still in effect and not amended, but if it chooses to enforce it in thefuture, we could incur fines for non-compliance and the possible prohibition of sales of soft drinks innon-refillable containers in Ontario. We estimate that approximately 4% of our sales would be affected by thepossible limitation of sales of soft drinks in non-refillable containers in Ontario if the Ontario Ministry of theEnvironment initiated an action to enforce the provisions of the OEPA against us. Moreover, the OntarioMinistry of the Environment released a report in 1997 stating that these OEPA regulations are “outdated andunworkable.” However, despite the “unworkable” nature of the OEPA regulations, they have not yet beenrevoked.
We believe that the magnitude of the potential fines that we could incur if the Ontario Ministry of theEnvironment chose to enforce these regulations is such that the costs to us of non-compliance could be, althoughare not contemplated to be, material. However, our management believes that such enforcement is very remoteand, in any event, these regulations are expected to be revoked in the future given the regulatory activity in thisarea as described below.
In December of 2003, the Ontario Ministry of the Environment approved the Blue Box Program, whichincluded provisions regarding industry responsibility for 50% of the net cost of the program. Generally, thecompany that owns the intellectual property rights to the brand of a product, or is the licensee of those rights, andthat manufactures, packages or distributes a product for sale in Ontario or causes such manufacturing, packagingor distributing of a product in Ontario, will be liable for the costs under the program. We generally do not ownthe intellectual property rights to the brands of our products. Rather, we generally manufacture, package anddistribute products for and on behalf of Ontario-based third party customers who are the brand owners, and we donot believe that any costs for which we might be ultimately responsible would have a material adverse effect onour results of operations; however, we cannot guarantee this outcome.
Employees
As of December 27, 2008, we had 2,803 employees, of whom 1,733 were in the North America operatingsegment, 729 were in the U.K. operating segment, 328 were in the Mexico operating segment and 13 were in thecombined RCI/All Other operating segments. We have entered into numerous collective bargaining agreementscovering 847 employees that we believe contain terms that are typical in the beverage industry. As theseagreements expire, we believe they can be renegotiated on terms satisfactory to us. We consider our relationswith employees to be generally good.
7

Availability of information and other matters
We are required to file annual, quarterly and current reports, proxy statements and other information withthe SEC and Canadian securities regulatory authorities. The public may read and copy any materials that we filewith the SEC at the SEC’s Public Reference Room at 100 F Street, NE, Washington, D.C. 20549. Information inthe Public Reference Room may be obtained by calling the SEC at 1-800-SEC-0330. In addition, the SECmaintains an Internet site that contains reports, proxy and information statements, and other informationregarding issuers that file with the SEC at www.sec.gov. Information filed with the Canadian securitiesregulatory authorities is available at www.sedar.com.
Our Annual Report on Form 10-K, quarterly reports on Form 10-Q, current reports on Form 8-K andamendments to reports filed or furnished pursuant to Sections 13(a) and 15(d) of the Securities Exchange Act of1934, as amended, are also available free of charge on our website at www.cott.com, as soon as reasonablypracticable after such material is electronically filed with, or furnished to, the SEC. The information found on ourwebsite is not part of this or any other report that we file with, or furnish to, the SEC or to Canadian securitiesregulatory authorities.
The certification of the Chief Executive Officer required by the NYSE Listing Standards,Section 303A.12(a), relating to the Company’s compliance with the NYSE Corporate Governance ListingStandards, was submitted to the NYSE on May 19, 2008. The certification indicated that the Chief ExecutiveOfficer was not aware of any violations of the Listing Standards by the Company.
We are responsible for establishing and maintaining adequate internal control over financial reporting asrequired by the SEC. See Management’s Report on Internal Control over Financial Reporting on page F-2.
ITEM 1A. RISK FACTORS
In addition to the other information set forth in this report, you should carefully consider the followingfactors, which could materially affect our business, financial condition or future results. The risks describedbelow are not the only risks that we face. Additional risks and uncertainties not currently known to us or that wecurrently deem to be immaterial also may materially adversely affect our business, financial condition or resultsof operations.
We may be unable to compete successfully in the highly competitive beverage category.
The markets for our products are extremely competitive. In comparison to the major national brandbeverage manufacturers, we are a relatively small participant in the industry. We face competition from thenational brand beverage manufacturers in all of our markets and from other retailer brand beveragemanufacturers. If our competitors reduce their selling prices, increase the frequency of their promotionalactivities in our core markets, enter into the production of private label products, or if our customers do notallocate adequate shelf space for the beverages we supply, we could experience a decline in our volumes, beforced to reduce pricing, forgo price increases required to off-set increased costs of raw materials and fuel,increase capital and other expenditures, or lose market share, any of which could adversely affect ourprofitability.
We may not be able to respond successfully to consumer trends related to carbonated and non-carbonatedbeverages.
Consumer trends with respect to the products we sell are subject to change. Consumers are seekingincreased variety in their beverages, and there is a growing interest among the public regarding the ingredients inour products, the attributes of those ingredients and health and wellness issues generally. This interest hasresulted in a decline in consumer demand for full-calorie CSDs and an increase in consumer demand for products
8

associated with health and wellness, such as water, enhanced water, teas, reduced-calorie CSDs and certain othernon-carbonated beverages. Consumer preferences may change due to a variety of other factors, including theaging of the general population, changes in social trends, the real or perceived impact the manufacturing of ourproducts has on the environment, changes in consumer demographics, changes in travel, vacation or leisureactivity patterns, negative publicity resulting from regulatory action or litigation against companies in theindustry, or a downturn in economic conditions. Any of these changes may reduce consumers’ demand for ourproducts.
There can be no assurance that we can develop innovative products that respond to consumer trends. Ourfailure to develop innovative products could put us at a competitive disadvantage in the marketplace and ourbusiness and financial results could be adversely affected.
Because a small number of customers account for a significant percentage of our sales, the loss of orreduction in sales to any significant customer could have a material adverse effect on our results ofoperations and financial condition.
A significant portion of our revenue is concentrated in a small number of customers. Our customers includemany large national and regional grocery, mass-merchandise, drugstore, wholesale and convenience store chainsin our core markets of North America, United Kingdom and Mexico. Sales to Wal-Mart, our top customer in2008 and 2007, accounted for 35.7% and 39.8%, respectively, of our total revenue, and sales to our top tencustomers in 2008 and 2007 accounted for 60.9% and 64.3%, respectively, of our total revenue. We expect thatsales of our products to a limited number of customers will continue to account for a high percentage of ourrevenue for the foreseeable future.
In 2008, Wal-Mart decreased the amount of shelf space allocated to its retailer brand CSDs. On January 27,2009, we received written notice from Wal-Mart stating that Wal-Mart was exercising its right to terminate,without cause, our Exclusive Supply Contract, effective on January 28, 2012. Pursuant to the terms of theExclusive Supply Contract, we are the exclusive supplier to Wal-Mart of retailer brand CSDs in the UnitedStates. The termination provision of the Exclusive Supply Contract provides for exclusivity to be phased out overa period of three years following notice of termination. Accordingly, we have the exclusive right to supply atleast two-thirds of Wal-Mart’s total CSD volume in the United States during the first 12 months of the NoticePeriod, and we have the exclusive right to supply at least one-third of Wal-Mart’s total CSD volume in theUnited States during the second 12 months of the Notice Period. Notwithstanding the termination of theExclusive Supply Contract, we continue to supply Wal-Mart and its affiliated companies, under annualnon-exclusive supply agreements, with a variety of products in the United States, Canada, United Kingdom andMexico, including CSDs, clear, still and sparkling flavored waters, juice-based products, bottled water, energydrinks and ready-to-drink teas.
The loss of Wal-Mart or any significant customer, or customers that in the aggregate represent a significantportion of our revenue, or a material reduction in the amount of business we undertake with such customer or anyother customer, could have a material adverse effect on our operating results and cash flows. Furthermore, wecould be adversely affected if Wal-Mart or any significant customer reacts unfavorably to any pricing of ourproducts or decides to de-emphasize or reduce their product offerings in the categories that we supply them with.At December 27, 2008, we had $87.6 million of customer relationships recorded as an intangible asset. Thepermanent loss of any customer included in the intangible asset would result in impairment in the value of theintangible asset or accelerated amortization and could lead to an impairment of fixed assets that were used toservice that client.
9

We have a significant amount of outstanding debt, which could adversely affect our business and ourability to meet our obligations.
As of December 27, 2008, our total indebtedness was $409.5 million. This significant amount of debt couldhave important consequences to us and our investors, including:
• requiring a substantial portion of our cash flow from operations to make interest payments on this debt;
• making it more difficult to satisfy debt service and other obligations;
• increasing the risk of a future credit ratings downgrade of our debt, which could increase future debtcosts;
• increasing our vulnerability to general adverse economic and industry conditions;
• reducing the cash flow available to fund capital expenditures and other corporate purposes and to growour business;
• limiting our flexibility in planning for, or reacting to, changes in our business and the industry;
• placing us at a competitive disadvantage to our competitors that may not be as highly leveraged withdebt as we are; and
• limiting our ability to borrow additional funds as needed or take advantage of business opportunities asthey arise, pay cash dividends or repurchase common stock.
To the extent we become more leveraged, the risks described above would increase. In addition, our actualcash requirements in the future may be greater than expected. Our cash flow from operations may not besufficient to repay at maturity all of the outstanding debt as it becomes due, and we may not be able to borrowmoney, sell assets or otherwise raise funds on acceptable terms, or at all, to refinance our debt.
In addition, our asset based lending (“ABL”) facility contains covenants that, among other things, limit ourability to incur debt at subsidiaries that are not guarantors, incur liens, merge or sell, transfer or otherwise disposeof all or substantially all of our assets, make investments, loans, advances, guarantees and acquisitions, enter intotransactions with affiliates and enter into agreements restricting our ability to incur liens or the ability of oursubsidiaries to make distributions. The ABL facility also requires us to comply with certain affirmative andfinancial covenants. For additional information about our ABL facility, see “Management’s Discussion andAnalysis of Financial Condition and Results of Operations—Liquidity and Capital Resources.”
If we breach the covenants and conditions set out in our debt agreements, counterparties could require usto repay the debt or we could have to renegotiate the debt agreements, which could lead to higher fees,interest costs, and could have a material adverse effect on our business.
Our two most significant debt arrangements currently outstanding are the ABL facility and the 8% seniorsubordinated notes due in 2011 (“the Notes”). Our ABL facility allows for revolving credit borrowings of up to$250.0 million provided we are in compliance with the covenants and conditions of the credit agreementgoverning the ABL facility. As of December 27, 2008, our total availability under the ABL facility was $163.8million which was based on our borrowing base (accounts receivables, inventory, and fixed assets) as ofNovember 22, 2008 (the November month-end under the terms of the credit agreement) and we had $107.5million of ABL borrowings outstanding and $10.8 million in outstanding letters of credit. As a result, our excessavailability under the ABL facility was $45.5 million. Each month’s borrowing base is not effective untilsubmitted to the lenders, usually on the fifteenth of the following month. The ABL facility contains a covenantrequiring a minimum fixed charge coverage ratio of 1.1 to 1.0 effective when and if excess availability is lessthan $30.0 million. If this covenant had been triggered as of December 27, 2008, we would not have been incompliance with the fixed charge coverage ratio. If availability is less than $37.5 million, the lenders will takedominion over the cash and will apply excess cash to reduce amounts owing under the revolver. The credit
10

agreement governing the ABL facility requires us to maintain excess availability of at least $15.0 million. Webelieve we were in compliance with all of the applicable covenants under the ABL facility on December 27,2008.
Events of default under the ABL facility include nonpayment, inaccuracy of representations and warranties(which include the occurrence of an event having a material adverse effect), violation of covenants, cross-defaultto other indebtedness, bankruptcy, material judgments, and a change of control of the Company. If we breach acovenant and such breach is not waived by the lenders, or an event occurs that would have a material adverseeffect on us, we would have to renegotiate the ABL facility and we would expect to incur higher fees and interestrates, provided the lenders wish to renegotiate. If a breach occurs, the lenders could choose to terminate the ABLfacility and accelerate the loan balance. Should the ABL facility become currently due, we may have to incuradditional fees and higher interest costs to replace it. However, there is no certainty in today’s financial marketsthat we would be able to replace do so on terms acceptable to us, or at all..
The events of default in the indenture governing the Notes that relate to other indebtedness arise only ifthere is a failure to pay principal, interest or premiums of such other indebtedness after the expiration of anyapplicable grace period, or there has been an acceleration in payment of such other indebtedness, in each case, inexcess of a threshold amount. A covenant default in our ABL facility would permit our lenders under the ABLfacility to demand or accelerate payment. A demand or acceleration of payment of indebtedness under the ABLfacility would result in a default of the Notes and in such event, the trustee or the holders of at least 25% ofprincipal amount of the then outstanding Notes may declare the Notes due and payable. If the Notes are declareddue and payable, they would be classified as a current liability. Should the Notes become currently due, we mayhave to incur additional fees and higher interest costs to replace them. However, there is no certainty in today’sfinancial markets that we would be able to replace them. As at December 27, 2008, these events of default didnot exist with respect to any other indebtedness.
If our cash from operations is not sufficient to enable us to reduce our debt as anticipated, our interestexpense could be materially higher than anticipated and our financial performance could be adversely affected. Ifour cash from operations is not sufficient to meet our expenses, or fund our capital expenditures and debt serviceobligations, we may be required to refinance our debt, sell assets, borrow additional money, or raise equity.
Our ability to generate cash to meet our expenses and debt service obligations and to otherwise reduce ourdebt as anticipated will depend on our future performance, which will be affected by financial, business,economic, legislative, regulatory and other factors, including potential changes in costs, pricing, the success ofproduct and marketing innovation, pressure from competitors and other matters discussed in this Annual Reporton Form 10-K (including this “Risk Factors” section). Many of these factors are beyond our control. Any factorthat negatively affects our results of operations, including our cash flow, may also negatively affect our ability topay the principal and interest on our outstanding debt. If we are unable to reduce our debt as anticipated, ourinterest expense could be materially higher than anticipated and our financial performance could be adverselyaffected.
If we do not have enough cash to pay our debt service obligations, we may be required to take actions suchas amending our ABL facility or indenture governing the Notes, refinancing all or part of our existing debt,selling assets, incurring additional indebtedness or raising equity. We cannot assure you that we will be able, atany given time, to take any of these actions on terms acceptable to us or at all.
A portion of our indebtedness is variable rate debt, and changes in interest rates could adversely affect usby causing us to incur higher interest costs with respect to such variable rate debt.
Our ABL facility subjects us to interest rate risk. The interest rate and margin applicable to the ABL facilityis variable, meaning that the rate at which we pay interest on amounts borrowed under the facility fluctuates withchanges in interest rates and our debt leverage. Accordingly, with respect to any amounts from time to time
11

outstanding under the ABL facility, we are exposed to changes in interest rates. We do not currently usederivative instruments to hedge interest rate exposure. If we are unable to adequately manage our debt structurein response to changes in the market, our interest expense could increase, which would negatively impact ourfinancial condition and results of operations.
Our credit rating has recently been downgraded by two of our rating agencies and is subject to furtherchange.
On September 19, 2008, Moody’s Investor Services (“Moody’s) downgraded our Notes from B3 to Caa1and our overall Company rating from B2 to B3. On December 22, 2008, Moody’s downgraded our Notes fromCaa1 to Caa2 and our overall Company rating from B3 to Caa1. On January 30, 2009, Standard & Poor’s(“S&P”) downgraded our Notes from CCC to CCC- and our overall Company rating from B- to CCC+. Theserating downgrades, and any potential future negative change in our credit rating, may make it more difficult forus to obtain any necessary amendments, refinance or raise additional capital in the future on terms that areacceptable to us, if at all; may negatively impact the price of our common stock; and may have other negativeimplications on our business.
Our financial results may be negatively impacted by the recent global financial events.
The recent global financial events have resulted in the consolidation, failure or near failure of a number ofinstitutions in the banking, insurance and investment banking industries and have substantially reduced theability of companies to obtain financing. These events have also caused a substantial reduction in the stockmarket. These events could have a number of different effects on our business, including:
• reduction in consumer spending, which could result in a reduction in our sales volume;
• a negative impact on the ability of our customers to timely pay their obligations to us or our vendors totimely supply materials, thus reducing our cash flow;
• an increase in counterparty risk;
• an increased likelihood that one or more members of our banking syndicate may be unable to honor itscommitments under our ABL facility; and
• restricted access to capital markets that may limit our ability to take advantage of businessopportunities, such as acquisitions.
Other events or conditions may arise directly or indirectly from the global financial events that couldnegatively impact our business.
Our geographic diversity subjects us to the risk of currency fluctuations.
We are exposed to changes in foreign currency exchange rates, including those between the U.S. dollar andthe pound sterling, the euro, the Canadian dollar, the Mexican peso and other currencies. Our operations outsideof the U.S. accounted for 38.9% of our 2008 sales. Accordingly, currency fluctuations in respect of ouroutstanding non-U.S. dollar denominated net asset balances may affect our reported results and competitiveposition.
Our ingredients, packaging supplies and other costs are subject to price increases and we may be unable toeffectively pass rising costs on to our customers.
We bear the risk of changes in prices on the ingredient and packaging in our products. The majority of ouringredient and packaging supply contracts allow our suppliers to alter the prices they charge us based on changesin the costs of the underlying commodities that are used to produce them. Aluminum for cans and ends, resin for
12
PET bottles, preforms and caps and corn for HFCS for sweeteners are examples of these underlyingcommodities. In addition, the contracts for certain of our ingredient and packaging materials permit our suppliersto increase the costs they charge us based on increases in their cost of converting those underlying commoditiesinto the materials that we purchase. In certain cases those increases are subject to negotiated limits and, in othercases, they are not. These changes in the prices that we pay for ingredient and packaging materials occur at timesthat vary by product and supplier, but are principally on a semi-annual or annual basis.
We are at risk with respect to fluctuating aluminum prices. Simultaneously, because PET resin is not atraded commodity, no fixed price mechanism has been implemented, and we are accordingly also at risk withrespect to changes in PET prices. HFCS has a history of volatile price changes. We typically purchase HFCSrequirements for North America under 12 month contracts. In 2008, we locked in a majority of our forecasted2009 HFCS and aluminum requirements, with the remaining requirements to be purchased at the prevailing 2009market prices.
Accordingly, we bear the risk of fluctuations in the costs of these ingredient and packaging materials,including the underlying costs of the commodities that comprise them and, to some extent, the costs ofconverting those commodities into finished products. We currently do not use derivatives to manage this risk. Ifthe cost of these ingredients or packaging materials increases, we may be unable to pass these costs along to ourcustomers through adjustments to the prices we charge. If we cannot pass on these increases to our customers ona timely basis, they could have a material adverse effect on our results of operations. If we are able to pass thesecosts on to our customers through price increases, the impact those increased prices could have on our volumes isuncertain.
Our beverage and concentrate manufacturing facilities use a significant amount of electricity, natural gasand other energy sources to operate. Fluctuations in the price of fuel and other energy sources for which we havenot locked in long-term pricing would affect our operating costs, which could impact our profitability.
If we are unable to maintain relationships with our raw material suppliers, we may incur higher supplycosts or be unable to deliver products to our customers.
In addition to water, the principal raw materials required to produce our products are PET bottles, caps andpreforms, aluminum cans and ends, labels, cartons and trays, concentrates and sweeteners.
We typically enter into annual supply arrangements rather than long-term contracts with our suppliers,meaning that our suppliers are obligated to continue to supply us with materials for one-year periods, at the endof which we must either renegotiate the contracts with our incumbent suppliers or find alternative sources forsupply. With respect to some of our key packaging supplies, such as aluminum cans and ends, and some of ourkey ingredients, such as artificial sweeteners, we have entered into long-term supply agreements, the remainingterms of which range from 1 to 3 years, and therefore we are assured of a supply of those key packaging suppliesand ingredients for a longer period of time. CCS supplies aluminum cans and ends under a contract expiring onDecember 31, 2011. The contract provides that CCS will supply our entire aluminum can and end requirementsworldwide, subject to certain exceptions. In 2007 and through the second quarter of 2008, the price paid foraluminum increased significantly to reflect world pricing, but the price fell significantly in the third quarter of2008. As with our annual supply contracts, we must either renegotiate these long-term supply agreements withthe incumbent suppliers when they expire or find alternative sources for supply.
We rely upon our ongoing relationships with our key suppliers to support our operations. There can be noassurance that we will be able to either renegotiate contracts with these suppliers when they expire or,alternatively, if we are unable to renegotiate contracts with our key suppliers, there can be no assurance that wecould replace them. We could also incur higher ingredient and packaging supply costs in renegotiating contractswith existing suppliers or replacing those suppliers, or we could experience temporary disruptions in our abilityto deliver products to our customers, either of which could have a material adverse effect on our results ofoperations.
13

In addition, the supply of specific ingredient and packaging materials could be adversely affected by manyfactors, including industry consolidation, energy shortages, governmental controls, labor disputes, naturaldisasters, transportation interruption, political instability, acts of war or terrorism and other factors.
Changes in future business conditions could cause business investments and/or recorded goodwill orindefinite life intangible assets to become impaired, resulting in substantial losses and write-downs thatwould reduce our results of operations.
As part of our overall strategy, we will, from time to time, make investments in other businesses. Theseinvestments are made upon careful target analysis and due diligence procedures designed to achieve a desiredreturn or strategic objective. These procedures often involve certain assumptions and judgment in determiningacquisition price. After acquisition, unforeseen issues could arise that adversely affect anticipated returns or thatare otherwise not recoverable as an adjustment to the purchase price. Even after careful integration efforts, actualoperating results may vary significantly from initial estimates.
Goodwill accounted for approximately $27.0 million of our recorded total assets as of December 27, 2008.We evaluate the recoverability of recorded goodwill amounts annually, or when evidence of potential impairmentexists. The annual impairment test is based on several factors requiring judgment and certain underlyingassumptions. Our only intangible asset with an indefinite life relates to the 2001 acquisition of intellectualproperty from Royal Crown Company, Inc. including the right to manufacture our concentrates, with all relatedinventions, processes, technologies, technical and manufacturing information, know-how and the use of theRoyal Crown brand outside of North America and Mexico (the “Rights”). This asset has a net book value of$45.0 million as more fully described in Note 2 to the Financial Statements.
Principally, a decrease in expected operating segment cash flows, changes in market conditions, loss of keycustomers and a change in our imputed cost of capital may indicate potential impairment of recorded goodwill orthe Rights. For additional information on accounting policies we have in place for goodwill impairment, see ourdiscussion under “Critical Accounting Policies and Estimates” in “Item 7. Management’s Discussion andAnalysis of Financial Condition and Results of Operations” of this Annual Report on Form 10-K and Note 1:Significant Accounting Policies in the Notes.
If we fail to manage our operations successfully, our business and financial results may be materially andadversely affected.
In recent years, we have grown our business and beverage offerings primarily through the acquisition ofother companies, new product lines and growth with key customers. We believe that opportunities exist toincrease sales of beverages in our markets by leveraging existing customer relationships, obtaining newcustomers, exploring new channels of distribution and introducing new products. To succeed with this strategy,we must identify appropriate acquisition or strategic alliance candidates and or product lines. The success of thisstrategy also depends on our ability to manage and integrate acquisitions and alliances at a pace consistent withthe growth of our business. If attractive acquisition opportunities are not available, we may not continue toacquire businesses and product lines. Furthermore, the businesses or product lines that we acquire or align withmay not be integrated successfully into our business or prove profitable. In addition to the foregoing factors, ourability to expand our business in foreign countries is also dependent on, and may be limited by, our ability tocomply with the laws of the various jurisdictions in which we may operate, as well as changes in localgovernment regulations and policies in such jurisdictions.
If we fail to manage the geographic allocation of production capacity surrounding customer demand inNorth America, we may lose certain customer product volume or have to utilize co-packers to fulfil our customercapacity obligations, either of which could negatively impact our financial results.
14
We may not fully realize the expected cost savings and/or operating efficiencies from our restructuringactivities.
During the last three years we have implemented, and plan to continue to implement, restructuring activitiesto support the implementation of key strategic initiatives designed to achieve long-term sustainable growth.These activities are intended to maximize our operating effectiveness and efficiency and to reduce our costs. Wecannot be assured that we will achieve or sustain the targeted benefits under these programs or that the benefits,even if achieved, will be adequate to meet our long-term growth expectations. In addition, the implementation ofkey elements of these activities, such as employee job reductions and plant closures, may have an adverse impacton our business, particularly in the near-term.
Substantial disruption to production at our beverage concentrates or other manufacturing facilities couldoccur.
A disruption in production at our beverage concentrates manufacturing facility, which manufactures almostall of our concentrates, could have a material adverse effect on our business. In addition, a disruption could occurat any of our other facilities or those of our suppliers, bottlers or distributors. The disruption could occur formany reasons, including fire, natural disasters, weather, manufacturing problems, disease, strikes, transportationinterruption, government regulation or terrorism. Alternative facilities with sufficient capacity or capabilitiesmay not be available, may cost substantially more or may take a significant time to start production, each ofwhich could negatively affect our business and financial performance.
Our success depends, in part, on our intellectual property, which we may be unable to protect.
We possess certain intellectual property that is important to our business. This intellectual property includestrade secrets, in the form of the concentrate formulas for most of the beverages that we produce, and trademarksfor the names of the beverages that we sell. While we own certain of the trademarks used to identify ourbeverages, other trademarks are used through licenses from third parties or by permission from our retailer brandcustomers. Our success depends, in part, on our ability to protect our intellectual property.
To protect this intellectual property, we rely principally on registration of trademarks, contractualresponsibilities and restrictions in agreements (such as indemnification, nondisclosure and confidentialityagreements) with employees, consultants and customers, and on common law and statutory protections affordedto trademarks, trade secrets and proprietary “know-how.” In addition, we vigorously protect our intellectualproperty against infringements using any and all legal remedies available. Notwithstanding our efforts, we maynot be successful in protecting our intellectual property for a number of reasons, including:
• our competitors may independently develop intellectual property that is similar to or better than ours;
• employees, consultants or customers may not abide by their contractual agreements and the cost ofenforcing those agreements may be prohibitive, or those agreements may prove to be unenforceable ormore limited than anticipated;
• foreign intellectual property laws may not adequately protect our intellectual property rights; and
• our intellectual property rights may be successfully challenged, invalidated or circumvented.
If we are unable to protect our intellectual property, our competitive position would weaken and we couldface significant expense to protect or enforce our intellectual property rights. At December 27, 2008, we had$45.0 million of rights and $11.6 million of trademarks recorded as intangible assets.
Occasionally, third parties may assert that we are, or may be, infringing on or misappropriating theirintellectual property rights. In these cases, we intend to defend against claims or negotiate licenses when weconsider these actions appropriate. Intellectual property cases are uncertain and involve complex legal and
15

factual questions. If we become involved in this type of litigation, it could consume significant resources anddivert our attention from business operations.
If we are found to infringe on the intellectual property rights of others, we could incur significant damages,be enjoined from continuing to manufacture, market or use the affected product, or be required to obtain a licenseto continue manufacturing or using the affected product. A license could be very expensive to obtain or may notbe available at all. Similarly, changing products or processes to avoid infringing the rights of others may becostly or impracticable.
Our products may not meet health and safety standards or could become contaminated and we could beliable for injury, illness or death caused by consumption of our products.
We have adopted various quality, environmental, health and safety standards. However, our products maystill not meet these standards or could otherwise become contaminated. A failure to meet these standards orcontamination could occur in our operations or those of our bottlers, distributors or suppliers. This could result inexpensive production interruptions, recalls and liability claims. We may be liable to our customers if theconsumption of any of our products causes injury, illness or death. Moreover, negative publicity could begenerated from false, unfounded or nominal liability claims or limited recalls. Any of these failures oroccurrences could have a material adverse effect on our results of operations or cash flows.
Litigation or legal proceedings could expose us to significant liabilities and damage our reputation.
We are party to various litigation claims and legal proceedings. We evaluate these claims and proceedingsto assess the likelihood of unfavorable outcomes and estimate, if possible, the amount of potential losses. Wemay establish a reserve as appropriate based upon assessments and estimates in accordance with our accountingpolicies. We base our assessments, estimates and disclosures on the information available to us at the time andrely on legal and management judgment. Actual outcomes or losses may differ materially from assessments andestimates. Actual settlements, judgments or resolutions of these claims or proceedings may negatively affect ourbusiness and financial performance. For more information, see “Business—Legal Proceedings.”
Changes in the legal and regulatory environment in the jurisdictions in which we operate could increaseour costs or reduce our revenues.
As a producer of beverages, we must comply with various federal, state, provincial, local and foreign lawsrelating to production, packaging, quality, labeling and distribution, including, in the U.S., those of the federalFood, Drug and Cosmetic Act, the Fair Packaging and Labeling Act, the Federal Trade Commission Act, theNutrition Labeling and Education Act and California Proposition 65. We are also subject to various federal, state,provincial, local and foreign environmental laws and workplace regulations. These laws and regulations include,in the U.S., the Occupational Safety and Health Act, the Unfair Labor Standards Act, the Clean Air Act, theClean Water Act, the Comprehensive Environmental Response, Compensation, and Liability Act, the ResourceConservation and Recovery Act, the Federal Motor Carrier Safety Act, laws governing equal employmentopportunity, customs and foreign trade laws and regulations, laws relating to the maintenance of fuel storagetanks, laws relating to water consumption and treatment, and various other federal statutes and regulations. Theselaws and regulations may change as a result of political, economic, or social events. Such regulatory changesmay include changes in food and drug laws, laws related to advertising, accounting standards, taxationrequirements, competition laws and environmental laws, including laws relating to the regulation of water rightsand treatment. Changes in laws, regulations or government policy and related interpretations may alter theenvironment in which we do business, which may impact our results or increase our costs or liabilities.
16
We are not in compliance with the requirements of the Ontario Environmental Protection Act (“OEPA”)and, if the Ontario government seeks to enforce those requirements or implements modifications to them,we could be adversely affected.
Certain regulations under the OEPA provide that a minimum percentage of a bottler’s soft drink sales withinspecified areas in Ontario must be made in refillable containers. The penalty for non-compliance is a fine of$50,000 per day beginning when the first offense occurs and continuing until the first conviction, and thenincreasing to $100,000 per day for each subsequent conviction. These fines may be increased to equal the amountof monetary benefit acquired by the offender as a result of the commission of the offense. We, and we believeother industry participants, are currently not in compliance with the requirements of the OEPA. Ontario is notenforcing the OEPA at this time, but if it chose to enforce the OEPA in the future, we could incur fines fornon-compliance and the possible prohibition of sales of soft drinks in non-refillable containers in Ontario.
We estimate that approximately 4% of our sales would be affected by the possible limitation on sales of softdrinks in non-refillable containers in Ontario if the Ontario Ministry of the Environment initiated an action toenforce the provisions of the OEPA against us.
In April 2003, the Ontario Ministry of the Environment proposed to revoke these regulations in favor of newmechanisms under the Ontario Waste Diversion Act to enhance diversion from disposal of CSD containers. OnDecember 22, 2003, the Ontario provincial government approved the implementation of the Blue Box Programplan under the Ministry of Environment Waste Diversion Act. The Program requires those parties who are brandowners or licensees of rights to brands which are manufactured, packaged or distributed for sale in Ontario tocontribute to the net cost of the Blue Box Program. We generally manufacture, package and distribute productsfor and on behalf of third party customers. Therefore, we do not believe that we will be responsible for directcosts of the Program. However, our customers may attempt to pass these costs, or a portion of them, on to us. Wedo not believe that the costs for which we may ultimately be responsible under this Program will have a materialadverse effect on our results of operations; however, we cannot guarantee this outcome. The Blue Box Programdoes not revoke any of the regulations mentioned above under the OEPA regarding refillable containers,although the industry anticipates that they will be reversed in the future.
Adverse weather conditions could reduce the demand for our products.
The sales of our products are influenced to some extent by weather conditions in the markets in which weoperate. Unusually cold or rainy weather during the summer months may reduce the demand for our products andcontribute to lower revenues, which could negatively impact our profitability.
Global or regional catastrophic events could impact our operations and financial results.
Our business can be affected by large-scale terrorist acts, especially those directed against the United Statesor other major industrialized countries, major natural disasters, or widespread outbreaks of infectious diseasessuch as avian influenza or severe acute respiratory syndrome. Such events could impair our ability to manage ourbusiness could disrupt our supply of raw materials, and could impact production, transportation and delivery ofproducts. In addition, such events could cause disruption of regional or global economic activity, which canaffect consumers’ purchasing power in the affected areas and, therefore, reduce demand for our products.
Recent changes in senior management, and our continued efforts to build our management teams, maydivert attention and resources from the core activities of our business and may adversely affect ourrelationships with customers, suppliers and other constituencies.
We have experienced changes in senior management. In March 2008, David T. Gibbons, a member of ourBoard, assumed the role of Interim Chief Executive Officer upon the departure of our former Chief ExecutiveOfficer. In February 2009, Jerry Fowden, who was previously President of our international segments andInterim President, North America, was appointed Chief Executive Officer. Transitioning to a permanent Chief
17

Executive Officer has taken, and may continue to take, significant time and resources. We also plan to continueto invest time and resources in building our management teams. Our long-term success will depend on our abilityto recruit and retain capable and talented people, and any failure to do so could have a material adverse effect onour future operating results and financial condition. In addition, if management changes negatively impact ourrelationships with customers, suppliers and other constituencies, it could have a material adverse effect on ourfuture operating results and financial condition.
Our stock price may be volatile.
Our common stock is traded on the New York Stock Exchange (the “NYSE”) and Toronto Stock Exchange(“TSX”). The market price of our common stock has fluctuated substantially in the past and could fluctuatesubstantially in the future, based on a variety of factors, including future announcements covering us or our keycustomers or competitors, government regulations, litigation, changes in earnings estimates by analysts,fluctuations in quarterly operating results or general conditions in our industry. Furthermore, stock prices formany companies fluctuate widely for reasons that may be unrelated to their operating results. Those fluctuationsand general economic, political and market conditions, such as recessions or international currency fluctuationsand demand for our services, may adversely affect the market price of our common stock.
Failure to maintain our stock exchange listings would adversely affect the trading price and liquidity ofour common stock.
On November 5, 2008, the NYSE notified us that we are not in compliance with the NYSE’s continuedlisting standards because the minimum average closing price of our common shares was under $1.00 over aconsecutive 30 trading-day period. Under NYSE continued listing standards in effect at that time, we had sixmonths from the date of the notice to cure the deficiency (the “Cure Period”). On February 26, 2009, the NYSEtemporarily suspended its $1.00 minimum share price continued listing standard until June 30, 2009. If we havenot cured the deficiency by that time, we will receive the remaining balance of the Cure Period (untilSeptember 6, 2009) or if we determine that we will cure the deficiency by taking action that will requireshareholder approval, we have until our 2010 annual shareholder meeting to correct the deficiency. If we are notable to maintain compliance with the listing requirements of the NYSE, our shares may be subject to removalfrom listing on the NYSE. Trading in our common stock after a delisting, if any, would likely be conducted in theover-the-counter markets in the Over-The-Counter Bulletin Board or the “pink sheets” and could also be subjectto additional restrictions. As a consequence of a delisting, our shareholders would find it more difficult to disposeof, or to obtain accurate quotations as to the market value of, our common shares. In addition, a delisting wouldmake our common stock substantially less attractive as collateral for margin and purpose loans, for investment byfinancial institutions under their internal policies or state investment laws, or as consideration in future capitalraising.
We may not be able to renew collective bargaining agreements on satisfactory terms, or we couldexperience strikes.
As of December 27, 2008, 847 of our employees were covered by collective bargaining agreements. Theseagreements typically expire every three to four years at various dates. We may not be able to renew our collectivebargaining agreements on satisfactory terms or at all. This could result in strikes or work stoppages, which couldimpair our ability to manufacture and distribute our products and result in a substantial loss of sales. The terms ofexisting or renewed agreements could also significantly increase our costs or negatively affect our ability toincrease operational efficiency.
We depend on key information systems and third-party service providers.
We depend on key information systems to accurately and efficiently transact our business, provide information tomanagement and prepare financial reports. We rely on third-party providers for the majority of our keyinformation systems and business processing services, including hosting our primary data center. These systems
18

and services are vulnerable to interruptions or other failures resulting from, among other things, natural disasters,terrorist attacks, software, equipment or telecommunications failures, processing errors, computer viruses,hackers, other security issues or supplier defaults. Security, backup and disaster recovery measures may not beadequate or implemented properly to avoid such disruptions or failures. Any disruption or failure of thesesystems or services could cause substantial errors, processing inefficiencies, security breaches, inability to usethe systems or process transactions, loss of customers or other business disruptions, all of which could negativelyaffect our business and financial performance.
We also face other risks that could adversely affect our business, results of operations or financialcondition, which include:
• any requirement to restate financial results in the event of inappropriate application of accountingprinciples;
• any event that could damage our reputation;
• failure of our processes to prevent and detect unethical conduct of employees;
• a significant failure of internal controls over financial reporting
• failure of our prevention and control systems related to employee compliance with internal policies andregulatory requirements; and
• failure of corporate governance policies and procedures.
ITEM 1B. UNRESOLVED STAFF COMMENTS
None.
ITEM 2. PROPERTIES
As of the end of 2008, we operate fourteen beverage production facilities in North America, ten of which weowned and four of which we leased. We also operate a global concentrate manufacturing facility in Columbus,Georgia, which we own. In the United Kingdom, we operate four beverage production facilities, all of which weown. In Mexico, we operate two beverage production facilities, one of which we own and one of which we lease.
Total square footage of our beverage production facilities is approximately 2.1 million square feet in theU.S.; 0.9 million square feet in Canada; 0.9 million square feet in the United Kingdom; and 0.3 million squarefeet in Mexico. This square footage does not include twenty-two separate leased offsite warehouses that comprise1.8 million square feet and four leased office spaces that comprise 0.2 million square feet. Lease terms fornon-owned beverage production facilities expire between 2009 and 2020.
The beverage production facilities and square footage amounts noted above do not include vacant orunderutilized properties such as: the Elizabethtown, Kentucky facility that is listed as of December 27, 2008 asheld for sale (subsequently sold in February 2009), or the leased facility in Wyomissing, Pennsylvania andsubleased office space in Tampa, Florida. Each of these properties was closed or subleased as of December 27,2008.
ITEM 3. LEGAL PROCEEDINGS
In January 2005, we were named as one of many defendants in The Consumers’ Association of Canada andBruce Cran v. Coca-Cola Bottling Ltd. Et al., a class action suit alleging the unauthorized use by the defendantsof container deposits and the imposition of recycling fees on consumers. On June 2, 2006, the British ColumbiaSupreme Court granted the summary trial application, which resulted in the dismissal of the plaintiffs’ action
19

against us and the other defendants. On June 26, 2006, the plaintiffs appealed the dismissal of the action to theBritish Columbia Court of Appeals which was denied, and an appeal to the Supreme Court of Canada wasrejected on December 20, 2007. In February 2005, similar class action claims were filed in a number of otherCanadian provinces. Claims filed in Quebec have since been discontinued, but is unclear how the dismissal of theBritish Columbia case will impact the other cases.
We are subject to various claims and legal proceedings with respect to matters such as governmentalregulations, income taxes, and other actions arising out of the normal course of business. Management believesthat the resolution of these matters will not have a material adverse effect on our financial position or resultsfrom operations.
ITEM 4. SUBMISSION OF MATTERS TO A VOTE OF SECURITY HOLDERS
No matters were submitted to a vote of shareowners during the fourth quarter of 2008.
20

SUPPLEMENTAL ITEM PART I. EXECUTIVE OFFICERS OF THE REGISTRANT
The following is a list of names, ages, offices and backgrounds of all of our executive officers as ofFebruary 28, 2009. Our officers do not serve for a set term.
Office Age
Jerry Fowden . . . . . . . . . . . . . . . . . . Chief Executive Officer 52Juan Figuereo . . . . . . . . . . . . . . . . . Chief Financial Officer 53Michael Creamer . . . . . . . . . . . . . . Vice President—People 52Matthew A. Kane, Jr. . . . . . . . . . . . Vice President, General Counsel and Secretary 50Gregory Leiter . . . . . . . . . . . . . . . . . Senior Vice President, Corporate Controller and Assistant Secretary 51William Reis . . . . . . . . . . . . . . . . . . Senior Vice President, Chief Procurement Officer 53
• Jerry Fowden was appointed Chief Executive Officer in February 2009. Prior to his appointment, heserved as President of Cott’s international segments from April 2008 and Interim President of NorthAmerica from June 2008 to February 2009 and as President of Cott’s U.K. operating segment fromSeptember 2007 to April 2008. He served as Chief Executive Officer of Trader Media Group Ltd., amedia company and as a member of its parent Guardian Media Group plc’s Board of Directors from2005 until 2007. From 2001 until 2004, he served in a variety of roles with ABInBev S.A. Belgium, analcoholic beverage company, including President, European Zone, Western, Central and EasternEurope from 2003 to 2004, Global Chief Operating Officer from 2002 to 2003 and Chief ExecutiveOfficer of Bass Brewers Ltd., a subsidiary of ABInBev S.A. Belgium, from 2001 to 2002.
• Juan Figuereo was appointed Chief Financial Officer in March 2007. Prior to joining Cott, he served asVice President, Mergers and Acquisitions for Wal-Mart International from July 2003 to March 2007.Prior to July 2003, he spent 15 years with PepsiCo in a variety of international finance and generalmanagement roles, first within the Pepsi-Cola organization and then in the Frito Lay business. He heldChief Financial Officer roles for Frito-Lay in Southern Europe, and for Pepsi-Cola Latin America, aswell as a stint as seconded CFO of the largest Pepsi bottler in Brazil.
• Michael Creamer was appointed Vice President of People for International in April 2007 and waspromoted to Vice President of People for Cott in August 2008. Prior to joining Cott, Mr. Creamer wasSenior Director of Human Resource Operations and International for Avanade Corporation, a global ITconsultancy formed as a joint venture between Accenture and Microsoft Corporation, from 2005 to2007. From 1990 to 2004, Mr. Creamer held several positions with Microsoft, including senior globalhuman resources positions.
• Matthew A. Kane was appointed as Vice President, General Counsel and Secretary of Cott inSeptember 2007. Prior to his appointment, he served as Vice President of Law of Cott Beverages, Inc.,a wholly-owned U.S. subsidiary of Cott, from April 2004 until his appointment. From January 2003 toApril 2004, he was Chief Counsel, Sales of PepsiCo Beverages and Foods. From 1993 to 2003, heserved as Associate General Counsel of Tropicana Products Inc.
• Gregory Leiter was appointed Vice President, Corporate Controller and Assistant Secretary of Cott inNovember 2007 and appointed Senior Vice President and Controller in April 2008. Prior to joiningCott, he served from October 2006 to October 2007 as Practice Manager—Governance, Risk &Compliance with the international software firm SAP America. From January 2003 to September 2006,he held two positions with Graham Packaging Company, an international manufacturer of customblow-molded plastic containers. From February 2006 to September 2006, he served as GrahamPackaging’s Vice President—Global Business Process and from January 2003 to February 2006, heserved as Director of Internal Audit.
• William Reis was appointed Senior Vice President, Chief Procurement Officer in March 2007. Prior tojoining Cott, he served from February 2004 to February 2007 as Senior Vice President and ChiefProcurement Officer for Revlon. From February 2001 to February 2004, he served as Vice President ofGlobal Procurement for Goldman Sachs.
21

PART II
ITEM 5. MARKET FOR THE REGISTRANT’S COMMON EQUITY AND RELATEDSHAREOWNERMATTERS
Our common shares are listed on the TSX under the ticker symbol “BCB,” and on the NYSE under theticker symbol “COT.”
The tables below show the high and low reported per share sales prices of common shares on the TSX (inCanadian dollars) and the NYSE (in U.S. dollars) for the indicated periods for the years ended December 27,2008 and December 29, 2007.
Toronto Stock Exchange (C$)
2008 2007
High Low High Low
January 1—March 31 . . . . . . . . . . . . . . . . . . . . . . . . . $7.11 $1.81 $17.80 $15.23April 1—June 30 . . . . . . . . . . . . . . . . . . . . . . . . . . . . . $3.61 $2.39 $19.70 $14.57July 1—September 30 . . . . . . . . . . . . . . . . . . . . . . . . . $3.51 $1.12 $16.63 $ 7.98October 1—December 31 . . . . . . . . . . . . . . . . . . . . . . $1.58 $0.80 $ 8.19 $ 5.14
New York Stock Exchange (U.S.$)
2008 2007
High Low High Low
January 1—March 31 . . . . . . . . . . . . . . . . . . . . . . . . . $7.03 $1.77 $15.22 $13.17April 1—June 30 . . . . . . . . . . . . . . . . . . . . . . . . . . . . . $3.55 $2.38 $17.33 $12.64July 1—September 30 . . . . . . . . . . . . . . . . . . . . . . . . . $3.49 $1.06 $16.12 $ 7.39October 1—December 31 . . . . . . . . . . . . . . . . . . . . . . $1.30 $0.66 $ 8.36 $ 5.40
As of February 28, 2009, we had 727 shareowners of record. This number was determined from recordsmaintained by our transfer agent and it does not include beneficial owners of securities whose securities are heldin the names of various dealers or clearing agencies. The closing sale price of our common shares onFebruary 28, 2009 was C$1.02 on the TSX and $0.78 on the NYSE.
We have not paid cash dividends since June 1998. There are certain restrictions on the payment of dividendsunder our ABL facility and the indenture governing the Notes. The ABL facility and the indenture governing theNotes are discussed in Management’s Discussion and Analysis of Financial Condition and Results of Operationsfrom page 38 to page 40.
If we pay dividends to shareowners, those dividends will generally be subject to Canadian withholding tax.Under current Canadian tax law, dividends paid by a Canadian corporation to a nonresident shareowner aregenerally subject to Canadian withholding tax at a 25% rate. Under the current tax treaty between Canada and theU.S., U.S. residents who are entitled to treaty benefits are generally eligible for a reduction in this withholdingtax rate to 15% (and to 5% for a shareowner that is a corporation and is the beneficial owner of at least 10% ofour voting stock). Accordingly, under current tax law, our U.S. resident shareowners who are entitled to treatybenefits will generally be subject to a Canadian withholding tax at a 15% rate on dividends paid by us, providedthat they have complied with applicable procedural requirements to claim the benefit of the reduced rate underthe tax treaty. The fifth protocol to the tax treaty between Canada and the U.S. places additional restrictions onthe ability of U.S. residents to claim these reduced rate benefits. U.S. residents generally will be entitled on theirU.S. federal income tax returns to claim a foreign tax credit, or a deduction, for Canadian withholding tax thatapplies to them, subject to certain applicable limitations. U.S. investors should consult their tax advisors withrespect to the tax consequences and requirements applicable to them, based on their individual circumstances.
22

For information on securities authorized for issuance under our equity compensation plans, see “Item 12—Security Ownership of Certain Beneficial Owners and Management and Related Shareowner Matters.”
During the fiscal year ended December 27, 2008, no equity securities of the Company were sold by theCompany that were not registered under the Securities Act of 1933, as amended.
Calculation of aggregate market value of non-affiliate shares
For purposes of calculating the aggregate market value of common shares held by non-affiliates as shownon the cover page of this report, it was assumed that all of the outstanding shares were held by non-affiliatesexcept for outstanding shares held or controlled by our directors and executive officers. This should not bedeemed to constitute an admission that any of these persons are, in fact, affiliates of us, or that there are not otherpersons who may be deemed to be affiliates. For further information concerning shareholdings of officers,directors and principal stockholders see Item 12, Security Ownership of Certain Beneficial Owners andManagement and Related Shareowner Matters.
Shareowner return performance graph
The following graph shows changes over our past five fiscal years in the value of C$100, assumingreinvestment of dividends, invested in: (i) our common shares; (ii) the Toronto Stock Exchange’s S&P/TSXComposite Index; and (iii) a peer group of publicly-traded companies in the bottling industry comprised of Coca-Cola Enterprises Inc., Coca-Cola Bottling Co. Consolidated, National Beverage Corp., Pepsi Bottling Group Inc.and PepsiAmericas Inc. The closing price of Cott’s common shares as of December 27, 2008 on the TSX wasC$1.27 and on the NYSE was $1.20. The following table is in Canadian dollars.
COMPARE 5-YEAR CUMULATIVE TOTAL RETURNAMONG COTT CORPORATION,
TSX/S&P COMPOSITE INDEX AND PEER GROUP INDEX
Can
adia
n D
olla
rs
Cott Corporation TSX/S&P Composite Index Peer Group
12/27/081/03/04 1/01/05 12/31/05 12/30/06 12/29/070.00
50.00
100.00
150.00
200.00
DateJanuary 3,
2004January 1,
2005December 31,
2005December 30,
2006December 29,
2007December 27,
2008
Cott Common Shares . . . . . . . . . . 100.00 81.47 47.30 45.81 18.06 3.49TSX/S&P Composite Index . . . . 100.00 113.41 140.63 164.85 180.83 112.14Peer Group . . . . . . . . . . . . . . . . . . 100.00 105.95 106.43 114.43 152.86 75.35
23

ITEM 6. SELECTED FINANCIAL DATA
The following selected financial data reflects the results of operations. This information should be read inconjunction with, and is qualified by reference to “Management’s Discussion and Analysis of FinancialCondition and Results of Operations” and the consolidated financial statements and notes thereto includedelsewhere in this report. The financial information presented may not be indicative of future performance.
(In millions of U.S. dollars, except per share amounts)December 27,
2008December 29,
2007 1December 30,
2006 2December 31,
2005 3January 1,2005 4
(52 weeks) (52 weeks) (52 weeks) (52 weeks) (52 weeks)Revenue . . . . . . . . . . . . . . . . . . . . . . . . . . . . . . . . $1,648.1 $1,776.4 $1,771.8 $1,755.3 $1,646.3Cost of sales . . . . . . . . . . . . . . . . . . . . . . . . . . . . . 1,467.1 1,578.0 1,554.9 1,505.8 1,362.6
Gross Profit . . . . . . . . . . . . . . . . . . . . . . . . . . . . . 181.0 198.4 216.9 249.5 283.7Selling, general and administrative expenses . . . 179.8 161.9 176.1 138.6 138.1Loss (gain) on disposal of property, plant andequipment . . . . . . . . . . . . . . . . . . . . . . . . . . . . . 1.3 0.2 — 1.5 (0.3)
Restructuring, asset and goodwill impairmentsand other charges:Restructuring . . . . . . . . . . . . . . . . . . . . . . . . 6.7 24.3 20.5 3.2 —Goodwill impairments . . . . . . . . . . . . . . . . . 69.2 55.8 — 5.9 —Asset impairments . . . . . . . . . . . . . . . . . . . . 37.0 10.7 15.4 27.6 0.9Other . . . . . . . . . . . . . . . . . . . . . . . . . . . . . . . — — 2.6 0.8 —
Operating (loss) income . . . . . . . . . . . . . . . . . . . (113.0) (54.5) 2.3 71.9 145.0Other (income) expense, net . . . . . . . . . . . . . . . . (4.7) (4.7) 0.1 (0.7) 0.2Interest expense, net . . . . . . . . . . . . . . . . . . . . . . . 32.3 32.8 32.2 28.8 26.0Minority interest . . . . . . . . . . . . . . . . . . . . . . . . . . 1.7 2.7 3.8 4.5 4.0
(Loss) income before income taxes . . . . . . . . . . (142.3) (85.3) (33.8) 39.3 114.8Income tax (benefit) expense . . . . . . . . . . . . . . . . (19.5) (13.9) (16.3) 14.7 35.8Equity loss . . . . . . . . . . . . . . . . . . . . . . . . . . . . . . — — — — 0.7
Net (loss) income . . . . . . . . . . . . . . . . . . . . . . . . . $ (122.8) $ (71.4) $ (17.5) $ 24.6 $ 78.3
(Loss) Income per common shareBasic . . . . . . . . . . . . . . . . . . . . . . . . . . . . . . . $ (1.73) $ (0.99) $ (0.24) $ 0.34 $ 1.10Diluted . . . . . . . . . . . . . . . . . . . . . . . . . . . . . $ (1.73) $ (0.99) $ (0.24) $ 0.34 $ 1.09
Total assets . . . . . . . . . . . . . . . . . . . . . . . . . . . . . . $ 873.1 $1,144.4 $1,140.7 $1,179.1 $1,030.3Short-term borrowings . . . . . . . . . . . . . . . . . . . . . 107.5 137.0 107.7 157.9 71.4Current maturities of long-term debt . . . . . . . . . . 7.6 2.4 2.0 0.8 0.8Long-term debt . . . . . . . . . . . . . . . . . . . . . . . . . . . 294.4 269.0 275.2 272.3 272.5Shareowners’ equity . . . . . . . . . . . . . . . . . . . . . . . 229.2 432.2 488.7 481.9 457.3Cash dividends paid . . . . . . . . . . . . . . . . . . . . . . . — — — — —
1 During the year ended December 29, 2007, we acquired 100% of the business assets of El Riego, a Mexicanwater bottler, for $2.2 million. Effective December 31, 2006, we adopted Financial Accounting StandardsBoard (“FASB”) Interpretation No. 48, “Accounting for Uncertainty for Income Taxes” and recorded an$8.8 million charge to our shareowners equity as of December 29, 2007.
2 There were no acquisitions in the year ended December 30, 2006. During the year we adopted Statement ofFinancial Accounting Standards (“SFAS”) No. 123R, “Share-Based Payments,” using the modifiedprospective approach and therefore have not restated results for prior periods. This change resulted in therecognition of $11.4 million in share-based compensation expense, $8.4 million net of tax or $0.12 per basicand diluted share.
3 During the year we acquired 100% of the shares of Macaw (Holdings) Limited, the parent company ofMacaw (Soft Drinks) Limited (“Macaw Acquisition”).
4 During the year we acquired certain of the assets of The Cardinal Companies of Elizabethtown, LLC andcertain of the assets of Metro Beverage Co.
24

ITEM 7. MANAGEMENT’S DISCUSSION AND ANALYSIS OF FINANCIAL CONDITION ANDRESULTS OF OPERATIONS
Overview
We are one of the world’s largest non-alcoholic beverage companies and the world’s largest retailer brandsoft drink company. Our objective of creating sustainable long-term growth in revenue and profitability ispredicated on working closely with our retailer partners to provide proven profitable products. As a fast followerof innovative products, our goal is to identify which new products are succeeding in the marketplace and developsimilar products to provide our retail partners and their consumers with high quality products at a better value.This objective is increasingly relevant in more difficult economic times.
Sales of our products tend to be seasonal, with the second and third quarters accounting for higher unit salesof our products than the first and fourth quarters. The seasonality of our sales volume, combined with theaccounting for fixed costs such as depreciation, amortization, rent and interest expense, impacts our results on aquarterly basis.
Businesses in our industry operate at low margins. Industry-wide CSD sales have continued to decline andingredient and packaging costs continued to increase during the majority of 2008. Each of these trends adverselyaffected our business in 2008. Notwithstanding the decline in commodity market prices during the latter part of2008, we will continue to focus on containing our costs. Ingredient and packaging costs represent a significantportion of our cost of sales. Most of these costs are subject to global and regional commodity price trends. Ourthree largest commodities are aluminum, PET resin, and corn (which is used to produce HFCS). We attempt tomanage our exposure to fluctuations in ingredient and packaging costs of our products by implementing priceincreases as needed and entering into price control contracts where possible. In 2008, we locked in a majority ofour 2009 HFCS and aluminum requirements, with the remaining forecasted requirements to be purchased at theprevailing 2009 market prices.
On January 27, 2009, we received written notice from Wal-Mart stating that Wal-Mart was exercising itsright to terminate, without cause, the Exclusive Supply Contract, effective on January 28, 2012. Pursuant to theterms of the Exclusive Supply Contract, we are the exclusive supplier to Wal-Mart of retailer brand CSDs in theUnited States. The termination provision of the Exclusive Supply Contract provides for exclusivity to be phasedout over a period of three years following notice of termination. Accordingly, we have the exclusive right tosupply at least two-thirds of Wal-Mart’s total CSD volumes in the United States during the first 12 months of theNotice Period, and we have the exclusive right to supply at least one-third of Wal-Mart’s total CSD volumes inthe United States during the second 12 months of the Notice Period. Notwithstanding the termination of theExclusive Supply Contract, we continue to supply Wal-Mart and its affiliated companies, under annualnon-exclusive supply agreements, with a variety of products in the United States, Canada, United Kingdom andMexico, including CSDs, clear, still and sparkling flavored waters, juice-based products, bottled water, energydrinks and ready-to-drink teas.
At the end of April 2008, Wal-Mart began reducing shelf space in its United States stores dedicated to itsretailer brand CSDs. Our revenue to Wal-Mart declined 15.4% during 2008 as compared to 2007. However, weattribute the decline in revenue in large part to (i) the increased competitive nature of the CSD marketplacearising from national competitors that have expended greater resources for product placement and promotionalsupport and (ii) the continued decline of CSDs in general, rather than the reduction in shelf space.
In addition, a long-term contract with Wal-Mart for the lease and maintenance of vending machines expiredin June 2008 as Wal-Mart implemented a different approach to soft drink vending. That program was designed tosupport Wal-Mart’s brands.
25
Summary financial results
Our net loss in 2008 was $122.8 million or $1.73 per diluted share, compared with our net loss of $71.4million or $0.99 per diluted share in 2007.
The following items of significance impacted our 2008 financial results:
• goodwill impairment of $69.2 million arising from lower anticipated operating cash flows related toour United Kingdom reporting unit;
• asset impairment of $35.4 million for the Rights (which are associated with the rights to manufactureconcentrate formulas, with all the related inventions, processes and technical expertise, recorded as anintangible assets at the cost of acquisition, including the RC brand outside of North America andMexico) arising from the downward trend of estimated concentrate production;
• the highly competitive environment and continued volume decline in all operating segments;
• decline in revenue to Wal-Mart of 15.4% in the U.S. reporting unit;
• executive transition costs of $6.8 million (including $1.9 million of non-cash stock compensationexpense);
• restructuring severance and lease termination costs of $6.7 million in connection with our restructuringinitiatives;
• increased selling, general and administrative costs associated with expiring trademarks, amortization ofsoftware costs, $4.5 million of previously capitalized software costs and bad debt expense;
• decrease in the foreign exchange rate as compared to the U.S. dollar for the Canadian dollar, poundsterling and Mexican peso that resulted in a $27.6 million adverse impact on revenues;
• accelerated depreciation of $1.5 million resulting from Wal-Mart’s decision to remove certain of ourvending machines from Wal-Mart stores along with $0.9 million of asset removal costs; and
• a lower effective income tax rate resulting from a write down of United Kingdom reporting unitgoodwill with no tax relief and a valuation allowance on U.S. and Mexico deferred income tax assets,offset in part by a settlement of certain tax matters under audit.
The following items of significance impacted our 2007 financial results:
• goodwill impairment of $55.8 million arising from lower anticipated operating cash flows related toour U.S. reporting unit;
• asset impairment charges of $10.7 million primarily related to the disposal of a water productionfacility in the Canada reporting unit and the discontinuance of certain hot-filled production assets in theU.S. reporting unit; and
• severance costs of $24.3 million associated with the North American Plan.
The following items of significance impacted our 2006 financial results:
• asset impairment charges of $15.4 million primarily related the closure of the Elizabethtown andWyomissing facilities;
• severance costs of $20.5 million associated with the North American Plan; and
• other costs of $2.6 million related to legal and consulting fees for the U.K. Competition Commissionreview of the Macaw Acquisition.
Critical accounting policies
Our critical accounting policies require management to make estimates and assumptions that affect thereported amounts in the consolidated financial statements and the accompanying notes. These estimates are based
26

on historical experience, the advice of external experts or on other assumptions management believes to bereasonable. Where actual amounts differ from estimates, revisions are included in the results of the period inwhich actuals become known. Historically, differences between estimates and actuals have not had a significantimpact on our consolidated financial statements.
Critical accounting policies and estimates used to prepare the financial statements are discussed with ourAudit Committee as they are implemented and on an annual basis and include the following:
Impairment testing of goodwill
With the implementation of Statement of Financial Accounting Standard (“SFAS”) No. 142 (“SFAS 142”)in 2002, goodwill and intangible assets with an indefinite life are no longer amortized, but instead are tested atleast annually for impairment in the fourth quarter or more frequently if we determine a triggering event hasoccurred during the year. Any impairment loss is recognized in income. We have goodwill of $27.0 million andan indefinite life intangible asset of $45.0 million on our balance sheet at December 27, 2008 after recording a$69.2 million goodwill impairment and a $35.4 million intangible asset impairment in 2008.
In accordance with SFAS 142, we evaluate goodwill for impairment on a reporting unit basis. A reportingunit or components of reporting units are defined for which discrete financial information is available. Theevaluation of goodwill for each reporting unit is based upon the following approach. We compare the fair valueof a reporting unit to its carrying amount. Where the carrying amount is greater than the fair value, the impliedfair value of the reporting unit goodwill is determined by allocating the fair value of the reporting unit to all theassets and liabilities of the reporting unit with any of the remainder being allocated to goodwill. The implied fairvalue of the reporting unit goodwill is then compared to the carrying amount of that goodwill to determine theimpairment loss.
We measure the fair value of reporting units using a mix of the income approach (which is based on thediscounted cash flow of the entity) and the public company approach. Because the business is assumed tocontinue in perpetuity, the discounted future cash flow includes a terminal value. The long-term growthassumptions incorporated into the discounted cash flow calculation reflect our long-term view of the market(with estimated revenue changes between -6.0% and 9.0%) and a discount rate of 12.0% based on the weightedaverage cost of capital a market participant would use if evaluating the reporting unit as an investment.
Each year we re-evaluate the assumptions used to reflect changes in the business environment. Based on theevaluation of goodwill performed in 2008, we determined that the fair values of all our reporting units except forthe United Kingdom reporting unit exceeded their carrying amounts and as a result further impairment testingwas not required.
We determined that as of September 27, 2008, our United Kingdom reporting unit’s goodwill was impairedbased on our estimate of its fair value. This impairment analysis was triggered due to declines in our forecasts ofvolumes and the profit margin of products in the United Kingdom, which resulted in lower revenues andoperating income than the forecast used to value this asset in our 2007 impairment analysis. Allocating this fairvalue to the assets and liabilities to the United Kingdom reporting unit resulted in a $69.2 million goodwillimpairment charge in 2008.
Due to the ongoing decline in the CSD markets we determined that as of December 29, 2007 our U.S.reporting unit’s goodwill was impaired based on our estimate of its fair value. Allocating this fair value to theassets and liabilities of the U.S. reporting unit resulted in a $55.0 million goodwill impairment charge in 2008.We also determined that $0.8 million of goodwill related to the Revelstoke, British Columbia operation wasimpaired as a result of the decision to dispose of that operation.
27

Impairment testing of intangible assets with an indefinite life
Our only intangible asset with an indefinite life is the Rights, which relates to the 2001 acquisition ofintellectual property from Royal Crown Company, Inc., including the right to manufacture our concentrates, withall related inventions, processes, technologies, technical and manufacturing information, know-how and the useof the Royal Crown brand outside of North America and Mexico, which has a net book value of $45.0 million asmore fully described in Note 1 and Note 2 to the Financial Statements. Prior to 2001, we paid a volume basedroyalty to the Royal Crown Company for purchase of concentrates. There are no legal, regulatory, contractual,competitive, economic, or other factors that limit the useful life of this intangible. In accordance with SFAS 142and based on the aforementioned factors, the life of the rights is considered to be indefinite and therefore notamortized, and tested annually for impairment. For an intangible asset with an indefinite life, we compare thecarrying amount of the rights to their fair value and where the carrying amount is greater than the fair value, werecognize in income an impairment loss. To determine fair value, we use a relief from royalty method whichcalculates a fair value royalty rate which is applied to a forecast of future volume shipments of concentrate that isused to produce CSDs. The resulting future cash flows are discounted using the same assumptions discussedabove for goodwill. We also evaluate on an annual basis, or more frequently if events or changes incircumstances so require, the fair value of the Rights. As of September 27, 2008, we recorded an assetimpairment related to the Rights of $27.4 million, triggered primarily due to the decline of our North Americacase volume (including reductions in volume with Wal-Mart) and lower anticipated overseas concentrate volumeby our RCI operating segment. We incurred an additional $8.0 million asset impairment as of December 27, 2008to reflect additional anticipated volume declines in our RCI operating segment for a total impairment of $35.4million. Absent any other changes, if our inter-plant concentrate volume declines by 1.0% from our estimatedvolume, the value of our Rights would decline by approximately $1.0 million. If our RCI volume declines by1.0% from our estimated volume, the value of the Rights would decline by approximately $1.0 million. If ourdiscounted borrowing rate increases by 100 basis points, the value of the Rights would decline by approximately$2.0 million.
Other intangible assets
As of December 27, 2008, other intangible assets were $124.6 million, which consisted principally of $87.6million of customer relationships that arise from acquisitions. Customer relationships are amortized on a straight-line basis for the period over which we expect to receive economic benefits. We review the estimated useful lifeof these intangible assets annually, taking into consideration the specific net cash flows related to the intangibleasset, unless a review is required more frequently due to a triggering event such as the loss of a customer. Thepermanent loss or significant decline in sales to any customer included in the intangible asset would result inimpairment in the value of the intangible asset or accelerated amortization and could lead to an impairment offixed assets that were used to service that customer.
Impairment of long-lived assets
We periodically compare the carrying amount of long-lived assets to the estimated undiscounted future cashflows at the lowest level of independent cash flows for the group of long-lived assets and recognize anyimpairment loss in our income statement, taking into consideration the timing of testing and the asset’s remaininguseful life. The expected life and value of these long-lived assets is based on an evaluation of the competitiveenvironment, history and future prospects as appropriate. In 2008, we recorded impairment losses totaling $1.6million for both the Elizabethtown, Kentucky facility and certain hot-filled production assets that areheld-for-sale. In 2007, we recorded impairment losses of $10.7 million relating to long-lived assets of theRevelstoke, British Columbia facility and certain hot-filled equipment at a co-packer that did not operate asplanned.
Inventory costs
Inventories are stated at the lower of cost, determined on the first-in, first-out method, or net realizablevalue. Returnable bottles and plastic shells are valued at the lower of cost, deposit value or net realizable value.Finished goods and work-in-process include the cost of raw materials, direct labor and manufacturing overhead
28

costs. As a result, we use an inventory reserve to adjust our costs down to a net realizable value and to reserve forestimated obsolescence of both raw and finished goods. Our accounting policy for the inventory reserve requiresus to reserve an amount based on the evaluation of the aging of inventory and a detailed analysis of finishedgoods for high-risk customers’.
Income taxes
We account for income taxes under the asset and liability method. Deferred tax assets and liabilities arerecognized based on the differences between the accounting values of assets and liabilities and their related taxbases using currently enacted income tax rates. A valuation allowance is established to reduce deferred incometax assets if, on the basis of available evidence, it is not more likely than not that all or a portion of any deferredtax assets will be realized. If we are unable to generate sufficient future taxable income in certain taxjurisdictions or if there is a material change in the actual effective tax rates or time period within which theunderlying temporary differences become taxable or deductible, we may be required to increase our valuationallowance against our deferred tax assets resulting in an increase in our effective tax rate and an adverse impacton operating results. We classify interest and income tax penalties as income tax expense (benefit).
Effective December 31, 2006, we adopted FASB Interpretation No. 48, “Accounting for Uncertainty inIncome Taxes—an Interpretation of FASB Statement No. 109” (“FIN 48”), which provides specific guidance onthe financial statement recognition, measurement, reporting and disclosure of uncertain tax positions taken orexpected to be taken in a tax return. FIN 48 addresses the determination of whether tax benefits, either permanentor temporary, should be recorded in the financial statements. The Interpretation requires that differences betweenthe amounts recognized prior to the adoption of FIN 48 and the amounts reported after adoption are accountedfor as a cumulative-effect adjustment recorded to the beginning balance of retained earnings and othershareowner equity accounts. As a result of adopting FIN 48 as of the beginning of our 2007 fiscal year, werecognized a $4.2 million decrease to retained earnings and $4.6 million decrease in additional paid-in-capital torecognize the cumulative effect of adoption.
Under FIN 48, we account for uncertain tax positions using a two-step process. The first step is to evaluatethe tax position for recognition by determining if the weight of available evidence indicates that it is more likelythan not that the position will be sustained on audit, including resolution of related appeals or litigationprocesses, if any. The second step requires us to estimate and measure the tax benefit as the largest amount that ismore than 50% likely to be realized upon ultimate settlement. It is inherently difficult and subjective to estimatesuch amounts, as we have to determine the probability of various possible outcomes. We re-evaluate theseuncertain tax positions on a quarterly basis. This evaluation is based on factors including, but not limited to,changes in facts or circumstances, changes in tax law, effectively settled issues under audit, and new auditactivity. Such a change in recognition or measurement would result in the recognition of a tax benefit or anadditional charge to the tax provision.
Pension Plans
On December 31, 2006, we adopted the recognition and disclosure requirements of Statement of FinancialAccounting Standards No. 158, “Employers’ Accounting for Defined Benefit Pension and Other PostretirementPlans, an amendment of FASB Statements No. 87, 88, 106, and 132(R)” (“SFAS 158”). The funded status is thedifference between the fair value of plan assets and the benefit obligation. The adjustment to accumulated othercomprehensive income at adoption represents the net unrecognized actuarial gains or losses and unrecognizedprior service costs. Future actuarial gains or losses that are not recognized as net periodic benefits cost in thesame periods will be recognized as a component of other comprehensive income.
We maintain two defined-benefit plans that cover certain full-time salaried employees and certain otheremployees under a collective bargaining agreement. We record annual amounts relating to these plans based oncalculations specified by GAAP, which include various actuarial assumptions such as discount rates (6.0% to
29

6.4%) and assumed rates of return (6.9% to 7.0%) depending on the pension plan. Material changes in pensioncosts may occur in the future due to changes in these assumptions. Future annual amounts could be impacted bychanges in the discount rate, changes in the expected long-term rate of return, changes in the level ofcontributions to the plans and other factors.
The discount rate is based on a model portfolio of AA rated bonds with a maturity matched to the estimatedpayouts of future pension benefits. The expected return on plan assets is based on our expectation of thelong-term rates of return on each asset class based on the current asset mix of the funds, considering the historicalreturns earned on the type of assets in the funds, plus an assumption of future inflation. The current investmentpolicy target asset allocation differs between our two plans, but it is between 50.0% to 60.0% for equities and40.0% to 50.0% for bonds. The current inflation assumption is 3.1%. We review our actuarial assumptions on anannual basis and make modifications to the assumptions based on current rates and trends when appropriate. Theeffects of the modifications are amortized over future periods.
Recent Accounting Pronouncements—see Note 1 of the consolidated financial statements.
Non-GAAP Measures
In this report, we present certain information regarding changes in our revenue excluding the impact offoreign exchange. We believe that this is a useful financial measure for investors in evaluating our operatingperformance for the periods presented, as when read in conjunction with our changes in revenue on a U.S. GAAPbasis, it presents a useful tool to evaluate our ongoing operations and provides investors with an opportunity toevaluate our management of assets held from period to period. In addition, these adjusted amounts are one of thefactors we use in internal evaluations of the overall performance of our business. This information, however, isnot a measure of financial performance under U.S. GAAP and should not be considered a substitute for changesin revenue as determined in accordance with U.S. GAAP.
The following table summarizes our Consolidated Statements of Operations as a percentage ofrevenue for 2008, 2007 and 2006:
2008 2007 2006
(In millions of U.S. dollars) DollarsPercent ofRevenue Dollars
Percent ofRevenue Dollars
Percent ofRevenue
Revenue . . . . . . . . . . . . . . . . . . . . . . . . . . . 1,648.1 100.0% 1,776.4 100.0% 1,771.8 100.0%Cost of sales . . . . . . . . . . . . . . . . . . . . . . . . 1,467.1 89.0% 1,578.0 88.8% 1,554.9 87.8%
Gross profit . . . . . . . . . . . . . . . . . . . . . . . . 181.0 11.0% 198.4 11.2% 216.9 12.2%Selling, general, and administrativeexpenses . . . . . . . . . . . . . . . . . . . . . . . . . 179.8 10.9% 161.9 9.1% 176.1 9.9%
Loss on disposal of property, plant andequipment . . . . . . . . . . . . . . . . . . . . . . . 1.3 0.1% 0.2 0.0% — 0.0%
Goodwill impairments . . . . . . . . . . . . . . . . 69.2 4.2% 55.8 3.2% — 0.0%Restructuring and other . . . . . . . . . . . . . . . 6.7 0.4% 24.3 1.4% 23.1 1.3%Asset impairment . . . . . . . . . . . . . . . . . . . . 37.0 2.2% 10.7 0.6% 15.4 0.9%
Operating (loss) income . . . . . . . . . . . . . . (113.0) -6.8% (54.5) -3.1% 2.3 0.1%Other (income) expense, net . . . . . . . . . . . (4.7) -0.3% (4.7) -0.3% 0.1 0.0%Interest expense, net . . . . . . . . . . . . . . . . . 32.3 2.0% 32.8 1.8% 32.2 1.8%Minority interest . . . . . . . . . . . . . . . . . . . . 1.7 0.1% 2.7 0.2% 3.8 0.2%
(Loss) income before income taxes . . . . . . (142.3) -8.6% (85.3) -4.8% (33.8) -1.9%Income tax benefit . . . . . . . . . . . . . . . . . . . (19.5) -1.2% (13.9) -0.8% (16.3) -0.9%
Net loss . . . . . . . . . . . . . . . . . . . . . . . . . . . (122.8) -7.4% (71.4) -4.0% (17.5) -1.0%
Depreciation & amortization . . . . . . . . . . . 80.7 4.9% 71.7 4.0% 86.8 4.9%
30

The following table summarizes our revenue, operating (loss) income by operating segment for 2008,2007 and 2006:
(In millions of U.S. Dollars) 2008 2007 2006
RevenueNorth America . . . . . . . . . . . . . . . . . . . . . . . . . . . . . . . . . . . . . . . . . $1,178.0 $1,274.9 $1,344.7United Kingdom . . . . . . . . . . . . . . . . . . . . . . . . . . . . . . . . . . . . . . . 385.3 405.3 341.6Mexico . . . . . . . . . . . . . . . . . . . . . . . . . . . . . . . . . . . . . . . . . . . . . . . 61.9 69.4 62.2RCI . . . . . . . . . . . . . . . . . . . . . . . . . . . . . . . . . . . . . . . . . . . . . . . . . 22.0 26.8 23.3All Other . . . . . . . . . . . . . . . . . . . . . . . . . . . . . . . . . . . . . . . . . . . . . 0.9 — —
Total . . . . . . . . . . . . . . . . . . . . . . . . . . . . . . . . . . . . . . . . . . . . . . . . $1,648.1 $1,776.4 $1,771.8
Operating (loss) incomeNorth America . . . . . . . . . . . . . . . . . . . . . . . . . . . . . . . . . . . . . . . . . $ (56.3) $ (78.4) $ (13.7)United Kingdom . . . . . . . . . . . . . . . . . . . . . . . . . . . . . . . . . . . . . . . (53.5) 16.6 7.9Mexico . . . . . . . . . . . . . . . . . . . . . . . . . . . . . . . . . . . . . . . . . . . . . . . (8.8) 1.7 —RCI . . . . . . . . . . . . . . . . . . . . . . . . . . . . . . . . . . . . . . . . . . . . . . . . . 8.1 10.7 8.7All Other 1 . . . . . . . . . . . . . . . . . . . . . . . . . . . . . . . . . . . . . . . . . . . . (2.5) (5.1) (0.6)
Total . . . . . . . . . . . . . . . . . . . . . . . . . . . . . . . . . . . . . . . . . . . . . . . . $ (113.0) $ (54.5) $ 2.3
1 Primarily represents international unallocated corporate costs.
The following table summarizes our case volume by operating segment for 2008, 2007 and 2006:
(In millions of cases) 2008 2007 2006
Volume 8oz equivalent cases—Total Beverage (includingconcentrate)
North America . . . . . . . . . . . . . . . . . . . . . . . . . . . . . . . . . . . . . . . . . . . . 665.8 699.6 753.6United Kingdom . . . . . . . . . . . . . . . . . . . . . . . . . . . . . . . . . . . . . . . . . . 189.2 198.8 193.4Mexico . . . . . . . . . . . . . . . . . . . . . . . . . . . . . . . . . . . . . . . . . . . . . . . . . . 29.4 34.0 32.2RCI . . . . . . . . . . . . . . . . . . . . . . . . . . . . . . . . . . . . . . . . . . . . . . . . . . . . 233.4 337.2 253.6All Other . . . . . . . . . . . . . . . . . . . . . . . . . . . . . . . . . . . . . . . . . . . . . . . . 0.7 0.6 —
Total . . . . . . . . . . . . . . . . . . . . . . . . . . . . . . . . . . . . . . . . . . . . . . . . . . . 1,118.5 1,270.2 1,232.8
Volume 8oz equivalent cases—Filled BeverageNorth America . . . . . . . . . . . . . . . . . . . . . . . . . . . . . . . . . . . . . . . . . . . . 581.0 627.6 680.0United Kingdom . . . . . . . . . . . . . . . . . . . . . . . . . . . . . . . . . . . . . . . . . . 171.1 182.9 177.2Mexico . . . . . . . . . . . . . . . . . . . . . . . . . . . . . . . . . . . . . . . . . . . . . . . . . . 29.4 34.0 32.2RCI . . . . . . . . . . . . . . . . . . . . . . . . . . . . . . . . . . . . . . . . . . . . . . . . . . . . — — —All Other . . . . . . . . . . . . . . . . . . . . . . . . . . . . . . . . . . . . . . . . . . . . . . . . 0.7 0.4 —
Total . . . . . . . . . . . . . . . . . . . . . . . . . . . . . . . . . . . . . . . . . . . . . . . . . . . 782.2 844.9 889.4
31

The following tables summarize revenue by product for 2008 and 2007:
For the Year Ended December 27, 2008
(In millions of U.S. dollars)North
AmericaUnited
Kingdom Mexico RCIAll
Other Total
RevenueCarbonated soft drinks . . . . . . . . . . . . . . . . . . . . . . . . . . $ 748.7 $163.3 $59.2 $ — $ 0.9 $ 972.1Concentrate . . . . . . . . . . . . . . . . . . . . . . . . . . . . . . . . . . 5.5 7.2 — 22.0 — 34.7All other products . . . . . . . . . . . . . . . . . . . . . . . . . . . . . 423.8 214.8 2.7 — — 641.3
Total . . . . . . . . . . . . . . . . . . . . . . . . . . . . . . . . . . . . . . . . $1,178.0 $385.3 $61.9 $ 22.0 $ 0.9 $1,648.1
(In millions of physical cases)North
AmericaUnited
Kingdom Mexico RCIAll
Other Total
8 ounce volumeCarbonated soft drinks . . . . . . . . . . . . . . . . . . . . . . . . . . 360.7 86.7 28.0 — 0.7 476.1Concentrate . . . . . . . . . . . . . . . . . . . . . . . . . . . . . . . . . . 84.8 18.1 — 233.4 — 336.3All other products . . . . . . . . . . . . . . . . . . . . . . . . . . . . . 220.3 84.4 1.4 — — 306.1
Total . . . . . . . . . . . . . . . . . . . . . . . . . . . . . . . . . . . . . . . . 665.8 189.2 29.4 233.4 0.7 1,118.5
For the Year Ended December 29, 2007
(In millions of U.S. dollars)North
AmericaUnited
Kingdom Mexico RCIAll
Other Total
RevenueCarbonated soft drinks . . . . . . . . . . . . . . . . . . . . . . . . . . $ 817.8 $182.0 $68.4 $ — $— $1,068.2Concentrate . . . . . . . . . . . . . . . . . . . . . . . . . . . . . . . . . . 4.7 9.2 — 26.8 — 40.7All other products . . . . . . . . . . . . . . . . . . . . . . . . . . . . . 452.4 214.1 1.0 — — 667.5
Total . . . . . . . . . . . . . . . . . . . . . . . . . . . . . . . . . . . . . . . . $1,274.9 $405.3 $69.4 $ 26.8 $— $1,776.4
(In millions of physical cases)North
AmericaUnited
Kingdom Mexico RCIAll
Other Total
8 ounce volumeCarbonated soft drinks . . . . . . . . . . . . . . . . . . . . . . . . . . 379.9 99.3 33.6 — 0.6 513.4Concentrate . . . . . . . . . . . . . . . . . . . . . . . . . . . . . . . . . . 72.2 15.9 — 337.2 — 425.3All other products . . . . . . . . . . . . . . . . . . . . . . . . . . . . . 247.5 83.6 0.4 — — 331.5
Total . . . . . . . . . . . . . . . . . . . . . . . . . . . . . . . . . . . . . . . . 699.6 198.8 34.0 337.2 0.6 1,270.2
Results of operations
The following table summarizes the change in revenue by operating segment for 2008:
For the Year Ended December 27, 2008
(In million of U.S. dollars) Cott 1North
AmericaUnited
Kingdom Mexico RCIAll
Other
Change in revenue . . . . . . . . . . . . . . . . . . . . . . . . . . . . . . . $(128.3) $(96.9) $(20.0) $ (7.5) $ (4.8) $ 0.9Impact of foreign exchange . . . . . . . . . . . . . . . . . . . . . . . . 27.6 (2.6) 29.9 0.4 — (0.1)Change excluding foreign exchange . . . . . . . . . . . . . . . . . $(100.7) $(99.5) $ 9.9 $ (7.1) $ (4.8) $ 0.8
Percentage change in revenue 2 . . . . . . . . . . . . . . . . . . . . . -7.2% -7.6% -4.9% -10.8% -17.9% N/A
Percentage change in revenue excluding foreignexchange 2 . . . . . . . . . . . . . . . . . . . . . . . . . . . . . . . . . . . -5.8% -7.8% 2.6% -10.3% -17.9% N/A
32

1 Cott includes the following operating segments: North America, United Kingdom, Mexico, RCI and AllOther.
2 Percent change in revenue and percent change in revenue excluding foreign exchange is N/A for All Otherdue to this operating segment representing our Asia reporting unit, which did not begin operations until thefourth quarter of 2007.
The following table summarizes the change in revenue by operating segment for 2007:
For the Year Ended December 29, 2007
(In million of U.S. dollars) Cott 1North
AmericaUnited
Kingdom Mexico RCIAll
Other
Change in revenue . . . . . . . . . . . . . . . . . . . . . . . . . . . . . . . . . $ 4.6 $(69.8) $ 63.7 $ 7.2 $ 3.5 $(0.0)Impact of foreign exchange . . . . . . . . . . . . . . . . . . . . . . . . . . (41.3) (12.4) (28.7) (0.2) — —Change excluding foreign exchange . . . . . . . . . . . . . . . . . . . $(36.7) $(82.2) $ 35.0 $ 7.0 $ 3.5 $(0.0)
Percentage change in revenue 2 . . . . . . . . . . . . . . . . . . . . . . . 0.3% -5.2% 18.6% 11.6% 15.0% N/A
Percentage change in revenue excluding foreignexchange 2 . . . . . . . . . . . . . . . . . . . . . . . . . . . . . . . . . . . . . -2.0% -6.1% 9.5% 11.2% 15.0% N/A
1 Cott includes the following operating segments: North America, United Kingdom, Mexico, RCI and AllOther.
2 Percent change in revenue and percent change in revenue excluding foreign exchange is N/A for All Otherdue to this operating segment representing our Asia reporting unit, which did not begin operations until thefourth quarter of 2007.
2008 versus 2007
Revenue decreased 7.2% in 2008 from 2007, primarily due to a decrease in North America case volume infilled beverage 8-ounce equivalents (“beverage case volume”). The 19.1% decrease in the Canadian dollar,26.1% decrease in the pound sterling and the 18.7% decrease in the Mexican peso, each relative to the U.S. dollarsince December 29, 2007, had a collective $27.6 million negative impact on our revenue and a $1.7 millionnegative impact on our gross margin from 2007.
2007 versus 2006
Revenue in 2007 increased 0.3% as compared to 2006 but decreased 2.0% when the impact of foreignexchange is excluded. The decrease in revenue was primarily the result of a 7.7% decrease in North Americabeverage case volume, which was not fully offset by price increases. The North America volume decline wasprimarily due to continued softness in the CSD category, the impact of our price increases and increasedpromotional activity by national brands.
Revenue Results for Operating segments
2008 versus 2007
Our North America operating segment revenue decreased 7.6% in 2008 from 2007, primarily due to a 7.4%decrease in beverage case volume that resulted from the continued softness in the CSD and bottled watercategories. Net selling price per beverage case (which is net revenue divided by beverage case volume) was flatfor 2008 from 2007. Absent foreign exchange impact, North America revenue for 2008 declined 7.8%.
Our U.K. operating segment revenue decreased 4.9% in 2008 from 2007, primarily due to a 26.1% declinein the pound and a 6.5% decrease in beverage case volume due to price increases. Net selling price per beverage
33

case increased 1.6% in 2008 from 2007. Absent foreign exchange impact, U.K. revenue increased 2.6% in 2008from 2007. The U.K. operating segment case volume decreased 4.8% due to accelerated CSD category decline inthe United Kingdom but was partially offset by a 13.8% increase in concentrate sales.
Our Mexico operating segment revenue decreased 10.8% in 2008 from 2007, primarily due to a 13.5%decrease in beverage case volume. Net selling price per beverage case increased 3.1% in 2008 from 2007. Absentforeign exchange impact, Mexico revenue decreased 10.3% in 2008 from 2007. Mexico case volume decreased13.5% in 2008 due to softness with modern trade customers and the impact of our new credit policies, offset byprice increases.
Our RCI revenue decreased 17.9% in 2008 from 2007, primarily due to a 30.8% decrease in case volumeresulting from an unusually large sales volume in the fourth quarter of 2007 in anticipation of a price increasethat was effective in 2008. Net selling price per beverage case increased 18.6% in 2008 from 2007. RCI onlysells concentrate case volume.
2007 versus 2006
Our North America operating segment revenue decreased 5.2% in 2007 from 2006, primarily due to a 7.7%decrease in beverage case volume that resulted from the continued softness in the CSD category and priceincreases. Net selling price per beverage case increased 3.5% in 2007 from 2006. Absent foreign exchangeimpact, North America revenue declined 6.1% in 2007.
Our U.K. operating segment revenue increased 18.6% in 2007 from 2006, primarily due to a 3.2% increasein beverage case volume and price increases. This increase was hindered by underperformance related to avoluntary product recall and unseasonably wet summer weather. Net selling price per beverage case increased15.0% in 2007 from 2006. Absent foreign exchange impact, U.K. revenue increased 9.5% in 2007 from 2006.
Our Mexico operating segment revenue increased 11.6% in 2007 from 2006, primarily due to a 5.6%increase in beverage case volume and price increases. Net selling price per beverage case increased 5.7% in 2007from 2006. Absent foreign exchange impact, Mexico revenue increased 11.2% in 2007 from 2006. The Mexicocase volume increased 5.6% in 2007 primarily as a result of broadening distribution within non-supermarketchannels.
Our RCI operating segment revenue increased 15.0% in 2007 from 2006, primarily due to a 33.0% increasein case volume from an unusually large sales volume in the fourth quarter of 2007 in anticipation of a priceincrease that was effective in 2008. Net selling price per beverage case decreased 11.1% for 2007 from 2006.RCI only sells concentrate case volume.
Cost of Sales
2008 versus 2007
Cost of sales decreased 7.0% overall and represented 89.0% of revenue in 2008 as compared to 88.8% in2007. This decrease was due in part to a 15.8% decrease in the utilization of our North American plant facilities,offset in part by slightly higher net selling price per case and lower ingredient and packaging costs. Variablecosts represented 78.6% of total sales in 2008, down from 79.5% in 2007. Major elements of these variable costsincluded ingredient and packaging costs, distribution costs and fees paid to third-party manufacturers. In 2007,we incurred $3.6 million of product recall costs in the U.K. net of $5.5 million of business interruption insurancereimbursements.
2007 versus 2006
Cost of sales increased 1.5% overall and represented 88.8% of revenue in 2007 as compared to 87.8% in2006. This increase was due primarily to an increase in ingredient and packaging costs arising from higher
34

packaging materials costs, including for aluminum and HFCS, in addition to the voluntary product recall costs inthe U.K. Variable costs represented 79.5% of total sales in 2007, an increase from 77.0% in 2006, largely due tohigher ingredient and packaging costs. Major elements of these variable costs included ingredient and packagingcosts, distribution costs and fees paid to third-party manufacturers. In 2007, we incurred costs of $3.6 million, netof insurance reimbursements of $5.5 million, related to our voluntary product recall in the U.K. in “Cost ofSales.”
Gross Profit
2008 versus 2007
Gross profit as a percentage of revenue decreased to 11.0% in 2008 from 11.2% in 2007. The overall grossprofit decreased by 8.8% in 2008 due primarily to lower sales, higher fixed operating costs due to an 15.8%decrease in the utilization of our North American plant facilities, and the sale of more lower-margin productssuch as bottled water.
2007 versus 2006
Gross profit as a percentage of revenue decreased to 11.2% in 2007 from 12.2% in 2006 primarily due tohigher ingredient and packaging costs, the inability to pass these costs on to customers in a timely manner andthe impact of the voluntary product recall in the U.K. Our North America operating segment was materiallyaffected by a drop in volume while all of our segments were adversely affected by rising costs for ingredient andpackaging. Our gross profit growth in the U.K. reflects increased volume and the implementation of priceincreases and is net of voluntary product recall costs. Fiscal year 2006 was negatively impacted by both a $9.0million loss relating to a U.K. PET resin supplier and accelerated depreciation of $13.2 million in North Americarelating to the North American Plan.
Selling, General and Administrative Expenses (“SG&A”)
2008 versus 2007
SG&A in 2008 increased $17.9 million, or 11.1%, from 2007. As a percentage of revenue, SG&A increasedto 10.9% during 2008, up from 9.1% in 2007. The overall increase and the percentage of revenue increase inSG&A in 2008 were primarily due to $4.4 million of increased bad debt expense, $2.7 million of increasedamortization related to a change in the estimated life of certain trademarks, $0.9 million of additionalamortization related to certain software assets, $2.1 million of additional stock compensation (including $1.9million of stock compensation related to executive transition costs) due to our reversal in the prior year of theaccrual for our performance stock unit awards, a $1.5 million legal settlement and $4.5 million of previouslycapitalized software costs expensed in the third quarter of 2008. These increases were partially offset by a $6.8million reduction in compensation costs due in part to the Refocus Plan (including $4.9 million of executivetransition costs and the unfavorable impact of $3.3 million of foreign exchange).
2007 versus 2006
SG&A in 2007 decreased $14.2 million, or 8.1%, from 2006. As a percentage of revenue, SG&A decreasedto 9.1% in 2007 from 9.9% in 2006. This change was due to reductions in the amount of incentive compensationearned in 2007, a $7.2 million decline in stock compensation expense and the non-recurrence of $8.7 million ofexecutive transition costs recorded in 2006, partially offset by the impact of $4.3 million in foreign exchange. In2007, our SG&A includes stock compensation expense of $4.2 million as compared to $11.4 million for 2006.The decrease in stock compensation expense was due in part to a $1.2 million reversal of the expense forpreviously awarded PSUs under our PSU Plan as we determined that we would not meet the performance targetsfor such awards.
35
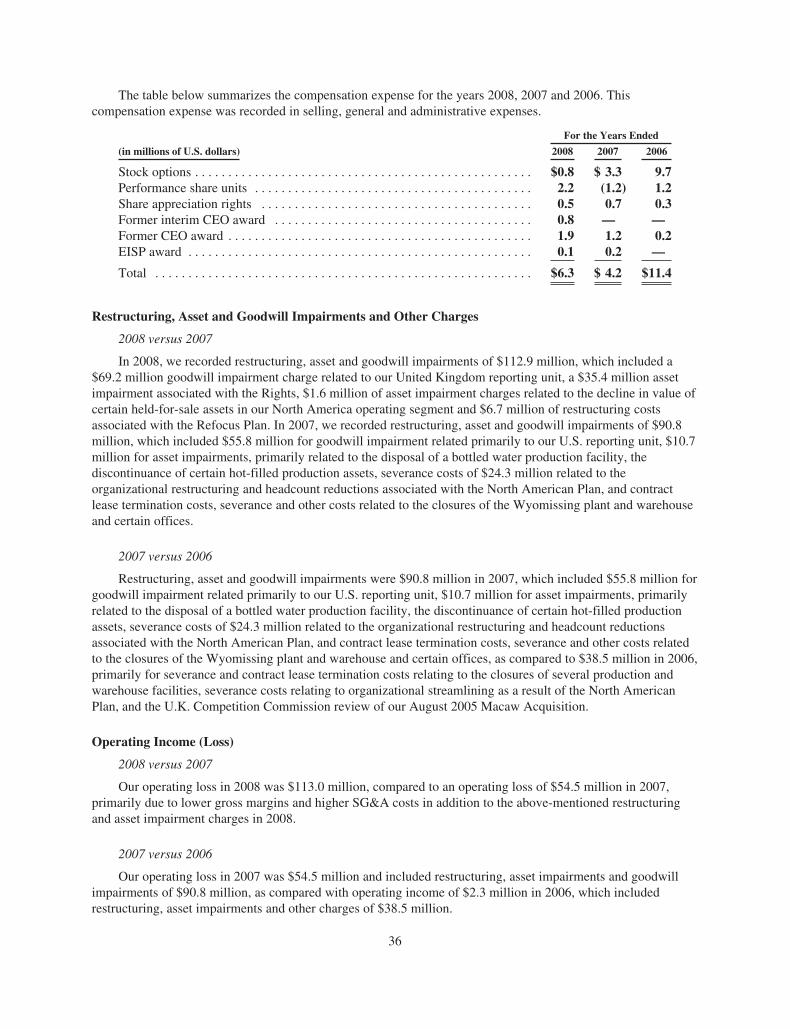
The table below summarizes the compensation expense for the years 2008, 2007 and 2006. Thiscompensation expense was recorded in selling, general and administrative expenses.
For the Years Ended
(in millions of U.S. dollars) 2008 2007 2006
Stock options . . . . . . . . . . . . . . . . . . . . . . . . . . . . . . . . . . . . . . . . . . . . . . . . . . . $0.8 $ 3.3 9.7Performance share units . . . . . . . . . . . . . . . . . . . . . . . . . . . . . . . . . . . . . . . . . . 2.2 (1.2) 1.2Share appreciation rights . . . . . . . . . . . . . . . . . . . . . . . . . . . . . . . . . . . . . . . . . 0.5 0.7 0.3Former interim CEO award . . . . . . . . . . . . . . . . . . . . . . . . . . . . . . . . . . . . . . . 0.8 — —Former CEO award . . . . . . . . . . . . . . . . . . . . . . . . . . . . . . . . . . . . . . . . . . . . . . 1.9 1.2 0.2EISP award . . . . . . . . . . . . . . . . . . . . . . . . . . . . . . . . . . . . . . . . . . . . . . . . . . . . 0.1 0.2 —
Total . . . . . . . . . . . . . . . . . . . . . . . . . . . . . . . . . . . . . . . . . . . . . . . . . . . . . . . . . $6.3 $ 4.2 $11.4
Restructuring, Asset and Goodwill Impairments and Other Charges
2008 versus 2007
In 2008, we recorded restructuring, asset and goodwill impairments of $112.9 million, which included a$69.2 million goodwill impairment charge related to our United Kingdom reporting unit, a $35.4 million assetimpairment associated with the Rights, $1.6 million of asset impairment charges related to the decline in value ofcertain held-for-sale assets in our North America operating segment and $6.7 million of restructuring costsassociated with the Refocus Plan. In 2007, we recorded restructuring, asset and goodwill impairments of $90.8million, which included $55.8 million for goodwill impairment related primarily to our U.S. reporting unit, $10.7million for asset impairments, primarily related to the disposal of a bottled water production facility, thediscontinuance of certain hot-filled production assets, severance costs of $24.3 million related to theorganizational restructuring and headcount reductions associated with the North American Plan, and contractlease termination costs, severance and other costs related to the closures of the Wyomissing plant and warehouseand certain offices.
2007 versus 2006
Restructuring, asset and goodwill impairments were $90.8 million in 2007, which included $55.8 million forgoodwill impairment related primarily to our U.S. reporting unit, $10.7 million for asset impairments, primarilyrelated to the disposal of a bottled water production facility, the discontinuance of certain hot-filled productionassets, severance costs of $24.3 million related to the organizational restructuring and headcount reductionsassociated with the North American Plan, and contract lease termination costs, severance and other costs relatedto the closures of the Wyomissing plant and warehouse and certain offices, as compared to $38.5 million in 2006,primarily for severance and contract lease termination costs relating to the closures of several production andwarehouse facilities, severance costs relating to organizational streamlining as a result of the North AmericanPlan, and the U.K. Competition Commission review of our August 2005 Macaw Acquisition.
Operating Income (Loss)
2008 versus 2007
Our operating loss in 2008 was $113.0 million, compared to an operating loss of $54.5 million in 2007,primarily due to lower gross margins and higher SG&A costs in addition to the above-mentioned restructuringand asset impairment charges in 2008.
2007 versus 2006
Our operating loss in 2007 was $54.5 million and included restructuring, asset impairments and goodwillimpairments of $90.8 million, as compared with operating income of $2.3 million in 2006, which includedrestructuring, asset impairments and other charges of $38.5 million.
36

Other (income) expense, net
In 2008, we recorded $4.5 million as business interruption recovery under our insurance coverage related toour voluntary product recall that occurred in the United Kingdom in 2007. This amount was reported in Other(income) expense, net because there were no direct costs incurred in 2008 that should be offset by the insuranceproceeds. In 2008, we also recorded $1.0 million of foreign exchange loss, which includes $3.2 million of foreignexchange losses related to inter-company loans. In 2007 we recorded $4.4 million of foreign exchange gains.
Interest Expense
2008 versus 2007
Net interest expense in 2008 decreased 1.5% from 2007 primarily due to lower overall average interest rateseven as we had overall higher debt amounts.
2007 versus 2006
Net interest expense in 2007 was up 1.9% from 2006, primarily due to higher short-term debt balances,amendment fees for our then-existing senior credit facility and higher average interest rates.
Income Taxes
2008 versus 2007
We recorded an income tax benefit of $19.5 million in 2008 as compared with an income tax benefit of$13.9 million in 2007. This benefit reflects the settlement of certain matters that were under audit and the benefitrealized from certain book losses offset by the impact of goodwill impairment charges that are not deductible fortax purposes and income generated in certain jurisdictions. The benefit of tax losses generated in the U.S. andMexico cannot be recognized since it is “more likely than not” that these losses will not be utilized before theyexpire. The valuation allowance resulted in the non-recognition of approximately $24.3 million in tax benefits forthe year.
2007 versus 2006
We recorded an income tax benefit in 2007 of $13.9 million, or an effective tax rate of 16.3%, as comparedwith an income tax benefit of $16.3 million, or an effective rate of 48.2%, in 2006. We also recognized a $21.2million valuation allowance because it was not more likely than not we would realize our U.S. deferred taxassets.
Net Loss Per Share
2008 versus 2007
Net loss for 2008 was $122.8 million, or a loss of $1.73 per diluted common share, as compared to a net lossof $71.4 million for 2007, or a loss of $0.99 per diluted common share.
2007 versus 2006
Net loss for 2007 was $71.4 million, or a loss of $0.99 per diluted common share, as compared to a net lossof $17.5 million for 2006, or a loss of $0.24 per diluted common share.
37

Liquidity and Capital Resources
The following table summarizes our cash flows for 2008, 2007 and 2006 as reported in our ConsolidatedStatements of Cash Flows in the accompanying Consolidated Financial Statements:
(in millions of U.S. dollars)December 27,
2008December 29,
2007December 30,
2006
Cash provided by operating activities . . . . . . . . . . . . . . . . . . . . . . . . . . . $ 66.9 $ 79.5 $109.4Cash used in investing activities . . . . . . . . . . . . . . . . . . . . . . . . . . . . . . . (54.8) (78.1) (46.5)Cash (used in) provided by financing activities . . . . . . . . . . . . . . . . . . . (19.3) 12.4 (71.3)Effect of exchange rate changes on cash . . . . . . . . . . . . . . . . . . . . . . . . . (5.5) 0.2 0.1
Net (decrease) increase in cash . . . . . . . . . . . . . . . . . . . . . . . . . . . . . . . . (12.7) 14.0 (8.3)Cash, beginning of period . . . . . . . . . . . . . . . . . . . . . . . . . . . . . . . . . . . . 27.4 13.4 21.7
Cash, end of period . . . . . . . . . . . . . . . . . . . . . . . . . . . . . . . . . . . . . . . . . $ 14.7 $ 27.4 $ 13.4
As of December 27, 2008, we had a total of $409.5 million of indebtedness. On September 19, 2008,Moody’s downgraded our Notes from B3 to Caa1 and our overall Company rating from B2 to B3. OnDecember 22, 2008, Moody’s downgraded our Notes from B3 to Caa1 and our overall Company rating from B2to B3. On January 30, 2009, S&P downgraded our Notes from CCC to CCC- and our overall Company ratingfrom B- to CCC+. These ratings downgrades, and any potential future negative change in our credit rating, maymake it more difficult for us to raise additional capital in the future on terms that are acceptable to us, if at all.
We believe that our level of resources, which includes cash on hand, available borrowings under the ABLfacility and funds provided by operations, will be adequate to meet our expenses and debt service obligations forthe next twelve months. Our ability to generate cash to meet our current expenses and debt service obligationswill depend on our future performance. If we do not have enough cash to pay our debt service obligations or ifthe ABL facility or the Notes were to become currently due, either at maturity or as a result of a breach, we maybe required to take actions such as amending our ABL facility or the indenture governing our Notes, refinancingall or part of our existing debt, selling assets, incurring additional indebtedness or raising equity.
For periods extending beyond twelve months, we believe that our ability to generate cash to meet ourexpenses and debt service obligations and to otherwise reduce our debt as anticipated will primarily depend onour ability to reduce the rate of revenue decline, retain a substantial amount of volume from our key customersand improve the profitability of our business. If we do not generate sufficient cash from operations or haveexcess debt availability to meet our expenses and debt service obligations or if the ABL facility or the Noteswere to become currently due, either at maturity or as a result of a breach, we may be required to take actionssuch as amending our ABL facility or the indenture governing our Notes, refinancing all or part of our existingdebt, selling assets, incurring additional indebtedness or raising equity. If we need to seek additional financing,there is no assurance that this additional financing will be available.
As of December 27, 2008, our total availability under the ABL facility was $163.8 million which was basedon our borrowing base (accounts receivables, inventory, and fixed assets) as of November 22, 2008 (theNovember month-end under the terms of the credit agreement) and we had $107.5 million of ABL borrowingsoutstanding and $10.8 million in outstanding letters of credits. As a result, our excess availability under the ABLfacility was $45.5 million. Each month’s borrowing base is not effective until submitted to the lenders, which isusually on the fifteenth of the following month. The ABL facility contains a covenant requiring a minimum fixedcharge coverage ratio of 1.1 to 1.0 effective when and if excess availability is less than $30.0 million. If thiscovenant had been triggered as of December 27, 2008, we would not have been in compliance with the fixedcharge coverage ratio. If availability is less than $37.5 million, the lenders will take dominion over the cash andwill apply excess cash to reduce amounts owing under the revolver. The credit agreement governing the ABLfacility requires us to maintain excess availability of at least $15.0 million. We believe we were in compliancewith all of the applicable covenants under the ABL facility on December 27, 2008.
38

We took delivery of approximately $32.5 million of new equipment in the third quarter of 2008 and incurred$14.0 million of related infrastructure and other equipment costs to support our North America bottled waterbusiness. These investments are expected to significantly lower production costs for this line of business. Wefunded the new equipment commitment through an interim financing arrangement that was signed in January2008. We executed a lease in the third quarter of 2008 and began making payments on the lease obligation. Theequipment was reported as a finance lease obligation.
Operating activities
Cash provided by operating activities in 2008 was $66.9 million as compared to $79.5 million in 2007 and$109.4 million in 2006. The $12.6 million decrease from 2007 to 2008 was primarily due to reduced operatingincome and the timing of certain vendor invoices, offset in part by the receipt of income tax refunds andimproved accounts receivable collection efforts as reflected in a decrease of our day sales outstanding (“DSO”)to 43.9 days in 2008 from 46.2 days in 2007.
The $29.9 million decrease from 2006 to 2007 was primarily the result of the increased operating loss andincrease in accounts receivables as our DSO increased from 41.2 days in December 2006 to 46.2 days inDecember 2007. The DSO increase was primarily due to increased sales in our operating segments outside NorthAmerica and new product introduction in North America. Payments related to our North American Plan wereoffset by an increase in our accounts payable and accrued expenses as we delayed the timing of payments ofcertain vendor invoices.
Investing activities
Cash used in investing activities was $54.8 million in 2008 as compared to $78.1 million in 2007 and $46.5million in 2006. The $23.3 million decrease from 2008 to 2007 was primarily the result of reduced capitalintensive projects even after our expenditures for the water bottling equipment project. The $31.6 millionincrease from 2006 to 2007 was primarily the result of increased capital expenditures related to our bottled waterbusiness and assets purchased for our aseptic hot-filled beverage initiatives. There were no such major projects in2006. Also included in investing activities in 2007 were the acquisition of a water bottling business in Mexicoand in 2006 the addition of information technology assets included in intangibles and other assets.
Financing activities
Cash used in financing activities was $19.3 million in 2008 as compared to cash provided of $12.4 millionin 2007 and cash used of $71.3 million in 2006. The $31.7 million increase in cash used in financing activities in2008 was primarily the result of the purchase of $6.4 million of treasury shares by an independent trusteepursuant to certain of our equity compensation plans, and a $27.8 million reduction in our short-term borrowingfacilities offset in part by financing the $32.5 million water bottling equipment project. The $83.7 milliondifference in financing activities from 2006 to 2007 was the result of paying down in 2007 short-term borrowingsthat were used for capital investments in 2006. We also purchased $6.0 million face value of our 8% seniorsubordinated notes for cancellation in November 2007 at a purchase price of $5.5 million.
Off-Balance Sheet Arrangements
We have no off-balance sheet arrangements as defined under Item 303(a)(4) of Regulation S-K as ofDecember 27, 2008.
39
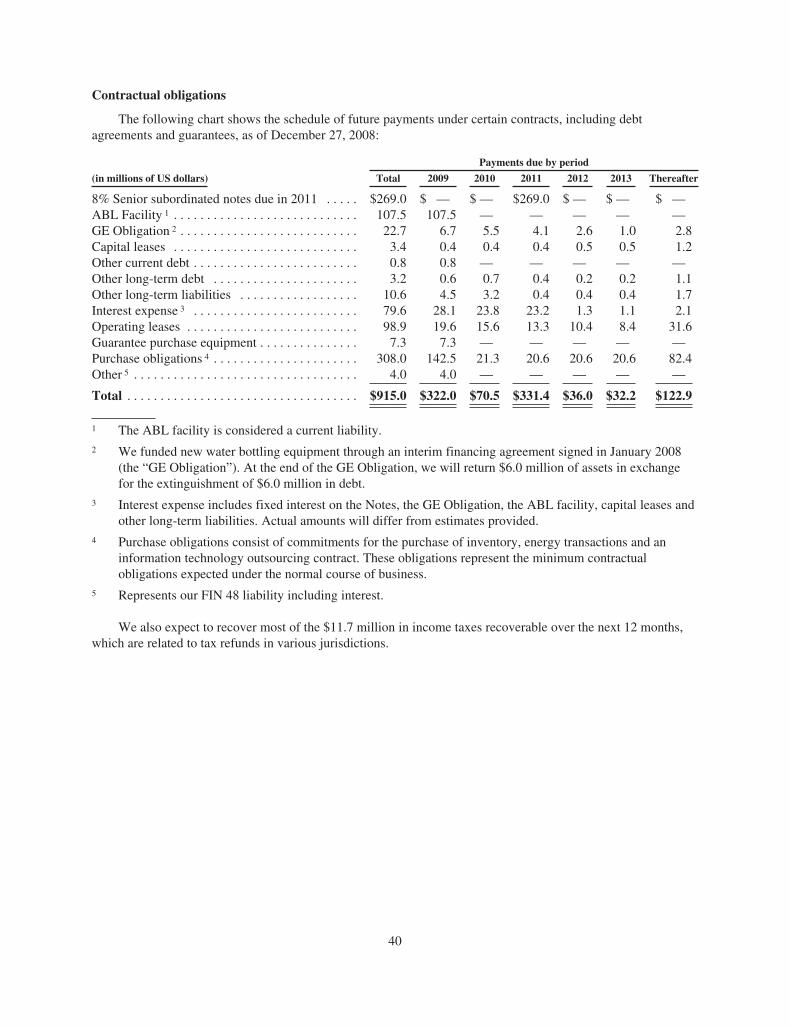
Contractual obligations
The following chart shows the schedule of future payments under certain contracts, including debtagreements and guarantees, as of December 27, 2008:
Payments due by period
(in millions of US dollars) Total 2009 2010 2011 2012 2013 Thereafter
8% Senior subordinated notes due in 2011 . . . . . $269.0 $ — $ — $269.0 $ — $ — $ —ABL Facility 1 . . . . . . . . . . . . . . . . . . . . . . . . . . . . 107.5 107.5 — — — — —GE Obligation 2 . . . . . . . . . . . . . . . . . . . . . . . . . . . 22.7 6.7 5.5 4.1 2.6 1.0 2.8Capital leases . . . . . . . . . . . . . . . . . . . . . . . . . . . . 3.4 0.4 0.4 0.4 0.5 0.5 1.2Other current debt . . . . . . . . . . . . . . . . . . . . . . . . . 0.8 0.8 — — — — —Other long-term debt . . . . . . . . . . . . . . . . . . . . . . 3.2 0.6 0.7 0.4 0.2 0.2 1.1Other long-term liabilities . . . . . . . . . . . . . . . . . . 10.6 4.5 3.2 0.4 0.4 0.4 1.7Interest expense 3 . . . . . . . . . . . . . . . . . . . . . . . . . 79.6 28.1 23.8 23.2 1.3 1.1 2.1Operating leases . . . . . . . . . . . . . . . . . . . . . . . . . . 98.9 19.6 15.6 13.3 10.4 8.4 31.6Guarantee purchase equipment . . . . . . . . . . . . . . . 7.3 7.3 — — — — —Purchase obligations 4 . . . . . . . . . . . . . . . . . . . . . . 308.0 142.5 21.3 20.6 20.6 20.6 82.4Other 5 . . . . . . . . . . . . . . . . . . . . . . . . . . . . . . . . . . 4.0 4.0 — — — — —
Total . . . . . . . . . . . . . . . . . . . . . . . . . . . . . . . . . . . $915.0 $322.0 $70.5 $331.4 $36.0 $32.2 $122.9
1 The ABL facility is considered a current liability.2 We funded new water bottling equipment through an interim financing agreement signed in January 2008
(the “GE Obligation”). At the end of the GE Obligation, we will return $6.0 million of assets in exchangefor the extinguishment of $6.0 million in debt.
3 Interest expense includes fixed interest on the Notes, the GE Obligation, the ABL facility, capital leases andother long-term liabilities. Actual amounts will differ from estimates provided.
4 Purchase obligations consist of commitments for the purchase of inventory, energy transactions and aninformation technology outsourcing contract. These obligations represent the minimum contractualobligations expected under the normal course of business.
5 Represents our FIN 48 liability including interest.
We also expect to recover most of the $11.7 million in income taxes recoverable over the next 12 months,which are related to tax refunds in various jurisdictions.
40

Debt
Our debt is summarized as follows:
(in millions of U.S. dollars)December 27,
2008December 29,
2007
8% senior subordinated notes due in 2011 1 . . . . . . . . . . . . . . . . . . . . . . . . . . . . . . . . . $269.0 $269.0Senior secured credit facility . . . . . . . . . . . . . . . . . . . . . . . . . . . . . . . . . . . . . . . . . . . . . — 102.3ABL facility . . . . . . . . . . . . . . . . . . . . . . . . . . . . . . . . . . . . . . . . . . . . . . . . . . . . . . . . . . 107.5 —GE Obligation . . . . . . . . . . . . . . . . . . . . . . . . . . . . . . . . . . . . . . . . . . . . . . . . . . . . . . . . 28.7 —Receivables securitization . . . . . . . . . . . . . . . . . . . . . . . . . . . . . . . . . . . . . . . . . . . . . . . — 33.0Other capital leases . . . . . . . . . . . . . . . . . . . . . . . . . . . . . . . . . . . . . . . . . . . . . . . . . . . . 3.4 3.1Other debt . . . . . . . . . . . . . . . . . . . . . . . . . . . . . . . . . . . . . . . . . . . . . . . . . . . . . . . . . . . . 3.2 3.9
Total debt . . . . . . . . . . . . . . . . . . . . . . . . . . . . . . . . . . . . . . . . . . . . . . . . . . . . . . . . . . . . 411.8 411.3Less: Short-term borrowings and current debt:
ABL facility . . . . . . . . . . . . . . . . . . . . . . . . . . . . . . . . . . . . . . . . . . . . . . . . . . . . . . 107.5 —Senior secured credit facility . . . . . . . . . . . . . . . . . . . . . . . . . . . . . . . . . . . . . . . . . — 95.5Receivables securitization . . . . . . . . . . . . . . . . . . . . . . . . . . . . . . . . . . . . . . . . . . . — 33.0Other short-term debt 2 . . . . . . . . . . . . . . . . . . . . . . . . . . . . . . . . . . . . . . . . . . . . . . — 8.5
Total short-term borrowings . . . . . . . . . . . . . . . . . . . . . . . . . . . . . . . . . . . . . . . . . 107.5 137.0GE obligation—current maturities . . . . . . . . . . . . . . . . . . . . . . . . . . . . . . . . . . . 6.7 —Other capital leases—current maturities . . . . . . . . . . . . . . . . . . . . . . . . . . . . . . . 0.3 2.4Other debt—current maturities . . . . . . . . . . . . . . . . . . . . . . . . . . . . . . . . . . . . . . 0.6 —
Total current debt . . . . . . . . . . . . . . . . . . . . . . . . . . . . . . . . . . . . . . . . . . . . . . . . . . 115.1 139.4
Long-term debt before discount . . . . . . . . . . . . . . . . . . . . . . . . . . . . . . . . . . . . . . . . . . . 296.7 271.9Less discount on 8% notes . . . . . . . . . . . . . . . . . . . . . . . . . . . . . . . . . . . . . . . . . . . (2.3) (2.9)
Total long-term debt . . . . . . . . . . . . . . . . . . . . . . . . . . . . . . . . . . . . . . . . . . . . . . . . . . . $294.4 $269.0
1 Our 8% senior subordinated notes were issued at a discount of 2.75% on December 21, 2001.
2 Includes $6.7 million in a negative cash position as December 29, 2007.
8% Senior Subordinated Notes due in 2011
We have outstanding 8% senior subordinated notes due on December 15, 2011. As of December 27, 2008,the principal amount of the Notes was $269.0 million. The issuer of the Notes is Cott Beverages Inc., but we andmost of our U.S., Canadian and U.K. subsidiaries guarantee the Notes. The interest on the Notes is payable semi-annually on June 15th and December 15th.
We may redeem all or a part of the Notes upon not less than 30 or more than 60 days’ notice. In addition tothe redemption price, accrued and unpaid interest and liquidated damages (as defined in the indenture governingthe Notes) are due. The redemption price is currently 101.333%, declining to 100% on December 15, 2009.
We may, from time to time, depending on market conditions, including without limitation whether the Notesare then trading at discounts to their respective face amounts, repurchase Notes for cash and/or in exchange forshares of our common stock, warrants, preferred stock, debt or other consideration, in each case in open marketpurchases and/or privately negotiated transactions. The amounts that we may repurchase as permitted by thecovenants in the ABL is limited to $15 million. However, the covenants in our ABL facility require us to have$75.0 million of availability after any such repurchase and a fixed charge coverage ratio of at least 1 to 1 for aperiod of four consecutive quarters. During 2007, we repurchased and cancelled $6.0 million face value of suchNotes on the open market at a purchase price of $5.5 million.
41

ABL facility
On March 31, 2008, we entered into a new ABL credit facility that provides financing for the United States,Canada, the United Kingdom and Mexico. Cott Corporation, Cott Beverages Inc. and Cott Beverages Limited areborrowers under the ABL facility. The debt under the ABL facility is guaranteed by most of our U.S., UnitedKingdom, Canadian and Mexican subsidiaries. The ABL facility replaced our former senior secured creditfacilities in the United States, Canada, the United Kingdom, and Mexico and our receivables securitizationfacility in the United States, the latter of which was terminated on March 28, 2008. At that time, there were noamounts due under the receivables securitization facility. On March 31, 2008, we paid off the remaining balanceand terminated the former senior secured credit facility.
The ABL facility is a five-year revolving facility of up to $250.0 million. The five-year term runs throughMarch 2013 but is subject to the refinancing of the Notes; the new ABL facility will mature early if the Noteshave not been refinanced six months prior to their maturity (i.e. June 2011) on terms and conditions specified inthe ABL facility.
The amount available under the ABL facility is dependent on a borrowing base calculated as a percentage ofthe value of eligible inventory, accounts receivable and property, plant and equipment. The ABL facility hassubfacilities for letters of credit and swingline loans and geographical sublimits for Canada ($40.0 million) andthe United Kingdom ($75.0 million).
The interest rate margin on loans under the ABL facility was fixed for the first six months of the term, andnow varies quarterly based on our average aggregate availability. The interest rate on LIBOR (or other fixed rate)loans for the first six months was LIBOR (or such other fixed rate) plus 2.50%. Prime (or other variable rate)loans during the first six months bore an interest rate of prime (or such other variable rate) plus 1.00%. Theinterest rate margin remains at these rates.
Beginning on September 29, 2008, the interest rate on LIBOR and Prime loans is now based on averageaggregate availability as follows:
(in millions of U.S. dollars)
AverageAggregateAvailability
ABRSpread
CanadianPrimeSpread
EurodollarSpread
LIBORSpread
Over $175 0.50% 0.50% 2.00% 2.00%$100 – 175 0.75% 0.75% 2.25% 2.25%$50 – 100 1.00% 1.00% 2.50% 2.50%Under $50 1.25% 1.25% 2.75% 2.75%
The interest rate for the ABL facility as of December 27, 2008 was 3.2%. As of December 27, 2008, ourABL borrowings are comprised of $90.0 million of LIBOR borrowings and $17.5 million of ABR Spreadborrowings. Our commitment fee also changes based on the average utilization of the ABL facility. This feeranges from 0.25% per annum to 0.375% per annum. We currently pay 0.375% per annum.
We incurred $5.3 million of financing fees in connection with the ABL facility. The financing fees are beingamortized over a five-year period, which represents the life of the ABL facility.
GE Financing Agreement
We funded $32.5 million of new water bottling equipment through an interim financing agreement signed inJanuary 2008. We executed a lease in the third quarter of 2008 and began making payments on the leaseobligation. It is being reported as a finance lease obligation. The quarterly payments under the lease obligationtotal approximately $8.8 million per annum for two years, $5.3 million per annum for the subsequent two years,then $1.7 million per annum for the final four years.
42

Credit Ratings and Covenant Compliance
Credit Ratings
On September 19, 2008, Moody’s downgraded our Notes from B3 to Caa1 and our overall Company ratingfrom B2 to B3. On December 22, 2008, Moody’s downgraded our Notes from B3 to Caa1 and our overallCompany rating from B2 to B3. On January 30, 2009, S&P downgraded our Notes from CCC to CCC- and ouroverall Company rating from B- to CCC+ with a stable outlook.
Covenant Compliance
ABL facility
We and our restricted subsidiaries are subject to a number of business and financial covenants and events ofdefault under the ABL facility. The debt under the ABL facility is guaranteed by most of our U.S., UnitedKingdom, Canadian and Mexican subsidiaries. The ABL facility contains customary limitations on indebtedness,liens, mergers, consolidations, liquidations and sales, payment of dividends, investments, loans and advances,optional payments and modifications of subordinated and other debt instruments, and transactions with affiliates.Events of default under the ABL facility include nonpayment, inaccuracy of representations and warranties(which would include the occurrence of an event having a material adverse effect), violation of covenants, cross-default to other indebtedness, bankruptcy, material judgments, and a change of control of the Company. Upon theoccurrence of an event of default, the lenders may terminate the commitments and declare all loans due andpayable. We have agreed to a mandatory prepayment provision (but without a reduction of the commitment),subject to certain exceptions, upon a sale or transfer of assets of a borrower or guarantor, upon the sale of anycommon stock or other equity, upon the receipt of proceeds from the issuance of any indebtedness, upon theoccurrence of an availability shortfall under the revolver, or upon receipt of insurance proceeds or condemnationawards.
As of December 27, 2008, our total availability under the ABL facility was $163.8 million, which was basedon our borrowing base (accounts receivables, inventory, and fixed assets) as of November 22, 2008 (theNovember month-end under the terms of the credit agreement), and we had $107.5 million of ABL borrowingsoutstanding and $10.8 million in outstanding letters of credits. As a result, our excess availability under the ABLfacility was $45.5 million. Each month’s borrowing base is not effective until submitted to the lenders, which isusually on the fifteenth of the following month. The ABL facility contains a covenant requiring a minimum fixedcharge coverage ratio of 1.1 to 1.0 effective when and if excess availability is less than $30.0 million. If thiscovenant had been triggered as of December 27, 2008, we would not have been in compliance with the fixedcharge coverage ratio. If availability is less than $37.5 million, the lenders will take dominion over the cash andwill apply excess cash to reduce amounts owing under the revolver. The credit agreement governing the ABLfacility requires us to maintain excess availability of at least $15.0 million. We believe we were in compliancewith all of the applicable covenants under the ABL facility on December 27, 2008.
8% Senior Subordinated Notes due in 2011
The indenture governing the Notes contains a number of business and financial covenants and events ofdefault that apply to the issuer and the guarantors. In addition to us, the guarantors are, in general, thesubsidiaries organized in Canada, the U.S., and the United Kingdom. Events of default or triggers for prepaymentprovided for under the indenture include, among others: (i) a change of control of us in certain circumstances;(ii) unsatisfied judgments or cross-default or cross-acceleration to other indebtedness in excess of $10.0 million,in the case of the indenture; (iii) our insolvency or that of the restricted subsidiaries; and (iv) covenant defaultunder the credit facilities or indenture.
We believe we have been in compliance with all of the covenants under the Notes and there have been noamendments to any such covenants since they were issued. See Note 15 to the consolidated financial statementscontained in this Annual Report on Form 10-K.
43

Capital structure
In 2008, shareowner’s equity decreased by $203.0 million from 2007. The decrease was primarily the resultof a net loss of $122.8 million, $5.4 million in stock purchases by an independent trustee under certain of ourbenefit plans that are treated as treasury stock under the accounting rules, a $76.6 million foreign currencytranslation loss on the net assets of self-sustaining foreign operations and $3.5 million of deferred pension losses,offset by $5.3 million of share-based compensation expense. The foreign currency translation adjustment resultedprimarily from the 26.0% decrease in the pound sterling, the 19.1% decrease in the Canadian dollar and the18.7% decrease in the Mexican peso relative to the U.S. dollar since December 2007.
Dividend payments
No dividends were paid in 2008 and we do not expect to change this policy in 2009 as we intend to use cashfor future growth or debt repayment.
There are certain restrictions on the payment of dividends under our credit facility and Notes indenture.
ITEM 7A. QUANTITATIVE AND QUALITATIVE DISCLOSURES ABOUTMARKET RISK
We do not trade market risk sensitive instruments.
Foreign exchange
We are exposed to changes in foreign currency exchange rates. Operations outside of the U.S. accounted forapproximately 39.0% of 2008 revenue and 39.0% of 2007 revenue, and are concentrated principally in the U.K.,Canada and Mexico. We translate the revenues and expenses of our foreign operations using average exchangerates prevailing during the period. The effect of a 10.0% change in foreign currency exchange rates among theU.S. dollar versus the Canadian dollar, pound sterling and Mexican peso as of December 27, 2008 at currentlevels of foreign debt and operations would result in our revenues in 2008 changing by $62.3 million and ourgross profit in 2008 changing by $4.3 million. These changes would be material to our cash flows and results ofoperations.
Debt obligations and interest rates
We have exposure to interest rate risk from the outstanding principal amounts of our short-term and long-term debt. Our long-term debt is fixed and our short-term debt is variable. Our short-term credit facilities arevulnerable to fluctuations in the U.S. short-term base rate and the LIBOR rate. At current debt levels as ofDecember 27, 2008, a 100 basis point increase in the current per annum interest rate for our ABL facility(excluding the $10.8 million outstanding letters of credit) would result in $1.1 million of additional interestexpense during the next year. This change would not be material to our cash flows or our results of operations.The weighted average interest rate of our debt outstanding at December 27, 2008 was 6.7%.
We regularly review the structure of our indebtedness and consider changes to the proportion of floatingversus fixed rate debt through refinancing, interest rate swaps or other measures in response to the changingeconomic environment. Historically, we have not used derivative instruments to manage interest rate risk. If weuse and fail to manage these derivative instruments successfully, or if we are unable to refinance ourindebtedness or otherwise increase our debt capacity in response to changes in the marketplace, the expenseassociated with debt service could increase. This would negatively impact our financial condition andprofitability.
44
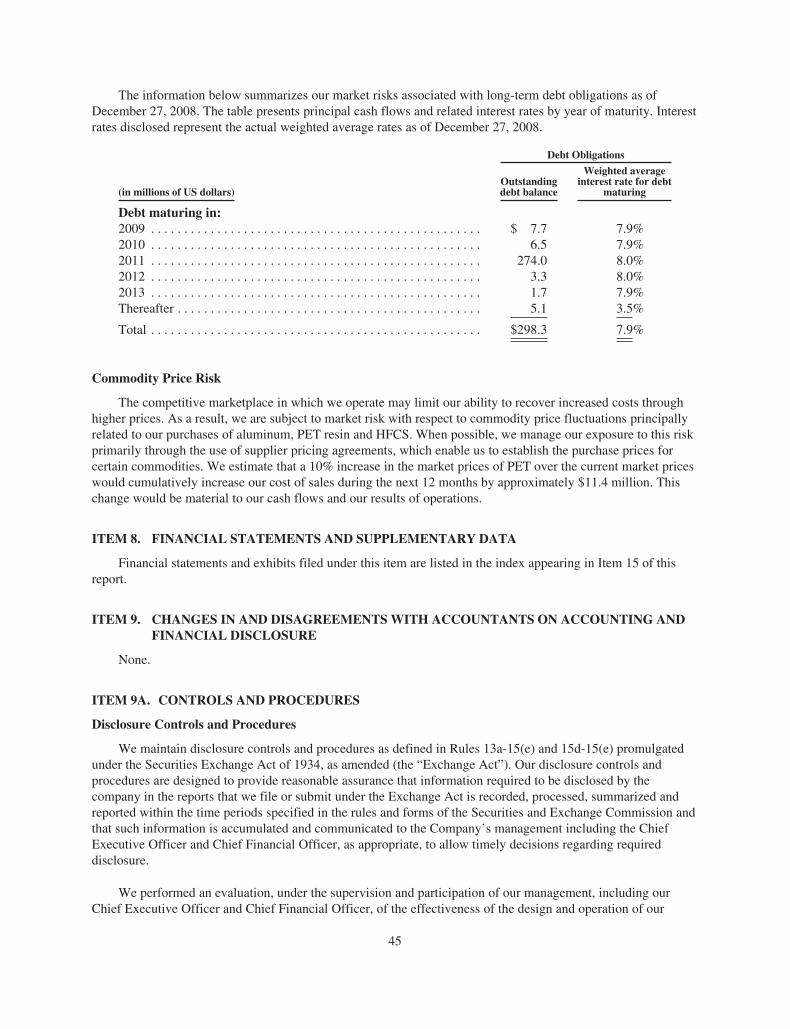
The information below summarizes our market risks associated with long-term debt obligations as ofDecember 27, 2008. The table presents principal cash flows and related interest rates by year of maturity. Interestrates disclosed represent the actual weighted average rates as of December 27, 2008.
Debt Obligations
(in millions of US dollars)Outstandingdebt balance
Weighted averageinterest rate for debt
maturing
Debt maturing in:2009 . . . . . . . . . . . . . . . . . . . . . . . . . . . . . . . . . . . . . . . . . . . . . . . . . . $ 7.7 7.9%2010 . . . . . . . . . . . . . . . . . . . . . . . . . . . . . . . . . . . . . . . . . . . . . . . . . . 6.5 7.9%2011 . . . . . . . . . . . . . . . . . . . . . . . . . . . . . . . . . . . . . . . . . . . . . . . . . . 274.0 8.0%2012 . . . . . . . . . . . . . . . . . . . . . . . . . . . . . . . . . . . . . . . . . . . . . . . . . . 3.3 8.0%2013 . . . . . . . . . . . . . . . . . . . . . . . . . . . . . . . . . . . . . . . . . . . . . . . . . . 1.7 7.9%Thereafter . . . . . . . . . . . . . . . . . . . . . . . . . . . . . . . . . . . . . . . . . . . . . . 5.1 3.5%
Total . . . . . . . . . . . . . . . . . . . . . . . . . . . . . . . . . . . . . . . . . . . . . . . . . . $298.3 7.9%
Commodity Price Risk
The competitive marketplace in which we operate may limit our ability to recover increased costs throughhigher prices. As a result, we are subject to market risk with respect to commodity price fluctuations principallyrelated to our purchases of aluminum, PET resin and HFCS. When possible, we manage our exposure to this riskprimarily through the use of supplier pricing agreements, which enable us to establish the purchase prices forcertain commodities. We estimate that a 10% increase in the market prices of PET over the current market priceswould cumulatively increase our cost of sales during the next 12 months by approximately $11.4 million. Thischange would be material to our cash flows and our results of operations.
ITEM 8. FINANCIAL STATEMENTS AND SUPPLEMENTARY DATA
Financial statements and exhibits filed under this item are listed in the index appearing in Item 15 of thisreport.
ITEM 9. CHANGES IN AND DISAGREEMENTSWITH ACCOUNTANTS ON ACCOUNTING ANDFINANCIAL DISCLOSURE
None.
ITEM 9A. CONTROLS AND PROCEDURES
Disclosure Controls and Procedures
We maintain disclosure controls and procedures as defined in Rules 13a-15(e) and 15d-15(e) promulgatedunder the Securities Exchange Act of 1934, as amended (the “Exchange Act”). Our disclosure controls andprocedures are designed to provide reasonable assurance that information required to be disclosed by thecompany in the reports that we file or submit under the Exchange Act is recorded, processed, summarized andreported within the time periods specified in the rules and forms of the Securities and Exchange Commission andthat such information is accumulated and communicated to the Company’s management including the ChiefExecutive Officer and Chief Financial Officer, as appropriate, to allow timely decisions regarding requireddisclosure.
We performed an evaluation, under the supervision and participation of our management, including ourChief Executive Officer and Chief Financial Officer, of the effectiveness of the design and operation of our
45

disclosure controls and procedures as of the end of the period covered by this report. Based on this evaluation,our Chief Executive Officer and Chief Financial Officer concluded that our disclosure controls and procedureswere effective at the reasonable assurance level as of December 27, 2008.
Management’s Report on Internal Control Over Financial Reporting
Management is responsible for establishing and maintaining adequate internal control over financialreporting. Internal control over financial reporting is defined in Rules 13a-15(f) or 15d-15(f) promulgated underthe Exchange Act as a process designed by, or under the supervision of, our principal executive and principalfinancial officer and effected by our Board of Directors, management and other personnel, to provide reasonableassurance regarding the reliability of financial reporting and the preparation of our financial statements forexternal purposes in accordance with generally accepted accounting principles and includes those policies andprocedures that:
i. pertain to the maintenance of records that in reasonable detail accurately and fairly reflect ourtransactions and dispositions of our assets;
ii. provide reasonable assurance our transactions are recorded as necessary to permit preparation of ourfinancial statements in accordance with generally accepted accounting principles, and that receipts andexpenditures are being made only in accordance with authorizations of our management and directors;and
iii. provide reasonable assurance regarding prevention or timely detection of unauthorized acquisition, useor disposition of our assets that could have a material effect on the financial statements.
Because of its inherent limitations, internal control over financial reporting may not prevent or detectmisstatements. Also, projections of any evaluation of effectiveness to future periods are subject to the risk thatcontrols may become inadequate because of changes in conditions, or that the degree of compliance with thepolicies or procedures may deteriorate.
Management of the Company has assessed the effectiveness of our internal control over financial reportingas of December 27, 2008. In making this assessment of internal control over financial reporting, we used thecriteria described in Internal Control—Integrated Framework issued by the Committee of SponsoringOrganizations of the Treadway Commission (“COSO”). Based on this evaluation, management concluded thatthe Company’s internal control over financial reporting was effective as of December 27, 2008 based on criteriain Internal Control—Integrated Framework issued by the COSO.
The effectiveness of the Company’s internal control over financial reporting as of December 27, 2008 hasbeen audited by PricewaterhouseCoopers LLP, an independent registered public accounting firm, as stated intheir report which is included in this Annual Report on Form 10-K.
Remediation of Previous Material Weaknesses
Management’s report on internal control over financial reporting for the year ended December 29, 2007described a material weakness in the Company’s internal control over financial reporting related to our year-endfinancial closing process and reporting controls. Specifically:
i. We did not maintain a sufficient complement of accounting and finance personnel that were adequatelytrained and that possessed the appropriate level of knowledge in United States generally acceptedaccounting principles in order to properly account for complex accounting transactions.
ii. The lack of a sufficient complement of accounting and finance personnel under item a), contributed toa lack of appropriate processes, controls and sufficient management oversight over the year-endfinancial close process to ensure: (a) the timely and accurate execution of account-level analyses andreconciliations, (b) the systematic review and approval of journal entries, (c) the proper accounting for
46
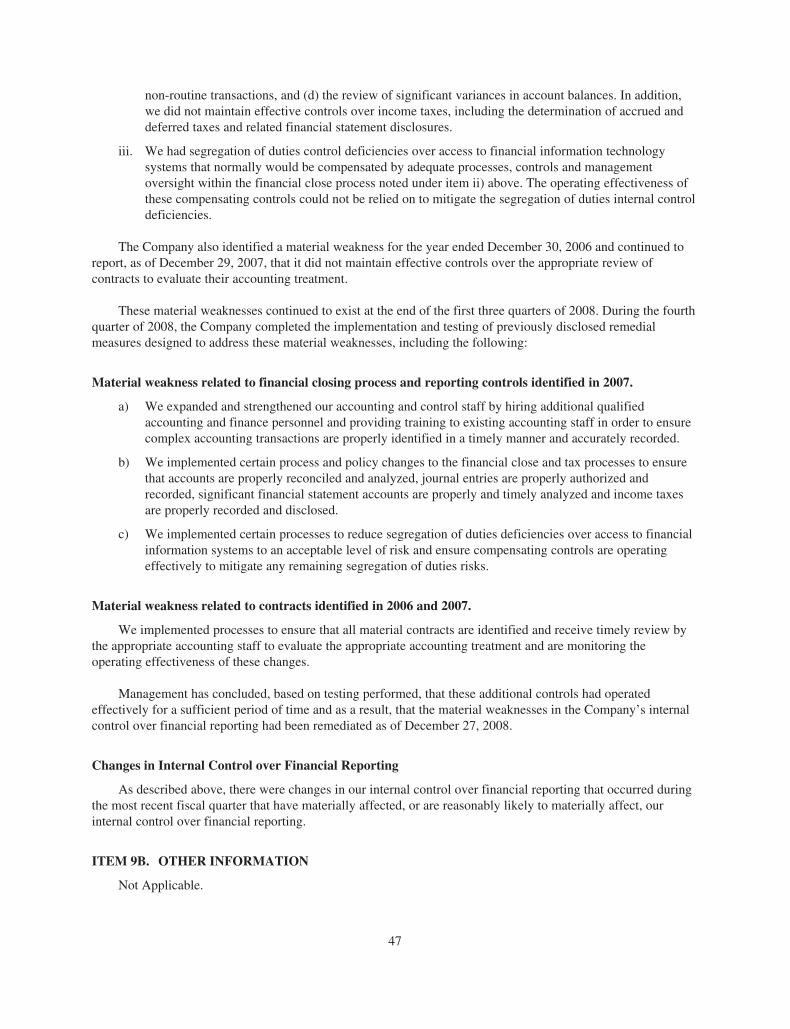
non-routine transactions, and (d) the review of significant variances in account balances. In addition,we did not maintain effective controls over income taxes, including the determination of accrued anddeferred taxes and related financial statement disclosures.
iii. We had segregation of duties control deficiencies over access to financial information technologysystems that normally would be compensated by adequate processes, controls and managementoversight within the financial close process noted under item ii) above. The operating effectiveness ofthese compensating controls could not be relied on to mitigate the segregation of duties internal controldeficiencies.
The Company also identified a material weakness for the year ended December 30, 2006 and continued toreport, as of December 29, 2007, that it did not maintain effective controls over the appropriate review ofcontracts to evaluate their accounting treatment.
These material weaknesses continued to exist at the end of the first three quarters of 2008. During the fourthquarter of 2008, the Company completed the implementation and testing of previously disclosed remedialmeasures designed to address these material weaknesses, including the following:
Material weakness related to financial closing process and reporting controls identified in 2007.
a) We expanded and strengthened our accounting and control staff by hiring additional qualifiedaccounting and finance personnel and providing training to existing accounting staff in order to ensurecomplex accounting transactions are properly identified in a timely manner and accurately recorded.
b) We implemented certain process and policy changes to the financial close and tax processes to ensurethat accounts are properly reconciled and analyzed, journal entries are properly authorized andrecorded, significant financial statement accounts are properly and timely analyzed and income taxesare properly recorded and disclosed.
c) We implemented certain processes to reduce segregation of duties deficiencies over access to financialinformation systems to an acceptable level of risk and ensure compensating controls are operatingeffectively to mitigate any remaining segregation of duties risks.
Material weakness related to contracts identified in 2006 and 2007.
We implemented processes to ensure that all material contracts are identified and receive timely review bythe appropriate accounting staff to evaluate the appropriate accounting treatment and are monitoring theoperating effectiveness of these changes.
Management has concluded, based on testing performed, that these additional controls had operatedeffectively for a sufficient period of time and as a result, that the material weaknesses in the Company’s internalcontrol over financial reporting had been remediated as of December 27, 2008.
Changes in Internal Control over Financial Reporting
As described above, there were changes in our internal control over financial reporting that occurred duringthe most recent fiscal quarter that have materially affected, or are reasonably likely to materially affect, ourinternal control over financial reporting.
ITEM 9B. OTHER INFORMATION
Not Applicable.
47

PART III
ITEM 10. DIRECTORS AND EXECUTIVE OFFICERS OF THE REGISTRANT
The information required by this item regarding directors is incorporated by reference to, and will becontained in, the “Election of Directors” section of our definitive proxy circular for the 2009 Annual Meeting ofShareowners, which will be filed within 120 days after December 27, 2008 (the “2009 Proxy Circular”). Theinformation required by this item regarding audit committee financial expert disclosure is incorporated byreference to, and will be contained in, the “Corporate Governance” section of our definitive proxy circular for the2009 Annual Meeting of Shareowners. The information required by this item regarding executive officersappears as the Supplemental Item in Part I. There have been no material changes to the procedures by whichshareholders may recommend nominees to our Board of Directors.
The Audit Committee of our Board of Directors is an “audit committee” for the purposes ofSection 3(a)(58)(A) of the Securities Exchange Act of 1934, as amended. The Audit Committee charter is postedon our website at www.cott.com. The members of the Audit Committee are Graham Savage (Chairman), GeorgeBurnett, and Gregory Monahan. As required by the NYSE rules, the board has determined that each member ofthe Audit Committee is financially literate and that Mr. Savage qualifies as an “audit committee financial expert”within the meaning of the rules of the U.S. Securities and Exchange Commission.
All of our directors, officers and employees must comply with our Code of Business Conduct and Ethics. Inaddition, our Chief Executive Officer, Chief Financial Officer and principal accounting officer and certain otheremployees have a further obligation to comply with our Code of Ethics for Senior Officers. Our Code ofBusiness Conduct and Ethics and our Code of Ethics for Senior Officers are posted on our website,www.cott.com and we intend to comply with obligations to disclose any amendment to, or waiver of, provisionsof these codes by posting such information on our website.
Section 16(a) Beneficial ownership reporting compliance
The information required by this item is incorporated by reference to, and will be contained in, the “Section16(a) Beneficial Ownership Reporting Compliance” section of our 2009 Proxy Circular.
ITEM 11. EXECUTIVE COMPENSATION
The information required by this item is incorporated by reference to, and will be contained in, the“Compensation of Executive Officers” section of our 2009 Proxy Circular.
ITEM 12. SECURITY OWNERSHIP OF CERTAIN BENEFICIAL OWNERS ANDMANAGEMENTAND RELATED SHAREOWNERMATTERS
The information required by this item is incorporated by reference to, and will be contained in, the“Principal Shareowners,” “Security Ownership of Directors and Management” and “Equity Compensation PlanInformation” sections of our 2009 Proxy Circular.
ITEM 13. CERTAIN RELATIONSHIPS AND RELATED TRANSACTIONS
The information required by this item is incorporated by reference to, and will be contained in, the “CertainRelationships and Related Transactions” section 2009 Proxy Circular.
ITEM 14. PRINCIPAL ACCOUNTANT FEES AND SERVICES
The information required by this item is incorporated by reference to, and will be contained in, the“Auditors” section of our 2009 Proxy Circular.
48

PART IV
ITEM 15. EXHIBITS AND FINANCIAL STATEMENT SCHEDULES
(a) The documents filed as part of this report are as follows:
1. Financial Statements
The consolidated financial statements and accompanying report of independent certified publicaccountants are listed in the Index to Consolidated Financial Statements and are filed as part ofthis report.
2. Financial Statement Schedules
Schedule II—Valuation and Qualifying Accounts
3. Exhibits
Exhibits required by Item 601 of Regulation S-K set forth on the “Exhibit Index.”
All other schedules called for by the applicable SEC accounting regulations are not required under therelated instructions or are inapplicable and, therefore, have been omitted.
49

Signatures
Pursuant to the requirements of Section 13 or 15(d) of the Securities Exchange Act of 1934, the Registranthas duly caused this report to be signed on its behalf by the undersigned, thereunto duly authorized.
Cott Corporation
/s/ JERRY FOWDEN
Jerry FowdenChief Executive Officer
Date: March 11, 2009
Pursuant to the requirements of the Securities Exchange Act of 1934, this report has been signed below bythe following persons on behalf of the registrant and in the capacities and on the dates indicated:
/s/ JERRY FOWDEN
Jerry FowdenChief Executive Officer, Director(Principal Executive Officer)
Date: March 11, 2009 /s/ GREGORY MONAHAN
Gregory MonahanDirector
Date: March 10, 2009
/s/ JUAN FIGUEREOJuan Figuereo
Chief Financial Officer(Principal Financial Officer)
Date: March 11, 2009 /s/ MARIO PILOZZIMario Pilozzi
Director
Date: March 10, 2009
/s/ GREGORY LEITERGregory Leiter
Senior Vice President and Controller(Principal Accounting Officer)
Date: March 11, 2009 /s/ GEORGE A. BURNETT
George A. BurnettDirector
Date: March 10, 2009
/s/ DAVID T. GIBBONS
David T. GibbonsChairman, Director
Date: March 10, 2009 /s/ ANDREW PROZESAndrew Prozes
Director
Date: March 10, 2009
/s/ MARK BENADIBA
Mark BenadibaDirector
Date: March 10, 2009 /s/ GRAHAM SAVAGEGraham Savage
Director
Date: March 10, 2009
/s/ STEPHEN H. HALPERIN
Stephen H. HalperinDirector
Date: March 10, 2009 /s/ ERIC ROSENFELD
Eric RosenfeldDirector
Date: March 10, 2009
/s/ BETTY JANE HESS
Betty Jane HessDirector
Date: March 10, 2009
50

COTT CORPORATION
INDEX TO CONSOLIDATED FINANCIAL STATEMENTS
Page(s)
Reports of Independent Registered Certified Public Accounting Firm . . . . . . . . . . . . . . . . . . . . . . . . . F – 2Consolidated Statements of (Loss) Income . . . . . . . . . . . . . . . . . . . . . . . . . . . . . . . . . . . . . . . . . . . . . . F – 4Consolidated Balance Sheets . . . . . . . . . . . . . . . . . . . . . . . . . . . . . . . . . . . . . . . . . . . . . . . . . . . . . . . . . F – 5Consolidated Statements of Shareowners’ Equity . . . . . . . . . . . . . . . . . . . . . . . . . . . . . . . . . . . . . . . . . F – 6Consolidated Statements of Cash Flows . . . . . . . . . . . . . . . . . . . . . . . . . . . . . . . . . . . . . . . . . . . . . . . . F – 7Notes to Consolidated Financial Statements . . . . . . . . . . . . . . . . . . . . . . . . . . . . . . . . . . . . . . . . . . . . . F – 8 to 48
F-1

Report of Independent Registered Certified Public Accounting Firm
To the Board of Directors and Shareowners of Cott Corporation:
In our opinion, the consolidated financial statements listed in the accompanying index present fairly, in allmaterial respects, the financial position of Cott Corporation and its subsidiaries at December 27, 2008, and theresults of their operations and their cash flows for the year then ended in conformity with accounting principlesgenerally accepted in the United States of America. In addition, in our opinion, the financial statement schedulefor the year ended December 27, 2008 listed in the index appearing under Item 15(a)(2) presents fairly, in allmaterial respects, the information set forth therein when read in conjunction with the related consolidatedfinancial statements. Also in our opinion, the Company maintained, in all material respects, effective internalcontrol over financial reporting as of December 27, 2008, based on criteria established in Internal Control—Integrated Framework issued by the Committee of Sponsoring Organizations of the Treadway Commission(COSO). The Company’s management is responsible for these financial statements and the financial statementschedule, for maintaining effective internal control over financial reporting and for its assessment of theeffectiveness of internal control over financial reporting, included in Management’s Report on Internal Controlover Financial Reporting under Item 9A. Our responsibility is to express an opinion on these financialstatements, on the financial statement schedule, and on the Company’s internal control over financial reportingbased on our integrated audit. We conducted our audit in accordance with the standards of the Public CompanyAccounting Oversight Board (United States). Those standards require that we plan and perform the audit toobtain reasonable assurance about whether the financial statements are free of material misstatement and whethereffective internal control over financial reporting was maintained in all material respects. Our audit of thefinancial statements included examining, on a test basis, evidence supporting the amounts and disclosures in thefinancial statements, assessing the accounting principles used and significant estimates made by management,and evaluating the overall financial statement presentation. Our audit of internal control over financial reportingincluded obtaining an understanding of internal control over financial reporting, assessing the risk that a materialweakness exists, and testing and evaluating the design and operating effectiveness of internal control based onthe assessed risk. Our audit also included performing such other procedures as we considered necessary in thecircumstances. We believe that our audit provides a reasonable basis for our opinion.
A company’s internal control over financial reporting is a process designed to provide reasonable assuranceregarding the reliability of financial reporting and the preparation of financial statements for external purposes inaccordance with generally accepted accounting principles. A company’s internal control over financial reportingincludes those policies and procedures that (i) pertain to the maintenance of records that, in reasonable detail,accurately and fairly reflect the transactions and dispositions of the assets of the company; (ii) provide reasonableassurance that transactions are recorded as necessary to permit preparation of financial statements in accordancewith generally accepted accounting principles, and that receipts and expenditures of the company are being madeonly in accordance with authorizations of management and directors of the company; and (iii) provide reasonableassurance regarding prevention or timely detection of unauthorized acquisition, use, or disposition of thecompany’s assets that could have a material effect on the financial statements.
Because of its inherent limitations, internal control over financial reporting may not prevent or detectmisstatements. Also, projections of any evaluation of effectiveness to future periods are subject to the risk thatcontrols may become inadequate because of changes in conditions, or that the degree of compliance with thepolicies or procedures may deteriorate.
/s/ PricewaterhouseCoopers LLP
Tampa, FloridaMarch 11, 2009
F-2

Report of Independent Registered Public Accounting Firm
To the Board of Directors and Shareowners of Cott Corporation:
In our opinion, the consolidated financial statements listed in the accompanying index present fairly, in allmaterial respects, the financial position of Cott Corporation and its subsidiaries at December 29, 2007, and theresults of their operations and their cash flows for each of the two years in the period ended December 29, 2007,in conformity with accounting principles generally accepted in the United States of America. In addition, in ouropinion, the financial statement schedule listed in the index appearing under Item 15(a)(2) of Form 10-K for eachof the two years in the period ended December 29, 2007 presents fairly, in all material respects, the informationset forth therein when read in conjunction with the related consolidated financial statements. These financialstatements and financial statement schedule are the responsibility of the Company’s management. Ourresponsibility is to express an opinion on these financial statements and financial statement schedule based onour audits. We conducted our audits of these statements in accordance with the standards of the Public CompanyAccounting Oversight Board (United States). Those standards require that we plan and perform the audit toobtain reasonable assurance about whether the financial statements are free of material misstatement. An auditincludes examining, on a test basis, evidence supporting the amounts and disclosures in the financial statements,assessing the accounting principles used and significant estimates made by management, and evaluating theoverall financial statement presentation. We believe that our audits provide a reasonable basis for our opinion.
As discussed in Note 1 to the consolidated financial statements, the Company adopted FASB InterpretationNo. 48 “Accounting for Uncertainty in Income Taxes — an interpretation of FASB Statement No. 109.”
/s/ PricewaterhouseCoopers LLP
Chartered Accountants, Licensed Public AccountantsToronto, OntarioMarch 10, 2008, except for Note 9, for which the date is as of March 11, 2009
F-3

Cott Corporation
Consolidated Statements of (Loss) Income
For the Years Ended
(In millions of U.S. dollars except share and per share data)December 27,
2008December 29,
2007December 30,
2006
Revenue, net . . . . . . . . . . . . . . . . . . . . . . . . . . . . . . . . . . . . . . . . . . . . . . $1,648.1 $1,776.4 $1,771.8Cost of sales . . . . . . . . . . . . . . . . . . . . . . . . . . . . . . . . . . . . . . . . . . . . . . 1,467.1 1,578.0 1,554.9
Gross profit . . . . . . . . . . . . . . . . . . . . . . . . . . . . . . . . . . . . . . . . . . . . . . 181.0 198.4 216.9Selling, general and administrative expenses . . . . . . . . . . . . . . . . . . . . . 179.8 161.9 176.1Loss on disposal of property, plant & equipment . . . . . . . . . . . . . . . . . . 1.3 0.2 —Restructuring, asset and goodwill impairments—Note 2
Restructuring . . . . . . . . . . . . . . . . . . . . . . . . . . . . . . . . . . . . . . . . . . 6.7 24.3 20.5Goodwill impairments . . . . . . . . . . . . . . . . . . . . . . . . . . . . . . . . . . . 69.2 55.8 —Asset impairments . . . . . . . . . . . . . . . . . . . . . . . . . . . . . . . . . . . . . . 37.0 10.7 15.4Other . . . . . . . . . . . . . . . . . . . . . . . . . . . . . . . . . . . . . . . . . . . . . . . . — — 2.6
Operating (loss) income . . . . . . . . . . . . . . . . . . . . . . . . . . . . . . . . . . . . (113.0) (54.5) 2.3Other (income) expense, net . . . . . . . . . . . . . . . . . . . . . . . . . . . . . . . . . . (4.7) (4.7) 0.1Interest expense, net . . . . . . . . . . . . . . . . . . . . . . . . . . . . . . . . . . . . . . . . 32.3 32.8 32.2Minority interest . . . . . . . . . . . . . . . . . . . . . . . . . . . . . . . . . . . . . . . . . . . 1.7 2.7 3.8
Loss before income taxes . . . . . . . . . . . . . . . . . . . . . . . . . . . . . . . . . . . (142.3) (85.3) (33.8)Income tax benefit—Note 5 . . . . . . . . . . . . . . . . . . . . . . . . . . . . . . . . . . (19.5) (13.9) (16.3)
Net loss . . . . . . . . . . . . . . . . . . . . . . . . . . . . . . . . . . . . . . . . . . . . . . . . . . $ (122.8) $ (71.4) $ (17.5)
Net loss per common share—Note 8Basic . . . . . . . . . . . . . . . . . . . . . . . . . . . . . . . . . . . . . . . . . . . . . . . . $ (1.73) $ (0.99) $ (0.24)Diluted . . . . . . . . . . . . . . . . . . . . . . . . . . . . . . . . . . . . . . . . . . . . . . . $ (1.73) $ (0.99) $ (0.24)
Weighted average outstanding shares (thousands)Basic . . . . . . . . . . . . . . . . . . . . . . . . . . . . . . . . . . . . . . . . . . . . . . . . 71,017 71,831 71,726Diluted . . . . . . . . . . . . . . . . . . . . . . . . . . . . . . . . . . . . . . . . . . . . . . . 71,017 71,831 71,773
The accompanying notes are an integral part of these consolidated financial statements.
F-4

Cott Corporation
Consolidated Balance Sheets
(In millions of U.S. dollars except share data)December 27,
2008December 29,
2007
AssetsCurrent assets
Cash & cash equivalents . . . . . . . . . . . . . . . . . . . . . . . . . . . . . . . . . . . . . . . . . . . $ 14.7 $ 27.4Accounts receivable, net of allowance of $5.5 ($4.9 as ofDecember 29, 2007) . . . . . . . . . . . . . . . . . . . . . . . . . . . . . . . . . . . . . . . . . . . . . 164.4 195.4
Income taxes recoverable . . . . . . . . . . . . . . . . . . . . . . . . . . . . . . . . . . . . . . . . . . . 7.7 32.8Inventories—Note 11 . . . . . . . . . . . . . . . . . . . . . . . . . . . . . . . . . . . . . . . . . . . . . . 111.1 130.1Prepaid and other expenses . . . . . . . . . . . . . . . . . . . . . . . . . . . . . . . . . . . . . . . . . 9.3 10.2Deferred income taxes . . . . . . . . . . . . . . . . . . . . . . . . . . . . . . . . . . . . . . . . . . . . . 3.0 2.5
310.2 398.4Property, plant and equipment . . . . . . . . . . . . . . . . . . . . . . . . . . . . . . . . . . . . . . . . . . . 346.8 388.4Goodwill . . . . . . . . . . . . . . . . . . . . . . . . . . . . . . . . . . . . . . . . . . . . . . . . . . . . . . . . . . . 27.0 108.3Intangibles and other assets—Note 13 . . . . . . . . . . . . . . . . . . . . . . . . . . . . . . . . . . . . . 169.6 236.0Deferred income taxes . . . . . . . . . . . . . . . . . . . . . . . . . . . . . . . . . . . . . . . . . . . . . . . . . 10.3 13.3Other tax receivable . . . . . . . . . . . . . . . . . . . . . . . . . . . . . . . . . . . . . . . . . . . . . . . . . . . 9.2 —
$873.1 $1,144.4
Liabilities and Shareowners’ EquityCurrent liabilities
Short-term borrowings—Note 15 . . . . . . . . . . . . . . . . . . . . . . . . . . . . . . . . . . . . $107.5 $ 137.0Current maturities of long-term debt . . . . . . . . . . . . . . . . . . . . . . . . . . . . . . . . . . 7.6 2.4Income taxes payable . . . . . . . . . . . . . . . . . . . . . . . . . . . . . . . . . . . . . . . . . . . . . . 0.1 —Accounts payable and accrued liabilities . . . . . . . . . . . . . . . . . . . . . . . . . . . . . . . 166.7 195.4
281.9 334.8Long-term debt—Note 15 . . . . . . . . . . . . . . . . . . . . . . . . . . . . . . . . . . . . . . . . . . . . . . 294.4 269.0Other long-term liabilities—Note 2 . . . . . . . . . . . . . . . . . . . . . . . . . . . . . . . . . . . . . . . 16.0 18.1Other tax liabilities . . . . . . . . . . . . . . . . . . . . . . . . . . . . . . . . . . . . . . . . . . . . . . . . . . . . 18.3 36.6Deferred income taxes . . . . . . . . . . . . . . . . . . . . . . . . . . . . . . . . . . . . . . . . . . . . . . . . . 16.0 34.1
626.6 692.6Contingencies and Commitments—Note 17Minority interest . . . . . . . . . . . . . . . . . . . . . . . . . . . . . . . . . . . . . . . . . . . . . . . . . . . . 17.3 19.6
Shareowners’ equityCapital stock, no par—71,871,330 (2007 – 71,871,330) shares issued . . . . . . . . . . . . 275.0 275.0Treasury stock—Note 18 . . . . . . . . . . . . . . . . . . . . . . . . . . . . . . . . . . . . . . . . . . . . . . . (6.4) —Restricted shares . . . . . . . . . . . . . . . . . . . . . . . . . . . . . . . . . . . . . . . . . . . . . . . . . . . . . — (0.4)Additional paid-in-capital . . . . . . . . . . . . . . . . . . . . . . . . . . . . . . . . . . . . . . . . . . . . . . 38.1 32.2(Accumulated deficit) retained earnings . . . . . . . . . . . . . . . . . . . . . . . . . . . . . . . . . . . (29.7) 93.1Accumulated other comprehensive income (loss) . . . . . . . . . . . . . . . . . . . . . . . . . . . . (47.8) 32.3
229.2 432.2
$873.1 $1,144.4
Approved by the Board of Directors:
/s/ Graham Savage
Director
The accompanying notes are an integral part of these consolidated financial statements.
F-5

Cott Corporation
Consolidated Statements of Shareowners’ Equity
(In millions of U.S. dollars exceptshare data)
Number ofCommonShares(In
Thousands)
Number ofTreasuryShares(In
Thousands)CommonShares
TreasuryShares
RestrictedShares
AdditionalPaid-in-Capital
(AccumulatedDeficit)RetainedEarnings
AccumulatedOther
Comprehensive(Loss) Income
TotalEquity
Balance at December 31,2005 . . . . . . . . . . . . . . . . . . . . . 71,712 — $273.0 $— $— $18.4 $ 186.2 $ 4.3 $ 481.9
Options exercised—Note 6 . . . . . 38 — 0.4 — — — — — 0.4Restricted shares—Note 6 . . . . . . — — — — (0.7) — — — (0.7)Share-based compensation—Note 6 . . . . . . . . . . . . . . . . . . . — — — — — 11.4 — — 11.4
Comprehensive loss—Note 7Currency translationadjustment . . . . . . . . . . . . . . — — — — — — — 12.8 12.8
Change in unrealized loss oncash flow hedges . . . . . . . . . — 0.4 0.4
Net loss . . . . . . . . . . . . . . . . . . — — — — — — (17.5) — (17.5)
Other comprehensive loss . . (4.3)
Balance at December 30,2006 . . . . . . . . . . . . . . . . . . . . . 71,750 — $273.4 $— $(0.7) $29.8 $ 168.7 $ 17.5 $ 488.7
Options exercised—Note 6 . . . . . 53 — 0.5 — — — — — 0.5Common sharesissued—Note 6 . . . . . . . . . . . . 68 — 1.1 — — — — — 1.1
Restricted shares—Note 6 . . . . . . — — — — 0.3 — — — 0.3Share-based compensation—Note 6 . . . . . . . . . . . . . . . . . . . — — — — — 3.9 — — 3.9
Reclassified share-basedcompensation to liabilities—Note 6 . . . . . . . . . . . . . . . . . . . — — — — — (0.4) — — (0.4)
Adjustment for adoption of FASBInterpretationNo. 48—Note 5 . . . . . . . . . . . . — — — — — (4.6) (4.2) — (8.8)
Adjustment for adoptionSFAS 158 . . . . . . . . . . . . . . . . . — — — — — — — (2.2) (2.2)
Change in uncertain taxpositions—Note 5 . . . . . . . . . . — — — — — 3.5 — — 3.5
Comprehensive loss—Note 7Currency translationadjustment . . . . . . . . . . . . . . — — — — — — — 17.9 17.9
Pension liabilities . . . . . . . . . . . — — — — — — — (0.9) (0.9)Net loss . . . . . . . . . . . . . . . . . . — — — — — — (71.4) — (71.4)
Other comprehensive loss . . (54.4)
Balance at December 29,2007 . . . . . . . . . . . . . . . . . . . . . 71,871 — $275.0 $— $(0.4) $32.2 $ 93.1 $ 32.3 $ 432.2
Treasury shares—Note 18 . . . . . . — 1,954 — (5.4) — — — — (5.4)Treasury shares purchased—EISP—Note 18 . . . . . . . . . . . . — 353 — (1.0) — 1.0 — — —
Restricted shares—Note 6 . . . . . . — — — — 0.4 (0.4) — — —Share-based compensation—Note 6 . . . . . . . . . . . . . . . . . . . — — — — — 5.3 — — 5.3
Comprehensive loss—Note 7Currency translationadjustment . . . . . . . . . . . . . . — — — — — — — (76.6) (76.6)
Pension liabilities . . . . . . . . . . . — — — — — — — (3.5) (3.5)Net loss . . . . . . . . . . . . . . . . . . — — — — — — (122.8) — (122.8)
Other comprehensive loss . . (202.9)
Balance at December 27,2008 . . . . . . . . . . . . . . . . . . . . . 71,871 2,307 $275.0 $(6.4) $— $38.1 $ (29.7) $(47.8) $ 229.2
The accompanying notes are an integral part of these consolidated financial statements.
F-6

Cott Corporation
Consolidated Statements of Cash Flows
For the Years Ended
(In millions of U.S. dollars)December 27,
2008December 29,
2007December 30,
2006
Operating ActivitiesNet loss . . . . . . . . . . . . . . . . . . . . . . . . . . . . . . . . . . . . . . . . . . . . . . . . . . . . . $ (122.8) $(71.4) $ (17.5)Depreciation and amortization . . . . . . . . . . . . . . . . . . . . . . . . . . . . . . . . . . . 80.7 71.7 86.8Amortization of financing fees . . . . . . . . . . . . . . . . . . . . . . . . . . . . . . . . . . 1.1 1.8 1.1Share-based compensation expense . . . . . . . . . . . . . . . . . . . . . . . . . . . . . . . 5.6 4.2 11.4Deferred income taxes . . . . . . . . . . . . . . . . . . . . . . . . . . . . . . . . . . . . . . . . . (13.4) 0.1 (6.6)(Decrease) increase in other income tax liabilities . . . . . . . . . . . . . . . . . . . (22.7) 0.9 —Minority interest . . . . . . . . . . . . . . . . . . . . . . . . . . . . . . . . . . . . . . . . . . . . . . 1.7 2.7 3.8Gain on repurchase of notes . . . . . . . . . . . . . . . . . . . . . . . . . . . . . . . . . . . . . — (0.4) —Loss on disposal of property, plant & equipment . . . . . . . . . . . . . . . . . . . . 1.3 0.2 —Asset impairments . . . . . . . . . . . . . . . . . . . . . . . . . . . . . . . . . . . . . . . . . . . . 1.6 10.7 15.4Intangible asset impairments . . . . . . . . . . . . . . . . . . . . . . . . . . . . . . . . . . . . 35.4 — —Goodwill impairments . . . . . . . . . . . . . . . . . . . . . . . . . . . . . . . . . . . . . . . . . 69.2 55.8 —Lease contract termination loss . . . . . . . . . . . . . . . . . . . . . . . . . . . . . . . . . . 0.3 12.5 7.7Lease contract termination payments . . . . . . . . . . . . . . . . . . . . . . . . . . . . . . (3.8) (7.7) —Other non-cash items . . . . . . . . . . . . . . . . . . . . . . . . . . . . . . . . . . . . . . . . . . 3.1 (0.1) 4.3Change in accounts receivable . . . . . . . . . . . . . . . . . . . . . . . . . . . . . . . . . . . 8.5 (7.3) 9.9Change in inventories . . . . . . . . . . . . . . . . . . . . . . . . . . . . . . . . . . . . . . . . . . 6.4 7.0 15.2Change in prepaid expenses and other current assets . . . . . . . . . . . . . . . . . (0.7) 0.8 0.5Change in other assets . . . . . . . . . . . . . . . . . . . . . . . . . . . . . . . . . . . . . . . . . (6.0) — —Change in accounts payable and accrued liabilities . . . . . . . . . . . . . . . . . . . (3.9) 13.0 (22.6)Change in income taxes recoverable . . . . . . . . . . . . . . . . . . . . . . . . . . . . . . 25.3 (15.0) —
Net cash provided by operating activities . . . . . . . . . . . . . . . . . . . . . . 66.9 79.5 109.4
Investing ActivitiesAdditions to property, plant and equipment . . . . . . . . . . . . . . . . . . . . . . . . . (55.9) (73.3) (35.1)Additions to intangibles . . . . . . . . . . . . . . . . . . . . . . . . . . . . . . . . . . . . . . . . (3.4) (3.9) (13.0)Proceeds from disposal of property, plant & equipment . . . . . . . . . . . . . . . 4.5 1.3 1.6Acquisition of businesses and business assets . . . . . . . . . . . . . . . . . . . . . . . — (2.2) —
Net cash used in investing activities . . . . . . . . . . . . . . . . . . . . . . . . . . (54.8) (78.1) (46.5)
Financing ActivitiesPayments of long-term debt . . . . . . . . . . . . . . . . . . . . . . . . . . . . . . . . . . . . . (9.0) (8.3) (1.0)Issuance of long-term debt . . . . . . . . . . . . . . . . . . . . . . . . . . . . . . . . . . . . . . 33.8 1.4 —Payments on credit facility, net . . . . . . . . . . . . . . . . . . . . . . . . . . . . . . . . . . (127.5) — —Short-term borrowings, net . . . . . . . . . . . . . . . . . . . . . . . . . . . . . . . . . . . . . (8.1) 23.1 (65.9)Short-term borrowings, ABL . . . . . . . . . . . . . . . . . . . . . . . . . . . . . . . . . . . . 1,300.3 — —Short-term repayments, ABL . . . . . . . . . . . . . . . . . . . . . . . . . . . . . . . . . . . . (1,192.7) — —Distributions to subsidiary minority shareowner . . . . . . . . . . . . . . . . . . . . . (3.9) (3.9) (5.4)Issuance of common shares . . . . . . . . . . . . . . . . . . . . . . . . . . . . . . . . . . . . . — 0.5 0.4Purchase of treasury shares . . . . . . . . . . . . . . . . . . . . . . . . . . . . . . . . . . . . . (6.4) — —Deferred financing fees . . . . . . . . . . . . . . . . . . . . . . . . . . . . . . . . . . . . . . . . (5.3) — —Other financing activities . . . . . . . . . . . . . . . . . . . . . . . . . . . . . . . . . . . . . . . (0.5) (0.4) 0.6
Net cash (used in) provided by financing activities . . . . . . . . . . . . . . . (19.3) 12.4 (71.3)
Effect of exchange rate changes on cash . . . . . . . . . . . . . . . . . . . . . . . . . . . . . . . (5.5) 0.2 0.1
Net (decrease) increase in cash . . . . . . . . . . . . . . . . . . . . . . . . . . . . . . . . . . . . . (12.7) 14.0 (8.3)Cash, beginning of period . . . . . . . . . . . . . . . . . . . . . . . . . . . . . . . . . . . . . . . . . 27.4 13.4 21.7
Cash, end of period . . . . . . . . . . . . . . . . . . . . . . . . . . . . . . . . . . . . . . . . . . . . . . $ 14.7 $ 27.4 $ 13.4
Supplemental Noncash Financing Activities:Capital lease additions . . . . . . . . . . . . . . . . . . . . . . . . . . . . . . . . . . . . . . . . . $ 4.6 $ — $ 4.5
Supplemental Disclosure of Cash Paid For:Interest . . . . . . . . . . . . . . . . . . . . . . . . . . . . . . . . . . . . . . . . . . . . . . . . . . . . . $ 31.1 $ 33.3 $ 32.1Income taxes paid (refund), net . . . . . . . . . . . . . . . . . . . . . . . . . . . . . . . . . . (9.6) (0.2) 7.7
The accompanying notes are an integral part of these consolidated financial statements.
F-7

Notes to Consolidated Financial Statements
Description of Business
Cott Corporation, together with its consolidated subsidiaries (“Cott,” “the Company,” “our Company,”“Cott Corporation,” “we,” “us,” or “our”), is one of the world’s largest non-alcoholic beverage companies andthe world’s largest retailer brand soft drink provider. In addition to carbonated soft drinks (“CSDs”), our productlines include clear, still and sparkling flavored waters, juice-based products, bottled water, energy drinks andready-to-drink teas.
Note 1—Summary of Significant Accounting Policies
Basis of presentation
These consolidated financial statements have been prepared in accordance with United States (“U.S.”)generally accepted accounting principles (“GAAP”) using the U.S. dollar as the reporting currency, as themajority of our business and the majority of our shareowners are in the U.S.
We operate in five operating segments—North America (which includes the U.S. reporting unit and Canadareporting unit), United Kingdom (“U.K.”) (which includes our United Kingdom reporting unit and ourContinental European reporting unit), Mexico, Royal Crown International (“RCI”) and All Other (which includesour Asian reporting unit). We closed our active Asian operations at the end of fiscal year 2008. We changed ouroperating segments in the third quarter of 2008 to reflect a change in our management structure and howinformation is reported to management.
Basis of consolidation
The financial statements consolidate our accounts, our wholly-owned and majority-owned subsidiaries andjoint ventures where we are exposed to the majority of the expected losses or returns. All intercompanytransactions and accounts have been eliminated in consolidation.
During the period ended September 27, 2008, we identified an error related to the expensing of certaininformation technology software costs that were previously capitalized and amortized over an estimated life andduring the period ended December 27, 2008, we identified errors relating to foreign exchange gains and lossesrelating to intercompany debt transactions. We assessed the materiality of these items on the income for the fullfiscal year ended December 27, 2008, as well as for the quarter ended September 27, 2008, year endedDecember 29, 2007 and all other periods subsequent to those dates, in accordance with the SEC’s StaffAccounting Bulletin No. 99 (“SAB 99”), and concluded that these errors were not material to any such periods.In accordance with SEC’s Staff Accounting Bulletin No. 108 (“SAB 108”), the December 27, 2008 consolidatedfinancial statements herein have been revised to correct the immaterial errors and to reflect the corrected balancesof other expense, currency translation adjustment, intangible assets and selling, general and administrativeexpenses as of that date. This correction resulted in a reduction of intangible assets of $4.6 million and anincrease in selling, general and administrative expenses of $4.6 million and net other expense of $1.0 million inthe Consolidated Statements of (Loss) Income.
Accumulated Other Comprehensive Loss as of December 29, 2007 includes an out of period adjustment torecord the unfunded liability of our U.K. Pension Plan. The adjustment of $2.2 million (net of income tax of $0.9million) was to adopt SFAS No. 158, “Employers’ Accounting for Defined Benefit Pension and OtherPostretirement Plans, an amendment of FASB Statements No 87, 88, 106 and 132(R)” (“SFAS 158”), whichrequired that we record the unfunded status of the pension plan. We should have recognized this adjustment toAccumulated Other Comprehensive Loss on December 30, 2006. In addition, we recorded an out of periodadjustment in Accumulated Other Comprehensive Loss to recognize a minimum pension liability of $0.9 million(net of tax of $0.3 million) as required by SFAS No. 87 “Employers Accounting for Pensions” (“SFAS 87”) andSFAS 158 for our U.K. Pension Plan. Since the U.K. pension plan is sponsored by our U.K. subsidiary, therecording of the minimum plan liability required an out-of-period adjustment of $1.0 million to reduce the
F-8
currency translation adjustment recorded in Other Comprehensive Income (Loss). We should have recognizedminimum pension liabilities and the corresponding effect of currency translation in prior years. The recording ofthe pension plan did not have a material impact on the Consolidated Statement of Loss (Income) and we haveconcluded, through a quantitative and qualitative analysis, that the adjustments to Accumulated OtherComprehensive Loss are not material to 2007 or prior years’ consolidated financial statements.
Reclassifications and Revisions
Certain of the comparative figures have been revised to correctly reflect the current period’s presentation,which includes a reclassification of $4.5 million from accrued liabilities to accounts receivable and certainincome tax line items discussed in Note 5. The revision had no impact on Consolidated Statement of (Loss)Income and Statements of Cash Flows.
Estimates
The preparation of these consolidated financial statements in conformity with GAAP requires managementto make estimates and assumptions that affect the amounts reported in the consolidated financial statements andaccompanying notes. Actual results could differ from those estimates. The consolidated financial statementsinclude estimates and assumptions which, in the opinion of management, were significant to the underlyingamounts representing the future valuation of intangible assets and goodwill, accounting for share-basedcompensation, realization of deferred income tax assets and the resolution of tax contingencies. We review long-lived assets and goodwill for impairment whenever events or changes in circumstances indicate that the carryingamounts may not be recoverable. Determining whether impairment has occurred requires various estimates andassumptions including estimates of cash flows that are directly related to the potentially impaired asset, the usefullife over which cash flows will occur and their amounts. The measurement of an impairment loss requires anestimate of fair value, which is based on cash flow estimates and the application of an appropriate discount rate.
Recently issued accounting pronouncements
On December 30, 2007, we adopted Statement of Financial Accounting Standards (“SFAS”) No. 157, “FairValue Measurements” (“SFAS 157”) for financial assets and liabilities. There was no cumulative effect related tothe adoption of SFAS 157 and the adoption did not have a material impact on our financial position or results ofoperations. As permitted by FASB Staff Position No. FAS 157-2, “Effective Date of FASB Statement No. 157,”we elected to defer the adoption of SFAS 157 for all nonfinancial assets and nonfinancial liabilities, except thosethat are recognized or disclosed at fair value in our financial statements on a recurring basis.
In February 2007, the FASB issued SFAS No. 159, “The Fair Value Option for Financial Assets andFinancial Liabilities—Including an Amendment of FASB Statement No. 115” (“SFAS 159”), which permitsentities to choose to measure many financial instruments and certain other items at fair value. SFAS 159 alsoincludes an amendment to SFAS No. 115, “Accounting for Certain Investments in Debt and Equity Securities,”which applies to all entities with available-for-sale and trading securities. This statement is effective as of thebeginning of an entity’s first fiscal year that began after November 15, 2007. We chose not to elect the fair valueoption for our financial assets and liabilities existing at December 30, 2007, and did not elect the fair valueoption on financial assets and liabilities transacted in the year ended December 27, 2008. Therefore, the adoptionof SFAS 159 had no impact on our consolidated financial statements.
In December 2007, the FASB issued SFAS No. 141 (revised 2007), “Business Combinations.” Thisstatement significantly changes the financial accounting and reporting of business combination transactions. Theprovisions of this statement are to be applied prospectively to business combination transactions in the firstannual reporting period beginning on or after December 15, 2008. We expect this to have an impact on ouraccounting for future business combinations once adopted but the effect is dependent upon acquisitions made inthe future.
F-9

In December 2007, the FASB issued SFAS No. 160, “Noncontrolling Interests in Consolidated FinancialStatements—an amendment of ARB No. 51” (“SFAS 160”). SFAS 160 establishes accounting and reportingstandards for noncontrolling interests in subsidiaries. This statement requires the reporting of all noncontrollinginterests as a separate component of stockholders’ equity, the reporting of consolidated net income (loss) as theamount attributable to both the parent and the noncontrolling interests and the separate disclosure of net income(loss) attributable to the parent and to the noncontrolling interests. In addition, this statement provides accountingand reporting guidance related to changes in noncontrolling ownership interests. Other than the reportingrequirements described above which require retrospective application, the provisions of SFAS 160 are to beapplied prospectively in the first annual reporting period beginning on or after December 15, 2008. We will bereporting minority interest as a component of equity in our Consolidated Balance Sheets and below income taxexpense in our Consolidated Statement of (Loss) Income. As minority interest will be recorded below income taxexpense, it will have an impact on our total effective tax rate, but our total taxes will not change.
In March 2008, the FASB issued SFAS No. 161, “Disclosures about Derivative Instruments and HedgingActivities—an amendment of FASB Statement No. 133” (“SFAS 161”). SFAS 161 increases the disclosurerequirements for derivative instruments and hedging activities to improve the transparency of financial reporting.Entities are required to provide enhanced disclosures about (a) how and why an entity uses derivativeinstruments, (b) how derivative instruments and related hedged items are accounted for under Statement No. 133and its related interpretations, and (c) how derivative instruments and related hedged items affect an entity’sfinancial position, financial performance, and cash flows. The provisions of this statement are to be appliedprospectively in the first annual reporting period beginning on or after November 15, 2008 with comparativedisclosures for earlier periods at initial adoption being optional. We are currently evaluating the impact of thisstandard on our disclosure. Since we currently do not have any derivative instruments for which SFAS 161applies, we do not expect any impact upon adoption of this statement.
In December 2008, the FASB issued FASB Staff Position (FSP) No.132 (R)-1, “Employers’ Disclosuresabout Pensions and Other Postretirement Benefits” (“FSP 132R-1”). FSP 132R-1 requires enhanced disclosuresabout the plan assets of a Company’s defined benefit pension and other postretirement plans. The enhanceddisclosures required by this FSP are intended to provide users of financial statements with a greaterunderstanding of: (1) how investment allocation decisions are made, including the factors that are pertinent to anunderstanding of investment policies and strategies; (2) the major categories of plan assets; (3) the inputs andvaluation techniques used to measure the fair value of plan assets; (4) the effect of fair value measurements usingsignificant unobservable inputs (Level 3) on changes in plan assets for the period; and (5) significantconcentrations of risk within plan assets. This FSP is effective for us for the year ending December 26, 2009.
In April 2008, the FASB issued FASB Staff Position (“FSP”) No. 142-3, “Determination of the Useful Lifeof Intangible Assets” (“FSP 142-3”). FSP 142-3 amends the factors to be considered in developing renewal orextension assumptions used to determine the useful life of intangible assets under SFAS No. 142, “Goodwill andOther Intangible Assets.” Its intent is to improve the consistency between the useful life of an intangible assetand the period of expected cash flows used to measure its fair value. This FSP becomes effective for us onDecember 28, 2008. We are still in the process of evaluating the impact of FSP 142-3 on our consolidatedfinancial statements.
Revenue recognition
We recognize revenue, net of sales returns, when ownership passes to customers for products manufacturedin our own plants and/or by third parties on our behalf, and when prices to our customers are fixed and collectionis reasonably assured. This may be upon shipment of goods or upon delivery to the customer, depending oncontractual terms. Shipping and handling costs paid by the customer to us are included in revenue. Although weaccept returns of products from our customers occasionally, such returns, historically, have not been material.
F-10

Sales incentives
We participate in various incentive programs with our customers, including volume-based incentives,promotional allowance incentives and contractual rebate incentives. Sales incentives are based on our customersachieving volume targets for a period of time. They are deducted from revenue and accrued as the incentives areearned and are based on management’s estimate of the total the customer is expected to earn and claim. Weregularly review customer sales forecasts to ensure volume targets will be met and adjust incentive accrualsaccordingly.
Cost of sales
We record shipping and handling and finished goods inventory costs in cost of sales. Finished goodsinventory costs include the cost of direct labor and materials and the applicable share of overhead expensechargeable to production.
Selling, general and administrative expenses
We record all other expenses not charged to production as selling, general and administrative expenses.
Share-based compensation
Effective January 1, 2006, we adopted SFAS No. 123R, “Share-Based Payments” (“SFAS 123R”), using themodified prospective approach and therefore have not restated results for prior periods. Under the modifiedprospective approach, share-based compensation expense for the year ended December 30, 2006 includescompensation expense for all share-based compensation awards granted prior to, but not yet vested as ofJanuary 1, 2006, based on the grant date fair value estimated in accordance with the original provision of SFASNo. 123, “Accounting for Stock-Based Compensation” (“SFAS 123”). Share-based compensation expense for allshare-based compensation awards granted after January 1, 2006 is based on the grant-date fair value estimated inaccordance with the provisions of SFAS 123R. We recognized these compensation costs net of a forfeiture rateon a straight-line basis over the requisite service period of the award, which is generally the vesting term of threeyears. We estimated the forfeiture rate for fiscal 2006 based on our historical experience with forfeitures duringthe preceding three fiscal years.
Upon adoption of SFAS 123R, we used the long form method for calculating the tax effect of share-basedcompensation. Under this method, we determine the beginning balance of additional paid-in capital related to thetax effects of the employee share-based compensation as if we had adopted the recognition provisions of SFAS123 since its effective date of January 1, 1995. On an ongoing basis, additional paid-in capital is adjusted by thetax impact related to the difference between the amount deducted for tax purposes and the compensation cost foraccounting purposes. Where the tax deduction exceeds book compensation cost, an increase in additional paid-incapital is recorded. Where the tax deduction is less than book compensation cost, a reduction in additionalpaid-in capital is recorded to the extent there is an accumulated balance or charged to income tax expense if ashortfall remains after the accumulated additional paid-in capital is brought to zero.
Cash and Cash Equivalents
Cash and cash equivalents include all highly liquid investments with original maturities not exceeding threemonths at the time of purchase. The fair values of our cash and cash equivalents approximate the amounts shownon our Consolidated Balance Sheets due to their short-term nature.
Allowance for Doubtful Accounts
A portion of our accounts receivable are not expected to be collected due to non-payment, bankruptcies andsales returns. Our accounting policy for the provision for doubtful accounts requires us to reserve an amountbased on the evaluation of the aging of accounts receivable, sales return trend analysis, detailed analysis of high-risk customers’ accounts, and the overall market and economic conditions of our customers.
F-11

Inventories
Inventories are stated at the lower of cost, determined on the first-in, first-out method, or net realizablevalue. Returnable bottles and plastic shells are valued at the lower of cost, deposit value or net realizable value.Finished goods and work-in-process include the cost of raw materials, direct labor and manufacturing overheadcosts.
Property, plant and equipment
Property, plant and equipment are stated at cost less accumulated depreciation. Depreciation is determinedusing the straight-line method over the estimated useful lives of the assets as follows:
Buildings . . . . . . . . . . . . . . . . . . . . . . . . . . . . . . . . . . . . . . . . . . . . . . . . . . . . . 10 to 50 yearsMachinery and equipment . . . . . . . . . . . . . . . . . . . . . . . . . . . . . . . . . . . . . . . 7 to 15 yearsFurniture and fixtures . . . . . . . . . . . . . . . . . . . . . . . . . . . . . . . . . . . . . . . . . . . 3 to 10 yearsPlates, films and molds . . . . . . . . . . . . . . . . . . . . . . . . . . . . . . . . . . . . . . . . . . 0 to 10 yearsVending . . . . . . . . . . . . . . . . . . . . . . . . . . . . . . . . . . . . . . . . . . . . . . . . . . . . . . 5 to 10 yearsTransportation equipment . . . . . . . . . . . . . . . . . . . . . . . . . . . . . . . . . . . . . . . . 3 to 15 years
Leasehold improvements are amortized using the straight-line method over the remaining life of the lease.Maintenance and repairs are charged to operating expense when incurred.
Goodwill and indefinite life intangible assets
December 27 December 29(in millions of U.S. dollars) 2008 2007
Balance at beginning of year . . . . . . . . . . . . . . . . . . . . . . . . . . . . $108.3 $158.4Impairment losses recognized—Note 2 . . . . . . . . . . . . . . . . . . . . (69.2) (55.8)Foreign exchange . . . . . . . . . . . . . . . . . . . . . . . . . . . . . . . . . . . . . (12.1) 5.7
Balance at end of year . . . . . . . . . . . . . . . . . . . . . . . . . . . . . . . . $ 27.0 $108.3
Goodwill represents the excess purchase price of acquired businesses over the fair value of the net assetsacquired. With the implementation of SFAS No. 142, “Goodwill and Other Intangible Assets” (“SFAS 142”) in2002, goodwill and intangible assets with an indefinite life are no longer amortized, but instead are tested at leastannually for impairment in the fourth quarter or more frequently if we determine a triggering event has occurredduring the year. Any impairment loss is recognized in our results of operations. In accordance with SFAS 142,we evaluate goodwill for impairment on an operating segment basis. Operating segments are operations forwhich discrete financial information is available. The evaluation of goodwill for each operating segment is basedupon the following approach. We compare the fair value of an operating segment to its carrying amount. Wherethe carrying amount is greater than the fair value, the implied fair value of the operating segment goodwill isdetermined by allocating the fair value of the operating segment to all the assets and liabilities of the operatingsegment with any of the remainder being allocated to goodwill. The implied fair value of the operating segmentgoodwill is then compared to the carrying amount of that goodwill to determine the impairment loss. Anyimpairment in value is recognized in net (loss) income.
We measure the fair value of reporting units using a mix of the income approach (which is based on thediscounted cash flow of the entity) and the public company approach. Because the business is assumed tocontinue in perpetuity, the discounted future cash flow includes a terminal value. The long-term growthassumptions incorporated into the discounted cash flow calculation reflect our long-term view of the market
F-12

(with estimated revenue changes between -6.0% and 9.0%) and a discount rate of 12.0%) based on the weightedaverage cost of capital a market participant would use if evaluating the reporting unit as an investment.
Each year during the fourth quarter, we re-evaluate the assumptions used to reflect changes in the businessenvironment. Based on the evaluation performed this year, we determined that the fair value of our Canadareporting unit exceeded its carrying amount and as a result further impairment testing was not required.
We determined that as of September 27, 2008, our United Kingdom reporting unit’s goodwill was impairedbased on our estimate of its fair value. This was triggered due to declines in our forecasts of volumes and theprofit margin of products in the United Kingdom, which resulted in lower revenues and operating income thanthe forecast used to value this asset in our 2007 impairment analysis. Allocating this fair value to the assets andliabilities to the United Kingdom reporting unit resulted in a $69.2 million goodwill impairment charge.
Our only intangible asset with an indefinite life relates to the 2001 acquisition of intellectual property fromRoyal Crown Company, Inc. including the right to manufacture our concentrates, with all related inventions,processes, technologies, technical and manufacturing information, know-how and the use of the Royal Crownbrand outside of North America and Mexico (the “Rights”) which has a net book value of $45.0 million as morefully described in Note 2 to the Financial Statements. Prior to 2001, we paid a volume based royalty to the RoyalCrown Company for purchase of concentrates. There are no legal, regulatory, contractual, competitive,economic, or other factors that limit the useful life of this intangible. In accordance with SFAS 142 and based onthe aforementioned factors, the life of the Rights is considered to be indefinite and therefore not amortized, andtested annually for impairment. For an intangible asset with an indefinite life, we compare the carrying amount ofthe rights to their fair value and where the carrying amount is greater than the fair value, we recognize in incomean impairment loss. To determine fair value, we use a relief from royalty method which calculates a fair valueroyalty rate which is applied to a forecast of future volume shipments of concentrate that is used to produceCSDs. The resulting future cash flows are discounted using the same assumptions discussed above for goodwill.We also evaluate on an annual basis, or more frequently if events or changes in circumstances so require, the fairvalue of the Rights. As of September 27, 2008, we recorded an asset impairment related to the Rights of $27.4million, triggered primarily due to the decline of our North America case volume (including reductions involume with Wal-Mart) and lower anticipated overseas concentrate volume by our RCI operating segment. Weincurred an additional $8.0 million asset impairment as of December 27, 2008 to reflect additional anticipatedvolume declines in our RCI operating segment for a total impairment of $35.4 million.
Due to the ongoing decline in the CSD markets we determined that as of December 29, 2007 our U.S.reporting unit’s goodwill was impaired based on our estimate of its fair value. Allocating this fair value to theassets and liabilities of the U.S. reporting unit resulted in a $55.0 million goodwill impairment charge. We alsodetermined that the decision to dispose of the Revelstoke, British Columbia operation resulted in a $0.8 millionimpairment of goodwill.
Intangibles and other assets
As of December 27, 2008, other intangible assets were $124.6 million, which consisted principally of $87.6million of customer relationships that arise from acquisitions and trademarks of $11.6 million. Customerrelationships are amortized on a straight-line basis for the period over which we expect to receive economicbenefits which is up to 15 years. We review the estimated useful life of these intangible assets annually takinginto consideration the specific net cash flows related to the intangible asset unless it is required more frequentlydue to a triggering event such as the loss of a customer. The permanent loss of any customer included in theintangible asset would result in impairment in the value of the intangible asset or accelerated amortization andcould lead to an impairment of fixed assets that were used to service that client.
F-13

Impairment of long-lived assets
We evaluate the recoverability of our long-lived assets whenever adverse events or changes in the businessclimate indicate that the expected undiscounted future cash flows from the related category of assets may be lessthan previously anticipated. If the net book value of the related category of assets exceeds the undiscountedfuture cash flows of the category of assets, or if we believe a certain asset’s future utilization is impaired, thecarrying amount would be reduced to the fair value and an impairment loss would be recognized. This analysisrequires us to make significant estimates and assumptions in projecting future cash flows, and changes in factsand circumstances could result in material changes in the amount of any impairment losses.
We assess whether there has been an impairment of long-lived assets and definite lived intangibles inaccordance with SFAS No. 144, “Accounting for the Impairment and Disposal of Long-Lived Assets.” If thecarrying amount of an asset, including associated intangibles, exceeds the sum of estimated undiscounted futurecash flows, then an impairment loss is recognized for the difference between estimated fair value and carryingamount. When we dispose of assets, the cost and related accumulated depreciation are removed from theaccounts, and any gains or losses are reflected in operating expenses.
Foreign currency translation
The assets and liabilities of non-U.S. active operations, all of which are self-sustaining, are translated at theexchange rates in effect at the balance sheet dates. Revenues and expenses are translated using average exchangerates prevailing during the period. The resulting gains or losses are recorded in accumulated comprehensiveincome under shareowners’ equity.
Taxation
We account for income taxes under the asset and liability method. Deferred tax assets and liabilities arerecognized based on the differences between the accounting values of assets and liabilities and their related taxbases using currently enacted income tax rates. A valuation allowance is established to reduce deferred incometax assets if, on the basis of available evidence, it is not more likely than not that all or a portion of any deferredtax assets will be realized. We classify interest and income tax penalties as income tax expense (benefit).
Effective December 31, 2006, we adopted FASB Interpretation No. 48, “Accounting for Uncertainty inIncome Taxes—an Interpretation of FASB Statement No. 109” (“FIN 48”), which provides specific guidance onthe financial statement recognition, measurement, reporting and disclosure of uncertain tax positions taken orexpected to be taken in a tax return. FIN 48 addresses the determination of whether tax benefits, either permanentor temporary, should be recorded in the financial statements. The Interpretation requires that differences betweenthe amounts recognized prior to the adoption of FIN 48 and the amounts reported after adoption are accountedfor as a cumulative-effect adjustment recorded to the beginning balance of retained earnings and othershareowner equity accounts. As a result of adopting FIN 48 as of the beginning of our 2007 fiscal year werecognized a $4.2 million decrease to retained earnings and $4.6 million decrease in additional paid-in- capital torecognize the cumulative effect of adoption.
Under FIN 48, we account for uncertain tax positions using a two-step process. The first step is to evaluatethe tax position for recognition by determining if the weight of available evidence indicates that it is more likelythan not that the position will be sustained on audit, including resolution of related appeals or litigationprocesses, if any. The second step requires us to estimate and measure the tax benefit as the largest amount that ismore than 50% likely to be realized upon ultimate settlement. It is inherently difficult and subjective to estimatesuch amounts, as we have to determine the probability of various possible outcomes. We re-evaluate theseuncertain tax positions on a quarterly basis. This evaluation is based on factors including, but not limited to,changes in facts or circumstances, changes in tax law, effectively settled issues under audit, and new auditactivity. Such a change in recognition or measurement would result in the recognition of a tax benefit or anadditional charge to the tax provision.
F-14
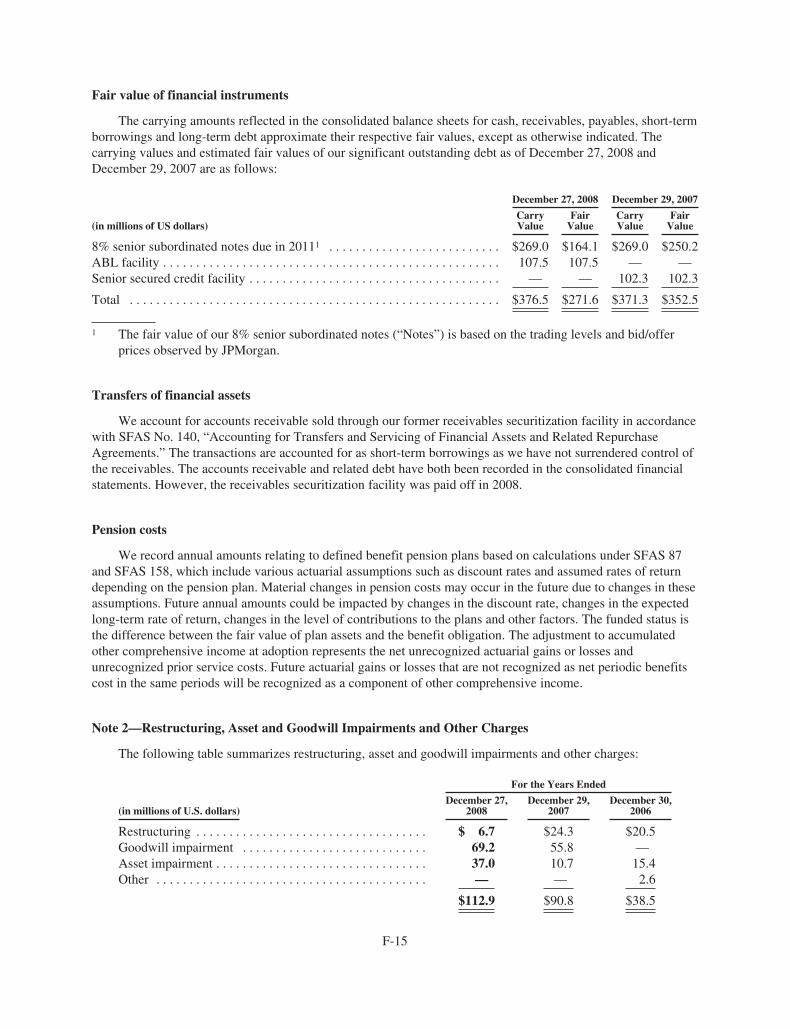
Fair value of financial instruments
The carrying amounts reflected in the consolidated balance sheets for cash, receivables, payables, short-termborrowings and long-term debt approximate their respective fair values, except as otherwise indicated. Thecarrying values and estimated fair values of our significant outstanding debt as of December 27, 2008 andDecember 29, 2007 are as follows:
December 27, 2008 December 29, 2007
(in millions of US dollars)CarryValue
FairValue
CarryValue
FairValue
8% senior subordinated notes due in 20111 . . . . . . . . . . . . . . . . . . . . . . . . . . $269.0 $164.1 $269.0 $250.2ABL facility . . . . . . . . . . . . . . . . . . . . . . . . . . . . . . . . . . . . . . . . . . . . . . . . . . . 107.5 107.5 — —Senior secured credit facility . . . . . . . . . . . . . . . . . . . . . . . . . . . . . . . . . . . . . . — — 102.3 102.3
Total . . . . . . . . . . . . . . . . . . . . . . . . . . . . . . . . . . . . . . . . . . . . . . . . . . . . . . . . $376.5 $271.6 $371.3 $352.5
1 The fair value of our 8% senior subordinated notes (“Notes”) is based on the trading levels and bid/offerprices observed by JPMorgan.
Transfers of financial assets
We account for accounts receivable sold through our former receivables securitization facility in accordancewith SFAS No. 140, “Accounting for Transfers and Servicing of Financial Assets and Related RepurchaseAgreements.” The transactions are accounted for as short-term borrowings as we have not surrendered control ofthe receivables. The accounts receivable and related debt have both been recorded in the consolidated financialstatements. However, the receivables securitization facility was paid off in 2008.
Pension costs
We record annual amounts relating to defined benefit pension plans based on calculations under SFAS 87and SFAS 158, which include various actuarial assumptions such as discount rates and assumed rates of returndepending on the pension plan. Material changes in pension costs may occur in the future due to changes in theseassumptions. Future annual amounts could be impacted by changes in the discount rate, changes in the expectedlong-term rate of return, changes in the level of contributions to the plans and other factors. The funded status isthe difference between the fair value of plan assets and the benefit obligation. The adjustment to accumulatedother comprehensive income at adoption represents the net unrecognized actuarial gains or losses andunrecognized prior service costs. Future actuarial gains or losses that are not recognized as net periodic benefitscost in the same periods will be recognized as a component of other comprehensive income.
Note 2—Restructuring, Asset and Goodwill Impairments and Other Charges
The following table summarizes restructuring, asset and goodwill impairments and other charges:
For the Years Ended
(in millions of U.S. dollars)December 27,
2008December 29,
2007December 30,
2006
Restructuring . . . . . . . . . . . . . . . . . . . . . . . . . . . . . . . . . . . $ 6.7 $24.3 $20.5Goodwill impairment . . . . . . . . . . . . . . . . . . . . . . . . . . . . 69.2 55.8 —Asset impairment . . . . . . . . . . . . . . . . . . . . . . . . . . . . . . . . 37.0 10.7 15.4Other . . . . . . . . . . . . . . . . . . . . . . . . . . . . . . . . . . . . . . . . . — — 2.6
$112.9 $90.8 $38.5
F-15

From 2006 through 2007, we implemented our North American Realignment and Cost Reduction Plan (the“North American Plan”) to realign the management of our Canadian and U.S. businesses to a North Americanbasis, rationalize product offerings, eliminate underperforming assets and increase focus on high potentialaccounts. We also closed several plants and warehouses in North America. In an effort to further align companyresources, we also decided to dispose of one of our water production facilities in Canada and certain hot-filledproduction assets at one of our co-packers. As part of the plan, we also realigned our reporting units in the UnitedKingdom, Mexico, RCI and Asian businesses into a combined International business to focus on cohesivecustomer management, channel development, and sales and marketing. In fiscal year 2007, we completed theimplementation of the North American Plan.
During the last three years we have undertaken two restructuring activities, the North American Plan andour plan to refocus on retailer brands and reduce costs in the operation of our business (the “Refocus Plan”). Wewill continue to pay cash related to restructuring accruals under the North American Plan and the Refocus Planover the next several years, but do not anticipate incurring any additional charges related to these plans.
In conjunction with the North American Plan, we closed our Lachine, Quebec juice plant (“Lachine”) inFebruary 2006 and in March 2006 we closed our Columbus, Ohio soft drink plant and warehouse (“Columbus”)to bring production capacity in line with the needs of our customers.
In addition, in October 2006, we announced the closures of our manufacturing plant in Elizabethtown,Kentucky (“Elizabethtown”) and our manufacturing plant and warehousing operations in Wyomissing,Pennsylvania (“Wyomissing”). We ceased production at both plants on December 30, 2006, and have reallocatedproduction volume to other manufacturing sites in North America. The Wyomissing warehouse was still inoperation as of December 30, 2006, and was closed in 2007.
In December 2007, we determined that certain hot fill equipment at one of our co-packers was no longerusable and placed this equipment up for sale and recorded an impairment loss of $7.2 million. We also decided todispose of one of our unprofitable plants located in Revelstoke, British Columbia (“Revelstoke”) and recorded arelated impairment loss of $2.6 million.
In 2008, we implemented the Refocus Plan, which resulted in a partial reduction of our workforce.
The following table is a summary of our cash restructuring charges through the year ended December 27,2008:
North American Plan:
(in millions of U.S. dollars)
Balance atJanuary 1,
2006
Chargeto Costsand
Expenses
Paymentsmadeduringthe year
Balance atDecember 30,
2006
Chargeto Costsand
Expenses
Paymentsmadeduringthe year
Balance atDecember 29,
2007
Severance and terminationbenefits . . . . . . . . . . . . . . . . $ 1.0 $12.1 $(7.7) $ 5.4 $11.8 $(15.1) $ 2.1
Lease contract terminationloss . . . . . . . . . . . . . . . . . . . . — 7.7 (0.4) 7.3 12.5 (7.7) 12.1
Other . . . . . . . . . . . . . . . . . . . . — 0.7 (0.7) — — — —
$ 1.0 $20.5 $(8.8) $12.7 $24.3 $(22.8) $14.2
(in millions of U.S. dollars)
Balance atDecember 29,
2007Charge to Costsand Expenses
Payments madeduring the year
Balance atDecember 27,
2008
Severance and termination benefits . . . . . . . . . . . . . . $ 2.1 $— $(2.1) $—Lease contract termination loss . . . . . . . . . . . . . . . . . 12.1 0.3 (2.8) 9.6
$14.2 $ 0.3 $(4.9) $ 9.6
F-16

Refocus Plan:
(in millions of U.S. dollars)
Balance atDecember 29,
2007
Charge toCosts andExpenses
Payments madeduring the year
Balance atDecember 27,
2008
Severance and termination benefits . . . . . . . . . . . . . . . . . . $— $6.4 $(6.4) $—
$— $6.4 $(6.4) $—
As of December 27, 2008, $5.8 million (December 29, 2007 – $12.1 million) of the lease contracttermination loss liability has been recorded as other long-term liabilities and $3.8 million of lease contracttermination loss liability (December 29, 2007—$2.1 million which included severance and termination benefits)has been classified as accounts payable and accrued liabilities. We also incurred $0.3 million of additionaltermination benefits in 2008 related to our Wyomissing property.
In 2008, we recorded pre-tax restructuring charges totaling $6.4 million in connection with severance costsrelating to headcount reductions associated with the Refocus Plan.
Year ended December 27, 2008
The following table sets out our restructuring, asset and goodwill impairments on a segmented basis for theyear ended December 27, 2008.
(in millions of U.S. dollars)North
America U.K. Total
Restructuring . . . . . . . . . . . . . . . . . . . . . . . . . . . . . . . . . . . . . . . . . . . . . . . $ 6.7 $ — $ 6.7Goodwill impairment . . . . . . . . . . . . . . . . . . . . . . . . . . . . . . . . . . . . . . . . . — 69.2 69.2Asset impairment . . . . . . . . . . . . . . . . . . . . . . . . . . . . . . . . . . . . . . . . . . . . 37.0 — 37.0
$43.7 $69.2 $112.9
Restructuring—On June 19, 2008, we announced the Refocus Plan. In 2008, we recorded pre-taxrestructuring charges totaling $6.4 million in connection with severance costs relating to headcount reductionsassociated with the Refocus Plan.
Asset impairments—In 2008, we recorded an asset impairment charge related to the Rights of $35.4 millionand recorded a $2.6 million asset impairment charge for our Elizabethtown facility. We also recovered $1.0million of previously impaired held-for-sale assets (hot filled production assets) in 2008.
Goodwill impairments—We recorded a goodwill impairment loss of $69.2 million associated with ourUnited Kingdom reporting unit as disclosed in Note 1.
Year ended December 29, 2007
The following table sets out our restructuring, asset and goodwill impairments on a segmented basis for theyear ended December 29, 2007.
(in millions of U.S. dollars)North
America U.K. RCI Total
Restructuring . . . . . . . . . . . . . . . . . . . . . . . . . . . . . . . . . . . . . . . . . $25.4 $(1.2) $ 0.1 $24.3Goodwill impairment . . . . . . . . . . . . . . . . . . . . . . . . . . . . . . . . . . . 55.8 — — 55.8Asset impairment . . . . . . . . . . . . . . . . . . . . . . . . . . . . . . . . . . . . . . 10.7 — — 10.7
$91.9 $(1.2) $ 0.1 $90.8
F-17

Restructuring—We recorded restructuring charges of $24.3 million for severance, contract and leasetermination costs relating the North American Plan.
Asset impairments—We recorded an impairment loss of $10.7 million, which is comprised of $0.9 millionfor certain software assets, $2.6 million for property, plant and equipment related to the disposal of theRevelstoke facility and $7.2 million for certain equipment at a co-packer.
Goodwill impairments—We recorded an impairment loss of $55.8 million, which is comprised of $0.8million for the disposal of the Revelstoke facility and $55.0 million for the U.S. reporting unit as disclosed inNote 1.
Year ended December 30, 2006
The following table sets out our restructuring, asset impairments and other charges on a segmented basis forthe year ended December 30, 2006.
(in millions of U.S. dollars)North
America U.K. RCI Total
Restructuring . . . . . . . . . . . . . . . . . . . . . . . . . . . . . . . . . . . . . . . . . $19.8 $ 0.5 $ 0.2 $20.5Asset impairment . . . . . . . . . . . . . . . . . . . . . . . . . . . . . . . . . . . . . . 15.4 — — 15.4Other . . . . . . . . . . . . . . . . . . . . . . . . . . . . . . . . . . . . . . . . . . . . . . . . — 2.6 — 2.6
$35.2 $ 3.1 $ 0.2 $38.5
Restructuring—We recorded restructuring charges of $20.5 million, including $14.7 million for severanceand contract termination costs relating to the closures of Columbus, Lachine, Elizabethtown and Wyomissing,$0.9 million of other severance costs relating to sales and marketing employees and $4.2 million for severancerelating to organizational streamlining. The remaining restructuring cost of $0.7 million related to consulting feesincurred in connection with restructuring activities.
Asset impairments—We recorded an impairment loss of $15.4 million, which was comprised of $14.2million for property, plant and equipment related to the closures of Elizabethtown and Wyomissing, $1.6 millionfor property, plant and equipment, customer list and information technology software related to the closure ofColumbus, and $0.1 million for property, plant and equipment relating to Lachine, net of a $0.5 million recoveryfrom the sale of other assets.
Other—Other items are primarily legal and consulting fees relating to the United Kingdom CompetitionCommission review of the Macaw Acquisition in the United Kingdom. On April 28, 2006, we received finalclearance of the review of our acquisition of Macaw (Holdings) Limited from the United Kingdom CompetitionCommission.
Note 3—Other (Income) Expense, Net
For the Years Ended
(in millions of U.S. dollars)December 27,
2008December 29,
2007December 30,
2006
Foreign exchange (gain) loss . . . . . . . . . . . . . . . . . . . . . . . $ 1.0 $(4.4) $(0.1)Gain on purchase of 8% senior subordinated notes . . . . . — (0.4) —Insurance reimbursement . . . . . . . . . . . . . . . . . . . . . . . . . (4.5) — —Other loss (gain) . . . . . . . . . . . . . . . . . . . . . . . . . . . . . . . . (1.2) 0.1 0.2
Total . . . . . . . . . . . . . . . . . . . . . . . . . . . . . . . . . . . . . . . . . $(4.7) $(4.7) $ 0.1
F-18
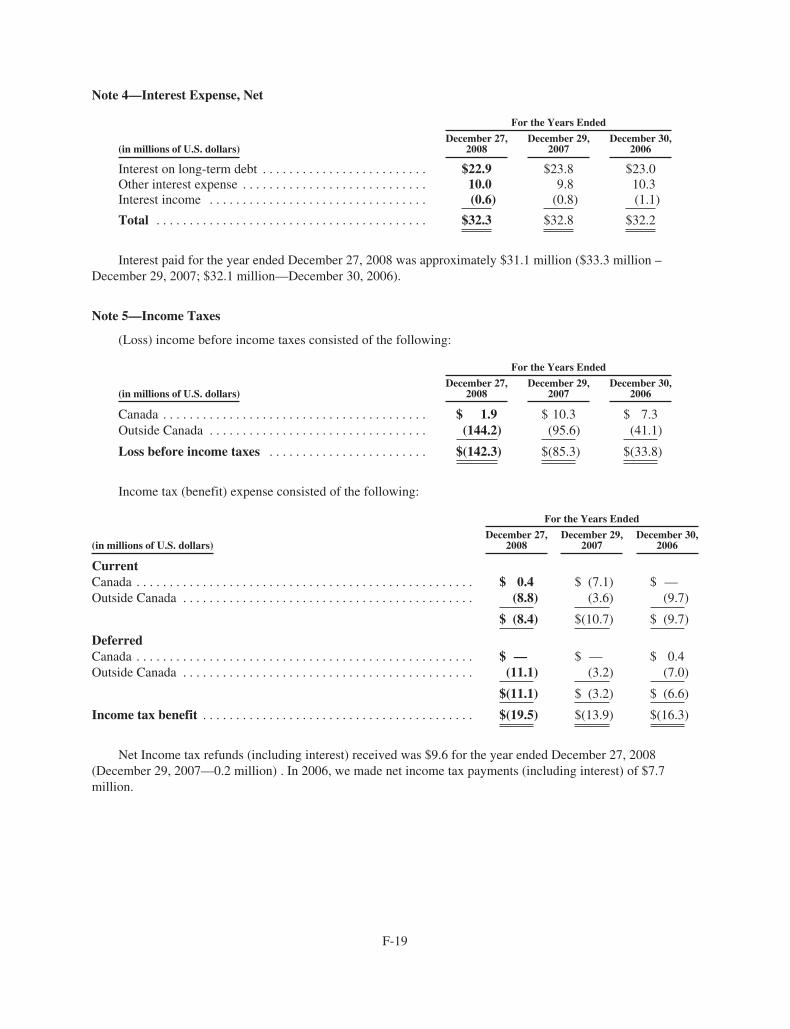
Note 4—Interest Expense, Net
For the Years Ended
(in millions of U.S. dollars)December 27,
2008December 29,
2007December 30,
2006
Interest on long-term debt . . . . . . . . . . . . . . . . . . . . . . . . . $22.9 $23.8 $23.0Other interest expense . . . . . . . . . . . . . . . . . . . . . . . . . . . . 10.0 9.8 10.3Interest income . . . . . . . . . . . . . . . . . . . . . . . . . . . . . . . . . (0.6) (0.8) (1.1)
Total . . . . . . . . . . . . . . . . . . . . . . . . . . . . . . . . . . . . . . . . . $32.3 $32.8 $32.2
Interest paid for the year ended December 27, 2008 was approximately $31.1 million ($33.3 million –December 29, 2007; $32.1 million—December 30, 2006).
Note 5—Income Taxes
(Loss) income before income taxes consisted of the following:
For the Years Ended
(in millions of U.S. dollars)December 27,
2008December 29,
2007December 30,
2006
Canada . . . . . . . . . . . . . . . . . . . . . . . . . . . . . . . . . . . . . . . . $ 1.9 $ 10.3 $ 7.3Outside Canada . . . . . . . . . . . . . . . . . . . . . . . . . . . . . . . . . (144.2) (95.6) (41.1)
Loss before income taxes . . . . . . . . . . . . . . . . . . . . . . . . $(142.3) $(85.3) $(33.8)
Income tax (benefit) expense consisted of the following:
For the Years Ended
(in millions of U.S. dollars)December 27,
2008December 29,
2007December 30,
2006
CurrentCanada . . . . . . . . . . . . . . . . . . . . . . . . . . . . . . . . . . . . . . . . . . . . . . . . . . . $ 0.4 $ (7.1) $ —Outside Canada . . . . . . . . . . . . . . . . . . . . . . . . . . . . . . . . . . . . . . . . . . . . (8.8) (3.6) (9.7)
$ (8.4) $(10.7) $ (9.7)
DeferredCanada . . . . . . . . . . . . . . . . . . . . . . . . . . . . . . . . . . . . . . . . . . . . . . . . . . . $ — $ — $ 0.4Outside Canada . . . . . . . . . . . . . . . . . . . . . . . . . . . . . . . . . . . . . . . . . . . . (11.1) (3.2) (7.0)
$(11.1) $ (3.2) $ (6.6)
Income tax benefit . . . . . . . . . . . . . . . . . . . . . . . . . . . . . . . . . . . . . . . . . $(19.5) $(13.9) $(16.3)
Net Income tax refunds (including interest) received was $9.6 for the year ended December 27, 2008(December 29, 2007—0.2 million) . In 2006, we made net income tax payments (including interest) of $7.7million.
F-19

The following table reconciles income taxes calculated at the basic Canadian corporate rates with theincome tax provision:
For the Years Ended
(in millions of U.S. dollars)December 27,
2008December 29,
2007December 30,
2006
Income tax benefit based on Canadian statutory rates . . . . . . . . . . . . . . $(45.4) $(29.2) $(11.6)Foreign tax rate differential . . . . . . . . . . . . . . . . . . . . . . . . . . . . . . . . . . . (4.5) (4.4) 2.0Inter-company debt structures . . . . . . . . . . . . . . . . . . . . . . . . . . . . . . . . . (3.3) (3.7) (4.5)Increase (decrease) in valuation allowance . . . . . . . . . . . . . . . . . . . . . . . 24.3 21.2 (3.5)(Decrease) increase to reserve . . . . . . . . . . . . . . . . . . . . . . . . . . . . . . . . . (12.7) (0.9) 0.8Non-deductible goodwill impairment . . . . . . . . . . . . . . . . . . . . . . . . . . . 21.7 6.0 —Other items . . . . . . . . . . . . . . . . . . . . . . . . . . . . . . . . . . . . . . . . . . . . . . . 0.4 (2.9) 0.5
Income tax benefit . . . . . . . . . . . . . . . . . . . . . . . . . . . . . . . . . . . . . . . . . . $(19.5) $(13.9) $(16.3)
In 2006, the FASB issued FASB Interpretation No. 48, “Accounting for Uncertainty in Income Taxes—anInterpretation of FASB Statement No. 109” (“FIN 48”), which provides specific guidance on the financialstatement recognition, measurement, reporting and disclosure of uncertain tax positions taken or expected to betaken in a tax return. FIN 48 addresses the determination of whether tax benefits, either permanent or temporary,should be recorded in the financial statements. We adopted FIN 48 as of the beginning of our 2007 fiscal yearand, as a result, recognized a $4.2 million decrease to retained earnings and $4.6 million decrease in additionalpaid-in-capital to recognize the cumulative effect of adoption.
A reconciliation of the beginning and ending amount of our unrecognized tax benefits is as follows:
(in millions of U.S. dollars) 2008 2007
Unrecognized tax benefits at beginning of year . . . . . . . . . . . . . . . . . . . . . . . . . . . . . . . . . . . . . . . $62.9 $ 63.8Additions based on tax positions taken during a prior period . . . . . . . . . . . . . . . . . . . . . . . . . . . . . 0.8 5.3Reductions based on tax positions taken during a prior period . . . . . . . . . . . . . . . . . . . . . . . . . . . . (9.5) (13.4)Settlement on tax positions taken during a prior period . . . . . . . . . . . . . . . . . . . . . . . . . . . . . . . . . (7.4) —Lapse in statue of limitations . . . . . . . . . . . . . . . . . . . . . . . . . . . . . . . . . . . . . . . . . . . . . . . . . . . . . . — (3.7)Additions based on tax positions taken during the current period . . . . . . . . . . . . . . . . . . . . . . . . . . 0.7 2.3Foreign exchange . . . . . . . . . . . . . . . . . . . . . . . . . . . . . . . . . . . . . . . . . . . . . . . . . . . . . . . . . . . . . . . (8.8) 8.6
Unrecognized tax benefits at end of year . . . . . . . . . . . . . . . . . . . . . . . . . . . . . . . . . . . . . . . . . . . $38.7 $ 62.9
As of December 27, 2008, we had total gross unrecognized tax benefits of $38.7 million, of which $19.7million would, if recognized, impact our effective tax rate over time. The comparable 2007 gross unrecognizedtax benefit amounts have been revised to exclude certain deferred tax assets that in the previous year were nettedagainst the unrecognized tax benefit.
Due to cumulative losses generated in the current and prior two years in the United States and Mexico, webelieve that it is more likely than not that the benefit from net operating loss carryforwards and other net deferredtax assets in these jurisdictions will not be realized in the future. In determining our conclusion that such assetswill not be able to be realized, we considered the current and past two years income/losses reported in thesejurisdictions, any recent changes to our business activities that could have a significant impact on recentoperating results reported in these jurisdictions, and the reversal of certain deferred tax liabilities during the sametime period as the operating losses and deferred tax assets in question. In recognition of this risk, we haveprovided a valuation allowance of $42.7 million on the net deferred tax assets relating to our net deferred taxassets in these jurisdictions. If our assumptions change and we determine we will be able to realize these deferredtax assets, the tax benefits relating to any reversal of the valuation allowance on deferred tax assets atDecember 27, 2008 will be accounted for as a income tax expense reduction.
F-20
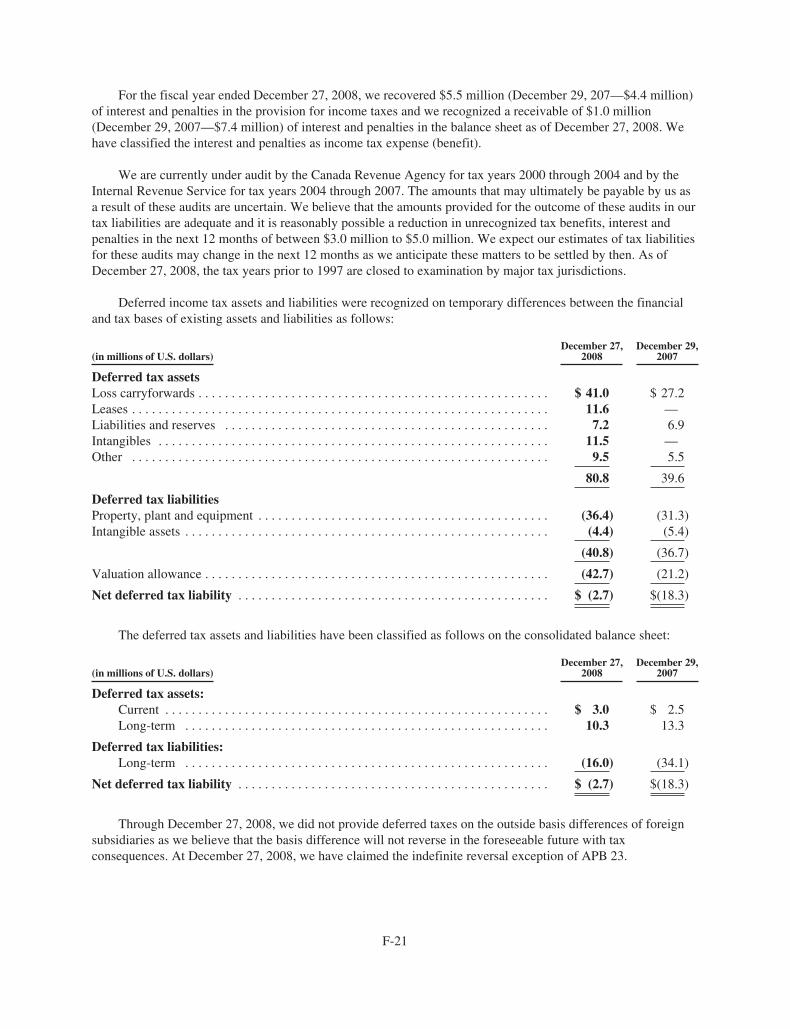
For the fiscal year ended December 27, 2008, we recovered $5.5 million (December 29, 207—$4.4 million)of interest and penalties in the provision for income taxes and we recognized a receivable of $1.0 million(December 29, 2007—$7.4 million) of interest and penalties in the balance sheet as of December 27, 2008. Wehave classified the interest and penalties as income tax expense (benefit).
We are currently under audit by the Canada Revenue Agency for tax years 2000 through 2004 and by theInternal Revenue Service for tax years 2004 through 2007. The amounts that may ultimately be payable by us asa result of these audits are uncertain. We believe that the amounts provided for the outcome of these audits in ourtax liabilities are adequate and it is reasonably possible a reduction in unrecognized tax benefits, interest andpenalties in the next 12 months of between $3.0 million to $5.0 million. We expect our estimates of tax liabilitiesfor these audits may change in the next 12 months as we anticipate these matters to be settled by then. As ofDecember 27, 2008, the tax years prior to 1997 are closed to examination by major tax jurisdictions.
Deferred income tax assets and liabilities were recognized on temporary differences between the financialand tax bases of existing assets and liabilities as follows:
(in millions of U.S. dollars)December 27,
2008December 29,
2007
Deferred tax assetsLoss carryforwards . . . . . . . . . . . . . . . . . . . . . . . . . . . . . . . . . . . . . . . . . . . . . . . . . . . . . $ 41.0 $ 27.2Leases . . . . . . . . . . . . . . . . . . . . . . . . . . . . . . . . . . . . . . . . . . . . . . . . . . . . . . . . . . . . . . . 11.6 —Liabilities and reserves . . . . . . . . . . . . . . . . . . . . . . . . . . . . . . . . . . . . . . . . . . . . . . . . . 7.2 6.9Intangibles . . . . . . . . . . . . . . . . . . . . . . . . . . . . . . . . . . . . . . . . . . . . . . . . . . . . . . . . . . . 11.5 —Other . . . . . . . . . . . . . . . . . . . . . . . . . . . . . . . . . . . . . . . . . . . . . . . . . . . . . . . . . . . . . . . 9.5 5.5
80.8 39.6
Deferred tax liabilitiesProperty, plant and equipment . . . . . . . . . . . . . . . . . . . . . . . . . . . . . . . . . . . . . . . . . . . . (36.4) (31.3)Intangible assets . . . . . . . . . . . . . . . . . . . . . . . . . . . . . . . . . . . . . . . . . . . . . . . . . . . . . . . (4.4) (5.4)
(40.8) (36.7)
Valuation allowance . . . . . . . . . . . . . . . . . . . . . . . . . . . . . . . . . . . . . . . . . . . . . . . . . . . . (42.7) (21.2)
Net deferred tax liability . . . . . . . . . . . . . . . . . . . . . . . . . . . . . . . . . . . . . . . . . . . . . . . $ (2.7) $(18.3)
The deferred tax assets and liabilities have been classified as follows on the consolidated balance sheet:
(in millions of U.S. dollars)December 27,
2008December 29,
2007
Deferred tax assets:Current . . . . . . . . . . . . . . . . . . . . . . . . . . . . . . . . . . . . . . . . . . . . . . . . . . . . . . . . . . $ 3.0 $ 2.5Long-term . . . . . . . . . . . . . . . . . . . . . . . . . . . . . . . . . . . . . . . . . . . . . . . . . . . . . . . 10.3 13.3
Deferred tax liabilities:Long-term . . . . . . . . . . . . . . . . . . . . . . . . . . . . . . . . . . . . . . . . . . . . . . . . . . . . . . . (16.0) (34.1)
Net deferred tax liability . . . . . . . . . . . . . . . . . . . . . . . . . . . . . . . . . . . . . . . . . . . . . . . $ (2.7) $(18.3)
Through December 27, 2008, we did not provide deferred taxes on the outside basis differences of foreignsubsidiaries as we believe that the basis difference will not reverse in the foreseeable future with taxconsequences. At December 27, 2008, we have claimed the indefinite reversal exception of APB 23.
F-21
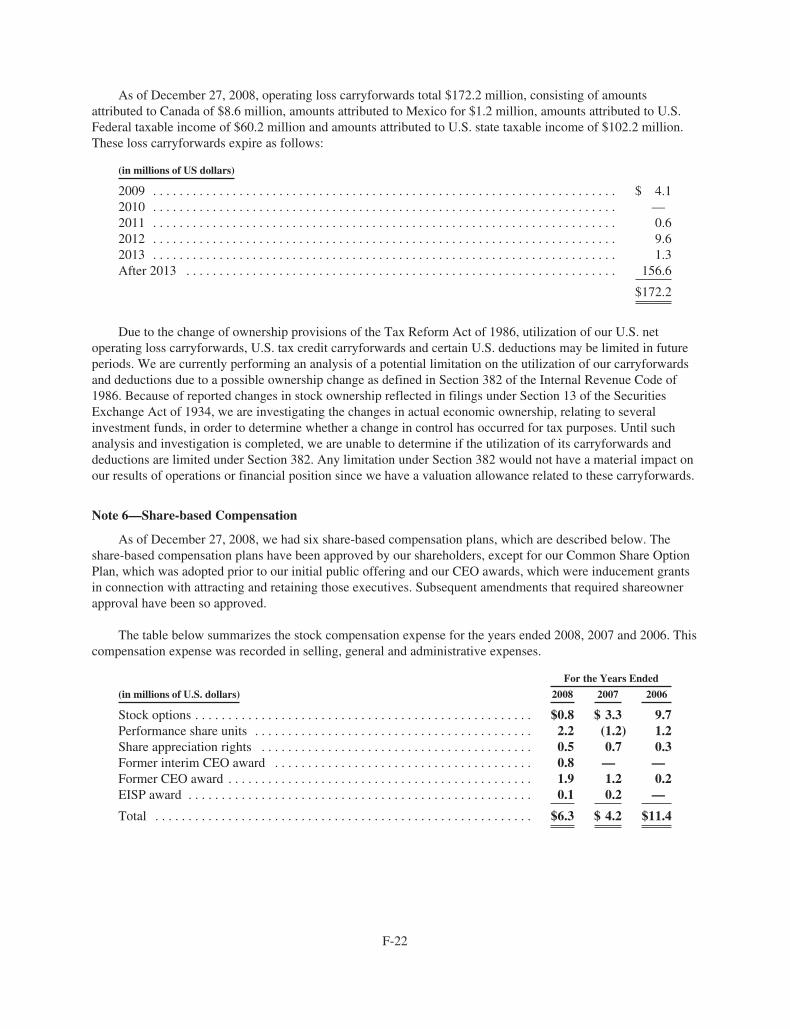
As of December 27, 2008, operating loss carryforwards total $172.2 million, consisting of amountsattributed to Canada of $8.6 million, amounts attributed to Mexico for $1.2 million, amounts attributed to U.S.Federal taxable income of $60.2 million and amounts attributed to U.S. state taxable income of $102.2 million.These loss carryforwards expire as follows:
(in millions of US dollars)
2009 . . . . . . . . . . . . . . . . . . . . . . . . . . . . . . . . . . . . . . . . . . . . . . . . . . . . . . . . . . . . . . . . . . . . . . $ 4.12010 . . . . . . . . . . . . . . . . . . . . . . . . . . . . . . . . . . . . . . . . . . . . . . . . . . . . . . . . . . . . . . . . . . . . . . —2011 . . . . . . . . . . . . . . . . . . . . . . . . . . . . . . . . . . . . . . . . . . . . . . . . . . . . . . . . . . . . . . . . . . . . . . 0.62012 . . . . . . . . . . . . . . . . . . . . . . . . . . . . . . . . . . . . . . . . . . . . . . . . . . . . . . . . . . . . . . . . . . . . . . 9.62013 . . . . . . . . . . . . . . . . . . . . . . . . . . . . . . . . . . . . . . . . . . . . . . . . . . . . . . . . . . . . . . . . . . . . . . 1.3After 2013 . . . . . . . . . . . . . . . . . . . . . . . . . . . . . . . . . . . . . . . . . . . . . . . . . . . . . . . . . . . . . . . . . 156.6
$172.2
Due to the change of ownership provisions of the Tax Reform Act of 1986, utilization of our U.S. netoperating loss carryforwards, U.S. tax credit carryforwards and certain U.S. deductions may be limited in futureperiods. We are currently performing an analysis of a potential limitation on the utilization of our carryforwardsand deductions due to a possible ownership change as defined in Section 382 of the Internal Revenue Code of1986. Because of reported changes in stock ownership reflected in filings under Section 13 of the SecuritiesExchange Act of 1934, we are investigating the changes in actual economic ownership, relating to severalinvestment funds, in order to determine whether a change in control has occurred for tax purposes. Until suchanalysis and investigation is completed, we are unable to determine if the utilization of its carryforwards anddeductions are limited under Section 382. Any limitation under Section 382 would not have a material impact onour results of operations or financial position since we have a valuation allowance related to these carryforwards.
Note 6—Share-based Compensation
As of December 27, 2008, we had six share-based compensation plans, which are described below. Theshare-based compensation plans have been approved by our shareholders, except for our Common Share OptionPlan, which was adopted prior to our initial public offering and our CEO awards, which were inducement grantsin connection with attracting and retaining those executives. Subsequent amendments that required shareownerapproval have been so approved.
The table below summarizes the stock compensation expense for the years ended 2008, 2007 and 2006. Thiscompensation expense was recorded in selling, general and administrative expenses.
For the Years Ended
(in millions of U.S. dollars) 2008 2007 2006
Stock options . . . . . . . . . . . . . . . . . . . . . . . . . . . . . . . . . . . . . . . . . . . . . . . . . . . $0.8 $ 3.3 9.7Performance share units . . . . . . . . . . . . . . . . . . . . . . . . . . . . . . . . . . . . . . . . . . 2.2 (1.2) 1.2Share appreciation rights . . . . . . . . . . . . . . . . . . . . . . . . . . . . . . . . . . . . . . . . . 0.5 0.7 0.3Former interim CEO award . . . . . . . . . . . . . . . . . . . . . . . . . . . . . . . . . . . . . . . 0.8 — —Former CEO award . . . . . . . . . . . . . . . . . . . . . . . . . . . . . . . . . . . . . . . . . . . . . . 1.9 1.2 0.2EISP award . . . . . . . . . . . . . . . . . . . . . . . . . . . . . . . . . . . . . . . . . . . . . . . . . . . . 0.1 0.2 —
Total . . . . . . . . . . . . . . . . . . . . . . . . . . . . . . . . . . . . . . . . . . . . . . . . . . . . . . . . . $6.3 $ 4.2 $11.4
F-22

As of December 27, 2008, the unrecognized compensation expense and years expected to recognizecompensation expense was as follows:
(in millions of U.S. dollars except years)
Unrecognizedcompensation
expense
Years expectedto recognizecompensation
expense
Performance share units . . . . . . . . . . . . . . . . . . . . . . . . . . . . . . . . . . . . . . $1.3 1.2Share appreciation rights . . . . . . . . . . . . . . . . . . . . . . . . . . . . . . . . . . . . . 0.5 0.9Interim CEO award . . . . . . . . . . . . . . . . . . . . . . . . . . . . . . . . . . . . . . . . . 0.1 0.3EISP award . . . . . . . . . . . . . . . . . . . . . . . . . . . . . . . . . . . . . . . . . . . . . . . 0.3 2.0
Total . . . . . . . . . . . . . . . . . . . . . . . . . . . . . . . . . . . . . . . . . . . . . . . . . . . . . $2.2
The fair value of each option and share appreciation rights grant is estimated on the date of grant using theBlack-Scholes option pricing model. The assumptions are based on three factors: risk-free interest rate, expectedterm and expected volatility. The risk-free interest rate is based on the implied yield available on zero couponGovernment of Canada bonds with an equivalent remaining term. The expected term of the options represents theestimated period of time until exercise and is based on historical experience of similar awards, givingconsideration to the contractual terms, vesting schedules and expectations of future employee behavior. Theexpected stock price volatility is based on a combination of historical volatility of our stock and the impliedvolatility of our traded options.
Common Share Option Plan
Under the 1986 Common Share Option Plan (the “Option Plan”), as amended, we have reserved a total of14.0 million common shares for future issuance. Options are granted at a price not less than the fair value of theshares on the date of grant. As of December 27, 2008, there were 7.4 million shares available for issuance underthe Option Plan.
There were no common shares issued pursuant to option exercises during 2008. However, in the secondquarter and the third quarter of 2008, we granted options to purchase 125,000 shares to new board members whojoined the board in 2008.
Options granted after September 1, 1998 expire after 7 years. Options granted after July 17, 2001 to thenon-management members of the Board of Directors vest immediately. All options are non-transferable andwhen options are exercised we issue new shares. As a result, shares issued upon the exercise of these options aredilutive to our shareowners.
The fair value of each option granted during the year is estimated on the date of grant using the Black-Scholes option pricing model with the following assumptions:
December 27,2008
December 29,2007
December 30,2006
Risk-free interest rate . . . . . . . . . . . . . . . . . . . . . . . . . . . . 3.3% 4.7% 3.3% - 3.9%Average expected life (years) . . . . . . . . . . . . . . . . . . . . . 5.0 3.0 4.0Expected volatility . . . . . . . . . . . . . . . . . . . . . . . . . . . . . . 76.3% 37.4% 40.0%Expected dividend yield . . . . . . . . . . . . . . . . . . . . . . . . . . — — —
Options representing 125,000 shares were issued during the year ended December 27, 2008 at exerciseprices ranging from C$2.60 to C$3.50 per share. The fair value of each option grant was estimated to be betweenC$1.50 and C$1.65 using the Black-Scholes option pricing model. These grants were fully vested at the time ofthe grant and therefore the entire amount was recorded as share-based compensation during the second and third
F-23

quarters of 2008. Options representing 50,000 shares were issued during the year ended December 29, 2007 at anexercise price of C$18.48 per share. The fair value of each option grant was estimated to be C$5.70 using theBlack-Scholes option pricing model. Because these options were issued to directors, these grants were fullyvested at the time of the grant and therefore the entire amount was recorded as share-based compensation duringthe second quarter of 2007. There were no options granted during the year December 30, 2006.
Option activity was as follows:
Shares
Weighted averageexerciseprice (C$)
Weightedaverage remainingcontractual term
(years)
Aggregateintrinsicvalue (C$)
(in thousands) (in thousands)
Balance at December 31, 2005 . . . . . . . . . . . . . 4,604 $30.69 4.8 $1,099.0Exercised . . . . . . . . . . . . . . . . . . . . . . . . . . (38) 13.61Forfeited or expired . . . . . . . . . . . . . . . . . . (1,871) 32.53
Balance at December 30, 2006 . . . . . . . . . . . . . 2,695 $29.65 3.6 $ 746.0Granted . . . . . . . . . . . . . . . . . . . . . . . . . . . . 50 18.48Exercised . . . . . . . . . . . . . . . . . . . . . . . . . . (53) 9.87Forfeited or expired . . . . . . . . . . . . . . . . . . (324) 28.46
Balance at December 29, 2007 . . . . . . . . . . . . . 2,368 30.03 2.7 $ —Granted . . . . . . . . . . . . . . . . . . . . . . . . . . . . 125 3.32Exercised . . . . . . . . . . . . . . . . . . . . . . . . . . — —Forfeited or expired . . . . . . . . . . . . . . . . . . (1,601) 16.74
Balance at December 27, 2008 . . . . . . . . . . . . . 892 $27.52 3.0 $ —
Vested and expected to vest at December 27,2008 . . . . . . . . . . . . . . . . . . . . . . . . . . . . . . . . 892 $27.52 3.0 $ —
Exercisable at December 27, 2008 . . . . . . . . . 892 $27.52 3.0 $ —
The aggregate intrinsic value amounts in the table above represent the difference between the closing priceof our common stock on December 27, 2008, which was C$1.27 (December 29, 2007 – C$6.58; December 31,2006 – C$16.69), and the exercise price, multiplied by the number of in-the-money stock options as of the samedate. The total intrinsic value of stock options exercised during the year ended December 27, 2008 was nil(December 29, 2007 – $0.4. million; December 30, 2006 – $0.1 million).
Total compensation cost related to unvested awards under the option plan not yet recognized is nil. The totalfair value of shares that vested during the year ended December 27, 2008 was $0.8 million.
Outstanding options at December 27, 2008 were as follows:
Options Outstanding Options Exercisable
Range of Exercise Prices (C$)Number
Exercisable
RemainingContractualLife (Years)
WeightedExercisePrice (C$)
NumberExercisable
WeightedExercisePrice (C$)
(in thousands) (in thousands)
$ 2.60—$ 3.50 . . . . . . . . . . . . . . . . . . . . . . . . . . 125 6.6 $ 3.32 125 $ 3.32$18.48—$29.95 . . . . . . . . . . . . . . . . . . . . . . . . . . 323 3.5 $26.60 323 $26.60$30.25—$43.64 . . . . . . . . . . . . . . . . . . . . . . . . . . 444 1.6 $35.00 444 $35.00
892 3.0 $27.52 892 $27.52
F-24

Long-Term Incentive Plans
During the second quarter of 2006, our shareowners approved and adopted two long-term incentive plans,the Performance Share Unit Plan (“PSU Plan”) and the Share Appreciation Rights Plan (“SAR Plan”). The PSUPlan and SAR Plan were amended and restated in the second quarter of 2007.
Amended and Restated PSU Plan
Under the Amended and Restated PSU Plan, performance share units (“PSUs”) may be awarded toemployees of our Company and its subsidiaries. The value of an employee’s award under our PSU Plan willdepend on (i) our performance over a maximum three-year performance cycle; and (ii) the market price of ourcommon shares at the time of vesting. Performance targets will be established annually by the Human Resourcesand Compensation Committee of the Board of Directors. PSUs granted will vest over a term not to exceed threefiscal years. The amendments to the PSU Plan allow for early funding by us under the PSU Plan and clarify theauthority of our Board of Directors to accelerate the vesting of all or a portion of the unvested PSUs of all of orany of the participants under the PSU Plan on a Change of Control (as such term is defined in the PSU Plan)irrespective of whether termination of employment has occurred. As of December 27, 2008, the trustee under thePSU Plan had purchased 1.6 million common shares in the open market to satisfy our anticipated future liabilityunder the PSU Plan.
Amended and Restated SAR Plan
Under the Amended and Restated SAR Plan, share appreciation rights (“SARs”) may be awarded toemployees and directors of our Company and its subsidiaries. SARs typically vest on the third anniversary of thegrant date. On vesting, each SAR will represent the right to be paid the difference, if any, between the price ofour common shares on the date of grant and their price on the vesting date of the SAR. Payments in respect ofvested in-the-money SARs will be made in the form of our common shares purchased on the open market by anindependent trust with cash contributed by us. If our share price on the date of vesting is lower than on the date ofgrant, no payment will be made in respect of those vested SARs. Prior to vesting, there are no dividends paid onthe SARs, and holders do not have the right to vote the common shares represented by their SARs. Theamendments to the SAR Plan allow for early funding by us and clarify the authority of our Board of Directors toaccelerate vesting of some or all of the SARs of all of or any of the participants under the SAR Plan asdetermined by the Board of Directors or the Human Resources and Compensation Committee in its solediscretion, irrespective of whether termination or a Change of Control (as such term is defined in the SAR Plan)has occurred.
We recognize the compensation cost of the PSUs and SARs based on the fair value of the grant. Werecognize these compensation costs net of a forfeiture rate on a straight-line basis over the requisite serviceperiod of the award, which is generally the vesting term. Compensation cost of the PSUs may vary depending onmanagement’s estimates of the probability of the performance measures being achieved and the number of PSUsexpected to vest.
During 2008 as compared to 2007, the PSU and SAR activity was as follows:
(In thousands)Number of
PSUsNumber of
SARs
Balance at December 30, 2006 . . . . . . . . . . . . . . . . . . . . . . . . . . . . . . . . . . . . . 531 410Awarded . . . . . . . . . . . . . . . . . . . . . . . . . . . . . . . . . . . . . . . . . . . . . . . . . . . 690 218Forfeited . . . . . . . . . . . . . . . . . . . . . . . . . . . . . . . . . . . . . . . . . . . . . . . . . . . (361) (6)
Balance at December 29, 2007 . . . . . . . . . . . . . . . . . . . . . . . . . . . . . . . . . . . . . 860 622Awarded . . . . . . . . . . . . . . . . . . . . . . . . . . . . . . . . . . . . . . . . . . . . . . . . . . . 1,612 0Forfeited . . . . . . . . . . . . . . . . . . . . . . . . . . . . . . . . . . . . . . . . . . . . . . . . . . . (980) (131)
Outstanding Balance at December 27, 2008 . . . . . . . . . . . . . . . . . . . . . . . . . . . 1,492 491
F-25

The following table summarizes the number of PSUs awarded during 2008 and the value if the targets underthe PSU Plan are met:
Number ofPSUs to beexpensed ifperformancetargets are
met
Remainingtarget
value perPSU (C$)
Total Value ofaward if
performancetargets are met
Total Value ofaward if
performance targetsare met
(in thousands) (in millions of C$) (in millions of U.S.$)
Awarded:February 28, 2008 . . . . . . . . . . . . . . . . . . . . . 140 2.91 0.4 0.4May 2, 2008 . . . . . . . . . . . . . . . . . . . . . . . . . 1,459 $2.94 $4.2 $4.2July 7, 2008 . . . . . . . . . . . . . . . . . . . . . . . . . 13 3.13 0.1 0.1
Total . . . . . . . . . . . . . . . . . . . . . . . . . . . . . . . . . . . 1,612 $4.7 $4.7
The number of PSUs awarded and target values per PSU noted above are based on an assumption that ourperformance targets will be achieved. The number of units and target values can vary from 0 to 150% dependingon the level of performance achieved relative to the performance target. Subject to the terms of the PSU Plan, thevesting date for the PSUs awarded in fiscal 2007 will be December 26, 2009. We did not meet the targets for thePSUs awarded in fiscal 2006 and as such those awards were forfeited as of December 27, 2008. The target valuesper PSU noted in the table above were determined based on the closing market price of our common shares onthe Toronto Stock Exchange (“TSX”) on the last trading day prior to the award date. As of December 27, 2008,no compensation costs were recognized associated with these units because it is not probable that the targets willbe met.
In connection with the termination of certain employees under the North American Plan, we made a cashpayment of $1.6 million to such employees, which amount is equal to the value (based on the closing price of ourstock on the TSX on the applicable date of termination) representing the pro rata portion of PSUs awarded toeach terminated employee in 2006 and 2007.
In the first quarter of 2008, we awarded a fixed dollar amount of $4.2 million of PSUs (representing1.5 million shares) to certain executives as a retention incentive. We met certain performance targets as ofDecember 27, 2008 and as a result, $1.1 million of these awards vested as of December 27, 2008 with ananticipated additional $1.9 million vesting as of December 26, 2009. The remainder of this award has beenforfeited due to terminations. This award is payable in shares and has been accounted for as an equity award inaccordance with SFAS 123R. We also awarded $0.4 million of individual sign-on awards in the first and thirdquarters of 2008 that will vest if certain performance targets are met. We recognized $2.2 million ofcompensation costs associated with these awards for 2008.
During the first quarter of 2007, we awarded to our employees 217,836 SARs having a fair value of $1.0million. Subject to the terms of the SAR Plan, the vesting dates for the SARs awarded in fiscal 2006 and 2007will be July 26, 2009, October 25, 2009 and February 19, 2010.
The fair value of the SARs grant is estimated on the date of grant using the Black-Scholes option pricingmodel with the following assumptions:
December 29,2007
December 30,2006
Risk-free interest rate . . . . . . . . . . . . . . . . . . . . . . . . . . . . . . . . . . . . . . . . . 5.05% 5.05%Average expected life (years) . . . . . . . . . . . . . . . . . . . . . . . . . . . . . . . . . . 4.0 4.0Expected volatility . . . . . . . . . . . . . . . . . . . . . . . . . . . . . . . . . . . . . . . . . . . 33.9% 33.9%Expected dividend yield . . . . . . . . . . . . . . . . . . . . . . . . . . . . . . . . . . . . . . . — —
F-26

Other Share-Based Compensation
In 2006, Brent Willis, our former Chief Executive Officer, received a net cash award of $0.9 million at thecommencement of his employment to purchase shares of the Company. The purchased shares were required to beheld for a minimum of three years. Mr. Willis’s employment terminated in March 2008, and as part of histermination agreement, we will no longer enforce the requirement that he hold the shares. In 2008, $0.4 million(December 29, 2007—$0.3 million) was recorded as compensation expense. In addition, in 2006, 204,000common shares with a fair value of $3.2 million, which vest over three years, were granted to Mr. Willis. For2008, compensation costs of $1.4 million were expensed as compensation expense because the shares vestedupon termination. On May 16, 2007, one third of his grant vested and, as a result, he received 68,000 commonshares, which was recognized as an issuance of share capital. As part of his termination agreement, the remaining136,000 shares were vested upon his termination and $0.3 million of cash (which was reclassified as a liabilityaward) was paid based on the fair value of such shares.
In connection with his appointment, we granted to David Gibbons, our former Interim Chief ExecutiveOfficer, 720,000 restricted stock units on March 24, 2008, of which 360,000 units vested immediately. Of theremaining 360,000 restricted stock units, 300,000 vested ratably on a monthly basis over a five-month periodbeginning October 24, 2008 through February 27, 2009. Mr. Gibbons resigned his position and his employmentarrangements came to an end on February 27, 2009, at which time 6,000 prorated restricted stock units vestedand the remaining 54,000 restricted stock units were forfeited. This award is recognized as compensation expenseover the vesting period. For 2008, $0.8 million of this award was recorded as compensation expense to reflect thevalue of the 540,000 vested restricted stock units and the anticipated vesting of the 120,000 remaining shares asof December 27, 2008. The fair value and compensation costs vary based on share price and this has beenaccounted for as a liability award in accordance with SFAS 123R.
Restated Executive Incentive Share Purchase Plan
In the second quarter of 2007, our shareowners approved a restated executive incentive share purchase plan(the “EISP Plan”), which allows officers and senior management executives, as designated by the HumanResources and Compensation Committee, to elect to receive their performance bonus (or a portion thereof) ascommon share units held on their behalf by an independent trust. If the employee elects to receive common shareunits, we will provide to the employee an equal number of shares, which vest in three years provided certaincorporate performance goals are achieved (“Match Portion”).
The Match Portion of the performance bonus is estimated based on the employee’s election and will beamortized over the service period of approximately four years. During 2007, employees elected to defer a total of$1.1 million under the EISP Plan. The Company recorded an expense of $0.1 million for the year endedDecember 27, 2008 related to the anticipated 2007 matching portion of the performance bonus. No amount hasbeen accrued for the Match Portion for 2008 deferrals because corporate performance goals were not achieved.
Note 7—Comprehensive Loss
(in millions of U.S. dollars)
CurrencyTranslationAdjustment Pension
Income(Loss)
Change inUnrealizedLoss on
Cash FlowHedges Total
Balance at December 31, 2005 . . . . . . . . . . . . . . . . . . . . . . . $ 4.7 $— $ 186.2 $(0.4) $ 190.52006 activity, net of tax . . . . . . . . . . . . . . . . . . . . . . . . . . . . 12.8 — (17.5) 0.4 (4.3)
Balance at December 30, 2006 . . . . . . . . . . . . . . . . . . . . . . . 17.5 — 168.7 — 186.22007 activity, net of tax . . . . . . . . . . . . . . . . . . . . . . . . . . . . 17.9 (3.1) (75.6) — (60.8)
Balance at December 29, 2007 . . . . . . . . . . . . . . . . . . . . . . . 35.4 (3.1) 93.1 — 125.42008 activity, net of tax . . . . . . . . . . . . . . . . . . . . . . . . . . . . (76.6) (3.5) (122.8) — (202.9)
Balance at December 27, 2008 . . . . . . . . . . . . . . . . . . . . . . . $(41.2) $(6.6) $ (29.7) $— $ (77.5)
F-27

Note 8—Net (Loss) Income per Common Share
Basic net (loss) income per common share is computed by dividing net (loss) income by the weightedaverage number of common shares outstanding during the period. Diluted net (loss) income per common share iscalculated using the weighted average number of common shares outstanding adjusted to include the effect, ifdilutive, that would occur if in-the-money stock options were exercised.
The following table reconciles the basic weighted average number of shares outstanding to the dilutedweighted average number of shares outstanding:
For the Years Ended
(In thousands)December 27,
2008December 29,
2007December 30,
2006
Weighted average number of shares outstanding—basic . . . . . . . . . . . . 71,017 71,831 71,726Dilutive effect on stock options . . . . . . . . . . . . . . . . . . . . . . . . . . . . . . . — — 47
Adjusted weighted average number of shares outstanding—diluted . . . 71,017 71,831 71,773
At December 27, 2008, options to purchase 891,740 (December 29, 2007—2,368,114, December 30,2006—2,333,964) shares of common stock at a weighted average exercise price of C$27.52. (December 29,2007—C$30.03, December 30, 2006—C$31.98) per share were outstanding, but were not included in thecomputation of diluted net income per share because the options’ exercise price was greater than the averagemarket price of our common stock.
Note 9—Segment Reporting
We produce, package and distribute retailer brand and branded bottled and canned soft drinks, waters, juice-based products, energy drinks and ready-to-drink teas to regional and national grocery, mass-merchandise andwholesale chains through five reportable segments—North America (which includes the U.S. reporting unit andCanada reporting unit), U.K. (which includes our United Kingdom reporting unit and our Continental Europeanreporting unit), Mexico, RCI and All Other (which includes our business in Asia). We closed our active Asianoperations at the end of 2008. We changed the operating segments in the third quarter of 2008 to reflect a changein our management structure and how information is reported to management.
Operating Segments
December 27, 2008
(in millions of U.S. dollars)North
AmericaUnited
Kingdom Mexico RCIAll
Other Total
External revenue 1 . . . . . . . . . . . . . . . . . . . . . . . . . . . . . . $1,178.0 $385.3 $61.9 $22.0 $ 0.9 $1,648.1Depreciation and amortization . . . . . . . . . . . . . . . . . . . . 62.2 16.2 2.3 — — 80.7Restructuring, asset and goodwill impairments andother chargesRestructuring . . . . . . . . . . . . . . . . . . . . . . . . . . . . . . 6.7 — — — — 6.7Goodwill impairments . . . . . . . . . . . . . . . . . . . . . . . — 69.2 — — — 69.2Asset impairments . . . . . . . . . . . . . . . . . . . . . . . . . . 37.0 — — — — 37.0
Operating (loss) income . . . . . . . . . . . . . . . . . . . . . . . . . (56.3) (53.5) (8.8) 8.1 (2.5) (113.0)Property, plant and equipment . . . . . . . . . . . . . . . . . . . . 244.1 88.7 14.0 — — 346.8Goodwill . . . . . . . . . . . . . . . . . . . . . . . . . . . . . . . . . . . . . 22.5 — — 4.5 — 27.0Intangibles and other assets . . . . . . . . . . . . . . . . . . . . . . . 150.2 18.3 0.9 — 0.2 169.6Total assets 2 . . . . . . . . . . . . . . . . . . . . . . . . . . . . . . . . . . 642.3 189.3 29.9 11.6 — 873.1Additions to property, plant and equipment . . . . . . . . . . 44.1 8.5 3.3 — — 55.9
1 Intersegment revenue between North America and the other segments is not material and has not beenseparately disclosed in the table above.
2 Excludes intersegment receivables, investments and notes receivable.
F-28

December 29, 2007
(in millions of U.S. dollars)North
AmericaUnited
Kingdom Mexico RCIAll
Other Total
External revenue 1 . . . . . . . . . . . . . . . . . . . . . . . . . . . . . . $1,274.9 $405.3 $69.4 $26.8 $— $1,776.4Depreciation and amortization . . . . . . . . . . . . . . . . . . . . 52.6 17.9 1.2 — — 71.7Restructuring, asset and goodwill impairments andother charges —
Restructuring . . . . . . . . . . . . . . . . . . . . . . . . . . . . . . 25.4 (1.2) — 0.1 — 24.3Goodwill impairments . . . . . . . . . . . . . . . . . . . . . . . 55.8 — — — — 55.8Asset impairments . . . . . . . . . . . . . . . . . . . . . . . . . . 10.7 — — — — 10.7
Operating (loss) income . . . . . . . . . . . . . . . . . . . . . . . . . (78.4) 16.6 1.7 10.7 (5.1) (54.5)Property, plant and equipment . . . . . . . . . . . . . . . . . . . . 250.8 125.2 12.4 — — 388.4Goodwill . . . . . . . . . . . . . . . . . . . . . . . . . . . . . . . . . . . . . 28.0 75.8 — 4.5 — 108.3Intangibles and other assets . . . . . . . . . . . . . . . . . . . . . . . 208.0 26.4 1.6 — — 236.0Total assets 2 . . . . . . . . . . . . . . . . . . . . . . . . . . . . . . . . . . 745.2 351.1 35.5 11.9 0.7 1,144.4Additions to property, plant and equipment . . . . . . . . . . 55.8 17.4 0.1 — — 73.3
1 Intersegment revenue between North America and the other segments is not material and has not beenseparately disclosed in the table above.
2 Excludes intersegment receivables, investments and notes receivable. Also, we reclassified certain amountsin the North America operating segment to conform to the current period’s presentation, which includes areclassification of $4.5 million from accrued liabilities to allowance for doubtful accounts.
December 30, 2006
(in millions of U.S. dollars)North
AmericaUnited
Kingdom Mexico RCIAll
Other Total
External revenue 1 . . . . . . . . . . . . . . . . . . . . . . . . . . . . . . $1,344.7 $341.6 $62.2 $23.3 $— $1,771.8Depreciation and amortization . . . . . . . . . . . . . . . . . . . . 69.3 16.1 1.4 — — 86.8Restructuring, asset and goodwill impairments andother chargesRestructuring and other . . . . . . . . . . . . . . . . . . . . . . 19.8 0.5 — 0.2 — 20.5Asset impairments . . . . . . . . . . . . . . . . . . . . . . . . . . 15.4 — — — — 15.4Other . . . . . . . . . . . . . . . . . . . . . . . . . . . . . . . . . . . . — 2.6 — — — 2.6
Operating (loss) income . . . . . . . . . . . . . . . . . . . . . . . . . (13.7) 7.9 — 8.7 (0.6) 2.3Property, plant and equipment . . . . . . . . . . . . . . . . . . . . 235.3 114.9 10.0 — — 360.2Goodwill . . . . . . . . . . . . . . . . . . . . . . . . . . . . . . . . . . . . . 79.2 74.7 — 4.5 — 158.4Intangibles and other assets . . . . . . . . . . . . . . . . . . . . . . . 215.5 34.4 0.8 — — 250.7Total assets 2 . . . . . . . . . . . . . . . . . . . . . . . . . . . . . . . . . . 777.6 323.1 29.4 10.3 0.3 1,140.7Additions to property, plant and equipment . . . . . . . . . . 27.4 6.9 0.8 — — 35.1
1 Intersegment revenue between North America and the other segments is not material and has not beenseparately disclosed in the table above.
2 Excludes intersegment receivables, investments and notes receivable.
For the year ended December 27, 2008, sales to Wal-Mart accounted for 35.7% (2007—39.8%, 2006—38.1%) of our total revenues, 42.5% of our North America operating segment revenues (2007—46.4%, 2006—47.5%), 21.0% of our U.K. operating segment revenues (2007—26.5%, 2006—14.0%), 22.2% of our Mexicooperating segment revenues (2007—22.1%, 2006—25.3%).
Credit risk arises from the potential default of a customer in meeting its financial obligations with us.Concentrations of credit exposure may arise with a group of customers that have similar economic characteristicsor that are located in the same geographic region. The ability of such customers to meet obligations would besimilarly affected by changing economic, political or other conditions. We are not currently aware of any factsthat would create a material credit risk.
F-29
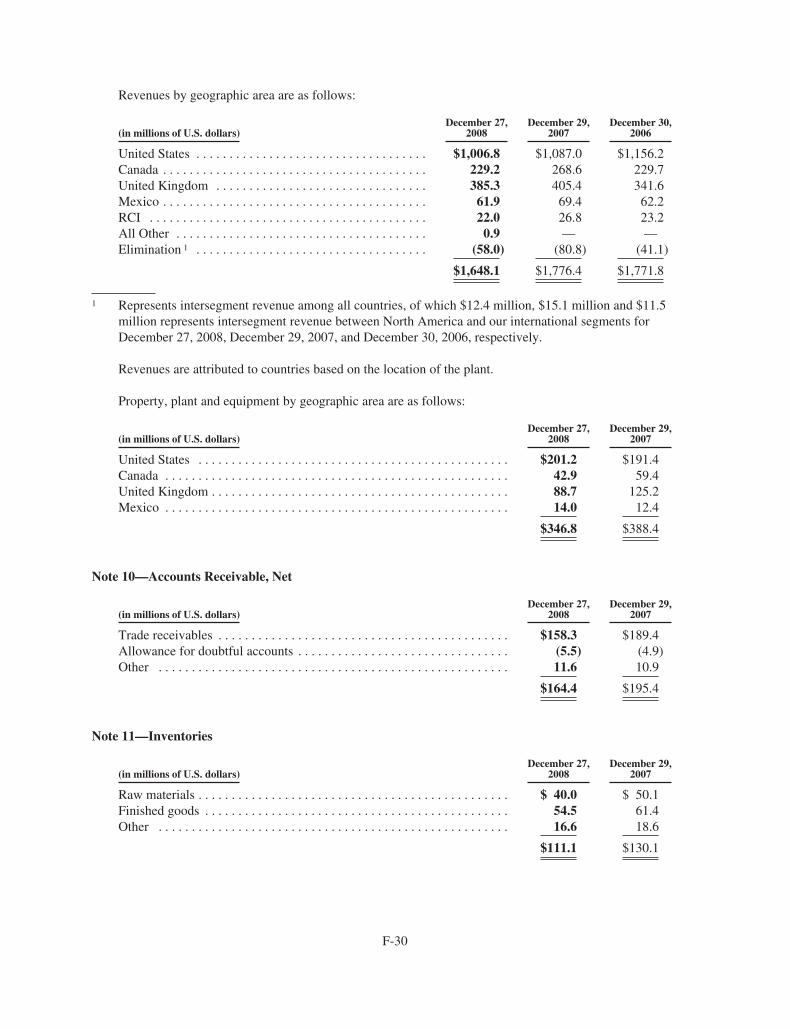
Revenues by geographic area are as follows:
(in millions of U.S. dollars)December 27,
2008December 29,
2007December 30,
2006
United States . . . . . . . . . . . . . . . . . . . . . . . . . . . . . . . . . . . $1,006.8 $1,087.0 $1,156.2Canada . . . . . . . . . . . . . . . . . . . . . . . . . . . . . . . . . . . . . . . . 229.2 268.6 229.7United Kingdom . . . . . . . . . . . . . . . . . . . . . . . . . . . . . . . . 385.3 405.4 341.6Mexico . . . . . . . . . . . . . . . . . . . . . . . . . . . . . . . . . . . . . . . . 61.9 69.4 62.2RCI . . . . . . . . . . . . . . . . . . . . . . . . . . . . . . . . . . . . . . . . . . 22.0 26.8 23.2All Other . . . . . . . . . . . . . . . . . . . . . . . . . . . . . . . . . . . . . . 0.9 — —Elimination 1 . . . . . . . . . . . . . . . . . . . . . . . . . . . . . . . . . . . (58.0) (80.8) (41.1)
$1,648.1 $1,776.4 $1,771.8
1 Represents intersegment revenue among all countries, of which $12.4 million, $15.1 million and $11.5million represents intersegment revenue between North America and our international segments forDecember 27, 2008, December 29, 2007, and December 30, 2006, respectively.
Revenues are attributed to countries based on the location of the plant.
Property, plant and equipment by geographic area are as follows:
(in millions of U.S. dollars)December 27,
2008December 29,
2007
United States . . . . . . . . . . . . . . . . . . . . . . . . . . . . . . . . . . . . . . . . . . . . . . . $201.2 $191.4Canada . . . . . . . . . . . . . . . . . . . . . . . . . . . . . . . . . . . . . . . . . . . . . . . . . . . . 42.9 59.4United Kingdom . . . . . . . . . . . . . . . . . . . . . . . . . . . . . . . . . . . . . . . . . . . . . 88.7 125.2Mexico . . . . . . . . . . . . . . . . . . . . . . . . . . . . . . . . . . . . . . . . . . . . . . . . . . . . 14.0 12.4
$346.8 $388.4
Note 10—Accounts Receivable, Net
(in millions of U.S. dollars)December 27,
2008December 29,
2007
Trade receivables . . . . . . . . . . . . . . . . . . . . . . . . . . . . . . . . . . . . . . . . . . . . $158.3 $189.4Allowance for doubtful accounts . . . . . . . . . . . . . . . . . . . . . . . . . . . . . . . . (5.5) (4.9)Other . . . . . . . . . . . . . . . . . . . . . . . . . . . . . . . . . . . . . . . . . . . . . . . . . . . . . 11.6 10.9
$164.4 $195.4
Note 11—Inventories
(in millions of U.S. dollars)December 27,
2008December 29,
2007
Raw materials . . . . . . . . . . . . . . . . . . . . . . . . . . . . . . . . . . . . . . . . . . . . . . . $ 40.0 $ 50.1Finished goods . . . . . . . . . . . . . . . . . . . . . . . . . . . . . . . . . . . . . . . . . . . . . . 54.5 61.4Other . . . . . . . . . . . . . . . . . . . . . . . . . . . . . . . . . . . . . . . . . . . . . . . . . . . . . 16.6 18.6
$111.1 $130.1
F-30

Note 12—Property, Plant and Equipment
December 27, 2008 December 29, 2007
(in millions of U.S. dollars) CostAccumulatedDepreciation Net Cost
AccumulatedDepreciation Net
Land . . . . . . . . . . . . . . . . . . . . . . . . . . . . . . . . . . $ 19.6 $ — $ 19.6 $ 24.3 $ — $ 24.3Buildings . . . . . . . . . . . . . . . . . . . . . . . . . . . . . . . 111.1 38.1 73.0 128.5 39.5 89.0Machinery and equipment
Owned . . . . . . . . . . . . . . . . . . . . . . . . . . . . . 480.1 267.4 212.7 504.9 271.8 233.1Capital leases . . . . . . . . . . . . . . . . . . . . . . . . 3.6 0.3 3.3 8.8 2.1 6.7
Plates, films & and molds . . . . . . . . . . . . . . . . . . 32.7 24.8 7.9 35.3 22.2 13.1Vending . . . . . . . . . . . . . . . . . . . . . . . . . . . . . . . . 22.3 18.3 4.0 35.9 28.6 7.3Transportation equipment . . . . . . . . . . . . . . . . . . 0.8 0.6 0.2 1.3 1.1 0.2Leasehold improvements . . . . . . . . . . . . . . . . . . 35.0 11.0 24.0 21.4 9.2 12.2Furniture and fixtures . . . . . . . . . . . . . . . . . . . . . 11.6 9.5 2.1 15.0 12.5 2.5
$716.8 $370.0 $346.8 $775.4 $387.0 $388.4
Depreciation expense for fiscal 2008 was $53.5 million ($50.0 million—December 29, 2007; $61.8million—December 30, 2006). Construction in progress for our water bottling equipment of $16.5 million wasincluded in “Machinery and equipment” for fiscal 2007.
Note 13—Intangibles and Other Assets
December 27, 2008 December 29, 2007
(in millions of U.S. dollars) CostAccumulatedAmortization Net Cost
AccumulatedAmortization Net
IntangiblesNot subject to amortization
Rights . . . . . . . . . . . . . . . . . . . . . . . . . . . . . $ 45.0 $ — $ 45.0 $ 80.4 $ — $ 80.4
Subject to amortizationCustomer relationships . . . . . . . . . . . . . . . . 157.5 69.9 87.6 165.9 60.8 105.1Trademarks . . . . . . . . . . . . . . . . . . . . . . . . . 24.8 13.2 11.6 29.9 13.6 16.3Information technology . . . . . . . . . . . . . . . 51.0 42.4 8.6 65.5 44.2 21.3Other . . . . . . . . . . . . . . . . . . . . . . . . . . . . . . 3.6 1.7 1.9 4.0 1.5 2.5
236.9 127.2 109.7 265.3 120.1 145.2
281.9 127.2 154.7 345.7 120.1 225.6
Other AssetsFinancing costs . . . . . . . . . . . . . . . . . . . . . . . . . . 6.7 1.7 5.0 4.8 4.1 0.7Deposits . . . . . . . . . . . . . . . . . . . . . . . . . . . . . . . 7.6 — 7.6 1.2 — 1.2Other . . . . . . . . . . . . . . . . . . . . . . . . . . . . . . . . . . 7.8 5.5 2.3 13.3 4.8 8.5
22.1 7.2 14.9 19.3 8.9 10.4
Total Intangibles & Other Assets . . . . . . $304.0 $134.4 $169.6 $365.0 $129.0 $236.0
Amortization expense of intangibles was $27.2 million during 2008 ($24.6 million—December 29, 2007;$24.6 million—December 30, 2006). Amortization of intangibles includes $10.4 million ($8.5 million—December 29, 2007; $8.8 million—December 30, 2006) relating to information technology assets and $1.1million ($1.8 million—December 29, 2007; $1.1 million—December 30, 2006) relating to deferred financingassets. As of December 27, 2008, we recorded an asset impairment related to the Rights of $35.4 million,primarily due to the decline of our North America case volume partially offset by anticipated increased overseasconcentrate volume in our RCI operating segment.
F-31

The estimated amortization expense for intangibles over the next five years is:
(in millions of U.S. dollars)
2009 . . . . . . . . . . . . . . . . . . . . . . . . . . . . . . . . . . . . . . . . . . . . . . . . . . . . . . . . . . . . . . . $15.72010 . . . . . . . . . . . . . . . . . . . . . . . . . . . . . . . . . . . . . . . . . . . . . . . . . . . . . . . . . . . . . . . 10.92011 . . . . . . . . . . . . . . . . . . . . . . . . . . . . . . . . . . . . . . . . . . . . . . . . . . . . . . . . . . . . . . . 9.02012 . . . . . . . . . . . . . . . . . . . . . . . . . . . . . . . . . . . . . . . . . . . . . . . . . . . . . . . . . . . . . . . 9.02013 . . . . . . . . . . . . . . . . . . . . . . . . . . . . . . . . . . . . . . . . . . . . . . . . . . . . . . . . . . . . . . . 8.8
$53.4
Note 14—Accounts Payable and Accrued Liabilities
(in millions of U.S. dollars)December 27
2008December 29
2007
Trade payables . . . . . . . . . . . . . . . . . . . . . . . . . . . . . . . . . . . . . . . . . . . . . . . $ 98.9 $118.3Accrued compensation . . . . . . . . . . . . . . . . . . . . . . . . . . . . . . . . . . . . . . . . 11.0 15.8Accrued sales incentives . . . . . . . . . . . . . . . . . . . . . . . . . . . . . . . . . . . . . . . 21.0 18.4Accrued interest . . . . . . . . . . . . . . . . . . . . . . . . . . . . . . . . . . . . . . . . . . . . . . 1.3 1.5Restructuring—Note 2 . . . . . . . . . . . . . . . . . . . . . . . . . . . . . . . . . . . . . . . . . 3.8 2.1Payroll, sales and other taxes . . . . . . . . . . . . . . . . . . . . . . . . . . . . . . . . . . . . 14.0 16.2Other accrued liabilities . . . . . . . . . . . . . . . . . . . . . . . . . . . . . . . . . . . . . . . . 16.7 23.1
$166.7 $195.4
Note 15—Debt
Our debt is summarized as follows:
(in millions of U.S. dollars)December 27,
2008December 29,
2007
8% senior subordinated notes due in 2011 1 . . . . . . . . . . . . . . . . . . . . . . . . . . . . . . . . . $269.0 $269.0Senior secured credit facility . . . . . . . . . . . . . . . . . . . . . . . . . . . . . . . . . . . . . . . . . . . . . — 102.3ABL facility . . . . . . . . . . . . . . . . . . . . . . . . . . . . . . . . . . . . . . . . . . . . . . . . . . . . . . . . . . 107.5 —GE Obligation . . . . . . . . . . . . . . . . . . . . . . . . . . . . . . . . . . . . . . . . . . . . . . . . . . . . . . . . 28.7 —Receivables securitization . . . . . . . . . . . . . . . . . . . . . . . . . . . . . . . . . . . . . . . . . . . . . . . — 33.0Other capital leases . . . . . . . . . . . . . . . . . . . . . . . . . . . . . . . . . . . . . . . . . . . . . . . . . . . . 3.4 3.1Other debt . . . . . . . . . . . . . . . . . . . . . . . . . . . . . . . . . . . . . . . . . . . . . . . . . . . . . . . . . . . . 3.2 3.9
Total debt . . . . . . . . . . . . . . . . . . . . . . . . . . . . . . . . . . . . . . . . . . . . . . . . . . . . . . . . . . . . 411.8 411.3Less: Short-term borrowings and current debt:
ABL facility . . . . . . . . . . . . . . . . . . . . . . . . . . . . . . . . . . . . . . . . . . . . . . . . . . . . . . 107.5 —Senior secured credit facility . . . . . . . . . . . . . . . . . . . . . . . . . . . . . . . . . . . . . . . . . — 95.5Receivables securitization . . . . . . . . . . . . . . . . . . . . . . . . . . . . . . . . . . . . . . . . . . . — 33.0Other short-term debt 2 . . . . . . . . . . . . . . . . . . . . . . . . . . . . . . . . . . . . . . . . . . . . . . — 8.5
Total short-term borrowings . . . . . . . . . . . . . . . . . . . . . . . . . . . . . . . . . . . . . . . . . 107.5 137.0GE obligation—current maturities . . . . . . . . . . . . . . . . . . . . . . . . . . . . . . . . . . . 6.7 —Other capital leases—current maturities . . . . . . . . . . . . . . . . . . . . . . . . . . . . . . . 0.3 2.4Other debt—current maturities . . . . . . . . . . . . . . . . . . . . . . . . . . . . . . . . . . . . . . 0.6 —
Total current debt . . . . . . . . . . . . . . . . . . . . . . . . . . . . . . . . . . . . . . . . . . . . . . . . . . 115.1 139.4
Long-term debt before discount . . . . . . . . . . . . . . . . . . . . . . . . . . . . . . . . . . . . . . . . . . . 296.7 271.9Less discount on 8% notes . . . . . . . . . . . . . . . . . . . . . . . . . . . . . . . . . . . . . . . . . . . (2.3) (2.9)
Total long-term debt . . . . . . . . . . . . . . . . . . . . . . . . . . . . . . . . . . . . . . . . . . . . . . . . . . . $294.4 $269.0
1 Our 8% senior subordinated notes were issued at a discount of 2.75% on December 21, 2001.2 Includes $6.7 million of negative cash position as of December 29, 2007.
F-32

The long-term debt payments (which include current maturities of long-term debt) required in each of thenext five years and thereafter are as follows:
(in millions of U.S. dollars)
2009 . . . . . . . . . . . . . . . . . . . . . . . . . . . . . . . . . . . . . . . . . . . . . . . . . . . . . . . . . . . . . . $ 7.72010 . . . . . . . . . . . . . . . . . . . . . . . . . . . . . . . . . . . . . . . . . . . . . . . . . . . . . . . . . . . . . . 6.52011 . . . . . . . . . . . . . . . . . . . . . . . . . . . . . . . . . . . . . . . . . . . . . . . . . . . . . . . . . . . . . . 274.02012 . . . . . . . . . . . . . . . . . . . . . . . . . . . . . . . . . . . . . . . . . . . . . . . . . . . . . . . . . . . . . . 3.32013 . . . . . . . . . . . . . . . . . . . . . . . . . . . . . . . . . . . . . . . . . . . . . . . . . . . . . . . . . . . . . . 1.7Thereafter . . . . . . . . . . . . . . . . . . . . . . . . . . . . . . . . . . . . . . . . . . . . . . . . . . . . . . . . . . 5.1
$298.3 1
1 We funded the purchase of a new water bottling equipment through an interim financing agreement signedin January 2008 (the “GE Obligation”). At the end of the GE Obligation, we will return $6.0 million ofassets in exchange for the extinguishment of $6.0 million in debt.
Debt
8% Senior subordinated notes due in 2011
Our Notes are due on December 15, 2011. As of December 27, 2008, the principal amount of those Noteswas $269.0 million. The issuer of the Notes is Cott Beverages Inc., but we and most of our U.S., Canadian andU.K. subsidiaries guarantee the Notes. The interest on these notes is payable semi-annually on June 15th andDecember 15th. During 2007, we repurchased and cancelled $6.0 million face value of such Notes on the openmarket at a purchase price of $5.5 million.
We may redeem all or a part of the Notes upon not less than 30 or more than 60 days’ notice. In addition tothe redemption price, accrued and unpaid interest and penalties, including liquidated damages (as defined in theindentures governing the Notes), are due.
ABL facility
On March 31, 2008, we entered into a new ABL credit facility that provides financing for the United States,Canada, the United Kingdom and Mexico. Cott Corporation, Cott Beverages Inc. and Cott Beverages Limited areborrowers under the ABL facility. The debt under the ABL facility is guaranteed by most of our U.S., UnitedKingdom, Canadian and Mexican subsidiaries. The ABL facility replaced our former senior secured creditfacilities in the United States, Canada, the United Kingdom, and Mexico and our receivables securitizationfacility in the United States, the latter of which was terminated on March 28, 2008. At that time, there were noamounts due under the receivables securitization facility. On March 31, 2008, we paid off the remaining balanceand terminated the former senior secured credit facility.
The ABL facility is a five-year revolving facility of up to $250.0 million. The five-year term runs throughMarch 2013 but is subject to the refinancing of the Notes; the new ABL facility will mature early if the Noteshave not been refinanced six months prior to their maturity (i.e. June 2011) on terms and conditions specified inthe ABL facility.
The amount available under the ABL facility is dependent on a borrowing base calculated as a percentage ofthe value of eligible inventory, accounts receivable and property, plant and equipment. The ABL facility hassubfacilities for letters of credit and swingline loans and geographical sublimits for Canada ($40.0 million) andthe United Kingdom ($75.0 million).
The interest rate margin on loans under the ABL facility was fixed for the first six months of the term, andnow varies quarterly based on our average aggregate availability. The interest rate on LIBOR (or other fixed rate)
F-33

loans for the first six months was LIBOR (or such other fixed rate) plus 2.50%. Prime (or other variable rate)loans during the first six months bore an interest rate of prime (or such other variable rate) plus 1.00%.Beginning on September 29, 2008, the interest rate on LIBOR and Prime loans is now based on averageaggregate availability as follows:
(in millions of U.S. dollars)
AverageAggregrateAvailability ABR Spread
Canadian PrimeSpread
EurodollarSpread LIBOR Spread
Over $175 0.50% 0.50% 2.00% 2.00%$100 – 175 0.75% 0.75% 2.25% 2.25%$50 – 100 1.00% 1.00% 2.50% 2.50%Under $50 1.25% 1.25% 2.75% 2.75%
The interest rate for the ABL facility as of December 27, 2008 was 3.2%. As of December 27, 2008, ourABL borrowings are comprised of $90.0 million of LIBOR borrowings and $17.5 million of ABR Spreadborrowings. Our commitment fee also changes based on the average utilization of the ABL. This fee ranges from0.25% per annum to 0.375% per annum. We currently pay 0.375% per annum.
We incurred $5.3 million of financing fees in connection with the ABL facility. The financing fees are beingamortized over a five-year period which represents the life of the ABL facility.
GE Financing Agreement
We funded $32.5 million of new water bottling equipment through an interim financing and leasearrangement that was signed in January 2008. We executed this lease in the third quarter of 2008 and beganmaking payments on the lease obligation. It is being reported as a finance lease obligation. The quarterlypayments under the lease obligation total approximately $8.8 million per annum for two years, $5.3 million perannum for the subsequent two years, then $1.7 million per annum for the final four years.
Covenant Compliance
We and our restricted subsidiaries are subject to a number of business and financial covenants and events ofdefault. The debt under the ABL facility is guaranteed by most of our U.S., United Kingdom, Canadian andMexico subsidiaries. The ABL facility contains customary limitations on indebtedness, liens, mergers,consolidations, liquidations and sales, payment of dividends, investments, loans and advances, optional paymentsand modifications of subordinated and other debt instruments, and transactions with affiliates. Events of defaultunder the ABL facility include nonpayment, inaccuracy of representations and warranties (which would includethe occurrence of an event having a material adverse effect), violation of covenants, cross-default to otherindebtedness, bankruptcy, material judgments, and a change of control of the Company. Upon the occurrence ofan event of default, the lenders may terminate the commitments and declare all loans due and payable. We haveagreed to a mandatory prepayment provision (but without a reduction of the commitment), subject to certainexceptions, upon a sale or transfer of assets of a borrower or guarantor, upon the sale of any common stock orother equity, upon the receipt of proceeds from the issuance of any indebtedness, upon the occurrence of anavailability shortfall under the revolver, or upon receipt of insurance proceeds or condemnation awards.
As of December 27, 2008, our total availability under the ABL facility was $163.8 million which was basedon our borrowing base (accounts receivables, inventory, and fixed assets) as of November 22, 2008 (theNovember month-end under the terms of the credit agreement) and we had $107.5 million of ABL borrowingsoutstanding and $10.8 million in outstanding letters of credits. As a result, our excess availability under the ABLfacility was $45.5 million. Each month’s borrowing base is not effective until submitted to the lenders, which isusually on the fifteenth of the following month. The ABL facility contains a covenant requiring a minimum fixedcharge coverage ratio of 1.1 to 1.0 effective when and if excess availability is less than $30.0 million If this
F-34

covenant had been triggered as of December 27, 2008, we would not have been in compliance with the fixedcharge coverage ratio. If availability is less than $37.5 million, the lenders will take dominion over the cash andwill apply excess cash to reduce amounts owing under the revolver. The credit agreement governing the ABLfacility requires us to maintain excess availability of at least $15.0 million. We believe we were in compliancewith all of the applicable covenants under the ABL facility on December 27, 2008.
8% Senior Subordinated Notes due 2011
The indenture governing the Notes contains a number of business and financial covenants and events ofdefault that apply to the issuer and the guarantors. In addition to us, the guarantors are, in general, thesubsidiaries organized in Canada, the U.S., and the United Kingdom. Events of default or triggers for prepaymentprovided for under the indenture include, among others: (i) a change of control of us in certain circumstances;(ii) unsatisfied judgments or cross-default or cross-acceleration to other indebtedness in excess of $10.0 million,in the case of the indenture; (iii) our insolvency or that of the restricted subsidiaries; and (iv) covenant defaultunder the credit facilities or indenture. Some of the more material financial covenants are discussed below.
The indenture has numerous covenants that are applicable to Cott Beverages Inc. and the guarantors. Wecan only make restricted payments, such as paying dividends, buying back stock or making certain investments,if our fixed charge coverage ratio is at least 2.0 to 1.0. Even then, we can only make those restricted payments inan amount that is no greater than 50.0% of our consolidated net income subject to certain adjustments. Certainother investments, like those not exceeding $60.0 million in the aggregate, may be made without satisfying therestricted payments test.
We can only incur additional debt or issue preferred stock, other than certain specified debt, if our fixedcharge coverage ratio is greater than 2.0 to 1.0. As of December 27, 2008, our fixed charge coverage ratio underthe indenture was greater than 2.0 to 1.0. Subject to some exceptions, asset sales may only be made where thesale price is equal to the fair market value of the asset sold and we receive at least 75.0% of the proceeds in cash.There are also limitations on what we may do with the sale proceeds such that we may be required to pay downdebt or reinvest the proceeds in enumerated business uses within a specified period of time.
There are further restrictions in several of the covenants, such as a complete prohibition on paying anydividends if we are in default under the indenture. Many of the covenants also effectively limit transactions withour unrestricted subsidiaries or non-guarantor entities.
We believe we have been in compliance with all of the covenants under the Notes and there have been noamendments to any such covenants since they were issued.
The events of default in the Notes indenture related to other indebtedness arise only if there is a failure topay principal, interest or premiums of such other indebtedness after the expiration of any applicable grace period,or if there has been acceleration in payment of such other indebtedness, in each case, in excess of a thresholdamount. As at December 27, 2008, these conditions of default did not exist with respect to any otherindebtedness.
Note 16—Benefit Plans
We maintain two noncontributory defined benefit plans resulting from prior acquisitions that cover certainother employees under a collective bargaining agreement in the United States (“U.S. Plan”) and certain salariedemployees in the United Kingdom (“U.K. Plan”). Retirement benefits for employees covered by the U.S. Plan arebased on years of service multiplied by a monthly benefit factor. The monthly benefit for employees under theU.K. Plan is based on years of service multiplied by a monthly benefit factor. Pension costs are funded inaccordance with the provisions of the applicable law. Both Plans are closed to new participants. We use aDecember 31 measurement date for both of our plans.
F-35

Accumulated Other Comprehensive Loss as of December 29, 2007 includes an out of period adjustment torecord the unfunded liability of the U.K. Plan. The adjustment of $2.2 million (net of income tax of $0.9 million)was to adopt SFAS No. 158, “Employers’ Accounting for Defined Benefit Pension and Other PostretirementPlans, an amendment of FASB Statements No 87, 88, 106 and 132(R)” (“SFAS 158”), which required that werecord the unfunded status of the pension plan. We should have recognized this adjustment to Accumulated OtherComprehensive Loss on December 30, 2006. In addition, we recorded an out of period adjustment inAccumulated Other Comprehensive Loss to recognize a minimum pension liability of $0.9 million (net of tax of$0.3 million) as required by SFAS No. 87 “Employers Accounting for Pensions” (“SFAS 87”) and SFAS 158 forour U.K. Pension Plan. Since the U.K. pension plan is sponsored by our U.K. subsidiary, the recording of theminimum plan liability required an out of period adjustment of $1.0 million to reduce the currency translationadjustment recorded in Other Comprehensive Income (Loss). We should have recognized minimum pensionliabilities and the corresponding effect of currency translation in prior years. The recording of the pension plandid not have a material impact on the Consolidated Statement of Loss and we have concluded, through aquantitative and qualitative analysis, that the adjustments to Accumulated Other Comprehensive Loss are notmaterial to 2007 or prior years’ consolidated financial statements.
Obligations and Funded Status
The following table sets forth the change in the benefit obligation, change in plan assets and unfunded statusof the two plans:
(in millions of U.S. dollars) 2008 2007
Change in Benefit ObligationBenefit obligation at beginning of year . . . . . . . . . . . . . . . . . . . . . . . . . . . . . . . . . . . . . . . . . . . . . $ 33.6 $ 33.1Service cost . . . . . . . . . . . . . . . . . . . . . . . . . . . . . . . . . . . . . . . . . . . . . . . . . . . . . . . . . . . . . . . . . . . 0.3 0.6Interest cost . . . . . . . . . . . . . . . . . . . . . . . . . . . . . . . . . . . . . . . . . . . . . . . . . . . . . . . . . . . . . . . . . . . 1.6 1.7Plan participant contributions . . . . . . . . . . . . . . . . . . . . . . . . . . . . . . . . . . . . . . . . . . . . . . . . . . . . . 0.1 0.2Benefit payments . . . . . . . . . . . . . . . . . . . . . . . . . . . . . . . . . . . . . . . . . . . . . . . . . . . . . . . . . . . . . . (0.8) (0.9)Actuarial (gains) losses . . . . . . . . . . . . . . . . . . . . . . . . . . . . . . . . . . . . . . . . . . . . . . . . . . . . . . . . . . (2.6) (1.4)Translation gains (losses) . . . . . . . . . . . . . . . . . . . . . . . . . . . . . . . . . . . . . . . . . . . . . . . . . . . . . . . . (7.4) 0.3
Benefit obligation at end of year . . . . . . . . . . . . . . . . . . . . . . . . . . . . . . . . . . . . . . . . . . . . . . . . . . $ 24.8 $ 33.6
Change in Plan AssetsPlan assets beginning of year . . . . . . . . . . . . . . . . . . . . . . . . . . . . . . . . . . . . . . . . . . . . . . . . . . . . . $ 27.9 $ 26.0Employer contributions . . . . . . . . . . . . . . . . . . . . . . . . . . . . . . . . . . . . . . . . . . . . . . . . . . . . . . . . . 0.9 1.3Plan participant contributions . . . . . . . . . . . . . . . . . . . . . . . . . . . . . . . . . . . . . . . . . . . . . . . . . . . . . 0.1 0.2Benefit payments . . . . . . . . . . . . . . . . . . . . . . . . . . . . . . . . . . . . . . . . . . . . . . . . . . . . . . . . . . . . . . (0.8) (0.9)Actual return on plan assets . . . . . . . . . . . . . . . . . . . . . . . . . . . . . . . . . . . . . . . . . . . . . . . . . . . . . . (5.4) 1.2Translation gains (losses) . . . . . . . . . . . . . . . . . . . . . . . . . . . . . . . . . . . . . . . . . . . . . . . . . . . . . . . . (6.0) 0.1
Fair value at end of year . . . . . . . . . . . . . . . . . . . . . . . . . . . . . . . . . . . . . . . . . . . . . . . . . . . . . . . . . $ 16.7 $ 27.9
Funded Status of PlanProjected benefit obligation . . . . . . . . . . . . . . . . . . . . . . . . . . . . . . . . . . . . . . . . . . . . . . . . . . . . . . $(24.8) $(33.6)Fair value of plan assets . . . . . . . . . . . . . . . . . . . . . . . . . . . . . . . . . . . . . . . . . . . . . . . . . . . . . . . . . 16.7 27.9
Unfunded status . . . . . . . . . . . . . . . . . . . . . . . . . . . . . . . . . . . . . . . . . . . . . . . . . . . . . . . . . . . . . . . $ (8.1) $ (5.7)
The accumulated benefit obligation for both defined benefit pension plans equaled the projected benefitobligations of $8.1 million and $5.7 million at the end of 2008 and 2007, respectively.
F-36
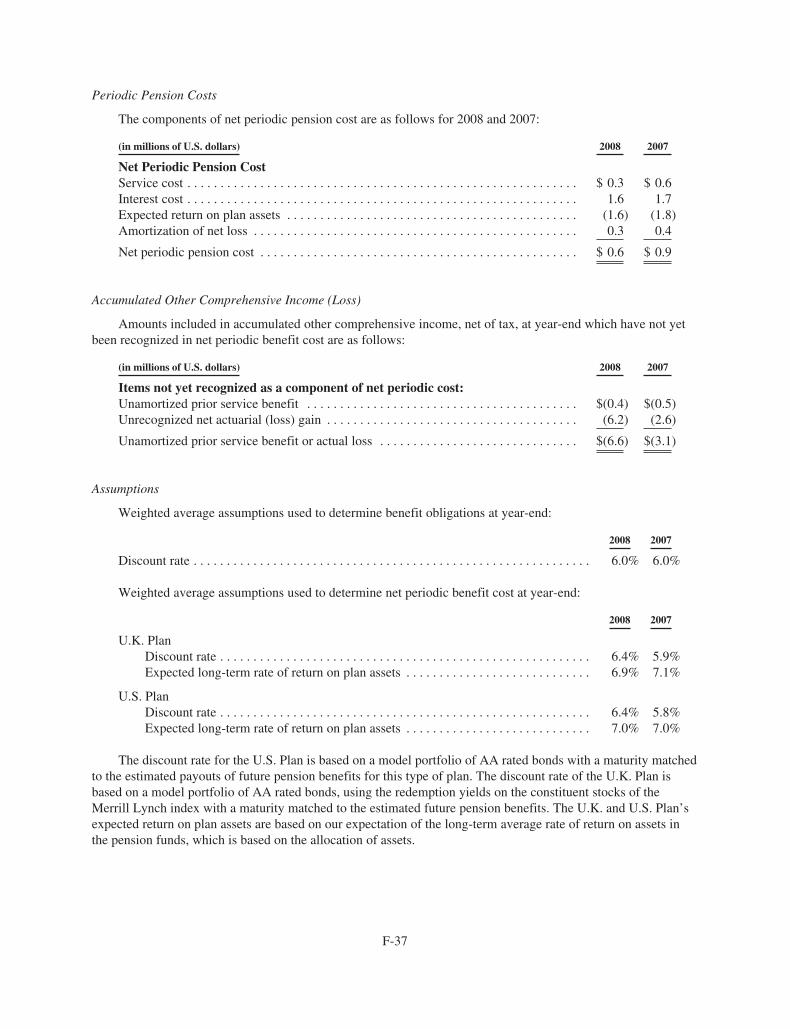
Periodic Pension Costs
The components of net periodic pension cost are as follows for 2008 and 2007:
(in millions of U.S. dollars) 2008 2007
Net Periodic Pension CostService cost . . . . . . . . . . . . . . . . . . . . . . . . . . . . . . . . . . . . . . . . . . . . . . . . . . . . . . . . . . . $ 0.3 $ 0.6Interest cost . . . . . . . . . . . . . . . . . . . . . . . . . . . . . . . . . . . . . . . . . . . . . . . . . . . . . . . . . . . 1.6 1.7Expected return on plan assets . . . . . . . . . . . . . . . . . . . . . . . . . . . . . . . . . . . . . . . . . . . . (1.6) (1.8)Amortization of net loss . . . . . . . . . . . . . . . . . . . . . . . . . . . . . . . . . . . . . . . . . . . . . . . . . 0.3 0.4
Net periodic pension cost . . . . . . . . . . . . . . . . . . . . . . . . . . . . . . . . . . . . . . . . . . . . . . . . $ 0.6 $ 0.9
Accumulated Other Comprehensive Income (Loss)
Amounts included in accumulated other comprehensive income, net of tax, at year-end which have not yetbeen recognized in net periodic benefit cost are as follows:
(in millions of U.S. dollars) 2008 2007
Items not yet recognized as a component of net periodic cost:Unamortized prior service benefit . . . . . . . . . . . . . . . . . . . . . . . . . . . . . . . . . . . . . . . . . $(0.4) $(0.5)Unrecognized net actuarial (loss) gain . . . . . . . . . . . . . . . . . . . . . . . . . . . . . . . . . . . . . . (6.2) (2.6)
Unamortized prior service benefit or actual loss . . . . . . . . . . . . . . . . . . . . . . . . . . . . . . $(6.6) $(3.1)
Assumptions
Weighted average assumptions used to determine benefit obligations at year-end:
2008 2007
Discount rate . . . . . . . . . . . . . . . . . . . . . . . . . . . . . . . . . . . . . . . . . . . . . . . . . . . . . . . . . . . . 6.0% 6.0%
Weighted average assumptions used to determine net periodic benefit cost at year-end:
2008 2007
U.K. PlanDiscount rate . . . . . . . . . . . . . . . . . . . . . . . . . . . . . . . . . . . . . . . . . . . . . . . . . . . . . . . . 6.4% 5.9%Expected long-term rate of return on plan assets . . . . . . . . . . . . . . . . . . . . . . . . . . . . 6.9% 7.1%
U.S. PlanDiscount rate . . . . . . . . . . . . . . . . . . . . . . . . . . . . . . . . . . . . . . . . . . . . . . . . . . . . . . . . 6.4% 5.8%Expected long-term rate of return on plan assets . . . . . . . . . . . . . . . . . . . . . . . . . . . . 7.0% 7.0%
The discount rate for the U.S. Plan is based on a model portfolio of AA rated bonds with a maturity matchedto the estimated payouts of future pension benefits for this type of plan. The discount rate of the U.K. Plan isbased on a model portfolio of AA rated bonds, using the redemption yields on the constituent stocks of theMerrill Lynch index with a maturity matched to the estimated future pension benefits. The U.K. and U.S. Plan’sexpected return on plan assets are based on our expectation of the long-term average rate of return on assets inthe pension funds, which is based on the allocation of assets.
F-37

Asset Mix
Our pension plan weighted-average asset allocations by asset category are as follows:
2008 2007
U.K. PlanEquity securities . . . . . . . . . . . . . . . . . . . . . . . . . . . . . . . . . . . . . . . . . . . . 60.0% 60.0%Debt securities . . . . . . . . . . . . . . . . . . . . . . . . . . . . . . . . . . . . . . . . . . . . . . 40.0% 40.0%
U.S. PlanEquity securities . . . . . . . . . . . . . . . . . . . . . . . . . . . . . . . . . . . . . . . . . . . . 50.0% 50.0%Debt securities . . . . . . . . . . . . . . . . . . . . . . . . . . . . . . . . . . . . . . . . . . . . . . 50.0% 50.0%
Plan Assets
Our investment policy is that plan assets will be managed utilizing an investment philosophy and approachcharacterized by all of the following, but listed in priority order: (1) emphasis on total return, (2) emphasis onhigh-quality securities, (3) sufficient income and stability of income, (4) safety of principal with limited volatilityof capital through proper diversification and (5) sufficient liquidity. The target allocation percentages for theU.K. Plan assets are 60% in equity securities and 40% in debt securities. The target allocation percentages for theU.S. Plan assets are 50% in equity securities and 50% in debt securities. None of our equity or debt securities areincluded in plan assets.
Cash Flows
We expect to contribute $0.7 million to the pension plans during the 2009 fiscal year.
The following benefit payments are expected to be paid:
(in millions of U.S. dollars)
Expected benefit paymentsFY 2009 . . . . . . . . . . . . . . . . . . . . . . . . . . . . . . . . . . . . . . . . . . . . . . . . . . . . . . . . . . . . . $0.6FY 2010 . . . . . . . . . . . . . . . . . . . . . . . . . . . . . . . . . . . . . . . . . . . . . . . . . . . . . . . . . . . . . 0.6FY 2011 . . . . . . . . . . . . . . . . . . . . . . . . . . . . . . . . . . . . . . . . . . . . . . . . . . . . . . . . . . . . . 0.8FY 2012 . . . . . . . . . . . . . . . . . . . . . . . . . . . . . . . . . . . . . . . . . . . . . . . . . . . . . . . . . . . . . 0.9FY 2013 . . . . . . . . . . . . . . . . . . . . . . . . . . . . . . . . . . . . . . . . . . . . . . . . . . . . . . . . . . . . . 1.1FY 2014 through FY 2018 . . . . . . . . . . . . . . . . . . . . . . . . . . . . . . . . . . . . . . . . . . . . . . . 7.1
Cott primarily maintains deferred contribution retirement plans covering qualifying employees. The totalexpense with respect to these plans was $5.0 million for the year ended December 27, 2008 ($5.7 million—December 29, 2007; $6.5 million—December 30, 2006). Total expense for 2006 includes approximately $1.0million for the defined benefit pension plan.
F-38
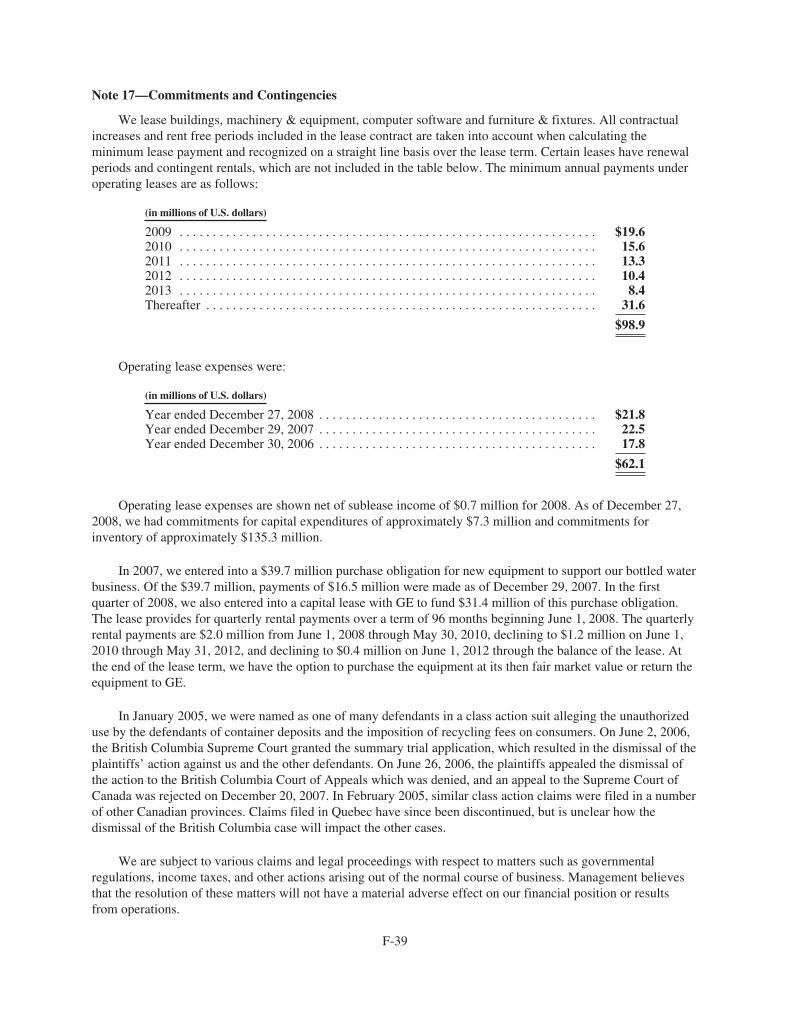
Note 17—Commitments and Contingencies
We lease buildings, machinery & equipment, computer software and furniture & fixtures. All contractualincreases and rent free periods included in the lease contract are taken into account when calculating theminimum lease payment and recognized on a straight line basis over the lease term. Certain leases have renewalperiods and contingent rentals, which are not included in the table below. The minimum annual payments underoperating leases are as follows:
(in millions of U.S. dollars)
2009 . . . . . . . . . . . . . . . . . . . . . . . . . . . . . . . . . . . . . . . . . . . . . . . . . . . . . . . . . . . . . . . $19.62010 . . . . . . . . . . . . . . . . . . . . . . . . . . . . . . . . . . . . . . . . . . . . . . . . . . . . . . . . . . . . . . . 15.62011 . . . . . . . . . . . . . . . . . . . . . . . . . . . . . . . . . . . . . . . . . . . . . . . . . . . . . . . . . . . . . . . 13.32012 . . . . . . . . . . . . . . . . . . . . . . . . . . . . . . . . . . . . . . . . . . . . . . . . . . . . . . . . . . . . . . . 10.42013 . . . . . . . . . . . . . . . . . . . . . . . . . . . . . . . . . . . . . . . . . . . . . . . . . . . . . . . . . . . . . . . 8.4Thereafter . . . . . . . . . . . . . . . . . . . . . . . . . . . . . . . . . . . . . . . . . . . . . . . . . . . . . . . . . . . 31.6
$98.9
Operating lease expenses were:
(in millions of U.S. dollars)
Year ended December 27, 2008 . . . . . . . . . . . . . . . . . . . . . . . . . . . . . . . . . . . . . . . . . . $21.8Year ended December 29, 2007 . . . . . . . . . . . . . . . . . . . . . . . . . . . . . . . . . . . . . . . . . . 22.5Year ended December 30, 2006 . . . . . . . . . . . . . . . . . . . . . . . . . . . . . . . . . . . . . . . . . . 17.8
$62.1
Operating lease expenses are shown net of sublease income of $0.7 million for 2008. As of December 27,2008, we had commitments for capital expenditures of approximately $7.3 million and commitments forinventory of approximately $135.3 million.
In 2007, we entered into a $39.7 million purchase obligation for new equipment to support our bottled waterbusiness. Of the $39.7 million, payments of $16.5 million were made as of December 29, 2007. In the firstquarter of 2008, we also entered into a capital lease with GE to fund $31.4 million of this purchase obligation.The lease provides for quarterly rental payments over a term of 96 months beginning June 1, 2008. The quarterlyrental payments are $2.0 million from June 1, 2008 through May 30, 2010, declining to $1.2 million on June 1,2010 through May 31, 2012, and declining to $0.4 million on June 1, 2012 through the balance of the lease. Atthe end of the lease term, we have the option to purchase the equipment at its then fair market value or return theequipment to GE.
In January 2005, we were named as one of many defendants in a class action suit alleging the unauthorizeduse by the defendants of container deposits and the imposition of recycling fees on consumers. On June 2, 2006,the British Columbia Supreme Court granted the summary trial application, which resulted in the dismissal of theplaintiffs’ action against us and the other defendants. On June 26, 2006, the plaintiffs appealed the dismissal ofthe action to the British Columbia Court of Appeals which was denied, and an appeal to the Supreme Court ofCanada was rejected on December 20, 2007. In February 2005, similar class action claims were filed in a numberof other Canadian provinces. Claims filed in Quebec have since been discontinued, but is unclear how thedismissal of the British Columbia case will impact the other cases.
We are subject to various claims and legal proceedings with respect to matters such as governmentalregulations, income taxes, and other actions arising out of the normal course of business. Management believesthat the resolution of these matters will not have a material adverse effect on our financial position or resultsfrom operations.
F-39

We had $10.8 million in standby letters of credit outstanding as of December 27, 2008 ($6.5 million—December 29, 2007).
Note 18—Shares Held in Trust treated as Treasury Shares
In May 2008, an independent trustee acting under certain of our benefit plans purchased 2.3 million of ourcommon shares on the open market for $6.4 million, of which 2.0 million shares, or $5.4 million, are to be usedto satisfy any future liability under the PSU Plan and the EISP Plan and 0.3 million shares, or $1.0 million, areheld in trust for our employees as part of the deferred compensation arrangement under the EISP Plan. See Note6 for further details of these two plans. Treasury shares are reported at cost.
Note 19—Quarterly Financial Information—(Unaudited)
Year ended December 27, 2008
(In millions of U.S. dollars, except per share amounts)First
QuarterSecondQuarter
ThirdQuarter
FourthQuarter Total
Revenue . . . . . . . . . . . . . . . . . . . . . . . . . . . . . . . . . . . . . . . . . . . . . . . $389.7 $466.5 $420.5 $371.4 $1,648.1Cost of sales . . . . . . . . . . . . . . . . . . . . . . . . . . . . . . . . . . . . . . . . . . . . 348.9 409.5 372.8 335.9 1,467.1
Gross Profit . . . . . . . . . . . . . . . . . . . . . . . . . . . . . . . . . . . . . . . . . . . . . 40.8 57.0 47.7 35.5 181.0Selling, general and administrative expenses . . . . . . . . . . . . . . . . . . . 52.8 44.5 42.4 40.1 179.8Loss on disposal of property, plant and equipment . . . . . . . . . . . . . . 0.2 0.1 0.1 0.9 1.3Restructuring, asset and goodwill impairments and other charges:
Restructuring . . . . . . . . . . . . . . . . . . . . . . . . . . . . . . . . . . . . . . . . — 6.7 (0.1) 0.1 6.7Goodwill impairments . . . . . . . . . . . . . . . . . . . . . . . . . . . . . . . . — — 69.2 — 69.2Asset impairments . . . . . . . . . . . . . . . . . . . . . . . . . . . . . . . . . . . — 0.4 26.6 10.0 37.0
Operating (loss) income . . . . . . . . . . . . . . . . . . . . . . . . . . . . . . . . . . . (12.2) 5.3 (90.5) (15.6) (113.0)
Net (loss) income . . . . . . . . . . . . . . . . . . . . . . . . . . . . . . . . . . . . . . . . $ (21.3) $ (1.8) $ (87.6) $ (12.1) $ (122.8)
Per share data:Net income (loss) per common share
Basic . . . . . . . . . . . . . . . . . . . . . . . . . . . . . . . . . . . . . . . . . . $ (0.30) $ (0.03) $ (1.25) $ (0.17) $ (1.73)Diluted . . . . . . . . . . . . . . . . . . . . . . . . . . . . . . . . . . . . . . . . $ (0.30) $ (0.03) $ (1.25) $ (0.17) $ (1.73)
Year ended December 29, 2007
(In millions of U.S. dollars, except per share amounts)First
QuarterSecondQuarter
ThirdQuarter
FourthQuarter Total
Revenue . . . . . . . . . . . . . . . . . . . . . . . . . . . . . . . . . . . . . . . . . . . . . . . $400.2 $498.5 $464.5 $413.2 $1,776.4Cost of sales . . . . . . . . . . . . . . . . . . . . . . . . . . . . . . . . . . . . . . . . . . . . 346.7 438.9 418.8 373.6 1,578.0
Gross Profit . . . . . . . . . . . . . . . . . . . . . . . . . . . . . . . . . . . . . . . . . . . . . 53.5 59.6 45.7 39.6 198.4Selling, general and administrative expenses . . . . . . . . . . . . . . . . . . . 37.7 44.6 34.2 45.4 161.9Loss (gain) on disposal of property, plant and equipment . . . . . . . . . — (0.4) 0.2 0.4 0.2Restructuring, asset and goodwill impairments and other charges:
Restructuring . . . . . . . . . . . . . . . . . . . . . . . . . . . . . . . . . . . . . . . . 0.3 9.1 14.1 0.8 24.3Goodwill impairments . . . . . . . . . . . . . . . . . . . . . . . . . . . . . . . . — — — 55.8 55.8Asset impairments . . . . . . . . . . . . . . . . . . . . . . . . . . . . . . . . . . . — — 0.9 9.8 10.7
Operating (loss) income . . . . . . . . . . . . . . . . . . . . . . . . . . . . . . . . . . . 15.5 6.3 (3.7) (72.6) (54.5)
Net (loss) income . . . . . . . . . . . . . . . . . . . . . . . . . . . . . . . . . . . . . . . . $ 4.8 $ 4.7 $ (5.8) $ (75.1) $ (71.4)
Per share data:Net income (loss) per common share
Basic . . . . . . . . . . . . . . . . . . . . . . . . . . . . . . . . . . . . . . . . . . $ 0.07 $ 0.07 $ (0.08) $ (1.05) $ (0.99)Diluted . . . . . . . . . . . . . . . . . . . . . . . . . . . . . . . . . . . . . . . . $ 0.07 $ 0.07 $ (0.08) $ (1.05) $ (0.99)
F-40
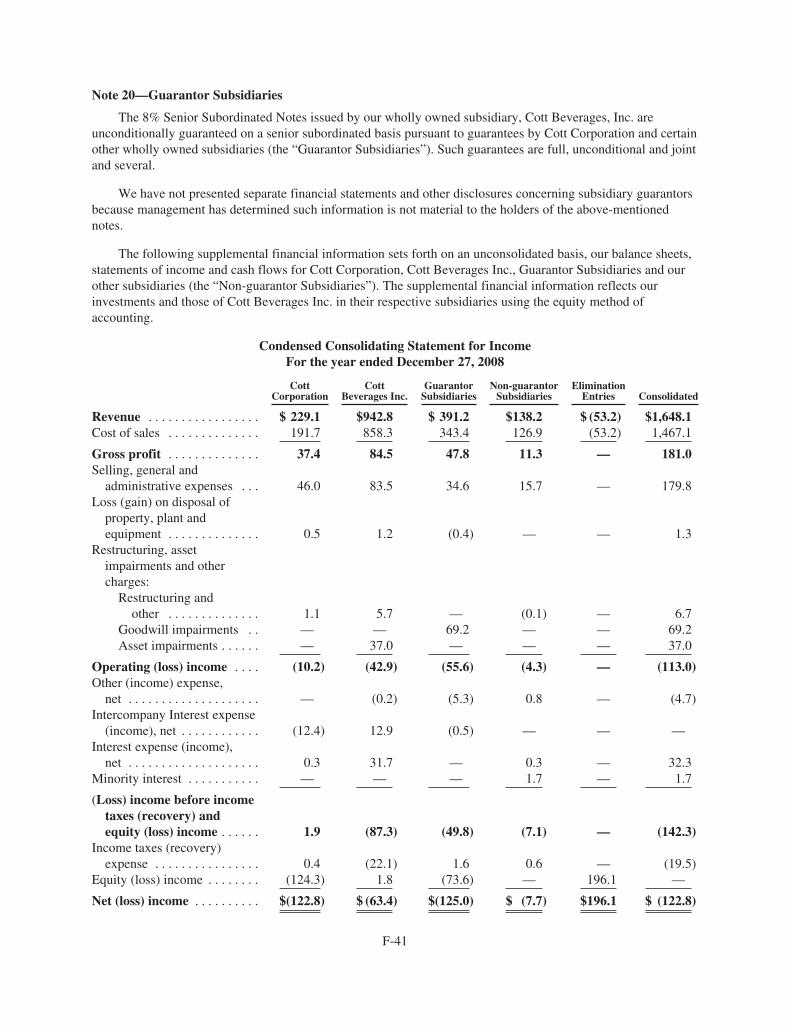
Note 20—Guarantor Subsidiaries
The 8% Senior Subordinated Notes issued by our wholly owned subsidiary, Cott Beverages, Inc. areunconditionally guaranteed on a senior subordinated basis pursuant to guarantees by Cott Corporation and certainother wholly owned subsidiaries (the “Guarantor Subsidiaries”). Such guarantees are full, unconditional and jointand several.
We have not presented separate financial statements and other disclosures concerning subsidiary guarantorsbecause management has determined such information is not material to the holders of the above-mentionednotes.
The following supplemental financial information sets forth on an unconsolidated basis, our balance sheets,statements of income and cash flows for Cott Corporation, Cott Beverages Inc., Guarantor Subsidiaries and ourother subsidiaries (the “Non-guarantor Subsidiaries”). The supplemental financial information reflects ourinvestments and those of Cott Beverages Inc. in their respective subsidiaries using the equity method ofaccounting.
Condensed Consolidating Statement for IncomeFor the year ended December 27, 2008
CottCorporation
CottBeverages Inc.
GuarantorSubsidiaries
Non-guarantorSubsidiaries
EliminationEntries Consolidated
Revenue . . . . . . . . . . . . . . . . . $ 229.1 $942.8 $ 391.2 $138.2 $ (53.2) $1,648.1Cost of sales . . . . . . . . . . . . . . 191.7 858.3 343.4 126.9 (53.2) 1,467.1
Gross profit . . . . . . . . . . . . . . 37.4 84.5 47.8 11.3 — 181.0Selling, general andadministrative expenses . . . 46.0 83.5 34.6 15.7 — 179.8
Loss (gain) on disposal ofproperty, plant andequipment . . . . . . . . . . . . . . 0.5 1.2 (0.4) — — 1.3
Restructuring, assetimpairments and othercharges:Restructuring andother . . . . . . . . . . . . . . 1.1 5.7 — (0.1) — 6.7
Goodwill impairments . . — — 69.2 — — 69.2Asset impairments . . . . . . — 37.0 — — — 37.0
Operating (loss) income . . . . (10.2) (42.9) (55.6) (4.3) — (113.0)Other (income) expense,net . . . . . . . . . . . . . . . . . . . . — (0.2) (5.3) 0.8 — (4.7)
Intercompany Interest expense(income), net . . . . . . . . . . . . (12.4) 12.9 (0.5) — — —
Interest expense (income),net . . . . . . . . . . . . . . . . . . . . 0.3 31.7 — 0.3 — 32.3
Minority interest . . . . . . . . . . . — — — 1.7 — 1.7
(Loss) income before incometaxes (recovery) andequity (loss) income . . . . . . 1.9 (87.3) (49.8) (7.1) — (142.3)
Income taxes (recovery)expense . . . . . . . . . . . . . . . . 0.4 (22.1) 1.6 0.6 — (19.5)
Equity (loss) income . . . . . . . . (124.3) 1.8 (73.6) — 196.1 —
Net (loss) income . . . . . . . . . . $(122.8) $ (63.4) $(125.0) $ (7.7) $196.1 $ (122.8)
F-41

Condensed Consolidating Statement for IncomeFor the year ended December 29, 2007
CottCorporation
CottBeverages Inc.
GuarantorSubsidiaries
Non-guarantorSubsidiaries
EliminationEntries Consolidated
Revenue . . . . . . . . . . . . . . . . . $268.6 $1,033.8 $ 409.6 $135.8 $ (71.4) $1,776.4Cost of sales . . . . . . . . . . . . . . 228.5 943.0 357.9 120.0 (71.4) 1,578.0
Gross profit . . . . . . . . . . . . . . 40.1 90.8 51.7 15.8 — 198.4Selling, general andadministrative expenses . . . 31.2 84.6 37.1 9.0 — 161.9
Loss (gain) on disposal ofproperty, plant andequipment . . . . . . . . . . . . . . — 0.4 (0.2) — — 0.2
Restructuring, assetimpairments and othercharges:
Restructuring and other . . . . . . 10.2 15.3 (1.2) — — 24.3Goodwill impairments . . . . . . — 55.8 — — 55.8Asset impairments . . . . . . . . . . — 5.6 5.1 — — 10.7
Operating (loss) income . . . . (1.3) (70.9) 10.9 6.8 — (54.5)Other (income) expense,net . . . . . . . . . . . . . . . . . . . . (4.5) 1.5 (0.7) (1.0) — (4.7)
Interest expense (income),net . . . . . . . . . . . . . . . . . . . . (7.1) 37.1 — 2.8 — 32.8
Minority interest . . . . . . . . . . . — — — 2.7 — 2.7
(Loss) income before incometaxes (recovery) andequity (loss) income . . . . . . 10.3 (109.5) 11.6 2.3 — (85.3)
Income taxes (recovery)expense . . . . . . . . . . . . . . . . (7.1) (6.7) (0.6) 0.5 — (13.9)
Equity (loss) income . . . . . . . . (88.8) 2.8 (100.2) — 186.2 —
Net (loss) income . . . . . . . . . . $ (71.4) $ (100.0) $ (88.0) $ 1.8 $186.2 $ (71.4)
F-42

Condensed Consolidating Statement for IncomeFor the year ended December 30, 2006
CottCorporation
CottBeverages Inc.
GuarantorSubsidiaries
Non-guarantorSubsidiaries
EliminationEntries Consolidated
Revenue . . . . . . . . . . . . . . . . . $229.7 $1,091.8 $396.0 $126.9 $(72.6) $1,771.8Cost of sales . . . . . . . . . . . . . . 188.4 968.3 360.4 110.4 (72.6) 1,554.9
Gross profit . . . . . . . . . . . . . . 41.3 123.5 35.6 16.5 — 216.9Selling, general andadministrative expenses . . . 34.1 94.6 36.9 10.5 — 176.1
Loss (gain) on disposal ofproperty, plant andequipment . . . . . . . . . . . . . . (0.5) 0.6 (0.1) — — (0.0)
Restructuring and assetimpairmentsRestructuring . . . . . . . . . . 1.9 18.2 0.4 — — 20.5Asset impairments . . . . . . — 14.2 1.0 0.2 — 15.4Other . . . . . . . . . . . . . . . . — — 2.6 — — 2.6
Operating income (loss) . . . . 5.8 (4.1) (5.2) 5.8 — 2.3Other expense (income),net . . . . . . . . . . . . . . . . . . . . (0.1) 9.2 (1.9) (5.6) (1.5) 0.1
Interest expense (income),net . . . . . . . . . . . . . . . . . . . . (0.2) 31.4 1.1 (0.1) — 32.2
Minority interest . . . . . . . . . . . — — — 3.8 — 3.8
Income (loss) before incometaxes (recovery) andequity (loss) income . . . . . . 6.1 (44.7) (4.4) 7.7 1.5 (33.8)
Income taxes (recovery)expense . . . . . . . . . . . . . . . . — (18.4) 0.3 8.5 (6.7) (16.3)
Equity (loss) income . . . . . . . . (23.6) (9.9) (10.9) — 44.4 —
Net (loss) income . . . . . . . . . . $ (17.5) $ (36.2) $ (15.6) $ (0.8) $ 52.6 $ (17.5)
F-43

Consolidating Balance SheetAs of December 27, 2008
CottCorporation
CottBeverages Inc.
GuarantorSubsidiaries
Non-guarantorSubsidiaries
EliminationEntries Consolidated
ASSETSCurrent assets
Cash . . . . . . . . . . . . . . . . . . . . . . . . . $ 2.1 $ 3.1 $ 7.4 $ 2.1 — $ 14.7Accounts receivable . . . . . . . . . . . . 37.1 97.2 57.7 18.3 (45.9) 164.4Income taxes recoverable . . . . . . . . — 7.7 — — — 7.7Inventories . . . . . . . . . . . . . . . . . . . . 19.2 68.7 17.6 5.6 — 111.1Prepaid expenses and otherassets . . . . . . . . . . . . . . . . . . . . . . 2.2 3.9 3.0 0.2 — 9.3
Deferred income taxes . . . . . . . . . . — 3.0 — — — 3.0
60.6 183.6 85.7 26.2 (45.9) 310.2Property, plant and equipment . . . . . . . . 42.9 197.1 93.9 12.9 — 346.8Goodwill . . . . . . . . . . . . . . . . . . . . . . . . . 22.5 4.5 — — — 27.0Intangibles and other assets . . . . . . . . . . 3.3 119.1 18.3 28.9 — 169.6Deferred income taxes . . . . . . . . . . . . . . 10.2 — 0.1 — — 10.3Tax receivable . . . . . . . . . . . . . . . . . . . . . — 9.2 — — — 9.2Due from affiliates . . . . . . . . . . . . . . . . . 249.7 10.0 210.3 41.9 (511.9) —Investments in subsidiaries . . . . . . . . . . . — 14.8 — 131.8 (146.6) —
389.2 538.3 408.3 241.7 (704.4) 873.1
LIABILITIESCurrent liabilities
Short-term borrowings . . . . . . . . . . 2.9 104.6 — — — 107.5Current maturities of long-termdebt . . . . . . . . . . . . . . . . . . . . . . . — 7.3 — 0.3 — 7.6
Income taxes payable . . . . . . . . . . . — 0.1 — — — 0.1Accounts payable and accruedliabilities . . . . . . . . . . . . . . . . . . . 38.2 95.9 64.3 14.2 (45.9) 166.7
Deferred income taxes . . . . . . . . . . — — — — — —
41.1 207.9 64.3 14.5 (45.9) 281.9Long-term debt . . . . . . . . . . . . . . . . . . . . — 291.4 — 3.0 — 294.4Other long-term liabilities . . . . . . . . . . . . 0.1 9.6 6.3 — — 16.0Other tax liabilities . . . . . . . . . . . . . . . . . 18.0 — — 0.3 — 18.3Deferred income taxes . . . . . . . . . . . . . . — 4.8 11.2 — — 16.0Losses and distributions in excess ofinvestment . . . . . . . . . . . . . . . . . . . . . . 57.8 — 272.7 — (330.5) —
Due from affiliates . . . . . . . . . . . . . . . . . 43.0 209.2 247.0 12.7 (511.9) —
160.0 722.9 601.5 30.5 (888.3) 626.6
Minority interest . . . . . . . . . . . . . . . . . . . — — — 17.3 — 17.3
Shareowners’ EquityCapital stock
Common shares . . . . . . . . . . . . . . . . 275.0 211.4 294.5 175.3 (681.2) 275.0Treasury shares . . . . . . . . . . . . . . . . (6.4) — — — — (6.4)Restricted shares . . . . . . . . . . . . . . . — — — — — —
Additional paid-in-capital . . . . . . . . . . . . 38.1 (1.0) — 1.0 — 38.1(Accumulated deficit) retainedearnings . . . . . . . . . . . . . . . . . . . . . . . . (29.7) (393.2) (502.9) (20.7) 916.8 (29.7)
Accumulated other comprehensive (loss)income . . . . . . . . . . . . . . . . . . . . . . . . . (47.8) (1.8) 15.2 38.3 (51.7) (47.8)
229.2 (184.6) (193.2) 193.9 183.9 229.2
$389.2 $ 538.3 $ 408.3 $241.7 $(704.4) $873.1
F-44

Consolidating Balance SheetAs of December 29, 2007
CottCorporation
CottBeverages Inc.
GuarantorSubsidiaries
Non-guarantorSubsidiaries
EliminationEntries Consolidated
ASSETSCurrent assets
Cash . . . . . . . . . . . . . . . . . . . . . . . . $ 13.2 $ — $ 10.3 $ 3.9 $ — $ 27.4Accounts receivable . . . . . . . . . . . 33.7 26.0 83.4 86.7 (34.4) 195.4Income taxes recoverable . . . . . . . 0.1 28.6 3.3 0.8 — 32.8Inventories . . . . . . . . . . . . . . . . . . . 26.1 71.7 25.2 7.1 — 130.1Prepaid expenses and otherassets . . . . . . . . . . . . . . . . . . . . . 1.6 4.3 4.0 0.3 — 10.2
Deferred income taxes . . . . . . . . . . — 1.8 0.7 — — 2.5
74.7 132.4 126.9 98.8 (34.4) 398.4Property, plant and equipment . . . . . . . 59.4 184.1 132.8 12.1 — 388.4Goodwill . . . . . . . . . . . . . . . . . . . . . . . . 28.0 4.5 75.8 — — 108.3Intangibles and other assets . . . . . . . . . . 16.3 159.9 26.5 33.3 — 236.0Deferred income taxes . . . . . . . . . . . . . . — — 12.8 0.5 — 13.3Due from affiliates . . . . . . . . . . . . . . . . 266.7 9.0 198.0 41.7 (515.4) —Investments in subsidiaries . . . . . . . . . . 95.6 20.7 — 164.1 (280.4) —
$540.7 $ 510.6 $ 572.8 $350.5 $(830.2) $1,144.4
LIABILITIESCurrent liabilities
Short-term borrowings . . . . . . . . . $ 20.4 $ 82.4 $ — $ 34.2 $ — $ 137.0Current maturities of long-termdebt . . . . . . . . . . . . . . . . . . . . . . — 2.4 — — — 2.4
Accounts payable and accruedliabilities . . . . . . . . . . . . . . . . . . 31.7 84.3 87.7 26.1 (34.4) 195.4
52.1 169.1 87.7 60.3 (34.4) 334.8Long-term debt . . . . . . . . . . . . . . . . . . . — 269.0 — — — 269.0Other long-term liabilities . . . . . . . . . . . 0.3 12.3 5.5 — — 18.1Other tax liabilities . . . . . . . . . . . . . . . . 45.1 194.8 268.6 6.9 (515.4) —Deferred income taxes . . . . . . . . . . . . . . 11.0 11.4 14.2 — — 36.6Losses and distributions in excess ofinvestment . . . . . . . . . . . . . . . . . . . . . — — 163.0 — (163.0) —
Due from affiliates . . . . . . . . . . . . . . . . — 15.2 18.9 — — 34.1
108.5 671.8 557.9 67.2 (712.8) 692.6
Minority interest . . . . . . . . . . . . . . . . . . — — — 19.6 — 19.6
Shareowners’ EquityCapital stock
Common shares . . . . . . . . . . . . . . . 275.0 178.4 319.5 175.0 (672.9) 275.0Restricted shares . . . . . . . . . . . . . . (0.4) — — — — (0.4)
Additional paid-in-capital . . . . . . . . . . . 32.2 — — — — 32.2Retained earnings (deficit) . . . . . . . . . . 93.1 (339.6) (276.5) 5.0 611.1 93.1Accumulated other comprehensiveincome (loss) . . . . . . . . . . . . . . . . . . . 32.3 — (28.1) 83.7 (55.6) 32.3
432.2 (161.2) 14.9 263.7 (117.4) 432.2
$540.7 $ 510.6 $ 572.8 $350.5 $(830.2) $1,144.4
F-45

Condensed Consolidating Statement of Cash FlowsFor the year ended December 27, 2008
CottCorporation
CottBeverages Inc.
GuarantorSubsidiaries
Non-guarantorSubsidiaries
EliminationEntries Consolidated
Operating activitiesNet (loss) income . . . . . . . . . . . . . . . . . . . . . . . $(122.8) $ (63.4) $(125.0) $ (7.7) $ 196.1 $ (122.8)
Depreciation and amortization . . . . . . . . . 13.6 41.6 19.5 6.0 — 80.7Amortization of financing fees . . . . . . . . . 0.2 0.7 0.2 — — 1.1Share-based compensation . . . . . . . . . . . . 2.1 3.4 0.1 — — 5.6Deferred income taxes . . . . . . . . . . . . . . . (27.9) 30.7 (3.2) (13.0) — (13.4)Tax receivable . . . . . . . . . . . . . . . . . . . . . . — — — — — —Increase in other income tax liabilities . . . 21.3 (42.7) (1.3) — — (22.7)Minority interest . . . . . . . . . . . . . . . . . . . . — — — 1.7 — 1.7Loss (gain) on disposal of property, plantand equipment . . . . . . . . . . . . . . . . . . . . 0.5 1.2 (0.4) — — 1.3
Equity (loss) income , net ofdistributions . . . . . . . . . . . . . . . . . . . . . 124.3 (1.8) 73.6 — (196.1) —
Inter-company transactions . . . . . . . . . . . . 9.7 3.8 3.0 — (16.5) —Asset impairments . . . . . . . . . . . . . . . . . . . — 1.6 — — — 1.6Intangible impairments . . . . . . . . . . . . . . . — 35.4 — — — 35.4Goodwill impairments . . . . . . . . . . . . . . . — — 69.2 — — 69.2Lease contract termination loss . . . . . . . . . — 0.3 — — — 0.3Lease contract termination payments . . . . — (3.8) — — — (3.8)Other non-cash items . . . . . . . . . . . . . . . . 1.5 1.6 — — — 3.1Net change in non-cash workingcapital . . . . . . . . . . . . . . . . . . . . . . . . . . (34.5) 5.1 30.0 29.0 — 29.6
Net cash provided by (used in) operatingactivities . . . . . . . . . . . . . . . . . . . . . . . . (12.0) 13.7 65.7 16.0 (16.5) 66.9
Investing activitiesAdditions to property, plant andequipment . . . . . . . . . . . . . . . . . . . . . . . (2.5) (42.6) (8.5) (2.3) — (55.9)
Acquisitions . . . . . . . . . . . . . . . . . . . . . . . — — — — — —Proceeds from disposal of property, plantand equipment . . . . . . . . . . . . . . . . . . . . 2.5 1.9 0.1 — — 4.5
Advances to affiliates . . . . . . . . . . . . . . . . 22.4 — (10.4) (6.0) (6.0) —Investment in subsidiary . . . . . . . . . . . . . . — — — — — —Additions to intangibles and otherassets . . . . . . . . . . . . . . . . . . . . . . . . . . . (0.3) (3.1) — — — (3.4)
Net cash (used in) provided by investingactivities . . . . . . . . . . . . . . . . . . . . . . . . 22.1 (43.8) (18.8) (8.3) (6.0) (54.8)
Financing activitiesPayments of long-term debt . . . . . . . . . . . — (8.7) — (0.3) — (9.0)Issue of long-term debt . . . . . . . . . . . . . . . — 33.8 — — — 33.8Payments on extinguishment of creditfacility . . . . . . . . . . . . . . . . . . . . . . . . . . (20.4) (91.9) (13.9) (1.3) — (127.5)
Short-term borrowings . . . . . . . . . . . . . . . — (8.1) — — — (8.1)Long-term borrowings—ABL . . . . . . . . . 40.9 1,196.9 62.5 — — 1,300.3Long-term repayments—ABL . . . . . . . . . (38.0) (1,092.2) (62.5) — — (1,192.7)Advances from affiliates . . . . . . . . . . . . . . 6.0 10.4 (22.4) — 6.0 —Distributions to subsidiary minorityshareowner . . . . . . . . . . . . . . . . . . . . . . — — — (3.9) — (3.9)
Issue of common shares . . . . . . . . . . . . . . — — — — — —Purchase of treasury shares . . . . . . . . . . . . (6.4) — — — — (6.4)Issuance of short-term debt . . . . . . . . . . . . — — — — — —Deferred financing fees . . . . . . . . . . . . . . . (0.8) (3.7) (0.8) — — (5.3)Dividends paid . . . . . . . . . . . . . . . . . . . . . — (3.0) (9.7) (3.8) 16.5 —Other financing activities . . . . . . . . . . . . . (0.2) (0.3) — — — (0.5)
Net cash (used in) provided by financingactivities . . . . . . . . . . . . . . . . . . . . . . . . (18.9) 33.2 (46.8) (9.3) 22.5 (19.3)
Effect of exchange rate on cash . . . . . . . . (2.3) — (3.0) (0.2) — (5.5)Net (decrease) increase in cash . . . . . . . (11.1) 3.1 (2.9) (1.8) (0.0) (12.7)
Cash, beginning of period . . . . . . . . . . . 13.2 — 10.3 3.9 — 27.4
Cash, end of period . . . . . . . . . . . . . . . . . $ 2.1 $ 3.1 $ 7.4 $ 2.1 $ (0.0) $ 14.7
F-46

Condensed Consolidating Statement of Cash FlowsFor the year ended December 29, 2007
CottCorporation
CottBeverages Inc.
GuarantorSubsidiaries
Non-guarantorSubsidiaries
EliminationEntries Consolidated
Operating activitiesNet (loss) income . . . . . . . . . . . . . . . . . . . . . $ (71.4) $(100.0) $ (88.0) $ 1.8 $ 186.2 $(71.4)
Depreciation and amortization . . . . . . . 12.3 34.1 20.4 4.9 — 71.7Amortization of financing fees . . . . . . . 0.1 0.2 1.1 0.4 — 1.8Share-based compensation . . . . . . . . . . 1.0 2.8 0.4 — — 4.2Deferred income taxes . . . . . . . . . . . . . 3.2 (3.8) 0.5 0.2 — 0.1Increase in other income taxliabilities . . . . . . . . . . . . . . . . . . . . . . (10.6) 10.0 1.5 — — 0.9
Minority interest . . . . . . . . . . . . . . . . . . — — — 2.7 — 2.7Gain on repurchase of notes . . . . . . . . . (0.4) — — — — (0.4)Loss (gain) on disposal of property,plant and equipment . . . . . . . . . . . . . — 0.4 (0.2) — — 0.2
Equity (loss) income , net ofdistributions . . . . . . . . . . . . . . . . . . . 194.2 1.3 113.3 — (308.8) —
Asset impairments . . . . . . . . . . . . . . . . 4.3 1.3 5.1 — — 10.7Goodwill impairments . . . . . . . . . . . . . — 55.8 — — — 55.8Lease contract termination loss . . . . . . — 12.5 — — — 12.5Lease contract terminationpayments . . . . . . . . . . . . . . . . . . . . . . — (7.7) — — — (7.7)
Other non-cash items . . . . . . . . . . . . . . — (0.1) — — — (0.1)Net change in non-cash workingcapital . . . . . . . . . . . . . . . . . . . . . . . . 1.1 (39.7) 39.1 (2.0) — (1.5)
Net cash provided by (used in)operating activities . . . . . . . . . . . . . . 133.8 (32.9) 93.2 8.0 (122.6) 79.5
Investing activitiesAdditions to property, plant andequipment . . . . . . . . . . . . . . . . . . . . . (6.9) (47.6) (17.2) (1.6) — (73.3)
Additions to intangibles and otherassets . . . . . . . . . . . . . . . . . . . . . . . . . (2.9) (0.4) (0.4) (0.2) — (3.9)
Proceeds from disposal of property,plant and equipment . . . . . . . . . . . . . — 1.3 — — — 1.3
Acquisition of business and businessassets . . . . . . . . . . . . . . . . . . . . . . . . . — — (2.2) — — (2.2)
Return of capital . . . . . . . . . . . . . . . . . . — — 97.4 — (97.4) —Advances to affiliates . . . . . . . . . . . . . . — 83.3 (25.9) (34.3) (23.1) —
Net cash (used in) provided byinvesting activities . . . . . . . . . . . . . . (9.8) 36.6 51.7 (36.1) (120.5) (78.1)
Financing activitiesPayments of long-term debt . . . . . . . . . (5.5) (2.8) — — — (8.3)Issue of long-term debt . . . . . . . . . . . . . — 1.4 — — — 1.4Short-term borrowings . . . . . . . . . . . . . 20.4 76.1 (107.7) 34.3 — 23.1Advances from affiliates . . . . . . . . . . . . (127.9) 27.2 77.4 0.2 23.1 —Return of capital . . . . . . . . . . . . . . . . . . — (97.4) — — 97.4 —Distributions to subsidiary minorityshareowner . . . . . . . . . . . . . . . . . . . . — — — (3.9) — (3.9)
Issue of common shares . . . . . . . . . . . . 0.5 — — — — 0.5Dividends paid . . . . . . . . . . . . . . . . . . . — (13.1) (105.4) (4.1) 122.6 —Other financing activities . . . . . . . . . . . (0.4) — — — — (0.4)
Net cash (used in) provided byfinancing activities . . . . . . . . . . . . . . (112.9) (8.6) (135.7) 26.5 243.1 12.4
Effect of exchange rate on cash . . . . . . 0.3 — (0.1) — — 0.2Net (decrease) increase in cash . . . . . 11.4 (4.9) 9.1 (1.6) (0.0) 14.0Cash, beginning of period . . . . . . . . . 1.8 4.9 1.2 5.5 — 13.4
Cash, end of period . . . . . . . . . . . . . . . $ 13.2 $ (0.0) $ 10.3 $ 3.9 $ (0.0) $ 27.4
F-47

Condensed Consolidating Statement of Cash FlowsFor the year ended December 30, 2006
CottCorporation
CottBeverages Inc.
GuarantorSubsidiaries
Non-guarantorSubsidiaries
EliminationEntries Consolidated
Operating activitiesNet (loss) income . . . . . . . . . . . . . . . . . $(17.5) $(36.2) $(15.6) $ (0.8) $ 52.6 $ (17.5)
Depreciation and amortization . . . 12.3 40.2 29.2 5.1 — 86.8Amortization of financing fees . . . 0.1 0.2 0.5 0.3 — 1.1Share-based compensation . . . . . . 11.4 — — — — 11.4Deferred income taxes . . . . . . . . . . — (6.4) (1.3) 7.8 (6.7) (6.6)Increase in other income taxliabilities . . . . . . . . . . . . . . . . . . — — — — — —
Minority interest . . . . . . . . . . . . . . — — — 3.8 — 3.8Loss on disposal of property, plantand equipment . . . . . . . . . . . . . . (0.5) 0.6 (0.1) — — (0.0)
Equity (loss) income , net ofdistributions . . . . . . . . . . . . . . . . 23.6 15.5 24.3 — (63.4) —
Asset impairments . . . . . . . . . . . . . (0.2) 15.6 — — — 15.4Lease contract termination loss . . . — 7.7 — — — 7.7Lease contract terminationpayments . . . . . . . . . . . . . . . . . . — — — — — —
Other non-cash items . . . . . . . . . . . (0.1) 0.2 4.1 0.1 — 4.3Net change in non-cash workingcapital . . . . . . . . . . . . . . . . . . . . 18.3 7.2 (25.8) 4.8 (1.5) 3.0
Net cash provided by (used in)operating activities . . . . . . . . . . 47.4 44.6 15.3 21.1 (19.0) 109.4
Investing activitiesAdditions to property, plant andequipment . . . . . . . . . . . . . . . . . (3.7) (20.3) (10.1) (1.0) — (35.1)
Additions to intangibles . . . . . . . . (4.2) (3.9) (4.9) — — (13.0)Proceeds from disposal ofproperty, plant andequipment . . . . . . . . . . . . . . . . . 0.7 0.6 0.3 — — 1.6
Advances to affiliates . . . . . . . . . . (47.7) 0.1 (8.8) — 56.4 —
Net cash (used in) provided byinvesting activities . . . . . . . . . . . (54.9) (23.5) (23.5) (1.0) 56.4 (46.5)
Financing activitiesPayments of long-term debt . . . . . — (1.0) — — — (1.0)Short-term borrowings . . . . . . . . . — (10.4) (45.5) (10.0) — (65.9)Advances from affiliates . . . . . . . . — 8.8 47.7 (0.1) (56.4) —Distributions to subsidiaryminority shareowner . . . . . . . . . — — — (5.4) — (5.4)
Issuance of common stock . . . . . . 0.4 — — — — 0.4Dividends paid . . . . . . . . . . . . . . . . — (13.4) — (5.6) 19.0 —Other financing activities . . . . . . . — (0.2) 0.8 — — 0.6
Net cash provided by (used in)financing activities . . . . . . . . . . 0.4 (16.2) 3.0 (21.1) (37.4) (71.3)
Effect of exchange rate on cash . . . 0.1 — 0.1 (0.1) — 0.1Net (decrease) increase incash . . . . . . . . . . . . . . . . . . . . . . (7.0) 4.9 (5.1) (1.1) — (8.3)
Cash, beginning of period . . . . . . 8.8 — 6.3 6.6 — 21.7
Cash, end of period . . . . . . . . . . . $ 1.8 $ 4.9 $ 1.2 $ 5.5 $ — $ 13.4
F-48

SCHEDULE II—VALUATION AND QUALIFYING ACCOUNTS
(In millions of U.S. dollars) Year ended December 27, 2008
Description
Balance atBeginning of
YearReduction in
Sales
Charged toCosts andExpenses
Charged toOther
Accounts DeductionsBalance atEnd of Year
Reserves deducted in the balance sheetfrom the asset to which they apply
Allowances for losses on:Accounts receivables . . . . . . . . . . . . . . . . $ (4.9) $ — $ (2.4) $ 1.5 $ 0.3 $ (5.5)Inventories . . . . . . . . . . . . . . . . . . . . . . . . (14.8) — (8.3) 1.3 14.7 (7.1)Deferred income tax liabilities . . . . . . . . . (20.8) — 34.6 (19.5) — (5.7)Other tax liabilities . . . . . . . . . . . . . . . . . . (36.6) — (5.1) 23.4 — (18.3)Accrued sales incentives . . . . . . . . . . . . . . (22.9) (34.1) — 5.0 31.0 (21.0)
$(100.0) $(34.1) $18.8 $ 11.7 $46.0 $(57.6)
(In millions of U.S. dollars) Year ended December 29, 2007
Description
Balanceat
Beginningof Year
Reduction inSales
Charged toCosts andExpenses
Charged toOther
Accounts Deductions
Balanceat Endof Year
Reserves deducted in the balance sheet fromthe asset to which they apply
Allowances for losses on:Accounts receivables . . . . . . . . . . . . . . . . . . . . $ (5.0) $ — $ 0.1 $ — $ — $ (4.9)Inventories . . . . . . . . . . . . . . . . . . . . . . . . . . . . (9.3) — (22.1) — 16.6 (14.8)Deferred income tax assets . . . . . . . . . . . . . . . . (17.5) — (21.2) 17.5 — (21.2)Other tax liabilities 1 . . . . . . . . . . . . . . . . . . . . . (30.2) — (0.7) (5.7) — (36.6)Accrued sales incentives . . . . . . . . . . . . . . . . . . (23.9) (48.6) — — 49.6 (22.9)
$(85.9) $(48.6) $(43.9) $11.8 $66.2 $(100.4)
1 On December 31, 2006, we adopted FASB Interpretation No. 48 “Accounting for Uncertainty in IncomeTaxes—an Interpretation of FASB Statement No. 109”. As of the beginning of our 2007 fiscal year, werecorded a liability for uncertain tax provisions in our Consolidated Balance Sheet of $30.2 million. Thisliability consists of a decrease in retained earnings of $4.2 million, a decrease in additional paid in capital of$4.6 million, a reclassification of $11.5 million from income taxes recoverable and $9.8 million recognitionof deferred tax assets. Included in the recognition of the $9.8 million of deferred tax assets is the 2006valuation allowance of $17.5 million.
(In millions of U.S. dollars) Year ended December 30, 2006
Description
Balance atBeginningof Year
Reduction inSales
Charged toCosts andExpenses
Charged toOther
Accounts DeductionsBalance atEnd of Year
Reserves deducted in the balance sheetfrom the asset to which they apply
Allowances for losses on:Accounts receivables . . . . . . . . . . . . . . . . . . $ (7.8) $ — $(1.8) $— $ 4.6 $ (5.0)Inventories . . . . . . . . . . . . . . . . . . . . . . . . . . (7.6) — (1.9) — 0.2 (9.3)Deferred income tax assets . . . . . . . . . . . . . (21.0) — 3.5 — — (17.5)Accrued sales incentives . . . . . . . . . . . . . . . (27.6) (45.9) — — 49.6 (23.9)
$(64.0) $(45.9) $(0.2) $— $54.4 $(55.7)
SCH-1

[THIS PAGE INTENTIONALLY LEFT BLANK]

Cott Corporation
Exhibit Index
Number Description
2.1 Agreement Relating to the Sale and Purchase of the Whole of the Issued Share Capital of Macaw(Holdings) Limited, dated August 10, 2005, between Andrew Cawthray and Others and Martyn Roseand Cott Beverages Limited (incorporated by reference to Exhibit 2.1 to our Form 8-K datedAugust 16, 2005).
3.1 Articles of Amalgamation of Cott Corporation (incorporated by reference to Exhibit 3.1 to our Form10-K filed February 28, 2007).
3.2 Amended and Restated By-laws of Cott Corporation (incorporated by reference to Exhibit 3.2 to ourForm 10-Q filed May 10, 2007).
4.1 Indenture dated as of December 21, 2001, between Cott Beverages Inc. (as issuer) and HSBC BankUSA (as trustee) (incorporated by reference to Exhibit 4.3 to our Form 10-K filed March 8, 2002).
4.2 Registration Rights Agreement dated as of December 21, 2001, among Cott Beverages Inc., theGuarantors named therein and Lehman Brothers Inc., BMO Nesbitt Burns Corp. and CIBC WorldMarkets Corp. (incorporated by reference to Exhibit 4.4 to our Form 10-K filed March 8, 2002).
10.1 1 Supply Agreement, dated December 21, 1998, between Wal-Mart Stores, Inc. and Cott BeveragesUSA, Inc. (now “Cott Beverages Inc.”) (incorporated by reference to Exhibit 10.3 to our Form 10-Kfiled March 31, 2000).
10.2 2 Second Canadian Employee Share Purchase Plan effective January 2, 2001 (incorporated byreference to Exhibit 10.11 to our Form 10-K filed March 20, 2001).
10.3 1 Supply Agreement executed November 11, 2003, effective January 1, 2002 between Crown Cork &Seal Company, Inc. and Cott Corporation (incorporated by reference to Exhibit 10.14 to our Form10-Q/A filed August 5, 2004).
10.4 2 Share Plan for Non-Employee Directors effective November 1, 2003 (incorporated by reference toExhibit 10.15 to our Form 10-K filed March 18, 2004).
10.5 2 Employment Offer Letter to Matthew A. Kane, Jr. dated March 12, 2004 (incorporated by referenceto Exhibit 10.42 to our Form 10-K filed March 11, 2008).
10.6 2 Letter Agreement with Frank E. Weise III, dated April 28, 2004 (incorporated by reference to Exhibit10.5 to our Form S-3/A filed on June 18, 2004).
10.7 2 Restated 1986 Common Share Option Plan of Cott Corporation/Corporation Cott as amendedthrough October 20, 2004 (incorporated by reference to Exhibit 10.15 to our Form 10-K filedMarch 16, 2005).
10.8 1 Amendment to Supply Agreement between Crown Cork & Seal USA, Inc. (successor to Crown Cork& Seal Company, Inc.) and Cott Corporation, dated December 23, 2004 (incorporated by reference toExhibit 10.17 to our Form 10-K filed March 16, 2005).
10.9 1 Credit Agreement, dated as of March 31, 2005, by and among Cott Corporation, Cott Beverages Inc.,Cott Beverages Limited, and Cott Embotelladores de Mexico, S.A. de C.V., as Borrowers, theLenders referred to herein, Wachovia Bank, National Association, as Administrative Agent andSecurity Trustee, Bank of Montreal, as Syndication Agent, and HSBC Bank Canada, CooperatieveCentrale Raiffeisen-BoerenleenBank B.A. “Rabobank International”, New York Branch, each as aDocumentation Agent, Wachovia Capital Markets, LLC as a Lead Arranger and the Sole BookManager, BMO Nesbitt Burns, as a Lead Arranger (incorporated by reference to Exhibit 10.1 to ourForm 10-Q filed May 12, 2005).
EX-1

Number Description
10.10 1 Receivables Purchase Agreement, dated as of April 1, 2005, among Cott USA ReceivablesCorporation, Cott Beverages Inc., Park Avenue Receivables Company, LLC, the financialinstitutions from time to time parties to the agreement, and JPMorgan Chase Bank, N.A.(incorporated by reference to Exhibit 10.2 to our Form 10-Q filed May 12, 2005).
10.11 First Amendment, Consent and Joinder Agreement, dated August 10, 2005, by and among CottCorporation, Cott Beverages Inc., Cott Beverages Limited, Macaw (Soft Drinks) Limited, CottEmbotelladores de Mexico, S.A. de C.V., certain Cott Corporation subsidiaries, the Lenders specifiedtherein and Wachovia Bank, National Association (incorporated by reference to Exhibit 10.1 to ourForm 8-K dated August 16, 2005).
10.12 2 Employment Agreement between Cott Corporation and Brent D. Willis dated May 16, 2006(incorporated by reference to Exhibit 10.1 to our Form 10-Q dated August 10, 2006).
10.13 2 Employment Agreement between Cott Corporation and Abilio Gonzalez dated August 1, 2006(incorporated by reference to Exhibit 10.7 to our Form 10-Q dated November 9, 2006).
10.14 2 Employment Agreement between Cott Corporation and Wynn A. Willard dated August 1, 2006(incorporated by reference to Exhibit 10.4 to our Form 10-Q dated November 9, 2006).
10.15 2 Employment Offer Letter to Richard Dobry dated September 21, 2006 and modification datedOctober 24, 2006 (incorporated by reference to Exhibit 10.6 to our Form 10-Q dated November 9,2006).
10.16 2 Cott Corporation Executive Incentive Share Purchase Plan (2008 Restatement) effective December31, 2006 (incorporated by reference to Exhibit 4.1 of our Form S-8 filed on June 20, 2008).
10.17 2 Employment Offer Letter to William Reis dated January 29, 2007 (incorporated by reference toExhibit 10.43 to our Form 10-K filed March 11, 2008).
10.18 2 Employment Offer Letter to Juan R. Figuereo dated March 5, 2007 (incorporated by reference toExhibit 10.1 to our Form 10-Q filed May 10, 2007).
10.19 2 Employment Offer Letter to Michael Creamer dated April 16, 2007 (filed herewith).
10.20 Third Amendment to the Credit Agreement dated as of July 17, 2007 (incorporated by reference toExhibit 10.3 to our Form 10-Q filed August 9, 2007).
10.21 Amendment No. 2 to Receivables Purchase Agreement dated as of July 17, 2007 (incorporated byreference to Exhibit 10.4 to our Form 10-Q filed August 9, 2007).
10.22 2 Amended and Restated Retention, Severance and Non-Competition Plan (incorporated by referenceto Exhibit 10.6 to our Form 10-Q filed August 9, 2007).
10.23 2 Amended and Restated Performance Share Unit Plan (incorporated by reference to Exhibit 10.7 toour Form 10-Q filed August 9, 2007).
10.24 2 Amended and Restated Share Appreciation Rights Plan (incorporated by reference to Exhibit 10.8 toour Form 10-Q filed August 9, 2007).
10.25 2 Employment Offer Letter to Gregory Leiter, executed October 15, 2007 (incorporated by reference toExhibit 10.41 to our Form 10-K filed March 11, 2008).
10.26 Letter Amendment to the senior secured credit facilities dated as of December 20, 2007 (incorporatedby reference to Exhibit 10.44 to our Form 10-K filed March 11, 2008).
10.27 Amendment No. 4 to Receivables Purchase Agreement effective December 29, 2007 (incorporatedby reference to Exhibit 10.45 to our Form 10-K filed March 11, 2008).
EX-2

Number Description
10.28 2 Employment Termination Agreement with Wynn Willard dated February 1, 2008 (incorporated byreference to Exhibit 10.1 to our Form 10-Q filed May 13, 2008).
10.29 2 Employment Offer Letter to Jerry Fowden dated February 29, 2008 (filed herewith).
10.30 2 Severance Agreement with Brent Willis dated April 7, 2008 and effective March 24, 2008(incorporated by reference to Exhibit 10.2 to our Form 10-Q filed May 13, 2008).
10.31 1 Credit Agreement dated as of March 31, 2008 among Cott Corporation, Cott Beverages Inc., CottBeverages Limited, the other Loan Parties party thereto, the Lenders party thereto, JPMorgan ChaseBank, N.A., London Branch as UK Security Trustee, JPMorgan Chase Bank, N.A., as AdministrativeAgent and Administrative Collateral Agent, and General Electric Capital Corporation, as Co-Collateral Agent (incorporated by reference to Exhibit 10.1 to our Form 8-K/A filed April 10, 2008).
10.32 2 Employment Agreement with David T. Gibbons dated April 23, 2008 (incorporated by reference toExhibit 10.3 to our Form 10-Q filed May 13, 2008).
10.33 Termination Letter Agreement with Richard Dobry dated June 27, 2008 (incorporated by reference toExhibit 10.3 to our Form 10-Q filed August 6, 2008).
10.34 Agreement between Cott Corporation and Cresendo Partners II, L.P., Series I, CrescendoInvestments II, LLC, Crescendo Partners III, L.P., Crescendo Investments III, LLC, Eric Rosenfeld,Mark Benadiba, Mario Pilozzi, Csaba Reider, and Greg Monahan, dated June 18, 2008 (incorporatedby reference to Exhibit 99.1 to the amended Schedule 13D filed by Crescendo Partners, L.P. onJune 20, 2008).
10.35 2 Termination Letter Agreement with Abilio Gonzalez dated August 13, 2008 (incorporated byreference to Exhibit 10.1 to our Form 10-Q filed November 6, 2008).
21.1 List of Subsidiaries of Cott Corporation (filed herewith).
23.1 Consent of Independent Registered Certified Public Accounting Firm (filed herewith).
23.2 Consent of Independent Registered Public Accounting Firm (filed herewith).
31.1 Certification of the Chief Executive Officer pursuant to section 302 of the Sarbanes-Oxley Act of2002 for the year ended December 27, 2008 (filed herewith).
31.2 Certification of the Chief Financial Officer pursuant to section 302 of the Sarbanes-Oxley Act of2002 for the year ended December 27, 2008 (filed herewith).
32.1 Certification of the Chief Executive Officer pursuant to section 906 of the Sarbanes-Oxley Act of2002 for the year ended December 27, 2008 (furnished herewith).
32.2 Certification of the Chief Financial Officer pursuant to section 906 of the Sarbanes-Oxley Act of2002 for the year ended December 27, 2008 (furnished herewith).
1 Document is subject to request for confidential treatment.2 Indicates a management contract or compensatory plan.
EX-3
EXHIBIT 31.1
CERTIFICATION PURSUANT TO SECTION 302 OF THE SARBANES-OXLEY ACT OF 2002
I, Jerry Fowden, certify that:
1. I have reviewed this annual report on Form 10-K of Cott Corporation;
2. Based on my knowledge, this report does not contain any untrue statement of a material fact or omit to statea material fact necessary to make the statements made, in light of the circumstances under which suchstatements were made, not misleading with respect to the period covered by this report;
3. Based on my knowledge, the financial statements, and other financial information included in this report,fairly present in all material respects the financial condition, results of operations and cash flows of theregistrant as of, and for, the periods presented in this report;
4. The registrant’s other certifying officer and I are responsible for establishing and maintaining disclosurecontrols and procedures (as defined in Exchange Act Rules 13a-15(e) and 15d-15(e)) and internal controlover financial reporting (as defined in Exchange Act Rules 13a-15(f) and 15d-15(f)) for the registrant andhave:
(a) Designed such disclosure controls and procedures, or caused such disclosure controls and procedures tobe designed under our supervision, to ensure that material information relating to the registrant,including its consolidated subsidiaries, is made known to us by others within those entities, particularlyduring the period in which this report is being prepared;
(b) Designed such internal control over financial reporting, or caused such internal control over financialreporting to be designed under our supervision, to provide reasonable assurance regarding thereliability of financial reporting and the preparation of financial statements for external purposes inaccordance with generally accepted accounting principles;
(c) Evaluated the effectiveness of the registrant’s disclosure controls and procedures and presented in thisreport our conclusions about the effectiveness of the disclosure controls and procedures, as of the endof the period covered by this report based on such evaluation; and
(d) Disclosed in this report any change in the registrant’s internal control over financial reporting thatoccurred during the registrant’s most recent fiscal quarter (the registrant’s fourth fiscal quarter in thecase of an annual report) that has materially affected, or is reasonably likely to materially affect, theregistrant’s internal control over financial reporting;
5. The registrant’s other certifying officer and I have disclosed, based on our most recent evaluation of internalcontrol over financial reporting, to the registrant’s auditors and the audit committee of the registrant’s boardof directors (or persons performing the equivalent functions):
(a) All significant deficiencies and material weaknesses in the design or operation of internal control overfinancial reporting which are reasonably likely to adversely affect the registrant’s ability to record,process, summarize and report financial information;
(b) Any fraud, whether or not material, that involves management or other employees who have asignificant role in the registrant’s internal control over financial reporting.
/s/ Jerry Fowden
Jerry FowdenChief Executive OfficerMarch 11, 2009

EXHIBIT 31.2
CERTIFICATION PURSUANT TO SECTION 302 OF THE SARBANES-OXLEY ACT OF 2002
I, Juan Figuereo certify that:
1. I have reviewed this annual report on Form 10-K of Cott Corporation;
2. Based on my knowledge, this report does not contain any untrue statement of a material fact or omit to statea material fact necessary to make the statements made, in light of the circumstances under which suchstatements were made, not misleading with respect to the period covered by this report;
3. Based on my knowledge, the financial statements, and other financial information included in this report,fairly present in all material respects the financial condition, results of operations and cash flows of theregistrant as of, and for, the periods presented in this report;
4. The registrant’s other certifying officer and I are responsible for establishing and maintaining disclosurecontrols and procedures (as defined in Exchange Act Rules 13a-15(e) and 15d-15(e)) and internal controlover financial reporting (as defined in Exchange Act Rules 13a-15(f) and 15d-15(f)) for the registrant andhave:
(a) Designed such disclosure controls and procedures, or caused such disclosure controls and procedures tobe designed under our supervision, to ensure that material information relating to the registrant,including its consolidated subsidiaries, is made known to us by others within those entities, particularlyduring the period in which this report is being prepared;
(b) Designed such internal control over financial reporting, or caused such internal control over financialreporting to be designed under our supervision, to provide reasonable assurance regarding thereliability of financial reporting and the preparation of financial statements for external purposes inaccordance with generally accepted accounting principles;
(c) Evaluated the effectiveness of the registrant’s disclosure controls and procedures and presented in thisreport our conclusions about the effectiveness of the disclosure controls and procedures, as of the endof the period covered by this report based on such evaluation; and
(d) Disclosed in this report any change in the registrant’s internal control over financial reporting thatoccurred during the registrant’s most recent fiscal quarter (the registrant’s fourth fiscal quarter in thecase of an annual report) that has materially affected, or is reasonably likely to materially affect, theregistrant’s internal control over financial reporting;
5. The registrant’s other certifying officer and I have disclosed, based on our most recent evaluation of internalcontrol over financial reporting, to the registrant’s auditors and the audit committee of the registrant’s boardof directors (or persons performing the equivalent functions):
(a) All significant deficiencies and material weaknesses in the design or operation of internal control overfinancial reporting which are reasonably likely to adversely affect the registrant’s ability to record,process, summarize and report financial information;
(b) Any fraud, whether or not material, that involves management or other employees who have asignificant role in the registrant’s internal control over financial reporting.
/s/ Juan Figuereo
Juan FiguereoChief Financial OfficerMarch 11, 2009

EXHIBIT 32.1
CERTIFICATION PURSUANT TO 18 U.S.C. SECTION 1350 AS ADOPTED PURSUANT TO SECTION906 OF THE SARBANES-OXLEY ACT OF 2002.
The undersigned, Jerry Fowden, Chief Executive Officer of Cott Corporation (the “Company”), hasexecuted this certification in connection with the filing with the Securities and Exchange Commission of theCompany’s Annual Report on Form 10-K for the year ended December 27, 2008 (the “Report”).
The undersigned hereby certifies that to the best of his knowledge:
The Report fully complies with the requirements of Section 13(a) or 15(d) of the Securities Exchange Act of1934; and
The information contained in the Report fairly presents, in all material respects, the financial condition andresults of operations of the Company.
IN WITNESS WHEREOF, the undersigned has executed this certification as of the 11th day of March,2009.
/s/ Jerry Fowden
Jerry FowdenChief Executive OfficerMarch 11, 2009

EXHIBIT 32.2
CERTIFICATION PURSUANT TO 18 U.S.C. SECTION 1350 AS ADOPTED PURSUANT TO SECTION906 OF THE SARBANES-OXLEY ACT OF 2002.
The undersigned, Juan Figuereo, Chief Financial Officer of Cott Corporation (the “Company”), hasexecuted this certification in connection with the filing with the Securities and Exchange Commission of theCompany’s Annual Report on Form 10-K for the year ended December 27, 2008 (the “Report”).
The undersigned hereby certifies that to the best of his knowledge:
The Report fully complies with the requirements of Section 13(a) or 15(d) of the Securities Exchange Act of1934; and
The information contained in the Report fairly presents, in all material respects, the financial condition andresults of operations of the Company.
IN WITNESS WHEREOF, the undersigned has executed this certification as of the 11th day of March,2009.
/s/ Juan Figuereo
Juan FiguereoChief Financial OfficerMarch 11, 2009

[THIS PAGE INTENTIONALLY LEFT BLANK]

EXECUTIVE OFFICERS
Jerry FowdenChief Executive Officer
Juan R. FiguereoChief Financial Officer
Matthew A. Kane, Jr.Vice President, General Counsel and Secretary
Michael CreamerVice President, People
Bill ReisChief Procurement Officer
Greg LeiterSenior Vice President, Corporate Controller
BOARD OF DIRECTORS
Mark BenadibaCorporate Director
George Burnett1,3Chief Executive OfficerALTA COLLEGES, INC.
Jerry FowdenChief Executive OfficerCOTT CORPORATION
David T. Gibbons2Chairman
Stephen H. HalperinPartner
GOODMANS LLP
BJ (Betty Jane) Hess3Corporate Director
Gregory Rush Monahan1Managing Director
CRESCENDO PARTNERS, LP
Mario Pilozzi3Corporate Director
Andrew Prozes2Global Chief Executive Officer
LEXISNEXIS GROUP
Eric Rosenfeld2President and Chief Executive Officer
CRESCENDO PARTNERS, LP
Graham W. Savage1Chairman
CALLISTO CAPITAL LP
BOARD COMMITTEES
1 Audit Committee2 Corporate Governance Committee3 Human Resource Compensation Committee
EXECUTIVE OFFICES
5519 West Idlewild AvenueTampa, Florida, U.S.A. 33634
tel: 813.313.1800 ~ 888.268.8872fax: 813.881.1870
6525 Viscount RoadMississauga, Ontario L4V 1H6
tel: 905.672.1900fax: 905.672.5299
REGISTERED OFFICE333 Avro AvenuePointe-Claire, QuebecH9R5W3
INVESTOR INFORMATIONTel: 813.313.1872Email: [email protected]: www.cott.com
PUBLICATIONSFor copies of the Annual Report or theSEC Form 10-K, visit our website, orcontact us at 813.313.1872
QUARTERLY BUSINESSRESULTS/COTT NEWSCurrent investor information isavailable on our website atwww.cott.com
TRANSFER AGENT ®ISTRARComputershare Investor Services Inc.
STOCK EXCHANGE LISTINGSNYSE: COTTSX: BCB
AUDITORSPricewaterhouseCoopers LLP
A TRIBUTE TO FRANK E. WEISE III
In November 2008, the Cott family lost a great leader, friend and colleague, Frank E. Weise, III, former Chairman andChief Executive Officer. Through his dedicated service, Frank set the gold standard for leadership, integrity, devotion andfriendship. Frank was bestowed with many honors while at Cott, including the prestigious US Beverage Industry “Executiveof the Year” award in 2002. The National Post named him one of Canada’s top three CEOs that same year. Frank’s successboth as a professional and as a friend is a reminder that great people, with focus, dedication and heart, can create real andlasting change.