
2008 Annual Report -...
69
Annual Report ~2008~
Transcript of 2008 Annual Report -...

Annual Report~2008~

~ On Our Cover ~
“Apple Butter Season” © 2008 Will Moses
In the painting commissioned for this year’s cover,artist Will Moses, great-grandson of legendary
painter Grandma Moses, transports us to an earlier timeat J. M. Smucker’s Orrville home, where families aregathered to celebrate the goodness of the harvest.
~ Contents ~
Letter to Shareholders 2
Business Overview 6
Recipes 11
Five-Year Summary of Selected Financial Data 14
Summary of Quarterly Results of Operations 15
Stock Price Data 15
Comparison of Five-Year CumulativeTotal Shareholder Return 16
Management’s Discussion and Analysis 17
Report of Management on Internal ControlOver Financial Reporting 27
Report of Independent Registered Public AccountingFirm on Internal Control Over Financial Reporting 28
Report of Independent Registered Public AccountingFirm on the Consolidated Financial Statements 29
Report of Management on Responsibilityfor Financial Reporting 30
Consolidated Financial Statements 31
Notes to Consolidated Financial Statements 36
Directors, Officers, and General Managers 64
Properties 64
Corporate and Shareholder Information 65
Year Ended April 30,
(Dollars in thousands, except per share data) 2008 2007
Net sales $2,524,774 $2,148,017Net income and net income per common share:
Net income $ 170,379 $ 157,219Net income per common share – assuming dilution $ 3.00 $ 2.76
Income and income per common share before restructuringand merger and integration costs: (1)
Income $ 178,881 $ 165,152Income per common share – assuming dilution $ 3.15 $ 2.89
Common shares outstanding at year end 54,622,612 56,779,850Number of employees 3,250 3,025
(1) Reconciliation to net income:Income before income taxes $ 254,788 $ 241,004Merger and integration costs 7,967 61Cost of products sold – restructuring 1,510 9,981Other restructuring costs 3,237 2,120
Income before income taxes, restructuring, and mergerand integration costs $ 267,502 $ 253,166Income taxes 88,621 88,014
Income before restructuring and merger and integration costs $ 178,881 $ 165,152
Financial HighlightsThe J.M. Smucker Company

Why We Are, Who We Are
...Our Culture
A culture of dotting the i’s and crossing the t’s…
Of doing the right things and doing things right…
A culture of growth — individual and as a company.
It’s who we are. It’s because of who we are.
It’s a result of living our Basic Beliefs…
Our Commitment to Each Other. To our customers,
and to our consumers.
As we look to the future of unlimited possibilities,
we recognize the principles that are instrumental
to our success…
A culture deeply rooted in our Basic Beliefs…
Guideposts for decisions at every level...
Why we are who we are.
A culture that encourages commitment to each other…
Clear communication and collaboration…
Vision…A culture of appreciation.
A family-sense of sharing in a job well done…
Where every person makes a difference.
®
®
®®
®
®


Fiscal 2008 was another record year for The J. M.
Smucker Company. This is especially gratifying in light
of the year’s challenging economic environment and
unprecedented commodity-driven cost increases, which
impacted all of our businesses.
Sales, excluding divested businesses, were up
22 percent, and net income grew eight percent.
Net income per share was $3.00, up from $2.76
last year, a nine percent increase.
Cash flow from operations exceeded $190 million,
allowing for a dividend increase for the 28th time
in the last 31 years.
We attribute our fiscal 2008 success to:
Our loyal consumers and customers, who trust
the Smucker family of brands to deliver on the
promise of quality, taste, and value;
Our talented and dedicated employees, who
continue to focus on our core business, while
embracing change as we grow;
A clear strategy of owning and marketing leading
food brands in North America; and
Our long-term commitment to investing in our
brands, developing new products, and acquiring
strategic businesses.
In fiscal 2008, we repurchased 2.9 million shares, total-
ing almost $150 million. This action demonstrates our
confidence in our Company and is an effective means
for continuing to create shareholder value.
~ Long-Term Performance ~
While we are proud of our fiscal 2008 results, they are
only a snapshot of a single year. We believe that success
is best measured over the long term, and we are pleased
to report that our compounded net sales and earnings
per share grew over the past decade by 16 percent and
10 percent, respectively.
Just as important, we measure success by more than
a financial yardstick. Our long-held values and philoso-
phies tell the true story of who we are—and with whom
you, as a shareholder, have entrusted your investment.
~ Our Purpose and Strategy ~
Our Company, brands, and people are about more
than making and marketing products.
At Smucker, our purpose is to help families share
memorable meals and moments. Key to achieving our
purpose is our strategic vision of owning and marketing
#1 food brands in North America. The Smucker family
of brands is a trusted part of everyday meals, casual
get-togethers, and special occasions—all of which foster
family connections and lasting memories.
Bringing families together is best accomplished by
employees who feel like family themselves. At Smucker,
we maintain a unique family feeling by genuinely living
our Basic Beliefs: Quality, People, Ethics, Growth, and
Independence.
Our purpose is what brings Smucker employees to
work every day. Our strategy is what guides our organi-
zation in a common direction and is the framework for
serving our consumers, customers, employees, suppliers,
communities, and shareholders.
Dear Shareholders and Friends:
~ 2 ~

~ Serving Our Constituents ~
Consumers Meeting consumers’ needs is the heart of
all we do. We always seek to understand what consumers
want and to meet their needs with quality products that
are “good and good for you,” “easy for you,” and that
“make you smile.” That commitment, along with respon-
sible marketing, helps establish a bond between our
brands and consumers. Consumer trust, which takes
years to build, is something we never take for granted.
Customers We strive to satisfy our customers by
delivering outstanding service, offering fair prices, and
creating jointly developed business plans that promise
mutual benefits. Our emphasis on ethics, fairness, and
quality is vital to long-term, productive customer
relationships.
A recent industry initiative called New Ways of Work-
ing Together aims to eliminate business disruptions,
so that—as a team—retailers and manufacturers can
focus more closely on satisfying consumers and grow-
ing business. While this is not a new objective for us,
we have taken a leadership position in this initiative,
because we believe it will benefit everyone: retailers,
manufacturers, and ultimately, consumers.
Employees Smucker employees are quality people,
each of whom brings important talents, perspectives,
and skills to our Company. We believe that every
employee makes a difference.
Suppliers Achieving our strategy depends on dedicated
suppliers and business partners who share our willingness
to go the extra mile in the name of quality and service.
We view our suppliers and business partners as extended
family, and we treat them accordingly. Whether it is the
brokers who stock the retail shelves, the drivers who
deliver our products, the farmers who supply our raw
materials, or the people who create our advertising—
each supplier or partner plays a key role that we
appreciate and acknowledge.
Communities We take seriously our responsibility to
be good environmental stewards. Sustainability, a term
now popular throughout the industry, describes what
we have been doing for many years. We realize that sus-
tainability begins at home—in the 20 North American
communities in which we have offices and manufacturing
plants—and that our local efforts fan out in concentric
circles that ultimately impact the world.
Shareholders In the final analysis, we are confident
that if we do a good job of serving our consumers,
customers, employees, suppliers, and communities, we
will ultimately deliver good returns for our shareholders.
It is clear to us that to achieve lasting, measurable
results, we must serve each of our constituents with
sincerity, trust, creativity, and unwavering dedication to
doing what is right. This is a longstanding commitment
on the part of thousands of thoughtful, capable people,
working with shared purpose in an atmosphere of
collaboration—people who strive every day to help
families create memorable meals and moments together.
All of us at The J. M. Smucker Company thank you for
your continued support and dedication.
Sincerely,
Tim Smucker Richard Smucker
~ 3 ~


Whatever the occasion, we are honored that our brands are included in family meals every day. Our tradi-tional favorites are joined by newly added brands, helping us deliver on
our promise to offer products that are good and good for you, convenient,
and that make you smile.

~ U.S. Retail Segment ~
Sales and profits within our U.S. Retail segment grew
by 21 percent and four percent, respectively, in fiscal
2008. Contributing to this growth were our core busi-
ness, new products, and the first full year of sales and
profits from the Eagle Brand acquisition. We are espe-
cially pleased with the performance of our U.S. Retail
segment, given another year of record-high commodity
costs that impacted all of our businesses.
During uncertain economic times, the Smucker
family of brands steadfastly provides consumers with
highly proven, deeply trusted products. Smucker’s, Jif,
Pillsbury, Crisco, Eagle Brand, Hungry Jack, Martha
White, and White Lily are well-loved parts of the
everyday meals and special occasions that bring
families together.
We are passionate about serving our consumers and
customers, and we always seek better ways to meet
their needs. In January 2008, we appointed Advantage
Sales and Marketing as our single national broker for all
of our grocery business within the U.S. Retail segment.
This decision represents a major milestone in our go-to-
market strategy. It will help us further improve customer
service, realize a number of near-term efficiencies, and
position our Company for future growth.
Fruit Spreads & Peanut Butter Our Smucker’s and Jif
brands delivered record market-share growth in fiscal
2008. Consumers continue to reach for our many fruit
spread varieties and peanut butter products, enjoying
each on its own or
pairing them to create
the “Great American
PB&J.”
Our Smucker’s
Organic fruit
spreads and
Smucker’s Sugar
Free fruit spreads sweetened with Splenda® continue to
perform well and now include even more varieties for
consumers to choose from.
This past year, we reintroduced “The Boys” television
advertising campaign, featuring a young Tim and Richard
Smucker. Through a series of three new television
spots, consumers are reminded of the heritage of the
Smucker’s brand and the quality ingredients we select
for every jar of fruit spread.
Peanut butter, our largest category, sustained impres-
sive growth in fiscal 2008, as increasing numbers of
consumers include this “good for you” and affordable
protein in their pantries. We produced record volumes
of Jif peanut butter to satisfy growing consumer
demand and to help meet customers’ needs as
a result of a competitor’s supply disruption.
In fiscal 2008, we extended the Jif
brand to the snack nuts category.
Just as “choosy moms” and “choosy
dads” have
trusted Jif
peanut butter
for genera-
tions, consum-
ers who crave
the finest-quality peanuts, cashews, and mixed nuts
are drawn to Jif snack nuts. New television advertising
reminds snack nut consumers, “We have to be choosy.
We’re Jif.”
Uncrustables Sandwiches Smucker’s Uncrustables
sandwiches, which offer a convenient and fun way
to enjoy a peanut butter and jelly sandwich, continue
to bring smiles to the faces of consumers. Demand
remains strong, and the introduction this past year of
white whole wheat Smucker’s Uncrustables sandwiches
in strawberry and grape varieties affords consumers
another better-for-you alternative and broadens our
presence in the frozen aisle.
Business Overview
~ 6 ~

Ice Cream Toppings Nothing says “celebration” like
Smucker’s ice cream toppings. The introduction in
fiscal 2008 of Smucker’s Triple Berry topping and
Smucker’s Sugar Free Chocolate and Sugar Free
Caramel Sundae
Syrups heightens
the fun and
further expands
our better-for-
you alternatives
in this category.
Potatoes, Pancakes, and Syrup This past year, we
extended the reach of our Hungry Jack brand by
continuing to focus on new products and expanding
our product distribution and print and radio advertis-
ing. We began testing several products that will offer
consumers even greater convenience. Included are
Hungry Jack refrigerated potatoes, Hungry Jack frozen
biscuits, and Hungry Jack Snack’n Waffles ready-to-eat,
pre-sweetened waffles.
Baking and Oils We continued to strengthen and expand
our U.S. baking aisle leadership position in fiscal 2008.
Through our portfolio of baking brands, including
Pillsbury, Eagle Brand, PET, Martha White, and White
Lily, we offer consumers products that meet nearly all
of their everyday and special-occasion baking needs.
We enjoyed the first full year of sales from
brands that joined our portfolio as part of the Eagle
acquisition. The addition of Eagle Brand sweetened
condensed milk, Eagle Brand evaporated milk,
Eagle Brand dessert
baking mixes, and
Magnolia sweetened
condensed milk
further broad-
ened our cross-
promotional
activities during
the busy fall and spring holiday baking periods.
Consumers often look for something exceptional to
serve to family and friends on special occasions. Our
newly introduced, simple-to-prepare Pillsbury Mint
Chocolate Brownies, Pillsbury Pumpkin Caramel Delight,
and Eagle Brand Magic Cookie Bar and Decadent
Fudge dessert kits answer this desire with impossible-
to-resist convenience.
Consumers continue to respond positively to our
better-for-you baking alternatives, including Pillsbury
Reduced Sugar cake mixes and frostings, Pillsbury
Reduced Sugar brownies, and Martha White whole-
grain muffins and sweet yellow cornbread.
Our Crisco olive oil products, which offer consumers
a trusted brand in the “good for you” olive oil category,
are a growing success. Thanks to ongoing momentum
and expanded distribution, these products will be
offered in the western United States in fiscal 2009.
Our introduction of Crisco Puritan canola oil with
Omega-3 DHA means consumers now have another
smart choice for adding nutritional value to their meals.
Unprecedented soybean, wheat, and milk commodity
costs significantly challenged our
Baking and Oils business in
fiscal 2008. It is expected
that these costs will
continue to rise in the
foreseeable future,
making the always-vital
need for cost and price
management more
critical than ever.
~ 7 ~

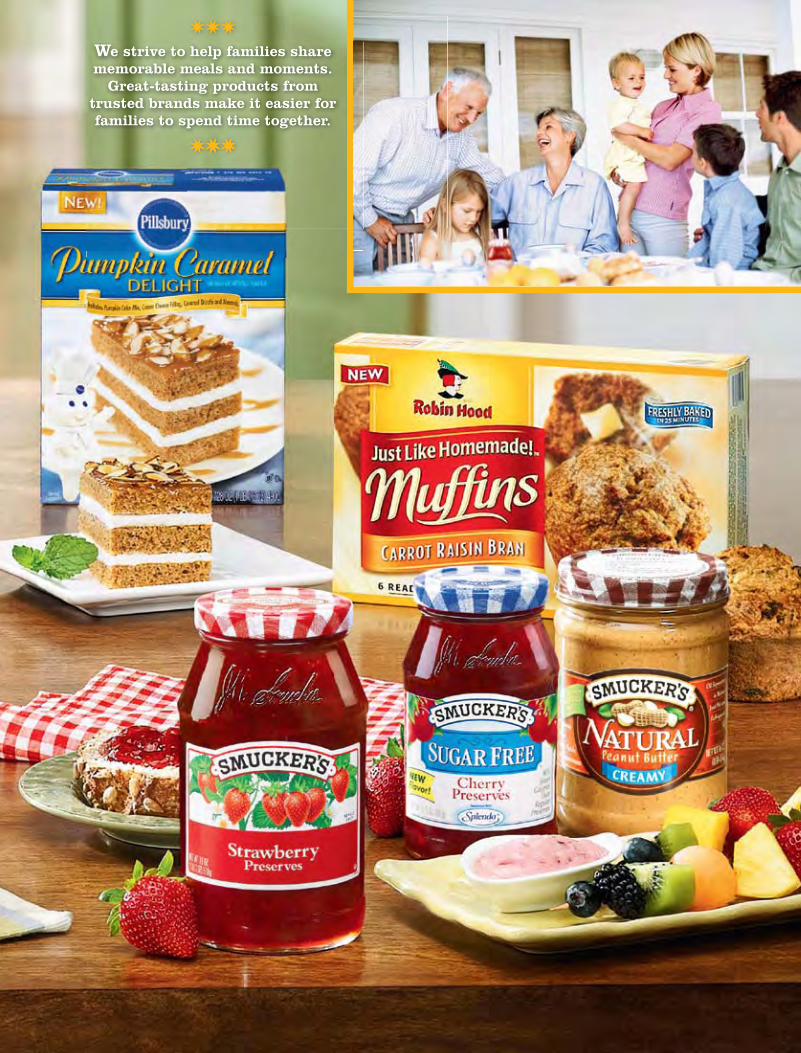
We strive to help families share memorable meals and moments.
Great-tasting products from trusted brands make it easier for families to spend time together.

~ Special Markets Segment ~
Our Special Markets segment saw another record
year. Compared to fiscal 2007, sales in this segment,
excluding divested businesses, were up 25 percent.
Profits increased 26 percent.
Canada Excluding divested businesses, our Canadian
business experienced a 35 percent growth in sales in
fiscal 2008. This significant increase was driven largely
by a full year of Eagle Brand sales and our acquisition
of Carnation, the #1 evaporated milk in Canada. Late
in the fiscal year, we also acquired Europe’s Best frozen
fruits and vegetables.
Carnation and Europe’s Best join our already strong
portfolio of #1 brands in Canada, including Smucker’s,
Robin Hood, and Bick’s. The Carnation acquisition
further strengthens our leadership position in the
baking aisle, and Europe’s Best adds premium frozen
fruits and vegetables to our product portfolio.
Adding to a recent string of award-winning innovations
in the baking category, we introduced Robin Hood frozen
muffins this past year. Together, Europe’s Best frozen
fruits and vegetables and Robin Hood frozen muffins
enhance our presence in Canada’s retail freezer aisles.
Foodservice Our Foodservice and Schools business
grew by 27 percent in fiscal 2008. Key contributors
were our core portion control business, Smucker’s
Uncrustables sandwiches, and recent acquisitions
of Eagle Brand and the Snack’n Waffles brand.
Snack’n Waffles ready-to-eat, pre-sweetened waffles
offer consumers a convenient, handheld waffle to
enjoy while away from home.
Beverage Our Beverage group continues to meet
consumer desire for products that are “good and
good for you” and made in a sustainable manner.
This business, driven by our R.W. Knudsen Family
and Santa Cruz Organic brands, grew in sales by nine
percent in fiscal 2008. We introduced new products,
including R.W. Knudsen Family Organic Pomegranate
Nectar, R.W. Knudsen Family Organic Black Currant
Nectar, and Sensible Sippers—juice boxes that provide
parents with a convenient alternative for offering
children organic juice, blended with just the right
amount of water, while at home or on the go.
Our Beverage business is an industry sustainability
leader, receiving the California Waste Reductions
Award for the eighth consecutive year.
International Consumers Consumers in more than
50 countries beyond the United States and Canada con-
tinue to enjoy our brands and products. The International
group remains focused on Mexico and the Caribbean,
with business growing in these markets by six percent
and 66 percent, respectively, in fiscal 2008.
~ 10 ~
We are pleased to welcome these additions to the
Smucker family of brands: Snack’n Waffles ready-
to-eat, pre-sweetened waffles; King Kelly California
Orange Marmalade; and,
in Canada, Carnation
evaporated milk and
Europe’s Best frozen
fruits and vegetables.

Sweet ‘n’ HotSouthwestern DipPrep time: 5 minutesReady in: 2 hoursMakes approximately 2 cups
Orange PecanWaffles with SweetOrange SyrupPrep time: 8 minutesCook time: 10 minutesReady in: 30 minutesMakes 8 waffles
Brownie Bites withCaramel FluffPrep time: 20 minutesBake time: 30 minutesReady in: 1 hour 30 minutesMakes 12 servings
A Touch of OrangeApple PiePrep time: 25 minutesCook time: 45 minutesReady in: 2 hoursMakes 8 servings
Fruit Kabobs withCreamy CherryPeanut Butter DipPrep time: 15 minutesReady in: 15 minutesMakes 8 servings
Mocha Walnut PiePrep time: 30 minutesCook time: 45 minutesReady in: 1 hour 45 minutesMakes 8 servings
Thai Peanut ButterChicken WrapsPrep time: 10 minutesReady in: 10 minutesMakes 4 wraps
Ingredients1 (9-inch) single Classic Crisco® Pie Crust
(recipe available at Crisco.com)2 (1 oz.) squares unsweetened chocolate1/4 cup butter or margarine11/2 tablespoons Kava® Coffee, dissolved in
1/4 cup hot water1 (14 oz.) can Eagle Brand® Sweetened
Condensed Milk2 large eggs, well beaten1 teaspoon vanilla extract1 cup chopped walnuts
Whipped cream or frozen whippedtopping, thawed (optional)
Ingredients1 cup lowfat vanilla yogurt1/4 cup Smucker’s® Creamy Natural
Peanut Butter1/3 cup Smucker’s® Cherry Sugar Free
Preserves or any Smucker’s®
Sugar Free or Low SugarTM flavorof your choice
4 cups fresh fruit such as pineapple chunks,sliced kiwi, melon balls, grapes,assorted whole berries
IngredientsMarinade Juice of 1 lime
2 tablespoons Crisco® Pure Olive Oil1/4 teaspoon salt1/8 teaspoon cayenne pepper1/2 pound fresh sea scallops, 10 to 20 count size1/2 pound fresh tail-on shrimp, 21 to 25 count size1 (6 oz.) package sliced portobello mushrooms
Dressing 1/4 cup balsamic vinegar1/2 teaspoon Dijon mustard
Salt and pepper to taste1 tablespoon chopped fresh herbs (basil,
oregano, thyme)1/2 cup Crisco® Pure Olive Oil
Crisco® Original No-Stick Cooking SpraySalad 12 cups fresh mixed baby greens
1 cup baby grape tomatoes1 medium cucumber, halved lengthwise, sliced1/2 each red and yellow bell peppers,
cut in julienne strips1/4 cup shredded carrots
Freshly grated Parmesan cheese (optional)
IngredientsWaffles 2 cups Hungry Jack® Buttermilk
Complete Pancake & Waffle Mix1/2 cup finely chopped pecans or walnuts1/4 cup Smucker’s® Sweet Orange
Marmalade11/4 cups water1/4 cup Crisco® Pure Vegetable Oil1 large egg
Orange 11/4 cups Smucker’s® Sweet OrangeSyrup Marmalade
1/4 teaspoon ground cinnamon
Whipped cream or frozen whippedtopping, thawed
IngredientsCrisco® Original No-Stick Cooking Spray
1 (12.35 oz.) package Pillsbury®
Reduced Sugar Chocolate FudgeBrownie Mix
1/3 cup Crisco® Pure Vegetable Oil3 tablespoons water1 large egg1/3 cup Smucker’s® Sugar Free
Caramel Topping2 cups sugar free frozen whipped
topping, thawed2 teaspoons mini semi-sweet
chocolate chipsAdditional Smucker’s® Sugar FreeCaramel Topping (optional)
Ingredients1 jar Dickinson’s® Sweet ‘n’ Hot
Pepper & Onion Relish1-2 tablespoons Dickinson’s® Lime Curd1/2 cup mayonnaise1/2 cup sour cream1/2 teaspoon chili powder (optional)
Corn chips or tortilla chips
VARIATIONZesty Pepper ‘n’ Onion DipIngredients1 (8 oz.) package cream cheese, softened1 jar Dickinson’s® Sweet ‘n’ Hot
Pepper & Onion RelishAssorted crackers
Ingredients1/2 cup Jif ® Creamy Peanut Butter
or Jif ® Extra Crunchy Peanut Butter1/2 cup pad thai sauce*1/2 cup chopped green onions4 burrito size tortillas1 (6 oz.) package fully cooked, grilled
chicken breast strips, cut intobite-size pieces or 11/3 cups cookedchicken
2 cups shredded lettuce
*Pad thai sauce is often located inthe Asian foods section of manygrocery stores.
Ingredients1 (9-inch) double Classic Crisco® Pie Crust
(recipe available at Crisco.com)3/4 cup sugar1 tablespoon cornstarch1 teaspoon ground cinnamon1/2 teaspoon grated orange peel1/8 teaspoon salt1/8 teaspoon ground nutmeg7 cups peeled, sliced Granny Smith apples,
about 2 pounds or 7 medium2 tablespoons butter or margarine
MilkSugar
Grilled SeafoodSaladPrep time: 40 minutesCook time: 15 minutesReady in: 1 hourMakes 6 servings
✥✥✥✥✥✥✥✥✥✥✥✥✥✥✥✥✥✥✥✥✥✥✥✥✥✥✥✥✥✥✥✥✥✥✥✥✥✥✥✥✥✥✥✥✥✥✥✥✥✥✥✥✥✥✥✥✥✥✥✥✥✥✥✥✥✥✥✥✥✥✥✥✥✥✥✥✥✥✥✥✥✥✥✥✥✥✥✥✥✥
✥✥✥✥✥✥✥✥✥✥✥✥✥✥✥✥✥✥✥✥✥✥✥✥✥✥✥✥✥✥✥✥✥✥✥✥✥✥✥✥✥✥✥✥✥✥✥✥✥✥✥✥✥✥✥✥✥✥✥✥✥✥✥✥✥✥✥✥✥✥✥✥✥✥✥✥✥✥✥✥✥✥✥✥✥✥✥✥✥✥
✥✥✥✥✥✥✥✥✥✥✥✥✥✥✥✥✥✥✥✥✥✥✥✥✥✥✥✥✥✥✥✥✥✥✥✥✥✥✥✥✥✥✥✥✥✥✥✥✥✥✥✥✥✥✥✥✥✥✥✥✥✥✥✥✥✥✥✥✥✥✥✥✥✥✥✥✥✥✥✥✥✥✥✥✥✥✥✥✥✥
✥✥
✥✥
✥✥
✥✥
✥✥
✥✥
✥✥
✥✥
✥✥
✥✥
✥✥
✥✥
✥✥
✥✥
✥✥
✥✥
✥✥
✥✥
✥✥
✥✥
✥✥
✥✥
✥✥
✥✥
✥✥
✥✥
✥✥
✥✥
✥✥
✥✥
✥✥
✥✥
✥✥
✥✥
✥✥
✥✥
✥✥
✥✥
✥✥
✥✥
✥✥
✥✥
✥✥
✥✥
✥✥
✥✥
✥✥
✥✥
✥✥
✥✥
✥✥
✥✥
✥✥
✥✥
✥✥
✥✥
✥✥
✥✥
✥✥
✥✥
✥✥
✥✥
✥
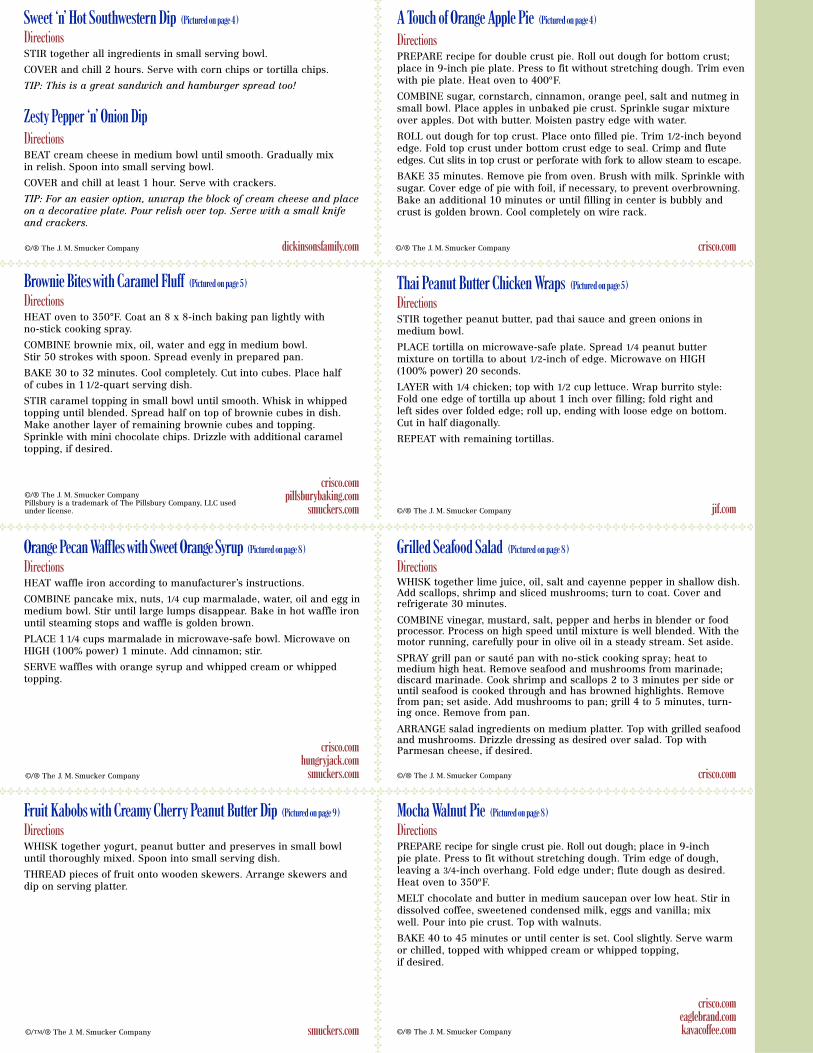
Orange PecanWaffles with Sweet Orange Syrup (Pictured on page 8 )
DirectionsHEAT waffle iron according to manufacturer’s instructions.
COMBINE pancake mix, nuts, 1/4 cup marmalade, water, oil and egg inmedium bowl. Stir until large lumps disappear. Bake in hot waffle ironuntil steaming stops and waffle is golden brown.
PLACE 1 1/4 cups marmalade in microwave-safe bowl. Microwave onHIGH (100% power) 1 minute. Add cinnamon; stir.
SERVE waffles with orange syrup and whipped cream or whippedtopping.
Grilled Seafood Salad (Pictured on page 8 )
DirectionsWHISK together lime juice, oil, salt and cayenne pepper in shallow dish.Add scallops, shrimp and sliced mushrooms; turn to coat. Cover andrefrigerate 30 minutes.
COMBINE vinegar, mustard, salt, pepper and herbs in blender or foodprocessor. Process on high speed until mixture is well blended. With themotor running, carefully pour in olive oil in a steady stream. Set aside.
SPRAY grill pan or sauté pan with no-stick cooking spray; heat tomedium high heat. Remove seafood and mushrooms from marinade;discard marinade. Cook shrimp and scallops 2 to 3 minutes per side oruntil seafood is cooked through and has browned highlights. Removefrom pan; set aside. Add mushrooms to pan; grill 4 to 5 minutes, turn-ing once. Remove from pan.
ARRANGE salad ingredients on medium platter. Top with grilled seafoodand mushrooms. Drizzle dressing as desired over salad. Top withParmesan cheese, if desired.
Fruit Kabobs with Creamy Cherry Peanut Butter Dip (Pictured on page 9 )
DirectionsWHISK together yogurt, peanut butter and preserves in small bowluntil thoroughly mixed. Spoon into small serving dish.
THREAD pieces of fruit onto wooden skewers. Arrange skewers anddip on serving platter.
Mocha Walnut Pie (Pictured on page 8 )
DirectionsPREPARE recipe for single crust pie. Roll out dough; place in 9-inchpie plate. Press to fit without stretching dough. Trim edge of dough,leaving a 3/4-inch overhang. Fold edge under; flute dough as desired.Heat oven to 350ºF.
MELT chocolate and butter in medium saucepan over low heat. Stir indissolved coffee, sweetened condensed milk, eggs and vanilla; mixwell. Pour into pie crust. Top with walnuts.
BAKE 40 to 45 minutes or until center is set. Cool slightly. Serve warmor chilled, topped with whipped cream or whipped topping,if desired.
Sweet ‘n’ Hot Southwestern Dip (Pictured on page 4 )
DirectionsSTIR together all ingredients in small serving bowl.
COVER and chill 2 hours. Serve with corn chips or tortilla chips.
TIP: This is a great sandwich and hamburger spread too!
Zesty Pepper ‘n’ Onion DipDirectionsBEAT cream cheese in medium bowl until smooth. Gradually mixin relish. Spoon into small serving bowl.
COVER and chill at least 1 hour. Serve with crackers.
TIP: For an easier option, unwrap the block of cream cheese and placeon a decorative plate. Pour relish over top. Serve with a small knifeand crackers.
A Touch of Orange Apple Pie (Pictured on page 4 )
DirectionsPREPARE recipe for double crust pie. Roll out dough for bottom crust;place in 9-inch pie plate. Press to fit without stretching dough. Trim evenwith pie plate. Heat oven to 400ºF.
COMBINE sugar, cornstarch, cinnamon, orange peel, salt and nutmeg insmall bowl. Place apples in unbaked pie crust. Sprinkle sugar mixtureover apples. Dot with butter. Moisten pastry edge with water.
ROLL out dough for top crust. Place onto filled pie. Trim 1/2-inch beyondedge. Fold top crust under bottom crust edge to seal. Crimp and fluteedges. Cut slits in top crust or perforate with fork to allow steam to escape.
BAKE 35 minutes. Remove pie from oven. Brush with milk. Sprinkle withsugar. Cover edge of pie with foil, if necessary, to prevent overbrowning.Bake an additional 10 minutes or until filling in center is bubbly andcrust is golden brown. Cool completely on wire rack.
Brownie Bites with Caramel Fluff (Pictured on page 5 )
DirectionsHEAT oven to 350°F. Coat an 8 x 8-inch baking pan lightly withno-stick cooking spray.
COMBINE brownie mix, oil, water and egg in medium bowl.Stir 50 strokes with spoon. Spread evenly in prepared pan.
BAKE 30 to 32 minutes. Cool completely. Cut into cubes. Place halfof cubes in 1 1/2-quart serving dish.
STIR caramel topping in small bowl until smooth. Whisk in whippedtopping until blended. Spread half on top of brownie cubes in dish.Make another layer of remaining brownie cubes and topping.Sprinkle with mini chocolate chips. Drizzle with additional carameltopping, if desired.
Thai Peanut Butter Chicken Wraps (Pictured on page 5 )
DirectionsSTIR together peanut butter, pad thai sauce and green onions inmedium bowl.
PLACE tortilla on microwave-safe plate. Spread 1/4 peanut buttermixture on tortilla to about 1/2-inch of edge. Microwave on HIGH(100% power) 20 seconds.
LAYER with 1/4 chicken; top with 1/2 cup lettuce. Wrap burrito style:Fold one edge of tortilla up about 1 inch over filling; fold right andleft sides over folded edge; roll up, ending with loose edge on bottom.Cut in half diagonally.
REPEAT with remaining tortillas.
©/® The J. M. Smucker Company
©/TM/® The J. M. Smucker Company ©/® The J. M. Smucker Company
©/® The J. M. Smucker Company ©/® The J. M. Smucker Company
©/® The J. M. Smucker Company
©/® The J. M. Smucker CompanyPillsbury is a trademark of The Pillsbury Company, LLC usedunder license.
crisco.comhungryjack.comsmuckers.com
smuckers.com
crisco.comeaglebrand.comkavacoffee.com
crisco.com
dickinsonsfamily.com
crisco.compillsburybaking.com
smuckers.com
crisco.com
jif.com
©/® The J. M. Smucker Company
✥✥✥✥✥✥✥✥✥✥✥✥✥✥✥✥✥✥✥✥✥✥✥✥✥✥✥✥✥✥✥✥✥✥✥✥✥✥✥✥✥✥✥✥✥✥✥✥✥✥✥✥✥✥✥✥✥✥✥✥✥✥✥✥✥✥✥✥✥✥✥✥✥✥✥✥✥✥✥✥✥✥✥✥✥✥✥✥✥✥
✥✥
✥✥
✥✥
✥✥
✥✥
✥✥
✥✥
✥✥
✥✥
✥✥
✥✥
✥✥
✥✥
✥✥
✥✥
✥✥
✥✥
✥✥
✥✥
✥✥
✥✥
✥✥
✥✥
✥✥
✥✥
✥✥
✥✥
✥✥
✥✥
✥✥
✥✥
✥✥
✥✥
✥✥
✥✥
✥✥
✥✥
✥✥
✥✥
✥✥
✥✥
✥✥
✥✥
✥✥
✥✥
✥✥
✥✥
✥✥
✥✥
✥✥
✥✥
✥✥
✥✥
✥✥
✥✥
✥✥
✥✥
✥✥
✥✥
✥✥
✥✥
✥✥
✥✥✥✥✥✥✥✥✥✥✥✥✥✥✥✥✥✥✥✥✥✥✥✥✥✥✥✥✥✥✥✥✥✥✥✥✥✥✥✥✥✥✥✥✥✥✥✥✥✥✥✥✥✥✥✥✥✥✥✥✥✥✥✥✥✥✥✥✥✥✥✥✥✥✥✥✥✥✥✥✥✥✥✥✥✥✥✥✥✥
✥✥✥✥✥✥✥✥✥✥✥✥✥✥✥✥✥✥✥✥✥✥✥✥✥✥✥✥✥✥✥✥✥✥✥✥✥✥✥✥✥✥✥✥✥✥✥✥✥✥✥✥✥✥✥✥✥✥✥✥✥✥✥✥✥✥✥✥✥✥✥✥✥✥✥✥✥✥✥✥✥✥✥✥✥✥✥✥✥✥
~ 13 ~
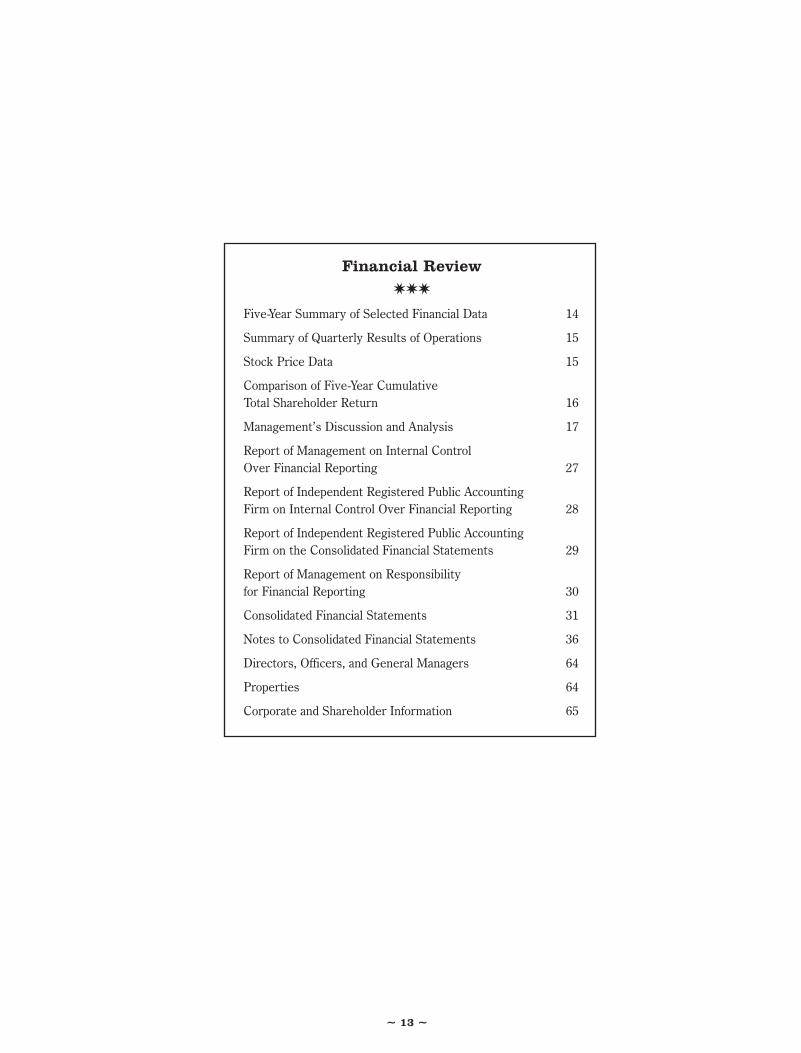
Financial Review✷✷✷
Five-Year Summary of Selected Financial Data 14
Summary of Quarterly Results of Operations 15
Stock Price Data 15
Comparison of Five-Year CumulativeTotal Shareholder Return 16
Management’s Discussion and Analysis 17
Report of Management on Internal ControlOver Financial Reporting 27
Report of Independent Registered Public AccountingFirm on Internal Control Over Financial Reporting 28
Report of Independent Registered Public AccountingFirm on the Consolidated Financial Statements 29
Report of Management on Responsibilityfor Financial Reporting 30
Consolidated Financial Statements 31
Notes to Consolidated Financial Statements 36
Directors, Officers, and General Managers 64
Properties 64
Corporate and Shareholder Information 65

~ 14 ~
The following table presents selected financial data for each of the five years in the period ended April 30, 2008. The selectedfinancial data was derived from the consolidated financial statements and should be read in conjunction with “Management’sDiscussion and Analysis of Results of Operations and Liquidity and Capital Resources” and the consolidated financial statementsand notes thereto.
Year Ended April 30,
(Dollars in thousands, except per share data) 2008 2007 2006 2005 2004
Statements of Income:Net sales $2,524,774 $2,148,017 $2,154,726 $2,043,877 $1,369,556Income from continuing operations $ 170,379 $ 157,219 $ 143,354 $ 130,460 $ 111,298Discontinued operations — — — (1,387) 52
Net income $ 170,379 $ 157,219 $ 143,354 $ 129,073 $ 111,350
Financial Position:Total assets $3,129,881 $2,693,823 $2,649,744 $2,635,894 $1,684,125Cash and cash equivalents 184,175 200,119 71,956 58,085 104,551Long-term debt 789,684 392,643 428,602 431,560 135,000Shareholders’ equity 1,799,853 1,795,657 1,728,059 1,690,800 1,210,693
Other Data:Capital expenditures $ 76,430 $ 57,002 $ 63,580 $ 87,576 $ 97,721Common shares repurchased 2,927,600 1,067,400 1,892,100 368,678 —Weighted-average shares 56,226,206 56,432,839 57,863,270 57,086,734 49,816,926Weighted-average shares – assuming dilution 56,720,645 57,056,421 58,425,361 57,748,780 50,395,747Earnings per common share:
Income from continuing operations $ 3.03 $ 2.79 $ 2.48 $ 2.29 $ 2.23Discontinued operations — — — (0.03) 0.01
Net income $ 3.03 $ 2.79 $ 2.48 $ 2.26 $ 2.24
Income from continuing operations –assuming dilution $ 3.00 $ 2.76 $ 2.45 $ 2.26 $ 2.21
Discontinued operations – assuming dilution — — — (0.02) —
Net income – assuming dilution $ 3.00 $ 2.76 $ 2.45 $ 2.24 $ 2.21
Dividends declared per common share $ 1.22 $ 1.14 $ 1.09 $ 1.02 $ 0.94
Five-Year Summary of Selected Financial Data
✷✷✷

~ 15 ~
Summary of Quarterly Results of Operations
The following is a summary of unaudited quarterly results of operations for the years ended April 30, 2008 and 2007.
(Dollars in thousands, except per share data)Earnings per
Net Earnings per Common Share –Quarter Ended Net Sales Gross Profit Income Common Share Assuming Dilution
2008 July 31, 2007 $561,513 $185,984 $40,761 $0.72 $0.71October 31, 2007 707,890 218,488 50,166 0.88 0.87January 31, 2008 665,373 195,453 42,401 0.75 0.75
April 30, 2008 589,998 182,239 37,051 0.68 0.67
2007 July 31, 2006 $526,509 $157,994 $28,724 $0.51 $0.50October 31, 2006 604,955 191,191 45,569 0.80 0.80January 31, 2007 523,081 172,967 40,427 0.72 0.71
April 30, 2007 493,472 179,903 42,499 0.76 0.75
Annual earnings per share may not equal the sum of the individual quarters due to differences in the average number of sharesoutstanding during the respective periods.
Stock Price Data
The Company’s common shares are listed on the New York Stock Exchange – ticker symbol SJM. The table below presents thehigh and low market prices for the shares and the quarterly dividends declared. There were approximately 267,380 shareholdersas of June 17, 2008, of which 78,959 were registered holders of common shares.
Quarter Ended High Low Dividends
2008 July 31, 2007 $64.32 $55.60 $0.30October 31, 2007 58.09 50.79 0.30January 31, 2008 53.70 42.75 0.30
April 30, 2008 52.59 46.84 0.32
2007 July 31, 2006 $47.25 $39.11 $0.28October 31, 2006 49.14 43.00 0.28January 31, 2007 49.98 45.00 0.28
April 30, 2007 57.43 46.97 0.30
✷✷✷
✷✷✷

✷✷✷
~ 16 ~
Comparison of Five-Year Cumulative Total Shareholder Return
April 30,
2003 2004 2005 2006 2007 2008
The J. M. Smucker Company $100.00 $147.38 $142.81 $115.66 $168.57 $154.05S&P 500 100.00 122.88 130.66 150.81 173.79 165.66S&P Packaged Foods & Meats 100.00 129.21 138.28 133.81 159.84 156.94
The above graph compares the cumulative total shareholder return for the five years ended April 30, 2008, for the Company’scommon shares, the S&P 500, and the S&P Packaged Foods and Meats index. These figures assume all dividends are reinvestedwhen received and are based on $100 invested in the Company’s common shares and the referenced index funds on April 30, 2003.
Among The J. M. Smucker Company, the S&P 500 Index, and the S&P Packaged Foods & Meats Index
Copyright © 2008, Standard & Poor’s, a division of The McGraw-Hill Companies, Inc. All rights reserved.
www.researchdatagroup.com/S&P.htm
$180
$160
$140
$120
$100
$80
$60
$40
$20
$0
4/03 4/04 4/05 4/06 4/07 4/08
◆◆
◆
◆◆
• • ••
■■
■
■
■
■ The J. M. Smucker Company
◆ S&P 500
• S&P Packaged Foods & Meats
•
■

~ 17 ~
~ Summary of 2008 ~
The Company realized strong sales growth in 2008 as the
impacts of Eagle and other recent acquisitions, pricing and
volume gains, and favorable foreign currency exchange rates
were realized. Company net sales increased 18 percent to
$2,524.8 million in 2008 from $2,148.0 million in 2007 while
net income increased eight percent to $170.4 million in 2008
from $157.2 million in 2007. Net income per common share –
assuming dilution was $3.00 in 2008, an increase of nine per-
cent from $2.76 in 2007, resulting from the increase in net
income combined with a decrease in common shares outstand-
ing during the year.
~ Net Sales ~
Year Ended April 30,
(Dollars in thousands) 2008 2007 2006
Net sales:U.S. retail market $1,874,547 $1,547,064 $1,484,873
Special markets 650,227 600,953 669,853
Total net sales $2,524,774 $2,148,017 $2,154,726
2008 Compared to 2007. Net sales increased $376.8 million, or
18 percent, in 2008 from 2007. Net sales increased 22 percent
over the same period, excluding the divested Canadian non-
branded, grain-based foodservice and industrial businesses
(“divested Canadian businesses”) sold in September 2006.
The acquired Eagle businesses contributed $236.2 million in
net sales in 2008, accounting for approximately one-half of the
increase in net sales excluding the divested Canadian busi-
nesses, while pricing contributed almost one-third of the
increase. Also contributing to net sales growth in 2008 were
gains in the Smucker’s, Jif, Crisco, and Hungry Jack brands, the
acquired Carnation canned milk business in Canada, and the
impact of favorable foreign exchange rates.
In the U.S. retail market segment, comprised of the Company’s
consumer and consumer oils and baking strategic business
areas, net sales were $1,874.5 million in 2008, up 21 percent
compared to $1,547.1 million in 2007. Net sales in the con-
Executive Summary
✷✷✷
The J. M. Smucker Company (the “Company”), headquartered
in Orrville, Ohio, is the leading marketer and manufacturer of
fruit spreads, peanut butter, shortening and oils, ice cream top-
pings, sweetened condensed milk, and health and natural foods
beverages in North America.
The Company’s strategy is to own and market leading food
brands found in the center of the store and sold throughout
North America. Its family of brands includes Smucker’s, Jif,
Crisco, Pillsbury, Eagle Brand, R.W. Knudsen Family, Hungry
Jack, White Lily, and Martha White in the United States, along
with Robin Hood, Five Roses, Carnation, Europe’s Best, and
Bick’s in Canada. In addition to these brands, the Company
markets products under numerous other brands, including
Dickinson’s, Laura Scudder’s, Adams, Double Fruit (Canada),
and Santa Cruz Organic. The Company is widely known and
trusted for quality food products.
The Company distributes its products through grocery and
other retail outlets, foodservice establishments, schools, spe-
cialty and gourmet shops, health and natural foods stores, and
consumer direct vehicles such as the Internet and a showcase
store in Orrville, Ohio, and markets a wide variety of other
specialty products throughout North America and in many for-
eign countries.
Since 1998, the Company has appeared on FORTUNE maga-
zine’s annual listing of the “100 Best Companies to Work For,”
in the United States, ranking number one in 2004.
Results of Operations
✷✷✷
On May 1, 2007, the Company acquired Eagle Family Foods
Holdings, Inc. (“Eagle”) in a transaction valued at approxi-
mately $248 million. The transaction has been accounted for as
a purchase business combination and the results of Eagle are
included in the Company’s consolidated financial statements
from the date of acquisition.
Management’s Discussion and Analysis
✷✷✷

cent over the same period, excluding the divested Canadian
businesses and the U.S. industrial ingredient business
(“divested businesses”). This net sales growth was led prima-
rily by volume gains in the Jif and Smucker’s brands, strong per-
formance across the businesses in the special markets
segment, and the contribution of approximately $33.4 million
from the White Lily and Five Roses brands acquired during 2007.
Price increases were also taken on most brands during the year.
In the U.S. retail market segment net sales were $1,547.1 mil-
lion in 2007, up $62.2 million, or approximately four percent,
over 2006. Net sales in the consumer strategic business area
were up seven percent for the year. The consumer increase
was led by strong sales of Jif peanut butter, particularly in the
fourth quarter of the fiscal year resulting from increased
demand for the product upon the recall of a competitor’s prod-
ucts. In addition, growth in natural peanut butter, fruit spreads,
toppings, and a 29 percent increase in Smucker’s Uncrustables
sandwiches during the year also contributed. In the consumer
oils and baking strategic business area, sales were flat com-
pared to the prior year as sales gains in retail oils, frosting,
flour, and the contribution of $14.8 million from the White Lily
brand acquired in October 2006 offset declines in baking mixes
and a $14.7 million decrease in sales of industrial oils.
Net sales in the special markets segment were $601.0 million
in 2007, a decrease of 10 percent, compared to 2006.
Excluding divested businesses, special market net sales
increased nine percent for the same period. All strategic busi-
ness areas in special markets contributed to the increase.
Foodservice net sales increased 13 percent, due to a 10 per-
cent increase in sales of traditional portion control products, as
well as a 20 percent increase in Smucker’s Uncrustables sand-
wiches in the schools market. Beverage net sales increased 11
percent in 2007 compared to 2006, as sales of R. W. Knudsen
Family, Santa Cruz Organic, and nonbranded products
increased nine, 21, and 19 percent, respectively. Net sales in
Canada increased five percent driven by the contribution of
approximately $18.6 million from the acquisition of the
~ 18 ~
sumer strategic business area increased nine percent led by
strong sales in peanut butter, fruit spreads, and Smucker’s
Uncrustables sandwiches. Excluding the contribution of $198.9
million from the acquired Eagle business in 2008, net sales in
the oils and baking strategic business area increased eight per-
cent as sales gains were realized in baking mixes and oils.
The special markets segment is comprised of the foodservice,
beverage, Canada, and international strategic business areas.
Net sales in this segment were $650.2 million in 2008, an
increase of eight percent compared to $601.0 million in 2007.
Excluding the divested Canadian businesses, net sales in the
special markets segment increased 24 percent in 2008 com-
pared to 2007. Canada contributed significantly to the increase
in special markets segment net sales due to the impacts of the
acquired Eagle and Carnation canned milk businesses and
favorable foreign exchange rates. The acquisition of Europe’s
Best brand of premium, all natural, frozen fruit and vegetables
during the fourth quarter of 2008 also contributed slightly to
the Canada sales increase. The foodservice strategic business
area net sales increased 27 percent in 2008 compared to 2007,
or 14 percent, excluding the contribution of $21.1 million of
Eagle net sales. Contributing to the foodservice improvement
in 2008 was continued growth of Smucker’s Uncrustables sand-
wiches, which realized a 15 percent increase, and a 12 percent
increase in traditional portion control products, primarily
peanut butter. Net sales in the beverage strategic business
area increased nine percent in 2008 compared to 2007 result-
ing from increases in R.W. Knudsen Family, Santa Cruz
Organic, and nonbranded products of seven, 14, and nine per-
cent, respectively. Net sales in the international strategic busi-
ness area increased two percent in 2008 despite the divestiture
of the Scotland business during the first quarter of 2008, driven
by a 19 percent increase in export sales and a six percent
increase in net sales in Mexico.
2007 Compared to 2006. Net sales in 2007 decreased $6.7 mil-
lion, or less than one percent, from 2006 reflecting the impact
of divestitures. Net sales increased $107.5 million, or five per-

~ 19 ~
Five Roses flour brand during the year and the impact of favor-
able exchange rates. In the international strategic business
area, net sales increased 14 percent primarily due to continued
growth in export markets.
~ Operating Income ~
The following table presents components of operating income
as a percentage of net sales.
Year Ended April 30,
2008 2007 2006
Gross profit 31.0% 32.7% 32.2%Selling, distribution,
and administrative expenses:Advertising 2.2% 2.4% 2.6%Marketing and selling 7.5 7.6 7.4Distribution 3.4 3.5 3.6General and administrative 6.3 7.1 6.7
Total selling, distribution,and administrative expenses 19.4% 20.6% 20.3%
Restructuring and mergerand integration costs 0.4% 0.1% 1.3%
Other operating (income)expense – net (0.1%) 0.2% (0.2%)
Operating income 11.3% 11.8% 10.8%
2008 Compared to 2007. Operating income increased 12 percent
in 2008 to $284.2 million, compared to 2007 while decreasing
as a percentage of net sales from 11.8 percent in 2007 to 11.3
percent in 2008. The impact of the lower margin Eagle busi-
nesses, record costs for soybean oil and wheat, and the mix of
products sold during the year resulted in a decline in gross
profit as a percentage of net sales from 32.7 percent in 2007 to
31.0 percent in 2008. The margin on the Eagle businesses was
impacted by an increase in milk costs and an unfavorable mix
of nonbranded sales during the year and accounted for approx-
imately one-half of the decrease in gross profit as a percentage
of net sales. The impact of price increases taken during the
year across all businesses, while essentially offsetting higher
raw material cost increases of approximately $150 million com-
pared to 2007, was not sufficient to maintain margins.
Selling, distribution, and administrative (“SD&A”) expenses
increased 11 percent from 2007 to $490.7 million in 2008,
resulting from increased marketing spending and additional
costs related to the acquired Eagle businesses. However, cor-
porate overhead expenses increased at a lesser rate than net
sales resulting in SD&A as a percent of net sales improving
from 20.6 percent in 2007 to 19.4 percent in 2008. Higher
restructuring and merger and integration costs in 2008 com-
pared to 2007 also negatively impacted operating income.
Other operating income – net of $3.9 million was recognized in
2008 resulting from a net insurance settlement related to
storm damage at a third-party distribution and warehouse facil-
ity in Memphis, Tennessee. Other operating expense – net of
$2.7 million was recognized in 2007 consisting of losses on dis-
posal of assets.
2007 Compared to 2006. Operating income increased $22.2 mil-
lion in 2007, or 10 percent, compared to 2006, and increased
from 10.8 percent of net sales in 2006 to 11.8 percent in 2007.
The increase in operating income in 2007 was primarily due to
improvements in gross profit and a decrease in merger and
integration costs. Gross profit increased from $692.9 million,
or 32.2 percent of net sales in 2006, to $702.1 million, or
32.7 percent of net sales in 2007. The increase in gross profit
occurred, despite a record high commodity price environment,
due to the divestiture of the lower margin Canadian non-
branded businesses during the second quarter of 2007 and
favorable product mix, particularly in the fourth quarter of
2007. These favorable contributions to gross profit were offset
in part by an increase in restructuring related impairment
charges in 2007 associated with the Canadian divestiture.
Although the Company implemented pricing actions to miti-
gate commodity cost increases totaling approximately $30 mil-
lion during the year, these cost increases were not fully offset
for the year.

~ 20 ~
SD&A expenses increased $4.4 million in 2007, or approximately
one percent, from 2006, and increased from 20.3 percent of net
sales in 2006 to 20.6 percent in 2007 due to costs associated with
the Company’s transition to restricted stock-based compensation
programs and the related impact of adopting Statement of
Financial Accounting Standards No. 123 (revised), Share-Based
Payment. Selling expenses were also up in 2007 compared to
2006. Marketing and distribution expense decreased in 2007
from 2006 as the Company actively managed SD&A costs to help
offset the impact of higher raw material costs.
Other operating expense – net of $2.7 million was recognized
in 2007 consisting of losses on disposal of assets. Other oper-
ating income – net of $3.4 million was recognized in 2006 as
the net gain on the sale of the Salinas facility of $5.6 million
offset losses on disposal of assets during the year.
~ Interest Income and Expense ~
Interest expense increased $18.8 million in 2008 compared to
2007, resulting from the issuance of $400 million in senior
notes on May 31, 2007, a portion of which was used to repay
short-term debt used in financing the Eagle acquisition. The
investment of excess proceeds resulted in an increase in inter-
est income of $4.0 million during 2008 compared to 2007.
Interest expense decreased $0.7 million in 2007 compared to
2006 as a portion of the proceeds from the sale of the Canadian
nonbranded businesses was utilized to pay off balances out-
standing against the Company’s revolving credit facility during
the second quarter of 2007. Also during 2007 interest income
increased $2.6 million compared to 2006, primarily related to
an increase in invested funds during the year resulting from
the Canadian nonbranded businesses sale and an overall
increase in cash generated from operations.
~ Income Taxes ~
Income taxes in 2008 were $84.4 million, up $0.6 million, or
one percent, from 2007. The increase in income taxes that
would have resulted from higher income in 2008 as compared
to 2007 was mostly offset by a decrease in the effective tax rate
from 34.8 percent in 2007 to 33.1 percent in 2008. The lower
effective tax rate for 2008 was primarily attributable to a lower
state tax rate resulting from the favorable resolution of uncer-
tain tax positions.
Income taxes were $83.8 million in 2007, an increase of $11.6
million, or 16 percent, from 2006. The increase is due prima-
rily to an increase in taxable income, combined with an
increase in the effective tax rate from 33.5 percent in 2006 to
34.8 percent in 2007. The effective tax rate in 2006 included
certain one-time benefits of the Company’s legal entity
realignment that did not recur in 2007.
~ Restructuring ~
During 2003, the Company announced plans to restructure cer-
tain operations as part of its ongoing efforts to refine its portfo-
lio, optimize its production capacity, improve productivity and
operating efficiencies, and improve the Company’s overall cost
base as well as service levels in support of its long-term strat-
egy. At the end of 2008, these restructurings were proceeding as
planned.
In conjunction with the restructurings, the Company has
recorded total charges of $58.5 million to date, including $4.7
million in 2008, $12.1 million in 2007, and $10.0 million in 2006.
The majority of these charges related to impairment and accel-
erated depreciation on buildings and machinery and equipment,
system conversion costs, employee separation costs, equipment
relocation expenses, and the disposition of inventories.
~ Subsequent Event ~
On June 4, 2008, the Company entered into a definitive agree-
ment with The Procter & Gamble Company (“P&G”) to merge
P&G’s Folgers coffee business with and into the Company.
Under the terms of the agreement, P&G will distribute the
Folgers business to P&G shareholders in a tax-free transaction,
with a simultaneous merger with and into the Company. In the
merger, current P&G shareholders will receive approximately

~ 21 ~
~ Operating Activities ~
The Company’s working capital requirements are greatest
during the first half of its fiscal year, primarily due to the need
to build inventory levels in advance of the “fall bake” season,
the seasonal procurement of fruit, and the purchase of raw
materials used in the Company’s pickle and relish business in
Canada. The acquisition of the Eagle businesses added further
to the cash requirements during the first half of the year.
Cash provided by operating activities was $191.6 million
during 2008, a decrease of $81.8 million, or 30 percent, over
2007. The decrease in cash from operations was primarily due
to an increase in the cash required to support working capital
requirements. Working capital, excluding cash and cash equiv-
alents, as a percent of net sales increased to 14.0 percent in
2008 from 9.4 percent in 2007 primarily as a result of higher
inventory balances associated with increased raw material costs.
~ Investing Activities ~
Net cash used for investing activities totaled approximately
$262.5 million in 2008, as $220.9 million was used for business
acquisitions, primarily Eagle, the Carnation canned milk busi-
ness in Canada, and Europe’s Best. Capital expenditures were
approximately $76.4 million during 2008, or three percent of
net sales.
~ Financing Activities ~
Net cash provided by financing activities during 2008 consisted
primarily of the Company’s issuance of $400 million in senior
notes on May 31, 2007, offset by the repayment of $148 million
of debt, including $115 million assumed in the Eagle acquisi-
tion, $152.5 million used to finance the repurchases of treasury
shares, and $68.1 million in dividend payments.
The purchase of treasury shares was comprised largely of
2,927,600 common shares, representing approximately five per-
cent of common shares outstanding at the beginning of 2008.
53.5 percent of the Company’s shares and current Company
shareholders will own approximately 46.5 percent of the com-
bined company upon closing. Upon closing, the Company will
have approximately 118 million shares outstanding. As part of
the transaction, the Company will assume an estimated $350
million of Folgers debt. The transaction is expected to be tax
free to both companies and P&G shareholders. In addition,
Company shareholders as of the record date, prior to the
merger, will receive a special dividend of $5 per share. The
record date for the special dividend will be determined by the
Company at a future date.
The transaction is expected to close in the fourth quarter of cal-
endar 2008, subject to customary closing conditions including
regulatory and Company shareholder approvals. The Company
expects to incur approximately $100 million in one-time costs
related to the transaction over the next two fiscal years.
The merger will be accounted for as a purchase business com-
bination. For accounting purposes, the Company will be treated
as the acquiring enterprise.
Liquidity and Capital Resources
✷✷✷
Year Ended April 30,
(Dollars in thousands) 2008 2007 2006
Net cash provided byoperating activities $ 191,577 $273,424 $198,689
Net cash used forinvesting activities 262,486 27,041 16,255
Net cash provided by(used for) financingactivities 49,839 (117,625) (169,129)
The Company’s principal source of funds is cash generated
from operations, supplemented by borrowings against the
Company’s revolving credit facility. Total cash and investments
at April 30, 2008, were $200.2 million compared to $244.2 mil-
lion at April 30, 2007.
The shares were repurchased under the Board of Directors’
authorized share repurchase program, including 2.5 million
common shares under Rule 10b5-1 trading plans announced
and completed during 2008. Since November 2004, the
Company has repurchased 6,255,778 common shares under
Board authorization, leaving 3,744,222 common shares author-
ized for repurchase. Due to structuring requirements of the
recently announced Folgers transaction, there are specific con-
ditions which must be satisfied prior to any share repurchase,
and as a result, the Company does not anticipate that it will
repurchase shares for a period of two years following the clos-
ing of the transaction.
Cash requirements for 2009, excluding funds necessary to
complete the Folgers merger, will include capital expenditures
estimated at approximately $85 million. In addition, regular
quarterly dividends are expected to approximate $70 million
and interest payments on long-term debt to approximate $46
million for the year.
Assuming there are no other material acquisitions or other sig-
nificant investments, the Company believes that cash on hand
and marketable securities, combined with cash provided by
operations, new borrowings anticipated in connection with the
Folgers merger, and borrowings available under the revolving
credit facility, will be sufficient to meet 2009 cash require-
ments, including capital expenditures, the payment of the spe-
cial dividend, the payment of quarterly dividends, repurchase
of common shares, if any, and interest on existing debt out-
standing and any new borrowings.
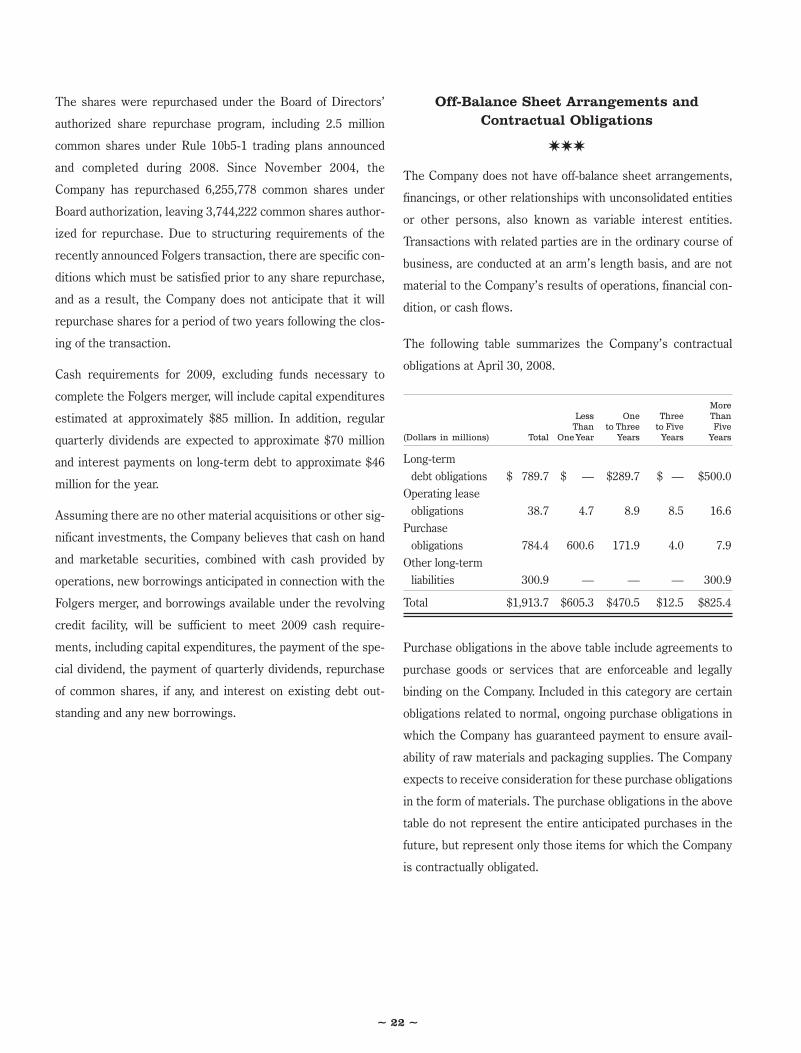
Off-Balance Sheet Arrangements andContractual Obligations
✷✷✷
The Company does not have off-balance sheet arrangements,
financings, or other relationships with unconsolidated entities
or other persons, also known as variable interest entities.
Transactions with related parties are in the ordinary course of
business, are conducted at an arm’s length basis, and are not
material to the Company’s results of operations, financial con-
dition, or cash flows.
The following table summarizes the Company’s contractual
obligations at April 30, 2008.
MoreLess One Three ThanThan to Three to Five Five
(Dollars in millions) Total OneYear Years Years Years
Long-termdebt obligations $ 789.7 $ — $289.7 $ — $500.0
Operating leaseobligations 38.7 4.7 8.9 8.5 16.6
Purchaseobligations 784.4 600.6 171.9 4.0 7.9
Other long-termliabilities 300.9 — — — 300.9
Total $1,913.7 $605.3 $470.5 $12.5 $825.4
Purchase obligations in the above table include agreements to
purchase goods or services that are enforceable and legally
binding on the Company. Included in this category are certain
obligations related to normal, ongoing purchase obligations in
which the Company has guaranteed payment to ensure avail-
ability of raw materials and packaging supplies. The Company
expects to receive consideration for these purchase obligations
in the form of materials. The purchase obligations in the above
table do not represent the entire anticipated purchases in the
future, but represent only those items for which the Company
is contractually obligated.
~ 22 ~

~ 23 ~
Critical Accounting Estimates and Policies
✷✷✷
The preparation of financial statements in conformity with
accounting principles generally accepted in the United States
requires management to make estimates and assumptions that
in certain circumstances affect amounts reported in the accom-
panying consolidated financial statements. In preparing these
financial statements, management has made its best estimates
and judgments of certain amounts included in the financial
statements, giving due consideration to materiality. The
Company does not believe there is a great likelihood that mate-
rially different amounts would be reported under different con-
ditions or using different assumptions related to the accounting
policies described below. However, application of these
accounting policies involves the exercise of judgment and use
of assumptions as to future uncertainties and, as a result,
actual results could differ from these estimates.
Revenue Recognition. The Company recognizes revenue when
all of the following criteria have been met: a valid customer
order with a determinable price has been received; the product
has been shipped and title has transferred to the customer;
there is no further significant obligation to assist in the resale
of the product; and collectibility is reasonably assured. A pro-
vision for estimated returns and allowances is recorded as a
reduction of sales at the time revenue is recognized.
Trade Marketing and Merchandising Programs. In order to
support the Company's products, various promotional activities
are conducted through the retail trade, distributors, or directly
with consumers, including in-store display and product place-
ment programs, feature price discounts, coupons, and other
similar activities. The Company regularly reviews and revises,
when it deems necessary, estimates of costs to the Company for
these promotional programs based on estimates of what will be
redeemed by the retail trade, distributors, or consumers. These
estimates are made using various techniques including histori-
cal data on performance of similar promotional programs.
Differences between estimated expense and actual perform-
ance are recognized as a change in management’s estimate in a
subsequent period. As the Company’s total promotional expen-
ditures, including amounts classified as a reduction of net sales,
represent approximately 26 percent of 2008 net sales, the like-
lihood exists of materially different reported results if factors
such as the level and success of the promotional programs or
other conditions differ from expectations.
Income Taxes. The future tax benefit arising from the net
deductible temporary differences and tax carryforwards is
approximately $59.7 million and $63.2 million, at April 30, 2008
and 2007, respectively. Management believes that the
Company’s earnings during the periods when the temporary
differences become deductible will be sufficient to realize the
related future income tax benefits. For those jurisdictions
where the expiration date of tax carryforwards or the projected
operating results of the Company indicate that realization is
not likely, a valuation reserve has been provided.
In assessing the need for a valuation allowance, the Company
estimates future taxable income, considering the viability of
ongoing tax planning strategies and the probable recognition of
future tax deductions and loss carryforwards. Valuation
allowances related to deferred tax assets can be affected by
changes in tax laws, statutory tax rates, and projected future
taxable income levels. Under current accounting rules,
changes in estimated realization of deferred tax assets would
result in either an adjustment to goodwill, if the change relates
to tax benefits associated with a business combination, or an
adjustment to income, in the period in which that determina-
tion is made.
In the ordinary course of business, the Company is exposed to
uncertainties related to tax filing positions and periodically
assesses these tax positions for all tax years that remain sub-
ject to examination, based upon the latest information avail-
able. For uncertain tax positions, the Company has recorded
tax reserves, including any applicable interest and penalty
charges, in accordance with Financial Accounting Standards
Board Interpretation No. 48.

~ 24 ~
Long-Lived Assets. Historically, long-lived assets have been
reviewed for impairment whenever events or changes in cir-
cumstances indicate that the carrying amount of the asset may
not be recoverable. Recoverability of assets to be held and
used is measured by a comparison of the carrying amount of
the assets to future net cash flows estimated to be generated
by such assets. If such assets are considered to be impaired,
the impairment to be recognized is the amount by which the
carrying amount of the assets exceeds the fair value of the
assets. However, determining fair value is subject to estimates
of both cash flows and interest rates and different estimates
could yield different results. There are no events or changes in
circumstances of which management is aware indicating that
the carrying value of the Company’s long-lived assets may not
be recoverable.
Goodwill and Indefinite-Lived Intangible Assets. The annual
evaluation of goodwill and indefinite-lived intangible assets
requires the use of estimates about future operating results for
each reporting unit to determine estimated fair value. Changes
in forecasted operations can materially affect these estimates.
Additionally, other changes in the estimates and assumptions,
including the discount rate and expected long-term growth
rate, which drive the valuation techniques employed to esti-
mate the fair value of the reporting unit could change and,
therefore, impact the assessments of impairment in the future.
Pension and Other Postretirement Benefit Plans. To determine
the Company’s ultimate obligation under its defined benefit
pension plans and other postretirement benefit plans, manage-
ment must estimate the future cost of benefits and attribute
that cost to the time period during which each covered
employee works. Various actuarial assumptions must be made
in order to predict and measure costs and obligations many
years prior to the settlement date, the most significant being
the interest rates used to discount the obligations of the plans,
the long-term rates of return on the plans’ assets, assumed pay
increases, and the health care cost trend rates. Management,
along with third-party actuaries and investment managers,
reviews all of these assumptions on an ongoing basis to ensure
that the most reasonable information available is being consid-
ered. For 2009 expense recognition, the Company will use a
discount rate of 6.6 percent and 6.1 percent, and a rate of com-
pensation increase of 3.8 percent and 4.0 percent, for U.S. and
Canadian plans, respectively. The Company will use an
expected rate of return on plan assets of 7.75 percent for U.S.
plans. For the Canadian plans, the Company will use an
expected rate of return on plan assets of 7.0 percent for the
hourly plan and 7.5 percent for all other plans.
Recovery of Trade Receivables. In the normal course of busi-
ness, the Company extends credit to customers that satisfy
predefined criteria. The Company evaluates the collectibility of
trade receivables based on a combination of factors. When
aware that a specific customer may be unable to meet its finan-
cial obligations, such as in the case of bankruptcy filings or
deterioration in the customer’s operating results or financial
position, the Company records a specific reserve for bad debt
to reduce the related receivable to the amount the Company
reasonably believes is collectible. The Company also records
reserves for bad debt for all other customers based on a vari-
ety of factors, including the length of time the receivables are
past due, historical collection experience, and an evaluation of
current and projected economic conditions at the balance sheet
date. Actual collections of trade receivables could differ from
management’s estimates due to changes in future economic or
industry conditions or specific customers’ financial conditions.
Derivative Financial Instrumentsand Market Risk
✷✷✷
The following discussions about the Company’s market risk
disclosures involve forward-looking statements. Actual results
could differ from those projected in the forward-looking state-
ments. The Company is exposed to market risk related to
changes in interest rates, foreign currency exchange rates, and
commodity prices.

~ 25 ~
Interest Rate Risk. The fair value of the Company’s cash and
short-term investment portfolio at April 30, 2008, approxi-
mates carrying value. Exposure to interest rate risk on the
Company’s long-term debt is mitigated since it is at a fixed rate
until maturity. Market risk, as measured by the change in fair
value resulting from a hypothetical 10 percent change in inter-
est rates, is not material. Based on the Company’s overall
interest rate exposure as of and during the year ended April 30,
2008, including derivative and other instruments sensitive to
interest rates, a hypothetical 10 percent movement in interest
rates would not materially affect the Company’s results of
operations. A hypothetical 100 basis point increase in short-
term interest rates would increase the Company’s interest
expense by approximately $0.1 million. Interest rate risk can
also be measured by estimating the net amount by which the
fair value of the Company’s financial liabilities would change as
a result of movements in interest rates. Based on a hypotheti-
cal, immediate 100 basis point decrease in interest rates at
April 30, 2008, the fair value of the Company’s long-term debt
and interest rate portfolio, in aggregate, would increase by
approximately $41.3 million.
Foreign Currency Exchange Risk. The Company has operations
outside the United States with foreign currency denominated
assets and liabilities, primarily denominated in Canadian cur-
rency. Because the Company has foreign currency denomi-
nated assets and liabilities, financial exposure may result,
primarily from the timing of transactions and the movement of
exchange rates. The foreign currency balance sheet exposures
as of April 30, 2008, are not expected to result in a significant
impact on future earnings or cash flows.
Revenues from customers outside the United States repre-
sented 13 percent of net sales during 2008. Thus, certain rev-
enues and expenses have been, and are expected to be, subject
to the effect of foreign currency fluctuations and these fluctua-
tions may have an impact on operating results.
Commodity Price Risk. Raw materials and other commodities
used by the Company are subject to price volatility caused by
supply and demand conditions, political and economic vari-
ables, and other unpredictable factors. To manage the volatility
related to anticipated commodity purchases, the Company
uses futures and options with maturities generally less than
one year. Certain of these instruments are designated as cash
flow hedges. The mark-to-market gains or losses on qualifying
hedges are included in other comprehensive income to the
extent effective, and reclassified into cost of products sold in
the period during which the hedged transaction affects earn-
ings. The mark-to-market gains or losses on nonqualifying,
excluded, and ineffective portions of hedges are recognized in
cost of products sold immediately.
The following sensitivity analysis presents the Company’s
potential loss of fair value resulting from a hypothetical 10 per-
cent change in market prices.
Year Ended April 30,
(Dollars in thousands) 2008 2007
Raw material commodities:High $13,229 $4,514Low 3,289 1,333Average 8,474 3,105
Fair value was determined using quoted market prices and was
based on the Company’s net derivative position by commodity
at each quarter end during the fiscal year. The calculations are
not intended to represent actual losses in fair value that the
Company expects to incur. In practice, as markets move, the
Company actively manages its risk and adjusts hedging strate-
gies as appropriate. The commodities hedged have a high
inverse correlation to price changes of the derivative com-
modity instrument; thus, the Company would expect that any
gain or loss in fair value of its derivatives would generally be
offset by an increase or decrease in the fair value of the under-
lying exposures.

Forward-Looking Statements
✷✷✷
Certain statements included in this Annual Report contain for-
ward-looking statements within the meaning of federal securi-
ties laws. The forward-looking statements may include
statements concerning the Company’s current expectations,
estimates, assumptions, and beliefs concerning future events,
conditions, plans, and strategies that are not historical fact.
Any statement that is not historical in nature is a forward-look-
ing statement and may be identified by the use of words and
phrases such as “expects,” “anticipates,” “believes,” “will,”
“plans,” and similar phrases.
Federal securities laws provide a safe harbor for forward-look-
ing statements to encourage companies to provide prospective
information. The Company is providing this cautionary state-
ment in connection with the safe harbor provisions. Readers
are cautioned not to place undue reliance on any forward-look-
ing statements as such statements are by nature subject to
risks, uncertainties, and other factors, many of which are out-
side of the Company’s control and could cause actual results to
differ materially from such statements and from the
Company’s historical results and experience. These risks and
uncertainties include, but are not limited to, those set forth
under the caption “Risk Factors” in the Company’s Annual
Report on Form 10-K, as well as the following:
general economic conditions in the U.S.;
the volatility of commodity markets from which rawmaterials are procured and the related impact on costs;
crude oil price trends and its impact on transportation,energy, and packaging costs;
the ability of the Company to successfully implementprice changes;
~ 26 ~
the success and cost of introducing new products andthe competitive response;
the success and cost of marketing and sales programsand strategies intended to promote growth in theCompany’s businesses, and in their respective markets;
general competitive activity in the market, includingcompetitors’ pricing practices and promotional spendinglevels;
the concentration of certain of the Company’s busi-nesses with key customers;
the ability of the Company to manage and maintain keycustomer, supplier, and employee relationships;
the loss of significant customers or a substantial reduc-tion in orders from these customers or the bankruptcyof any such customer;
the ability of the Company to obtain any required financ-ing;
the timing and amount of capital expenditures andrestructuring, and merger and integration costs;
the outcome of current and future tax examinations andother tax matters, and their related impact on theCompany’s tax positions;
the ability of the Company to obtain regulatory andshareholders’ approval of the Folgers merger withoutunexpected delays or conditions;
the ability of the Company to integrate acquired andmerged businesses in a timely and cost effectivemanner;
foreign currency exchange and interest rate fluctuations;
the timing and cost of acquiring common shares under theCompany’s share repurchase authorizations, if any; and
other factors affecting share prices and capital marketsgenerally.

~ 27 ~
Shareholders
The J. M. Smucker Company
Management of The J. M. Smucker Company is responsible for establishing and maintaining adequate accounting and internal con-trol systems over financial reporting for the Company. The Company’s internal control system is designed to provide reasonableassurance that the Company has the ability to record, process, summarize, and report reliable financial information on a timely basis.
The Company’s management assessed the effectiveness of the Company’s internal control over financial reporting as of April 30,2008. In making this assessment, management used the criteria established in Internal Control – Integrated Framework issued bythe Committee of Sponsoring Organizations of the Treadway Commission (“the COSO criteria”).
Based on the Company’s assessment of internal control over financial reporting under the COSO criteria, management concludedthe Company’s internal control over financial reporting was effective as of April 30, 2008.
Ernst & Young LLP, independent registered public accounting firm, audited the effectiveness of the Company’s internal controlover financial reporting as of April 30, 2008, and their report thereon is included on page 28 of this report.
Timothy P. Smucker Richard K. Smucker Mark R. Belgya
Chairman and President and Vice President,Co-Chief Executive Officer Co-Chief Executive Officer Chief Financial Officer
and Treasurer
Report of Management on Internal Control Over Financial Reporting
✷✷✷

~ 28 ~
Board of Directors and Shareholders
The J. M. Smucker Company
We have audited The J. M. Smucker Company’s internal control over financial reporting as of April 30, 2008, based on criteriaestablished in Internal Control—Integrated Framework issued by the Committee of Sponsoring Organizations of the TreadwayCommission (“the COSO criteria”). The J. M. Smucker Company’s management is responsible for maintaining effective internalcontrol over financial reporting, and for its assessment of the effectiveness of internal control over financial reporting included inthe accompanying Report of Management on Internal Control Over Financial Reporting. Our responsibility is to express an opin-ion on the company’s internal control over financial reporting based on our audit.
We conducted our audit in accordance with the standards of the Public Company Accounting Oversight Board (United States).Those standards require that we plan and perform the audit to obtain reasonable assurance about whether effective internal con-trol over financial reporting was maintained in all material respects. Our audit included obtaining an understanding of internal con-trol over financial reporting, assessing the risk that a material weakness exists, testing and evaluating the design and operatingeffectiveness of internal control based on the assessed risk, and performing such other procedures as we considered necessaryin the circumstances. We believe that our audit provides a reasonable basis for our opinion.
A company’s internal control over financial reporting is a process designed to provide reasonable assurance regarding the relia-bility of financial reporting and the preparation of financial statements for external purposes in accordance with generally acceptedaccounting principles. A company’s internal control over financial reporting includes those policies and procedures that (1) per-tain to the maintenance of records that, in reasonable detail, accurately and fairly reflect the transactions and dispositions of theassets of the company; (2) provide reasonable assurance that transactions are recorded as necessary to permit preparation offinancial statements in accordance with generally accepted accounting principles, and that receipts and expenditures of the com-pany are being made only in accordance with authorizations of management and directors of the company; and (3) provide rea-sonable assurance regarding prevention or timely detection of unauthorized acquisition, use, or disposition of the company’sassets that could have a material effect on the financial statements.
Because of its inherent limitations, internal control over financial reporting may not prevent or detect misstatements. Also, pro-jections of any evaluation of effectiveness to future periods are subject to the risk that controls may become inadequate becauseof changes in conditions, or that the degree of compliance with the policies or procedures may deteriorate.
In our opinion, The J. M. Smucker Company maintained, in all material respects, effective internal control over financial report-ing as of April 30, 2008, based on the COSO criteria.
We also have audited, in accordance with the standards of the Public Company Accounting Oversight Board (United States), theconsolidated balance sheets of The J. M. Smucker Company as of April 30, 2008 and 2007, and the related statements of consoli-dated income, shareholders’ equity, and cash flows for each of the three years in the period ended April 30, 2008, and our reportdated June 19, 2008, expressed an unqualified opinion thereon.
Akron, OhioJune 19, 2008
Report of Independent Registered Public Accounting Firm onInternal Control Over Financial Reporting
✷✷✷

~ 29 ~
Board of Directors and Shareholders
The J. M. Smucker Company
We have audited the accompanying consolidated balance sheets of The J. M. Smucker Company as of April 30, 2008 and 2007, andthe related statements of consolidated income, shareholders’ equity, and cash flows for each of the three years in the period endedApril 30, 2008. These financial statements are the responsibility of the Company’s management. Our responsibility is to expressan opinion on these financial statements based on our audits.
We conducted our audits in accordance with the standards of the Public Company Accounting Oversight Board (United States).Those standards require that we plan and perform the audit to obtain reasonable assurance about whether the financial statementsare free of material misstatement. An audit includes examining, on a test basis, evidence supporting the amounts and disclosuresin the financial statements. An audit also includes assessing the accounting principles used and significant estimates made by man-agement, as well as evaluating the overall financial statement presentation. We believe that our audits provide a reasonable basisfor our opinion.
In our opinion, the consolidated financial statements referred to above present fairly, in all material respects, the consolidated finan-cial position of The J. M. Smucker Company at April 30, 2008 and 2007, and the consolidated results of its operations and its cashflows for each of the three years in the period ended April 30, 2008, in conformity with U.S. generally accepted accounting principles.
As discussed in Note P, effective May 1, 2007, the Company adopted FASB Interpretation No. 48, Accounting for Uncertainty inIncome Taxes. Also, as discussed in Note I, effective April 30, 2007, the Company adopted Statement of Financial AccountingStandards (“SFAS”) No. 158, Employees Accounting for Defined Benefit Pension and Other Postretirement Plans, an amendment ofFASB Statement Nos. 87, 88, 106, and 132(R); and as discussed in Note A, effective May 1, 2006, the Company adopted SFAS123(R), Share-Based Payment.
We also have audited in accordance with the standards of the Public Company Accounting Oversight Board (United States), theeffectiveness of The J. M. Smucker Company’s internal control over financial reporting as of April 30, 2008, based on criteria estab-lished in Internal Control – Integrated Framework issued by the Committee of Sponsoring Organizations of the TreadwayCommission and our report dated June 19, 2008, expressed an unqualified opinion thereon.
Akron, OhioJune 19, 2008
Report of Independent Registered Public Accounting Firm on theConsolidated Financial Statements
✷✷✷

~ 30 ~
Report of Management on Responsibility for Financial Reporting
Shareholders
The J. M. Smucker Company
Management of The J. M. Smucker Company is responsible for the preparation, integrity, accuracy, and consistency of the con-solidated financial statements and the related financial information in this report. Such information has been prepared in accor-dance with U.S. generally accepted accounting principles and is based on our best estimates and judgments.
The Company maintains systems of internal accounting controls supported by formal policies and procedures that are communi-cated throughout the Company. There is a program of audits performed by the Company’s internal audit staff designed to evalu-ate the adequacy of and adherence to these controls, policies, and procedures.
Ernst & Young LLP, independent registered public accounting firm, has audited the Company’s financial statements in accordancewith the standards of the Public Company Accounting Oversight Board (United States). Management has made all financialrecords and related data available to Ernst & Young LLP during its audit.
The Company’s audit committee, comprised of three nonemployee members of the Board of Directors, meets regularly with theindependent registered public accounting firm and management to review the work of the internal audit staff and the work, auditscope, timing arrangements, and fees of the independent registered public accounting firm. The audit committee also regularlysatisfies itself as to the adequacy of controls, systems, and financial records. The manager of the internal audit department isrequired to report directly to the chair of the audit committee as to internal audit matters.
It is the Company’s best judgment that its policies and procedures, its program of internal and independent audits, and the over-sight activity of the audit committee work together to provide reasonable assurance that the operations of the Company are con-ducted according to law and in compliance with the high standards of business ethics and conduct to which the Companysubscribes.
Timothy P. Smucker Richard K. Smucker Mark R. Belgya
Chairman and President and Vice President,Co-Chief Executive Officer Co-Chief Executive Officer Chief Financial Officer
and Treasurer
✷✷✷

~ 31 ~
Statements of Consolidated Income
See notes to consolidated financial statements.
Year Ended April 30,
(Dollars in thousands, except per share data) 2008 2007 2006
Net sales $2,524,774 $2,148,017 $2,154,726Cost of products sold 1,741,100 1,435,981 1,459,611Cost of products sold – restructuring 1,510 9,981 2,263
Gross Profit 782,164 702,055 692,852Selling, distribution, and administrative expenses 490,665 442,814 438,457Merger and integration costs 7,967 61 17,934Other restructuring costs 3,237 2,120 7,722Other operating (income) expense – net (3,879) 2,689 (3,386)
Operating Income 284,174 254,371 232,125Interest income 13,259 9,225 6,630Interest expense (42,145) (23,363) (24,026)Other (expense) income – net (500) 771 841
Income Before Income Taxes 254,788 241,004 215,570Income taxes 84,409 83,785 72,216
Net Income $ 170,379 $ 157,219 $ 143,354
Earnings per common share:
Net Income $ 3.03 $ 2.79 $ 2.48
Net Income – Assuming Dilution $ 3.00 $ 2.76 $ 2.45
The J.M. Smucker Company

~ 32 ~
~ Assets ~April 30,
(Dollars in thousands) 2008 2007
Current Assets
Cash and cash equivalents $ 184,175 $ 200,119
Trade receivables, less allowance for doubtful accounts 162,426 124,048
Inventories:
Finished products 280,568 196,177
Raw materials 99,040 89,875
379,608 286,052
Other current assets 49,998 29,147
Total Current Assets 776,207 639,366
Property, Plant, and Equipment
Land and land improvements 45,461 41,456
Buildings and fixtures 202,564 176,950
Machinery and equipment 586,502 536,825
Construction in progress 39,516 25,284
874,043 780,515
Accumulated depreciation (377,747) (326,487)
Total Property, Plant, and Equipment 496,296 454,028
Other Noncurrent Assets
Goodwill 1,132,476 990,771
Other intangible assets, net 614,000 478,194
Marketable securities 16,043 44,117
Other noncurrent assets 94,859 87,347
Total Other Noncurrent Assets 1,857,378 1,600,429
$3,129,881 $2,693,823
Consolidated Balance SheetsThe J.M. Smucker Company

~ 33 ~
~ Liabilities and Shareholders’ Equity ~April 30,
(Dollars in thousands) 2008 2007
Current LiabilitiesAccounts payable $ 119,844 $ 93,500Salaries, wages, and additional compensation 35,808 32,580Accrued trade marketing and merchandising 32,350 24,672Income taxes 1,164 7,265Dividends payable 17,479 17,034Current portion of long-term debt — 33,000Other current liabilities 32,752 28,417
Total Current Liabilities 239,397 236,468
Noncurrent LiabilitiesLong-term debt 789,684 392,643Defined benefit pensions 47,978 45,881Postretirement benefits other than pensions 41,583 46,349Deferred income taxes 175,950 158,418Other noncurrent liabilities 35,436 18,407
Total Noncurrent Liabilities 1,090,631 661,698
Shareholders’ EquitySerial preferred shares – no par value:
Authorized – 3,000,000 shares; outstanding – none — —Common shares – no par value:
Authorized – 150,000,000 shares; outstanding –54,622,612 in 2008 and 56,779,850 in 2007 (net of 10,807,615and 8,619,519 treasury shares, respectively), at stated value 13,656 14,195
Additional capital 1,181,645 1,216,091Retained income 567,419 553,631Amount due from ESOP Trust (5,479) (6,017)Accumulated other comprehensive income 42,612 17,757
Total Shareholders’ Equity 1,799,853 1,795,657
$3,129,881 $2,693,823
See notes to consolidated financial statements.

~ 34 ~
Year Ended April 30,
(Dollars in thousands) 2008 2007 2006
Operating ActivitiesNet income $170,379 $157,219 $143,354Adjustments to reconcile net income to net cash
provided by operations:Depreciation 58,497 57,346 62,452Amortization 4,122 1,528 190Asset impairments and other restructuring charges 1,510 10,089 2,263Share-based compensation expense 11,531 11,257 7,255Gain on sale of assets (1,903) — (5,638)Deferred income tax expense 18,215 22,530 33,124Changes in assets and liabilities, net of effect from
businesses acquired:Trade receivables (17,599) 23,848 1,444Inventories (35,022) (8,146) (6,601)Other current assets (16,208) 5,218 (24,369)Accounts payable and accrued items 6,988 1,034 (64,019)Income taxes (22,302) (15,079) 44,756Other – net 13,369 6,580 4,478
Net Cash Provided by Operating Activities 191,577 273,424 198,689
Investing ActivitiesBusinesses acquired, net of cash acquired (220,949) (60,488) —Additions to property, plant, and equipment (76,430) (57,002) (63,580)Proceeds from sale of businesses 3,407 84,054 8,754Purchase of marketable securities (229,405) (20,000) (5,000)Sale and maturities of marketable securities 257,536 26,272 31,101Disposal of property, plant, and equipment 3,532 2,313 3,747Other – net (177) (2,190) 8,723
Net Cash Used for Investing Activities (262,486) (27,041) (16,255)
Financing ActivitiesProceeds from long-term debt 400,000 — —Repayments of long-term debt (148,000) — (17,000)Revolving credit arrangements – net — (28,144) (8,434)Dividends paid (68,074) (63,632) (62,656)Purchase of treasury shares (152,521) (52,125) (81,717)Proceeds from stock option exercises 17,247 25,766 3,783Other – net 1,187 510 (3,105)
Net Cash Provided by (Used for) Financing Activities 49,839 (117,625) (169,129)Effect of exchange rate changes on cash 5,126 (595) 566
Net (decrease) increase in cash and cash equivalents (15,944) 128,163 13,871Cash and cash equivalents at beginning of year 200,119 71,956 58,085
Cash and Cash Equivalents at End of Year $184,175 $200,119 $ 71,956
( ) Denotes use of cash
Statements of Consolidated Cash Flows
See notes to consolidated financial statements.
The J.M. Smucker Company

AccumulatedCommon Deferred Amount Other Total
(Dollars in thousands, Shares Common Additional Retained Compen- Due from Comprehensive Shareholders’except per share data) Outstanding Shares Capital Income sation ESOP Trust Income (Loss) Equity
Balance at May 1, 2005 58,540,386 $ 14,635 $ 1,240,110 $ 447,831 $(4,573) $ (7,044) $ (159) $ 1,690,800
Net income 143,354 143,354Foreign currency
translation adjustment 19,512 19,512Minimum pension liability
adjustment 8,710 8,710Unrealized loss on
available-for-sale securities (650) (650)Unrealized loss on cash
flow hedging derivatives (204) (204)
Comprehensive Income 170,722
Purchase of treasury shares (1,936,423) (484) (41,910) (39,323) (81,717)Stock plans 345,081 86 12,753 (3,954) 8,885Cash dividends declared –
$1.09 per share (62,795) (62,795)Tax benefit of stock plans 1,645 1,645Other 519 519
Balance at April 30, 2006 56,949,044 14,237 1,212,598 489,067 (8,527) (6,525) 27,209 1,728,059
Net income 157,219 157,219Foreign currency
translation adjustment 2,437 2,437Minimum pension liability
adjustment 427 427Unrealized gain on
available-for-sale securities 1,644 1,644Unrealized gain on cash
flow hedging derivatives 138 138
Comprehensive Income 161,865
Purchase of treasury shares (1,100,194) (275) (23,915) (27,935) (52,125)Stock plans 931,000 233 24,247 8,527 33,007Cash dividends declared –
$1.14 per share (64,720) (64,720)Adjustments to initially
apply Statement ofFinancial AccountingStandards No. 158,net of tax of $7,377 (14,098) (14,098)
Tax benefit of stock plans 3,161 3,161Other 508 508
Balance at April 30, 2007 56,779,850 14,195 1,216,091 553,631 — (6,017) 17,757 1,795,657
Net income 170,379 170,379Foreign currency
translation adjustment 20,861 20,861Pensions and other
postretirement liabilities (2,920) (2,920)Unrealized loss on
available-for-sale securities (379) (379)Unrealized gain on cash
flow hedging derivatives 7,293 7,293
Comprehensive Income 195,234
Purchase of treasury shares (2,991,920) (748) (66,075) (85,698) (152,521)Stock plans 834,682 209 20,398 20,607Cash dividends declared –
$1.22 per share (68,519) (68,519)Adjustments to initially
apply Financial AccountingStandards BoardInterpretation No. 48 (2,374) (2,374)
Tax benefit of stock plans 11,231 11,231Other 538 538
Balance at April 30, 2008 54,622,612 $13,656 $1,181,645 $567,419 $ — $(5,479) $42,612 $1,799,853
~ 35 ~
Statements of Consolidated Shareholders’ Equity
See notes to consolidated financial statements.
The J.M. Smucker Company

~ 36 ~
Note A: Accounting Policies
✷✷✷
Principles of Consolidation: The consolidated financial statements include the accounts of the Company, its wholly-owned sub-sidiaries, and any majority-owned investment. Intercompany transactions and accounts are eliminated in consolidation.
Use of Estimates: The preparation of consolidated financial statements in conformity with U.S. generally accepted accounting prin-ciples requires management to make certain estimates and assumptions that affect the amounts reported in the consolidatedfinancial statements and accompanying notes. Significant estimates in these consolidated financial statements include: allowancesfor doubtful trade receivables, estimates of future cash flows associated with assets, asset impairments, useful lives for depreci-ation and amortization, loss contingencies, net realizable value of inventories, accruals for trade marketing and merchandising pro-grams, income taxes, and the determination of discount and other rate assumptions for defined benefit pension and otherpostretirement benefit expenses. Actual results could differ from these estimates.
Revenue Recognition: The Company recognizes revenue, net of estimated returns and allowances, when all of the following cri-teria have been met: a valid customer order with a determinable price has been received; the product has been shipped and titlehas transferred to the customer; there is no further significant obligation to assist in the resale of the product; and collectibilityis reasonably assured.
Major Customer: Sales to Wal-Mart Stores, Inc. and subsidiaries amounted to approximately 20 percent, 20 percent, and 18 per-cent of net sales in 2008, 2007, and 2006, respectively. These sales are primarily included in the U.S. retail market segment. Noother customer exceeded 10 percent of net sales for any year. Trade receivables at April 30, 2008 and 2007, included amounts duefrom Wal-Mart Stores, Inc. and subsidiaries of $34,210 and $28,274, respectively.
Shipping and Handling Costs: Shipping and handling costs are included in cost of products sold.
Trade Marketing and Merchandising Programs: In order to support the Company’s products, various promotional activities are con-ducted through the retail trade, distributors, or directly with consumers, including in-store display and product placement pro-grams, feature price discounts, coupons, and other similar activities. The Company regularly reviews and revises, when it deemsnecessary, estimates of costs to the Company for these promotional programs based on estimates of what will be redeemed by theretail trade, distributors, or consumers. These estimates are made using various techniques including historical data on perform-ance of similar promotional programs. Differences between estimated expense and actual performance are recognized as a changein management’s estimate in a subsequent period. As the Company’s total promotional expenditures, including amounts classifiedas a reduction of net sales, represent approximately 26 percent of 2008 net sales, the likelihood exists of materially differentreported results if factors such as the level and success of the promotional programs or other conditions differ from expectations.Operating results for the year ended April 30, 2006, include an increase of approximately $6.7 million to net sales reflecting achange in estimate of the expected liability for trade merchandising programs.
Advertising Expense: Advertising costs are expensed as incurred. Advertising expense was $55,522, $51,446, and $56,647 in 2008,2007, and 2006, respectively.
Product Development Cost: Total product development costs including research and development costs and product formulationcosts were $9,547, $9,680, and $10,781 in 2008, 2007, and 2006, respectively.
Share-Based Payments: In December 2004, the Financial Accounting Standards Board issued Statement of Financial AccountingStandards No. 123 (revised), Share-Based Payment (“SFAS 123R”). SFAS 123R is a revision of Statement of Financial AccountingStandards No. 123, Accounting for Stock-Based Compensation (“SFAS 123”), supersedes Accounting Principles Board Opinion No. 25,Accounting for Stock Issued to Employees (“APB 25”), and also amends Statement of Financial Accounting Standards No. 95,Statement of Cash Flows. SFAS 123R requires that the cost of transactions involving share-based payments be recognized in the
Notes to Consolidated Financial Statements
(Dollars in thousands, except per share data)
The J.M. Smucker Company
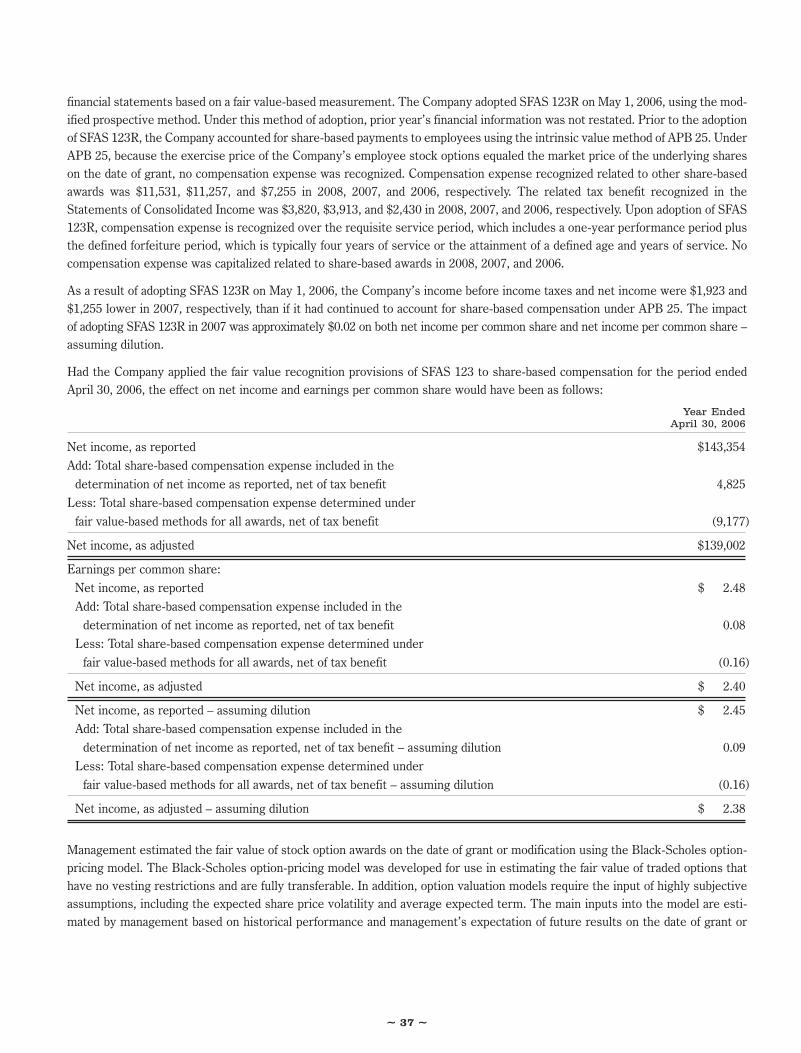
~ 37 ~
financial statements based on a fair value-based measurement. The Company adopted SFAS 123R on May 1, 2006, using the mod-ified prospective method. Under this method of adoption, prior year’s financial information was not restated. Prior to the adoptionof SFAS 123R, the Company accounted for share-based payments to employees using the intrinsic value method of APB 25. UnderAPB 25, because the exercise price of the Company’s employee stock options equaled the market price of the underlying shareson the date of grant, no compensation expense was recognized. Compensation expense recognized related to other share-basedawards was $11,531, $11,257, and $7,255 in 2008, 2007, and 2006, respectively. The related tax benefit recognized in theStatements of Consolidated Income was $3,820, $3,913, and $2,430 in 2008, 2007, and 2006, respectively. Upon adoption of SFAS123R, compensation expense is recognized over the requisite service period, which includes a one-year performance period plusthe defined forfeiture period, which is typically four years of service or the attainment of a defined age and years of service. Nocompensation expense was capitalized related to share-based awards in 2008, 2007, and 2006.
As a result of adopting SFAS 123R on May 1, 2006, the Company’s income before income taxes and net income were $1,923 and$1,255 lower in 2007, respectively, than if it had continued to account for share-based compensation under APB 25. The impactof adopting SFAS 123R in 2007 was approximately $0.02 on both net income per common share and net income per common share –assuming dilution.
Had the Company applied the fair value recognition provisions of SFAS 123 to share-based compensation for the period endedApril 30, 2006, the effect on net income and earnings per common share would have been as follows:
Year EndedApril 30, 2006
Net income, as reported $143,354Add: Total share-based compensation expense included in the
determination of net income as reported, net of tax benefit 4,825Less: Total share-based compensation expense determined under
fair value-based methods for all awards, net of tax benefit (9,177)
Net income, as adjusted $139,002
Earnings per common share:Net income, as reported $ 2.48Add: Total share-based compensation expense included in the
determination of net income as reported, net of tax benefit 0.08Less: Total share-based compensation expense determined under
fair value-based methods for all awards, net of tax benefit (0.16)
Net income, as adjusted $ 2.40
Net income, as reported – assuming dilution $ 2.45Add: Total share-based compensation expense included in the
determination of net income as reported, net of tax benefit – assuming dilution 0.09Less: Total share-based compensation expense determined under
fair value-based methods for all awards, net of tax benefit – assuming dilution (0.16)
Net income, as adjusted – assuming dilution $ 2.38
Management estimated the fair value of stock option awards on the date of grant or modification using the Black-Scholes option-pricing model. The Black-Scholes option-pricing model was developed for use in estimating the fair value of traded options thathave no vesting restrictions and are fully transferable. In addition, option valuation models require the input of highly subjectiveassumptions, including the expected share price volatility and average expected term. The main inputs into the model are esti-mated by management based on historical performance and management’s expectation of future results on the date of grant or

~ 38 ~
modification. The fair value of each option grant was estimated at the date of grant or modification using the following weighted-average assumptions:
Year EndedApril 30, 2006
Average expected term (years) 5.71Risk-free interest rate 4.90%Dividend yield 2.00%Volatility 25.20%
Fair value of options granted $ 8.76
As of April 30, 2008, total compensation cost related to nonvested share-based awards not yet recognized was approximately$14,133. The weighted-average period over which this amount is expected to be recognized is approximately three years.
Corporate income tax benefit realized upon exercise or vesting of an award in excess of that previously recognized in earnings,referred to as an excess tax benefit, is presented in the Statements of Consolidated Cash Flows as a financing activity. Realizedexcess tax benefits are credited to additional capital in the Consolidated Balance Sheets. Realized shortfall tax benefits, amountswhich are less than that previously recognized in earnings, are first offset against the cumulative balance of excess tax benefits,if any, and then charged directly to income tax expense. Under the transition rules for adopting SFAS 123R using the modifiedprospective method, the Company calculated a cumulative balance of excess tax benefits from post-1995 years for the purpose ofaccounting for future shortfall tax benefits and, as a result, has sufficient cumulative excess tax benefits to absorb arising short-falls, such that earnings were not affected in 2008 or 2007. For 2008 and 2007, the actual tax deductible benefit realized fromshare-based compensation was $11,231 and $3,161, including $11,107 and $3,346, respectively, of excess tax benefits realizedupon exercise or vesting of share-based compensation, and classified as other-net under financing activities on the Statement ofConsolidated Cash Flows.
Income Taxes: The Company accounts for income taxes using the liability method. Accordingly, deferred tax assets and liabilitiesare recognized for the future tax consequences attributable to differences between financial statement carrying amounts of exist-ing assets and liabilities and their respective tax bases. Deferred tax assets and liabilities are measured using enacted tax ratesexpected to apply to taxable income in the years in which those temporary differences are expected to be recovered or settled.The effect on deferred tax assets and liabilities of a change in the tax rate is recognized in income or expense in the period thatthe change is effective. A valuation allowance is established when it is more likely than not that all or a portion of a deferred taxasset will not be realized. A tax benefit is recognized when it is more likely than not to be sustained.
Cash and Cash Equivalents: The Company considers all short-term investments with a maturity of three months or less whenpurchased to be cash equivalents.
Trade Receivables: In the normal course of business, the Company extends credit to customers. Trade receivables, less allowancefor doubtful accounts, reflect the net realizable value of receivables, and approximate fair value. In the domestic markets, theCompany’s products are primarily sold through brokers to food retailers, food wholesalers, club stores, mass merchandisers, dis-count stores, military commissaries, health and natural foods stores, foodservice distributors, and chain operators including:hotels and restaurants, schools and other institutions. The Company’s operations outside the United States are principally inCanada where the Company’s products are primarily sold through brokers to a concentration of food retailers and other retail andfoodservice channels similar to those in domestic markets. The Company believes there is no concentration of risk with anysingle customer whose failure or nonperformance would materially affect the Company’s results other than as discussed in MajorCustomer. On a regular basis, the Company evaluates its trade receivables and establishes an allowance for doubtful accountsbased on a combination of specific customer circumstances, credit conditions, and historical write-offs and collections. A receiv-able is considered past due if payments have not been received within the agreed upon invoice terms. The allowance for doubtfulaccounts at April 30, 2008 and 2007, was $911 and $821, respectively. Trade receivables are charged off against the allowance aftermanagement determines the potential for recovery is remote.

~ 39 ~
Inventories: Inventories are stated at the lower of cost or market. Cost is determined using the first-in, first-out method.
Derivative Financial Instruments: The Company utilizes derivative instruments such as commodity futures and options contracts,interest rate swaps, and foreign currency futures contracts to manage exposure to changes in commodity prices, interest rates,and foreign currency exchange rates. The Company accounts for these derivative instruments in accordance with Statement ofFinancial Accounting Standards No. 133, Accounting for Derivative Instruments and Hedging Activities (“SFAS 133”). SFAS 133requires that all derivative instruments be recognized in the financial statements and measured at fair value regardless of the pur-pose or intent for holding them. For derivatives that are designated as a fair value hedge and used to hedge an existing asset orliability, both the derivative and hedged item are recognized at fair value with any changes recognized immediately in theStatements of Consolidated Income. For derivatives designated as a cash flow hedge that are used to hedge an anticipated trans-action, changes in fair value are deferred and recorded in shareholders’ equity as a component of accumulated other comprehen-sive income to the extent the hedge is effective and then recognized in the Statements of Consolidated Income in the periodduring which the hedged transaction affects earnings. The Company utilizes regression analysis to determine correlation betweenthe value of the hedged item and the value of the derivative instrument utilized to identify instruments that meet the criteria forhedge accounting. Any ineffectiveness associated with the hedge or changes in fair value of derivatives that are nonqualifying arerecognized immediately in the Statements of Consolidated Income. By policy, the Company has not historically entered into deriv-ative financial instruments for trading purposes or for speculation. For additional information, see Note N: Derivative FinancialInstruments.
Property, Plant, and Equipment: Property, plant, and equipment are recorded at cost and are depreciated on a straight-line basisover the estimated useful lives of the assets (3 to 20 years for machinery and equipment, and 10 to 40 years for buildings, fixtures,and improvements).
The Company leases certain land, buildings, and equipment for varying periods of time, with renewal options. Rent expense in2008, 2007, and 2006 totaled $23,902, $20,261, and $19,866, respectively.
Impairment of Long-Lived Assets: In accordance with Statement of Financial Accounting Standards No. 144, Accounting for theImpairment or Disposal of Long-Lived Assets, long-lived assets, except goodwill and indefinite-lived intangible assets, are reviewedfor impairment when circumstances indicate the carrying value of an asset may not be recoverable. Recoverability of assets to beheld and used is measured by a comparison of the carrying amount of the assets to future net cash flows estimated by theCompany to be generated by such assets. If such assets are considered to be impaired, the impairment to be recognized is theamount by which the carrying amount of the assets exceeds the fair value of the assets. Assets to be disposed of by sale arerecorded as held for sale at the lower of carrying value or estimated net realizable value. During 2007, the Company recordedimpairment of approximately $8.5 million on long-lived assets associated with the Canadian nonbranded, grain-based foodserviceand industrial businesses divested during the year.
Goodwill and Other Intangible Assets: Goodwill is the excess of the purchase price paid over the fair value of the net assets of thebusiness acquired. In accordance with Statement of Financial Accounting Standards No. 142, Goodwill and Other Intangible Assets,goodwill and indefinite-lived intangible assets are not amortized but are reviewed at least annually for impairment. The Companyconducts its annual test for impairment of goodwill and indefinite-lived intangible assets as of February 1, of each year. For annualimpairment testing purposes, the Company’s reporting units are its operating segments. In addition, the Company will test forimpairment if events or circumstances occur that would more likely than not reduce the fair value of a reporting unit below itscarrying amount. Finite-lived intangible assets are amortized over their estimated useful lives.
Other Investments in Securities: The Company maintains funds for the payment of benefits associated with nonqualified retire-ment plans. These funds include investments considered to be available-for-sale marketable securities. The fair value of theseinvestments included in other assets at April 30, 2008 and 2007, was $31,130 and $31,727, respectively. At April 30, 2008 and2007, the deferred gain included in accumulated other comprehensive income was $1,404 and $2,089, respectively.
Foreign Currency Translation: Assets and liabilities of the Company’s foreign subsidiaries are translated using the exchange ratesin effect at the balance sheet date, while income and expenses are translated using average rates. Translation adjustments arereported as a component of shareholders’ equity in accumulated other comprehensive income.

~ 40 ~
Recently Issued Accounting Standards: In September 2006, the Financial Accounting Standards Board (“FASB”) issued Statementof Financial Accounting Standards No. 157, Fair Value Measurements (“SFAS 157”). SFAS 157 and related interpretations provideguidance for using fair value to measure assets and liabilities and only applies when other standards require or permit the fairvalue measurement of assets and liabilities. It does not expand the use of fair value measurement. In February 2008, the FASBissued Staff Position No. 157-2, Effective Date of FASB Statement No. 157 (“FSP SFAS 157-2”). FSP SFAS 157-2 amends SFAS 157to delay the effective date of the standard, as it relates to nonfinancial assets and nonfinancial liabilities, to fiscal years beginningafter November 15, 2008, (May 1, 2009, for the Company). SFAS 157 for financial assets and financial liabilities is effective forfiscal years beginning after November 15, 2007, (May 1, 2008, for the Company). The Company is currently assessing the impactof SFAS 157, and related interpretations and amendments, on the consolidated financial statements.
In February 2007, the FASB issued Statement of Financial Accounting Standards No. 159, The Fair Value Option for FinancialAssets and Financial Liabilities (“SFAS 159”). SFAS 159 provides companies with an option to report selected financial assets andliabilities at fair value. The objective of SFAS 159 is to reduce both complexity in accounting for financial instruments and thevolatility in earnings caused by measuring related assets and liabilities differently. SFAS 159 is effective for fiscal years beginningafter November 15, 2007, (May 1, 2008, for the Company). The Company is currently assessing the impact of SFAS 159 on theconsolidated financial statements.
In December 2007, the FASB issued Statement of Financial Accounting Standards No. 141(revised), Business Combinations(“SFAS 141R”). SFAS 141R continues to require the purchase method of accounting to be applied to all business combinations,but it significantly changes the accounting for certain aspects of business combinations. SFAS 141R establishes principles andrequirements for how the Company recognizes the assets acquired and liabilities assumed, recognizes the goodwill acquired, anddetermines what information to disclose to enable the evaluation of the nature and financial effects of the business combination.SFAS 141R is effective for business combinations for which the acquisition date is on or after the beginning of the first annualreporting period beginning on or after December 15, 2008, (May 1, 2009, for the Company).
In March 2008, the FASB issued Statement of Financial Accounting Standards No. 161, Disclosures about Derivative Instrumentsand Hedging Activities – an amendment of FASB Statement No. 133 (“SFAS 161”). SFAS 161 seeks to improve financial reportingof derivative instruments and hedging activities by requiring enhanced disclosures regarding the impact on financial position,financial performance, and cash flows. SFAS 161 is effective for fiscal years and interim periods beginning after November 15,2008, (February 1, 2009, for the Company).
Risks and Uncertainties: The Company insures its business and assets in each country against insurable risks, to the extent thatit deems appropriate, based upon an analysis of the relative risks and costs.
The raw materials used by the Company are primarily commodities and agricultural-based products. Glass, plastic, caps, cartonboard, and corrugate are the principle packaging materials used by the Company. The fruit and vegetable raw materials used bythe Company in the production of its food products are purchased from independent growers and suppliers. Sweeteners, peanuts,oils, wheat and flour, milk, corn, and other ingredients are obtained from various suppliers. The cost and availability of many ofthese commodities have fluctuated, and may continue to fluctuate over time. Raw materials are available from numerous sourcesand the Company believes that it will continue to be able to obtain adequate supplies. The Company has not historically encoun-tered shortages of key raw materials. The Company considers its relationship with key material suppliers to be good.
Approximately 31 percent of the Company’s employees, located at 10 facilities, are covered by union contracts. The contracts varyin term depending on the location with one contract expiring in 2009.
Reclassifications: Certain prior year amounts have been reclassified to conform to current year classifications.

~ 41 ~
Note B: Subsequent Events
✷✷✷
On June 4, 2008, the Company entered into a definitive agreement with The Procter & Gamble Company (“P&G”) to mergeP&G’s Folgers coffee business with and into the Company. Under the terms of the agreement, P&G will distribute the Folgersbusiness to P&G shareholders in a tax-free transaction, with a simultaneous merger with and into the Company. In the merger,current P&G shareholders will receive approximately 53.5 percent of the Company’s shares and current Company shareholderswill own approximately 46.5 percent of the combined company upon closing. Upon closing, the Company will have approximately118 million shares outstanding. As part of the transaction, the Company will be assuming an estimated $350 million of Folgersdebt. The transaction is expected to be tax free to both companies and P&G shareholders. In addition, Company shareholders asof the record date, prior to the merger, will receive a special dividend of $5 per share. The record date for the special dividend willbe determined by the Company at a future date.
The transaction is expected to close in the fourth quarter of calendar 2008, subject to customary closing conditions including reg-ulatory and Company shareholder approvals. The Company expects to incur approximately $100 million in one-time costs relatedto the transaction over the next two fiscal years.
The merger will be accounted for as a purchase business combination. For accounting purposes, the Company will be treated asthe acquiring enterprise.
In addition, on May 13, 2008, the Company completed an acquisition of the Knott’s Berry Farm food brand and certain manufac-turing equipment from ConAgra Foods, Inc.
Note C: Acquisitions
✷✷✷
On May 1, 2007, the Company completed its acquisition of Eagle, a privately held company headquartered in Columbus, Ohio, for$133 million in cash and the assumption of $115 million in debt, in a transaction valued at approximately $248 million. Eagle isthe largest producer of canned milk in North America, with sales primarily in retail and foodservice channels. The acquisitionexpands the Company’s position in the baking aisle and complements the Company’s strategy, which is to own and market lead-ing North American food brands sold in the center of the store.
The Company utilized cash on-hand to fund the cash portion of the purchase price. The Company borrowed $130 million againstits revolving credit facility with a weighted-average interest rate of 5.60 percent, a portion of which was used to deposit$118.8 million in escrow on the date of the transaction. The escrow deposit was in exchange for a covenant defeasance on Eagle’s$115 million 8.75 percent Senior, subordinated Notes due January 2008, that were assumed on the acquisition date, as well asaccrued interest due through May 31, 2007. On May 31, 2007, the escrow was distributed to note holders in full payment of theSenior Notes.
The Eagle purchase price was allocated to the underlying assets acquired and liabilities assumed based upon their fair values atthe date of acquisition. The Company determined the estimated fair values based on independent appraisals, discounted cash flowanalyses, quoted market prices, and estimates made by management. To the extent the purchase price exceeded the fair value ofthe net identifiable tangible and intangible assets acquired, such excess was recorded as goodwill.

~ 42 ~
The following table summarizes the estimated fair values of the assets acquired and liabilities assumed at the date of acquisition.
Assets acquired:Current assets $ 48,725Property, plant, and equipment 20,044Intangible assets 100,070Goodwill 100,547Other assets 651
Total assets acquired $270,037Total current liabilities assumed 21,999
Net assets acquired $248,038
In addition to Eagle, the Company completed a series of smaller acquisitions during 2008 including Europe’s Best, Inc. (“Europe’sBest”), a privately owned company headquartered in Montreal, Quebec, and the Canadian Carnation brand canned milk businessfrom Nestlé Canada, for aggregate cash consideration of approximately $87 million.
The purchase price allocation to the identifiable intangible assets acquired is as follows:
Eagle Other Total
Intangible assets with finite livesCustomer relationships (20 year estimated useful life) $ 62,400 $16,703 $ 79,103Technology (20 year estimated useful life) 970 — 970
Intangible assets with indefinite lives 36,700 19,643 56,343
Total intangible assets $100,070 $36,346 $136,416
Goodwill $100,547 $34,660 $135,207
Of the total goodwill, $101,147 and $34,060 was assigned to the U.S. retail market and special markets segments, respectively.For tax purposes, $23,327 is not deductible. The purchase price allocations of Europe’s Best and the Canadian Carnation brandcanned milk business are preliminary and subject to adjustment following the completion of the valuation process.
The results of the operations of each of the acquired businesses are included in the Company’s consolidated financial statementsfrom the date of the acquisition. Had the acquisitions occurred on May 1, 2006, unaudited, pro forma consolidated results for theyears ended April 30, 2008 and 2007, would have been as follows:
Year Ended April 30,
2008 2007
Net sales $2,602,005 $2,451,698Net income $ 173,937 $ 168,488Net income per common share – assuming dilution $ 3.07 $ 2.95
The unaudited, pro forma consolidated results are based on the Company’s historical financial statements and those of theacquired businesses and do not necessarily indicate the results of operations that would have resulted had the acquisitions beencompleted at the beginning of the applicable period presented, nor is it indicative of the results of operations in future periods.

~ 43 ~
Note D: Restructuring
✷✷✷
In 2003, the Company announced its plan to restructure certain operations as part of its ongoing efforts to refine its portfolio, opti-mize its production capacity, improve productivity and operating efficiencies, and improve the Company’s overall cost base as wellas service levels in support of its long-term strategy. The Company’s strategy is to own and market leading North Americanbrands sold in the center of the store.
To date, the Company has closed its fruit processing operations at its Watsonville, California, and Woodburn, Oregon, locationsand subsequently sold these facilities; completed the combination of its two manufacturing facilities in Ripon, Wisconsin, into oneexpanded site; completed a restructuring program to streamline operations in Europe and the United Kingdom, including the exitof a contract packaging arrangement and certain portions of its retail business; completed the sale of its U.S. industrial ingredi-ent business; completed the realignment of distribution warehouses; sold the Salinas, California, facility after production was relo-cated to plants in Orrville, Ohio, and Memphis, Tennessee; and sold the Canadian nonbranded businesses, which were acquiredas part of International Multifoods Corporation, to Horizon Milling G.P., a subsidiary of Cargill and CHS Inc., as part of a strate-gic plan to focus the Canadian operations on its branded consumer retail and foodservice businesses. The restructurings resultedin the reduction of approximately 410 full-time positions.
The Canadian nonbranded divestiture was completed on September 22, 2006. The sale and related restructuring activities haveresulted in expense of approximately $18.6 million, which was reported as a restructuring charge. Costs included noncash, long-lived asset charges, as well as transaction, legal, severance, and pension costs. To date, charges of approximately $16.1 millionwere recognized related to the Canadian restructuring.
The Company expects to incur total restructuring costs of approximately $69 million related to these initiatives, of which $58.5million has been incurred since the announcement of the initiative in March 2003. The balance of the costs and remaining cashpayments, estimated to be approximately $10.5 million and $2.5 million, respectively, are related to the Canadian restructuringand will primarily be incurred through 2009.
The following table summarizes the activity with respect to the restructuring and related asset impairment charges recorded andreserves established and the total amount expected to be incurred.
Employee Long-Lived Equipment OtherSeparation Asset Charges Relocation Costs Total
Total expected restructuring charge $16,900 $20,700 $6,900 $24,500 $69,000
Balance at May 1, 2005 $ 3,222 $ — $ — $ — $ 3,222Charge to expense 2,984 1,699 2,414 2,888 9,985Cash payments (4,512) — (2,414) (2,323) (9,249)Noncash utilization — (1,699) — (565) (2,264)
Balance at April 30, 2006 $ 1,694 $ — $ — $ — $ 1,694Charge to expense 357 9,292 67 2,385 12,101Cash payments (1,415) — (67) (1,696) (3,178)Noncash utilization (108) (9,292) — (689) (10,089)
Balance at April 30, 2007 $ 528 $ — $ — $ — $ 528Charge to expense 53 1,510 112 3,072 4,747Cash payments (176) — (112) (3,072) (3,360)Noncash utilization — (1,510) — — (1,510)
Balance at April 30, 2008 $ 405 $ — $ — $ — $ 405
Remaining expected restructuring charge $ 400 $ — $ — $10,100 $10,500

~ 44 ~
Approximately $1,510, $9,981, and $2,263 of the total restructuring charges of $4,747, $12,101, and $9,985 in 2008, 2007, and2006, respectively, were reported in cost of products sold in the accompanying Statements of Consolidated Income, while theremaining charges were reported in other restructuring costs. The restructuring costs classified as cost of products sold includelong-lived asset charges and inventory disposition costs. Total expected employee separation costs of approximately $16,900 arebeing recognized over the estimated future service period of the related employees. The obligation related to employee separa-tion costs is included in salaries, wages, and additional compensation in the Consolidated Balance Sheets.
Long-lived asset charges include impairments and accelerated depreciation related to machinery and equipment that will be usedat the affected production facilities until they close or are sold. Other costs include miscellaneous expenditures associated withthe Company’s restructuring initiative and are expensed as incurred. These costs include employee relocation, professional fees,and other closed facility costs.
Note E: Reportable Segments
✷✷✷
The Company operates in one industry: the manufacturing and marketing of food products. The Company has two reportable seg-ments: U.S. retail market and special markets. The U.S. retail market segment includes the consumer and consumer oils andbaking strategic business areas. This segment primarily represents the domestic sales of Smucker’s, Jif, Crisco, Pillsbury, EagleBrand, Hungry Jack, White Lily, and Martha White branded products to retail customers. The special markets segment is com-prised of the international, foodservice, beverage, and Canada strategic business areas. Special markets segment products are dis-tributed domestically and in foreign countries through retail channels, foodservice distributors and operators (i.e., restaurants,schools and universities, health care operations), and health and natural foods stores and distributors.

~ 45 ~
The following table sets forth reportable segment and geographical information.
Year Ended April 30,
2008 2007 2006
Net sales:U.S. retail market $1,874,547 $1,547,064 $1,484,873Special markets 650,227 600,953 669,853
Total net sales $2,524,774 $2,148,017 $2,154,726
Segment profit:U.S. retail market $ 332,827 $ 319,795 $ 305,121Special markets 92,019 72,974 68,033
Total segment profit $ 424,846 $ 392,769 $ 373,154
Interest income 13,259 9,225 6,630Interest expense (42,145) (23,363) (24,026)Amortization (4,122) (1,528) (190)Share-based compensation expense (11,531) (11,257) (7,255)Restructuring costs (4,747) (12,101) (9,985)Merger and integration costs (7,967) (61) (17,934)Corporate administrative expenses (115,569) (111,082) (109,223)Other unallocated income (expense) 2,764 (1,598) 4,399
Income before income taxes $ 254,788 $ 241,004 $ 215,570
Net sales:Domestic $2,199,433 $1,819,747 $1,746,111International:
Canada $ 278,447 $ 282,069 $ 368,017All other international 46,894 46,201 40,598
Total international $ 325,341 $ 328,270 $ 408,615
Total net sales $2,524,774 $2,148,017 $2,154,726
Assets:Domestic $2,604,909 $2,198,029 $2,101,109International:
Canada $ 516,529 $ 484,641 $ 539,750All other international 8,443 11,153 8,885
Total international $ 524,972 $ 495,794 $ 548,635
Total assets $3,129,881 $2,693,823 $2,649,744
Long-lived assets:Domestic $1,895,500 $1,690,755 $1,662,389International:
Canada $ 457,344 $ 357,486 $ 339,490All other international 830 6,216 5,027
Total international $ 458,174 $ 363,702 $ 344,517
Total long-lived assets $2,353,674 $2,054,457 $2,006,906
Segment profit represents revenue less direct and allocable operating expenses.

~ 46 ~
The following table presents product sales information.
Year Ended April 30,
2008 2007 2006
Peanut butter 19% 21% 19%Shortening and oils 14 15 16Fruit spreads 13 14 14Baking mixes and frostings 10 11 11Canned milk 10 — —Flour and baking ingredients 8 11 14Portion control 5 5 5Juices and beverages 5 5 4Uncrustables frozen sandwiches 5 4 4Toppings and syrups 4 5 4Pickles and condiments 3 3 3Other 4 6 6
Total 100% 100% 100%
As a result of the pending Folgers merger disclosed in Note B: Subsequent Events, the Company is in the process of evaluatingits current management organization and reporting structure. As part of this evaluation, the Company will evaluate its reportablesegment presentation upon closing of the pending transaction. If the evaluation results in a change in segment reporting, all his-torical information will be retroactively conformed to the new presentation to the extent practical.
Note F: Earnings per Share
✷✷✷
The following table sets forth the computation of earnings per common share and earnings per common share – assuming dilution.
Year Ended April 30,
2008 2007 2006
Numerator:Net income for earnings per common share and
earnings per common share – assuming dilution $170,379 $157,219 $143,354
Denominator:Weighted-average shares 56,226,206 56,432,839 57,863,270Effect of dilutive securities:
Stock options 231,682 389,247 435,361Restricted stock 262,757 234,335 126,730
Denominator for earnings per common share –assuming dilution 56,720,645 57,056,421 58,425,361
Net income per common share $ 3.03 $ 2.79 $ 2.48
Net income per common share – assuming dilution $ 3.00 $ 2.76 $ 2.45
Options to purchase 24,248 and 200,967 common shares were outstanding during 2007 and 2006, respectively, but were notincluded in the computation of earnings per common share – assuming dilution, as the options’ exercise prices were greater thanthe average market price of the common shares and, therefore, the effect would have been antidilutive.

~ 47 ~
Note G: Marketable Securities
✷✷✷
Under the Company’s investment policy, it may invest in debt securities deemed to be investment grade at time of purchase.Currently, these investments are defined as mortgage-backed obligations, corporate bonds, municipal bonds, federal agency notes,and commercial paper. However, in light of current market conditions, the Company has limited its investments primarily to high-quality money market funds. The Company determines the appropriate categorization of debt securities at the time of purchaseand reevaluates such designation at each balance sheet date. The Company has categorized all debt securities as available for salebecause it currently has the intent to convert these investments into cash if and when needed. Classification of these available-for-sale marketable securities as current or noncurrent is based on whether the conversion to cash is expected to be necessaryfor current operations, which is currently consistent with the securities maturity date.
Securities categorized as available for sale are stated at fair value, with unrealized gains and losses reported as a component ofother comprehensive income. Approximately $257,536, $26,272, and $31,101 of proceeds have been realized upon maturity orsale of available-for-sale marketable securities in 2008, 2007, and 2006, respectively. The Company uses specific identification todetermine the basis on which securities are sold.
The following table is a summary of available-for-sale marketable securities, consisting entirely of mortgage-backed securities, atApril 30, 2008 and 2007.
Year Ended April 30,
2008 2007
Cost $16,532 $44,679Gross unrealized gains — 134Gross unrealized losses (489) (696)
Estimated fair value $16,043 $44,117
Marketable securities in an unrealized loss position at April 30, 2008, consisted of two securities for a period of less than twelvemonths. Based on management’s evaluation at April 30, 2008, considering the nature of the investments, the credit worthinessof the issuers, and the intent and ability of the Company to hold the securities for the period necessary to recover the cost of thesecurities, the decline in the fair values was determined to be temporary.
Note H: Goodwill and Other Intangible Assets
✷✷✷
A summary of changes in the Company’s goodwill during the years ended April 30, 2008 and 2007, by reportable segment is asfollows:
U.S. Retail SpecialMarket Markets Total
Balance at May 1, 2006 $ 902,097 $ 38,870 $ 940,967Acquisitions 34,800 15,434 50,234Other (364) (66) (430)
Balance at April 30, 2007 $ 936,533 $ 54,238 $ 990,771Acquisitions 101,147 34,060 135,207Other 4,331 2,167 6,498
Balance at April 30, 2008 $1,042,011 $90,465 $1,132,476
Included in the other category at April 30, 2008 and 2007, were tax adjustments related to various items recognized in goodwillthat are deductible for tax purposes.

~ 48 ~
The Company’s other intangible assets and related accumulated amortizations are as follows:
April 30, 2008 April 30, 2007
Acquisition Accumulated Acquisition AccumulatedCost Amortization Net Cost Amortization Net
Finite-lived intangible assetssubject to amortization:Patents $ 1,000 $ 592 $ 408 $ 1,000 $492 $ 508Technology 970 49 921 — — —Customer relationships 79,103 3,334 75,769 — — —Trademarks 6,785 663 6,122 6,592 251 6,341
Total intangible assetssubject to amortization $ 87,858 $4,638 $ 83,220 $ 7,592 $743 $ 6,849
Indefinite-lived intangible assetsnot subject to amortization:Trademarks $530,780 $ — $530,780 $471,345 $ — $471,345
Total other intangible assets $618,638 $4,638 $614,000 $478,937 $743 $478,194
Amortization expense for finite-lived intangible assets was $3,895, $351, and $100 in 2008, 2007, and 2006, respectively. Theweighted-average useful life of the finite-lived intangible assets is 20 years. Based on the current amount of intangible assets sub-ject to amortization, the estimated amortization expense for each of the succeeding five years is $4,500.
Pursuant to Statement of Financial Accounting Standards No. 142, Goodwill and Other Intangible Assets, the Company is requiredto review goodwill and indefinite-lived intangible assets at least annually for impairment. The annual impairment review of allappropriate assets was performed as of February 1, 2008. Goodwill impairment is tested at the reporting unit levels which are theCompany’s operating segments. No impairment was required to be recorded as a result of the annual impairment review.Approximately $225 of impairment was recorded related to certain indefinite-lived intangible assets in 2007.
Note I: Pensions and Other Postretirement Benefits
✷✷✷
The Company has pension plans covering certain of its domestic and Canadian employees. Benefits are based on the employee’syears of service and compensation. The Company’s plans are funded in conformity with the funding requirements of applicablegovernment regulations.
In addition to providing pension benefits, the Company sponsors several unfunded, defined postretirement plans that providehealth care and life insurance benefits to certain retired domestic and Canadian employees. These plans are contributory, withretiree contributions adjusted periodically, and contain other cost-sharing features, such as deductibles and coinsurance. Coveredemployees generally are eligible for these benefits when they reach age 55 and have attained 10 years of credited service.
Effective April 30, 2007, the Company adopted Statement of Financial Accounting Standards No. 158, Employers’ Accounting forDefined Benefit Pension and Other Postretirement Plans – an amendment of FASB Statement Nos. 87, 88, 106, and 132(R) (“SFAS158”). SFAS 158 requires the recognition of a plan’s funded status as an asset for fully funded plans and as a liability for unfundedor under-funded plans. Previously unrecognized actuarial gains and losses and prior service costs are now recorded in accumu-lated other comprehensive income. The amounts recorded in accumulated other comprehensive income are modified as actuarialassumptions and service costs change and such amounts are amortized to expense over a period of time through the net periodicbenefit cost.

~ 49 ~
The following table summarizes the components of net periodic benefit cost and other comprehensive income related to thedefined benefit pension and other postretirement plans.
Defined Benefit Pension Plans Other Postretirement Benefits
Year Ended April 30, 2008 2007 2006 2008 2007 2006
Service cost $ 6,925 $ 7,607 $ 9,002 $1,291 $ 2,016 $2,113Interest cost 25,900 23,740 22,399 2,516 3,081 3,332Expected return on plan assets (35,391) (32,008) (28,318) — — —Amortization of prior service cost (credit) 1,364 1,423 1,381 (454) (204) 24Amortization of initial net asset (1) (1) (78) — — —Amortization of net actuarial loss (gain) 1,014 1,393 2,779 (523) 49 156Curtailment loss 68 111 — — — —
Net periodic benefit (credit) cost $ (121) $ 2,265 $ 7,165 $2,830 $ 4,942 $5,625
Other changes in plan assets and benefitliabilities recognized in accumulatedother comprehensive incomebefore income taxes:
Change prior to adoption of SFAS 158 $ — $ 826 $ 13,527 $ — $ — $ —Change due to adoption of SFAS 158 — (34,272) — — 12,797 —Change after adoption of SFAS 158:
Prior service cost arising during the year — — — 3,175 — —Net actuarial (losses) gains arising
during the year (14,670) — — 4,826 — —Amortization of prior service cost (credit) 1,364 — — (454) — —Amortization of initial net asset (1) — — — — —Amortization of net actuarial loss (gain) 1,014 — — (523) — —Curtailment 2,821 — — — — —Foreign currency translation (1,212) — — 18 — —
Net change for the year $ (10,684) $(33,446) $ 13,527 $7,042 $12,797 $ —
Weighted-average assumptions used indetermining net periodic benefit costs:U.S. plans:
Discount rate 6.00% 6.30% 5.75% 6.00% 6.30% 5.75%Expected return on plan assets 8.25% 8.25% 8.50% — — —Rate of compensation increase 4.10% 4.10% 4.40% — — —
Canadian plans:Discount rate – before remeasurement 5.25% 5.50% 5.50% 5.25% 5.50% 5.50%Discount rate – after remeasurement — 5.00% — — 5.00% —Expected return on plan assets 8.00% 8.00% 8.00% — — —Rate of compensation increase 4.00% 4.00% 4.00% — — —
The Company uses a measurement date of April 30 to determine defined benefit pension plans’ and other postretirement bene-fits’ assets and benefit obligations. As a result of the sale of the Canadian nonbranded businesses in September 2006, a remea-surement of three Canadian plans was performed.

~ 50 ~
The following table sets forth the combined status of the plans as recognized in the Consolidated Balance Sheets.
Defined Benefit OtherPension Plans Postretirement Benefits
April 30, April 30,
2008 2007 2008 2007
Change in benefit obligation:Benefit obligation at beginning of the year $435,268 $406,259 $ 46,349 $ 54,026
Service cost 6,925 7,607 1,291 2,016Interest cost 25,900 23,740 2,516 3,081Amendments — 2,831 (3,175) —Divestiture — (3,983) — (4,217)Actuarial (gain) loss (22,986) 21,755 (4,799) (6,941)Participant contributions 371 628 1,250 1,313Benefits paid (25,736) (24,443) (3,116) (2,944)Curtailment gain (2,752) — — —Foreign currency translation adjustments 13,999 874 1,267 15
Benefit obligation at end of the year $430,989 $435,268 $ 41,583 $ 46,349
Change in plan assets:Fair value of plan assets at beginning of the year $431,000 $402,599 $ — $ —
Actual return on plan assets (2,094) 40,257 — —Company contributions 3,538 10,955 1,866 1,631Participant contributions 371 628 1,250 1,313Benefits paid (25,736) (24,443) (3,116) (2,944)Foreign currency translation adjustments 14,940 1,004 — —
Fair value of plan assets at end of the year $422,019 $431,000 $ — $ —
Funded status of the plans $ (8,970) $ (4,268) $(41,583) $(46,349)
Other assets $ 39,008 $ 41,632 $ — $ —Salaries, wages, and additional compensation — (19) — —Defined benefit pensions (47,978) (45,881) — —Postretirement benefits other than pensions — — (41,583) (46,349)
Net benefit liability $ (8,970) $ (4,268) $(41,583) $(46,349)
The following table summarizes amounts recognized in accumulated other comprehensive income at April 30, 2008, beforeincome taxes.
OtherDefined Benefit PostretirementPension Plans Benefits
2008 2007 2008 2007
Net actuarial (loss) gain $ (47,743) $ (35,650) $ 15,319 $ 10,999Prior service (cost) credit (8,563) (9,973) 4,520 1,798Initial asset — 1 — —
Total $ (56,306) $ (45,622) $ 19,839 $ 12,797
During 2009, the Company expects to recognize amortization of net actuarial losses and prior service cost of $1,358 and $1,296,respectively, in net periodic benefit costs.

~ 51 ~
The following table sets forth the assumptions used in determining the benefit obligations.
Defined Benefit OtherPension Plans Postretirement Benefits
April 30, April 30,
2008 2007 2008 2007
Weighted-average assumptions used indetermining benefit obligation:U.S. plans:
Discount rate 6.60% 6.00% 6.60% 6.00%Rate of compensation increase 3.84% 4.10% — —
Canadian plans:Discount rate 6.10% 5.25% 6.10% 5.25%Rate of compensation increase 4.00% 4.00% — —
The rate of compensation increase is based on multiple graded scales and is weighted based on the active liability balance. For2009, the assumed health care trend rates are nine percent and seven and one-half percent, for U.S. and Canadian plans, respec-tively. The rate for participants under age 65 is assumed to decrease to five percent and four and one-half percent in 2014, for U.S.and Canadian plans, respectively. The health care cost trend rate assumption has a significant effect on the amount of the otherpostretirement benefits obligation and periodic other postretirement benefits cost reported.
A one-percentage point annual change in the assumed health care cost trend rate would have the following effect as of April 30, 2008:
One-Percentage Point
Increase Decrease
Effect on total service and interest cost components $ 689 $ (545)Effect on benefit obligation 2,085 (1,934)
The following table sets forth selective information pertaining to the Company’s foreign pension and other postretirement bene-fit plans.
Defined Benefit OtherPension Plans Postretirement Benefits
Year Ended April 30, 2008 2007 2008 2007
Benefit obligation at end of the year $145,348 $137,005 $ 12,079 $ 12,473Fair value of plan assets at end of the year 154,530 147,284 — —
Funded status of the plans $ 9,182 $ 10,279 $(12,079) $(12,473)
Service cost $ 1,103 $ 1,696 $ 58 $ 200Interest cost 8,553 6,607 669 714Company contributions 1,654 8,465 1,090 802Participant contributions 371 628 — —Benefits paid (9,406) (7,691) (1,090) (802)Net periodic benefit (credit) cost (2,849) (1,710) 727 964
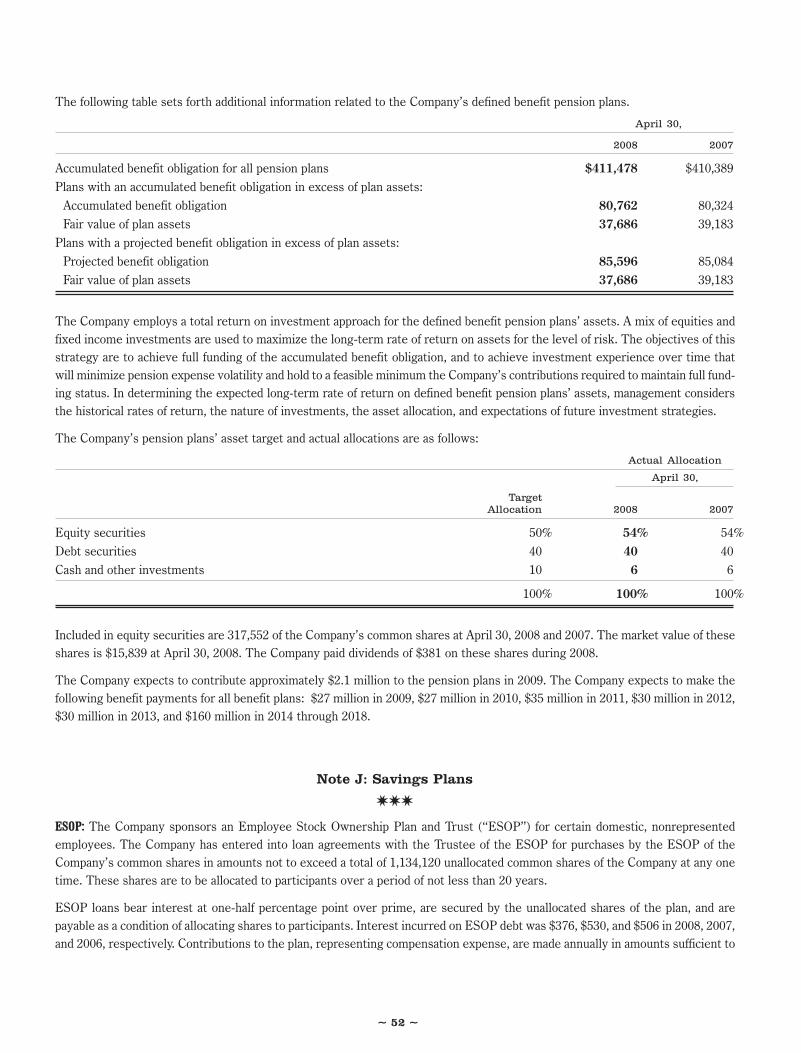
~ 52 ~
The following table sets forth additional information related to the Company’s defined benefit pension plans.
April 30,
2008 2007
Accumulated benefit obligation for all pension plans $411,478 $410,389Plans with an accumulated benefit obligation in excess of plan assets:
Accumulated benefit obligation 80,762 80,324Fair value of plan assets 37,686 39,183
Plans with a projected benefit obligation in excess of plan assets:Projected benefit obligation 85,596 85,084Fair value of plan assets 37,686 39,183
The Company employs a total return on investment approach for the defined benefit pension plans’ assets. A mix of equities andfixed income investments are used to maximize the long-term rate of return on assets for the level of risk. The objectives of thisstrategy are to achieve full funding of the accumulated benefit obligation, and to achieve investment experience over time thatwill minimize pension expense volatility and hold to a feasible minimum the Company’s contributions required to maintain full fund-ing status. In determining the expected long-term rate of return on defined benefit pension plans’ assets, management considersthe historical rates of return, the nature of investments, the asset allocation, and expectations of future investment strategies.
The Company’s pension plans’ asset target and actual allocations are as follows:
Actual Allocation
April 30,
TargetAllocation 2008 2007
Equity securities 50% 54% 54%Debt securities 40 40 40Cash and other investments 10 6 6
100% 100% 100%
Included in equity securities are 317,552 of the Company’s common shares at April 30, 2008 and 2007. The market value of theseshares is $15,839 at April 30, 2008. The Company paid dividends of $381 on these shares during 2008.
The Company expects to contribute approximately $2.1 million to the pension plans in 2009. The Company expects to make thefollowing benefit payments for all benefit plans: $27 million in 2009, $27 million in 2010, $35 million in 2011, $30 million in 2012,$30 million in 2013, and $160 million in 2014 through 2018.
Note J: Savings Plans
✷✷✷
ESOP: The Company sponsors an Employee Stock Ownership Plan and Trust (“ESOP”) for certain domestic, nonrepresentedemployees. The Company has entered into loan agreements with the Trustee of the ESOP for purchases by the ESOP of theCompany’s common shares in amounts not to exceed a total of 1,134,120 unallocated common shares of the Company at any onetime. These shares are to be allocated to participants over a period of not less than 20 years.
ESOP loans bear interest at one-half percentage point over prime, are secured by the unallocated shares of the plan, and arepayable as a condition of allocating shares to participants. Interest incurred on ESOP debt was $376, $530, and $506 in 2008, 2007,and 2006, respectively. Contributions to the plan, representing compensation expense, are made annually in amounts sufficient to

~ 53 ~
fund ESOP debt repayment and were $690, $684, and $558 in 2008, 2007, and 2006, respectively. Dividends on unallocated sharesare used to reduce expense and were $334, $356, and $380 in 2008, 2007, and 2006, respectively. The principal payments receivedfrom the ESOP in 2008, 2007, and 2006 were $538, $508, and $519, respectively.
Dividends on allocated shares are credited to participant accounts and are used to purchase additional common shares for partic-ipant accounts. Dividends on allocated and unallocated shares are charged to retained income by the Company.
As permitted by Statement of Position 93-6, Employers’ Accounting for Employee Stock Ownership Plans, the Company will con-tinue to recognize future compensation using the cost basis as all shares currently held by the ESOP were acquired prior to 1993.At April 30, 2008, the ESOP held 269,398 unallocated and 702,502 allocated shares. All shares held by the ESOP were consideredoutstanding in earnings per share calculations for all periods presented.
Defined Contribution Plans: The Company offers employee savings plans for all domestic and Canadian employees not covered by cer-tain collective bargaining agreements. The Company’s contributions under these plans are based on a specified percentage ofemployee contributions. Charges to operations for these plans in 2008, 2007, and 2006 were $4,943, $4,138, and $4,213, respectively.
Note K: Share-Based Payments
✷✷✷
The Company provides for equity-based incentives to be awarded to key employees and nonemployee directors. Currently, theseincentives consist of restricted shares, restricted stock units, deferred shares, deferred stock units, performance units, and stockoptions. These awards are administered through various plans, as described in the following paragraphs.
2006 Equity Compensation Plan: In August 2006, the Company’s shareholders approved the 2006 Equity Compensation Plan.Awards under this plan may be in the form of stock options, stock appreciation rights, restricted shares, deferred stock units, per-formance shares, performance units, incentive awards, and other share-based awards. Awards under this plan may be granted tothe Company’s nonemployee directors, consultants, officers, and other employees. Deferred stock units granted to nonemployeedirectors vest immediately. At April 30, 2008, there were 2,352,462 shares available for future issuance under this plan. As a resultof this plan becoming effective in August 2006, no further awards will be made under the previously existing equity compensa-tion plans listed below, except for certain defined circumstances included in the new plan.
1998 Equity and Performance Incentive Plan: This plan provides for the issuance of stock options and restricted shares, which mayinclude performance criteria, as well as stock appreciation rights, deferred shares, performance shares, and performance units.As a result of the adoption of the 2006 Equity Compensation Plan, there are no common shares available for grant under this plan.Options granted under this plan became exercisable at the rate of one-third per year, beginning one year after the date of grant.The contractual term of the options is 10 years, and the option price is equal to the market value of the shares on the date of thegrant. Restricted shares and deferred shares issued under this plan are subject to a risk of forfeiture for at least three years in theevent of termination of employment or failure to meet performance criteria, if any. Restricted shares and deferred shares issuedto date under the plan are generally subject to a four-year forfeiture period, but may provide for the earlier termination of restric-tions in the event of retirement, the attainment of a defined age and service requirements, permanent disability or death of anemployee, or a change in control of the Company.
Upon adoption of Statement of Financial Accounting Standards No. 123 (revised), Share-Based Payment (“SFAS 123R”), restrictedshares, deferred stock units, performance units, and performance shares are charged to expense over the requisite service period,which includes a one-year performance period plus the defined forfeiture period. Performance units are granted to a limitednumber of executives. At the beginning of each fiscal year, performance criteria are established for the restricted shares, deferredstock units, and performance units to be earned during the year. At the end of the one-year performance period, the restrictedshares and deferred stock units are granted and the performance units and performance shares are converted into restrictedshares and all are subject to normal vesting over the remaining forfeiture period. The actual number of restricted shares issuedon the conversion date will depend on the actual performance achieved.

~ 54 ~
1987 Stock Option Plan: Options granted under this plan became exercisable at the rate of one-third per year, beginning one yearafter the date of grant, and the option price is equal to the market value of the shares on the date of the grant. The maximum con-tractual term on options issued under this plan is 10 years. As a result of the adoption of the 2006 Equity Compensation Plan,there are no common shares available for future grant under this plan.
Nonemployee Director Stock Option Plan: This plan provides for the issuance of stock options to nonemployee directors annually.Options granted under this plan became exercisable six months after the date of grant, and the option price is equal to the marketvalue of the shares on the date of the grant. The maximum contractual term on options issued under this plan is 10 years. As aresult of the adoption of the 2006 Equity Compensation Plan, there are no common shares available for future grant under this plan.
Amended and Restated 1997 Stock-Based Incentive Plan: This plan was initially adopted by shareholders of InternationalMultifoods Corporation (“Multifoods”) in 1997. Effective with the Company’s acquisition of Multifoods, the Company assumedthe plan. After the acquisition, only former employees of Multifoods that are employed by the Company were eligible to receiveawards under the plan. The maximum contractual term on options issued under this plan is 10 years. As a result of the adoptionof the 2006 Equity Compensation Plan, there are no common shares available for future grant under this plan.
As a result of the Multifoods acquisition, the Company also assumed two additional stock benefit plans. However, no commonshares are available for future grant under these plans.
Under the 2006 Equity Compensation Plan, the Company has the option to settle share-based awards by issuing common sharesfrom treasury or issuing new Company common shares. For awards granted from the Company’s other equity compensation plans,the Company issues common shares from treasury, except for plans that were acquired as part of the Multifoods acquisition, whichare settled by issuing new Company common shares.
~ Stock Options ~
Beginning in fiscal 2006, the Company replaced its employee stock option incentive program with a restricted shares program.No stock options were issued to employees during 2008, 2007, and 2006. During 2006, 12,000 stock options were issued to non-employee directors, with a grant date fair value of $11.45.
On April 12, 2006, the Executive Compensation Committee of the Company’s Board of Directors approved accelerating the vestingof previously issued stock options that had exercise prices greater than $39.31, the closing price of the Company’s common shareson the New York Stock Exchange on April 11, 2006. As a result, approximately 441,000 stock options with exercise prices of either$43.38 or $44.17 became immediately exercisable. Approximately 110,000 and 331,000 of these options would originally have vestedin 2007 and 2008, respectively. The Company accelerated vesting in order to minimize future noncash compensation expense asso-ciated with stock options upon adoption of SFAS 123R on May 1, 2006. By accelerating the vesting of those options, the Companydid not incur compensation expense related to those options of approximately $1.0 million and $2.7 million in 2008 and 2007, respec-tively, that otherwise would have been required to be recognized in the respective periods upon adoption of SFAS 123R.
A summary of the Company’s stock option activity, and related information follows:
Weighted-AverageExercise
Options Price
Outstanding at May 1, 2007 2,147,358 $35.65Exercised (1,007,303) 32.36Forfeited (21,196) 55.60
Outstanding and exercisable at April 30, 2008 1,118,859 $38.23
At April 30, 2008, the weighted-average remaining contractual term for stock options outstanding and exercisable was 4.9 years,and the aggregate intrinsic value of these stock options was $13,036.
The total intrinsic value of options exercised during 2008, 2007, and 2006, was approximately $28,973, $9,409, and $3,674, respectively.

~ 55 ~
~ Other Equity Awards ~
A summary of the Company’s restricted shares, deferred shares, deferred stock units, performance shares, and performance unitsactivity follows:
Restricted/Deferred Weighted-
Shares and Average Performance Weighted-Deferred Grant Date Shares and Average
Stock Units Fair Value Units Fair Value
Outstanding at May 1, 2007 427,845 $ 42.92 67,440 $ 57.73Granted 140,290 57.50 65,830 51.37Converted 67,440 57.73 (67,440) 57.73Unrestricted (192,284) 44.45 — —Forfeited (4,801) 49.65 — —
Outstanding at April 30, 2008 438,490 $49.12 65,830 $51.37
The total fair value of equity awards other than stock options vesting in 2008, 2007, and 2006, was approximately $8,547, $4,276,and $3,700, respectively. The weighted-average grant date fair value of restricted shares, deferred shares, deferred stock units,performance shares, and performance units is the average of the high and the low share price on the date of grant. The followingtable summarizes the weighted-average grant date fair values of the equity awards granted in 2008, 2007, and 2006.
Restricted/Deferred Weighted- Weighted-
Shares and Average Performance AverageiDeferred Grant Date Shares and Grant Date
Year Ended April 30, Stock Units Fair Value Units Fair Value
2008 140,290 $57.50 65,830 $51.372007 172,669 40.80 67,440 57.732006 199,640 50.11 63,310 40.41
The performance shares and units column represents the number of restricted shares received by certain executive officers, sub-sequent to year end, upon conversion of the performance shares and units earned during the year. Restricted stock generallyvests four years from the date of grant or upon the attainment of a defined age and years of service.
Note L: Long-Term Debt and Financing Arrangements
✷✷✷
Long-term debt consists of the following:
April 30,
2008 2007
6.77% Senior Notes due June 1, 2009 $ 75,000 $ 75,0007.87% Series B Senior Notes due September 1, 2007 — 33,0007.94% Series C Senior Notes due September 1, 2010 10,000 10,0004.78% Senior Notes due June 1, 2014 100,000 100,0006.60% Senior Notes due November 13, 2009 204,684 207,6435.55% Senior Notes due April 1, 2022 400,000 —
Total long-term debt $789,684 $425,643Current portion of long-term debt — 33,000
Total long-term debt less current portion $789,684 $392,643
The notes are unsecured and interest is paid annually on the 6.60 percent Senior Notes and semiannually on the other notes. The6.60 percent Senior Notes are guaranteed by Diageo plc. The guarantee may terminate, in limited circumstances, prior to the

~ 56 ~
maturity of the notes. Among other restrictions, the note purchase agreements contain certain covenants relating to liens, con-solidated net worth, and sale of assets as defined in the agreements. The Company is in compliance with all covenants.
On May 31, 2007, the Company issued $400 million of 5.55 percent Senior Notes, due April 1, 2022, with required prepayments,the first of which is $50 million on April 1, 2013. Proceeds from this issuance were used to repay borrowings under the revolv-ing credit facility used in financing the acquisition of Eagle. Additional proceeds were used to finance other strategic and long-term initiatives as determined by the Company.
The Company has available a $180 million revolving credit facility with a group of three banks. Interest on the revolving creditfacility is based on prevailing U.S. prime, Canadian Base Rate, LIBOR, or Canadian CDOR, as determined by the Company, andis payable either on a quarterly basis, or at the end of the borrowing term. At April 30, 2008, the Company did not have a balanceoutstanding under the revolving credit facility. At April 30, 2008, the Company had standby letters of credit of approximately $9.5million outstanding.
Interest paid totaled $44,584, $27,580, and $29,374 in 2008, 2007, and 2006, respectively. This differs from interest expense dueto the timing of payments, amortization of the fair value adjustment on the 6.60 percent Senior Notes, amortization of deferredinterest rate swap gains, and interest capitalized.
Note M: Contingencies
✷✷✷
The Company, like other food manufacturers, is from time to time subject to various administrative, regulatory, and other legalproceedings arising in the ordinary course of business. The Company is not currently party to any pending proceedings whichcould reasonably be expected to have a material adverse effect on the Company.
Note N: Derivative Financial Instruments
✷✷✷
The Company is exposed to market risks, such as changes in interest rates, currency exchange rates, and commodity pricing.To manage the volatility relating to these exposures, the Company enters into various derivative transactions.
Commodity Price Management: In connection with the purchase of inventories by the Company’s baking business in Canada andthe consumer oils and baking business in the United States, the Company enters into commodity futures and options contractsto manage the price volatility and reduce the variability of future cash flows related to anticipated inventory purchases of flour,milk, and edible oils. The Company also enters into commodity futures and options related to the delivery of natural gas to itsmanufacturing plants in the United States. The derivative instruments generally have maturities of less than one year. Certain ofthe derivative instruments associated with the Company’s oils business meet the hedge criteria according to Statement ofFinancial Accounting Standards No. 133, Accounting for Derivative Instruments and Hedging Activities (“SFAS 133”), and areaccounted for as cash flow hedges. The mark-to-market gains or losses on qualifying hedges are deferred and included as a com-ponent of other comprehensive income to the extent effective, and reclassified into cost of products sold in the period duringwhich the hedged transaction affects earnings.
In order to qualify as a hedge of commodity price risk, it must be demonstrated that the changes in the fair value of the com-modities futures contracts are highly effective in hedging price risks associated with the commodity purchased. Hedge ineffec-tiveness is measured on a quarterly basis. The mark-to-market gains or losses on nonqualifying, excluded, and ineffectiveportions of hedges are recognized in cost of products sold immediately.
~ 57 ~
The fair value of all derivative commodity instruments is included in current assets on the Consolidated Balance Sheets. As ofApril 30, 2008 and 2007, the deferred gain, net of tax, included in accumulated other comprehensive income was $8,046 and $858,respectively. The entire amount at April 30, 2008, is expected to be recognized in earnings as the related commodity is utilizedduring 2009. The impact of commodities futures contracts and options recognized in earnings was a gain of $18,428, $4,940, and$637 in 2008, 2007, and 2006, respectively. Included in these amounts are amounts related to nonqualifying, excluded, and inef-fective portions of hedges resulting in a gain of $7,851, $1,552, and $1,742 in 2008, 2007, and 2006, respectively.
Foreign Exchange Rate Hedging: The Company may periodically utilize forward currency exchange contracts. The contracts gen-erally have maturities of less than one year. These contracts are used to manage the effect of the foreign exchange fluctuationson future cash payments related to purchases of certain assets. At the inception of the contract, the derivative is evaluated anddocumented for SFAS 133 accounting treatment. If the contract qualifies for hedge accounting treatment, to the extent the hedgeis deemed effective, the associated mark-to-market gains and losses are deferred and included as a component of other compre-hensive income. As of April 30, 2008, the deferred gain, net of tax, included in accumulated other comprehensive income was$105. These gains or losses are reclassified to earnings in the period the contracts are executed. The ineffective portion of thesecontracts is immediately recognized in earnings. Certain instruments used to manage foreign exchange exposures do not meet therequirements for hedge accounting treatment and the change in value of these instruments is immediately recognized in earnings.
Note O: Other Financial Instruments
✷✷✷
Financial instruments, other than derivatives, that potentially subject the Company to significant concentrations of credit risk con-sist principally of cash investments, marketable securities, and trade receivables. The Company places its cash investments withhigh quality financial institutions and limits the amount of credit exposure to any one institution. The Company’s marketable secu-rities are in debt securities. Under the Company’s investment policy, it will invest in securities deemed to be investment gradeat time of purchase. Currently, these investments are defined as mortgage-backed obligations, corporate bonds, municipal bonds,federal agency notes, and commercial paper. However, in light of current market conditions, the Company has limited its invest-ments primarily to high-quality money market funds. The Company determines the appropriate categorization of its debt securi-ties at the time of purchase and reevaluates such designation at each balance sheet date. With respect to trade receivables,concentration of credit risk is limited due to the large number of customers. The Company does not require collateral from itscustomers. The fair value of the Company’s financial instruments, other than certain of its fixed-rate long-term debt, approxi-mates their carrying amounts. The fair value of the Company’s fixed-rate long-term debt, estimated using current market ratesand a discounted cash flow analysis, was approximately $807,583 at April 30, 2008.
The following table provides information on the carrying amount and fair value of financial instruments, including derivative finan-cial instruments.
April 30, 2008 April 30, 2007
Carrying CarryingAmount Fair Value Amount Fair Value
Marketable securities $ 16,043 $ 16,043 $ 44,117 $ 44,117Derivative financial instruments (net assets) 1,269 1,269 971 971Long-term debt:
6.77% Senior Notes due June 1, 2009 75,000 78,722 75,000 77,9057.87% Series B Senior Notes due September 1, 2007 — — 33,000 33,4007.94% Series C Senior Notes due September 1, 2010 10,000 11,016 10,000 10,8674.78% Senior Notes due June 1, 2014 100,000 99,339 100,000 96,2786.60% Senior Notes due November 13, 2009 204,684 211,591 207,643 208,0375.55% Senior Notes due April 1, 2022 400,000 406,915 — —

~ 58 ~
Note P: Income Taxes
✷✷✷
Deferred income taxes reflect the tax effects of temporary differences between the carrying amounts of assets and liabilities forfinancial reporting purposes and the amounts used for income tax reporting. Significant components of the Company’s deferredtax assets and liabilities are as follows:
April 30,
2008 2007
Deferred tax liabilities:Intangible assets $148,182 $139,445Depreciation and amortization 59,359 54,925Pension and other employee benefits 11,280 10,976Other 8,000 4,434
Total deferred tax liabilities $226,821 $209,780
Deferred tax assets:Loss carryforwards $8,858 $ 12,783Post-employment and other employee benefits 43,902 42,240Tax credit carryforwards 990 12,203Intangible assets 4,866 4,579Other 10,962 8,031
Total deferred tax assets $ 69,578 $ 79,836Valuation allowance for deferred tax assets (9,890) (16,626)
Total deferred tax assets less allowance $ 59,688 $ 63,210
Net deferred tax liability $167,133 $146,570
The following table summarizes domestic and foreign loss carryforwards at April 30, 2008.
Related Tax DeferredDeduction Tax Asset Expiration Date
Loss carryforwards:Federal capital loss $ 11,205 $4,043 2010 to 2012State net operating loss 111,345 4,413 2009 to 2028Foreign net operating loss 4,213 402 2017
Total loss carryforwards $126,763 $8,858
Deferred tax assets at April 30, 2008, also include $990 of foreign tax credit carryforwards that are due to expire from 2010 to 2011.

~ 59 ~
The valuation allowance decreased by $6,736, primarily due to the write-off of deferred tax assets and corresponding full valua-tion allowances associated with foreign tax credit carryforwards. The valuation allowance at April 30, 2008, includes approxi-mately $9,210 for the domestic and foreign loss and tax credit carryforwards. Approximately $4,751 of the valuation allowance, ifsubsequently recognized as a tax benefit under current accounting rules, would be allocated to reduce goodwill.
Domestic income and foreign withholding taxes have not been recorded on undistributed earnings of foreign subsidiaries sincethese amounts are considered to be permanently reinvested. Any additional taxes payable on the earnings of foreign subsidiaries,if remitted, would be partially offset by domestic tax credits or deductions for foreign taxes already paid. It is not practical to esti-mate the amount of additional taxes that might be payable on such undistributed earnings.
Income (loss) before income taxes is as follows:
Year Ended April 30,
2008 2007 2006
Domestic $236,307 $241,349 $210,157Foreign 18,481 (345) 5,413
Income before income taxes $254,788 $241,004 $215,570
The components of the provision for income taxes are as follows:
Year Ended April 30,
2008 2007 2006
Current:Federal $ 59,239 $ 59,207 $ 34,460Foreign 3,580 (3,756) (81)State and local 3,375 5,804 4,713
Deferred 18,215 22,530 33,124
Total income tax expense $ 84,409 $ 83,785 $ 72,216
A reconciliation of the statutory federal income tax rate and the effective income tax rate follows:
Year Ended April 30,
Percent of Pretax Income 2008 2007 2006
Statutory federal income tax rate 35.0% 35.0% 35.0%State and local income taxes, net of
federal income tax benefit 0.4 2.0 0.8Other items – net (2.3) (2.2) (2.3)
Effective income tax rate 33.1% 34.8% 33.5%
Income taxes paid $ 73,786 $ 54,581 $ 5,882
In July 2006, the Financial Accounting Standards Board issued Interpretation No. 48, Accounting for Uncertainty in Income Taxes(“FIN 48”), which is an interpretation of Statement of Financial Accounting Standards No. 109, Accounting for Income Taxes. FIN 48clarifies the financial statement recognition and measurement criteria of a tax position taken or expected to be taken in a tax return.FIN 48 also provides guidance on derecognition, classification, interest and penalties, accounting in interim periods, disclosure,and transition. The Company adopted FIN 48 as of May 1, 2007.

~ 60 ~
The cumulative effect of applying this interpretation has been recorded as a decrease of $2,374 to retained income as of May 1,2007. The Company’s unrecognized tax benefits upon adoption on May 1, 2007, were $19,591, of which $11,231 would affect theeffective tax rate, if recognized.
In accordance with the requirements of FIN 48, uncertain tax positions have been classified in the Consolidated Balance Sheetsas long term, except to the extent payment is expected within one year. The Company recognizes net interest and penalties relatedto unrecognized tax benefits in income tax expense, consistent with the accounting method used prior to adopting FIN 48. As ofMay 1, 2007, the Company’s accrual for tax-related net interest and penalties totaled $5,247.
The Company files income tax returns in the U.S. and various state, local, and foreign jurisdictions. With limited exceptions, theCompany is no longer subject to examination of U.S. federal, state and local, or foreign income taxes for years prior to 2004. TheCompany is currently under examination by the Internal Revenue Service (“IRS”) for years ending 2007 and 2006. During 2008,the Company reached an agreement with the IRS on proposed adjustments resulting from an examination of its federal incometax returns for years ended in 2005 and 2004. As a result of this agreement, the Company reduced its unrecognized tax benefitsand net interest accrual by $4,871 and $667, respectively, and paid $7,726 in taxes and interest. The agreement did not have amaterial effect on the Company’s effective tax rate for the year.
Within the next twelve months, it is reasonably possible that the Company could decrease its unrecognized tax benefits by anestimated $4,540, primarily as a result of state settlement negotiations in process and the expiration of federal, state, and localstatute of limitation periods.
The Company’s unrecognized tax benefits as of April 30, 2008, are $21,902, of which $8,961 would affect the effective tax rate, ifrecognized. As of April 30, 2008, the Company’s accrual for tax-related net interest and penalties totaled $4,865. The amount oftax-related net interest and penalties charged to earnings during 2008 totaled $36.
A reconciliation of the Company’s unrecognized tax benefits is as follows:
Balance at May 1, 2007 $19,591Increases:
Current year tax positions 117Current year acquisitions 6,752Prior year tax positions 5,869
Decreases:Prior year tax positions 1,642Settlement with tax authorities 7,395Expiration of statute of limitations periods 1,390
Balance at April 30, 2008 $21,902

~ 61 ~
Note Q: Accumulated Other Comprehensive Income
✷✷✷
Comprehensive income is included in the Statements of Consolidated Shareholders’ Equity. The components of accumulatedother comprehensive income as shown on the Consolidated Balance Sheets are as follows:
Foreign Pension Unrealized Unrealized Gain AccumulatedCurrency and Other Gain (Loss) on on Cash Flow Other
Translation Postretirement Available-for-Sale Hedging ComprehensiveAdjustment Liabilities Securities Derivatives Income
Balance at May 1, 2005 $ 15,276 $ (16,333) $ (26) $ 924 $ (159)Reclassification adjustments — — — (1,467) (1,467)Current period credit (charge) 19,512 13,527 (1,025) 1,146 33,160Income tax (expense) benefit — (4,817) 375 117 (4,325)
Balance at April 30, 2006 $ 34,788 $ (7,623) $ (676) $ 720 $ 27,209Reclassification adjustments — — — (1,146) (1,146)Current period credit 2,437 826 2,593 1,354 7,210Adjustments to initially apply
Statement of Financial AccountingStandards No. 158 — (21,475) — — (21,475)
Income tax benefit (expense) — 6,978 (949) (70) 5,959
Balance at April 30, 2007 $ 37,225 $ (21,294) $ 968 $ 858 $ 17,757Reclassification adjustments — — — (1,354) (1,354)Current period credit (charge) 20,861 (3,642) (611) 12,885 29,493Income tax benefit (expense) — 722 232 (4,238) (3,284)
Balance at April 30, 2008 $58,086 $(24,214) $ 589 $8,151 $42,612

Note R: Common Shares
✷✷✷
Voting: The Company’s Amended Articles of Incorporation (“the Articles”) provide that each holder of an outstanding commonshare is entitled to one vote on each matter submitted to a vote of the shareholders except for the following specific matters:
any matter that relates to or would result in the dissolution or liquidation of the Company;
the adoption of any amendment of the articles of incorporation, or the regulations of the Company, or the adoption ofamended articles of incorporation, other than the adoption of any amendment or amended articles of incorporation thatincreases the number of votes to which holders of common shares are entitled or expand the matters to which time phasevoting applies;
any proposal or other action to be taken by the shareholders of the Company, relating to the Company’s rights agreement orany successor plan;
any matter relating to any stock option plan, stock purchase plan, executive compensation plan, or other similar plan,arrangement, or agreement;
adoption of any agreement or plan of or for the merger, consolidation, or majority share acquisition of the Company or anyof its subsidiaries with or into any other person, whether domestic or foreign, corporate or noncorporate, or the authoriza-tion of the lease, sale, exchange, transfer, or other disposition of all, or substantially all, of the Company’s assets;
any matter submitted to the Company’s shareholders pursuant to Article Fifth (which relates to procedures applicable to cer-tain business combinations) or Article Seventh (which relates to procedures applicable to certain proposed acquisitions ofspecified percentages of the Company’s outstanding shares) of the Amended Articles of Incorporation, as they may be fur-ther amended, or any issuance of common shares of the Company for which shareholder approval is required by applicablestock exchange rules; and
any matter relating to the issuance of common shares, or the repurchase of common shares that the Company’s Board ofDirectors determines is required or appropriate to be submitted to the Company’s shareholders under the Ohio RevisedCode or applicable stock exchange rules.
On the matters listed above, common shares are entitled to 10 votes per share, if they meet the requirements set forth in theArticles. Common shares which would be entitled to 10 votes per share are:
common shares beneficially owned for four consecutive years as of the June 23, 2008, annual meeting record date; or
common shares received through the Company’s various equity plans.
In the event of a change in beneficial ownership, the new owner of that share will be entitled to only one vote with respect to thatshare on all matters until four years pass without a further change in beneficial ownership of the share.
~ 62 ~

Shareholders’ Rights Plan: Pursuant to a shareholders’ rights plan established in 1999, one share purchase right is associated witheach of the Company’s outstanding common shares.
Under the plan, the rights will initially trade together with the Company’s common shares and will not be exercisable. In theabsence of further action by the directors, the rights generally will become exercisable and allow the holder to acquire theCompany’s common shares at a discounted price if a person or group acquires 10 percent or more of the outstanding commonshares. Rights held by persons who exceed the applicable thresholds will be void. Shares held by members of the Smucker familyare not subject to the thresholds. If exercisable, each right entitles the shareholder to buy one common share at a discountedprice. Under certain circumstances, the rights will entitle the holder to buy shares in an acquiring entity at a discounted price.
The plan also includes an exchange option. In general, if the rights become exercisable, the directors may, at their option, effectan exchange of part or all of the rights, other than rights that have become void, for common shares. Under this option, theCompany would issue one common share for each right, in each case subject to adjustment in certain circumstances.
The Company’s directors may, at their option, redeem all rights for $0.01 per right, generally at any time prior to the rights becom-ing exercisable. The rights will expire May 14, 2009, unless earlier redeemed, exchanged, or amended by the directors.
~ 63 ~

~ 64 ~
Directors, Officers, and General Managers
— Directors —
Vincent C. ByrdSenior Vice President, Consumer MarketThe J. M. Smucker Company
R. Douglas Cowan A
ChairmanThe Davey Tree Expert CompanyKent, Ohio
Kathryn W. Dindo A, E
Retired Vice PresidentFirstEnergy Corp.Akron, Ohio
Paul J. Dolan E
PresidentCleveland IndiansCleveland, Ohio
Elizabeth Valk Long A, E
Former Executive Vice PresidentTime Inc.New York, New York
Nancy Lopez Knight G
FounderNancy Lopez Golf CompanyAlbany, Georgia
Gary A. Oatey G
Chairman and Chief Executive OfficerOatey Co.Cleveland, Ohio
Richard K. SmuckerPresident and Co-Chief Executive OfficerThe J. M. Smucker Company
Timothy P. SmuckerChairman and Co-Chief Executive OfficerThe J. M. Smucker Company
William H. Steinbrink G
Advisor to Business and Non-Profit LeadersShaker Heights, Ohio
A Audit Committee MemberE Executive Compensation Committee MemberG Nominating and Corporate Governance
Committee Member
Timothy P. SmuckerChairman and Co-Chief Executive Officer
Richard K. SmuckerPresident and Co-Chief Executive Officer
Dennis J. ArmstrongVice President, Logistics and
Operational Support
Mark R. BelgyaVice President, Chief Financial Officerand Treasurer
Vincent C. ByrdSenior Vice President, Consumer Market
John W. DenmanVice President and Controller
Barry C. DunawayVice President, Corporate Development
M. Ann HarlanVice President, General Counseland Secretary
Donald D. Hurrle, Sr.Vice President, Sales, Grocery Market
John F. MayerVice President, Customer Development
Kenneth A. MillerVice President, Alternate Channels
Steven OaklandVice President and General Manager,Consumer Oils and Baking
Andrew G. PlattVice President, InformationServices and Chief Information Officer
Christopher P. ResweberVice President, Marketing Services
Julia L. SabinVice President and General Manager,Smucker Quality Beverages, Inc.
Mark T. SmuckerVice President, International
Paul Smucker WagstaffVice President, Foodserviceand Beverage Markets
Albert W. YeagleyVice President, Quality Assurance
Jeannette L. KnudsenSecurities and Acquisition Counseland Assistant Secretary
Debra A. MartheyAssistant Treasurer
Larry W. HermanGeneral Manager, Foodservice
Gary A. JeffcottGeneral Manager, International Market
David LemmonManaging Director, Canada
— Properties —
Corporate Offices:
Orrville, Ohio
Domestic Locations:
Chico, California
Cincinnati, Ohio
El Paso, Texas
Grandview, Washington
Havre de Grace, Maryland
Lexington, Kentucky
Memphis, Tennessee
New Bethlehem, Pennsylvania
Orrville, Ohio
Oxnard, California
Ripon, Wisconsin
Scottsville, Kentucky
Seneca, Missouri
Toledo, Ohio
West Fargo, North Dakota*
International ManufacturingLocations:
Delhi Township, Ontario, Canada
Dunnville, Ontario, Canada
Sherbrooke, Quebec, Canada
Ste. Marie, Quebec, Canada
Sales and Administrative Offices:*
Bentonville, Arkansas
Markham, Ontario, Canada
Mexico City, Mexico
* Leased properties
— Officers & General Managers —
The J.M. Smucker Company

Corporate and Shareholder Information
Corporate Offices
The J. M. Smucker CompanyStrawberry LaneOrrville, Ohio 44667Telephone: (330) 682-3000
Stock Listing
The J. M. Smucker Company’s common shares are listed on theNew York Stock Exchange — ticker symbol SJM.
Corporate Web Site
To learn more about The J. M. Smucker Company, visitwww.smuckers.com.
Annual Meeting
The annual meeting will be held at 11:00 a.m. Eastern DaylightTime, Thursday, August 21, 2008, in Fisher Auditorium at theOhio Agricultural Research and Development Center,1680 Madison Avenue, Wooster, Ohio 44691.
Corporate News and Reports
Corporate news releases, annual reports, and Securities andExchange Commission filings, including Forms 10-K, 10-Q, and8-K, are available free of charge on the Company’s Web site.They are also available without cost to shareholders who submita written request to:
The J. M. Smucker CompanyAttention: Corporate SecretaryStrawberry LaneOrrville, Ohio 44667
Certifications
The Company’s Chief Executive Officers and Chief FinancialOfficer have certified to the New York Stock Exchange thatthey are not aware of any violation by the Company of NewYork Stock Exchange corporate governance standards. TheCompany has also filed with the Securities and ExchangeCommission certain certifications relating to the quality of theCompany’s public disclosures. These certifications are filed asexhibits to the Company’s Annual Report on Form 10-K.
Independent Registered Public Accounting Firm
Ernst & Young LLPAkron, Ohio
Dividends
The Company’s Board of Directors typically declaresa cash dividend each quarter. Dividends are generally payableon the first business day of March, June, September, andDecember. The record date is approximately two weeksbefore the payment date. The Company’s dividend disburse-ment agent is Computershare Investor Services, LLC.
Shareholder Services
The transfer agent and registrar for the Company,Computershare Investor Services, LLC, is responsible forassisting registered shareholders with a variety of mattersincluding:
✥ Shareholder investment program (BYDSSM)– direct purchase of Company common shares– dividend reinvestment– automatic monthly cash investments
✥ Book-entry share ownership
✥ Share transfer matters (including name changes,gifting, and inheritances)
✥ Direct deposit of dividend payments
✥ Nonreceipt of dividend checks
✥ Lost share certificates
✥ Changes of address
✥ Online shareholder account access
✥ Form 1099 income inquiries (including requests forduplicate copies)
Shareholders may contact Shareholder Relations at thecorporate offices regarding other shareholder inquiries.
Transfer Agent and Registrar
Computershare Investor Services, LLC250 Royall StreetCanton, MA 02021Telephone: (800) 456-1169Telephone outside the U.S., Canada, andPuerto Rico: (312) 360-5254Web site: www.computershare.com/contactus
©/™/® The J. M. Smucker Company or its subsidiaries. Pillsbury, PillsburyBEST, the Barrelhead logo and the Doughboy character are trademarks ofThe Pillsbury Company, LLC used under license. Borden and Elsie trade-marks used under license. Splenda and Splenda design are trademarks ofMcNeil Nutritionals, LLC.
This annual report includes certain forward-looking statements that arebased on current expectations and are subject to a number of risks anduncertainties. Please reference “Forward-Looking Statements” located onpage 26 in the Management’s Discussion and Analysis section.
The majority of this report was printedon paper with a minimum of 25% post-consumer waste recycled content.
C
The J.M. Smucker Company
With a Name Like Smucker’s, It Has to Be Good.®
All the Goodness of Smucker’s®... In a Store!
Smucker’s Wall of Jam
The Café
Company Museum
Brand Products & Merchandise
Custom Gift Baskets Unique Gift Sets


![Interview Pater Daniel Artmeyer SJM [550]](https://static.fdocuments.net/doc/165x107/5695cf891a28ab9b028e8091/interview-pater-daniel-artmeyer-sjm-550.jpg)