Chapitre III Amortissement des immobilisations Cours proposé par GABSI Mohamed ISG Tunis -2007-2008.
ICT R&D MACRO DATA COLLECTION AND ANALYSIS
2008-2009 NACE REV. 2 ICT DATASETS.
METHODOLOGICAL NOTES
3 December 2012

CONTENTS
3 PART 1. DESCRIPTION OF 2008-2009 NACE REV. 2 ICT DATASETS. DEFINITION OF ICT SECTOR AND CORRESPONDENCES TABLES
6 PART 2. ICT DATA COLLECTION
7 1. ICT GVA 7 1.1. EU-27 8 1.2 JAPAN 9 1.3. UNITED STATES
10 2. ICT EMPLOYMENT 10 2.1. EU-27 12 2.2. JAPAN 13 2.3. UNITED STATES
13 3. ICT LABOUR PRODUCTIVITY
14 4. ICT TURNOVER 14 4.1. EU-27
15 5. ICT BUSINESS EXPENDITURE ON R&D (BERD) 15 5.1. EU-27 17 5.2. JAPAN 18 5.3. UNITED STATES
19 6. ICT PERSONNEL AND RESEARCHERS ON R&D 19 6.1. EU-27
21 7. ICT BERD INTENSITY
Part 1 Description of
2008-2009 NACE Rev. 2 ICT Datasets. Definition of ICT
sector and correspondences tables

2008-2009 NACE Rev. 2 ICT datasets. Methodological notes 4
The Instituto Valenciano de Investigaciones Económicas (Valencian Institute of Economic Research, Ivie) has collected, processed and made use of data for EU-27, Japan and United States, following international standards, in particular the Guide to measuring the Information Society (OECD 2011). The datasets consist of the NACE Rev. 2 2008-2009 ICT data according to latest OECD definition (table 1).
Table 1. The 2007 OECD ICT sector definition (based on NACE Rev. 2)
ICT manufacturing industries
261 Manufacture of electronic components and boards
262 Manufacture of computers and peripheral equipment
263 Manufacture of communication equipment
264 Manufacture of consumer electronics
268 Manufacture of magnetic and optical media
ICT trade industries
4651 Wholesale of computers, computer peripheral equipment and software
4652 Wholesale of electronic and telecommunications equipment and parts
ICT services industries
5820 Software publishing
6110 Wired telecommunications activities
6120 Wireless telecommunications activities
6130 Satellite telecommunications activities
6190 Other telecommunications activities
6201 Computer programming activities
6202 Computer consultancy and computer facilities management activities
6209 Other information technology and computer service activities
6311 Data processing, hosting and related activities
6312 Web portals
9511 Repair of computers and peripheral equipment
9512 Repair of communication equipment
Source: OECD (2011).
The EU-27 dataset consist of the five ICT manufacturing sectors (261 to 264 and 268), two ICT trade sectors (4651 and 4652) and five ICT services sectors (5820, 61, 62, 631 and 951).
Dataset for Japan and United States does not include ICT trade sector.
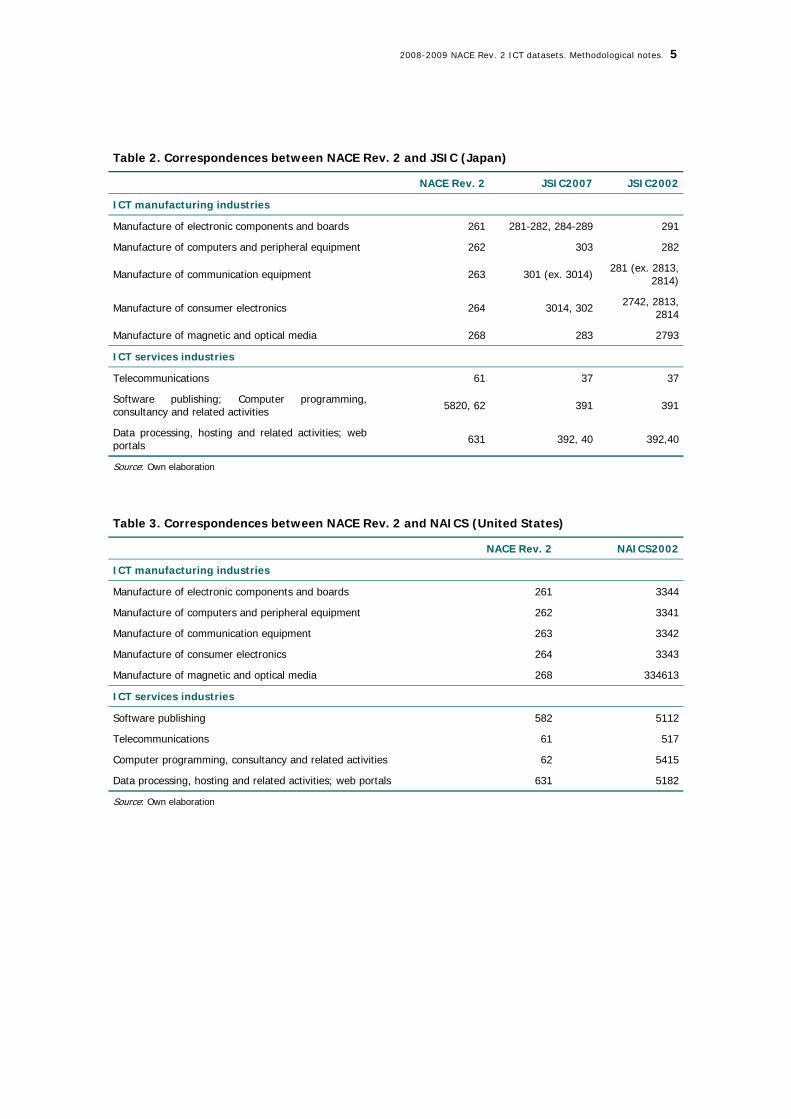
The Ivie has elaborated correspondence tables between NACE Rev. 2 (ISIC Rev. 4) and other national activity classifications like Standard Industrial Classification for Japan (JSIC) (table 2) and North American Industry Classification System (NAICS) used by United States (table 3).
2008-2009 NACE Rev. 2 ICT datasets. Methodological notes 5
Table 2. Correspondences between NACE Rev. 2 and JSIC (Japan)
NACE Rev. 2 JSIC2007 JSIC2002
ICT manufacturing industries
Manufacture of electronic components and boards 261 281-282, 284-289 291
Manufacture of computers and peripheral equipment 262 303 282
Manufacture of communication equipment 263 301 (ex. 3014) 281 (ex. 2813, 2814)
Manufacture of consumer electronics 264 3014, 302 2742, 2813, 2814
Manufacture of magnetic and optical media 268 283 2793
ICT services industries
Telecommunications 61 37 37
Software publishing; Computer programming, consultancy and related activities 5820, 62 391 391
Data processing, hosting and related activities; web portals 631 392, 40 392,40
Source: Own elaboration
Table 3. Correspondences between NACE Rev. 2 and NAICS (United States)
NACE Rev. 2 NAICS2002
ICT manufacturing industries
Manufacture of electronic components and boards 261 3344
Manufacture of computers and peripheral equipment 262 3341
Manufacture of communication equipment 263 3342
Manufacture of consumer electronics 264 3343
Manufacture of magnetic and optical media 268 334613
ICT services industries
Software publishing 582 5112
Telecommunications 61 517
Computer programming, consultancy and related activities 62 5415
Data processing, hosting and related activities; web portals 631 5182
Source: Own elaboration

Part 2 ICT data collection

2008-2009 NACE Rev. 2 ICT datasets. Methodological notes 7
1. ICT GVA
1.1. EU-27
Sources
National Accounts (NA) from Eurostat:
http://appsso.eurostat.ec.europa.eu/nui/show.do?dataset=nama_gdp_c&lang=en Downloaded: 05-03-2012 (GDP and main components - Current prices)
http://appsso.eurostat.ec.europa.eu/nui/show.do?dataset=nama_nace10_c&lang=en Downloaded: 05-03-2012 (National Accounts by 10 branches - aggregates at current prices (NACE Rev.2))
http://appsso.eurostat.ec.europa.eu/nui/show.do?dataset=nama_nace21_c&lang=en Downloaded: 05-03-2012 (National Accounts by 21 branches - aggregates at current prices (NACE Rev.2))
http://appsso.eurostat.ec.europa.eu/nui/show.do?dataset=nama_nace38_c&lang=en Downloaded: 05-03-2012 (National Accounts by 38 branches - aggregates at current prices (NACE Rev.2))
http://appsso.eurostat.ec.europa.eu/nui/show.do?dataset=nama_nace64_c&lang=en Downloaded: 05-03-2012 (National Accounts by 64 branches - aggregates at current prices (NACE Rev.2))
Purchasing power parities (PPP) from Eurostat http://appsso.eurostat.ec.europa.eu/nui/show.do?dataset=nama_aux_cra&lang=en
Downloaded: 05-03-2012
Structural Business Statistics (SBS) from Eurostat:
http://appsso.eurostat.ec.europa.eu/nui/show.do?dataset=sbs_na_sca_r2&lang=en Downloaded: 01-03-2012 (Annual enterprise statistics for special aggregates of activities (NACE Rev.2))
http://appsso.eurostat.ec.europa.eu/nui/show.do?dataset=sbs_na_ind_r2&lang=en Downloaded: 01-03-2012 (Annual detailed enterprise statistics for industry (NACE Rev.2 B-E))
http://appsso.eurostat.ec.europa.eu/nui/show.do?dataset=sbs_na_r2preli&lang=en Downloaded: 01-03-2012 (Preliminary results on industry and construction, main indicators (NACE Rev.2 B-F))
http://appsso.eurostat.ec.europa.eu/nui/show.do?dataset=sbs_na_dt_r2&lang=en Downloaded: 01-03-2012 (Annual detailed enterprise statistics for trade (NACE Rev.2 G))
http://appsso.eurostat.ec.europa.eu/nui/show.do?dataset=sbs_dt_r2preli&lang=en Downloaded: 01-03-2012 (Preliminary results on trade, main indicators (NACE Rev.2 G))
http://appsso.eurostat.ec.europa.eu/nui/show.do?dataset=sbs_na_1a_se_r2&lang=en Downloaded: 01-03-2012 (Annual detailed enterprise statistics for services (NACE Rev.2 H-N and S95))
http://appsso.eurostat.ec.europa.eu/nui/show.do?dataset=sbs_sc_r2preli&lang=en Downloaded: 01-03-2012 (Preliminary results on services, main indicators (NACE Rev.2 H-N and S95)

2008-2009 NACE Rev. 2 ICT datasets. Methodological notes 8
Remarks
The main source of the 2008-2009 GVA NACE Rev.2 ICT sector database in nominal euros for the EU countries is NA from Eurostat.
The NA GVA data has been distributed among ICT (and non ICT) sectors, according to the latest OECD definition (table 1) using GVA or production data (when the first is not available) from the NA and SBS statistics. NA from Eurostat only provides direct GVA information for ICT sector NACE 61 (telecommunications) for all the European countries, except Bulgaria, Luxembourg, Malta and United Kingdom. The majority of GVA sector gaps have been filled with weights of the same sector and the same year in production or with GVA of another year.
Greece, Luxembourg and especially Malta lack official data, therefore we recommend taking the results with caution. The missing data not covered with sources mentioned above has been estimated using NACE Rev. 1.1 data, correspondence table between NACE Rev. 1.1 and NACE Rev. 2, European averages ICT shares, and turnover/GVA ratio.
We obtain GVA dataset in PPS using purchasing power parities coming from Eurostat.
1.2. JAPAN
Sources
NA from Economic and Social Research Institute (ESRI), Cabinet Office.
http://www.esri.cao.go.jp/en/sna/data/kakuhou/files/2010/24annual_report_e.html Downloaded: 02-04-2012
Annual manufacturing census from Economic and Industrial Policy Bureau, Ministry of Economy, Trade and Industry (METI).
http://www.meti.go.jp/english/statistics/tyo/kougyo/index.html Downloaded: 02-04-2012
Survey of selected services industries from METI
http://www.meti.go.jp/english/statistics/tyo/tokusabizi/index.html Downloaded: 02-04-2012
Japan Industrial Productivity (JIP) from Research Institute of Economy, Trade and Industry (RIETI) and Hitotsubashi University.
http://www.rieti.go.jp/en/database/JIP2011/index.html Downloaded: 20-04-2012
Exchange rates and PPP from Eurostat
http://appsso.eurostat.ec.europa.eu/nui/show.do?dataset=ert_bil_eur_a&lang=en

2008-2009 NACE Rev. 2 ICT datasets. Methodological notes 9
Downloaded: 05-03-2012 (Exchange rates)
http://appsso.eurostat.ec.europa.eu/nui/show.do?dataset=nama_aux_cra&lang=en Downloaded: 05-03-2012 (Purchasing power parities)
Exchange rates and PPP from OECD
http://stats.oecd.org/Index.aspx?DataSetCode=SNA_TABLE4 Downloaded: 05-03-2012 (PPPs and exchange rates: national currency per US dollar)
Remarks
The main source of the GVA ICT sector data (in national currency) for Japan is ESRI, Cabinet Office, since OECD has not published any NACE Rev. 2 data yet.
The National Accounts GVA data has been distributed among ICT (and non ICT) sectors following the comprehensive 2007 OECD ICT sector definition (table 1) using GVA data from annual manufacturing census provided by METI, GVA data from JIP Database provided by RIETI and Hitotsubashi University, sales data from Survey on Selected Service Industries provided by METI and correspondences tables between JSIC and NACE Rev. 2 (table 2).
Japan dataset does not include ICT trade sector and ICT sector NACE 951 (repair of computers and communication equipment), and NACE 62 (Computer programming, consultancy and related activities) includes ICT sector NACE 5820 (Software publishing).
We obtain 2008-2009 NACE Rev. 2 GVA in euros and PPS using exchange rates and purchasing power parities respectively coming from OECD and Eurostat
1.3. UNITED STATES
Sources
NA from Bureau of Economic Analysis (BEA).
http://www.bea.gov/industry/gdpbyind_data.htm Downloaded: 01-04-2012
Input-Output Accounts from BEA.
http://www.bea.gov/industry/gdpbyind_data.htm Downloaded: 01-04-2012
Exchange rates and PPP from Eurostat
http://appsso.eurostat.ec.europa.eu/nui/show.do?dataset=ert_bil_eur_a&lang=en Downloaded: 05-03-2012 (Exchange rates: national currency per euro)
2008-2009 NACE Rev. 2 ICT datasets. Methodological notes 10
http://appsso.eurostat.ec.europa.eu/nui/show.do?dataset=nama_aux_cra&lang=en Downloaded: 05-03-2012 (Purchasing power parities: national currency per PPS)
Exchange rates and PPP from OECD
http://stats.oecd.org/Index.aspx?DataSetCode=SNA_TABLE4 Downloaded: 05-03-2012 (PPPs and exchange rates: national currency per US dollar)
Remarks
The main source for the 2008-2009 GVA ICT sector data (in national currency) in NAICS for United States is NA from BEA, since OECD has not published any NACE Rev. 2 data yet.
The NA GVA data has been distributed among ICT (and non ICT) sectors following the comprehensive 2007 OECD ICT sector definition (table 1) using production data from the Input-Output Accounts provided by BEA and correspondences tables between NAICS and NACE Rev. 2 (table 7).
United States GVA dataset does not contain information for the ICT trade sector and one ICT services sector: 951 (Repair of computers and communication equipment).
We obtain 2008-2009 NACE Rev. 2 GVA in euros and PPS using exchange rates and purchasing power parities respectively coming from OECD and Eurostat.
2. ICT Employment
2.1. EU-27
Sources
National Accounts (NA) from Eurostat:
http://appsso.eurostat.ec.europa.eu/nui/show.do?dataset=nama_aux_pem&lang=en Downloaded: 29-02-2012 (Population and employment - Annual data)
http://epp.eurostat.ec.europa.eu/portal/page/portal/national_accounts/data/database Downloaded: 29-02-2012 (National Accounts by 10 branches – employment data (NACE Rev.2))
http://appsso.eurostat.ec.europa.eu/nui/show.do?dataset=nama_nace21_e&lang=en Downloaded: 29-02-2012 (National Accounts by 21 branches - employment data (NACE Rev.2))
http://appsso.eurostat.ec.europa.eu/nui/show.do?dataset=nama_nace31_e&lang=en Downloaded: 29-02-2012 (National Accounts by 38 branches - employment data (NACE Rev.2))
http://appsso.eurostat.ec.europa.eu/nui/show.do?dataset=nama_nace64_e&lang=en

2008-2009 NACE Rev. 2 ICT datasets. Methodological notes 11
Downloaded: 29-02-2012 (National Accounts by 64 branches - employment data (NACE Rev.2))
Structural Business Statistics (SBS) from Eurostat:
http://appsso.eurostat.ec.europa.eu/nui/show.do?dataset=sbs_na_sca_r2&lang=en Downloaded: 01-03-2012 (Annual enterprise statistics for special aggregates of activities (NACE Rev.2))
http://appsso.eurostat.ec.europa.eu/nui/show.do?dataset=sbs_na_ind_r2&lang=en Downloaded: 01-03-2012 (Annual detailed enterprise statistics for industry (NACE Rev.2 B-E))
http://appsso.eurostat.ec.europa.eu/nui/show.do?dataset=sbs_na_r2preli&lang=en Downloaded: 01-03-2012 (Preliminary results on industry and construction, main indicators (NACE Rev.2 B-F))
http://appsso.eurostat.ec.europa.eu/nui/show.do?dataset=sbs_na_dt_r2&lang=en Downloaded: 01-03-2012 (Annual detailed enterprise statistics for trade (NACE Rev.2 G))
http://appsso.eurostat.ec.europa.eu/nui/show.do?dataset=sbs_dt_r2preli&lang=en Downloaded: 01-03-2012 (Preliminary results on trade, main indicators (NACE Rev.2 G))
http://appsso.eurostat.ec.europa.eu/nui/show.do?dataset=sbs_na_1a_se_r2&lang=en Downloaded: 01-03-2012 (Annual detailed enterprise statistics for services (NACE Rev.2 H-N and S95))
http://appsso.eurostat.ec.europa.eu/nui/show.do?dataset=sbs_sc_r2preli&lang=en (Preliminary results on services, main indicators (NACE Rev.2 H-N and S95) Downloaded: 01-03-2012
Labour Force Statistics (LFS) from Eurostat:
http://appsso.eurostat.ec.europa.eu/nui/show.do?dataset=lfsa_egan2&lang=en Downloaded: 06-03-2012 (Employment by sex, age groups and economic activity (NACE Rev.2 section level)
http://appsso.eurostat.ec.europa.eu/nui/show.do?dataset=lfsa_egan22d&lang=en Downloaded: 06-03-2012 (Employment by sex, age groups and detailed economic activity (NACE Rev.2 two digit level)
Remarks
The main source of the 2008-2009 employment NACE Rev.2 (in persons) for the EU countries is NA from Eurostat.
The NA employment data has been distributed among ICT (and non ICT) sectors, according to the latest OECD definition (table 1) using employment or jobs (employed or employee) from NA, SBS and LFS.
NA from Eurostat only provides direct employment information for ICT sector NACE 61 (telecommunications) for all the European countries, except Bulgaria, Estonia, Luxembourg, Malta and United Kingdom. In the last country, NA only provides sectoral job information, instead of persons. SBS only provides number of employees data for France

2008-2009 NACE Rev. 2 ICT datasets. Methodological notes 12
The employment gaps have been filled with weights of the same sector using employment (employed or employee) from NA, SBS or LFS of another year.
Greece, Luxembourg and especially Malta lack official data, therefore we recommend taking the results with caution. The missing data has been estimated using some alternative methods like NACE Rev. 1.1 data, correspondence table between NACE Rev. 1.1 and NACE Rev. 2, and European average ICT shares.
2.2. JAPAN
Sources
NA from Economic and Social Research Institute (ESRI), Cabinet Office.
http://www.esri.cao.go.jp/en/sna/data/kakuhou/files/2010/24annual_report_e.html Downloaded: 02-04-2012
Annual manufacturing census from Economic and Industrial Policy Bureau, Ministry of Economy, Trade and Industry (METI).
http://www.meti.go.jp/english/statistics/tyo/kougyo/index.html Downloaded: 02-04-2012
Survey of selected services industries from METI
http://www.meti.go.jp/english/statistics/tyo/tokusabizi/index.html Downloaded: 02-04-2012
Japan Industrial Productivity (JIP) from Research Institute of Economy, Trade and Industry (RIETI) and Hitotsubashi University.
http://www.rieti.go.jp/en/database/JIP2011/index.html Downloaded: 20-04-2012
Remarks
The main source of the Employment ICT sector data for Japan is ESRI, Cabinet Office, since OECD has not published any NACE Rev. 2 data yet.
The National Accounts employment data has been distributed among ICT (and non ICT) sectors using employment (employees) data from annual manufacturing census provided by METI, employment data from JIP Database provided by RIETI and Hitotsubashi University, employment data from Survey on Selected Service Industries provided by METI and correspondences tables between JSIC and NACE Rev. 2 (table 2).
Japan dataset does not include ICT trade sector and ICT sector NACE 951 (repair of computers and communication equipment), and NACE 62 (computer programming, consultancy and related activities) includes ICT sector NACE 5820 (software publishing).
2008-2009 NACE Rev. 2 ICT datasets. Methodological notes 13
2.3. UNITED STATES
Sources
NA from Bureau of Economic Analysis (BEA):
http://www.bea.gov/industry/gdpbyind_data.htm Downloaded: 01-04-2012
Industry Productivity and Costs from Bureau of Labour Statistics (BLS)
http://www.bls.gov/lpc/ Downloaded: 01-04-2012
Labor Force Statistics (Current Population Survey) from BLS
http://www.bls.gov/cps/ Downloaded: 01-04-2012
Annual Survey of Manufactures from United States Census Bureau
http://www.census.gov/manufacturing/asm/index.html Downloaded: 01-04-2012
Remarks
The main source for the 2008-2009 employment NAICS ICT sector data for United States is NA from BEA, since OECD has not published any NACE Rev. 2 data yet.
The NA employment data has been distributed among ICT (and non ICT) sectors following the comprehensive 2007 OECD ICT sector definition (table 1) using employment (employed or employee) data provided by BLS and the United States Census Bureau and correspondence tables between NAICS and NACE Rev. 2 (table 7).
United States employment dataset does not contain information for the ICT trade sector and one ICT services sector: 951 (Repair of computers and communication equipment).
3. ICT labour productivity
Sources: see sources in 1. ICT GVA and 2. ICT employment
Remarks: Labour productivity (GVA/employment) dataset is provided in nominal euros per person and in euros PPS per person. See comments in 1. ICT GVA and 2. ICT employment.

2008-2009 NACE Rev. 2 ICT datasets. Methodological notes 14
4. ICT Turnover
4.1 EU-27
Sources
Structural Business Statistics (SBS) from Eurostat:
http://appsso.eurostat.ec.europa.eu/nui/show.do?dataset=sbs_na_sca_r2&lang=en Downloaded: 01-03-2012 (Annual enterprise statistics for special aggregates of activities (NACE Rev.2))
http://appsso.eurostat.ec.europa.eu/nui/show.do?dataset=sbs_na_ind_r2&lang=en Downloaded: 01-03-2012 (Annual detailed enterprise statistics for industry (NACE Rev.2 B-E))
http://appsso.eurostat.ec.europa.eu/nui/show.do?dataset=sbs_na_r2preli&lang=en Downloaded: 01-03-2012 (Preliminary results on industry and construction, main indicators (NACE Rev.2 B-F))
http://appsso.eurostat.ec.europa.eu/nui/show.do?dataset=sbs_na_dt_r2&lang=en Downloaded: 01-03-2012 (Annual detailed enterprise statistics for trade (NACE Rev.2 G))
http://appsso.eurostat.ec.europa.eu/nui/show.do?dataset=sbs_dt_r2preli&lang=en Downloaded: 01-03-2012 (Preliminary results on trade, main indicators (NACE Rev.2 G))
http://appsso.eurostat.ec.europa.eu/nui/show.do?dataset=sbs_na_1a_se_r2&lang=en Downloaded: 01-03-2012 (Annual detailed enterprise statistics for services (NACE Rev.2 H-N and S95))
http://appsso.eurostat.ec.europa.eu/nui/show.do?dataset=sbs_sc_r2preli&lang=en Downloaded: 01-03-2012 (Preliminary results on services, main indicators (NACE Rev.2 H-N and S95)
Purchasing power parities (PPP) from Eurostat
http://appsso.eurostat.ec.europa.eu/nui/show.do?dataset=nama_aux_cra&lang=en Downloaded: 05-03-2012
Remarks
The main source of the 2008-2009 turnover NACE Rev. 2 ICT database in nominal euros for the EU countries is SBS from Eurostat.
The SBS turnover data has been distributed among ICT (and non ICT) sectors following the comprehensive 2007 OECD ICT sector definition (table 1). The majority of turnover sector gaps have been filled either with weights of the same sector and the same year in production, GVA or with turnover of another year.
Greece, Luxembourg and especially Malta lack official data, therefore we recommend taking the results with caution. The missing data not cover with method mentioned above has been estimated using NACE Rev. 1.1 data, correspondence table between NACE Rev. 1.1 and NACE Rev. 2, European averages ICT shares and turnover/GVA ratio.

2008-2009 NACE Rev. 2 ICT datasets. Methodological notes 15
We obtain 2008-2009 NACE Rev. 2 turnover database in PPS using purchasing power parities coming from Eurostat
5. ICT Business Expenditure on R&D (BERD)
5.1. EU-27
Deliverable 1.1
Sources
Statistics on Research and Development (SRD) from Eurostat:
http://appsso.eurostat.ec.europa.eu/nui/show.do?dataset=rd_e_berdindr2&lang=en Downloaded: 14-03-2012 (R&D expenditure at national and regional level. Business enterprise R&D expenditure (BERD) by economic activity (NACE Rev. 2))
Community Innovation Survey (CIS) from Eurostat:
http://appsso.eurostat.ec.europa.eu/nui/show.do?dataset=inn_cis6_exp&lang=en Downloaded: 14-03-2012 (Results of the CIS 2008. Innovation activity and expenditure in 2008)
Structural Business Statistics (SBS) from Eurostat
http://appsso.eurostat.ec.europa.eu/nui/show.do?dataset=sbs_na_sca_r2&lang=en Downloaded: 01-03-2012 (Annual enterprise statistics for special aggregates of activities (NACE Rev.2))
http://appsso.eurostat.ec.europa.eu/nui/show.do?dataset=sbs_na_ind_r2&lang=en Downloaded: 01-03-2012 (Annual detailed enterprise statistics for industry (NACE Rev.2 B-E))
http://appsso.eurostat.ec.europa.eu/nui/show.do?dataset=sbs_na_r2preli&lang=en Downloaded: 01-03-2012 (Preliminary results on industry and construction, main indicators (NACE Rev.2 B-F))
http://appsso.eurostat.ec.europa.eu/nui/show.do?dataset=sbs_na_dt_r2&lang=en Downloaded: 01-03-2012 (Annual detailed enterprise statistics for trade (NACE Rev.2 G))
http://appsso.eurostat.ec.europa.eu/nui/show.do?dataset=sbs_dt_r2preli&lang=en Downloaded: 01-03-2012 (Preliminary results on trade, main indicators (NACE Rev.2 G))
http://appsso.eurostat.ec.europa.eu/nui/show.do?dataset=sbs_na_1a_se_r2&lang=en Downloaded: 01-03-2012 (Annual detailed enterprise statistics for services (NACE Rev.2 H-N and S95))
http://appsso.eurostat.ec.europa.eu/nui/show.do?dataset=sbs_sc_r2preli&lang=en Downloaded: 01-03-2012 (Preliminary results on services, main indicators (NACE Rev.2 H-N and S95)
Purchasing power parities (PPP) from Eurostat
http://appsso.eurostat.ec.europa.eu/nui/show.do?dataset=nama_aux_cra&lang=en Downloaded: 05-03-2012

2008-2009 NACE Rev. 2 ICT datasets. Methodological notes 16
Remarks
The elaboration of the 2008-2009 BERD NACE Rev.2 ICT sector database (in nominal euros and euros PPS) for the EU countries has been based on the information provided by Eurostat.
The main sources of Business Expenditure R&D data is Statistics on Research and Development (Eurostat). BERD data has been distributed among ICT (and non ICT) sectors, according to the latest OECD definition (table 1) using data provided by country and industry from Eurostat.
The majority of BERD sectors gaps have been filled following these steps:
a. When a country has data for a year in Statistics on R&D, the same percentage structure for the next year is applied.
b. Using Community Innovation Survey to cover the lack of data in some sectors.
c. Using data provided by industry (NACE 1.1.) from Eurostat and correspondence table between NACE rev. 2 and NACE Rev 1.1
d. Using the percentage structure of turnover: weight of the sector 465 (Wholesale of information and communication equipment) in sector G (Wholesale and retail trade; repair of motor vehicles and motorcycles; for Finland, Germany, Greece, Ireland, Latvia, Lithuania, Luxembourg, Netherlands, Romania and Sweden); distribution of the sector 26 (Manufacture of computer, electronic and optical products) to 3-digits (for Denmark, Finland, Greece, Latvia, Luxembourg, Netherlands, Romania and Sweden); weight of the sector 631 (Data processing, hosting and related activities; web portals) in sector 63 (Information service activities; for Belgium, Finland, Greece, Ireland, Lithuania, Luxembourg, Netherlands, Poland, Romania, Spain and Sweden).
e. Using the average weight of R&D expenditure in countries with sector 582 data (Software publishing) in sector 58 (Publishing activities; sample 17 countries; weight: 93% in 2008 and 92% in 2009).
f. Using the average weight of R&D expenditure in countries with sector 951 data (Repair of computers and communication equipment) in sector S-U (Other service activities; sample 17 countries; weight: 16% in 2008 and 13% in 2009).
Greece and Luxembourg lack official data, therefore we recommend taking the results with caution. The missing data has been estimated using some alternative methods like NACE Rev .1.1 data and correspondence table between NACE rev. 2 and NACE Rev 1.1 or percentage structure of turnover.
Data by industry for EU-27 is obtained as the sum of the member countries since official data is not available.
2008-2009 NACE Rev. 2 ICT datasets. Methodological notes 17
We obtain BERD dataset in PPS using purchasing power parities coming from Eurostat.
5.2. JAPAN
Sources
Annual Survey of Research and Development from Japan’s Ministry of Internal Affairs and Communication (MIC)
http://www.stat.go.jp/english/data/kagaku/index.htm Downloaded: 25-04-2012
Annual Manufacturing Census from Economic and Industrial Policy Bureau, Ministry of Economy, Trade and Industry (METI)
http://www.meti.go.jp/english/statistics/tyo/kougyo/index.html Downloaded: 02-04-2012
Survey of Selected Service Industries from METI
http://www.meti.go.jp/english/statistics/tyo/tokusabizi/index.html Downloaded: 24-04-2012
Exchange rates and PPP from Eurostat
http://appsso.eurostat.ec.europa.eu/nui/show.do?dataset=ert_bil_eur_a&lang=en Downloaded: 05-03-2012 (Exchange rates)
http://appsso.eurostat.ec.europa.eu/nui/show.do?dataset=nama_aux_cra&lang=en Downloaded: 05-03-2012 (Purchasing power parities)
Exchange rates and PPP from OECD
http://stats.oecd.org/Index.aspx?DataSetCode=SNA_TABLE4 Downloaded: 05-03-2012 (PPPs and exchange rates: national currency per US dollar)
Remarks
The elaboration of the ICT sector database for Japan has been based on the information provided by Japan’s Ministry of Internal Affairs and Communication (MIC) in the Annual Survey of Research and Development, since OECD has not published any NACE Rev. 2 data yet.
The R&D expenditures have been distributed among ICT (and non ICT) sectors, following the comprehensive 2007 OECD ICT sector definition (table 1), using the correspondences tables between JSIC and NACE Rev. 2 (table 2) elaborated by Ivie.

2008-2009 NACE Rev. 2 ICT datasets. Methodological notes 18
In some cases it has been necessary to use additional information to estimate specific ICT subsectors:
- Value of production from Annual Manufacturing Census provided by METI has been used to estimate the ICT sectors NACE 261 (Manufacture of electronic components and boards), 262 (Manufacture of computers and peripheral equipment), 263 (Manufacture of communication equipment), 264 (Manufacture of consumer electronics) and 268 (Manufacture of magnetic and optical media) in 2008 and 2009. For the previous years the distribution of R&D expenditures is based on 2008 BERD/GVA relation.
- Sales of main activity from Survey on Selected Service Industries provided by METI have been used to estimate ICT sectors NACE 582 (Software publishing), 62 (Computer programming, consultancy and related activities) and 631 (Data processing, hosting and related activities; web portals).
Japan dataset does not contain information for the ICT trade sector and one ICT services sector: 951 (Repair of computers and communication equipment). In addition, ICT sector 62 (Computer programming, consultancy and related activities) includes ICT sector 582 (Software publishing).
We obtain BERD in euros and PPS using exchange rates and purchasing power parities coming from OECD and Eurostat.
5.3. UNITED STATES
Sources
Business R&D and Innovation Survey (BRDIS) from National Science Foundation and United States Census Bureau
http://www.nsf.gov/statistics/srvyindustry/about/brdis Downloaded: 30-07-2012
Science and Engineering Indicators from National Science Foundation and United States Census Bureau
http://www.nsf.gov/statistics/seind12/appendix.htm#c4 Downloaded: 30-07-2012
Survey of Industrial Research and Development from National Science Foundation
http://www.nsf.gov/statistics/industry/ Downloaded: 30-07-2012
Exchange rates and PPP from Eurostat
http://appsso.eurostat.ec.europa.eu/nui/show.do?dataset=ert_bil_eur_a&lang=en Downloaded: 05-03-2012 (Exchange rates)

2008-2009 NACE Rev. 2 ICT datasets. Methodological notes 19
http://appsso.eurostat.ec.europa.eu/nui/show.do?dataset=nama_aux_cra&lang=en Downloaded: 05-03-2012 (Purchasing power parities)
Exchange rates and PPP from OECD
http://stats.oecd.org/Index.aspx?DataSetCode=SNA_TABLE4 Downloaded: 05-03-2012 (PPPs and exchange rates: national currency per US dollar)
Remarks
The elaboration of the ICT sector database for the United States has been based mainly on the information provided by National Science Foundation and United States Census Bureau, since OECD has not published any NACE Rev. 2 data yet.
The R&D expenditures have been distributed among ICT (and non ICT) sectors, following the comprehensive 2007 OECD ICT sector definition (table 1), using correspondence tables between NAICS and NACE Rev. 2 (table 3) elaborated by Ivie.
2008 BRDIS data have greater industrial disaggregation. Because of that, when it was necessary, 2008 structure has been used to distribute R&D expenditures in other years among certain ICT sectors.
United States dataset does not contain information for the ICT trade sector and one ICT services sector: 951 (Repair of computers and communication equipment).
We obtain BERD in euros and PPS using exchange rates and purchasing power parities coming from OECD and Eurostat.
6. ICT Personnel and Researchers on R&D
6.1. EU-27
Sources
Statistics on Research and Development (SRD) from Eurostat:
http://appsso.eurostat.ec.europa.eu/nui/show.do?dataset=rd_p_bempoccr2&lang=en Downloaded: 14-03-2012 (R&D personnel at national and regional level. Total R&D personnel and researchers in business sector by economic activity and sex (NACE Rev. 2))
Labour Force Survey (LFS) from Eurostat:
Specific request to 3-digits Downloaded: 03-04-2012 (Employment by economic activity and highest level of education attained (NACE Rev. 2))

2008-2009 NACE Rev. 2 ICT datasets. Methodological notes 20
Remarks
The elaboration of the 2008-2009 R&D Personnel NACE Rev.2 ICT sector database (in full time equivalent and head count) and R&D Researchers ICT sector database (in full time equivalent) for the EU countries has been based on the information provided by Eurostat.
The main sources of R&D Personnel and Researchers data are Statistics on Research and Development (Eurostat). This data has been distributed among ICT (and non ICT) sectors, according to the latest OECD definition (table 1) using data provided by country and industry from Eurostat.
The majority of sectors gaps have been filled following these steps:
a. When a country has data for a year in Statistics on R&D, the same percentage structure for the next year is applied.
b. Using data provided by industry (NACE 1.1.) from Eurostat and correspondence table between NACE rev. 2 and NACE Rev 1.1
c. Using the percentage structure of Highly Qualified Employment (Labour Force Statistics from Eurostat): weight of the sector 465 (Wholesale of information and communication equipment) in sector G (Wholesale and retail trade; repair of motor vehicles and motorcycles; for Finland, Germany, Greece, Ireland, Latvia, Lithuania, Luxembourg, Netherlands, Romania and Sweden); distribution of the sector 26 (Manufacture of computer, electronic and optical products) to 3-digits (for Denmark, Finland, Greece, Latvia, Lithuania, Luxembourg, Netherlands and Sweden); weight of the sector 631 (Data processing, hosting and related activities; web portals) in sector 63 (Information service activities; for Bulgaria, Finland, France, Germany, Greece, Ireland, Lithuania, Luxembourg, Netherlands, Romania and Sweden).
d. Using the average weight of R&D personnel and researchers in countries with data of the sector 582 (Software publishing) in sector 58 (Publishing activities; sample 18 countries; weight: 91% in 2008 and 2009).
e. Using the average weight of R&D personnel and researchers in countries with data of the sector 951 (Repair of computers and communication equipment) in sector S-U (Other service activities; sample 15 countries; weight: 17% in 2008 and 14% in 2009).
Greece and Luxembourg lack official data, therefore we recommend taking the results with caution. The missing data has been estimated using some alternative methods like NACE Rev .1.1 data and correspondence table between NACE rev. 2 and NACE Rev 1.1 or percentage structure of Highly Qualified.

2008-2009 NACE Rev. 2 ICT datasets. Methodological notes 21
Data by industry for EU-27 is obtained as the sum of the member countries since official data is not available.
7. ICT BERD intensity
Sources: see sources in 5. ICT BERD and 1. ICT GVA
Remarks: Business Expenditure in R&D intensity (BERD/GVA) dataset is provided in percentages. See comments in 5. ICT BERD and 1. ICT GVA.