2007:082 CIV MASTER'S THESIS Standardized Implementation of Q11016193/FULLTEXT01.pdf · MASTER'S...
74
2007:082 CIV MASTER'S THESIS Standardized Implementation of Q1 Ford quality trustmark Claes Gustafsson Andreas Persson Luleå University of Technology MSc Programmes in Engineering Industrial Business Administration Department of Business Administration and Social Sciences Division of Quality & Environmental Management 2007:082 CIV - ISSN: 1402-1617 - ISRN: LTU-EX--07/082--SE
Transcript of 2007:082 CIV MASTER'S THESIS Standardized Implementation of Q11016193/FULLTEXT01.pdf · MASTER'S...
2007:082 CIV
M A S T E R ' S T H E S I S
Standardized Implementation of Q1Ford quality trustmark
Claes Gustafsson Andreas Persson
Luleå University of Technology
MSc Programmes in Engineering Industrial Business Administration
Department of Business Administration and Social SciencesDivision of Quality & Environmental Management
2007:082 CIV - ISSN: 1402-1617 - ISRN: LTU-EX--07/082--SE

‐ Preface ‐
I
PREFACE
This Masters Thesis is the last part of our education in Industrial Management and Engineering with concentration towards Quality Technology and Management at Luleå University of Technology. The thesis is conducted at Brose Sweden AB in Gothenburg.
We would like to express our gratitude to our supervisor Anders Ericson for giving us the opportunity to do our Masters Thesis at Brose Sweden AB. Anders Ericson gave us excellent guidance and a helping hand when needed.
We would also like to thank Rickard Garvare, our supervisor at Luleå University of Technology, for excellent feedback and support during the project. Rickard Garvare has followed us during our project and always been there for us if needed.
At last we would like to thank our roommates Sanna Thelin and Gustaf Wikström for a wonderful time and many hilarious evenings together. They have been there for us in our ups and downs, many thanks.
Gothenburg, February 2007
______________________ ______________________
Claes Gustafsson Andreas Persson

‐ Abstract ‐
II
ABSTRACT
Brose is a supplier to the automotive industry, with more than 40 vehicle brands as customers. It is world market leaders in door system and window regulators and European market leader in seat system. The management system in the new plant in Gothenburg, Sweden, is certified according to ISO 14001 and TS 16949. At the outset of this study the company was ready to go towards a new step, fulfilling customer demands from Ford and Volvo cars to become certified according to Q1, which is a standard for management sub systems including fundamental quality and manufacturing disciplines.
Brose wanted the authors to lead the implementation work in Gothenburg and to make a standardized work model for other new plants. The collection of data has come through interviews and brochures, which were then analysed and used when creating a model for implementation. Q1, TS 16949 and ISO 14001 are similar to a number of other standards. We have gone through some of them and made comparisons in order to find ways to facilitate the implementation of Q1.
When working with quality systems it is necessary to create awareness for the employees and set goals for the implementation work. There is also a need to educate employees and build up trust for the system to make it usable for the company. The implementation work has to be delegated to be able to create awareness between the employees and to make them feel needed. Recurring meetings and learning are key elements to build a successful quality work. The team spirit in the company comes from the managers expressing their gratitude to all employees and making them aware of the situation, the work towards customer satisfaction.

‐ Table of Contents ‐
III
TABLE OF CONTENTS
1 INTRODUCTION ..................................................................................................................................... ‐ 1 ‐
1.1 CORPORATE PROFILE ................................................................................................................................... ‐ 1 ‐
1.2 Q1 .......................................................................................................................................................... ‐ 4 ‐
1.3 PROBLEM DISCUSSION ................................................................................................................................. ‐ 5 ‐
1.4 PURPOSE ................................................................................................................................................... ‐ 6 ‐
2 METHODOLOGY .................................................................................................................................... ‐ 7 ‐
2.1 LITERATURE RESEARCH ................................................................................................................................. ‐ 7 ‐
2.2 RESEARCH STRATEGY ................................................................................................................................... ‐ 7 ‐
2.3 THE DMAIC IMPROVEMENT PROCESS ............................................................................................................ ‐ 8 ‐
2.4 DATA COLLECTION METHOD ........................................................................................................................ ‐ 12 ‐
2.5 INTERVIEWS ............................................................................................................................................. ‐ 12 ‐
2.6 RELIABILITY AND VALIDITY .......................................................................................................................... ‐ 13 ‐
3 THEORETICAL FRAME OF REFERENCE ................................................................................................... ‐ 15 ‐
3.1 Q1 REQUIREMENTS AND EXPECTATIONS ........................................................................................................ ‐ 15 ‐
3.2 TS 16949 ............................................................................................................................................... ‐ 17 ‐
3.3 ISO 14001 ............................................................................................................................................. ‐ 18 ‐
3.4 ODETTE/MMOG ..................................................................................................................................... ‐ 19 ‐
3.5 QUALITY SYSTEM ...................................................................................................................................... ‐ 21 ‐
3.6 TQM ..................................................................................................................................................... ‐ 22 ‐
4 EMPIRICAL STUDIES AND ANALYSIS ..................................................................................................... ‐ 28 ‐
4.1 DEFINE ................................................................................................................................................... ‐ 28 ‐
4.2 MEASURE ................................................................................................................................................ ‐ 29 ‐
4.3 ANALYSIS ................................................................................................................................................ ‐ 32 ‐
4.4 IMPROVEMENT ......................................................................................................................................... ‐ 34 ‐
4.5 CONTROL ................................................................................................................................................ ‐ 37 ‐
5 CONCLUSIONS ..................................................................................................................................... ‐ 38 ‐
6 DISCUSSION ........................................................................................................................................ ‐ 40 ‐
7 REFERENCES ........................................................................................................................................ ‐ 41 ‐

‐ Table of Contents ‐
IV
TABLE OF APPENDIX
Brose Customer Appendix 1
World Map over Brose Plants Appendix 2
Interview Guide Appendix 3
Q1 Scoring Thresholds Appendix 4
Organisation Chart Appendix 5
Customer Endorsement Letter Appendix 6
Customer Endorsement Matrix Appendix 7
Handbook to Q1 Implementation Matrix Appendix 8
Q1 Implementation Matrix Appendix 9

‐ Introduction ‐
‐ 1 ‐
1 INTRODUCTION
This section starts with the company presentation and further on presenting the problem in a problem discussion that leads to the purpose of the report.
1.1 CORPORATE PROFILE
The company presentation will guide you through the corporation of Brose, their history, their products and their way to produce.
1.1.1 HISTORY AND BACKGROUND
In 1908 Brose was founded in Berlin by Max Brose and was at first primarily a trading company for automotive accessories and aircraft materials. Today Brose operates and is partner to the international automotive industry and supplies more than 40 vehicle brands around the world, see appendix: 1. With 8,800 employees at almost 40 locations in 20 countries, see appendix: 2, Brose is world market leader in window regulators and door systems (Brose, 2006). Brose is also the European market leader in seat systems and has the third position in closure systems (Brose, 2006). Because of their large market shares there is in fact at least one Brose component in every fourth vehicle produced worldwide (Brose, 2006). During the time from 1908 until now Brose has been one of the biggest innovative firms on their market (Brose, 2006). Amongst several different innovations it has for example been world first with window regulators that could hold the glass in any position (Brose, 2006). In September 2000 Brose presents a seat adjuster mechanism at the International Frankfurt Motor show, the weight is only 28 grams (Brose, 2006).
In the summer of 2004 the construction of the Brose Group’s first Scandinavian production site in Gothenburg was started, see Picture 1.1. This plant in Gothenburg is a just in sequence plant (explained in chapter 1.1.3) that produces approximately 5,600 units each week for door systems. In 2006 there were about 50 employees, including the development and customer teams for the Swedish automakers (Brose, 2006), see appendix 5 for the current organisation chart.
Picture 1.1: The front side of Brose’s Gothenburg plant

‐ Introduction ‐
‐ 2 ‐
1.1.2 THE PRODUCT –
Brose divides its products in two categories, Technology for doors and Technology for seats. Those categories are further divided into components, systems and electronics.
1.1.2.1 TECHNOLOGY FOR DOORS
Brose both develops and produces all essential system and components for the automotive doors. The main product of the Gothenburg plant is a system solution consisting of different subcomponents, steel carrier plate, latch, window regulator, speakers and all surrounding systems. These different subcomponents are assembled onto the steel carrier plate creating the steel carrier plate system solution, see Picture 1.2 and 1.3. (Brose, 2006)
Picture 1.2: The steel carrier plate system solution Picture 1.3: The side‐door latch
1.1.2.2 TECHNOLOGY FOR SEATS
Brose’s products in seat technology have a wide range from manual adjustment component up to 18‐way power comfort seat systems, see Picture 1.4 and 1.5.

‐ Introduction ‐
‐ 3 ‐
Picture 1.4: The manual seat height adjuster Picture 1.5: The power multifunctional seat

‐ Introduction ‐
‐ 4 ‐
1.1.3 PRODUCTION
Brose’s plant in Gothenburg uses an extension of just in time that is called just in sequence (Brose, 2006). Just in sequence means that each component reaches the customer at the right time, in the right sequence, and in the appropriate version. This way of producing has become a necessity because of the changes in the automotive industry. The majority of components is not produced by the manufacturer but comes instead from suppliers with increasing number of responsibilities in the production, development and logistics (SAP AG, 2003). As the picture 1.6 shows, Brose only got 180 minutes from getting the sequence call until the delivery and line feeding starts.
Picture 1.6: JIS system at Brose Gothenburg
1.2 Q1
In the automotive industry the aim for continuous improvement plays a central role, Ford has taken this a step further. By introducing their own set of rules together with demands on different ISO certifications, Ford introduces Q1. Fords second edition Q1 system was launched in 2002 and is a set of fundamental quality and manufacturing disciplines which, when followed, ensures a supplier’s success and drives a supplier’s continuous

‐ Introduction ‐
‐ 5 ‐
improvement. Suppliers are expected to attain a certain mark, to put the tools in place to maintain excellence and to improve in every area with each passing year. Q1 is also a requirement from Ford if you want to be a successful supplier to Ford (Q1 second edition, 2003).
1.3 PROBLEM DISCUSSION
High quality has often been an important factor when manufacturing cars, but it has run with a parallel to low costs. The main thing suppliers struggle for is to meet or preferably exceed the car manufacturers needs, because of the high market competition. Car manufacturers have often been in the frontline of seeking new ways to solve problems and lead the way to new quality tools, as for example Just in Time production (JIT) by Toyota in the 1970’s.
Costs of poor quality impact on how the companies of today plan their strategy, partly to be more competitive against their rivals and partly more obliging to their customers. A car manufacturer can often choose and control a supplier; they can put demands on their supplier to have different diplomas and certificates. In the car industry the need for high quality has made many car makers to create their own grade labelling. Ford now requires its suppliers to be certified according to their own quality standard, Q1. To get Q1 status you first need to be certified according to ISO 16949, 14001 and MS 9000/Odette/MMOG. Besides these ISO certifications Ford has numerous expectations and demands that’s needs to be fulfilled to get and keep Q1 status.
As a supplier to Volvo, owned by Ford, Brose needs to have Q1 status to be competitive. At the time of this report Brose was certified according to ISO 14001 and was also aiming towards TS 16949. This is an important step for Brose which goal is to be certified with Q1 in the beginning of 2007. Brose has no standardized way to implement Q1 in their plants which can lead to higher costs and more problems during the implementation. These costs and problems might be avoided by using a standardized guide on how to implement Q1 in their plants.
A manager at Brose said that their problem when implementing new systems like ISO 14001 and TS 16949 are that they have not a structured working method with a time plan that shows the ongoing and coming steps that would help them through the implementation. The responsibility lies at the quality manager who does the most of the work and is not delegating any of the necessary routines. There way of working has though to this gone well and they have completed the most of their expectations in other certifications. They now want to minimize the double work of their daily routines towards Q1.
Brose now wanted us to create a standardised way on how to implement Q1, a guide on how you begin and a tool you easily can use in other factories with the smallest amount of effort or input to it.
‐ Introduction ‐
‐ 6 ‐
1.4 PURPOSE
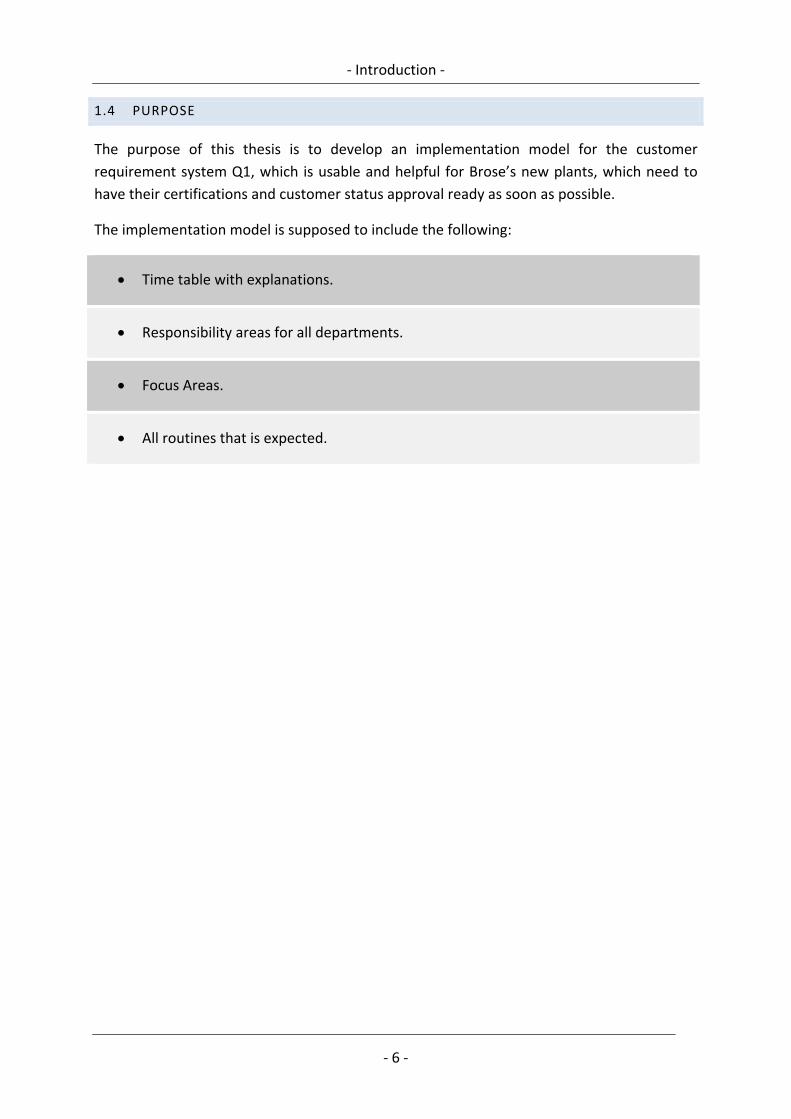
The purpose of this thesis is to develop an implementation model for the customer requirement system Q1, which is usable and helpful for Brose’s new plants, which need to have their certifications and customer status approval ready as soon as possible.
The implementation model is supposed to include the following:
• Time table with explanations.
• Responsibility areas for all departments.
• Focus Areas.
• All routines that is expected.

‐ Methodology ‐
‐ 7 ‐
2 METHODOLOGY
In this section a presentation of used methods for the report are introduced and how the procedures have been.
2.1 LITERATURE RESEARCH
According to Denscombe (2000) researchers should start by doing a literature research to get a greater understanding about existing knowledge in the chosen subject. To get a greater understanding of our subject we started to do an examination of the available literature. This was done at first by searching the two databases Lucia and Libris and continued further on with Emerald and Ebsco. Words used as criteria’s to find articles on our subject were “ISO 9001”, “ISO 14001”, “Q1”, “implementing quality system”. We also tried to use different composition and operators of these words to find additional articles on the subject as for example “Implementing ISO 9001 and ISO 14001”. There were some articles that were useful and applicable on our subject but the results varied and for written reports or other studies on Q1 we could not find anything helpful.
2.2 RESEARCH STRATEGY
Denscombe (2000) advocates that case studies are used to study things in detail and therefore gain valuable and unique insights about the research. Denscombe (2000) mentions that case studies concentrates on one or a few units with the purpose to get a deeper understanding for events, relations, experiences or processes that emerges in the particular unit. Denscombe (2000) also describes that the typical observation is chosen because of the possibility to apply results from the research on to other cases. This means that one result is possible to generalize onto the whole group.
Denscombe (2000) claims that survey studies are used when the researcher wants to have a wide range of data that gives a description of the present. Unlike the case study Denscombe (2000) claims that survey studies preferably uses a large number of research units to get a wide coverage of data. Further Denscombe (2000) writes that quantitative methods like surveys also makes it possible to generalize results onto other units but this method is heavily dependent on the number of research units, increasing number of research units increases the possibility to generalize.
Our interpretation of Denscombe (2000) is that if you only have few research units and want to get deep and unique insights into those or that research unit you should preferably choose case studies. We also interpret Denscombe (2000) as if you have a large amount of research units the obvious choice is to use surveys as the research strategy. Because our problem consists of one research unit (Brose Sweden AB, Gothenburg) that hopefully will give the possibility to generalize onto the whole Brose group we decided to use case study as

‐ Methodology ‐
‐ 8 ‐
our research strategy. Our choice to use case study is also supported by the fact that case studies give the researcher a deeper understanding of events and processes in the particular unit, according to Denscombe (2000).
According to Bergman & Klefsjö (2001) unwanted variation is a very important source for costs and unsatisfied customers. Bergman & Klefsjö (2001) continues to explain that elimination of variation can result in dramatic result enhancements which are the single most important issue for Six Sigma. They also mean that Six Sigma gives a systematic and structured way of working that often result in requisite enhancements.
This states that we will use the different phases in the DMAIC cycle and apply them to the case study and gain the benefits from both of these theories. The most important benefits that we will gain is the structural way of working from DMAIC and the possibility to generalize our results from a single research unit to the other plants in the Brose group.
2.3 THE DMAIC IMPROVEMENT PROCESS
Six sigma gives a systematic procedure to bring the requisites improvements. According to Brue (2002), Foster (2003) and Pande & Holpp (2001) DMAIC consists of five steps: define, measure, analyse, improve and control.
2.3.1 THE DEFINE PHASE
This is the first step in the improvement process. According to Pande & Holpp (2001) the team’s goal with the improvements are to identify and define the problem. The team must first answer an array of questions: What are we working on? Why are we working on this particular problem? Who is the customer? What are the customer’s requirements? How is the work currently being done? What are the benefits of making the improvement? This could easy be overviewed in a chart according to Pande & Holpp (2001). The chart usually contains:
• A business case: Why is this particular opportunity being chosen?
• Problem/opportunity and goal statements: What’s the specific problem or pain being addressed, and what results will be sought?
• Constraints/assumptions: What limitations are placed on the project or resource expectations being made?
• Scope: How much of the process and/or range of issues are “in bounds”?

‐ Methodology ‐
‐ 9 ‐
• Players and roles: Who are the team members Champion, and other stakeholders?
• Preliminary plan: When will each phase (D, M, A, I, and C) be completed?
When the questions have been answered a current status report is being done so everyone has the same picture of the process and to work from the same assumptions. We had our current status report orally because we were only two concerned of it and to save us time.
2.3.2 THE MEASURE PHASE
This is the second step in the improvement process. Pande & Holpp (2001) claims that this is the bridge between the define phase and the analysis phase which means that it is an important step to gather the right data and the right amount of it or else the bridge will collapse. The Measure step has two main objectives:
1. Gather data to validate and to quantify the problem/opportunity. Usually this is critical information to refine and complete the first full project Charter.
2. Begin teasing out facts that offer clues about the causes of the problem.
The output or outcome is the first priority from a DMAIC process, the end result of the process. It also best quantifies with the current problem because we find it to be a good method to use and a useful approach in our problem, the phases are there to build up a structure in our process. Some of the most important techniques in collecting data are how to collect data, and what sort of data. (Pande & Holpp, 2001). We will collect our data with interviews from different persons, which will be qualitative data to build a background and to observe Broses way to work.
2.3.3 THE ANALYSIS PHASE
Pande & Holpp (2001) describes the analysis phase in the DMAIC process as the team enhances its understanding of the process and problem and if all goes as intended they identifies the cause behind the problem. In some cases the root to the problem is evident. When they are, teams can move through analysis quickly. In other cases the cause is buried under years of work not documented or under a pile of paperwork. One of the principles of good DMAIC problem solving is to consider many types of causes, so that not past experiences cloud the team’s judgement. Pande & Holpp (2001) continues with to present the “5Ms and 1P”, often used to describe different types of causes to a problem:

‐ Methodology ‐
‐ 10 ‐
• Methods: the procedures or techniques used in doing the work
• Machines: the technology, such as computers, copiers, or manufacturing equipment, used in a work process.
• Materials: the data, instructions, numbers or facts, forms, and files that, if flawed, will have a negative impact on the output.
• Measures: faulty data resulting from measuring a process or changing people’s actions on the basis of what’s measured and how.
• Mother Nature: environmental elements, from weather to economic conditions, which impact how a process or a business performs.
• People: a key variable in how all these other elements combine to produce business results.
To use the right tools is one of the big challenges in the Analysis step, it differs, sometimes simple tools can solve a problem, as for example when analysing qualitative data while other times more advanced tools is necessary, when calculations might be required.
2.3.4 THE IMPROVE PHASE
In the improve phase new ideas to the problems have to be tested, refined and implemented. Sometimes even the problem has to be refined when new information raises, example from the testing. A good way to learn new ways of solving problems is to look at other companies or other groups in their business to see whether they can borrow solutions or ideas. Once several potential solutions have been proposed, more criteria come, including costs and likely benefits to decide the most practical solution. (Pande & Holpp, 2001)
2.3.5 THE CONTROL PHASE
In the control phase, measure and monitor result is as important as persuade and selling ideas for people, a long‐term relationship and impact in the way people work is a demanding and necessary effort to ensure that it lasts. The team and DMAIC Black Belts much complete these specific Control tasks:

‐ Methodology ‐
‐ 11 ‐
• Developing a monitoring process to keep track of the changes they have set out.
• Creating a response plan for dealing with problems that may arise.
• Helping focus management’s attention on a few critical measures that give them current information on the outcomes of the project (the Y) and key process measures, too (the Xs).
From the people standpoint, the team must:
• “Sell” the project through presentations and demonstrations.
• Hand off project responsibilities to those who do the day to‐day work.
• Ensure support from management for the long‐term goals of the project.
When the solution has been implemented it can seem difficult to walk away from a project, that the team has been working on in the lasts months. (Pande & Holpp, 2001)
2.3.6 QUANTITATIVE OR QUALITATIVE METHOD
Denscombe (2000) claims that there is no clear distinction between quantitative or qualitative research, primarily because they are not excluding each other. Nevertheless, the largest distinguishing factor between these two research methods is according to Denscombe (2000) the use of numbers or words as the analysis unit, where qualitative research usually uses words as their primary analysis unit. Denscombe (2000) also describes the qualitative method as well suited for small‐scale studies that describes events with a holistic view and that the researcher’s role in constructing data is important because the researcher is the tool that interprets all data. In contrast to qualitative research, quantitative research often uses numerical or statistical methods as the tool that interprets data. In contrast to the qualitative research, quantitative research uses numbers as their primary analysis unit according to Denscombe (2000).
Our problem requires us to do a descriptive research based on words and the research has to be influenced by the knowledge of the authors. With this in mind we decided to choose a qualitative research as the method for this project.

‐ Methodology ‐
‐ 12 ‐
2.4 DATA COLLECTION METHOD
Instead of just using literature as introduction to the research it can also have a more central role as the actual object for research. According to Denscombe (2000) literature can be used in research projects when it is used as background information or as a source for data. Denscombe (2000) claims that there are seven different subtopics in literature as a data source and one of them is books and journals.
Denscombe (2000) writes that interviews are a very attractive alternative for researchers because it seems easy to master. Although it seems easy to master Denscombe (2000) describes another scenario and argues that interviews are not only conversations. Instead of a simple conversation Denscombe (2000) describes interviews as a series of assumptions based on deep knowledge within the area of the interview. He continues to explain that interviews are used when the researcher needs in depths information on the subject. According to Denscombe (2000) there are two questions that the researcher should ask himself when deciding on doing interviews;
• Is in depth information necessary for the research?
• Is it reasonable to rely on so few sources? (Interviews cost more and takes more time than for example a questionnaire, therefore the same amount is almost never viable)
After having considered these two questions we came to the conclusion that comparing existing literature with interviews of key personal for implementation of Q1 would probably be the best data collection method. We also realized that we had assumptions on how to solve our problem that needed to be confirmed by someone who had existing knowledge.
The assumptions we had on how to solve the problem were:
• To divide the expectations so that it should be more clear
• To split the responsibilities in the department
2.5 INTERVIEWS
In this research we have used personal interviews to get a better glimpse of the subject. At the time we have done interviews we have used interview guides for our help. The guides where semi constructed, for the possibility to make follow up questions on the answers. As Denscombe (2000) indicates, semi constructed interview guides is to prefer if the researcher

‐ Methodology ‐
‐ 13 ‐
wants to be flexible when it comes to niche and develop in a visual purpose. The interviews where supported with the help from our interview guides in Appendix 3.
Trost (2005) accounts that there is often better that the interviewer works in a par if they ensembles. They can support each other under the interview while it becomes better and more information is usable. Trost (2005) continues to explain that on the other side the interviewee perhaps feels under pressure if the interviewer is two, when the subject is personal, while if the interviewer represent his business it can be polite if it is two interviewer. We decided both to be there at all interviews, easier to remember information and a great team together exceeds the disadvantages.
We determined to not use a tape recorder during the interviews. According to Trost, (2005) a tape recorder is for example useful if you are alone as an interviewer or if you are a poor hand writer. We decided instead that one of us should write down notes and at the same time try to support active in the interview.
To best comply with the purpose of this research we chose to interview persons involved in somehow with Q1 implementation, they should be at different positions or different companies to get a better and deeper understanding and many point of views.
Brose introduced us to Q1 and the project by helping us to find the brochure about Q1 and by showing us the SIM system, which is used by the supplier to report to the Volvo STA. Brose also helped us with names at Volvo and other supplier with Q1 status that we could contact. They then let us find our own way to help them. Brose wanted us to gather more information on how the implementation works, including tips and pitfalls.
2.6 RELIABILITY AND VALIDITY
A big aspect in scientific researches is to achieve a big agreement as possible between the theories and the empirical. (Andersen, 1998) Bell (2000) claims that validity is a measure on how a specific question describes or measures the same as it refers to. Befring (1994) describes it as whether the result is agreed with the desired result or if it has been influenced by other factors. Bell (2000) describes reliability as a measure to what extent an instrument or procedure can have the same result at different times. According to Befring (1994) reliability states to what degree of precision or failure.
Since this entire report is based on interviews and observations it is important to make it as reliable and valid as possible. To raise the reliability and the validity we therefore interviewed different persons at different companies or at different positions. We then tried to use their tips and not fall in the earlier mistakes to create as good result as possible with minimised risks.
During the interviews we always were two interviewers to minimize the risk of misunderstanding, one of us always typed down the answers to minimize the risk for loss of

‐ Methodology ‐
‐ 14 ‐
data. Afterwards we discussed the answer and typed the result of it so that we both had a complete awareness of the answers.
We have all the time both been aware of what the next step is supposed to be. A close discussion have made it clear for both of us, we therefore have had the chance to achieve a better work and concentrate our skills on the most important, to create a fully working matrix.

‐ Theoretical Frame of Reference ‐
‐ 15 ‐
3 THEORETICAL FRAME OF REFERENCE
In this section our used theoretical frame is being presented. These theories will be used later and will be the base for the analysis and the result.
3.1 Q1 REQUIREMENTS AND EXPECTATIONS
To receive and keep Q1 status there are numerous of requirements and expectations that have to be fulfilled. Key areas are capable systems and manufacturing site assessment, besides these two key areas there are also ongoing performance, customer endorsement and continuous improvement.
3.1.1 CAPABLE SYSTEMS
To even be considered for Q1 status suppliers need to have third‐party certification in TS 16949 or QS‐9000 and the ISO 14001 environmental standard. Suppliers also need to show compliance to MS‐9000, Odette or MMOG (Q1 second edition, 2003). The self assessment of MS‐9000, Odette or MMOG must be entered via GSDB online by 1st of August each year. If any of these certifications are revoked the Q1 status will be in jeopardy.
3.1.2 ONGOING PERFORMANCE
Ford measures ongoing performance with scoring thresholds and five key performance metrics. Depending on the site performance they gain or lose points according to the scoring threshold, see appendix: 4. Every new Q1 supplier starts of with 1000 Q1 points, these points are then recalculated and reported in SIM each month based on the most recent six month performance. In addition to these metrics manufacturing site assessment and warranty performance are also taken in consideration when calculating the monthly score. The five key metrics are listed below but manufacturing site assessment and warranty performance is explained in the following chapters.
• Field service actions; has Ford been forced to intervene because of supplier failure? (Q1 second edition, 2003)
• Stop shipments; Due to failure in product quality or availability, has vehicle rework, modification or reinspection been necessary? (Q1 second edition, 2003)
• PPM performance; Does a supplier deliver consistently high‐quality products? (Q1 second edition, 2003)
• Delivery performance: Does the supplier deliver products in time, at the right

‐ Theoretical Frame of Reference ‐
‐ 16 ‐
locations, in proper quantity and with the right information? (Q1 second edition, 2003)
• Violations of trust; has the Supplier Technician Assistance been informed of changes in the production, changes in equipment, supplier or sub‐supplier changes? (Q1 second edition, 2003)
Ongoing performance does not need to be in consideration during the implementation, but it is one of the most important part when achieved Q1 status. Although ongoing performance is not graded during the implementation you still need to have six month of a clean PPM record.
3.1.3 MANUFACTURING SITE ASSESSMENT
The manufacturing site assessment defines Fords quality requirements and is a key component of Q1. The meaning of the manufacturing site assessment is to evaluate supplier’s quality system and how well the site performs and plans for manufacturing process capability. In order to achieve and keep Q1 status the site need to demonstrate evidence for these fundamentals. For a specific list of the expectations on the manufacturing site assessment see appendix: 9.
To be able to receive and keep Q1 status suppliers need to be able to list evidence of each specific expectation to their STA on the manufacturing site assessment. The STA will have the possibility to base their decision on the self assessment that are reported in SIM or by doing an on site assessment of all points.
3.1.4 WARRANTY PERFORMANCE
Warranty performance is something that will be implemented in Q1 later on but as for now it is not implemented in the scoring threshold of the Q1 system.
3.1.5 CUSTOMER ENDORSEMENT
To be able to apply for Q1 status the supplier need to gather customer endorsements from the STA and from all your customers. An example of the endorsement letter and endorsement matrix is supplemented in appendix: 6 and 7.
3.1.6 BENEFITS FROM Q1
Having Q1 status as a supplier brings several benefits; the most valuable of them are recognition, publicity and advertising privileges, self‐certification, world excellence award and preferred status with Ford, see the explanation here:

‐ Theoretical Frame of Reference ‐
‐ 17 ‐
• Recognition; Q1 is a sign that your facility stands side by side with the best suppliers in the world (Q1 second edition, 2003).
• Publicity and advertising privileges; Q1 status allow you to publicize your company with the prestigious Q1 flag (Q1 second edition, 2003).
• Self certification; As a Q1 supplier, you will be eligible, with Supplier technician assistance concurrence, to self‐certify to the Production Part Approval Process requirements of QS‐9000 and TS 16949 (Q1 second edition, 2003).
• World excellence award; as Q1 supplier you will be eligible for world excellence award, which acknowledge the best of the best (Q1 second edition, 2003).
• Preferred status with Ford; this might be the most important benefit from having Q1 status. Preferred status with Ford gives your facility the possibility to come under consideration for development and sourcing of new products (Q1 second edition, 2003).
3.2 TS 16949
Prior to 1996 the automotive industry had as many quality standards as there were car producers. Suppliers could supply several of these car producers at the same time and it could be very problematic to comply with all of these different quality standards at the same time. This problem came to the automotive industries attention and The International Automotive Task Force was created in 1996 to resolve this problem. IATF Together with representatives from ISO‐TC 176 started developments towards the new standard ISO/Technical Specification ‐16949 started and today they are trying to adept ISO/TS 16949 to ISO 9001. The quality standards that were used to develop ISO/TS 16949 can here be seen: (Bergman & Klefsjö, 2001).

‐ Theoretical Frame of Reference ‐
‐ 18 ‐
• VDA 6.1 (Verband der Automobilindustrie) represents the German automotive industry
• EAQF (Référential d´Evaluation d´Aptitude Qualité Fournisseurs) represents the French automotive industry
• AVSQ (ANFIA Evaluation of Quality Systems) represents the Italian automotive industry
• (A)QS‐9000 represents the American automotive industry
3.3 ISO 14001
The Environmental Management Systems is an activity system for companies and organisations who want to run an affective and structured environmental work. The Management System constitutes a voluntary tool that should make the work easier, and the standards give a work model for constant improvements. (Morris, 2004)
To be certified with ISO 14001 the company requires to have identified the environmental aspects by their activity, put up goals for their environmental work and designed a program to reach the goals. It is necessary to have documented responsibility ratio and routines beside the recurring audit for the purpose to find opportunities and improvements. A god internal and external environmental communication is also important components. (Morris, 2004)
A certified Environmental Management System is not a warranty to ensure that a company have a small environmental impact. The manufacturing of environmental damaging products
VDA 6.1
EAQF
AVSQ
AQS‐9000
TS 16949

‐ Theoretical Frame of Reference ‐
‐ 19 ‐
can for example be environmental certified, assumed that the production fulfils the requirements for the certification. (Morris, 2004)
3.4 ODETTE/MMOG
One area with significant development progress is material management. As automotive original equipment manufacturers seek to balance production with demand, it is paramount that right supplier are at the right plant at the right time for production to stay on‐schedule. For automotive suppliers that argue delivery performance must be perfect. If supplier delivery performance is faulty penalties are appointed.
Industry collaboration has delivered standardized rules for material management which intended to improve efficiency and accuracy, as well as reduce costs from errors and waste. Insights from early adopters suggest that these standards serve their purpose, and more. For example it was recognized that effective and efficient materials management can help minimize supply‐related risk, from overstocking to getting the wrong components. To get a handle on material management Ford motor company created materials system requirements and Volvo put logistics evaluation documents in place.
Automotive Industry Action Group in North America and Odette International in Europe took note of these rules and guidelines that were created, and the fact that each manufacturer had different set of rules and guidelines. These trade groups took on the task to establish material management standards for their respective regions.
In 2004 these trade groups took the standardization a step further and compiled a single standard issue: the joint global Materials Management Operations Guideline/Logistics Evaluation (MMOG/LE). Today Global MMOG/LE principles are being used by the automotive industry to help ensure effective and efficient management of materials that saves time and costs. The Global MMOG/LE uses a self‐assessment help identify what process adjustments that are needed for world‐class function. The self assessment is also mandatory to be able to apply for Q1 as a supplier for Volvo. See picture: 3.1.

‐ Theoretical Frame of Reference ‐
‐ 20 ‐
Picture 3.1: Supplier Audit Policy.

‐ Theoretical Frame of Reference ‐
‐ 21 ‐
3.5 QUALITY SYSTEM
A quality system is a tool to use to control and improve the quality on the company’s products. The quality system includes everything from methods and routines to organisation and responsible distribution. The common denominator is that they control and affect the quality. (Berggren, Grubb, Holländer, Kinde, Mellby, Severinsson Skog, 2001)
To secure the quality in the company products the quality system must include and control all the essential parts of the business. Customer and authorities often puts a demand on the supplier’s product and the quality system content and function. The company management have the responsibility to have an updated, effective and an affective quality system. (Berggren et al. 2001)
When implementing a quality system in a company a systematic long‐term work is necessary to achieve a good result. In the beginning of the implementation an overview over fundamental questions about the company activity and the structure is essential. When the quality system is introduced a continuous work is required to complement and improve the system. The system requires documentation as far it possible and should be a support in the daily business; it could also work as a base for the audits. (Berggren et al. 2001)
A certification for a company quality system means that an independent accredit organisation makes an assessment about the requirements in for example ISO 9001. (Berggren et al. 2001)
A company’s main task is to produce goods and services and to fulfil the customer’s needs, demands and expectations. All company’s have a main process that goes from identification of customer needs to a complete product. This main process can often be divided into a system of processes that is depended on each other. (Berggren et al. 2001)
When a quality system is implemented it is important to identify the company processes and to establish the order and collaboration between the processes. You also have to decide which criteria and methods that needs to make sure that the processes can be controlled, functioned, supervised, improved. (Berggren et al. 2001)
The purpose with standards for quality system is not to ensure that all companies have the same quality system, which is impossible, instead they should be built on the same principles and fulfil some fundamental requirements. The quality system must be adjusted to the company situation, which means that it should not be more complicated than the activity requires. Although sometimes can a customer or authority require that the company clear can show that they fulfils the demands, often the quality system is computerized. (Berggren et al. 2001)

‐ Theoretical Frame of Reference ‐
‐ 22 ‐
3.6 TQM
Dale and Bunney (1999) describe Total Quality Management (TQM) as very hard to define because of the various definitions that exist. Although TQM is very hard to define there is common ground between these definitions.
Systems for improving quality and quality management has improved rapidly during the last decades, from simple inspections to refined versions of quality control and quality assurance, and now most companies are working towards TQM according to Dale and Bunney (1999).
Total Quality management requires that the principles of quality management should be applied in every branch and at every level in the organization. It is a company‐wide approach to quality, improvements undertaken on continuous basis by everyone in the organization.
3.6.1 KEY ELEMENTS OF TQM
Despite all different views on what constitutes TQM, there are key elements in various definitions that need to be summarized. Dale and Bunney (1999).
3.6.1.1 COMMITMENT AND LEADERSHIP OF SENIOR MANAGEMENT
Without the total commitment of the senior management, nothing much will happen and anything that does will not be permanent. The senior management has to be the ones that provides directions and exercises a forceful leadership. Although the senior management uses a forceful leadership nothing should be forced, everything should come naturally. Dale and Bunney (1999).
3.6.1.2 PLANNING AND ORGANIZATION
Planning and organization is featured in a number of areas of a continuous improvement process as listed below:
• Developing a long term strategy for TQM which is integrated with other strategies such as Information Technology, Production/Operations, Human resources and business plans of the organization.
• Building product and service quality into designs and processes.
• Developing prevention‐based activities.

‐ Theoretical Frame of Reference ‐
‐ 23 ‐
• Putting quality assurance procedures into place which facilitate closed loop corrective action.
• Planning the approach to be taken for the effective use of quality systems, procedures and tools and techniques, in the context of the overall strategy.
• Developing the organization and infrastructure to support the improvement activities.
• Pursuing standardization, systematization and simplification of work instructions, procedures and systems.
Dale and Bunney (1999)
3.6.1.3 USING QUALITY MANAGEMENT TOOLS AND TECHNIQUES
To support and develop a process of continuous improvement an organization will need to use a selection of tools and techniques. The tools and techniques should be integrated into the routine operation of the business and the tools and techniques that are intended to be used should be presented in a route map. Dale and Bunney (1999). Examples of recommended tools are:
• Benchmarking
• FMEA (Failure Mode and Effects Analysis)
• Flow charts
• QFD (Quality Function Deployment)
• One or several of the seven management tools
• SPC (Statistical Process Control)
3.6.1.4 EDUCATION AND TRAINING
‐ Theoretical Frame of Reference ‐
‐ 24 ‐
To ensure the general awareness of quality management, skills and attitudes employees should have the right level of training and education. A formal programme of education and training needs to be planned and provided on a timely and a regular basis to ensure the general awareness of quality amongst the employees. Dale and Bunney (1999).
3.6.1.5 INVOLVEMENT
There must be a commitment to the development of employees, with recognition that they are an asset which will be appreciated over time. To achieve broad employee interest, commitment and contribution to the continuous improvement process all available means from suggestion schemes to various forms of teamwork must be considered. For example, part of the TQM process is to ensure that every employee is aware of what is required of them and how their process affects the business as a whole. Dale and Bunney (1999).
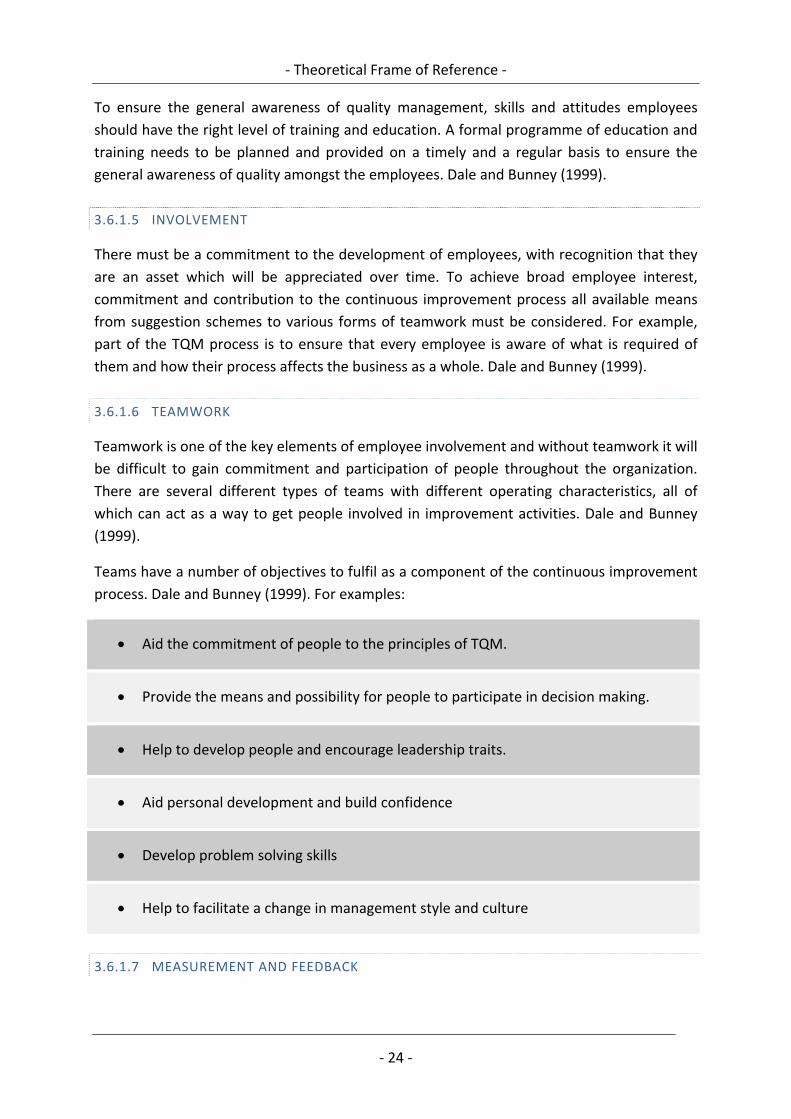
3.6.1.6 TEAMWORK
Teamwork is one of the key elements of employee involvement and without teamwork it will be difficult to gain commitment and participation of people throughout the organization. There are several different types of teams with different operating characteristics, all of which can act as a way to get people involved in improvement activities. Dale and Bunney (1999).
Teams have a number of objectives to fulfil as a component of the continuous improvement process. Dale and Bunney (1999). For examples:
• Aid the commitment of people to the principles of TQM.
• Provide the means and possibility for people to participate in decision making.
• Help to develop people and encourage leadership traits.
• Aid personal development and build confidence
• Develop problem solving skills
• Help to facilitate a change in management style and culture
3.6.1.7 MEASUREMENT AND FEEDBACK

‐ Theoretical Frame of Reference ‐
‐ 25 ‐
Measurement needs to be made continually against a series of key results or performance indicators – internal and external. The approved measurements and indicators should be developed from existing processes and customers. By using already existing processes and customer certain checkpoint can be developed by using a roadmap with belonging action plans that is used to correct faulty values. Dale and Bunney (1999).
3.6.1.8 WORKING TOGETHER
It is very important to create an organizational environment that is beneficial for the continual improvement process and where everyone can participate. By changing people’s behaviour, attitudes and working practice there will be possible to integrate quality assurance into all of an organizations processes and functions. Although it is very important to change peoples behaviour and attitudes it will be one of the hardest tasks that there is within a company. Dale and Bunney (1999).
3.6.2 TOWARDS TQM
Joseph Juran advocates that reducing the cost of quality is a must to be successful in the length. Juran’s ten‐point plan is a milestone towards reduced cost of quality and total quality success. Dale and Bunney (1999). Juran’s 10 points are:
1. Build awareness of the need and opportunity for improvement
2. Set goals for improvement
3. Organize to reach the goals
4. Provide training
5. Carry out projects to solve problems
6. Report progress
7. Give recognition
8. Communicate results
9. Keep the score

‐ Theoretical Frame of Reference ‐
‐ 26 ‐
10. Maintain momentum by making annual improvement part of the regular system and processes of the company
3.6.3 CUSTOMER LOYALTY – CUSTOMER SATISFACTION
Jones & Sasser (1995) says that it is more profitable to keep the existing customers rather than all the time has to try to search for new ones. In the study from Jones & Sasser (1995) the result was that if you can be able to raise the customer loyalty with 5 % your profit can increase with 25–85 %. The study also includes an estimate of the cost to generate a new customer and compare this with the profit from year to year. Jones & Sasser (1995) refers to studies that show that it costs six times as much to sell to a new customer rather than an existing.
Many managers realize that the more competitive the market, the more important the level of customer satisfaction is in markets where competition is intense, such as hard and soft durables, business equipment, financial services, and retailing, see picture 3.2. Jones & Sasser (1995).
Loya
lty
Satisfaction
Airlines
Hospitals
Automobiles
Personalcomputers
Customer Loyalty – Customer Satisfaction
Low
High
Low High
Picture 3.2: The figure shows the relation between customer loyalty and customer satisfaction in different

‐ Theoretical Frame of Reference ‐
‐ 27 ‐
businesses. The figure is designed on the basis of Jones and Sasser (1995).
Making the first sale to a customer is often very expensive. It takes a lot of time, advertising and promotions. A big mistake too many businesses make is focusing on selling more to first‐time buyers rather than try to build up sales with existing customers. Jones & Sasser (1995).
‐ Empirical studies and Analysis ‐
‐ 28 ‐
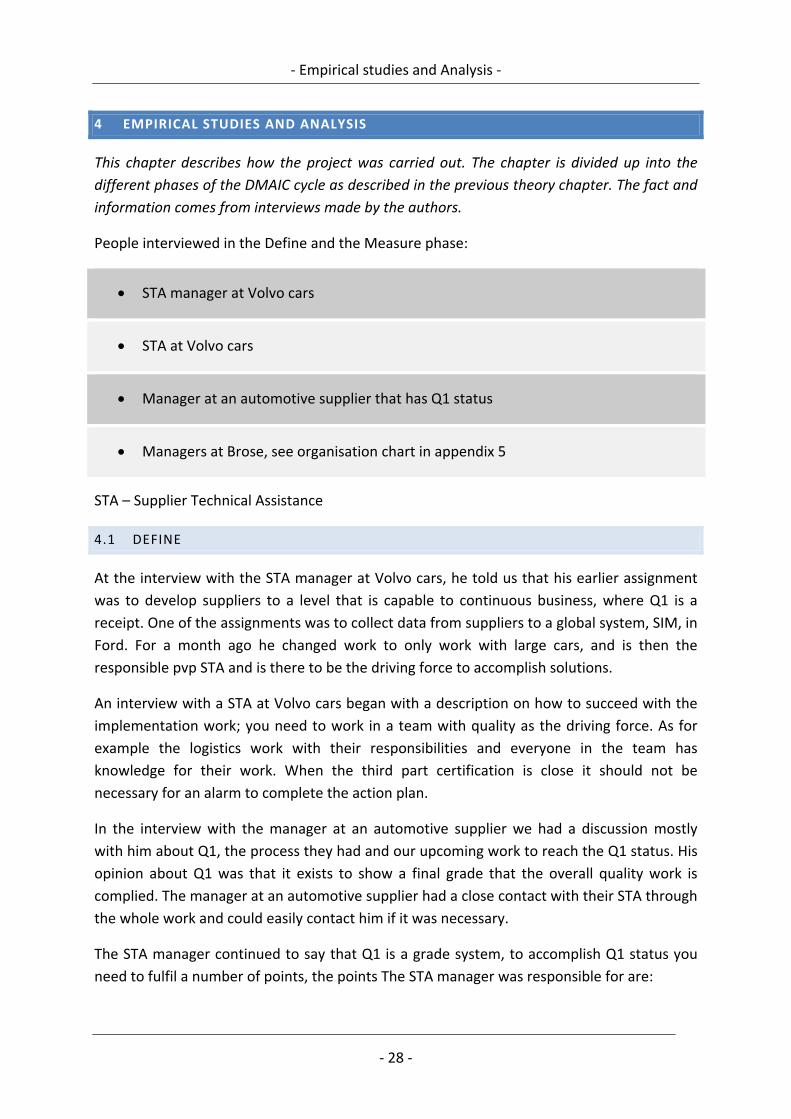
4 EMPIRICAL STUDIES AND ANALYSIS
This chapter describes how the project was carried out. The chapter is divided up into the different phases of the DMAIC cycle as described in the previous theory chapter. The fact and information comes from interviews made by the authors.
People interviewed in the Define and the Measure phase:
• STA manager at Volvo cars
• STA at Volvo cars
• Manager at an automotive supplier that has Q1 status
• Managers at Brose, see organisation chart in appendix 5
STA – Supplier Technical Assistance
4.1 DEFINE
At the interview with the STA manager at Volvo cars, he told us that his earlier assignment was to develop suppliers to a level that is capable to continuous business, where Q1 is a receipt. One of the assignments was to collect data from suppliers to a global system, SIM, in Ford. For a month ago he changed work to only work with large cars, and is then the responsible pvp STA and is there to be the driving force to accomplish solutions.
An interview with a STA at Volvo cars began with a description on how to succeed with the implementation work; you need to work in a team with quality as the driving force. As for example the logistics work with their responsibilities and everyone in the team has knowledge for their work. When the third part certification is close it should not be necessary for an alarm to complete the action plan.
In the interview with the manager at an automotive supplier we had a discussion mostly with him about Q1, the process they had and our upcoming work to reach the Q1 status. His opinion about Q1 was that it exists to show a final grade that the overall quality work is complied. The manager at an automotive supplier had a close contact with their STA through the whole work and could easily contact him if it was necessary.
The STA manager continued to say that Q1 is a grade system, to accomplish Q1 status you need to fulfil a number of points, the points The STA manager was responsible for are:

‐ Empirical studies and Analysis ‐
‐ 29 ‐
• Warranty Spikes, in case that a supplier has caused an error on the field, they have not been sticking to their agreement.
• Field service action, as for example if you are forced to call back the cars an input to system is necessary.
• Stop shipment. If the supplier causes a stop in the production an input to the system is necessary.
• Violation of trust, if it should come forward that the supplier withholds information an input to the system is necessary.
The STA manager continuous to tell that the expectation that Q1 has is to give support to the supplier so it will be easier to solve problems, if the supplier can’t support Ford or Volvo when a problem occurs they will loose the Q1 status. Partnership and knowledge about and with the supplier is highly prioritised. If the supplier should be disqualified the SIM system shows that the supplier is revoked. Another problem that a supplier can loose the Q1 status by is that they have a wrong attitude that can’t keep up with level of quality. Before the supplier gets revoked a dialogue between themselves are made to see if there is a solution.
The automotive supplier has fulfilled the Q1 status since 2002 according to the manager, the relationship has not been better after the automotive supplier implemented Q1. Since the beginning of the production towards Volvo the relationship has gone from a personal and close relationship to a more distant relationship that endures more numbers.
When the manager at an automotive supplier started with the implementation of Q1 they started to go through the MSA together with the STA to evaluate all the expectations and to see if they had to change anything, The manager at an automotive supplier had already fulfilled many of the expectations already since before, so they did not need to change that much.
Today the manager at an automotive supplier says that they have meagre controls outside the SIM to see if they fulfil the expectations for Q1, and their work procedure has not been controlled by the STA from Volvo since the first control.
4.2 MEASURE
The STA manager carried on with how to precede the work to initiate Q1. A commitment is written so that the supplier gets a full understanding of what Q1 is going to mean for them. The work continuous by the management team, including Factory manager, Quality manager and the Production manager. From a flowchart they together go through what it means with

‐ Empirical studies and Analysis ‐
‐ 30 ‐
zero wrong. The next step that they have to achieve is to establish a plan with the coming work that is necessary to achieve Q1 status.
The STA manager says that the management team agrees which part that can be scheduled to drive parallel, from that the Quality manager makes a plan. To make the work with a good performance it is necessary that the continuous work is a part of the daily work and a part of the management agenda, QOS.
The STA says that before you begin towards Q1 the Capable Systems, TS16949, ISO 14000 and Odette is expected to be completed. Odette is a rate in SIM. The Focus is then towards the MSA, The STA says that if this is completed the rest will be covered.
The STA implied with the fact that TS 16949 and Q1 MSA has many similar expectations, it is easy to follow the similarity in TS 16949.
The STA manager says that quality is as much as sensitive that it is a significant output from all those involved, from operators all the way up to the management. An operator that has been misled by instructions can easily make a mistake which then will have an effect that influence a great part of the production, which then also will effect the quality.
The STA manager says then when the supplier has implemented the systems they need, they then will have to show that they can and are using it, both by working and communicating at the right way and by a high precision in delivery and output.
If the STA finds something that is mismatched from the expectations they will not revoke the supplier immediately, they will let the supplier fix their problems from action plans. The STA points out that it is much better to raise the supplier with positive stages than cutting them at their feet’s.
The STA says that for the most the supplier works by themselves while the STA comes at the end and checks if everything has gone as planned, the STA walks around in the plant and see how everyone works. The most work lies in the MSA, both for the STA and the supplier. The STA likes to take a random sample that has been brought up on the management meetings.
The STA says that a good start when implementing Q1 is to have a full overview over the process and to complete evidence for the MSA. A reminder is that everything is not related with PPM, the suppliers work is in fact the job we continue to exist on.
An advice from the STA is to have a good system for the process flows and the FMEA. A clean factory is much more appreciated from the customer and the STA. Easy to follow and easy to see the work instructions are pleasant; even if the workers might not need them they should always be there.
The STA says that work instructions are highly strict and are in line with the actual production and work. An action plan that has control over the process is necessary.
‐ Empirical studies and Analysis ‐
‐ 31 ‐
The STA manager continuous by explaining a few tips regarding implementing, the expectations needs to be more precise to goals that can me measured, and that it can be a good plan to cross through different sites, benchmarking. A view between the plan and the reality is necessary for a success, and that the co‐workers feel for their work and that they are conscious and that their selves can help if they do right and cause if they do wrong.
The STA manager says that a tip is to start with yourselves and your daily work to see how much time that is putting on quality. Does the management work on the right way? It is enough to go into QOS to see if its quality or economic on the agenda. It should also be a clear connection between quality, production and the co‐workers. What is the subject of speech in the mornings? The rate or first time through. The operators have a big and important responsibility when they then have the final assignment to carry through their work at the right way.
The STA mentions that it is important if you want to keep Q1, complemented improvements should be a continuously force all the way from the management to the operators.
The STA manager says that an improvement that sometimes is a wish from the customer is when the supplier gets stressed and is short of time it is easy to loose communication between the supplier‐customer, it is important to keep it on a high level. It is necessary to have parameters of control and to be able to transfer the verbal that is coming up to measurable goals and then have a plan about who is doing what.
The STA says that when Q1 status has been proven, the stability in the PPM lights up where you are and is highly important.
The manager at an automotive supplier says that their PPM has been discussed over the years and if it has deviate outside the limits it has been discussed with the STA at Volvo; the discussion has been about trying to solve the actual problem and future problems.
The STA says that the supplier has been divided into a group from one to four, dependent on what they produce and how important it is to the customer, also their history of producing influence, if they have good PPM. This is done to control how the supplier works with the MSA.
• 1: Have control twice a year from the STA, characteristics for these suppliers is that they have though commodities, bad deliveries or has new deliveries.
• 2: Have control twice a year from the STA, characteristics for these suppliers is that they have not so good commodities and not so god delivers.
• 3: Have control once a year from the STA, characteristics for these suppliers is that

‐ Empirical studies and Analysis ‐
‐ 32 ‐
they have slightly higher PPM than group number 4.
• 4: Have control once a year from the STA, characteristics for these suppliers is that they have small articles and a good PPM.
The STA says that work instructions are highly strict and are in line with the actual production and work. An action plan that has control over the process is necessary.
The STA continuous to say that at the end the final product is most important and if the supplier uses FMEA and has good PPM it is often a good start, especially from a small supplier. For an example the STA mentions a small company where he is STA, they have had a lot of trouble for many years, but has finally come down to 3 PPM after implemented new systems such as FMEA. An easy way to see if the production is running smoothly and the workers is following the instructions can be made by following the production from scratch, one product from the start of the assembly to the end, go through every point in the line until it has reached the final stage.
The STA says that mistakes that easily and often is missed when implementing Q1 is the contact with the sub supplier, the gage calibration, PPM and FMEA. If it is a high lack of frequency by the workers, it is important to be able to have education with the employees to make them stay so they can use their competence. A big mistake that easily is missed is the continuous work from the management meetings, where updates are made and the base for all work comes from.
4.3 ANALYSIS
When implementing a new system there have to be an understanding of why this is done throughout the employees. An engagement from all departments needs to be made and an understanding of what is crucial to be accomplished for a successful business. Meetings and presentations are necessary to use to inform the employees and to make Q1 an important issue. Awareness is so important and crucial to succeed with a system implementation, that continuous meetings and follow ups is most likely to be arranged every week or every second week. The result needs to be reported and feedbacks need to be made. This is also confirmed by Dale and Bunney (1999) and Juran’s 10 points.
A timeline and planning schedule is essential to succeed with the implementation work. It should be general and specific with deadlines for all steps. The work should also be delegated through the entire organisation to the relevant division. This is needed to be done to raise the understanding and the engagement for the workers; if they feel they have more responsibility and that they are doing an important issue for the company they will be more satisfied. The employees perhaps need more training and education to keep up there work. This is also confirmed by Juran’s 10 points.

‐ Empirical studies and Analysis ‐
‐ 33 ‐
Dale and Bunney (1999) agree that the implementation work needs to start at the managers showing that this is an important step to a better future in the business. Q1 is a tool to use to control yourself and a certification to show your customer that you follow their expectations on how to work. If all the employees have an understanding of what this means and has a working plan on how they should work with actions plans and work instructions they are well prepared for the customers expectations. It needs to be clear that the responsibility does not lie at the Quality manager; every department has their own responsibility to make Q1 work and succeed in the company.
Continuous improvements are an ongoing process and Q1 is there to control and help this process to work. The STA is supposed to be a helpful hand through the process and also checks and controls if the expectations are followed. In the beginning the STA and the supplier together gather information on what they need to fulfil and change if necessary to apply with the expectations.
The requirements or certifications that need to be completed to achieve Q1 status are TS 16949, ISO 14001 and Odette. The most important thing in the implementation work towards Q1 beside the certifications is to work according to the MSA and have a PPM that fulfils the demands. Q1 and TS 16949 are similar according to some aspects; those will be presented in next chapter. A good way to work is trying to combine the implementation work of ISO 16949 and Q1 because they are related to each other and they both give and take from one another.
Q1 is a demand from the customer to the supplier to raise the corporation between them both, to build a greater bond between them. In theory there are many demands and expectations that the supplier needs to follow, who will loose Q1 status if not followed, and the possibility to keep producing new products to the customer. According to Edvardsson et al this is a way to build up customer loyalty. In practice the STA instead of revoking them he tries to communicate with the supplier to solve certain issues, it is almost always better to help and try solve problems and find solutions rather than to cancel a relationship. In most cases the existing supplier is better to deliver right instead of trying to find a new supplier. This is also supported by Dale and Bunney (1999).
Communication between supplier‐customer is always important, even if the supplier gets stressed or feels that they don’t have control over their production they need to continue to have a working relationship. A high‐quality dialog is necessary to have for a working business to business cooperation. The customer needs to feel that the supplier works for the best interest of the customer, this is also aligned with Dale and Bunney (1999).
Quality is a significant output from all those involved, from operators all the way up to managers. The easiest effect by a mistake is often seen in the production, it could have happened by a mistake in the instruction plans, a mistake when the operators were lectured or a mistake by the operator, although the effect of quality will be remarkable sustained. If a

‐ Empirical studies and Analysis ‐
‐ 34 ‐
mistake at the managers are made it will often take longer until the effect is seen through the company.
When Q1 has been proven the most important factor is PPM, it lights up where you are and is easy to measure and to control for the customer. If the goals isn’t fulfilled a problem‐solution discussion with the customer is necessary to make an overview of what is needed to be changed.
At the end certifications and diplomas will not automatically create a good product, but it can help by implementing control processes, for example by using FMEA when finding failures in a product or DMAIC when working on a project. Certifications are both for the supplier and the customer. Positive for the supplier is that he gets more control over their production and processes when implementing new certifications with audits. The customer gets a receipt or certification from the supplier that the supplier works towards consistently improvements, not only at the production but even at the managers.
A system that is created from the customer that is supposed to be for use by the supplier often involves high costs and effort in form of manpower from the supplier. It is not always a system like this is good for a business, the focus is often not at the main process and instead it can be at material handling or meetings discussing irrelevant forms, the focus need to be clear and understood from all parts, which also is according to Dale and Bunney (1999).
4.4 IMPROVEMENT
In the improvement phase we will discus the problem areas and a solution for these problems.
4.4.1 IDENTIFIED PROBLEM AREAS
Earlier work towards Q1 within Brose has according to our research and knowledge several problem areas. These problem areas are not only because of faulty routines from Brose but also lack of information from Volvo. We discovered the following problem areas:
• No clear responsibilities, quality manager is often responsible for everything regarding Q1.
• No clear timetables for Q1 implementation
• No clear action plan of what needs to be done to achieve Q1
• No clear linkage between TS 16949, ISO 14001 and Q1 which has lead to bigger work

‐ Empirical studies and Analysis ‐
‐ 35 ‐
loads than necessary
• No real understanding of Q1
• Odette approvals are problematic to achieve
4.4.2 IMPLEMENTATION MODEL
To solve these problems we constructed this report and a supplemented matrix, see appendix: 9. The purpose with the report is to give you an understanding of the elements of Q1 and how we managed to construct a solution. By reading the report you will have the necessary understanding and knowledge to start your work towards Q1.
We found that a lot of the Q1 required routines is also required by TS 16949 and/or ISO 14001. The similarities between ISO 14001, TS 16949 and Q1 is one of the biggest improvements that our matrix can offer because of this we will be able to finish a lot of the required routines for Q1 and TS 16949/ISO 14001 simultaneously and therefore decrease the total workload. We also managed to distribute responsibilities for all the Q1 routines, which will solve the problem concerning that the quality manager often is responsible for everything regarding Q1. All of the Q1 routines are distributed by the organizational scheme and gives us the possibility to use those who are most qualified for each separate task.
Odette is one of the certifications that are required along with TS 16949 and ISO 14001 but according to our experience Odette is problematic to achieve by your self. Our recommendation is to contact your logistic representative from Volvo and they will sit down for a day or two and help to complete all routines that are required. By doing this you will be able to reduce the workload for the Odette certification.
By reading and having interviews with managers at both Volvo and Brose we managed to compile a timetable that is adapted for Brose Gothenburg but would be very easy to adept to any organization that are in need of help for Q1 certification. The timetable is not a précis one but rather a guide with milestones that are very important to manage and to fulfil.
4.4.3 COSTS & SAVINGS
The savings that will come thanks to our guide and work for Brose is very hard to predict because the future in the automotive industry is very hard to predict and these savings is very dependable on the future success of Ford, Volvo and Brose. Our calculations are based on our own thoughts and are for now very likely to happen. The approximations of our costs is based on the work that we have done to be able to understand Q1 and in that way construct the guide that in the end will help Brose.

‐ Empirical studies and Analysis ‐
‐ 36 ‐
We believe that our work and the work with our guide will give Brose savings around 42,000 – 52,500 EUR during a period of 10 years. As we believe there should take approximately one employee at least 1 – 2 months of part time work to get the understandings about Q1 that are necessary to be able to implement Q1 in a successful way. A project group, one from each department needs to spend about 128 hours together into Q1 implementation; we have approximately saved them half of their work, 64 hours. And because Brose is a successful company that has great potential we believe that they will have approximately 4 – 5 new Ford sites that needs to have Q1 status in a period of 10 years. This assumption is based on the success of Volvo, the reorganisation of Ford and the very likely growth of Brose. Our guide should reduce the workload of the person whom is responsible for Q1 implementation with about 1 – 1.5 months part time work. This gives the calculation for our potential savings:
One person working part time with Q1 for 1 – 1.5 months 4,000 EUR
Project Group, time saved 64 hours 3,500 EUR
Other costs (such as travelling expenses, telephone calls etc) 2,000 EUR
Troubleshooting and Rework 1,000 EUR
Summary 10,500 EUR
These cost savings will be done at each new site that will be required to have Q1 status which according to our believes there should be about 4‐5 sites.
4 sites * 10,500 EUR = 42,000 EUR
5 sites * 10.500 EUR = 52,500 EUR
Then the total saved amount would be about 52,500 EUR on the 5 new sites.

‐ Empirical studies and Analysis ‐
‐ 37 ‐
4.5 CONTROL
The work from our implementation matrix and our way of working during the implementation towards Q1 has been successfully approved by the STA at Volvo cars. There were no drawbacks or changes that needed to be made. Therefore we can say that the matrix and the comparison between TS 16949, ISO 14001 and Q1 has made the implementation work less demanding for the plant, the next plants don’t not need to go through all points in Q1 because it has similarities in the other systems.

‐ Conclusions ‐
‐ 38 ‐
5 CONCLUSIONS
In this chapter our conclusions and most important recommendations are stated.
We believe that our matrix and this report will be a great asset for all Brose sites that must be Q1 certified in the future. Our biggest expectation from the matrix is that the similar routines with the TS 16949 and the ISO 14001 are pointed out which then makes less double work in the future. The timetable and the easy step by step handbook will also be a guide through Q1 in a simple way. By this report we state out that Q1, TS 16949 and ISO 14001 can be implemented at the same time, it will both save time and money.
Coming in to the automotive industry we believed that everything regarding quality would be taken very seriously, and most quality issues were. But when we increased our knowledge about Q1, TS 16949 and ISO 14001 we actually became astonished when seeing all the correspondence between Q1, TS 16949 and ISO 14001. Because of all the correspondence routines between Q1 and TS 16949 we asked ourselves what the meaning of Q1 was.
After having performed interviews, meetings and a lot of literature studies we came to the conclusion that Q1 will not gain suppliers in any way besides those advantages that Ford has stated in their brochure about Q1: see our Theory chapter for further information.
• Recognition
• Publicity and advertising privileges
• Self certification
• World excellence award
• Preferred status with Ford
We believe that the only true reason for Ford to implement Q1 as one of their supplier demands is to gain more control and to tie their suppliers even closer. By gaining more control and getting more dependant suppliers Ford will have huge advantages when negotiating prices and setting terms for contracts. According to our believes this situation will in the long run make several suppliers to not be able to do profitable business with Ford and because that these suppliers will be so dependent on Ford they will not be able to be flexible and might in worst case be forced to shut down their operations that are tied to Ford.

‐ Conclusions ‐
‐ 39 ‐
We also believe that by following Fords demands (not only regarding Q1) there will be even more demands in the future. To avoid these problems and those stated above, suppliers have to make Ford aware of the increased costs that come with these routines and demands.
1. Force Ford to cancel these demands and suppliers will be able to continue to supply Ford under the same pricing.
2. Continue to comply to Fords demands but then suppliers have to increase their pricing for supplied products
As our final conclusion we believe that putting these demands on suppliers will gain Ford in the short term but might not be so profitable for them in the long run.

‐ Discussion ‐
‐ 40 ‐
6 DISCUSSION
In this chapter we will discuss about our report, what could have been done different?
The report has been our final project at the university while therefore we wanted to use our knowledge in a real life project. Our purpose was to help Brose with the implementation work of the Ford supplier requirement, Q1. With just only one brochure about Q1 we had to interview a few people to get more knowledge together with tips and tricks to have as smooth implementation as possible.
The persons that we interviewed at Volvo, the STA’s, had a very positive attitude towards Q1, there feeling that this was a working system for the supplier and a needed status might have had an affect on us. When we discussed it with a supplier he had a different view on the system and said that their relationship with Volvo had been less personal since the Q1. Q1 is a required status for a supplier while therefore at the moment is a necessary implementation for a factory.
The reliability and validity have been a concerned regarding the people we have been interviewing. Sometimes they had different opinions and facts. We could have solved this by interviewing more suppliers and more STA’s, but the timeframe did not allow that together with none cooperating suppliers to Volvo.
We need to highlight that our compared points with Q1, TS 16949 and ISO 14001 might not have the exact similarity but it has the same meaning and significance.
As a final word for this project we would like to point out that we think if the handbook together with our Matrix is used; the time and cost effort will be very positive for the factory.

‐ References ‐
‐ 41 ‐
7 REFERENCES
In this section a presentation of used references for the report will be introduced.
Andersen, I. (1998). Den uppenbara verkligheten ‐ Val av samhällsvetenskaplig metod. Lund: Studentlitteratur.
Befring, E. (1994). Forskningsmetodik och statistik. Lund: Studentlitteratur.
Bell, J. (2000). Introduktion till forskningsmetodik. Lund: Studentlitteratur.
Berggren, Grubb, Holländer, Kinde, Mellby, Severinsson & Skog. (2001) 9000 Goda råd ‐ att bygga ett kvalitetssystem i företag. Mölndal: IVF.
Bergman, B. & Klefsjö, B. (2001). Kvalitet från behov till användning. Lund: Studentlitteratur.
Brue, G. (2002) Six Sigma for Managers. Blacklick, OH, USA: McGraw‐Hill Professional.
Dale & Bunney. (1999). Total quality management blueprint. Oxford: Blackwell.
Denscombe, M. (2000). Forskningshandboken – För småskaliga forskningsprojekt inom samhällsvetenskaperna. Lund: Studentlitteratur.
Ford. (2003). Q1 second edition.
Foster, T. (2003). Managing quality: an integrative approach. Upper Saddle River, N.J; Great Britain: Prentice Hall.
Jones & Sasser. (1995). Why satisfied customers defect. Harvard Business Review.
Morris, Alan S. ISO 14000 Environmental Management Standards: Engineering and Financial Aspects. Hoboken, NJ, USA: John Wiley & Sons, Incorporated, 2004.
Odette.se. Global Materials Management Standard Charts a Course for Industry Advantage.
Pande & Holpp. (2002). What Is Six Sigma?. Blacklick, OH, USA: McGraw‐Hill Professional.
Trost, J. (2005). Kvalitativa Intervjuer. Lund: Studentlitteratur.

‐ Appendix ‐
APPENDIX 1: BROSE CUSTOMER

‐ Appendix ‐
APPENDIX 2: WORLD MAP OVER BROSE PLANTS

‐ Appendix ‐
APPENDIX 3: INTERVIEW GUIDE
STA Manager
1. Can you describe your roll in the Q1 work?
2. Can you in short describe what Q1 is?
3. Can you describe a normal implementation process to reach Q1?
4. Can you list the most common problem?
5. Could you give some tips to future Q1 companies?
STA
1. How would you start the work towards a successful implementation?
2. Can you recommend a way to work for Brose to achieve and keep Q1 status?
3. What MSA points do you see as most important?
4. How does the Q1 scoring work?
5. Is it correct that many of the Q1 MSA points exist in TS 16949?
6. What is the biggest mistake a company makes during the implementation work?
Manager at an automotive supplier
1. Could you describe your way to implement Q1 in your company?

‐ Appendix ‐
APPENDIX 4: Q1 SCORING THRESHOLDS

‐ Appendix ‐

‐ Appendix ‐
APPENDIX 5: ORGANISATION CHART
Weit ergabe sow ie Verv ielf ält igung dieser vert raulich en Unterlage(n), Verw ertung und Mit t eilung ihres Inhalt s ist nicht ohne unsere vor-herige schrif t liche Gen ehmigung gestat t et . Zuw iderh andlung en verpf licht en zu Schad enersatz. Alle Rechte für d en Fall der Patent -erteilung oder Gebrauch smuster-Eint ragung vorbehalten .
The copying, use, d ist ribut ion ordisc losure of the conf ident ial and proprietary informat ion contain ed in this do cument (s) is st rict lyprohibited w ithout pr ior w rit tenconsent . Any breach sh all subjectthe inf ring ing p arty to rem edies. The ow n er reserves all right s in theevent of th e grant of a p atent or theregist rat ion of a ut i l it y model ordesign .
Source: Brose Fahrzeugteile GmbH & Co. Kommanditgesellschaft
Organization Chart

‐ Appendix ‐
APPENDIX 6: CUSTOMER ENDORSEMENT LETTER
This appendix contains the original Customer Endorsement letter.

‐ Appendix ‐
Request for Customer Endorsement (Pro Forma)
To: Date: From: Q1 Candidate Supplier Code: ___________ Subject: Q1 Endorsement of the <Supplier Name, City, State> Facility/Organization The <Supplier Name, City, State> (Company/Division/Operating Group) is petitioning for Q1. Since your Facility/Organization is a customer of the petitioning Facility/Organization, your endorsement is required. Please return your completed endorsement within 30 days <date>. The scope of your evaluation should be the most recent ___ months, with any exceptions identified. Any additional information or detail that you wish to provide would also be appreciated. Do you endorse this Facility/Organization for Q1? Yes _____ No _____ If no, please detail any issues/concerns which require resolution in order to assist us in continuous improvement of our ability to satisfy your requirements. ___________________________________________________________________________ ___________________________________________________________________________ ___________________________________________________________________________ ___________________________________________________________________________ ___________________________________________________________________________ _______________________________________________________________ Signature (Highest level Manager, Petitioning Company/Division/Operating Group) Endorsement Signature: ___________________________ Title: ___________________________ Date: ___________________________
December 2006

‐ Appendix ‐
APPENDIX 7: CUSTOMER ENDORSEMENT MATRIX
Plant name or division
Name Title Address Tel e-mail
Buyer Volvo Cars Torslanda
David Rohman
Logistic Manager VCT Volvo Car Corporation Dept 79000 Geo loc TVKV S-405 31 Göteborg
+46-31-597006 [email protected]
STA Eng Volvo Cars Torslanda
Jimmy Sjöö STA Volvo Personvagnar Dept. 53240 Geo Plac. PVH-55 Ljusgård 40531 Göteborg
+46-31-3253382 [email protected]

‐ Appendix ‐
APPENDIX 8: HANDBOOK TO Q1 IMPLEMENTATION
Handbook to Q1 implementation
1. Set up a project group.
a. Good if it is the same as TS 16949 and ISO 14001.
2. Check the time plan and see if you are able to put the effort as necessary.
a. Read the steps and look for the explanation.
b. Set up Deadlines.
3. The project leader appoints meetings for every department.
4. Go through the points in Q1 implementation matrix and see if any point is completed. At the same time you will have a fast overview over what is necessary to be made.
a. Including:
i. Capable Systems
ii. Warranty Performance
iii. Manufacturing Site Assessment
iv. Customer Endorsement
5. Send Customer endorsement letters in time; it might take up to three weeks to receive them.
6. Keep a continuous contact with your STA.

‐ Appendix ‐
APPENDIX 9: Q1 IMPLEMENTATION MATRIX
This appendix contains the Q1 implementation Matrix that was used by us during the implementation work including Time plan, Capable Systems, Warranty and the Manufacturing Site Assessment. The Matrix has been adjusted to fit inside the thesis.

Q1 Time Table
R Denotes responsible department
S Denotes supportive department
Index Process
Gen
eral
Pla
nt M
anag
er
Qua
lity
& E
nviro
nmen
t
Proj
ect d
evel
opm
ents
TK
5
Prod
uctio
n Sy
stem
Com
mer
cial
Adm
inis
trat
ion
Hum
an R
esou
rces
Logi
stic
s
Ass
embl
y
Prod
uctio
n Fa
cilit
y
Act
ions
to b
e ta
ken
Act
ions
take
n to
Dat
e
Req
uire
d co
mpl
etio
n da
te
Act
ual c
ompl
etio
n da
te
Stat
us
Explanation T.1. Time Table T.1.1 Contact Ford
STA R
2006-11-06 2006-11-07 Completed By Contacting the Ford STA site engineer you will be guided through the necessary steps before you can do a formal Q1 application.

T.1.2 Q1 metrics history
R
2007-01-01 Completed Your STA engineer will use your recent six months of key performance metrics that are reported in SIM as one of the elements for his final recommendation on Q1 status. There are five performance metrics, Field service action, Stop shipments, PPM performance, Delivery performance and Violation of trust. Be sure to check your performance metrics and be ready to explain eventual problems at the on site assesment.
T.1.3 Working with expectations
R R R R R R R R R
2006-12-01 Completed The manufacturing site assessment is a key component to Q1. Be ready to show compliance for each expectation that is presented in the manufacturing site assessment matrix at the "on site evaluation".
T.1.4 Warranty (exp) R
2006-12-01 Completed The warranty expectations is a necesary component in the evaluation of Q1 status. A supplier can gain or lose Q1 points depending on demonstrated warranty performance.
T.1.5 Capable Systems
R R
2006-12-01 Completed Work towards third-party certifications in TS-16949 and ISO-14001. Also work toward compliance according to MS-9000/Odette/MMOG. (because ISO-14001 and TS-16949 already is implemented, the timeplan only takes Odette, MS-9000 and MMOG in to consideration)
T.1.6 Self Evaluation R
2006-12-08 Completed Your facility will conduct a self-evaluation to ensure that you meet Q1 criteria. This self evaluation will concern Working with expectations. More specific explanation on expectations are supplemented in the Manufacturing site assessment page.

T.1.7 Self Correction R
2006-12-15 Completed After the Self Evaluation you might have seen missing or missled information that does not meet the Q1 criteria. Here you have time to take action.
T.1.8 Customer Endorsement
R
2006-12-19 Completed Once you believe your facility is ready, based on the site performance reported in SIM and the manufacturing site assessment expectations the next step is to obtain the necessary customer endorsements. These endorsements will be valid for six months from the date of the signature. Be sure to gather all endorsements from all your Ford customers.
T.1.9 Formal Application
R
2006-12-20 Completed Send a formal Q1 application to Ford STA along with documentation of your certification to TS 16949 (or QS-9000 until December 14, 2006) and ISO 14001, and compliance with MMOG (or MS-9000 or Odette).
T.1.10 On Site Evaluation
R
2006-11-05 Completed Q1 on-site evaluation may be scheduled to review your qualifications for Q1 by Ford STA. The on site evaluation will discuss, demonstrated site capabilities, performance metrics, manufacturing site assessment and the overall Q1 points maintained during the prior six months of data.
T.1.11 Final recommendation
R
2007-01-08 A final recommendation about your Q1 status by Ford STA will be presented.

Q1 Capable Systems
R Denotes responsible department S Denotes supportive department
Index Process Gen
eral
Pla
nt M
anag
er
Qua
lity
& E
nviro
nmen
t
Proj
ect d
evel
opm
ents
TK
5
Prod
uctio
n Sy
stem
Com
mer
cial
Adm
inis
trat
ion
Hum
an R
esou
rces
Logi
stic
s
Ass
embl
y
Prod
uctio
n Fa
cilit
y
Act
ions
to b
e ta
ken
Act
ions
take
n to
Dat
e
Req
uire
d co
mpl
etio
n da
te
Act
ual c
ompl
etio
n da
te
Stat
us
Expl
anat
ion
C.1. Capable Systems C.1.1 Third Part Certification:
ISO 14001 - Environmental Management System
R
2006-12-01 Completed
C.1.2 Third Part Certification: QS-9000 - Quality Management System TS 16949 - Supplier Quality System
R
2006-12-01 2006-11-02 Completed
C.1.3 Compilance According to: MS 9000 - Material Management System Requirements MMOG - Material Management Operation Guideline Odette
R
2006-12-01 In progress

Q1 Warranty Performance (TBD points)
R Denotes responsible department
S Denotes supportive department
Index Process Gen
eral
Pla
nt M
anag
er
Qua
lity
& E
nviro
nmen
t
Proj
ect d
evel
opm
ents
TK
5
Prod
uctio
n Sy
stem
Com
mer
cial
Adm
inis
trat
ion
Hum
an R
esou
rces
Logi
stic
s
Ass
embl
y
Prod
uctio
n Fa
cilit
y
Act
ions
take
n to
Dat
e
Req
uire
d co
mpl
etio
n da
te
Act
ual c
ompl
etio
n da
te
Stat
us
Expl
anat
ion
W.1. Warranty Performance W.1.1 Supplier must demonstrate knowledge of the
warranty's impact on their parts to Ford Motor Company vehicles.
R
2006-12-01 In progress
W.1.2 Warranty metrics should be integrated in the
supplier's QOS along with roadmap actions to deliver significant year-over-year improvements.
R
2006-12-01 In progress
W.1.3 In addition, suppliers must have plans in
place to monitor low time in service warranty to detect and to correct emerging customer concerns.
R
2006-12-01 In progress
W.1.4 Suppliers should utilize available warranty
tools, such as the Analytical Warranty System (AWS), SIM Warranty and regional warranty parts return centers.
R
2006-12-01 In progress

Q1 Expectations Completed 98% x.x.x.x Correspo
ndence routine
In progress 3%
*= Denotes focus area R Denotes responsible department
Behind schedule
No Correspondence S Denotes supportive department Critical
Index Process Gen
eral
Pla
nt M
anag
er
Qua
lity
& E
nviro
nmen
t
Proj
ect d
evel
opm
ents
TK
5
Prod
uctio
n Sy
stem
Com
mer
cial
Adm
inis
trat
ion
Hum
an R
esou
rces
Logi
stic
s
Ass
embl
y
Prod
uctio
n Fa
cilit
y
Act
ions
to b
e ta
ken
Act
ions
take
n to
Dat
e
Req
uire
d co
mpl
etio
n da
te
Act
ual c
ompl
etio
n da
te
Stat
us
Expl
anat
ion
TS-1
6949
Rou
tines
ISO
-140
01 R
outin
es
I.1. Quality procedures/QS-9000/TS 16949/QOS R I.1.1 Supplier's quality system is third-party certified to
the QS-9000 or TS 16949 (full compliance to TS 16949 by December 14, 2006) requirements.
R 2006-12-01
2006-11-07
Completed
I.1.2 Existing Supplier's environmental system will be certified to ISO 14001 by July 1, 2003. Non- Q1 suppliers must comply to ISO 14001 requirements prior to Q1 award or Q1 reinstatement.
R 2006-12-01
2006-11-07
Completed
I.1.3 Supplier's quality manual contains processes for all areas of the site assessment. The quality manual is updated as needed to drive statistically valid continual improvements in the quality system. Supplier's Senior Management Team including representatives from Manufacturing, Quality, Engineering and Human Resources perform these reviews.
R 2006-12-01
2006-11-07
Completed Finished for the TS-16949 audit.
4.2.2

I.1.4 Non-conformances identified in internal audits are not repeated.
R 2006-12-31
In progress
Finished for the TS-16949 audit.
8.2.2
I.1.5 Supplier has a document process to identify and regularly update customer expectations, objectives and requirements.
R 2006-12-01
2006-11-07
Completed Finished for the TS-16949 audit.
5.2, 5.4.1.1, 7.2.1, 8.2.1
I.1.6 Supplier has a document process to identify and regularly update internal expectations, objectives and requirements.
R 2006-12-01
2006-11-07
Completed Finished for the TS-16949 audit.
8.2.1
I.1.7 Supplier has a documented process to identify and regularly update internal expectations, objectives and requirements into QOS measurable.
R 2006-12-01
2006-11-07
Completed Finished for the TS-16949 audit.
8.2.1
I.1.8 Supplier has a documented process to assign targets and objectives to each QOS measurable.
R 2006-12-01
2006-11-07
Completed Finished for the TS-16949 audit.
5.4.1
I.1.9 Supplier has a documented process to assign chosen measurable to appropriate management levels for review, follow-up and improvements.
R 2006-12-01
2006-11-07
Completed Finished for the TS-16949 audit.
5.4.1
I.1.10 Supplier utilizes action plans to drive statistically valid continual improvements of chosen metrics and are a tracked at QOS review meetings.
R 2006-12-01
2006-11-07
Completed Finished for the TS-16949 audit.
8, 8.4
I.1.11 Supplier's management team holds monthly QOS performance review meetings with representatives from Manufacturing, Quality, Engineering and Human Resources. Improvements actions are taken by cross-functional teams that include levels of the organization.
R 2006-12-01
2006-11-07
Completed Finished for the TS-16949 audit.
5.6.1

I.1.12 QOS reviews include a review of all applicable Ford SIM metrics, key process metrics and customer satisfaction metrics.
R 2006-12-01
2006-11-07
Completed Finished for the TS-16949 audit.
8.2.1.1
I.1.13 Metrics monitoring customer satisfaction that are related to supplier manufacturing are understood and tracked.
R 2006-12-01
2006-11-07
Completed Finished for the TS-16949 audit.
5.2, 8.2.1
I.2. FMEAs/Control Plans* R
I.2.1 All Ford parts have documented design and process failure mode and effects analysis (DFMEA, PFMEA and Control Plans (or DCPs)). There is a robust process in place for these documents.
R 2006-12-01
2006-11-21
Completed Finished for the TS-16949 audit.
7.3.1.1, 7.3.3.1, 7.3.3.2
I.2.2 FMEAs are reviewed annually or as issues arise. A Pareto is used to focus on 1) severity 2) the product of severity and occurrence, and 3) to identify high RPNs in order to prioritize actions to drive improvements.
R 2006-12-01
2006-11-21
Completed Reviewed on regular basis
7.5.1.1
I.2.3 All error detection areas are reviewed and plans exist to move to error prevention devices (poke joke), where feasible.
R 2006-12-01
2006-11-21
Completed Reviewed prior to TS audit
7.3
I.2.4 Supplier, in cooperation with their customers, has identified Significant Characteristics (SCs) and High Impact Characteristics (HICs), where applicable, on their PFMEAs and Control Plans for every Ford part or family of Ford parts.
R 2006-12-01
2006-11-21
Completed Finished for the TS-16949 audit. Coincides with TS routine 7.3.2.3
7.3.2.3
I.2.5 Supplier works with Ford (i.e., Program Vehicle Teams (CRT), Supplier Technical Assistance (STA) to establish final agreement of SCs and HICs. Suppliers obtain specific agreement from Ford for any parts not having SCs or HICs.
R 2006-12-01
2006-11-21
Completed Reviewed prior to TS audit
I.2.6 Supplier ensures that all print dimensions and call-out notes on the engineering drawing are always met through Control Plans, work instructions, job set-up instructions and receiving inspection.
R 2006-12-01
2006-11-21
Completed Reviewed prior to TS audit

I.2.7 Supplier verifies pass-through characteristics and ensures that zero defects are at Vehicle Operations (VO) and final customer.
R 2006-12-01
2006-11-21
Completed Reviewed prior to TS audit
7.1.2
I.2.8 Control Plan is a result of appropriate quality planning and includes clear linkage between DFMEA and PFMEA.
R 2006-12-01
2006-11-21
Completed Finished for the TS-16949 audit.
7.5.1.1
I.2.9 Control Plans contain the following elements: Operation number/name Part Name/Part Number Inspection Requirements Specifications Control Methods SC, CC, HIC (where applicable) and Engineering Specifications (ES) requirements are identified SC, CC, HIC (where applicable) and ES Control Methods (in-process checks, process gaging, and part gaging) are appropriate Error-proofing methods In-process control methods Sample size and frequency Required tools, gages and other equipment Reaction plans must clearly direct the operator on how to act when a process begins to go out of control, or a product fails an inspection or test
R 2006-12-01
2006-11-21
Completed Finished for the TS-16949 audit.
7.3.2.3, 7.3.3
I.3. Employee Readiness/Training Review R 4.4.2
I.3.1 Supplier is responsible for assessing the skills required to perform all activities that affect product quality.
R 2006-12-01
2006-11-07
Completed Finished for the TS-16949 audit.
6.2.2
I.3.2 Employees have had a skills assessment, a training plan and evidence of training.
R 2006-12-01
2006-11-07
Completed Finished for the TS-16949 audit.
6.2.2
I.3.3 Supplier ensures that only trained and qualified personnel are involved in all aspects of the manufacturing of Ford parts.
R 2006-12-01
2006-11-07
Completed Finished for the TS-16949 audit.
6.2.1

I.4. APQP/Launch/PPAP/Run-at-Rate Review* R
I.4.1 Supplier has a APQP tracking mechanism in place. R 2006-12-01
2006-11-21
Completed Reviewed prior to TS audit
I.4.2 Supplier has a system to manage new vehicle program launches.
R 2006-12-01
2006-11-21
Completed Reviewed prior to TS audit
I.4.3 Supplier has a process in place to support Ford prototype and pre-production build events in a timely manner.
R 2006-12-01
2006-11-21
Completed Finished for the TS-16949 audit.
7.3.6.2
I.4.4 Supplier has a process to continuously monitor and improve launch performance.
R 2006-12-01
2006-11-21
Completed Finished for the TS-16949 audit.
7.5.1.1
I.4.5 All PPAP documentation must contain the information per the PPAP manual published by the Automotive Industry Action Group ( AIAG) - this information must also be available for Ford review. Suppliers in North America have a process in place to comply with Phased PPAP initial run-at-rate, production verification and capacity verification.
R 2006-12-01
2006-11-21
Completed Reviewed prior to TS audit
I.4.6 Suppliers require sub-suppliers to have a process in place that effectively satisfies all PPAP requirements regardless of sub-supplier business relationship with Ford.
R 2006-12-01
2006-11-21
Completed Reviewed prior to TS audit
I.4.7 Run-at-rate must be completed and support the stated program requirements (at full-volume production levels) for all Ford parts.
R 2006-12-01
2006-11-21
Completed
I.4.8 Run-at rate must include the following elements and be performed on the entire process or the slowest operation (process bottleneck): machine available hours, shifts, days, machine downtime (planned and unplanned), machine change-over, breaks, and quality or scrap.
R 2006-12-01
2006-11-21
Completed
I.4.9 Supplier monitors capacity has a process to ensure ongoing sufficient capacity on all Ford parts.
R 2006-12-01
2006-11-21
Completed
I.5. Manage the Change R

I.5.1 Supplier has a documented process to effectively implement post - Job 1 design changes, process changes or volume changes.
R 2006-12-01
2006-11-21
Completed Reviewed prior to TS audit
I.5.2 Supplier effectively reviews and updates its quality supporting documentation for these changes. Examples of documents that may require changes: Process Flow Diagrams, FMEAs, Control Plans, Operator Instructions, Visual Aids and PPAP documentation.
R 2006-12-01
2006-11-21
Completed Finished for the TS-16949 audit.
4.2.4
I.5.3 Supplier follows a documented process to ensure that proper Ford approvals are gained prior to making process changes. The approval process will include use of Supplier Request for Engineering Approvals (SREAs), Change Request/Concern Report (CR/CR) in Worldwide Engineering Release System (WERS), Management Alerts and revised PPAP documentation, as appropriate
R 2006-12-01
2006-11-21
Completed VCC requirements
7.1.4
II.1. Sub-supplier Quality Management* R
II.1.1 Supplier has defined process for managing its supply base including identification of those with a high-impact to quality.
R 2006-12-01
2006-11-21
Completed Central Quality Brose Coburg
7.4.1
II.1.2 Supplier requires sub-suppliers to have a quality operating system that is similar to QS-9000, TS 16949 or VDA. Supplier verifies sub-supplier compliance by annual on-site assessment of high impact sub-supplier facilities.
R 2006-12-01
2006-11-21
Completed Finished for the TS-16949 audit.
7.4.1.2
II.1.3 Supplier requires PPAP for all parts from sub-suppliers (regardless of supplier business relationship with Ford).
R 2006-12-01
2006-11-21
Completed Reviewed prior to TS audit
II.1.4 Where Ford has defined an Engineering Specification (ES), or special characteristics that are the responsibility of the sub-supplier, the sub-supplier must show compliance to the ES or special characteristics in its PPAP submission to the Tier One supplier.
R 2006-12-01
2006-11-21
Completed Finished for the TS-16949 audit.
4.2.3.1
II.1.5 Supplier requires sub-suppliers to take specific actions to ensure that all pass-through characteristics are to the customer's specifications.
R 2006-12-01
2006-11-21
Completed Finished for the TS-16949
7.2.1.1

audit.
II.1.6 Supplier must confirm sub-supplier compliance by review and approval of sub-supplier PPAP submission prior to incorporation of product in supplier manufacturing process.
R 2006-12-01
2006-11-21
Completed Reviewed prior to TS audit
II.1.7 Supplier conducts systematic reviews with sub-suppliers and assures implementation of corrective actions across supplier facilities for all issues resulting in stop ship or field action.
R 2006-12-01
2006-11-21
Completed 7.4.3.2
II.2. Control of Incoming Quality R
II.2.1 Supplier has a strategy for receiving inspection. R 2006-12-01
2006-11-20
Completed Finished for the TS-16949 audit.
7.4.3
II.2.2 Incoming quality requirements are part of a Control Plan. If incoming quality inspections are made, there is evidence of the specification and compliance to the specification. If no incoming inspections are made, there is a rationale for quality sub-suppliers.
R 2006-12-01
2006-11-20
Completed Finished for the TS-16949 audit.
7.5.1.1 (Annex A)
II.2.3 Incoming Quality Operator follows a reaction plan if raw material or purchased part is found to be out of specification.
R 2006-12-01
2006-11-20
Completed Finished for the TS-16949 audit.
7.5.1.1 (Annex A)
II.2.4 Supplier has appropriate resources to manage sub-supplier quality, including on-site assessment of high-impact sub-supplier facilities.
R 2006-12-01
2006-11-20
Completed 7.4.3.1
II.3 Control Plans/Operator Instructions* R R II.3.1 Standardized operator instructions (including
Control Plans, work instructions, job aids, check sheets, job setup instructions and illustrations) are developed and available for operators.
R 2006-12-01
Completed Finished for the TS-16949 audit.
7.5.1.2
II.3.2 Standardized operator instructions are legible, specific and controlled. The instructions are available in the area where the work is being performed and are followed by operators as written.
R 2006-12-01
Completed Finished for the TS-16949 audit.
7.5.1.2

II.3.3 Reaction plans are clearly defined and protect Ford from non-conforming materials.
R 2006-12-01
Completed Finished for the TS-16949 audit.
8.3, 8.2.3.1
II.3.4 Control Plans are revised and updated when products or processes differ from those in current production.
R 2006-12-01
2006-11-20
Completed Finished for the TS-16949 audit.
7.5.1.1
II.4 Process Variability Monitoring/Reduction* R 4.5.1 II.4.1 Supplier has determined appropriate statistical
techniques. A key aspect of defect prevention is process variability reduction and the use of SPC to indicate when action is necessary (such as adjustments and tooling changes), and conversely when process should be left alone.
R 2006-12-01
2006-11-20
Completed Finished for the TS-16949 audit.
8.2.3.1, 8.2.3
II.4.2 Operator-based SPC control charts are optimized for statistically valid sample frequency, sample size and appropriate chart type. SPC checks are performed on a timely basis and out-of-control conditions prompt corrective action as appropriate.
R 2006-12-01
2006-11-20
Completed Finished for the TS-16949 audit
8.2.3.1
II.4.3 SPC data is maintained, monitored and used by the equipment operators to drive process and product improvements by reducing process variability. Evidence of process improvements include: reduction in scrap, reductions in rework/repair and DPU; increases in first-time-through capabilities, Rolled Throughput Yield (YRT), Cpk, Process Sigma level, records of error proofing mechanism implementation; and reductions in machine downtime.
R 2006-12-01
2006-11-20
Completed Finished for the TS-16949 audit
8.2.3.1
II.4.4 Ppk and Cpk levels are greater than or equal to 1.67 and 1.33 respectively, for all SCs; CCs and HICs (where applicable). For all SCs and CCs, CPk trends are tracked over time, and action plans have been put in place to increase these Cpk values by process of continuously reducing the causes of variability, These trends are part of the Supplier's Management routine review.
R 2006-12-01
2006-11-20
Completed Finished for the TS-16949 audit
8.2.3.1

II.4.5 Machine capability for SCs, CCs and HICs (where applicable) must be demonstrated on all new equipment and tooling.
R 2006-12-01
2006-11-20
Completed Finished for the TS-16949 audit
8.2.3.1
II.5. Gage Calibration and Use* R 4.5.1 II.5.1 Supplier ensures that all gages are available for
use as identified in the Control Plan. The gage calibration and gage maintenance program ensures that back-up gages or a back-up gaging process is available to support inspections required by the Control Plan.
R 2006-12-01
2006-11-20
Completed Finished for the TS-16949 audit.
7.5.1.1
II.5.2 Variable gages are used for all SC's and CC's whenever possible. HIC gages are per the Control Plan. All gages (company and employee-owned) are identified per the Control Plan.
R 2006-12-01
2006-11-20
Completed Finished for the TS-16949 audit.
7.5.1.1
II.5.3 Gage R&R is to conform with the guidelines in the AIAG Measurement Systems Analysis (MSA) manual. Whenever gage R&R does not meet these guidelines, specific plans are in place which adhere to the guidelines.
R 2006-12-01
2006-11-20
Completed Finished for the TS-16949 audit
II.5.4 Supplier has documented "dropped/damaged gage" policy that is followed by all employees. This ensures that only functional, in-specification gages are used.
R 2006-12-01
2006-11-20
Completed Finished for the TS-16949 audit.
7.6
II.5.5 Gage masters are traceable to a national or international equivalent standard. Gage calibration and maintenance is performed on an appropriate schedule and per specification.
R 2006-12-01
2006-11-20
Completed Finished for the TS-16949 audit.
7.6
II.5.6 Supplier conducts regular evaluation of error proofing devices.
R 2006-12-01
2006-11-20
Completed Finished for the TS-16949 audit
7.6
II.6. Part Identification/Nonconforming Parts/Packaging/Shipping
R R 4.5.2
II.6.1 Supplier has a documented process for positive part identification in all stages of production, testing, laboratories, storage areas, office areas, etc.
R 2006-12-01
Completed 7.5.3

II.6.2 Supplier has lot traceability of product after shipment to Ford.
R 2006-12-01
Completed 7.5.3
II.6.3 Supplier takes measures to ensure that production process control handling, storage and packaging as to prevent damage or deterioration, and preserve product quality.
R 2006-12-01
Completed Finished for the TS-16949 audit.
7.5.5
II.6.4 Supplier follows Ford packaging requirements (Form (1750 - North America; Form 1750EU - Europé) At pack-out, the Ford packaging guidelines are available for use and followed as required.
R 2006-12-01
Completed
II.7 Testing/Engineering Specifications R II.7.1 All inspections, measurements and tests, including
Engineering Specifications (ES) and Material Specifications (MS) are performed according to documented control plans, instructions and/or procedures to ensure product requirements are met.
R 2006-12-01
2006-11-21
Completed 7.5.1.1 (Annex A)
II.7.2 Appropriate reaction plans address what actions should take place if there is a test or inspection failure, and includes product containment and customer notification policy for all events.
R 2006-12-01
2006-11-21
Completed Test release report + A-D check. TS 8.2.3.1
8.2.3.1
II.7.3 Suppliers and sub-suppliers providing heat-treated components are required to meet Ford Manufacturing Standard W-HTX and demonstrate compliance using the Ford Heat Treat System Survey Guidelines. To reduce the risk of embitterment, heat-treated steel components are required to conform with Ford material specification WSS-M99A3.
R 2006-12-01
In progress
II.8 Preventive Maintenance (PM)/Housekeeping* R R R II.8.1 Supplier has instituted practices that include
reactive, preventive and predictive maintenance. The maintenance system supports process capability improvement.
R 2006-12-01
Completed Finished for the TS-16949 audit.
7.5.1.4

II.8.2 Management regularly reviews (at least quarterly) the status of the PM completion to plan. Management reviews corrective action plans to ensure any backlog (past due) maintenance and has a plan to become current to the PM schedule. Management undertakes an evaluation to determine if there is a reduction of machine/process downtime.
R 2006-12-01
Completed
II.8.3 The supplier has continuous improvement plans for plant cleanliness, housekeeping, ergonomics and working conditions, and audits their facility at least monthly. There is evidence that the supplier management team is following continuous improvement plans.
R 2006-12-01
Completed
II.8.4 Supplier takes measures to minimize foreign material, chips, debris, contamination, excessive oil, etc., where part quality can be negatively affected.
R S S S S S S S S 2006-12-01
Completed
II.9 Manufacturing Flow/6-Sigma and Lean Manufacturing Metrics*
R R
II.9.1 Supplier uses Lean manufacturing and 6-Sigma principles for current and new model parts incorporating just-in-time production (JIT), waste elimination and team-based structured problem solving to drive continuous improvement for quality process capability and manufacturing efficiency.
R S 2006-12-01
Completed Finished for the TS-16949 audit.
7.5.1.6
II.9.2 Supplier includes key manufacturing and 6-Sigma type measurable within its QOS. A minimum of two Lean- and 6-Sigma-type measurable
R 2006-12-01
2006-11-20
Completed
II.10 Problem Solving/Corrective Actions* R R II.10.1 Supplier uses a structured problem solving method
(e.g., Global 8D) to address customer concerns and complaints.
R 2006-12-01
2006-11-20
Completed Finished for the TS-16949 audit.
8.5.2.1
II.10.2 Methods are established to communicate quality concerns to the supplier's production and support personnel. Corrective actions are submitted to the supplier's management team for review. The corrective actions are communicated to and replicated in all affected areas in the supplier's organisation.
R 2006-12-01
2006-11-20
Completed Finished for the TS-16949 audit.
7.2.3

II.10.3 Supplier has a process in place to address customer plant concerns in a timely and thorough manner.
R 2006-12-01
2006-11-20
Completed Finished for the TS-16949 audit
II.10.4 Supplier reviews previous launches and incorporates lessons learned into future launch plans to achieve flawless launch.
R 2006-12-01
2006-11-21
Completed Reviewed prior to TS audit