2007 PLAINS NUTRITION COUNCIL SPRING...
126
2007 PLAINS NUTRITION COUNCIL SPRING CONFERENCE March 29-30, 2007 San Antonio, Texas Publication No. AREC 07-20 Texas A&M University Agricultural Research and Extension Center Amarillo
-
Upload
nguyenxuyen -
Category
Documents
-
view
216 -
download
1
Transcript of 2007 PLAINS NUTRITION COUNCIL SPRING...

2007 PLAINS NUTRITION COUNCIL SPRING CONFERENCE
March 29-30, 2007 San Antonio, Texas
Publication No. AREC 07-20 Texas A&M University
Agricultural Research and Extension Center Amarillo

The Plains Nutrition Council
2007 Spring Conference
2006-2007 Officers And Executive Committee
Paul DeFoor, President Clint Krehbiel, 1st Vice President Kendall Karr, 2nd Vice President
Tom Eck, Past President
The Plains Nutrition Council 6500 Amarillo Blvd West
Amarillo, Texas 79106 Ted McCollum III, Secretary/Treasurer


We appreciate the continuing support of our
2007 PNC Sponsors
Platinum
Cargill Animal Nutrition
Gold Plus
Zinpro Elanco
Gold
Intervet Nutrition Physiology Corp. Vet Life Westway Feed Products
Silver Alltech Sweet Bran Fort Dodge Min-Ad
Bronze Albion Diamond V Global Animal Products Kemin MicroBeef Technologies Pfizer servi-Tech Laboratories

i
TABLE OF CONTENTS
Invited Presentations Page Genetic Control of Fat Deposition in Cattle…………………………………………………………. 1
Udaya DeSilva and Asitha T. Vasudevan-Pillai, Oklahoma State University, Stillwater
Cellular aspects of intramuscular adipogenesis: Competition for cells between
muscle and marbling………………………………………………………………………………………. 9 Ki Yong Chung and Bradley J. Johnson, Kansas State University, Manhattan
Marbling: Management of cattle to maximize the deposition of intramuscular adipose tissue……………………………………………………………………………………………..…. 26 Stephen B. Smith and David K. Lunt,Texas A&M University, College Station
Corn by-products: Considerations involving sulfur……………………………………………. 43
R. H. Pritchard, South Dakota State University, Brookings
Corn by-products: Considerations involving variability and formulation …………. 49 P. G. Guiroy, J. N. Pike, C. B. Calk, and M. A. Messman, Cargill Inc, Minnetonka, MN
Beef and the Greening of America………………………………………………………….…………. 57
Rick McCarty, National Cattlemen’s Beef Association Animal Welfare: Contemporary Issues in Today’s Animal Agriculture…..…………. 60
Chris Ashworth, Monsanto
University Research Updates
Texas Tech University Burnett Center, ..………………………………………………………….. 74 M. L. Galyean and J. T. Vasconcelos
South Dakota State University…………..………………………………………………………………. 80
R. H. Pritchard, E. R. Loe and A. Wertz-Lutz

ii
Graduate Research Abstracts Page Investigation of differences in feed efficiency through comparison of observed versus model predicted feed intake in Bos indicus – Bos taurus F2 full sibling steers. T. S. Amen, J.E. Sawyer, A. D. Herring, J. O. Sanders, D.K. Lunt and C. A. Gill. Texas A&M University, College Station and McGregor……………………. 85 Environmental factors affecting water intake in steers finished in feedlots. R.A. Arias and T.L. Mader. University of Nebraska-Lincoln……………………………… 86 Effects of roughage source and level in finishing diets containing wet distillers grains on feedlot performance and economics. J. R. Benton, G. E. Erickson, T. J. Klopfenstein, K. J. Vander Pol, and M. A. Greenquist. University of Nebraska-Lincoln…………………………………………………………………………………………………. 86 Evaluation of a mathematical model to estimate total feed required for pen-fed animals based on performance and diet information. B.M. Bourg1, L.O. Tedeschi1, and M.S. Brown2. Texas A&M University, College Station1, West Texas A&M University, Canyon2 ……………………………………………………………….. 87 UNL Meta-analysis on the effects of WDGS and Sweet Bran® on feedlot cattle performance and carcass characteristics. V.R. Bremer, G.E. Erickson, and T.J. Klopfenstien. University of Nebraska-Lincoln……………………………………………………. 88 Economic model for determining byproduct returns in finishing diets. C. D. Buckner, V. R. Bremer, T. J. Klopfenstein, G. E. Erickson, and D. R. Mark. University of Nebraska-Lincoln………………………………………………………………………….. 89 An experimental model to study effects of bovine respiratory disease on cellular and humoral immune response, performance, and metabolic changes in finishing beef steers. L.O. Burciaga-Robles, B. McLaughlin, C.R. Krehbiel, D.L. Step, M. Montelongo, A.W. Confer, R.W. Fulton, C.J. Richards, U. DeSilva, and G. Zhang. Oklahoma State University, Stillwater………………………… 90 Effects of corn processing method and wet distillers grains with solubles inclusion level in finishing steer diets. M. Corrigan, G. Erickson, T. Klopfenstein, K. Vander Pol, M. Greenquist, and M. Luebbe. University of Nebraska, Lincoln……………………………………………………………………………………………. 91 Dried corn distiller’s grains with solubles: How much is too much? B. E. Depenbusch, C. M. Gordon, and J. S. Drouillard. Kansas State University, Manhattan……………………………………………………………………………………………………………. 91

iii
Graduate Research Abstracts (cont’d) Page Effects of feeding polyclonal antibody preparations against Streptococcus bovis and Fusobacterium necrophorum on rumen in situ starch and fiber disappearance. N. DiLorenzo, G.I. Crawford, D. Blini, and A. DiCostanzo. University of Minnesota, St. Paul……………………………………………………………………….. 92 Efficacy of rumen temperature boluses for monitoring health of feedlot cattle. T. K. Dye, C. J. Richards, L. O. Burciaga-Robles, C. R. Krehbiel, and D. L. Step. Oklahoma State University, Stillwater………………………………………………..…. 93 Rumen microbial population changes in response to sub-acute ruminal acidosis. S. C. Fernando1, H. T. Purvis II1, C. R. Krehbiel1, F. Z. Najar2, T.G. Nagaraja3, B. A. Roe2, and U. DeSilva1. 1 Oklahoma State University, Stillwater, 2 University of Oklahoma, Norman, 3 Kansas State University, Manhattan………. 93 Comparison of yearling steers sorted into heavy, medium, and light weight groups at feedlot entry. W.A. Griffin, J.D. Folmer, T.J. Klopfenstein, and G.E. Erickson. University of Nebraska, Lincoln…………………………………………………… 94 Effects of Micro-Aid concentration in a high-concentrate beef cattle finishing diet on fermentation and microbial protein synthesis in a continuous culture fermentation system. K. E. Hales, T. L. Covey, C. S. Abney, and M. L. Galyean. Texas Tech University, Lubbock…………………………………………………………… 95 Effects of corn hybrid, processing method, and interactions on feedlot performance and digestion. F.W. Harrelson1, M.K. Luebbe1, N.F. Meyer1, G.E. Erickson1, T.J. Klopfenstein1, and W.A. Fithian2. 1University of Nebraska, Lincoln, 2Golden Harvest Seeds Inc., Waterloo, NE……………………………………………. 96 Factors affecting residual feed intake in feedlot steers. J.W. Homm, L.L. Berger, and S. L. Rodriguez-Zas. University of Illinois, Urbana………………………… 97 Evaluation of the effects of two commercially available modified live vaccines for bovine respiratory disease complex on naïve beef steers. W. J. Horne, K. S. Barling, A. D. Herring, D. K. Lunt, A. Thomas, and J. E. Sawyer. Texas A&M University, College Station…………………………………………………………………………………. 97 Effect of wet distillers grains level on feedlot cattle performance and nutrient mass balance. M. K. Luebbe, G. E. Erickson, T. J. Klopfenstein, and M. A. Greenquist. University of Nebraska, Lincoln…………………………………………………….. 98 Wet distiller’s grains with solubles in beef finishing diets with steam-flaked or dry-rolled corn. M. L. May, M. J. Quinn, J.J. Higgins, and J.S. Drouillard. Kansas State University, Manhattan………………………………………………………………….. 99
iv
Graduate Research Abstracts (cont’d) Page Use of distiller’s dry grains with solubles on beef finishing diets with high or low roughage levels. M.L. May, M.J. Hands, M.J. Quinn, B.E. Depenbusch, J.O. Wallace, C.D. Reinhardt and J.S. Drouillard. Kansas State University, Manhattan…………………………………………………………………………………………………………... 100 Effect of leg-filled storage bins on starch availability, gelatinization, and in vitro dry matter disappearance of steam-flaked corn. J.P. McMeniman1, S.E. Bachman2, M.L. Galyean1, C. Bowers3, T. Bryant3, and C. Carter 3. 1Texas Tech University, Lubbock, 2Bachman Nutritional Consulting, Inc., Amarillo, 3Five Rivers Ranch Cattle Feeding, LLC, Loveland, CO……………………………………… 100 Effect of CRINA Ruminants AF, a mixture of essential oil compounds on finishing beef steer performance, carcass characteristics, ruminal fermentation, and digestibility. N.F. Meyer1, G.E. Erickson1, T.J. Klopfenstein1, M.K. Luebbe1, M.A. Greenquist1, K.J. Vander Pol1, P. Williams2, and R. Losa3. 1University of Nebraska, Lincoln, 2DSM Nutritional Products, Inc., Parsippany, NJ, 3CRINA SA Gland, Switzerland……………………………………………………………………………………………… 101 Metaphylaxis therapy interacts with temperament to influence performance of growing beef steers. Z.D. Paddock1, G.E. Carstens1, J.E. Sawyer1, R.R. Gomez1, B.M. Bourg1, P.A. Lancaster1, D.K. Lunt2, S.A. Moore3, and D.S. DeLaney3. Texas A&M University, College Station1 and McGregor2 and King Ranch, Kingsville, TX3…………………………………………………………………………………………. 102 Response to dosing patterns of estradiol 17-beta and trenbolone acetate in finishing steers. S. L. Parr, R. H. Pritchard, and K. W. Bruns. South Dakota State University, Brookings………………………………………………………………………………… 103 Effects of combined trenobolone acetate and estradiol implant and/or ractopamine-HCl administration on circulating Insulin-like Growth Factor-1 and skeletal muscle gene expression in cull cows. G. L. Parsons, K. A. Harborth, M. J. Quinn, T. T. Marston, J. S. Drouillard, and B. J. Johnson. Kansas State University, Manhattan………………………………………………………………….. 104 Supplemental trace minerals (Zn, Cu, Mn, and Co) as Availa®4 or inorganic sources for shipping-stressed cattle. M. Pass1, E. B. Kegley1, and C. K. Larson2. 1University of Arkansas, Fayetteville, 2Zinpro Corp., Eden Prairie, MN………….. 104 Effects of a saccharin-containing additive (SUCRAM) on total tract digestibility, plasma metabolites, metabolic hormones, and urine organic acid excretion by steer calves. C. H. Ponce1, M. S. Brown1, J. C. Silva1, P. Schlegel2, and W. Rounds3. 1West Texas A&M University, Canyon, 2Pancosma SA, Geneva, Switzerland, 3Prince Agri Products, Qunicy, IL………………………………………………….. 105

v
Graduate Research Abstracts (cont’d) Page The effects of feeding ground flaxseed on morbidity, mortality, and performance of feedlot heifers. M. J. Quinn, E. S. Moore, B. E. Depenbusch, M. L. May, J. J. Higgins, and J. S. Drouillard. Kansas State University, Manhattan……………………………………………………………………………………………………………. 106 Source and level of dietary energy influence responses to an endotoxin challenge in beef steers. R. R. Reuter1,2, J. A. Carroll2, and M. L. Galyean1. 1Texas Tech University, Lubbock, 2USDA-ARS Livestock Issues Research Unit, Lubbock……………………………………………………………………………………………………………….. 106 Relationships of feed efficiency with carcass and non-carcass tissue composition in Angus bulls and heifers. F. R. B. Ribeiro1, G. E. Carstens1, P. A. Lancaster1, L. O. Tedeschi1, and M. E. Davis2. Texas A&M University, College Station1, The Ohio State University, Columbus2………………………………….. 107 Effects of dietary fat concentration and wet sorghum distiller’s grains plus solubles on feedlot performance and carcass characteristics of finishing heifers. J. C. Silva1, N. A. Cole2, M. S. Brown1, D. L. Mitchell1, C. H. Ponce1, and D. R. Smith1. 1West Texas A&M University, Canyon, 2USDA ARS Conservation and Production Research Laboratory, Bushland, TX……………………. 108 Effects of different winter growing programs and subsequent finishing on gene expression in different adipose tissue depots in beef steers. D. R. Stein1, A. Pillai1, M. P. McCurdy1, U. DeSilva1, C. R. Krehbiel1, J. B. Morgan1, G. W. Horn1, J. J. Wagner2, P. Ayoubi1, J.R. Malayer1, and R. D. Geisert3. 1Oklahoma State University, Stillwater, 2Southeast Colorado Research Center, Colorado State University, Lamar, and 3Department of Animal Science, University of Missouri, Colombia………………………………………………………………………………………………. 109 Increasing dietary protein improves nitrogen retention in steers following an endotoxin challenge. J. W. Waggoner, C. A. Löest, J. L. Turner, C. P. Mathis, K. K. Kane, D. M. Hallford, and M. K. Petersen. New Mexico State University, Las Cruces……………………………………………………………………………………………………………. 110 Limit-feeding a high-concentrate diet may alter nutrient absorption. J. O. Wallace, W. F. Miller, B. J. Johnson, and C. D. Reinhardt. Kansas State University, Manhattan……………………………………………………………………………………….. 110 Feed management case study demonstrating assessment and planning tools. R.A. White1, G.E. Erickson2, R.K. Koelsch2, R.E. Massey3, V. R. Bremer2, J.H. Harrison1. 1Washington State University, Puyallup, 2University of Nebraska, Lincoln, 3University of Missouri, Columbia……………………………………………………….. 111
vi
Graduate Research Abstracts (cont’d)
Page Performance and hay intake of beef calves fed dried distiller’s grains. S. J. Winterholler, B. P. Holland, J. J. Cranston, T. K. Dye, M. D. Hudson, C. R. Krehbiel, G. W. Horn and D. L. Lalman. Oklahoma State University, Stillwater. 112 Effects of combined trenbolone acetate and estradiol implant and/or ractopamine-HCl administration versus natural beef production in finishing steers. S. J. Winterholler, A. S. Webb, G. L. Parsons, D. K. Walker, M. J. Quinn, J. S. Drouillard, and B. J. Johnson. Kansas State University, Manhattan……….. 113

vii

viii
1
Genetic Control of Fat Deposition in Cattle
Udaya DeSilva and Asitha T. Vasudevan-Pillai Animal Science Department
Oklahoma State University, Stillwater
Introduction
US beef cattle industry is estimated to produce over 2 billion kilograms of excess fat every year (Smith et al., 2000). One of the major reasons for this excess in feedlot steers is feeding grain and increased time on feed in an effort to improve the palatability to US consumer demand (Crouse et al., 1984; Smith et al., 2000). The annual cost borne by the US beef industry due to such production inefficiencies that involve inferior muscling and excessive fat deposition is estimated to be around 7.4 billion dollars. On the other hand, marbling or the deposition of intramuscular (i.m.) adipose tissue is considered to be highly desirable in cattle industry, as marbling is believed to positively influence the palatability and tenderness of beef (Dolezal et al., 1982; Harper, 1997; Johnson, 1987; Wheeler et al., 1994). In fact, under the current USDA beef grading system, carcass value is primarily determined by the abundance of marbling on a cross-section of Longissimus dorsi muscle (USDA, 1997). Although heritabilities for tenderness, and thus marbling, has varied from moderate/high to low in various studies in beef cattle (Burrow et al., 2001), studies in laboratory animals suggest that the deposition and differentiation of adipose tissue is under significant genetic control (Gregoire et al., 1998). Although a significant amount of work has been done in laboratory animals (Cornelius et al., 1994; Gregoire et al., 1998; Patel and Lane, 1999; Patel and Lane, 2000; Tang and Lane, 1999), little is understood about the genetic control of adipocyte deposition in cattle. There have been efforts at identifying genes involved in adipogenesis using traditional means with some success (Taylor et al., 1998). A differential display experiment conducted at Oklahoma State University found that NAT1, a transcriptional regulator, to be differentially expressed in cattle with extremely high intramuscular fat deposition while PPARG, the well-known adipogenesis regulator in rodents not to be differentially regulated (Childs et al., 2002). A similar study done with Korean Hanwoo cattle resulted in the identification of a small number of differentially expressed genes (Yu et al., 2004).
In vitro Adipogenesis
One of the major problems in working with in vivo adipogenesis is the heterogeneity of the adipocytes in the living animal. Although you can identify expression differences due to lipid profiles, age, or nutrition, genetic regulators of adipocyte recruitment, commitment of initiation of lipid accumulation would be lost among the heterogeneity of the cells. In vitro models of adipogenesis eliminate some of these limitations. In fact, most information available for model organisms have been obtained through immortal cell lines (Ailhaud et al., 1992; Green and

2
Meuth, 1974; Gregoire et al., 1998; Macdougald and Lane, 1995). However one of the major disadvantages of such cell lines is their aneuploid nature. This disadvantage could be overcome by the use of primary pre-adipocyte cell lines. Over the past several years primary pre-adipocyte cultures have been successfully developed from several species including rat, mouse, human, pig, sheep, cattle, and chicken (Bjorntorp et al., 1980; Torii et al., 1998; Wu et al., 2000). These primary cultures were developed from fibroblast like interstitial cells isolated from the vascular stroma of different adipose depots and are known as Stromal Vascular Cells (SVCs). We have successfully developed a bovine primary adipocyte cell line and have used it to study synchronized gene expression during adipogenesis (Pillai et al., 2006).
Figure 1. Microscopic images of Stromal Vascular Cells at different stages of differentiation: (a) Confluent SVCs morphologically similar to fibroblasts. (b) Differentiating adipocytes 48 hours, cells started showing change in
morphology by 12 hours and the lipid droplets were apparent by 48 hours post induction.
(c) Differentiating adipocytes 120 hours post induction, cytoplasm of the cells were filled with lipid droplets by 120h of differentiation.
(d) Oil Red O stained lipid droplets in the cytoplasm (120 hours).

3
Gene Expression Analysis
In an effort to understand the genetic regulation of adipogenesis, we have constructed a bovine adipose tissue specific cDNA library and have sequence analyzed ~4000 clones. Interestingly, this non-normalized library has less than 20% redundancy after sequence analysis of over 4000 clones suggesting that adipose tissue is one of the highly transcriptionally active tissues in the body. A similar study done with a porcine adipose tissue cDNA library proved that porcine adipose tissue is much less complex by attaining ~60% redundancy at a similar stage of sequence analysis. We have selected a sub set of non-redundant transcripts from the library and have developed a bovine cDNA microarray. We have used this array in several expression profiling studies using RNA extracted from animals with varying fat deposition capabilities. One such study was a time course analysis of differential expression analysis using the previously described cell line.
Figure 2. Schema for microarray experiments

4
We have used the bovine adipose tissue specific cDNA microarray to analyze gene expression during adipocyte differentiation in the previously described bovine SVC primary cell culture system. Cells were induced to differentiate to adipocytes and expression profiling was carried out at critical time points (0, 6, 12, 24, 48, 72, 96, and 120 hours post induction). 110 genes were found to be differentially expressed (P<0.01, fold change >2) over different time points. Largest functional category of differentially expressed genes was those involved in binding capacity and catalytic activity. Of the up-regulated genes (n=68), 50% were involved in catalytic activity, 41% in binding capacity, 4.55% in signal transduction and 4.55% were involved in transporter activity. Of down-regulated genes (n=42), 33% were involved in transporter activity, 33% with binding capacity, 22% with structural molecular activity and 11% were involved in catalytic activity. A sub set of genes that are both differentially expressed and are biologically significant are depicted in tables 1 and 2 along with their function as described in the KEGG PATHWAY database (Kanehisa et al., 2006). Microarray results for a subset of genes that are significant in both expression profile as well as biological function were validated using quantitative real-time PCR analysis. There are several bovine quantitative trait loci (QTLs) associated with adipose tissue deposition (Hu et al., 2007; Polineni et al., 2006). Several of the differentially expressed genes reside in the region of the bovine genome covered by the QTLs.
Conclusion
In vitro adipogenesis provides a useful means of analyzing coordinated gene expression as a fibroblast cell differentiates into a fat cell. We are in the process of better understanding genes that are involved in recruitment, retention and early differentiation of adipocytes. Furthermore, combining functional genomic analyses with existing and future QTL studies expedite identification of genes with significant effect on fat deposition in cattle.
Literature Cited
Ailhaud, G., P. Grimaldi, and R. Negrel. 1992. Cellular and Molecular Aspects of Adipose Tissue Development. Annual Review of Nutrition 12:207-233.
Bjorntorp, P., M. Karlsson, P. Pettersson, and G. Sypniewska. 1980. Differentiation and Function of Rat Adipocyte Precursor Cells in Primary Culture. J. Lipid Res. 21:714-723.
Burrow, H. M., S. S. Moore, D. J. Johnston, W. Barendse, and B. M. Bindon. 2001. Quantitative and molecular genetic influences on properties of beef: a review. Australian Journal of Experimental Agriculture 41:893-919.
Childs, K. D., D. W. Goad, M. F. Allen, D. Pomp, C. R. Krehbiel, R. D. Geisert, J. B. Morgan, and J. R. Malayer. 2002. Differential expression of the NAT1 translational repressor during development of bovine intramuscular adipocytes. Physiological Genomics 10:49-56.
Cornelius, P., O. A. Macdougald, and M. D. Lane. 1994. Regulation of adipocyte development. Annual Review of Nutrition 14:99-129.

5
Crouse, J. D., H. R. Cross, and S. C. Seidman. 1984. Effects of grass or grain diet on the quality of three beef muscles. J. Anim. Sci. 58:619-625.
Dolezal, H. G., G. C. Smith, J. W. Savell, and Z. L. Carpenter. 1982. Comparison of subcutaneous fat thickness, marbling and quality grade for predicting palatability of beef. J. Food. Sci. 47:397-402.
Green, H. and M. Meuth. 1974. Established Pre-Adipose Cell Line and Its Differentiation in Culture. Cell 3:127-133.
Gregoire, F. M., C. M. Smas, and H. S. Sul. 1998. Understanding Adipocyte Differentiation. Physiol. Rev. 78:783-809.
Harper, G. S. 1997. Trends in skeleltal muscle biology and the understanding of toughness in beef. Australian Journal of Agricultural Research 50:1105-1129.
Hu, Z. L., E. R. Fritz, and J. M. Reecy. 2007. AnimalQTLdb: a livestock QTL database tool set for positional QTL information mining and beyond. Nucleic Acids Res. 35:D604-D609.
Johnson, E. R. 1987. Marbling Fat in Beef. Meat Science 20:267-279. Kanehisa, M., S. Goto, M. Hattori, K. F. oki-Kinoshita, M. Itoh, S. Kawashima, T.
Katayama, M. Araki, and M. Hirakawa. 2006. From genomics to chemical genomics: new developments in KEGG. Nucleic Acids Res. 34:D354-D357.
Macdougald, O. A. and M. D. Lane. 1995. Transcriptional regulation of gene-expression during adipocyte differentiation. Annual Review of Biochemistry 64:345-373.
Patel, Y. M. and M. D. Lane. 1999. Role of calpain in adipocyte differentiation. Proc Natl Acad Sci, USA 96:1279-1284.
Patel, Y. M. and M. D. Lane. 2000. Mitotic clonal expansion during preadipocyte differentiation: Calpain-mediated turnover of p27. Journal of Biological Chemistry 275:17653-17660.
Pillai, A. T. V., X. Guo, D. M. Kupfer, C. R. Krehbiel, Y. A. M. S. Wickramasinghe, P. Ayoubi, B. A. Roe, and U. DeSilva. 2006. Differential expression analysis of adipogenesis in cattle.Plant and Animal Genome XIV Conference. Plant and Animal Genome XIV Conference, San Diego, CA.
Polineni, P., P. Aragonda, S. R. Xavier, R. Furuta, and D. L. Adelson. 2006. The bovine QTL viewer: a web accessible database of bovine Quantitative Trait Loci. Bmc Bioinformatics 7.
Smith, S. B., D. K. Lunt, and M. Zembayashi. 2000. Intramuscular fat deposition: The physiological process and the potential for its manipulation. Page 1 in 2000 Plains Nutrition Council Spring Conference. Texas A&M Research and Extension Center, Amarillo, TX.
Tang, Q. Q. and M. D. Lane. 1999. Activation and centromeric localization of CCAAT/enhancer- binding proteins during the mitotic clonal expansion of adipocyte differentiation. Genes Dev. 13:2231-2241.
Taylor, J. F., L. L. Coutinho, K. L. Herring, D. S. Gallagher, R. A. Brenneman, N. Burney, J. O. Sanders, R. V. Turner, S. B. Smith, R. K. Miller, J. W. Savell, and S. K. Davis. 1998. Candidate gene analysis of GH1 for effects on growth and carcass composition of cattle. Animal Genetics 29:194-201.

6
Torii, S. I., T. Kawada, K. Matsuda, T. Matsui, T. Ishihara, and H. Yano. 1998. Thiazolidinedione induces the adipose differentiation of fibroblast-like cells resident within bovine skeletal muscle. Cell Biology International 22:421-427.
USDA. 1997. Official United States standards for grades of carcass beef. US Department of Agriculture, Agriculture Marketing Services, Washington, DC.
Wheeler, T. L., L. V. Cundiff, and R. M. Koch. 1994. Effect of marbling degree on beef palatability in Bos taurus and Bos indicus cattle. J. Anim. Sci. 72:3145-3151.
Wu, P. X., K. Sato, F. Suzuta, Y. Hikasa, and K. Kagota. 2000. Effects of lipid-related factors on adipocyte differentiation of bovine stromal-vascular cells in primary culture. Journal of Veterinary Medical Science 62:933-939.
Yu, S. L., K. C. Jung, Y. J. Lee, J. H. Lee, D. H. Yoon, S. H. Lee, K. D. Choi, and B. C. Sang. 2004. Identification of differentially - expressed genes in skeletal muscles in Hanwoo (Korean cattle) using cDNA microarray. Page 70 in Proceedings of the 29th international conference on animal genetics.

7
Table 1. Selected up-regulated genes with pathway information retrieved from KEGG PATHWAY database. Gene name, KEGG pathway, Locus ID and fold difference in expression at each time point tested are depicted.
Gene name Kegg pathway Locus ID 6H 12H 24H 48H 72H 120H ADP,ATP carrier protein Calcium signaling pathway SLC25A4 - - 2.81 2.47 2.03 2.15
Apolipoprotein E Lipoprotein metabolism APOE - - - - 2.40 2.15 Caveolin 1 Focal adhesion CAV1 - - - - 2.05
CD36 antigen
PPAR signalingpathway, Adipocytokine signaling pathway, ECM receptor
interaction, Aematopoietic cell lineage
CD36 - 3.17 6.15 5.01 6.29 8.80
Coagulation factor III Complement and coagulation cascades F3 - - - 2.13 - -
Fatty acid-binding protein, adipocyte PPAR signaling pathway FABP4 - 2.17 2.87 3.73 11.17 6.39
Ferritin, heavy polypeptide
Porphyrin and chlorophyll metabolism FTH1 - - 2.40 2.49 2.32 2.27
Fibronectin Focal adhesion, cell
Communication, Regulation of actin cytoskelton
FN1 - - - - - 2.23
Glucose-6-phosphate isomerase
Glycolysis/gluconeogenesis, Pentose phosphate pathway,
Starch and sucrose metabolism GPI - 3.27 3.42 3.07 2.49 -
Glutathione peroxidase plasma
Arachidonic acid metabolism, Glutathione metabolism GPX3 - - - - 2.86 2.84
Glutathione S-transferase M1
Glutathione metabolism, Metabolism of xenobiotics by
cytochrome P450 GSTM1 - - 2.63 2.24 2.43 -
Leptin
Adipocytokine signaling pathway, Cytokine-cytokine
receptor interaction, Neuroactive ligand receptor
interaction
LEP - - - - 3.14 -
Microsomal glutathione S-transferase 1
Glutathione metabolism, Metabolism of xenobiotics by
cytochrome P450 MGST1 - - 2.79 3.82 5.21 3.19
Peroxiredoxin 6 Phenylalanine metabolism,
Butanoate metabolism, Methane metabolism
AOP2 2.31 2.19 2.25 - - -
Predicted:Complement factor B precursor
Complement and coagulation cascades BF - - - - 2.26 -

8
Table 2. Selected down-regulated genes with pathway information retrieved from KEGG PATHWAY database. Gene name, KEGG pathway, Locus ID and fold difference in expression at each time point tested are depicted.
Gene name Kegg pathway Locus ID 6H 12H 24H 48H 72H 120H
Actin, beta
Focal adhesion, Regulation of actin cytoskelton, Cell
communication, Adherens junctions, Tight junctions,
Leukocyte trans endothelial migration,
ACTB - - 2.40 3.62 - -
Platelet-derived growth factor B (PDGFB), mRNA
Focal adhesion, Regulation of actin cytoskelton, Glioma,
MAPK signalng pathway, Gap junction, Melanoma
PDGFB - 2.18 - - - -
PREDICTED:Calmodulin 2 (CALM2)
Calcium signaling pathway, Phosphatidyl inositol signaling
pathway, Insulin signaling pathway, GnRH signaling
pathway
CALM2 - - - - 2.49 -
Pro alpha 1(I) collagen Focal adhesion, cell
communication, ECM receptor interaction
COL1A1 - - - 2.04 2.16 -
Serpine1 Complement and coagulation cascades SERPINE1 - - - 2.50 3.10 2.50
Seryl-tRNA synthetase Glycine, Serine and threonine metabolism, amino acyl tRNA
biosynthesis SARS - - - 2.35 -
9
Cellular aspects of intramuscular adipogenesis: Competition for cells between muscle and marbling
Ki Yong Chung, Ph.D. and Bradley J. Johnson, Ph.D.
Nutritional Growth and Development Laboratory Department of Animal Sciences and Industry
Kansas State University, Manhattan
Introduction
A recent headline in Feedstuffs stated “Growth promotion can impede beef quality” (Feedstuffs, Jan. 15, 2007). The focus of this proceeding paper is to delve into the “Why?” of the aforementioned statement. A common answer is growth promotants, such as steroidal implants and β-adrenergic agonists, shift nutrient utilization toward carcass lean tissue deposition at the expense of adipose tissue. Previous work with TBA/E2 implants reported increased lean tissue deposition in beef cattle approximately 5 to 10 %. Much of this increased lean tissue deposition resulted in favorable responses in carcasses of cattle implanted with TBA/ E2. Generally, TBA/ E2 implants increased carcass weight 40 to 60 lb., increased ribeye area (REA) 0.5 to 1.0 in2, and had no effect on fat thickness as compared to nonimplanted fed the same number of days. We have observed an initial burst of protein gain during the first 40 d after implantation with TBA/E2 that resulted in carcasses from implanted steers with approximately 10 to 12% more carcass protein than carcasses from nonimplanted steers fed the same number of days (Johnson et al., 1996a). It seemed that after d 40, rates of carcass protein deposition were similar between implanted and nonimplanted steers. This implied that differences in carcass protein mass at the end of the feeding period after implantation with TBA/E2 may be largely due to significant increases in muscle deposition during the first 40 d after implantation. One could make the argument that any type of growth promotion will shift or partition nutrient demand/utilization from one tissue to a different one during the early stages after implanting. This has served as a basis of why some delayed implant or low-dose implant programs in yearling cattle have been successful at attenuating the decrease in quality grade at harvest. However, instead of focusing on the shift of nutrient utilization during periods of growth promotion or lack thereof, the focus of this discussion will be at the cellular level. It is our hypothesis that growth promotion first impacts the direction certain non-differentiated, “stem cell-like” mesodermal cells proceed. Once these cells progress towards a certain phenotype any change is often irreversible. An increased understanding of cellular mechanisms affected by growth promotion then in turn can help explain shifts in nutrient utilization by the whole animal. This discussion will give brief overviews of both skeletal muscle and adipose tissue growth and development in cattle, the process of transdifferentiation between two cell types, and conclude with how growth promotants may push a non-differentiated cell to become a certain lineage.

10
Postnatal skeletal muscle growth in cattle
The individual muscle fiber is considered the cellular unit of skeletal muscle tissue. The postnatal skeletal muscle fiber has several, distinguishing characteristics compared to cells that make up other tissues.
• Skeletal muscle fiber number is fixed at birth in most meat animals • Individual fibers cannot divide • Skeletal muscle fibers are large, multinucleated cells • Individual nuclei present in the fiber are considered post-mitotic, in that they
don’t divide • Postnatal DNA accumulation into the fiber is highly correlated to rate muscle
growth • Muscle satellite cells are recognized as the source of DNA needed to support
muscle growth • Accumulation of DNA from satellite cells into existing fibers is a rate-limiting
step for maximizing postnatal muscle hypertrophy The muscle fibers, as well as nuclei within each fiber, are post-mitotic,
having lost the ability to divide. Additionally, muscle fiber number is fixed at birth in most meat animals. In order to sustain postnatal muscle hypertrophy, the muscle fiber needs an external source of DNA. The DNA accumulation responsible for postnatal muscle hypertrophy is highly correlated to muscle growth rate (Trenkle et al., 1978). In fact, 60 to 90% of DNA located within mature skeletal muscle fibers is accumulated during postnatal growth (Allen et al., 1979). Muscle satellite cells are now known to be the source of DNA responsible for postnatal muscle hypertrophy (Figure 1). By supplying more DNA to the individual fiber, there is more “machinery” available to ultimately, synthesize a greater amount of protein within each fiber. Hence, the positive relationship between DNA content in the fiber and rate of muscle growth in cattle.
Satellite cells are mononucleated cells located between the basal lamina and
sarcolemma of the muscle fiber (Mauro, 1961). Moss and LeBlond (1970) determined there were two types of nuclei within the basement membrane of the muscle fiber that were distinguishable from one another. Following the labeling of nuclei by a single [3H]-thymidine injection, male rats were sacrificed at different time intervals and the tibialis anterior muscle was removed for radioautography analysis. The results of this study showed that the true muscle nuclei were not labeled at 1 h following injection, indicating they were not actively dividing. However, the nuclei within the basement membrane were labeled, indicating the satellite cells were able to synthesize DNA and divide. Moss and LeBlond (1970) also reported that over the time course of 72 h, the number of labeled true muscle nuclei was increasing while the number of labeled satellite cells decreased. This lead to the conclusion that the source of labeled nuclei being counted within the fiber over the 72 h time frame were in fact that of satellite cells that were dividing and incorporating into the existing muscle fibers. Once the satellite cells fused with the existing fiber and donated their nuclei, they in turn lost their proliferative capacity (Moss and Leblond,

11
1971). These studies confirmed the postmitotic nature of true muscle nuclei and the importance of the muscle satellite cell in postnatal skeletal muscle growth.
The necessity of satellite cells in postnatal muscle growth is well understood, however, there are still limitations to the degree of DNA accretion at later stages of muscle growth. In a newborn animal, 30% of muscle nuclei are satellite cells, but the number reduces to 2 to 10% in mature animals, thus showing the actual number of satellite cells decrease with age (Cardasis and Cooper, 1975). This becomes a challenge in optimizing skeletal muscle hypertrophy in more mature cattle due to the small population of progenitor cells available to contribute to the existing fiber. Not only is there a reduction in satellite cell number, but also those cells still present withdraw from the proliferative state of the cell cycle and enter G0 (a state of quiescence) which leads to a growth plateau (Cardasis and Copper, 1975). In order to maintain the satellite cell population necessary to support muscle hypertrophy in mature animals, the cells in quiescence must be activated to allow them to progress through the cell cycle and contribute nuclei to the existing muscle fiber. Hepatocyte growth factor (HGF) is required to activate quiescent satellite cells (Allen et al., 1995). Hepatocyte growth factor is the active agent in crushed muscle extract responsible for satellite cell activation needed for muscle regeneration (Bischoff, 1986; Tatsumi et al., 1998), and it is the only known growth factor capable of activating satellite cells that exist in a state of quiescence. Interestingly, satellite cells express the receptor for HGF, c-met, at all times, but it isn’t until HGF is produced and released that the cells are activated (Allen et al., 1995).
Once quiescent satellite cells have been activated, there is a need for growth factors capable of stimulating satellite cell proliferation and subsequent differentiation. Insulin-like growth factor-I (IGF-I) and fibroblast growth factor-2 (FGF-2) are known as progression factors due to their ability to aid in progressing cells through the cell cycle. Both growth factors are both potent stimulators of satellite cell proliferation (Johnson and Allen, 1990; Allen and Rankin, 1990). However, IGF-I is unique in skeletal muscle in that it is also promotes muscle cell differentiation, whereas FGF-2 inhibits differentiation (Allen and Boxhorn, 1989; Allen and Rankin, 1990). The transforming growth factor-β (TGF-β) superfamily members are also capable of regulating satellite cell activity. These growth factors are considered negative regulators of skeletal muscle in that they inhibit both proliferation, and differentiation (Allen and Rankin, 1990). One member of the TGF-β superfamily responsible for negative regulation of skeletal muscle is myostatin, also known as growth and differentiation factor 8 (GDF-8) (McPherron et al., 1997). Myostatin is responsible for double muscling observed in cattle due to a mutation in the myostatin gene (McPherron and Lee, 1997). This embryonic mutation leads to a greater number of muscle fibers in each muscle, as witnessed in double-muscled cattle. This recent discovery has led to evaluation of the possible use of myostatin in therapeutic settings such as muscular dystrophy, as well as future use in growth promoting systems for meat animals. The regulation of growth-factor mediated changes in satellite cell proliferation and differentiation is controlled by a family of
12
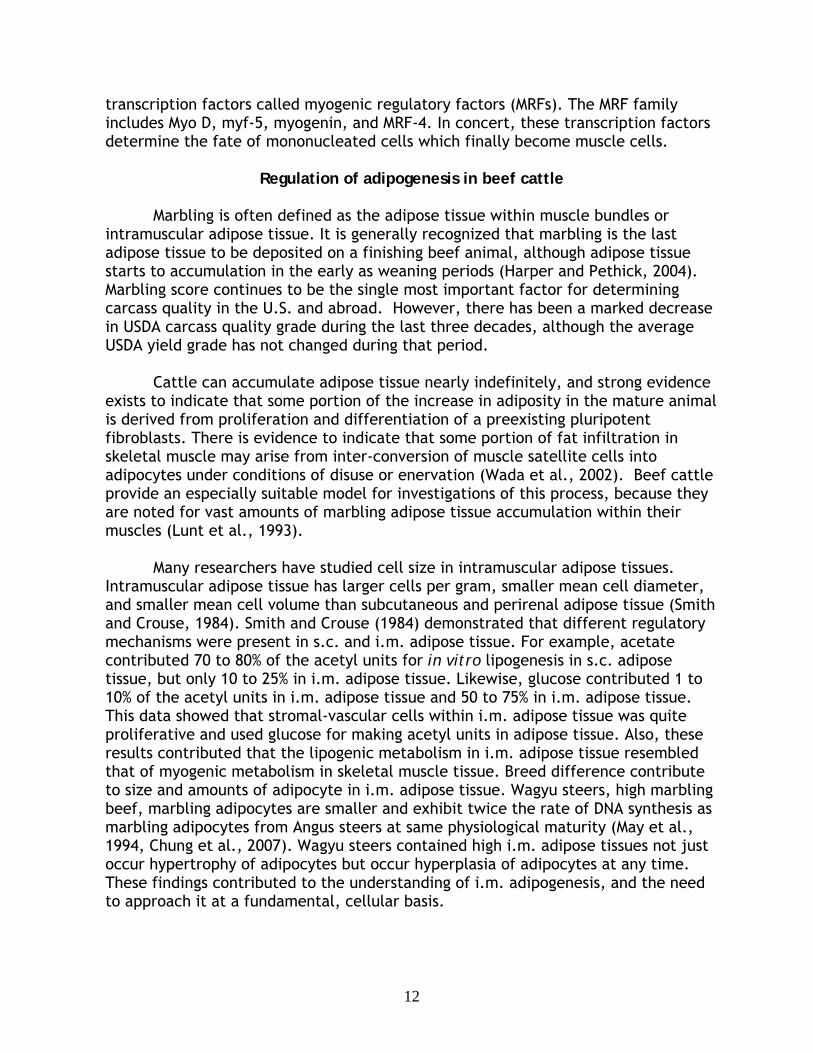
transcription factors called myogenic regulatory factors (MRFs). The MRF family includes Myo D, myf-5, myogenin, and MRF-4. In concert, these transcription factors determine the fate of mononucleated cells which finally become muscle cells.
Regulation of adipogenesis in beef cattle
Marbling is often defined as the adipose tissue within muscle bundles or
intramuscular adipose tissue. It is generally recognized that marbling is the last adipose tissue to be deposited on a finishing beef animal, although adipose tissue starts to accumulation in the early as weaning periods (Harper and Pethick, 2004). Marbling score continues to be the single most important factor for determining carcass quality in the U.S. and abroad. However, there has been a marked decrease in USDA carcass quality grade during the last three decades, although the average USDA yield grade has not changed during that period.
Cattle can accumulate adipose tissue nearly indefinitely, and strong evidence
exists to indicate that some portion of the increase in adiposity in the mature animal is derived from proliferation and differentiation of a preexisting pluripotent fibroblasts. There is evidence to indicate that some portion of fat infiltration in skeletal muscle may arise from inter-conversion of muscle satellite cells into adipocytes under conditions of disuse or enervation (Wada et al., 2002). Beef cattle provide an especially suitable model for investigations of this process, because they are noted for vast amounts of marbling adipose tissue accumulation within their muscles (Lunt et al., 1993).
Many researchers have studied cell size in intramuscular adipose tissues.
Intramuscular adipose tissue has larger cells per gram, smaller mean cell diameter, and smaller mean cell volume than subcutaneous and perirenal adipose tissue (Smith and Crouse, 1984). Smith and Crouse (1984) demonstrated that different regulatory mechanisms were present in s.c. and i.m. adipose tissue. For example, acetate contributed 70 to 80% of the acetyl units for in vitro lipogenesis in s.c. adipose tissue, but only 10 to 25% in i.m. adipose tissue. Likewise, glucose contributed 1 to 10% of the acetyl units in i.m. adipose tissue and 50 to 75% in i.m. adipose tissue. This data showed that stromal-vascular cells within i.m. adipose tissue was quite proliferative and used glucose for making acetyl units in adipose tissue. Also, these results contributed that the lipogenic metabolism in i.m. adipose tissue resembled that of myogenic metabolism in skeletal muscle tissue. Breed difference contribute to size and amounts of adipocyte in i.m. adipose tissue. Wagyu steers, high marbling beef, marbling adipocytes are smaller and exhibit twice the rate of DNA synthesis as marbling adipocytes from Angus steers at same physiological maturity (May et al., 1994, Chung et al., 2007). Wagyu steers contained high i.m. adipose tissues not just occur hypertrophy of adipocytes but occur hyperplasia of adipocytes at any time. These findings contributed to the understanding of i.m. adipogenesis, and the need to approach it at a fundamental, cellular basis.

13
Recent research findings support the concept of two different lineages making up either backfat or marbling, based on the novel finding that these two types of adipocytes are derived from two distinctly different origins. It appears that adipocytes that are found in subcutaneous adipose tissue are derived from brown adipose tissue that was present at birth in calves. However, very recent, novel findings in a rodent model, report that resident, specialized muscle cells can be converted into the adipocytes that make up the intramuscular fat (marbling) within the muscle in vivo and in vitro (Wada et al., 2002; Singh et al., 2003). The muscle cells found in postnatal muscle are often referred to as muscle satellite cells. These progenitor cells have shown to be critical for supporting postnatal muscle growth in many species including beef cattle (Johnson et al., 1998). It is thought that there are various stages of differentiation of these muscle satellite cells in the muscle tissue of an adult animal. Under certain stimuli, these cells can be activated to proliferate (divide) and donate their DNA (nuclei) to the existing muscle fiber (differentiation). This is a critical rate-limiting step for postnatal muscle growth because the number of muscle fibers is fixed near birth in beef cattle and these fibers are large and contain many nuclei that no longer divide. In order to support greater size (growth) of the existing fibers, recruitment of more nuclei is necessary. In addition to the well-documented role these muscle progenitor cells play in supporting postnatal muscle growth in beef cattle, it appears likely that these cells under appropriate conditions can proceed down the adipose tissue pathway rather than the skeletal muscle differentiation pathway.
The 3T3-L1 cell line is one of the most well-characterized and reliable models
for studying the conversion of preadipocytes into adipocytes. Up-regulation of genes important during differentiation is summarized in Figure 2. When injected into mice, 3T3-L1 preadipocytes differentiate and form fat pads that are indistinguishable from normal adipose tissue. In culture, differentiated 3T3-L1 preadipocytes possess most of the structural characteristics of adipocytes from animal tissue. The formation and appearance of developing fat droplets also mimic live adipose tissue (Green and Kehinde, 1974). Confluent 3T3-L1 preadipocytes can be differentiated synchronously by a defined adipogenic component. Maximal differentiation is achieved upon treatment with the combination of insulin, a glucocorticoid, an agent that elevates intracellular cAMP levels, and fetal bovine serum (Cornelius et al., 1994). Insulin is known to act through the insulin-like growth factor I (IGF-I) receptor. IGF-I can be substituted for insulin in the adipogenic cocktail. Dexamethasone, a synthetic glucocorticoid agonist, is traditionally used to stimulate the glucocorticoid receptor pathway. Methylisobutylxanthine, a cAMP-phosphodiesterase inhibitor, is traditionally used to stimulate the cAMP-dependent protein kinase pathway. These adipogenic components are commonly abbreviated MDI (Methylisobutylxanthine, Dexamethasone, Insulin). Approximately 24 h after induction by MDI, differentiating preadipocytes undergo a postconfluent mitosis and subsequent growth arrest (Bernlohr et al., 1985). The cells undergo at least one round of DNA replication and cell division. By d 2 of differentiation, the cells complete the postconfluent mitosis and enter into an unusual growth arrest called GD (Scott et al., 1982). This terminal mitosis is believed necessary to unwind DNA, allowing transcription factors access to

14
regulatory response elements present in genes involved in modulating the mature adipocyte phenotype (Cornelius et al., 1994). After the growth arrest, cells are committed to becoming adipocytes. The growth arrest is required for subsequent differentiation. Growth-arrested cells begin to express late markers of differentiation at d 3. These late markers consist of lipogenic and lipolytic enzymes, as well as other proteins responsible for modulating the mature adipocyte phenotype. The cells then round up, accumulate fat droplets and become terminally differentiated adipocytes by d 5–7.
Adipose differentiation processes are genetically regulated by diverse
hormonal and nutritional factors. CCAAT/enhancer-binding protein β (C/EBPβ) and peroxisome proliferators-activated receptor γ (PPARγ), transcriptional factors expressed early and intermediate stage of adipocyte differentiation, induced to mature adipoctye regulated by PPARγ activators. C/EBPβ protein in initiating adipogenic program was expressed in early stage of adipose differentiation. Expression of C/EBPβ can converts pluripotent cell into preadipocytes that induced PPAR activators to differentiation (Wu et al., 1995). Among the PPARs, PPARγ is expressed primarily in adipose tissue and is induced adipocyte differentiation as a heterodimer. There is a report when PPARγ expressed in the myoblast cell line, it can suppress the muscle specific transcription factors (Myf5, MyoD, myogenin and MRF4) (Hu et al., 1995). This data suggested that adipogenic transcription factors can also involved to satellite cell differentiation.
Stearoyl-Co A desaturase (SCD) gene expression can be used as a later marker
for adipocyte differentiation (Figure 2). SCD gene expression is induced by growth factors and hormones and promotes de novo fatty acid synthesis not only in the adipocyte but also in the muscle tissue (Miyazaki et al., 2003; Chang et al., 1992). SCD gene expression and enzyme activity in bovine adipose tissues are an indicator of fat softness and an important aspect of meat quality (Smith et al., 1998, Chung et al., 2007). SCD is an endoplasmic reticulum-anchored enzyme that converts palmitoyl-CoA and stearoyl-CoA to palmitoleoyl-CoA and oleoyl-CoA catalyzed by the NADH- and O2-dependent desaturation of saturated fatty acid (SFA). (Miyazaki and Ntambi, 2003). High carbohydrate condition and insulin induced SCD gene expression through sterol regulatory element binding protein 1 (SREBP1) cascade (Shimano, 2001). Monounsaturated fatty acid (MUFA) are used as major precursors for the synthesis of various lipid forms, including triaylglycerol (TAG), phospholipids, cholesterol ester (CE), and wax esters. Oleic acid, a major MUFA in animal adipose tissue synthesized by SCD, is the active precursor for acyl-CoA cholesterol acyltransferase (ACAT) in CE biosynthesis and diacylglycerol acyltransferase (DGAT) in TAG synthesis. Oleic acid also has been reported to regulate cell development and differentiation through control of membrane fluidity and signal transduction (Ntambi, 1999; Miyazaki et al., 2001). SCD activity affects not only the fatty acid composition in plasma membranes but also lipid metabolism in adipose tissue. Therefore, C/EBPβ, PPARγ and SCD are not only activate many lipogenic genes and control adipogenesis but also involve in central role of adipose differentiation.

15
Conversion of primitive cells to a different fate: transdifferentiation There are several in vitro studies that have demonstrated a role for
adipogenic transcriptional factors, PPARγ and C/EBPα (Figure 3), inducing adipocyte number in the skeletal muscle in cattle and pig (Poulos and Hausman. 2006, Torii et al., 1998). These two adipogenic transcriptional factors gradually express under the transdifferentiation process of myoblasts, when exposed to thiazolidinedione (TZD). Otherwise, these factors did not express when myoblasts were treated with optimal myogenic differentiation conditions (Hu et al., 1995). TZD known as transcriptional factor specific ligands and long chain fatty acids can induce transdifferentiation from myoblast cell to adipocytes (Grimaldi et al., 1997, Hu et al., 1995, Teboul et al., 1995, and De Coppi et al., 2006). TZD used as antidiabetic agents improves insulin sensitivity and glucose uptake by activating GLUT4 (Mukherjee et al., 2000). The physiological activity of TZD can affect the balance of muscle and adipose stromal-vascular cell and then maybe affect intramuscular adipogenesis (Poulos and Hausman. 2006). Glucose uptake in i.m. adipocyte of beef cattle may have more important factor for improving marbling. TZD mediated adipose improvement of i.m. adipose tissue contributes to enhanced quality of beef cattle. However, there are other physiological activities for using TZD that have been reported. TZD can transdifferentiate bone marrow cells to adipocyte and unbalance of the adipogenic activity in bone marrow which causes anemia (Gimble et al., 1996). Also TZD may decrease the skeletal muscle mass by suppression of myogenic gene expression (Singh et al., 2003). Torii et al., (1998) reported that fibroblast-like cells, resident in bovine skeletal muscle, could be converted to adipocytes when exposed to the TZD, T-174. Interestingly, the endogenous ligand of PPAR-γ, prostaglandin J2, could not induce the bovine-derived fibroblast cells to become adipocytes like has been reported in rodent models. Thus, suggesting potential species differences.
A very recent report (Table 1; Singh et al., 2007) investigated the effect of a
potent TZD, ciglitizone, on transdifferentiation of procine muscle satellite cells to adipocytes. Under normal myogenic culture conditions, porcine muscle satellite cells became multi-nucleated myotubes indicating normal myogenic differentiation. Exposure of these muscle satellite cells to ciglitizone completely ameliorated fusion (formation of multi-nucleated myotubes) and caused formation of cells containing lipid droplets suggesting conversion of muscle cells to adipocytes. Further investigation revealed that in the ciglitizone-treated groups, expression of C/EBP-α and PPAR-γ were up-regulated. Consequently, the expression of C/EBP-α and PPAR-γ was sufficient to block muscle differentiation and result in transdifferentiation of muscle satellite cells to adipocytes. Taken together, these data show the profound effect TZDs can have on conversion of muscle cells to adipocytes. The next generation of research will need to begin investigating the effect of these products on in vivo changes.

16
Growth promotants and cellular responses
Insulin-like growth factor I (IGF-I) has been shown to be potent stimulator of protein synthesis in skeletal muscle and at the same time can reduce the rate of protein degradation. Previous research demonstrated that administration of a combined TBA/E2 implant resulted in increased circulating IGF-I and IGF-I mRNA levels in the longissimus muscles of implanted steers as compared to nonimplanted steers 30 to 40 d after implantation (Johnson et al., 1996b; 1998b; Dunn et al., 2003; White et al., 2003). In addition, Pampusch et al. (2003) reported that IGF-I mRNA levels in longissimus muscle biopsy samples from implanted steers were greater than those of nonimplanted steers as quickly as 12 d after implantation. These results suggest that the muscle of implanted steers may produce more IGF-I than that of non-implanted cattle. Additionally, circulating levels of IGF-I will be greater in sera from cattle implanted with TBA/E2 compared to nonimplanted cattle. Taken together these effects of implanting will have positive effects on enhancing protein accretion in existing skeletal muscle fibers.
For the increase in protein mass to be sustained long-term in skeletal muscle,
eventually the fiber will need more “machinery” or added DNA to aid in the process of protein synthesis. As discussed above, this is an important role of the muscle satellite cell. Satellite cells lie between the basal lamina and sarcolemma of individual muscle fibers. They are capable of proliferating/dividing and ultimately “fuse” into the adjoining fiber to donate their nuclei to support the ramped up protein synthesis. Consequently, factors that can impact rate of satellite cell incorporation into existing fibers will have a positive impact on postnatal muscle hypertrophy. TBA/E2 administration to yearling steers resulted in an increase in the number of actively proliferating, satellite cells within 35 days of implantation (Johnson et al., 1998a). This is important in light of the fact that only a small number of satellite cells are present at this time in yearling cattle. In addition many of these satellite cells have become quiescent or left the cell cycle. We feel that an important mode of action of anabolic steroid mediated muscle hypertrophy involves altering the activity of muscle satellite cells. It is thought that the enhanced IGF-I production by the muscle fiber after administration of the steroid implants mediated the increased proliferative activity of these satellite cells. In addition, in vitro studies have revealed that trenbolone and estradiol can directly increase the rate of cell proliferation of cultured satellite cells isolated from bovine skeletal muscle (Kamanga-Sollo et al., 2004). Based on the discussion in the previous section, increased proliferative activity of satellite cells should enhance the rate of muscle growth in cattle. Taken together, these findings strongly support a mechanism for steroid implant-induced muscle growth in beef cattle that involves increases in the local production of muscle IGF that in turn enhances satellite cell activity and consequently increases skeletal muscle growth.
If we assume there are a small number of these progenitor cells present in
more mature bovine skeletal muscle, administration of steroidal implants will potentially, activate, increase proliferation capacity, and ultimately, induce

17
differentiation of the daughter cells to existing muscle fibers. A recent report further showed that as compounds, like anabolic steroids, were causing progenitor cells to go down the myogenic pathway they were also blocking their entry to the adipogenic pathway. Singh et al., (2003) used the pluripotent, immortalized cell line, C3H 10T1/2 to investigate the direct effect of androgens on myogenic and adipogenic differentiation. Interestingly, the number myogenic cells and myosin protein levels increased in a dose-dependent fashion in response to both testosterone and dihydrotestosterone (DHT) addition. At the same time these two steroids decreased the number of adipocytes formed by the 10T1/2 cells and down-regulated both C/EBP-α and PPAR-γ protein expression. These profound effects were blocked by a specific androgen receptor antagonist, bicalutamide, indicating the steroids were mediating these cell fates through the androgen receptor on the pluripotent cells. Although conducted with rodent pluripotent cells in a cell culture model, these data increase our understanding of the potential effects of anabolic steroids used in implants on the push of primitive muscle-derived cells to stay muscle cells and not become adipocytes. Thus offering us a cellular explanation of how growth promotion could positively impact skeletal muscle growth and simultaneously inhibit marbling. Another recent report challenges the effects of TBA/E2 administration on inhibiting markers of adipose conversion. Smith et al., (2007) reported that administration of two Synovex Plus implants (200 mg trenbolone acetate and 28 mg estradiol benzoate) to both steers and heifers did not alter mRNA expression for important markers of adipogenesis like acetyl CoA carboxylase, stearyl CoA desaturase, and lipoprotein lipase at the end of 140-d feeding period. Although the authors did not analyze changes over a time course following implanting, one could hypothesize that changes at the end of the feeding period may not be reflective of what occurred immediately following implanting. Interestingly, in steers the number of intramuscular adipocytes per gram of tissue was greater in implanted cattle compared to nonimplanted cattle. In addition, this response only occurred for the intramuscular adipocytes and not subcutaneous adipocytes. In heifers these differences only tended to be different but paralled the response observed in steers. One could hypothesize, the administration of the implant earlier in the feeding period engaged the primitive cells to proliferate, albeit most went to become muscle, the pool available to transdifferentiate could have been larger due to implanting. Therefore at the end of the feeding period when steroid levels wanted these cells became intramuscular adipocytes within the muscle.
It appears that progestins may have opposite effects of androgens and
estrogens in skeletal muscle. In a study by Sissom et al. (2006), the addition of MGA to cultured bovine satellite cells resulted in a dose dependent decrease in [3H]-thymidine incorporation with both supraphysiological and physiological concentrations. Furthermore, in the experiments utilizing C2C12 myoblasts, both MGA and progesterone addition resulted in significant reductions in [3H]-thymidine incorporation when IGFBP-3-stripped media was utilized. In order to examine the mechanism through which MGA and P4 reduced [3H]-thymidine incorporation rate in C2C12 myoblasts, the antiprogestin RU486 was utilized. Progesterone activity is

18
inhibited by RU486 through the nuclear progesterone receptor. However, in these experiments, the addition of RU486 to cultures treated with either MGA or P4 did not block the reduction in [3H]-thymidine incorporation. Interestingly, RU486 added alone to C2C12 myoblasts resulted in a significant reduction in [3H]-thymidine incorporation similar to MGA and P4 treated cultures. The inability of RU486 to block the effect of MGA and P4 has been demonstrated in other cell types and is referred to as non-genomic actions. Non-genomic actions do not involve binding to the classic nuclear receptor and therefore are not affected by inhibitors of that mechanism, such as RU486. Additionally, these responses are very rapid and involve second messenger systems such as cyclic AMP or intracellular Ca2+. These data support the hypothesis that the reduction in [3H]-thymidine incorporation rate observed in C2C12 myoblasts treated with MGA or P4 may be mediated through a non-genomic mechanism, which provides further insight into the direct actions of progestins on skeletal muscle. It is interesting that many nutritionists feel that inclusion of MGA may improve marbling scores. The fact it appears to have anti-anabolic properties in muscle cell cultures may imply that it can stimulate transdifferentiation of muscle cells to adipocytes. More research needs to be conducted with progestins and transdifferentiation.
We have addressed the effects of anabolic steroid growth promotion on
cellular conversion, now what impact may feeding approved β-adrenergic agonists have on cellular transdifferentiation. One of the most pronounced effects of feeding a β-adrenergic agonist to ruminants is the preferential dramatic increase in skeletal muscle mass and/or cross-sectional area of individual muscles. Due to the dramatic increase in skeletal muscle hypertrophy following β-adrenergic agonist administration to ruminants, one would expect satellite cell proliferation and subsequent fusion of the satellite cells, to provide a source of DNA to support the rapid changes in muscle mass, similar to action of steroid implants. However, the majority of previous work suggested during the 3 to 5 weeks of β-adrenergic agonist stimulated muscle hypertrophy, no change in number of nuclei occurred. A constant DNA amount (nuclei number) coupled with rapid changes in muscle mass and consequently, protein accumulation results lower DNA concentration of individual muscles in β-adrenergic agonist-fed animals compared to untreated controls. Since DNA accumulation during rapid periods of muscle hypertrophy does not occur due to feeding a β-adrenergic agonist, many researchers have focused on the direct of β-adrenergic agonists, binding to their receptors (β-adrenergic receptors) affecting either rate of protein synthesis, protein degradation or both. Skeletal muscle in cattle has been shown to have abundant numbers of β-adrenergic receptors on the cell surface. Previous research has shown that many β-adrenergic agonists are capable of increasing protein synthesis and decreasing protein degradation. The net affect of these changes are dramatic changes in accretion of protein within skeletal muscle tissue. It appears that β-adrenergic agonists cause existing nuclei within the muscle fiber to become much more efficient at increasing muscle protein accumulation without the support of additional DNA from satellite cells. However, over a course of 3 to 5 weeks it becomes difficult for skeletal muscle to sustain this level of fiber hypertrophy without additional DNA and consequently, responsiveness

19
to the β-adrenergic agonists is dampened. These results indicate that administration of a β-adrenergic agonist to cattle may have minimal effects on primitive cell activity.
Conclusions
Commonly used growth promotants, such as steroidal implants and β-
adrenergic agonists, have recently been implicated as one contributing factor that has led to reduced marbling scores in beef cattle. These compounds are effective at improving lean tissue deposition in cattle thus, significantly improving feed efficiency. An increased understanding of how these agents are affecting cellular aspects of growth and development of both skeletal muscle and adipose tissue will allow us as cattle feeders, consultants, and researchers, to instigate intervention strategies to ameliorate the reduced marbling scores. If successful, these strategies would still allow maximal lean tissue growth, hence maximal feed efficiency, but also result in carcasses with optimal quality.
Literature Cited
Allen, R. E., and L. K. Boxhorn. 1989. Regulation of skeletal muscle satellite cell
proliferation and differentiation by transforming growth factor-beta, insulin-like growth factor I, and fibroblast growth factor. J. Cell. Physiol. 138: 311-315.
Allen, R. E., R. A. Merkel, and R. B. Young. 1979. Cellular aspects of muscle growth: myogenic cell proliferation. J. Anim. Sci. 49: 115-127.
Allen, R. E., and L. L. Rankin. 1990. Regulation of satellite cells during skeletal muscle growth and development. Proc. Soc. Exp. Biol. Med. 194: 81-86.
Allen, R. E., S. M. Sheehan, R. G. Taylor, T. L. Kendall, and G. M. Rice. 1995. Hepatocyte growth factor activates quiescent skeletal muscle satellite cells in vitro. J. Cell. Physiol. 165: 307-312.
Atraza, J. N., S. Bhasin, T. R. Magee, S. Reisz-Porszasz, R. Shen, N. P. Groome, M. M. Fareez, and N. F. Gonzalez-Cadavid. 2005. Myostatin inhibits myogenesis and promotes adipogenesis in C3H 10T(1/2) mesenchymal multipotent cells. Endocrinology 146:3547-3557.
Bernlohr, D. A., M. A. Bolanowski, T. J. Kelly, and M. D. Lane. 1985. Evidence for an increase in transcription of specific mRNAs during differentiation of 3T3-L1 preadipocytes. J. Biol. Chem. 260:5563-5567.
Bischoff, R. 1986. A satellite cell mitogen from crushed adult muscle. Dev. Biol. 115: 140-147.
Cao, Z., R. M. Umek, and S. L. McKnight. 1991. Regulated expression of three C/EBP isoforms during adipose conversion of 3T3-L1 cells. Gene Dev. 5:1538-1552.
Cardasis, C. A., and G. W. Cooper. 1975. A method for the chemical isolation of individual muscle fibers and its application to a study of the effect of denervation on the number of nuclei per muscle fiber. J. Exp. Zool. 191: 333-346.
Cornelius, P., O. A. MacDougald., and M. D. Lane. 1994. Regulation of adipocyte development. Annu. Rev. Nutr. 14;99-129.

20
Chang, J. H. P., D. K. Lunt, and S. B. Smith. 1992. Fatty acid composition and fatty aid elongase and stearoyl-CoA desaturase activities in tissues of steers fed high oleate sunflower seed. J. Nutr. 122:2074-2080.
Chung, K.Y., Lunt, D.K., Kawachi, H., Yano, H., and Smith, S.B. 2007. Lipogenesis and stearoyl-CoA desaturase gene expression and enzyme activity in adipose tissue of short- and long-fed Angus and Wagyu steers fed corn- or hay-based diets. J. Anim. Sci. 85:380-387.
DeCoppi, P., G. Milan, A. Scarda, L. Boldrin, C. Centobene, M. Piccoli, M. Pozzobon, C. Pilon, C. Pagano, P. Gamba, and R. Vettor. 2006. Rosiglitazone modifies the adipogenic potential of human muscle satellite cells. Diabetologia 49:1962-1973.
DeHaan, K. C., L. L. Berger, D. J. Kesler, F. K. McKeith, D. B. Faulkner, G. F. Cmarik and R. J. Favero. 1990. Effects of prenatal testosterone treatment and post natal steroil implantation on growth performance and carcass traits of heifers and steers. J. Anim. Sci. 68:2198-2207.
Dunn, J. D., B. J. Johnson, J. P. Kayser, A. T. Waylan, E. K. Sissom, and J. S. Drouillard. 2003. Effects of flax supplementation and a combined trenbolone acetate and estradiol implant on circulating insulin-like growth factor-I (IGF-I) and muscle IGF-I messenger RNA levels in beef cattle. J. Anim. Sci. 81:3028-3034.
Gimble, J. M., C. E. Robinson, X. Wu, K. A. Kelly, B. R. Rodriguez, S. A. Kliewer, J. M. Lehmann, and D. C. Morris. 1996. Peroxisome proliferator-activated receptor-γ activation by thiazolidinediones induces adipogenesis in bone marrow stromal cells. Mol. Pharmacol. 50:1087-1094.
Green, H., and O. Kehinde. 1974. An established pre-adipose cell line and its differentiation in culture. Cell 1:113-116.
Grimaldi, P. A., L. Teboul, H. Inadera, D. Gaillard, and E. Z. Amri. 1997. Trans-differentiation of myoblasts to adipoblasts: triggering effects of fatty acids and thiazolidinediones. Prost. Leuk. and Esst. Fatty Acids. 57:71-5.
Harper. G. S., and D. W. Pethick. 2004. How might marbling begin? Aust. J. Experi. Agri. 44:653-662.
Hausman, G. J. and S. Poulos. 2004. Recruitment and differentiation of intramuscular preadipocytes in stromal-vascular cell cultures derived from neonatal pig semitendinosus muscles. J. Anim. Sci. 82:429-437.
Hu, E., P. Tontonoz, and B. M. Spiegelman. 1995. Transdifferentiation of myoblasts by the adipogenic transcription factors PPARγ and C/EBPα. Proc. Natl. Acad. Sci. USA. 92:9856-9860.
Hunt, D. W., D. M. Henricks, G. C. Skelley, and L. W. Grimes. 1991. Use of trenbolone acetate and estradiol in intact and castrate male cattle: effects on growth, serum hormones, and carcass characteristics. J. Anim. Sci. 69:2452-2462.
Johnson, B. J., P. T. Anderson, J. C. Meiske, and W. R. Dayton. 1996a. Effect of a combined trenbolone acetate and estradiol implant on feedlot performance, carcass characteristics, and carcass composition of feedlot steers. J. Anim. Sci. 74:363-371.
Johnson, B. J., M. R. Hathaway, P. T. Anderson, J. C. Meiske, and W. R. Dayton. 1996b. Stimulation of circulating insulin-like growth factor-1 (IGF-1) and insulin-

21
like growth factor binding proteins (IGFBP) due to administration of a combined trenbolone acetate and estradiol implant in feedlot cattle. J. Anim. Sci. 74:372-379.
Johnson, B. J., N. Halstead, M. E. White, M. R. Hathaway, A. DiCostanzo, and W. R. Dayton. 1998a. Activation state of muscle satellite cells isolated from steers implanted with a combined trenbolone acetate and estradiol implant. J. Anim. Sci. 76:2779-2786.
Johnson, B. J., M. E. White, M. R. Hathaway, C. J. Christians, and W. R. Dayton. 1998b. Effect of a combined trenbolone acetate and estradiol implant on steady-state IGF-1 mRNA concentrations in the liver of wethers and in the longissimus muscle of steers. J. Anim. Sci. 76:491-497.
Johnson, S. E., and R. E. Allen. 1990. The effects of bFGF, IGF-I, and TGF-beta on RMo skeletal muscle cell proliferation and differentiation. Exp. Cell. Res. 187: 250-254.
Kamanga-Sollo, E., M. S. Pampusch, G. Xi, M. E. White, M. R. Hathaway, and W. R. Dayton. 2004. IGF-I mRNA levels in bovine satellite cell cultures: effects of fusion and anabolic steroid treatment. J. Cell Physiol 201:181-189.
Li, W., W. Yu., J. M. Quinlan., Z. D. Burke, and D. Tosh. 2005. The molecular basis of transdifferentiation. J. Cell. Mol. Med. 9:569-582.
Lunt, D. K., R. R. Riley, and S. B. Smith. 1993. Growth and carcass characteristics of Angus and American Wagyu steers. Meat Sci. 34:224-327.
Mauro, A. 1961. Satellite cell of skeletal muscle fibers. J. Biophys. Biochem. Cytol. 9: 493-495.
May, S. G., J. W. Savell, D. K. Lunt, J. J. Wilson, J. C. Laurenz, and S. B. Smith. 1994. Evidence for preadipocyte proliferation during culture of subcutaneous and intramuscular adipose tissues from Angus and Wagyu crossbred steers. J. Anim. Sci. 72:3110-3117.
McPherron, A. C., A. M. Lawler, and S. J. Lee. 1997. Regulation of skeletal muscle mass in mice by a new TGF-beta superfamily member. Nature 387: 83-90.
McPherron, A. C., and S. J. Lee. 1997. Double muscling in cattle due to mutations in the myostatin gene. Proc. Natl. Acad. Sci. USA 94: 12457-12461.
Miyazaki, M., and J. M. Ntambi. 2003. Role of stearoyl-coenzyme A desaturase in lipid metabolism. Prostaglandins Leukot. Essent. Fatty Acids 68:113-121.
Miyazaki, M, Y. C. Kim, and J. M. Ntambi. 2001. A lipogenic diet in mice with a disruption of the stearoyl-CoA desaturase 1 gene reveals a stringent requirement of endogenous monounsaturated fatty acids for triglyceride synthesis. J. Lipid Res. 42:1018-1024.
Moss, F. P., and C. P. Leblond. 1970. Nature of dividing nuclei in skeletal muscle of growing rats. J. Cell. Biol. 44: 459-462
Moss, F. P., and C. P. Leblond. 1971. Satellite cells as the source of nuclei in muscles of growing rats. Anat. Rec. 170: 421-435.
Mukherjee, R., P. A. Hoener, L. Jow, J. Bilakovics, K. Klausing, D. E. Mais, A. Faulkner, G. E. Crostont, and J. R. Paterniti, Jr. 2000. A selective peroxisome proliferator-activated receptor-gamma (PPARgamma) modulator blocks adipocyte differentiation but stimulates glucose uptake in 3T3-L1 adipocytes. Mol Endocrinal. 14:1425-1433.

22
Ntambi, J. M. 1999. Regulation of stearoyl-CoA desaturase by polyunsaturated fatty acids and cholesterol. J. Lipid Res. 1999. 40:1549-1558.
Pampusch, M. S., B. J. Johnson, M. E. White, M. R. Hathaway, J. D. Dunn, A. T. Waylan, and W. R. Dayton. 2003. Time course of changes in growth factor mRNA levels in muscle of steroid-implanted and non-implanted steers. J. Anim. Sci. 81:2733-2740.
Poulos, S. P. and G. J. Hausman. 2006. A comparison of thiazolidinedione-induced adipogenesis and myogenesis in stromal-vascular cells from subcutaneous adipose tissue or semitendinosus muscle of postnatal pigs. J. Anim. Sci. 84:1076-1082.
Scott, R. E., D. L. Florine, J. J. Wille, and K. Yun. 1982. Coupling of growth arrest and differentiation at a distinct state in the G1 phase of the cell cycle: GD. Proc. Natl. Acad. Sci. U.S.A. 79: 845–849.
Shimano, H. 2001. Sterol regulatory-element binding proteins (SREBPs) : transcriptional regulators of lipid synthetic genes. Prog. Lipid Res. 40:439-452.
Singh, N. K., H. S. Chae, I. H. Hwang, Y. M. Yoo, C. N. Ahn, S. H. Lee, H. J. Lee, H. J. Park, and H. Y. Chung. 2007. Transdifferentiation of porcine satellite cells to adipoblasts with ciglitizone. J. Anim. Sci. 85:(In press).
Singh, R., J. N. Artaza, W. E. Taylor, N. F. Gonzales-Cadavid, and S. Bhasin. 2003. Androgens stimulate myogenic differentiation and inhibit adipogenesis in C3H 10T1/2 pluripotent cells trough an androgen receptor-mediated pathway. Endocrinology 144:5081-5088.
Sissom, E. K., C. D. Reinhardt, and B. J. Johnson. 2006. Melengestrol acetate alters carcass composition in feedlot heifers through changes in muscle cell proliferation. J. Anim. Sci. 84:2950-2958.
Smith, K. R., S. K. Duckett, M. J. Azain, R. N. Sonon Jr., and T. D. Pringle. 2007. The effect of anabolic implants on intramuscular lipid deposition in finished beef cattle. J. Anim. Sci. 85:430-440.
Smith, S. B., A. Yang, T. W. Larsen, and R. K. Tume. 1998. Positional analysis of triacylglycerols from bovine adipose tissue lipids varying in degree of unsaturation. Lipids 33:197-207.
Smith, S. B., D. K. Lunt, and M. Zembayashi. 2000. Intramuscular fat deposition: The physiological process and the potential for its manipulation. In Proc. Plains Nutrition Conf. Pub. No. AREC 00-22, Texas A&M Univ. pp 1-12.
Smith, S. B., and J. D. Crouse. 1984. Relative contributions of acetate, lactate, and glucose to lipogenesis in bovine intramuscular and subcutaneous adipose tissue. J. Nutr. 114:792-800.
Tatsumi, R., J. E. Anderson, C. J. Nevoret, O. Halevy, and R. E. Allen. 1998. HGF/SF is present in normal adult skeletal muscle and is capable of activating satellite cells. Dev. Biol. 194: 114-128.
Teboul, L., D. Gaillard, L. Staccini, H. Inadera, E. Z. Amiri, and P. A. Grimaldi. 1995. Thiazolidinediones and fatty acids convert myogenic cells into adipose-like cells. J. Biol. Chem. 27:28183-7.
Torii, S. I., T. Kawada, K. Matsuda, T. Matsui, T. Ishihara, and H. Yano. 1998. Thiazolidinedione induces the adipose differentiation of fibroblast-like cells resident within bovine skeletal muscle. 22:421-427.

23
Trenkle, A., D. L. DeWitt, and D. G. Topel. 1978. Influence of age, nutrition and genotype on carcass traits and cellular development of M. longissimus of cattle. J. Anim. Sci. 46: 1597-1603.
Wada, M. R., M. inagawa-Ogashiwa, S. Shimizu, S. Yasumoto, and N. Hashimoto. 2002. Generation of different fates from multipotent muscle stem cells. Development 129:2987-2995.
White, M. E., B.J. Johnson, M.R. Hathaway, and W.R. Dayton. 2003. Growth factor mRNA levels in muscle and liver of steroid-implanted and nonimplanted steers. J. Anim. Sci. 81:965-972.
Wu, Z., Y. Xie, N. L. Bucher, and S. R. Farmer. 1995. Conditional ectopic expression of C/EBP beta in NIH-3T3 cells induces PPAR gamma and stimulates adipogenesis. Gene Dev. 9:2350-2363.

24
Table 1. Selected transdifferentiation studies in cells obtained from meat animals Cell Type TZD Adipocytes Reference
Porcine muscle stromal-vascular DEXa Yes Hausman and Poulos, 2004
Porcine muscle stromal-vascular Ciglitazone No Poulos and Hausman, 2006
Porcine s.c. adipose stromal-vascular
Ciglitazone Yes Poulos and Hausman, 2006
Porcine muscle stromal-vascular Troglitizone
Yes Poulos and Hausman, 2006
Porcine s.c. adipose stromal-vascular
Troglitizone
Yes Poulos and Hausman, 2006
Porcine muscle satellite cells Ciglitizone Yes Singh et al., 2007 Bovine muscle-derived fibroblasts T-174 Yes Torii et al., 1998
aDEX = dexamethasone, not a TZD
Figure 1. The role of muscle satellite cells in supporting postnatal muscle growth. Satellite cells lie in close proximity to existing fiber. Under appropriate stimuli, these cells can undergo cell division. Eventually, the majority of these cells will fuse into the existing fiber, thus donating their DNA to support skeletal muscle hypertrophy.
25
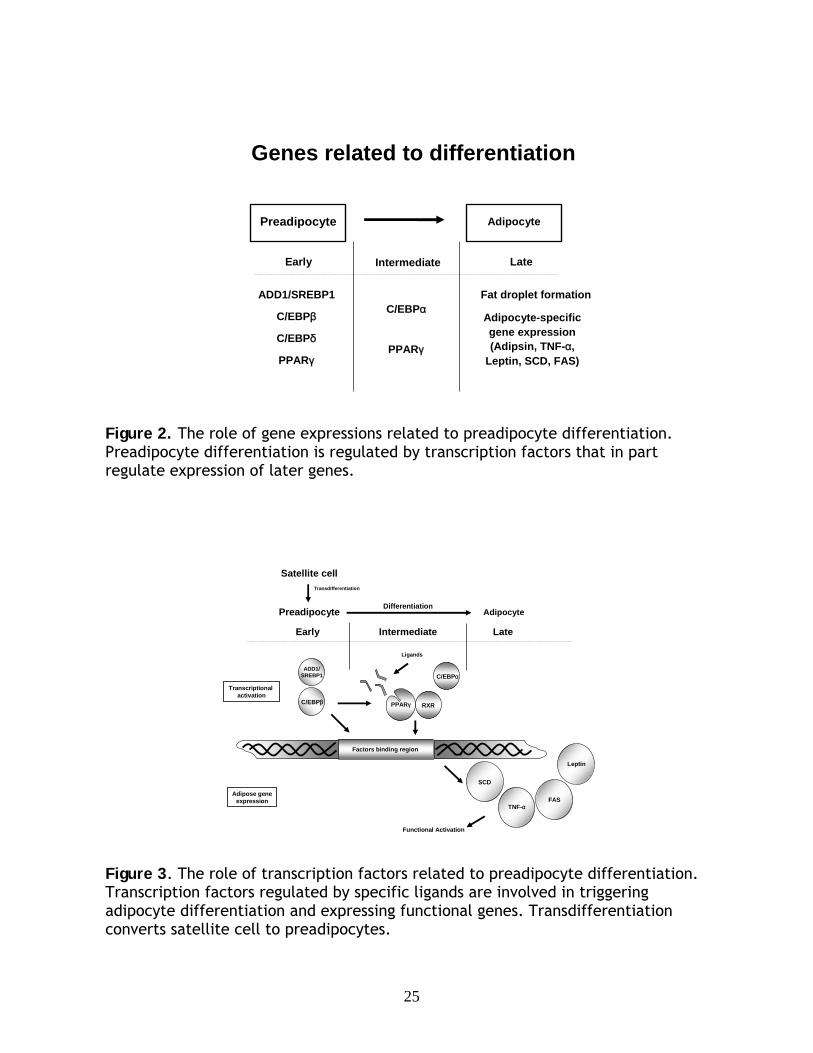
Genes related to differentiation
Preadipocyte Adipocyte
Early Intermediate Late
C/EBPβ C/EBPα
PPARγC/EBPδ
Fat droplet formation
Adipocyte-specific gene expression (Adipsin, TNF-α,
Leptin, SCD, FAS)
ADD1/SREBP1
PPARγ
Figure 2. The role of gene expressions related to preadipocyte differentiation. Preadipocyte differentiation is regulated by transcription factors that in part regulate expression of later genes.
Preadipocyte Adipocyte
Early Intermediate Late
Factors binding region
Ligands
Adipose geneexpression
Transcriptional activation
PPARγ RXRC/EBPβ
ADD1/SREBP1
SCD
FASTNF-α
Leptin
C/EBPα
Functional Activation
Differentiation
Satellite cellTransdifferentiation
Figure 3. The role of transcription factors related to preadipocyte differentiation. Transcription factors regulated by specific ligands are involved in triggering adipocyte differentiation and expressing functional genes. Transdifferentiation converts satellite cell to preadipocytes.

26
Marbling: Management of cattle to maximize the deposition of intramuscular adipose tissue
Stephen B. Smith and David K. Lunt
Department of Animal Science Texas A&M University, College Station
Introduction
There is a very real possibility that the U.S. will lose its competitive advantage over Australia, New Zealand, and other countries that have specifically targeted Asian countries for the export of high quality beef. This would incur an economic loss to the U.S. in billions of dollars. In Japan, U.S. beef was considered superior to Australian beef because 1) Australian producers cannot produce beef as highly marbled as beef from the U.S., even in long-fed cattle; and 2) Australian cattle have harder fat than U.S. cattle. The Japanese highly value both marbling (but not excess fat trim) and soft fat, but the distinction between U.S. and Australian beef is disappearing. There is a downward trend in cattle that grade USDA Choice, i.e., a decline in the deposition of marbling adipose tissue, with a concomitant increase in fat hardness, owing simply to the loss of corn and other grains to the production of ethanol. A second, albeit minor contributor to the reduction in carcass quality (and increase in fat hardness) is pressure from some public and production sectors to replace grain feeding with pasture feeding, as the latter is perceived to produce more healthful beef. This presentation will address: 1) the biology of marbling; and 2) impact of different grain sources on carcass quality; and 3) a comparison of the effects of calf-and yearling feeding on carcass and fat quality.
The Biology of Marbling
Histology and metabolism
Marbling adipose tissue, also known as interfascicular or intramuscular (i.m.) adipose tissue, represents a unique depot. It can be distinguished from other fat depots by its location within perimysial connective tissues alongside myofibers (Moody and Cassens, 1968; Figure 1). Although some scientists have provided evidence for transdifferentiation of satellite cells to preadipocytes (e.g., Teboul et al., 1997), the localization of marbling adipocytes to the perimysium in most breed types would argue that marbling arises primarily from fibroblasts associated with perimysial connective tissue.
In early work, we demonstrated that glucose contributes a larger proportion
of acetyl units to fatty acid biosynthesis in i.m. adipose tissue than in s.c. adipose tissue (Smith and Crouse, 1984; Figure 2a). The data in Figure 2a are for adipose tissues 18-mo-old Angus steers; adipose tissues. In i.m. adipose tissue, acetate and lactate contributed less than 20% of the acetyl units to fatty acid biosynthesis,

27
whereas glucose contributed approximately 70% of the acetyl units. The reverse was seen for s.c. adipose tissue; in fact, glucose contributed less than 5% to total acetyl units under these conditions.
Figure 1a. Marbling adipocytes lying alongside myofibers in bovine longissimus muscle (Moody and Cassens, 1968)
Figure 1b. Marbling adipocytes located in perimysial seams of connective tissue (M. Brooks and S. B. Smith, unpublished)
Figure 2a. The contributions of acetate, lactate, and glucose to de novo fatty acid biosynthesis in i.m. and s.c. adipose tissues (Smith and Crouse, 1984)
Figure 2b. Fatty acid biosynthesis from acetate and glucose in i.m. adipose tissues of heavy weight Angus and Wagyu steers (data are pooled across breed type; Rhoades et al., 2007)
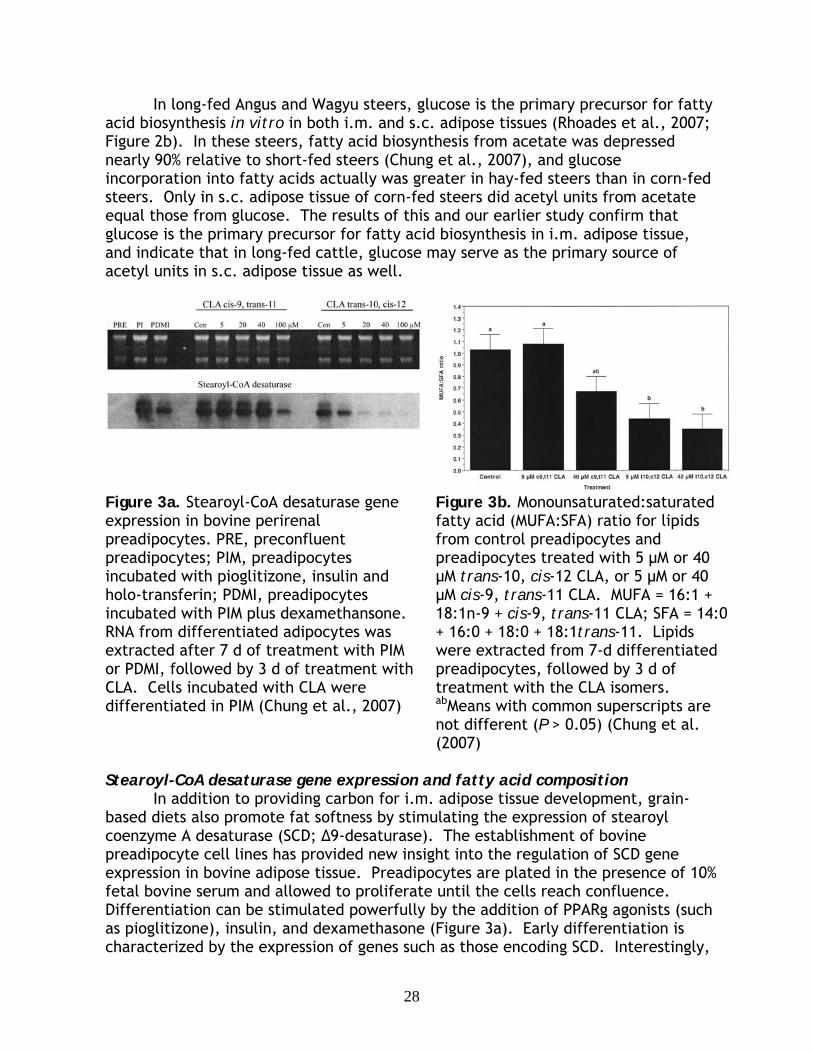
28
In long-fed Angus and Wagyu steers, glucose is the primary precursor for fatty acid biosynthesis in vitro in both i.m. and s.c. adipose tissues (Rhoades et al., 2007; Figure 2b). In these steers, fatty acid biosynthesis from acetate was depressed nearly 90% relative to short-fed steers (Chung et al., 2007), and glucose incorporation into fatty acids actually was greater in hay-fed steers than in corn-fed steers. Only in s.c. adipose tissue of corn-fed steers did acetyl units from acetate equal those from glucose. The results of this and our earlier study confirm that glucose is the primary precursor for fatty acid biosynthesis in i.m. adipose tissue, and indicate that in long-fed cattle, glucose may serve as the primary source of acetyl units in s.c. adipose tissue as well.
Figure 3a. Stearoyl-CoA desaturase gene expression in bovine perirenal preadipocytes. PRE, preconfluent preadipocytes; PIM, preadipocytes incubated with pioglitizone, insulin and holo-transferin; PDMI, preadipocytes incubated with PIM plus dexamethansone. RNA from differentiated adipocytes was extracted after 7 d of treatment with PIM or PDMI, followed by 3 d of treatment with CLA. Cells incubated with CLA were differentiated in PIM (Chung et al., 2007)
Figure 3b. Monounsaturated:saturated fatty acid (MUFA:SFA) ratio for lipids from control preadipocytes and preadipocytes treated with 5 µM or 40 μM trans-10, cis-12 CLA, or 5 µM or 40 μM cis-9, trans-11 CLA. MUFA = 16:1 + 18:1n-9 + cis-9, trans-11 CLA; SFA = 14:0 + 16:0 + 18:0 + 18:1trans-11. Lipids were extracted from 7-d differentiated preadipocytes, followed by 3 d of treatment with the CLA isomers. abMeans with common superscripts are not different (P > 0.05) (Chung et al. (2007)
Stearoyl-CoA desaturase gene expression and fatty acid composition
In addition to providing carbon for i.m. adipose tissue development, grain-based diets also promote fat softness by stimulating the expression of stearoyl coenzyme A desaturase (SCD; ∆9-desaturase). The establishment of bovine preadipocyte cell lines has provided new insight into the regulation of SCD gene expression in bovine adipose tissue. Preadipocytes are plated in the presence of 10% fetal bovine serum and allowed to proliferate until the cells reach confluence. Differentiation can be stimulated powerfully by the addition of PPARg agonists (such as pioglitizone), insulin, and dexamethasone (Figure 3a). Early differentiation is characterized by the expression of genes such as those encoding SCD. Interestingly,

29
the trans-10,cis-12 isomer of conjugated linoleic acid (t10,c12 CLA) strongly depresses SCD gene expression (Figure 3a) and thereby decreases the synthesis of monounsaturated fatty acids (MUFA; Figure 3b). This is unusual in light of the fact that t10,12 CLA is a product of rumen fermentation, and its accumulation would effectively block the conversion of trans-vaccenic acid (a primary product of ruminal fermentation) to cis-9,trans-11 CLA (c9,t11 CLA).
The strong depression of SCD gene expression by t10,c12 CLA in our bovine
perirenal preadipocyte culture system suggests that any production strategy to increase t10,c12 CLA in beef ultimately will reduce the endogenous production of the c9,t11 isomer in beef. It also will depress the synthesis of MUFA in general, which leads to profound increases in saturated fatty acids (SFA), especially stearic acid. Although we have argued against the use of fatty acid ratios to predict SCD gene expression and/or catalytic activity (Archibeque et al., 2005), we have observed that the ratio of palmitoleic acid (16:1n-7) to stearic acid (18:0) has some utility in predicting ∆9-desaturase status in adipose tissue (Figure 4a; Smith et al., 2006). Thus, adipose tissues from cattle raised in Australia in the mid-1990s displayed very low palmitoleic:stearic acid ratios and lipids from their adipose tissues had correspondingly high slip points (a measure of melting points; Smith et al. 1998). Slip point is strongly correlated with the concentration of stearic acid in beef lipids (Figure 4b), and the highest slip points were observed in short-fed, hay-fed steers, included short-fed Wagyu steers (Chung et al., 1996). Conversely, very low slip points (i.e., very soft fat) was observed in long-fed, corn-fed Angus and Wagyu steers. The high, negative correlation between palmitoleic acid and stearic acid indicates that the concentration of these fatty acids is coordinately regulated. Thus, when SCD activity is high, palmitoleic acid accumulates and stearic acid is consumed as a result of its conversion to oleic acid (18:1n-9). The highest concentrations of palmitoleic acid (and lowest concentrations of stearic acid) were observed in adipose tissue lipids from Japanese Black (Wagyu) cattle raised in the U.S. (Chung et al., 2006) or in Japan (Smith et al., 1998). Some of the lowest concentrations of palmitoleic acid were measured in young Angus steers raised in the U.S. (Archibeque et al., 2005). Adipose tissues of these cattle also contained high concentrations of trans-vaccenic acid, with little accumulation of c9,t11 CLA, suggesting a strong depression of SCD enzyme activity in these cattle. As will be addressed later, these data illustrate the effects of both diet and age on fatty acid composition in beef.

30
Figure 4a. Palmitoleic acid as a function of stearic acid in lipids extracted from bovine subcutaneous adipose tissue
Figure 4b. Slip point as a function of the concentration of stearic acid in lipids extracted from bovine subcutaneous adipose tissue (Chung et al., 2006)
Grain Sources and Quality
Distillers grains and carcass quality
The high price of corn and ready availability of the byproducts of ethanol production have led to the increased use of distillers grains in feedlot cattle production. Distillers grains are byproducts of fermentation, and the production of distillers grains has increased profoundly with the increase in ethanol-producing facilities. Table 1 compares the composition of a typical finishing diet contained dry-rolled corn to one containing distillers grains from corn (from Al-Suwaiegh et al., 2002).
Distillers grains are high in protein and fat on a DM basis (Owens and Gardner,
2000), which explains why feeding them to beef cattle typically increases average daily gain. Based on the similarity in ribeye areas, it is apparent that most of the difference in carcass weight between cattle fed dry-rolled corn and those fed distillers grains is due to fat accumulation (Table 2; Al-Suwaiegh et al., 2002). Also, distillers grains reduced marbling scores and the number of steers grading Choice. These data suggest that the increased use of distillers grains in U.S. beef cattle production ultimately will reduce the number of cattle grading Choice.

31
Table 1. Diet composition of a standard corn-based finishing diet and one containing corn distillers grains
Item Corn Corn distillers grains Ingredient, % DM
Dry-rolled corn 84 54 Corn distillers grains -- 30
Alfalfa hay 7.5 7.5 Molasses 3.5 3.5 Supplement 5.0 5.0
Chemical composition, %DM Crude protein 13.0 16.1 Ether extract 6.9 8.0
(Al-Suwaiegh et al., 2002) Table 2. Carcass characteristics of feedlot beef cattle fed a standard corn-based finishing diet or a diet containing corn distillers grains
Item Corn Corn distillers grains n 19 20 Average daily gain, kg 1.65 1.80 Hot carcass weight, kg 359 370 Ribeye area cm2 32.5 32.0 Fat thickness, cm 1.12 1.29 Marbling score Small58 Small44 Yield grade 2.32 2.63 USDA Choice, % 95 70
(Al-Suwaiegh et al., 2002) Carcass quality of steers fed dry-rolled or steam-flaked corn The biochemical evidence suggests that corn, and especially cracked or dry-rolled corn, should produce the highest quality grades in feedlot steers. The effects of steam flaking corn are similar to reductions in carcass quality caused by distillers grains (Table 3; Owens and Gardner, 2000). Cattle fed dry-rolled corn had smaller carcasses, but greater USDA quality grades. Cattle fed steam-flaked corn were fatter, with higher yield grades.
The ruminal conversion of distillers grains and steam-flaked corn to energy is more efficient, and gives higher average daily gains, than the metabolism of dry-rolled corn. Distillers grains and steam-flaked corn also promote the production of carcass fat, but reduce the deposition of marbling. We propose that distillers grains and steam-flaked corn reduce carcass quality because there is less starch available for absorption in the small intestine.

32
Table 3. Carcass characteristics of feedlot beef cattle fed dry-rolled corn or steam-flaked corn
Item Dry-rolled corn Steam-flaked corn n 60 60 Average daily gain, kg 1.42 1.58 Hot carcass weight, kg 322 335 Ribeye area cm2 79.4 84.3 Fat thickness, cm 1.13 1.31 Marbling score Small24 Slight82 Quality grade Choice24 Select82
Yield grade 2.69 2.85 (Owens and Gardner, 2000) Somewhat different results were obtained when distillers grains were combined with processed corn (fine ground or steam-flaked) or minimally processed corn (high-moisture or dry-rolled) (Figure 5; Vander Pol et al., 2006). Cattle fed fine ground or steam-flaked corn had lower marbling scores than those fed high moisture or dry-rolled corn. However, the cattle with the highest marbling scores also had the highest yield grades. Thus, when ruminal starch is low (as with distillers grains), dry-rolled corn may promote the accumulation of all fat depots. Figure 5. Yield grades and marbling scores of finishing steers fed 30% wet distillers grains plus fine ground corn, steam-flaked corn, high moisture corn, or dry rolled corn (n = 60 per type of corn). All diets contained 61.4% corn type. CP = 16.1%, ether extract = 6.5% (DM basis). xyzYield grades with common superscripts are not different. abMarbling scores with common superscripts are not different. Carcasses from steers fed fine ground corn or steam-flaked corn were 10 and 7% Choice, whereas carcasses from steers fed high moisture corn or dry rolled corn were 28 and 29% Choice, respectively (Vander Pol et al., 2006)
Steam flaking of corn (and all grains) breaks down the epicardium of the corn
kernal, completely exposing the contents to metabolism by ruminal microflora. Starches within the kernal are completely hydrolyzed to glucose, which subsequently is metabolized to lactate and volatile fatty acids. The pH of the rumen drops, which favors the proliferation and metabolism of microorganisms that produce priopionate. Propionate accelerates marbling development as it is converted by to glucose by the liver. When corn is less processed (as in high-moisture, cracked, or dry-rolled corn),

33
some of the starch is protected within the kernal and escapes into the abomasum and hence into the small intestine. The starch is hydrolyzed by pancreatic amyloglucosidase, and glucose is absorbed intact from the small intestine. The direct absorption of glucose from the small intestine accelerates the development of marbling more than the production of propionate in the rumen.
In the case of distillers grains, all of the starch is fermented in the ethanol plants, leaving a high-protein, high-fat product that is devoid of starch. Without starch, acetogenic bacteria are favored, and acetate and butyrate are the predominant volatile fatty acids absorbed from the rumen. Most adipose tissue depots in cattle use acetate preferentially for the synthesis of lipids, so the production of acetate promotes the development of carcass fat. Taken together, these studies suggest that production systems should be designed to provide starch or free glucose to the small intestine in beef cattle. Thus, whereas forage diets are considered acetogenic, perhaps some distinction should be made between propiogenic (e.g., steam-flaked corn) and glucogenic (e.g., dry-rolled corn) diets.
Calf and Yearling Feeding
Calf-fed steers are fed high-concentrate finishing diets at weaning, whereas
yearling-fed steers typically are fed native pasture until approximately 12 mo of age. Thus, calf-fed steers are younger at slaughter. In the recent past, when corn was relatively inexpensive and especially during times of drought, calves were adapted to corn soon after weaning. However, the use of grains for the production of ethanol has so increased the price of grains that producers are feeding more distillers grains (as addressed above) or are keeping their calves on pasture for longer periods of time. This is especially attractive to that segment of the producers who are marketing their beef as coming from pasture-fed cattle.
It now is apparent that calves will begin to accumulate marbling as soon as
they are adapted to a high-grain diet, and backgrounding calves on pasture may retard marbling development. Whereas Dikeman et al. (1985) and Huffman et al. (1990) reported no difference in carcass quality between calf- and yearling-fed cattle, Lunt and Orme (1987) reported that yearling-fed cattle produced carcasses with lower yield and quality grades than calf-fed cattle raised to a constant BW. Similarly, yearling-fed Brangus steers had lower USDA yield grades than calf-fed steers (3.9 vs 4.5) even though both groups were fed to a constant BW (Harris et al., 1997). Thus, adipose tissue development may be depressed in yearling-fed steers due to the additional time necessary to achieve the same BW as the calf-fed steers.
In one study, we measured adiposity and preadipocyte proliferation in s.c.
and i.m. adipose tissues of calf- and yearling-fed Brangus calves (Harris et al., 1997; Smith et al., 2007). The calf- and yearling-fed steers were fed either to a constant age or to a constant BW. When raised to a constant age, carcasses from the fatter, calf-fed steers had higher marbling scores, but the yearling-fed steers achieved the same marbling scores when fed to the same BW as the calf-fed steers (Figure 6a).

34
However, at the same BW, the younger calf-fed steers had higher yield grades than yearling-fed steers, primarily due to smaller ribeye areas (Harris et al., 1997; Smith et al., 2007).
Figure 6a. Marbling scores, adjusted fat thickness and yield grades of calf- and yearling-fed Brangus steers raised to a constant age or constant BW (Harris et al., 1997)
Figure 6b. Volume distributions of i.m. adipocytes from calf-fed and yearling-fed Brangus steers raised to a constant age (16 mo; CA yearling-fed) or a constant weight (530 kg; CW yearling-fed). a,b,cRelative volume proportion of s.c. adipocytes without common superscripts are different (P < 0.05). a*,b*Relative volume proportions < 300 pL are all greater in i.m. adipose tissue of CA yearling-fed steers than in calf-fed or CW yearling-fed steers (Smith et al., 2007)
Volume distributions for i.m. adipocytes indicated that, as expected, the
yearling-fed steers had smaller adipocytes than calf-fed steers when they were sampled at the same age (Figure 6b). This was due to the lesser time on the corn finishing diet for the yearling-fed steers. By the time the yearling-fed steers had achieved the same BW as the calf-fed steers, their i.m. adipocyte volumes were the same. Virtually identical results were observed for s.c. adipose tissue (Smith et al., 2007). Thus, although backgrounding the yearling-fed steers on pasture initially depressed adiposity, there was a complete recovery of carcass fat when the yearling-fed steers were grown to the same BW as the calf-fed steers.
To date, the fatty acid composition of muscle and adipose tissue of calf- and yearling-fed steers has not been described. We predicted that backgrounding calves on pasture until 12 mo of age would promote harder, more saturated fat. Angus steers fed hay-based diets had depressed SCD gene expression and catalytic activity than steers fed corn-based diets (Chung et al., 2007), and correspondingly lower

35
concentrations of s.c. adipose tissue MUFA (Chung et al., 2006). Therefore, initial backgrounding of calves on pasture should elicit a similar depression in SCD gene expression, which could influence the ultimate fatty acid composition of the finished steers.
Figure 7a. Adjusted fat thickness of calf- and yearling-fed steers (M. Brooks and S. B. Smith, unpublished)
Figure 7b. Longissimus muscle intramuscular lipid percentage in calf-and yearling-fed steers (M. Brooks and S. B. Smith, unpublished)
In a recent study, steers were adapted at 8 mo of age to a corn-based
finishing diet (calf-fed), or were allowed to graze native pasture until 12 mo of age (yearling-fed). Because of poor pasture conditions, at 10 mo of age the yearling-fed steers were supplemented with sufficient concentrate to provide 0.9 kg/d ADG. Cattle were sampled at 8, 12, 16 mo of age. The yearling-fed steers also were sampled at 17.5 mo of age, at which time they had achieved the same BW as the calf-fed steers (530 kg). As predicted, s.c. adipose tissue (i.e., adjusted fat thickness) accumulated at a greater rate in the calf-fed steers, but the yearling-fed steers had the same adjusted fat thickness by the final sampling time (Figure 7a). However, the yearling-fed steers never quite attained the same amount of intramuscular lipid within the longissimus muscle as the calf-fed steers (Figure 7b).
Samples of i.m. adipose tissue were obtained at each sampling time except at
8 mo of age, at which time there was insufficient i.m. adipose tissue to collect for RNA extraction. Also, liver was obtained at each sampling period. Although the data have not yet been properly normalized to a housekeeping gene such as GAPDH, the pattern of SCD gene expression is very apparent in slot blots of the RNA (Figure 8). SCD gene expression clearly was highest in samples from 12-mo-old calf-fed steers and nearly undetectable in samples from yearling-fed steers at 12 mo of age. Whereas SCD gene expression declined in i.m. adipose tissue of the calf-fed steers over time on feed, it generally increased in the yearling-fed steers. SCD gene

36
expression was not detectable in liver samples, which is identical to results we reported earlier (Cameron et al., 1994). Figure 8. Stearoyl-CoA desaturase (SCD) gene expression in i.m. adipose tissue of calf- and yearling-fed steers. Additionally, SCD gene expression was measured in liver samples from two 16-mo-old calf-fed steers. SCD RNA was undetectable in the liver samples (M. Brooks and S. B. Smith, unpublished)
A very similar pattern of gene expression was observed in s.c. adipose tissue (Figure 9a, in which the SCD absorbance:GAPDH absorbance has been calculated). We were able to obtain s.c. adipose tissue from the weaned calves, and SCD gene expression was virtually undetectable in those samples. As for i.m. adipose tissue, peak SCD gene expression in s.c. adipose tissue of the calf-fed steers was observed at 12 mo of age, and declined thereafter. There was very low SCD gene expression at 12 mo of age in the yearling-fed steers, but SCD gene expression increased nearly 20-fold by 16 mo of age.
The MUFA:SFA ratios in yearling-fed s.c. adipose tissue never achieved the
values observed in s.c. adipose tissue from calf-fed steers. We interpret this to mean that the accumulation of SFA in s.c. adipose tissue of the yearling-fed calves prior to weaning and during the time on pasture diluted the MUFA that subsequently were synthesized and deposited in their adipose tissues. This dilution effect was not observed in i.m. adipose tissue, probably because so little lipid had accumulated in the marbling of the yearling-fed steers prior to being switched to the high-corn diet (Figure 7b). It also is clear from these data and our previous reports (Sturdivant et al., 1992; May et al., 1993; Archibeque et al., 2005) that i.m. adipose tissue represents a more saturated adipose tissue depot than s.c. adipose tissue. Relationship of amount of intramuscular lipid to fatty acid composition
A final caveat of feeding corn to finishing cattle is that any increase in intramuscular lipid (or marbling scores) typically is positively correlated with an accumulation of MUFA. In a recent comparison of Wagyu and Angus steers fed corn- or hay-based diets, we demonstrated that there is a significant correlation between the concentration of s.c. MUFA and amount of longissimus muscle lipid (Figure 10b; Chung et al., 2006; reviewed in Smith et al., 2006). Fatty acid composition of i.m.
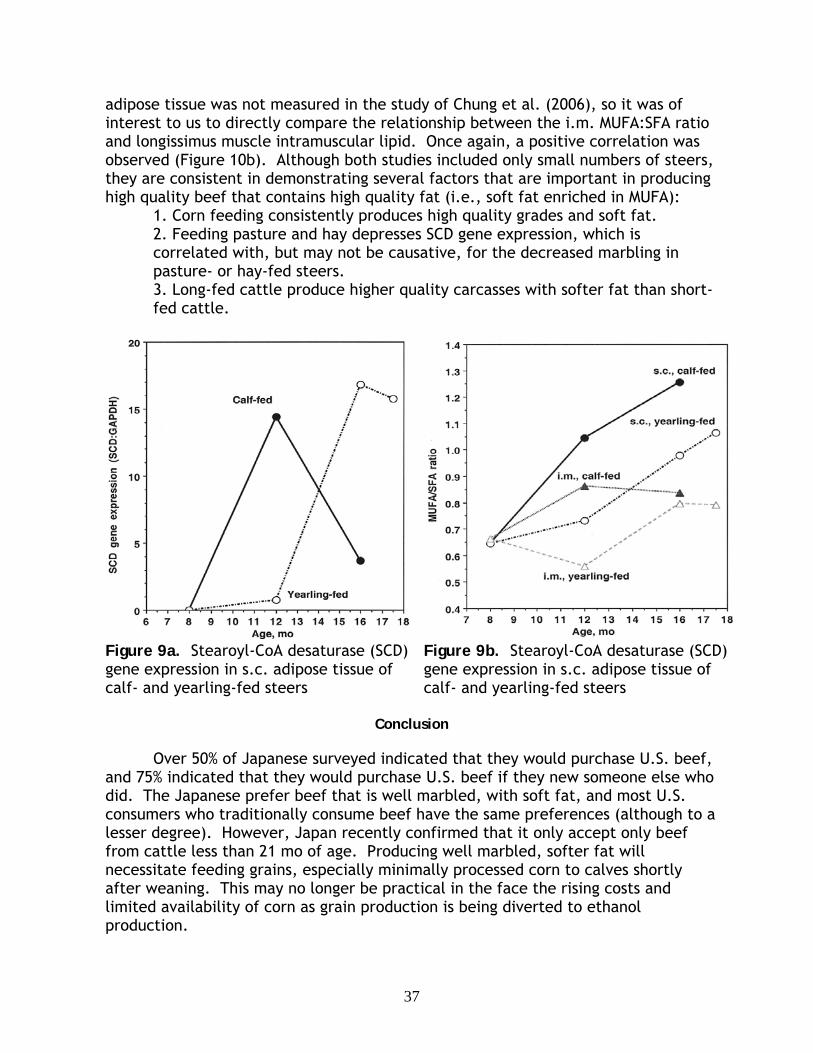
37
adipose tissue was not measured in the study of Chung et al. (2006), so it was of interest to us to directly compare the relationship between the i.m. MUFA:SFA ratio and longissimus muscle intramuscular lipid. Once again, a positive correlation was observed (Figure 10b). Although both studies included only small numbers of steers, they are consistent in demonstrating several factors that are important in producing high quality beef that contains high quality fat (i.e., soft fat enriched in MUFA):
1. Corn feeding consistently produces high quality grades and soft fat. 2. Feeding pasture and hay depresses SCD gene expression, which is correlated with, but may not be causative, for the decreased marbling in pasture- or hay-fed steers. 3. Long-fed cattle produce higher quality carcasses with softer fat than short-fed cattle.
Figure 9a. Stearoyl-CoA desaturase (SCD) gene expression in s.c. adipose tissue of calf- and yearling-fed steers
Figure 9b. Stearoyl-CoA desaturase (SCD) gene expression in s.c. adipose tissue of calf- and yearling-fed steers
Conclusion
Over 50% of Japanese surveyed indicated that they would purchase U.S. beef,
and 75% indicated that they would purchase U.S. beef if they new someone else who did. The Japanese prefer beef that is well marbled, with soft fat, and most U.S. consumers who traditionally consume beef have the same preferences (although to a lesser degree). However, Japan recently confirmed that it only accept only beef from cattle less than 21 mo of age. Producing well marbled, softer fat will necessitate feeding grains, especially minimally processed corn to calves shortly after weaning. This may no longer be practical in the face the rising costs and limited availability of corn as grain production is being diverted to ethanol production.
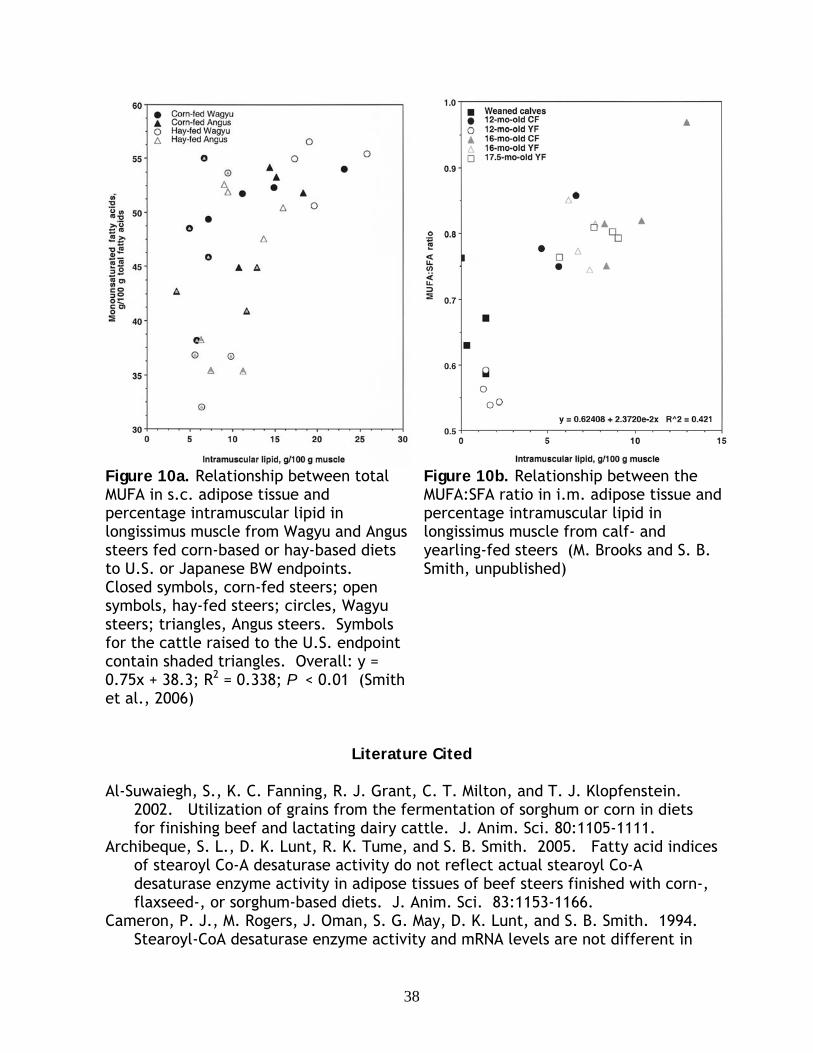
38
Figure 10a. Relationship between total MUFA in s.c. adipose tissue and percentage intramuscular lipid in longissimus muscle from Wagyu and Angus steers fed corn-based or hay-based diets to U.S. or Japanese BW endpoints. Closed symbols, corn-fed steers; open symbols, hay-fed steers; circles, Wagyu steers; triangles, Angus steers. Symbols for the cattle raised to the U.S. endpoint contain shaded triangles. Overall: y = 0.75x + 38.3; R2 = 0.338; P < 0.01 (Smith et al., 2006)
Figure 10b. Relationship between the MUFA:SFA ratio in i.m. adipose tissue and percentage intramuscular lipid in longissimus muscle from calf- and yearling-fed steers (M. Brooks and S. B. Smith, unpublished)
Literature Cited
Al-Suwaiegh, S., K. C. Fanning, R. J. Grant, C. T. Milton, and T. J. Klopfenstein. 2002. Utilization of grains from the fermentation of sorghum or corn in diets for finishing beef and lactating dairy cattle. J. Anim. Sci. 80:1105-1111.
Archibeque, S. L., D. K. Lunt, R. K. Tume, and S. B. Smith. 2005. Fatty acid indices of stearoyl Co-A desaturase activity do not reflect actual stearoyl Co-A desaturase enzyme activity in adipose tissues of beef steers finished with corn-, flaxseed-, or sorghum-based diets. J. Anim. Sci. 83:1153-1166.
Cameron, P. J., M. Rogers, J. Oman, S. G. May, D. K. Lunt, and S. B. Smith. 1994. Stearoyl-CoA desaturase enzyme activity and mRNA levels are not different in

39
subcutaneous adipose tissue from Angus and American Wagyu steers. J. Anim. Sci. 72:2624-2628.
Chung, K. Y., C. B. Choi, H. Kawachi, H. Yano, and S. B. Smith. 2007. Trans-10, cis-12 conjugated linoleic acid down-regulates arginine-promoted differentiation of bovine preadipocytes. Adipocytes (In press).
Chung, K. Y., D. K. Lunt, C. B. Choi., S. H. Chae, R. D. Rhoades, T. L. Adams, B. Booren, and S. B. Smith. 2006. Lipid characteristics of subcutaneous adipose tissue and M. longissimus thoracis of Angus and Wagyu steers fed to U.S. and Japanese endpoints. Meat Sci. 73:432-441.
Chung, K. Y., D. K. Lunt, H. Kawachi, H. Yano, and S. B. Smith, S.B. 2007. Lipogenesis and stearoyl-CoA desaturase gene expression and enzyme activity in adipose tissue of short- and long-fed Angus and Wagyu steers fed corn- or hay-based diets. J. Anim. Sci. 85:380-387.
Dikeman, M. E., A. D. Dayton, M. C. Hunt, C. L. Kastner, J. B. Axe, and H. J. Ilg. 1985. Conventional versus accelerated beef production with carcass electrical stimulation. J. Anim. Sci. 61:573-583.
Harris, J.J., D. K. Lunt, S. B. Smith, W. L. Mies, D. S. Hale, M. Koohmaraie, and J. W. Savell. 1997. Feedlot performance, carcass traits and meat palatability of calf- versus yearling-fed cloned steers. J. Anim. Sci. 75:986-992.
Huffman, R. D., S. E. Williams, D. D. Hargrove, D. D. Johnson, and T. T. Marshall. 1990. Effects of percentage Brahman and Angus breeding, age-season of feeding and slaughter end point on feedlot performance and carcass characteristics. J. Anim. Sci. 68:2243-2251.
Lunt, D. K., and L. E. Orme. 1987. Feedlot performance and carcass evaluation of heifers fed finishing diets as weanling calves or as yearlings. Meat Sci. 20:159-164.
May, S. G., Sturdivant, D. K. Lunt, R. K. Miller, and S. B. Smith. Comparison of sensory characteristics and fatty acid composition between Wagyu crossbred and Angus steers. Meat Sci. 35:289-298.
Moody, W. B., and R. G. Cassens. 1968. A quantitative and morphological study of bovine longissimus fat cells. J. Food Sci. 33:47-55.
Owens, F. N., and B. A. Gardner. 2000. A review of the impact of feedlot management and nutrition on carcass measurements of feedlot cattle. Proc. Am. Soc. Anim. Sci. 79(E-Suppl.).
Rhoades, R. D., J. E. Sawyer, K. Y. Chung, M. L. Schell, D. K. Lunt, and S. B. Smith. 2007. Effect of dietary energy source on in vitro substrate utilization and insulin sensitivity in muscle and adipose tissues of long-fed Angus and Wagyu steers. J. Anim. Sci. 85:(In press).
Smith, S. B., A. A. Chapman, D. K. Lunt, J. J. Harris, and J. W. Savell. 2007. Adiposity of calf- and yearling-fed steers raised to constant-age and constant-BW endpoints. J. Anim. Sci. 85:(In press).
Smith, S. B. and J. D. Crouse. 1984. Relative contributions of acetate, lactate and glucose to lipogenesis in bovine intramuscular and subcutaneous adipose tissue. J. Nutr. 792-800.
Smith, S. B., D. K. Lunt, K. Y. Chung, C. B. Choi, R. K. Tume, and M. Zembayashi. 2006. Review article: Adiposity, fatty acid composition, and delta-9 desaturase

40
activity during growth in beef cattle. Anim. Sci. J. (Jpn.) 77:478-486. Smith, S. B., A. Yang, T. W. Larsen, and R. K. Tume. 1998. Positional analysis of
triacylglycerols from bovine adipose tissue lipids varying in degree of unsaturation. Lipids 33:197-207.
Sturdivant, C. A., D. K. Lunt, and S. B. Smith. 1992. Fatty acid composition of longissimus muscle and subcutaneous and intramuscular adipose tissues of Japanese Wagyu cattle. Meat Sci. 32:449-458.
Teboul, L., D. Gaillard, L. Taccini, H. Inadera, E. Z. Amri, and P. A. Grimaldi. 1997. Thiazolidinediones and fatty acids convert myogenic cells into adipose-like cells. J. Biol. Chem. 270:28183-28187.
Vander Pol, K. J., G. E. Erickson, M. A. Greenquist, T. J. Klopfenstein, and T. Robb. 2006. Effect of corn processing in finishing diets containing wet distillers grains on feedlot performance and carcass characteristics of finishing steers. Nebraska Beef Report 2006:48-50.

41

42
43
Corn by-products: Considerations involving sulfur
R. H. Pritchard, Ph.D. Department of Animal and Range Sciences South Dakota State University, Brookings
Introduction
The generation of ethanol by-product feeds (DGS) has mushroomed since the
objective of renewable fuels production became a national priority. In this environment of dramatic growth, advances in the efficiency and capacity of ethanol production are the focus. The DGS is not a priority beyond its future potential to yield additional renewable fuels. Generally, it was presumed by the ethanol industry that by-product was by-product and historical feed data were adequate indicators of composition and nutritive value. The one simple, overriding question was “how much of this biomass can be moved through livestock?” Most of the research to address this question was not funded by the ethanol industry. A functional disconnect exists between cattle nutritionists and the generation of by-products in spite of the socialization and market-driven research support that has been available.
An interesting quirk in all of this is that never before have cattle feeders had access to such a nutrient-rich feed as DGS that was priced comparable to an energy feed. Suddenly, nutrients that were expensive and fed at levels necessary only to meet requirements are affordable. So affordable, that they become included in diets at levels well beyond animal needs. It is a perspective that is rarely considered in research, especially when multiple essential nutrients are fed in excess simultaneously.
While many important nutrient excesses occur when feeding high dietary levels of DGS, this essay will focus only on sulfur. The sulfur levels in the ethanol by-product streams can be quite high, are variable, and have been implicated in an increased occurrence of polioencephalomalacia (PEM) in cattle.
Sulfur Levels
The 1996 Beef NRC lists DDGS sulfur content at 0.4%. In the 1984 Beef NRC, the value was 0.33%. Spiehs et al. (2002) in surveys of 12 plants reported S levels of 0.33 to 0.74% and within plant coefficients of variation that ranged from 6.4 to 43.5%. Holt et al. (2004) sampled four plants and found that sulfur content ranged from 0.35 to 0.69% for DDGS; 0.36 to 0.39% for wet distillers grains; and from 0.25 to 1.15% for CDS. It is required to include sulfur levels on feed tags for ethanol co-products in South Dakota. A recent survey of those labels indicated a range of claims of 0.7 to 1.2% maximum sulfur content (air dry basis).

44
The point of this is that sulfur levels in DGS are variable and can be quite high. If maximum dietary sulfur for feedlot cattle should be limited to 0.3% S, then one must be very careful of diet formulations when high DGS inclusions are planned. A 0.7% S DGS fed at 20% of the diet will meet animal sulfur requirements. At 30% DGS, the DGS alone would meet the maximum sulfur limit of 0.20% proposed by Zinn et al. (1997).
Consequences of Excess Dietary Sulfur
Zinn et al. (1997) reported reduced ADG, DMI and energetic efficiency occurred if the diet exceeded 0.20% S. The 1996 Beef NRC indicates 0.40% S as the maximum tolerable concentration of sulfur. It goes on to list restlessness, diarrhea, muscle twitching, and dyspnea as symptoms of acute sulfur toxicity. Today there is a significant concern about polioencephalomalacia (PEM) related to excess dietary sulfur. Three textbooks and two NRC publications reviewed made no reference to sulfur-induced polioencephalomalacia (PEM) but it was described in the NRC Mineral Tolerances of Animals (2005). The textbook references to PEM were generally tied to thiamin deficiencies. Sulfur-induced PEM is not necessarily associated with lowered blood thiamin concentrations (Sager et al., 1990; Gould et al., 1991). In our research feedlot we have inadvertently come to recognize apparent PEM cases that are not responsive to intravenous B1 therapy. Those cases in our feedlot have coincided with feeding high S-content diets. Ward and Patterson (2004) found that feeding 1 g B1/d did not stop PEM in steers offered high SO4 water, although there was some advantage in ADG and F/G when B1 was offered.
The more plausible explanation for PEM in high S diets is H2S poisoning (Gould, 1998). The H2S originates from the reduction of sulfates to sulfides as part of normal ruminal fermentation processes. This reduction process is involved in bacterial incorporation of S for producing S-containing amino acids. Presumably, problems emerge when excess sulfate reductions exceed microbial sulfur utilization rates, leading to an accumulation of H2S. Gould (1998) describes a series of studies that led to implicating H2S in the rumen gas cap as causal of PEM. He went on to indicate that H2S concentrations ≥ 2000 ppm in the rumen gas cap preceded the onset of PEM. However, ruminal gas cap H2S was not necessarily present at elevated levels after the subjects became symptomatic.
Outwardly visible CNS disorders are commonly referred to in the feedlot vernacular as Polio and the inference is an association with PEM. True PEM brain lesions are not always recognized (if even evaluated) in cases of H2S toxicosis and if observed may differ slightly form lesions associated with a thiamin deficiency. The point here is that the H2S induced CNS disorder is not really the same thing as the PEM that we were taught to treat with thiamin. Outward symptoms are similar, both probably correspond to imbalanced rumen microbial populations but the causal agents differ.
45
A common diagnosis of mortality associated with high sulfur diets is bloat. Church (1988) perhaps citing Kandylis (1984) or Bird (1972) identified reduced rumen motility associated with accumulated ruminal H2S. These animals, if suffering CNS disorders, may become non-ambulatory. They are also full. With this combination of conditions they probably do succumb to bloat, but the cause of the bloat conceivably stems from the diet induced H2S insult.
Mechanisms Related to H2S Toxicity
High sulfur diets do not result in all cattle in a pen becoming clinical. Mortality is sporadic. Overall pen performance (brainers and deads out) will likely match projections. If all of the cattle are being fed a toxic level of a compound, it is interesting that most of the cattle seem unaffected. Even on the occasion of a severe problem, intake for the pen appears normal, and symptomatic cattle may appear over several days. Pulls categorized as bloat, or CNS disorders that are non-responsive to B1 therapy, or Realizers suffering from inappetence are wide ranging disorders that may not trigger acknowledging a common problem. There is no clear dose dependent response to the level of dietary sulfur and currently nutritionists are not consistent in their indications of a “safe” sulfur or DGS level.
Several factors may be involved in the poor prediction of the dose of sulfur implicated in toxicity. An obvious place to start is with the forms and levels of dietary sulfur. The high SO4 content anticipated in DGS, in other co-products, or in mineral supplements would be more rapidly reduced than the S found in proteins, especially corn protein. I’m not aware that anyone has broken down the matter to that level. We are challenged that it is too common that actual S content of the dietary ingredients is not known. While formulated dietary sulfur level may be acceptable (< 0.30%), a large spike in S from one source or a combination of lesser spikes in sulfur content from multiple sources would push actual S intake much higher. The most likely source of a sulfur spike would be from the DGS being fed but few feedlots test each load of DGS for S content. Inventory turnover is rapid, and the feed may no longer be available when an investigation into problems gets underway. Similar circumstances may apply to supplements although they are less likely to be the source of S problems. Not all water sources are consistent in S content, and hot weather causes spikes in water intake. As a consequence the dietary S content at the time of an adverse event is often not known.
Diets formulated with an insufficient safety factor for how each of these variables applies in a specific feedlot will be at risk. One step I recommend to all DGS users is to sample each load of DGS and hold that sample until the load is fed out. If no problems develop, the sample is discarded. If problems do develop, a sample is available for testing.
I perceive sulfur related maladies to be more frequently associated with modified distillers grains (mDGS; 50 to 55% DM) than with wet or dry distillers grains. My perception may be driven by more prevalent local usage rates of mDGS than the

46
other feeds. However, in support of my bias, proprietary monthly ethanol plant average assay values suggest that the S content tends to be higher in mDGS. The product also has handling characteristics that can be problematic. The mDGS has a propensity to roll into golf ball to softball-sized clumps while feed is mixing. Cattle like this feed and the clumps are easily selected from the “mixed” diet. Selective eaters in a pen may be consuming significant amounts of sulfur and succumbing to H2S. In doing so they would lower the dietary sulfur load and risk for the balance of the pen.
The H2S in the rumen is actually in equilibrium with the HS- anion. The pka of H2S is 6.7 (VanSoest, 1987), meaning that at lower ruminal pH, equilibrium favors the H2S form. Gould (1998) indicated that at pH 5.2 the balance would be 97% H2S, the form that accumulates in the rumen head gas and is associated with PEM. Because of this pH effect, subclinical acidosis would lead to greater accumulations of H2S, as well as causing elevated respiration rates that would increase the potential for H2S inhalation. Subclinical acidosis would also be associated with reduced microbial protein synthesis, which would increase the amount of S available to the sulfide pool. It is probably quite fortunate that DGS contain fiber and fat to help control the incidence and degree of subclinical acidosis in the population. Otherwise the frequency of H2S mortalities might be higher.
Kung et al. (2000) found that Mo effectively reduced H2S production, but the response required 10 ppm Mo, which in itself would become problematic. Screening other fermentation modifiers, they (Kung et al., 2000) reported percentage reductions of H2S for CTC (72%), OTC (55%), bambermycin (14%), and lasalocid (12%) for high sulfate substrates in vitro. They also reported a 71% reduction in sulfide production when 10 ppm of 9, 10 anthraquionone was added to the fermentation. In those studies monensin caused an increase in H2S ebullition in an in vitro experiment. It is unclear, but assumed, that the innocula donors were not adapted to monensin. Considering the pervasiveness of DGS and monensin in feedlots today, this must be further studied.
It has been postulated that additional Zn or Cu might provide a degree of added protection in high sulfur diets. I am aware of no definitive data supporting or refuting this possibility. However, a diet containing 0.5% S has 3000 ppm excess S. If an additional 5 to 10 ppm Cu does provide protection, it must occur by some mechanism other than the formation of insoluble cupric sulfite. That reaction would account for <1% of the excess S in the system.
Managing High S Content DGS
From the feedlot perspective, the simple solution would be for ethanol plants to not add sulfur to the by-product stream. Some plants have made that choice, others have not. Communicating the value of avoiding added sulfur and that value being sufficient to effect change are both necessary for a plant to change it’s SOP.

47
We can take several in-house steps to manage the risk of S toxicity: (1) Know the sulfate content of the water supply. (2) Know the typical sulfur content and content variability for each ethanol plant
source of DGS you use. (3) Know the S content of the commercial supplements and other feeds used in
diets. (4) For each specific feedlot, use these data to calculate a safety factor for DGS
inclusion rates. Yards or seasons more predisposed to acidosis probably should be included in calculating safety factors.
(5) If you are feeding high sulfur diets consider PEM as an indicator of subclinical acidosis as well as S toxicity and respond as you would to the indications of acidosis in addition to responding to the sulfur issue.
(6) Monitor mixing effectiveness to assure adequate dispersion of high S content ingredients.
(7) (I hate this one) consider use of OTC or CTC during S toxicosis events or periods of significant risk. Circumstances expected to lead to disruption of normal ruminal fermentation would be included here. The most pervasive of these events in feedlots is the process of stepping cattle up on feed.
(8) We absolutely need to know more about potential interactions of H2S production and monensin. At this point there is insufficient research to know if monensin does interact with sulfur reducing mechanisms or whether dietary concentrations of sulfur x monensin interact in favorable or unfavorable ways.
Literature Cited
Bird, P.R. 1972. Sulfur metabolism and excretion studies in ruminants. X. Sulfide toxicity in sheep. Aust. J. Biol. Sci. 25:1073-1085.
Church, D. C. 1988. The Ruminant Animal Digestive Physiology and Nutrition. Prentice-Hall, Inc. Englewood Cliffs, NJ.
Gould, D. H., 1998. Polioencephalomalacia. J. Anim. Sci. 76:309-314. Holt, S. M., R. H. Pritchard. 2004. Composition and nutritive value of corn co-
products from dry milling ethanol plants. BEEF 2004-01. Pages 1-7 in SD Beef Report. SDAES, Brookings.
Kandylis, K. 1984. Toxicology of sulfur in ruminants. Review. J. Dairy Sci. 67:2179-287
Kung, L., J. P. Bracht, J. Y. Tavares. 2000. Effects of various compounds on in vitro ruminal fermentation and production of sulfide. Anim. Feed Sci. and Tech. 84:69-81.
Kung, Jr., L., K. A. Smith, A. M. Smagala, K. M. Endres, C. A. Bessett, N. K. Ranjit, and J. Yaissle. 2003. Effects of 9, 10 anthraquinone on ruminal fermentation, total-tract digestion, and blood metabolite concentrations in sheep. J. Anim. Sci. 81:323-328.
NRC. 1984. Nutrient Requirements of Beef Cattle. 6th Rev. Ed. Natl. Acad. Press, Washington, DC.

48
NRC. 1996. Nutrient Requirements of Beef Cattle. 7th Rev. Ed. Natl. Acad. Press. Washington, DC.
NRC. 2005. Mineral Tolerances of Animals. 2nd Rev. Ed. Natl. Acad. Press. Washington, DC.
Spiehs, M. J., M. H. Whitney, and G. C. Shurson. 2002. Nutrient database for distiller’s dried grains with solubles produced from new ethanol plants in Minnesota and South Dakota. J. Anim. Sci. 80:2639-2645.
Van Soest, P. J. 1994. Nutritional Ecology of the Ruminant. 2nd Ed. Comstock Pub. Associates, Cornell Univ. Press, Ithaca, NY and London.
Zinn, R. A., E. Alvarez, M. Mendez, M. Montano, E. Ramirez, and Y. Shen. 1997. Influence of dietary sulfur level on growth performance and digestive function in feedlot cattle. J. Anim. Sci. 75:1723-1728.

49
Corn by-products: Considerations involving variability and formulation
P. G. Guiroy, J. N. Pike, C. B. Calk, and M. A. Messman
Cargill Inc, Minnetonka, MN
Introduction
The recent demand for biofuels has increased the utilization of corn to produce ethanol and consequently increased the competitive price of corn for the cattle feeding industry. The rapid investment of infrastructure to supply the ethanol demand suggests that competition for corn may persist for years to come. Favorable prices and availability of corn by-products in comparison to corn grain results in feedlot nutritionists increasing the usage of these ingredients. Feedlot nutritionists must understand the key nutrients and the variability of by-products in order to successfully and economically incorporate them in diets to achieve target animal performance, cost of gain, and/or meat quality specifications.
Our objective is to describe the nutrient variability of corn by-products and its implications in animal performance, focusing on those nutrients that directly affect the energy value of the ingredient and its protein fractions. For the purpose of this study, we will focus our attention specifically on corn distiller grains with solubles. However, it should be stated that the concepts presented here also apply to other grain by-products.
Nutrient variability in Distillers Grains
Ethanol and Biodiesel are the end products of the biofuel industry. These products are produced to tight specifications with little variability. Therefore the variability in the grain is transferred and amplified in the by-product. This variability is intensified by the range and type of by-product marketed: wet and dried distiller grains, differing degrees of added solubles and differing cereal grains used for fermentation, etc. This situation makes standard book values that characterize their nutritional value of poor reliability (Pritchard, 2006).
The most common estimate in the production of ethanol is that one bushel of
corn will yield 2.7 gallons of ethanol or 17.8 lbs, 17.8 lbs of dried distillers, and 17.8 lbs of CO2, or approximately two-thirds of the original kernel converted into ethanol and CO2, and the other third into feed by-product. Variability in the end products of ethanol and CO2 should be considered negligible. Therefore, most, if not all the original variability found in the corn kernel (from corn variety, growing conditions, soil quality, etc) should ultimately be magnified in the feed-byproduct, creating a challenge to nutritionist trying to formulate consistent diets.
In order to evaluate the nutrient variability in dried and wet corn distillers in
comparison to corn grain, we analyzed a large number of samples received at our

50
laboratories during 2006. For the purpose of this comparison, we will focus on the following nutrients, which drive our energy estimations: dry matter, crude protein, neutral detergent fiber, fat, and ash. In this analysis, grain and DDGS were analyzed through NIR calibrations built in our own laboratories. Approximately two-thirds of the samples analyzed of WDGS were run using conventional wet chemistry techniques and the other third through NIR. Regarding our laboratory procedures, it should be noted that our NDF runs lower than analysis from many other labs by about 10-20%. This is because our NDF lab assay was designed to remove protein, starch, and fat contamination from the cell wall. In this NDF assay, samples were extracted with petroleum ether (removing fat and wax) prior to being boiled in a detergent solution at neutral pH with sodium sulfite and heat stable amylase. Fat was determined by ether extract. Nitrogen was measured by combustion and then multiplied by 6.25 to obtain crude protein. Laboratory procedures were performed on “as is” basis in corn and DDGS or after drying overnight at 60o C in WDGS. Then, values were adjusted to dry matter basis after measuring the loss from drying after 2 hours at 135o C. Recently, the American Feed Industry Association (AFIA, 2007) has reported that this method of estimating loss on drying (135o C/2 hr) was overestimating moisture in distiller grains. This overestimation was confirmed at our laboratory and therefore all samples in this database were corrected by 3% units. Finally, energy values in our system were calculated with a summative equation that considers key nutrients (e.g. starch, fat, etc), the digestible component of that nutrient considering site of digestion (rumen, small and large intestines), and the estimate of metabolizable energy from end products of digestion (e.g. VFAs, glucose, microbial crude protein).
Table 1 shows the results of the nutrient composition and variability in DDGS and WDGS in comparison to corn grain obtained in our analysis. Coefficients of Variation were found higher for dry matter and fat in distillers vs. corn grain. This is in agreement with Akayezu et al. (1998) who reported that dry matter, fat, ash, soluble and degradable protein, and amino acid intestinal digestibility are the nutrients more variable in distillers, while NDF and Protein are less variable. Comparing mean values, CP was similar between DDGS and WDGS, but WDGS contained slightly less NDF and more fat and ash than DDGS. These differences in composition between DDGS and WDGS could be explained if we assume that more thin stillage or distiller’s solubles were included in these WDGS samples than in DDGS, based on the composition of distiller’s solubles (Schingoethe, 2006). There appears to be a larger variability for WDGS in comparison to DDGS for all nutrients presented in Table 1. However, the fewer number of samples analyzed for WDGS in comparison to DDGS needs to be considered in comparing CVs.
Energy values as estimated in our system based on the nutrient composition in
Table 1 indicate that DDGS and WDGS have 108.4 and 110.0% the NEg value of dried corn (coarsely cracked), respectively, and WDGS has 101.5% the NEg value of DDGS. Kononoff and Erickson (2006) summarized feedlot-finishing experiments where dry rolled corn was replaced with WDGS and concluded that WDGS have 120 - 150% the energy value of dry rolled corn in beef finishing diets. Therefore, there is a clear

51
difference in the assigned energy value of the by-product depending on the methodology utilized: analytical vs. animal performance. The analytical approach is a mechanistic estimation of energy that, in general, utilizes nutrient composition, digestibility, and associated energy value of the nutrients for the specific ingredient.
Table 1. Nutrient composition and variability of Corn Grain, Corn DDGS, and Corn WDGS (see text for lab procedures)
Corn Grain Corn DDGS Corn WDGS Number of Samples 1350 3500 117 Dry Matter, % Mean 87.02 89.81 44.17 St. Deviation 1.08 1.37 9.33 Coeff. of Variation 1.2% 1.6% 21.1% Range 84-91 81-97 26-67 CP, % DM Mean 9.00 29.96 29.81 St. Deviation 0.75 1.27 4.24 Coeff. of Variation 8.3% 4.2% 14.2% Range 5.4-12.3 25-43 15-53 NDF, % DM Mean 8.56 28.25 25.7 St. Deviation 0.99 1.86 4.71 Coeff. of Variation 11.6% 6.6% 18.3% Range 6.4-17.6 19-44 16-47 Fat, % DM Mean 3.97 11.90 12.67 St. Deviation 0.30 1.11 1.84 Coeff. of Variation 7.6% 9.3% 14.5% Range 3.0-6.1 4.6-16.2 7.0-17.1 Ash, % DM Mean 1.34 4.49 4,91 St. Deviation 0.15 0.46 1.10 Coeff. of Variation 11.2% 10.3% 22.4% Range 0.7-3.7 1.8-6.7 1.3-10.3 NEg, Mcal/cwt Mean 71.331 77.33 78.46 St. Deviation 0.52 1.58 3.03 Coeff. of Variation 0.7% 2.0% 3.9% Range 68-74 67-83 70-84 1Assuming coarse cracked processing for estimation of energy.

52
For the analytical approach to be useful in practice, it needs to consider associative effects of the specific ingredient when fed with the rest of the ration as a whole (such as changes in dry matter intake, ration conditioning, supply of protein to the animal, site of digestion, etc.). Therefore, when the analytical approach is used, it needs a formulation system that considers other ingredients in the diet, trying to account for all associative effects (positive and negative). The animal performance approach is an empirical estimation of energy based on actual feed conversion, which compares the energy value of the by-product when replaced at different inclusion rates of the corn grain. For this approach to be repeatable, all factors have to be very similar or identical to those in the original experiment including the diets, ingredient composition of the by-product as well as other ingredients in the diet, and other animal and environmental factors. Changes in diet composition can affect the original energy estimation of the specific by-product. An example of this is the addition of other ingredients in the ration, or different processing of existing ingredients (rolled vs steam flaked grain). Thus, neither approach is superior, rather they complement each other to help us better understand and validate the value of the by-product at different inclusion levels and with a variety of other ingredients in the ration. Ideally, an analytical approach that accounts for the rest of the nutritional value of other ingredients and associative effects specific to a ration should be able to predict the performance observed in feedlot experiments under a wide range of conditions, providing a useful tool to nutritionists.
Sensitivity analysis evaluation in feedlot performance from DDGS of varying nutritional value
Table 1 indicates that the CV for NEg as estimated in our system for DDGS was
almost three times greater than the CV for NEg estimated in corn. This higher variability in DDGS and WDGS can be explained by the higher variability found in the fat content of these by-products in comparison to corn grain, and by the more important role that fat has as a contributor of their total energy in these by-products. Fat content in corn distillers is the single most important contributor to NEg, accounting for at least 80% of the variation in NEg. This variability in NEg found in DDGS can have important implications in the total energy density of the ration and therefore having an important impact on feedlot performance and the value (or cost opportunity) of the by-product itself. In order to measure the impact of this variability, we performed a sensitivity analysis comparing feedlot results when using four DDGS of different NEg values based on Table 1: average and plus/minus 1 or 2 standard deviations (SD) from average. Table 2 presents the parameters utilized in this analysis, using a common diet, fixed days on feed, and same animal description, but varying the energy content of the DDGS.
As presented in Table 3, a diet containing the same inclusion of DDGS can have substantial differences in animal performance and net returns. Based on this analysis, plus/minus 1 SD in NEg of DDGS can be worth either $7.58 more or $8.70 less value per ton in comparison to a DDGS of average NEg value.
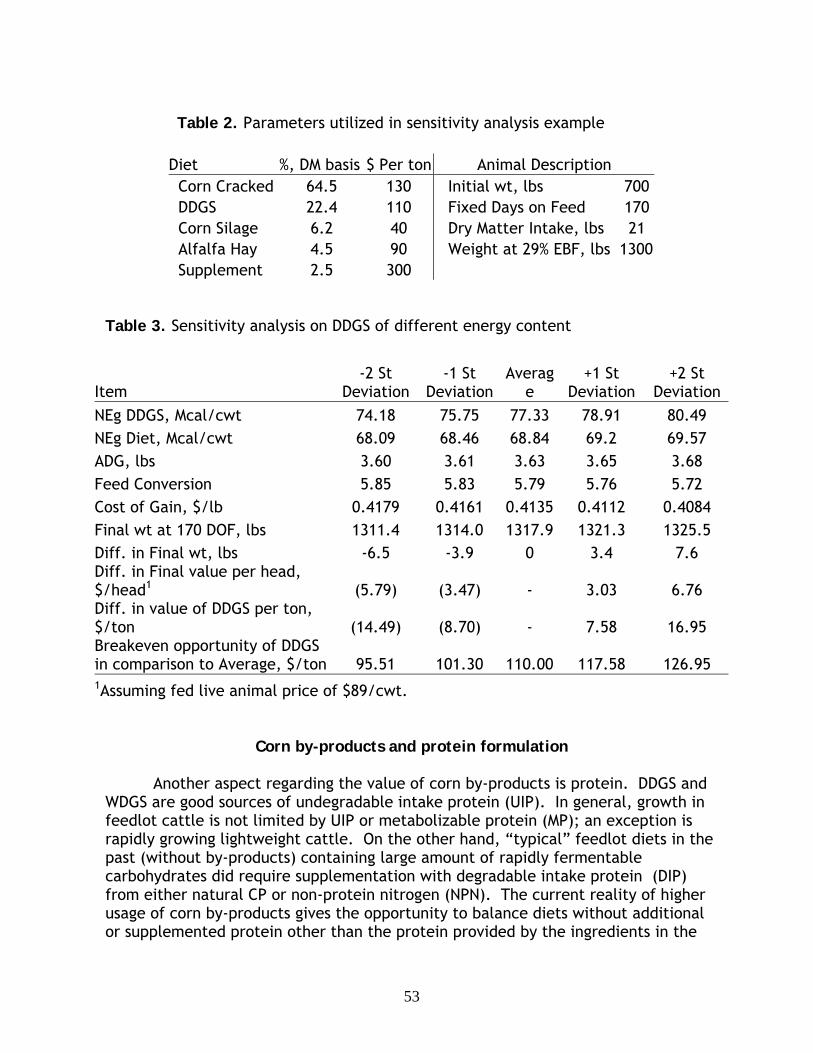
53
Table 2. Parameters utilized in sensitivity analysis example
Diet %, DM basis $ Per ton Animal Description Corn Cracked 64.5 130 Initial wt, lbs 700 DDGS 22.4 110 Fixed Days on Feed 170 Corn Silage 6.2 40 Dry Matter Intake, lbs 21 Alfalfa Hay 4.5 90 Weight at 29% EBF, lbs 1300 Supplement 2.5 300
Table 3. Sensitivity analysis on DDGS of different energy content
Item -2 St
Deviation -1 St
Deviation Averag
e +1 St
Deviation +2 St
Deviation NEg DDGS, Mcal/cwt 74.18 75.75 77.33 78.91 80.49 NEg Diet, Mcal/cwt 68.09 68.46 68.84 69.2 69.57 ADG, lbs 3.60 3.61 3.63 3.65 3.68 Feed Conversion 5.85 5.83 5.79 5.76 5.72 Cost of Gain, $/lb 0.4179 0.4161 0.4135 0.4112 0.4084 Final wt at 170 DOF, lbs 1311.4 1314.0 1317.9 1321.3 1325.5 Diff. in Final wt, lbs -6.5 -3.9 0 3.4 7.6 Diff. in Final value per head, $/head1 (5.79) (3.47) - 3.03 6.76 Diff. in value of DDGS per ton, $/ton (14.49) (8.70) - 7.58 16.95 Breakeven opportunity of DDGS in comparison to Average, $/ton 95.51 101.30 110.00 117.58 126.95 1Assuming fed live animal price of $89/cwt.
Corn by-products and protein formulation
Another aspect regarding the value of corn by-products is protein. DDGS and WDGS are good sources of undegradable intake protein (UIP). In general, growth in feedlot cattle is not limited by UIP or metabolizable protein (MP); an exception is rapidly growing lightweight cattle. On the other hand, “typical” feedlot diets in the past (without by-products) containing large amount of rapidly fermentable carbohydrates did require supplementation with degradable intake protein (DIP) from either natural CP or non-protein nitrogen (NPN). The current reality of higher usage of corn by-products gives the opportunity to balance diets without additional or supplemented protein other than the protein provided by the ingredients in the

54
diet. However, in order to balance diets correctly from a microbial protein requirements standpoint, the following is needed:
1) Good knowledge of the UIP and DIP protein fractions in all ingredients in the diet, particularly those with high protein such as the corn by-products.
2) Reliable estimates of DIP requirements based on rate and amount of rumen fermentable carbohydrates in the diet.
Values of DIP for DDGS found in the literature vary widely, not just from
differences in the specific type of DDGS used among studies (e.g. with or without solubles), but also by the method used to determine DIP. At this time, there is no “gold standard” laboratory procedure in measuring DIP. Stern et al. (1994) and White and Ashes (1999) provide excellent reviews of the different methods for measuring DIP: in vivo, in vitro, in situ, and calculated by estimates of digestion and passage rates (such as in the Dairy NRC, 2001), each having its pros and cons. Obtained values from these different methods should be considered more “relative” values than absolute values and values are not necessarily comparable. The method chosen in our laboratory to determine DIP is the in vitro Streptomyces griseus technique following the procedure of Roe et al. (1990). The value obtained through this method is then applied in an equation developed by comparing selected published data on DIP and in vitro analysis for different feed groups.
As reported by others (Schingoethe, 2006), most of the readily degradable protein in corn is degraded during the fermentation process in producing ethanol, thus the protein remaining in the corn DDGS is going to be proportionately higher in UIP (or less DIP) than in the original corn. Firkins et al. (1984), using an in vivo technique determined the DIP as percent CP for wet and dried distiller grains to be 53 and 46%, respectively, and corroborated these numbers with in situ disappearance of nitrogen (he also explains that corn gluten feed has more degradable protein than distiller grains because the dilution in acid in the wet milling process solubilize some of the gluten protein in corn). Schroeder (2003) reported that most values found in the literature for DIP in DDGS range from 37 to 53% CP. In general, it is accepted that WDGS has slightly higher DIP values than DDGS. The increased addition of thin stillage or syrup to the distillers grains will increase the DIP in the final product due to the much higher degradability of the thin stillage in comparison to distiller grains before solubles are added.
Recently we evaluated 196 samples of DDGS to help us develop NIR
calibrations to predict DIP content: average value of DIP as percent CP (in vitro results adjusted with our equation) and SD from these samples were 46 and 9.4, respectively, with values ranging from 30 to 71. To evaluate the impact of this variability in feedlot diets, we performed a sensitivity analysis similar to the one presented above for energy but this time evaluating the microbial crude protein (MCP) requirements and supply of protein balance when using average DIP and plus/minus 1 or 2 SD in the DDGS in the same diet described in Table 2 (DDGS included at 22.4% DM basis). Our formulation system (Cargill MAXTM) utilizes a model

55
to estimate MCP requirements based on type and amount of dietary carbohydrates fermented in the rumen for each individual diet (e.g. starch, sugars, digestible fiber). Then, diets can be formulated to be balanced by the supply of rumen available protein (RAP, sum of degradable intake protein and recycled nitrogen) to match MCP requirements. This formulation system was recently validated in two large commercial feedlot trials to test a deficient scenario and an excess scenario in balancing for RAP and MCP requirements. Under the deficient scenario, diets that were 10% deficient in the supply of RAP resulted in decreased ADG (3.7%), feed to gain ratio (1.4%), and hot carcass weight (2.0%), all at P-values less than 0.05. Dry matter intake was higher during the first 60 days (P< 0.01) when diets were balanced for RAP with a tendency for DMI to be higher for the entire feeding period (P=0.11). Complete description and results of these studies are being presented elsewhere.
Table 4 indicates that when DDGS contain less than 1 or 2 SD of DIP in comparison to average values the balance between RAP and MCP created a deficient scenario of 7 and 14%, respectively. At average DIP content, the diet only required 0.30% NPN (or 0.11% urea) on a diet DM basis to balance RAP and MCP. At minus 1 SD it requires 0.66% NPN, and at 2 SD it requires 1.31% NPN, at an additional $1 or $2 per head, respectively. While the additional cost to balance for RAP and MCP might not be substantial on a per head basis, the detrimental effects in performance of the deficiency situation can have more important implications based on the feedlot trial results mentioned above. On the other hand, dealing with corn-byproducts that contain high levels of DIP (such as corn gluten feed) can provide opportunities to reduce or eliminate any supplemented protein with a subsequent reduction in ration cost. Table 4. Sensitivity analysis on DDGS of different Rumen Degradable Protein (DIP) content1
-2 St
Deviation -1 St
Deviation Average +1 St
Deviation +2 St
Deviation DIP, %CP in DDGS 27.2 36.6 46.0 55.4 64.8 DIP, %DM in Diet 5.80 6.45 7.11 7.75 8.40 Rumen Available Protein (RAP), grams 759 821 883 945 1007 Microbial Crude Protein (MCP), grams 883 883 883 883 883 RAP - MCP balance, grams -124 -62 0 62 124 Cost or savings to balance for MCP, $/ton Suppl. 46 23 - -17 -17 Cost or savings to balance for MCP, $/head 2.0 1.0 - -0.74 -0.74 1All diets contain same level of CP at 14.3% DM basis. Supplement provided 0.30% NPN, in Diet DM basis in order to match RAP with MCP for the Average DIP in DDGS diet.

56
Conclusions
Examples of nutrient variability in regards to energy and protein in DDGS were shown as they affect feedlot performance. The feedlot industry has a tremendous opportunity to utilize more by-products and improve productivity. However, having a deep understanding of animal requirements and nutrient composition in corn by-products is critical to precisely optimize the design of a diet. The practice of using fixed inclusion rates of by-products in a diet as well as balancing these diets for fixed minimum levels of CP or NPN are no longer adequate for today’s feedlot diets. The technology is available to manage these inputs precisely. Further research is needed in: 1) fully understanding the mechanism behind associative effects with other ingredients in the diet when feeding corn by-products, and 2) dealing with new challenges caused by high concentrations of specific nutrients -such as protein, phosphorus, and sulfur- that appear when corn by-products are fed at high inclusion rates.
Literature cited
AFIA. 2007. Evaluation of analytical methods for analysis of dried distillers grains
with solubles. AFIA Sub-Working Group Final Report and Recommendations. February 1, 2007.
Akayezu, J. M., J. G. Linn, S. R. Harty, J. M. Cassady. 1998. Use of distillers grains and co-products in ruminant diets. http://www.ddgs.umn.edu/articles-dairy/1998-Akayezu-%20MNC.pdf. Accessed on 1/1/07.
Firkins, J. L., L. L. Berger, G. C. Fahey, Jr., and N. R. Merchen. 1984. Ruminal nitrogen degradability and escape of wet and dry distillers grains and wet and dry corn gluten feed. Dairy Sci. 67:1936-1944.
Kononoff, P.J. and G.E. Erickson. 2006. Feeding Corn Milling Co-Products to Dairy and Beef Cattle. 21st Annual Southwest Nutrition & Management Conference. February 23-24, 2006. Tempe, AZ – 155.
Pritchard, R. H. 2006. Update on corn distillers co-products in ruminant diets. 67th Minnesota Nutrition Conference. September 19-20, 2006
Roe, M. B.; Sniffen, C. J.; Chase, L. E. 1990. Techniques for Measuring Protein Fractions in Feedstuffs. Proc. Cornell Nutr. Conf. Feed Manuf., p 81. Syracuse, NY.
Schroeder, J. W. 2003. Distillers Grains as a protein and energy supplement for Dairy Cattle. North Dakota State University, Fargo, North Dakota 58105. http://www.ag.ndsu.edu/pubs/ansci/dairy/as1241.pdf. Accessed on 1/1/07.
Schingoethe, D. G. 2006. Feeding Ethanol Byproducts to Dairy and Beef Cattle. Pages 49-63 in Proc. California Anim. Nutr. Conf., May 10-11, Fresno, CA.
Stern, M. D., G. A. Varga, J. H. Clark, J. L. Firkins, J. T. Huber, and D. L. Palmquist. 1994. Evaluation of Chemical and Physical Properties of Feeds that Affect Protein Metabolism In the Rumen. J Dairy Sci 77:2762-2786.
White, C. L. and J. R. Ashes. 1999. A review of methods for assessing the protein value of grain fed to ruminants. Australian Journal of Agricultural Research. Aust. J. Agric. Res., 1999, 50, 855-69.

57
Beef and the Greening of America
Rick McCarty Executive Director, Issues Management National Cattlemen’s Beef Association
The growing environmental consciousness of America has been much in the
news this past year and several magazines have devoted entire issues to the subject. This new consciousness often is called the “new” greening of America, apparently in deference to Charles Reich’s 1970 book – The Greening of America – that offered the failed prediction of a new and pervasive environmental and community consciousness. The relevance of this for the food industry has been predicted by trend spotters for several years – consumers increasingly want to know where their food comes from.
But, in fact, most consumers really don’t want to know (in any detail) how their
food is produced, especially their meat. What some (currently a minority) of consumers actually want is reassurance that their beef was from animals that were raised humanely, were well-cared for, were not given chemicals (antibiotics and hormones) that could have possible human health implications and were produced from a sustainable agricultural production system. What exactly constitutes sustainable agriculture is subject to wide interpretation. Frankly, no farmer or rancher wants to practice agriculture that is not sustainable. But, generally, sustainable agriculture is considered to be the opposite of industrial agriculture. And industrial agriculture is increasingly being characterized as “factory farming”.
Both food producers and food marketers are feeling pressure in regard to
sustainability. Companies have begun to focus on what is called Corporate Social Responsibility (CSR). CSR is a concept that promotes making decisions and taking actions that will benefit customers, employees, shareholders, communities and the environment. A similar concept is Sustainable Development that argues companies should take more into account than profits and dividends when making decisions. Specifically, corporations should factor in both short- and long-term social and environmental consequences.
Companies are taking this seriously. In 2006, McDonalds Corporation released a
70-page, 4-color comprehensive corporate responsibility report that featured an analysis and review of the company by a group of McDonalds “fellows” – MBA students from the University of California Berkeley. We will see more focus on CSR by food companies.
The new greening of America has created consumer attention to global warming
(Al Gore’s documentary won an Oscar). A recent United Nations FAO report claimed worldwide livestock production is a greater source of greenhouse gas emissions than automobiles. It also has resulted in an emphasis on eating locally (even, according to the March 12 issue of TIME, to the exclusion of eating organically). In testament to the

58
long-term trend of interest in local food, the number of farmers markets in the U.S. doubled between 1994 and 2004.
But, practically speaking, sustainable also is seen as unable to sustain the
feeding of an ever-growing population. Even Whole Foods, the retailing giant that has been a centerpiece of the natural and organic movement and trades heavily on that image, could not have achieved its growth without its shelves being primarily stocked with products from so-called industrial (and international) agriculture. In fact, Whole Foods CEO, John Mackey, has said, “There’s an assumption that small is beautiful and big is industrial and that’s not necessarily the case.”.
Of course, Mackey, a vegan, also has said, “These “factory farm” operations
need to be eventually outlawed, in my opinion, and this is where major change is needed in the organic regulations.”.
Given the new green consumer mindset, what is facing the beef industry? The
fundamental issue involves effectively telling the beef production story. The Beef Industry Long Range Plan 2010 lists telling the beef production story as an important action under its priority of creating sustainability through a favorable U.S. business climate. It is important for the beef industry to tell the story of modern beef production.
The problem is relatively simple to explain. Consumers don’t know how beef
gets from the pasture to the plate. Consumers tend to see beef at the polar extremes of the production chain. They see cattle grazing peacefully in a pasture as they drive down a highway. Their next encounter with beef is a set of choices at the meat case or a beef entrée on the menu of a restaurant. In between the pasture and the plate is a knowledge vacuum we call the Fuzzy Spot.
The Fuzzy Spot has become a battleground. Journalist Walter Lippman once
said, “We are all captives of the pictures in our heads.” Modern marketing has refined that into the science of positioning and of social (cause related) marketing, but the psychological principle remains the same. Activists discovered the potential of the Fuzzy Spot some years ago. The activists have been working aggressively to fill the information void with as many bad pictures as they can and to promote the evils of factory farming. The objective is to convince consumers the steak on their plate comes at a high cost – in terms of health, in terms of safety, in terms of the environment. Activist themes include factory farming, animal cruelty, hormones, antibiotics, pesticides, mad cow disease, E. coli, cancer and heart disease.
Some niche marketers also have discovered the Fuzzy Spot. These marketers
see safety, nutrition and animal care as exploitable marketing advantages. When marketers play in the Fuzzy Spot, they use many of the same themes as the activists but with a twist. They promote the idea that their natural/organic/grass-fed products avoid the evils of factory farming and produce a safer more nutritious type of beef. In

59
short, if you like beef, you can feel good about it if you choose their products. You’ll pay more for that piece of mind.
The result of all this is general consumer confusion. True, USDA has established
standards for organic products and if beef carries the certified organic label, anyone can go read the specifications and know how it was produced. USDA also is working on developing definitions for grass-fed and for natural beef. But a set of voluntary standards and process-verified programs won’t reduce consumer confusion brought on by the claims being made out there in the Fuzzy Spot. It certainly hasn’t for organic beef.
So, what’s the solution? The beef industry has to play in the Fuzzy Spot, too.
But it has to play fair. It has to be accurate and stand on science. It has to tell the beef production story in a way that is accessible and credible to consumers, to media, to industry stakeholder organizations. And it has to use, to the extent possible, those people who are experts at beef production…. beef producers themselves.
NCBA’s consumer research found a long time ago that cattle farmers and
ranchers are credible with the public. They are viewed as honest, hard-working and an embodiment of American values. Nobody knows beef production like beef producers and nobody is more credible telling that story.
To support that effort, NCBA has established a program called Beef - From
Pasture to Plate. It is the story of cattle producers’ commitment to providing wholesome beef. There is a range of activities associated with the program, and a major piece of it can be viewed at its Web site: www.BeefFromPastureToPlate.org
And just like the county fair, we expect this program to get bigger and better
every year.

60
Animal WelfareAnimal WelfareContemporaryContemporary Issues in Issues in TodayToday’’s Animal Agricultures Animal Agriculture
Chris Ashworth DVMChris Ashworth DVMMarch 30, 2007March 30, 2007
Veterinarian’s Oath• “Being admitted to the profession of veterinary
medicine, I solemnly swear to use my scientific knowledge and skills for the benefit of society through the protection of animal health, the relief of animal suffering, the conservation of livestock resources, the promotion of public health, and the advancement of medical knowledge. I will practice my profession conscientiously, with dignity and in keeping with the principles of veterinary medical ethics. I accept as a lifelong obligation the continual improvement of my professional knowledge and competence.”
Chris Ashworth DVM• Raised on a farm east of Fort Smith, AR - Angus cattle.• Undergraduate program – LSU• LSU School of Veterinary Medicine 1987• Large animal internship – U. of Illinois• Three year residency in Food Animal Medicine and
Surgery – U of Illinois 1991• U of I Faculty – 2 years• Purina Mills, Inc – St. Louis and Gray Summit, MO for 7
years.• Monsanto Co. Tech Service – 8 years in Feb of 2007
Chris Ashworth DVM• Animal Welfare Committee – United States Animal
Health Association-Richmond, VA• Animal Welfare Committee – Vice-Chair at National
Institute for Animal Agriculture• Animal Welfare Committee – American Association of
Bovine Practitioners• Animal Agriculture Alliance, Washington DC. Executive
Committee.• Owner of New Frontier Angus Ranch in Fort Smith, AR
and Bangs, TX, and other partnerships in Colorado, Texas and Arkansas
• President of the Arkansas Angus Association
I personally think that when entering into a pure debate with “animal rights” groups you must be under the premise that they are pushing a total vegetarian lifestyle, NOT animal welfare.
Where will our food come from?
• In the next 44 years, another 100 Million people will come to or be born in the US.
• Housing 2 more for every 2• Water – Agriculture or Golf Course• Less land, more people, fewer farmers

61
Moral and Ethical Concerns
• There are moral and ethical concerns regarding food production.
• In the future will the “wealthy” get the good “stuff”, free of all the antibiotics, pesticides, hormones, and growth promotents.
• What do the 16% of Americans that make minimum wage eat ?
My views
• I am not the moral police, the ethical food bearer, nor the only person with the correct view. I want to stimulate you to think about issues that you may not have thought about before.
Terms
•Animal Rights•Animal Welfare•Animal Well Being – “Wellness Programs”
THE MISSION ?
• Improve the lives of animals in modern animal agriculture ?
• Circus Animals• Animals for Entertainment• Rodeos
When are you becoming a vegetarian ?• Vegetarian – abstains from eating meat,
fish, or poultry.• Vegan – abstains from any animal
products, including dairy and sometimes even honey.
• Lacto-ova vegetarian – do eat eggs and dairy products.
Demographics
• 3-5% of the US population is vegetarian• 30% of these are Vegans

62
THE PRESS
• The good• The bad• The ugly• The ugly ugly
Wall Street JournalOnline EditionSeptember 22, 2006“In a single year in this country, our industrialized animal agriculture’s intensive confinement system produces more than a billion tons of manure –as heavy as 10,000 Nimitz class aircraft carriers. Billions of farm animals are overcrowded in stressful, unsanitary sheds, pens, cages, and stalls: no wonder we are increasingly plagued with infectious food-borne diseases. Animal factories are a public health threat. We shouldn’t have to cook the crap out of our food.”
Michael Greger, MDDirectorPublic Health and Animal AgricultureHumane Society of the United StatesWashington
Egg Industry To Drop LogoSan Luis Obispo.comSept. 21, 2006The egg industry has agreed to permanently drop “Animal Care Certified” logos on egg cartons, after state officials and animal rights groups said consumers were being misled. “A certification program must not be promoted in a way that misleads consumers” said Robert Spagnoletti, attorney general for the District of Columbia, which reached the agreement with 16 states and United Egg Producers. Last November, the egg group’s decision to drop the “Animal Care Certified” logo prompted the FTC to stop reviewing a complaint from one animal rights group, Maryland-based Compassion Over Killing.
The Animal Rights Industry
• Who are they ?• Where do they get their money ?• What is their relationship to each other ?• Networks ?
• www.activistcash.com
The Animal Rights Industry
• 400 Active Groups• > $ 400 Million Budget• People Commitment• 8,000 to 10,000 people protest in 7 days
Whom owns your pet ?
• Pet Ownership • Pet Guardianship• Communal Pet Ownership• Pet of the State

63
Methods that are Working ?
• Public billboards• Magazine articles• Hollywood• The ultimate farm and ranch managers
would include: Paris Hilton, Bo Derek, Jessica Simpson, Paul McCartney, Pamela Anderson, and the Rev. Al Sharpton
• www.kentuckyfriedcruelty.com
Top 5 Animal Rights Groups
• Humane Society of the United States• > $130 M (Doris Day Foundation)• Farm Sanctuary $4.384 M• Farm Animal Reform Movement $409000• PETA - $29 M• Physicians Committee for Responsible
Medicine - $10.575 M
Top Priorities Across All Species• Method of Slaughter• Method of Stunning/Immobilization• Transportation• Form of Housing
The European Influence ?• Why do the European’s not trust their
food ?• BSE ?• Foot and Mouth Disease –• Larger numbers of people, smaller land
mass. • Environmental impact of human waste ?
How do you dispose of it ?
Organic vs. Conventional
• Why does the animal rights movement endorse the organic industry ?
• What is conventional ?• What are the animal rights activists calling
it ?
We need a national land use plan!
• Where is the land going today ?• Where is it going to come from in the
future ?

64
What’s next ?
• Hormone Free ?• Antibiotic Free ?• Humane Friendly ?• All Natural ?
Animal Welfare Issues
• Gestation Crates – AZ and FL• Veal Crates – AZ and FL• Tail Docking• 3x Milking• Antibiotic Free• Organic Castration• Castration – Age and Method
HB 5557
• Farm Animal Purchase Act
Antibiotic Free
• What is the ethics and morality of NOT treating an animal with a bacterial infection with an antibiotic ?
All Natural Programs
• Do they differentiate ?• 2% All Natural, 98% Conventional• Do they play by the rules ?• What rules ?• Use of Artificial Insemination ?• Pick the management practices that I like ?• Water – Ozonated, Reverse Osmosis ?• Chicken labels ?
Reduced Production
• If we reduce production on a per cow basis for any reason, don’t we have to add cows to make up for the lost production ?
• Adding one cow, adds another 127 pounds of wet manure ?
• Is this sustainable ?

65
Congresswoman Delauro
• “The farm animal industry needs more regulation to prevent all of these E.coli food borne illnesses.”
NCIFAP
• National Commission on Industrial Farm Animal Production
• CAFU effects on:• Human Health• Antimicrobial Resistance• Animal Welfare• Sociologic Change in Small Rural
Communities
Is the slaughter of horses legal ?
• Why is this important to the people in this room ?
How are horses slaughtered ?
• What method is approved by USDA ?• Captive bolt to the head
Do you care how a chicken is slaughtered ?• Why is this important to me as a hog
producer or a beef rancher or a dairyman ?
HSUS sues USDA over chicken slaughter• In 2005, HSUS sued USDA over the
method of stunning for poultry in the Northern California Federal Courts.

66
How are cattle killed at slaughter ?
So, if it becomes illegal to “harvest”horses for food in which a captive bolt is used, and it becomes illegal to slaughter and stun birds with electrical pulses in salt brine solution, could it not conceivably become illegal to “harvest” cattle for food, in which a captive bolt is used ?
“FACTORY FARM”
Why will the animal rights industry not define “factory farm” ?• One reason• This means they would be embracing
animal agriculture• Their goal is to stop all animal agriculture
Future Methods of the Animal Rights Groups• Litigation• Legislation• Litigation• Grass roots movements• Litigation• Organic• Litigation• Dealing with the producer or producer groups• Litigation
Top Priorities Across All Species
• Method of Slaughter• Method of Stunning/Immobilization• Transportation• Form of Housing
67
US Meat Production
• Chicken• 1995 24 B #• 2005 37 B #
Economic Research Service
• Cattle• 1995 100 M Head• 2005 93 M
How will these help ?
• Arkansas Funeral Home Assoc.• Oklahoma Used Car Dealers Assoc.• Kansas Convenience Store Assoc.• Canadian Tourist Bureau
Farmed Fish
• Almost 70% of fish consumed as food worldwide are raised on fish farms rather than caught in the wild.
• 45.5 million metric tons of fish eaten each year worldwide.
• Developing countries supply 77% of fish consumed globally as food.
Food and Agriculture Organization (FAO)
Farm Fish Issues
• Catfish –• Salmon -• Method of Slaughter• Density per cubic foot of water• % that die during production• “Conditions on aquafarms are so horrendous that on some farms, 40% percent of the
fish may die before farmers can kill and package them for food”www.fishinghurts.com
• www.lobsterlib.com
Equine Issues
• Horse Slaughter• Nerve blocks of the foot• Soring• Transportation issues, esp. to slaughter• Rodeo events – bronco riding, calf roping• Tail blocks• Carriage Horses in cities such as New Orleans,
Memphis, Fort Smith, etc
Poultry Issues
• Method of Slaughter/Stunning• Debeeking• Cage size• Free range ?• Layers – Cages, nesting boxes, ground eggs• Transportation• Density in houses• Avian Influenza

68
Feedlot Issues
• Mud• Cleanliness of the hides• Shade• Transportation• Dehorning/Castration –method/age• Pain control• Downer animals
Cow-Calf Issues
• Method of weaning Whole Foods Markets• Castration – analgesia ?• Timing of castration• “All Natural Programs” – AI ?• Dehorning• Downer Cows
Dairy
• Downer Cows• % lame in a lactation• Shade• Heat stress Cattle deaths in California !• 2x vs. 3X milking• Newborn care – esp. colostrum management for
bulls• Tail docking• When do we remove a calf after birth ?
Swine• Method of slaughter.• Stunning/CO2• Farrowing crates• Gestation crates• Needle teeth removal• Tail docking• Timing of castration• Analgesia/anesthesia for castration• Transportationwww.azFarmersRanchers.com
Castration and Dehorning
• What legislation or industry directives will come about regarding castration and dehorning ?
• So, how do I organically castrate a male farm animal ? No drugs, no pain relief ?
Issues that we need to improve
• Shade• Heat Stress management• Overstocking in the early growth process• ALL Transportation – to the veterinary clinic, to
the farm, to the livestock sale barn, to the feedlot, to the slaughter house.
• The photo op – the dead calf, stockers on the side of the road, disposal of dead swine.

69
Why did we start to use commercial fertilizers in the late 1950’s ?
•FOOD SAFETY IS THE REASON !
Pasteurization of Milk
• Dr. Louis Pasteur (1822 – 1895)• Most likely the most important food safety
process ever to come to human food production.
• Why do some people propose we discontinue pasteurization of milk ?
www.rawmilk.org
Food Safety
• Pasteurization• Milk, orange juice, apple juice, …• Bottled water ?
Irradiation
Is E.coli in Spinach an issue ?
• Where did it come from ?• Why ?• Why was it not detected sooner ?• Is organic really safer ?• Raw milk ?
ORGANIC FOODS• Organic - Pure, clean, unadulterated, no pesticides, no
chemicals, no hormones, etc. Marketing by exclusion !
• Conventional – “the other stuff”
• “Contaminated” with chemicals, hormones, and all things bad.
• *Milk has over 40 hormones that you can assay for, even in organic milk.

70
www.ams.usda.gov/nop
The Organic “Revolution”
• Not safe in a lot of ways.• Lower production per acre• Therefore more acres have to be grown• More total water used, with more acres• Is this “sustainable”.• 16% of Americans make minimum wage !• How do the poorest of Americans afford food if
organic is the wave of the future.
Organic Animal Production
• What is moral or humane about NOT treating an animal with an infection with an antibiotic ?
• If your child had an ear infection, will you not treat that child’s infection with an antibiotic ? Dept. of Child Protective Services ?
• Are infections in farm animals different ?
Veterinarian’s Perspective• I personally think that NOT treating an animal’s
infection, inflammation, or condition is ethically WRONG !
• Using products such as spices, locoweed, and aloe vera (Non of which are approved by the FDA !) is not humane to the animal, not scientifically proven, and leads to chronic pain for these animals. Want some X with that pre-curdled milk ?
• What about meat and milk withdrawal times ?
Some useful websites
• www.consumerfreedom.com• www.animalagalliance.org• www.animalscam.com• www.CSPIScam.com• www.mercuryfacts.org• www.Petakillsanimals.com• www.PhysicianScam.com
“A complex mess”
• Vegetarian Agenda• Animal welfare• Organic• Food Safety• Cheap food for the masses• Specialty diets• Environmental issues• Antimicrobial resistance

71
CALL TO ACTION
Questions
• Did I make you think ?
These issues are not always about science ?
72

73

74
University Research Updates
Texas Tech University Burnett Center
M. L. Galyean and J. T. Vasconcelos Department of Animal and Food Sciences
Texas Tech University, Lubbock
Introduction
Research conducted at the Texas Tech University Burnett Center has continued to focus on effects of various nutritional and management factors on performance by feedlot cattle. Major areas studied have included methods to improve feedstuff utilization, prediction and management of feed intake, and animal health/nutrition interactions. With increasing availability of coproducts from wet corn milling and ethanol production, research has been conducted to evaluate the use of these coproducts in finishing diets. Efforts also have been made to regularly evaluate nutritional recommendations by feedlot consulting nutritionists, and a 2007 Consulting Nutritionist Survey (update of the 2000 survey) was recently finalized. Effects of graded levels of sorghum wet distiller’s grains and degraded intake protein on performance and carcass characteristics of feedlot cattle fed steam-flaked corn-based diets. J. T. Vasconcelos, L. M. Shaw, K. A. Lemon, N. A. Cole, and M. L. Galyean.
Two experiments evaluated different levels of sorghum wet distiller’s grains (SWDG) and effects of increasing levels of degraded intake protein (DIP) in diets containing SWDG on performance and carcass characteristics of feedlot cattle. In Exp. 1, 200 steers (average BW = 404 kg) were fed SWDG at 0, 5, 10, and 15% of DM and 1 level of corn WDG (10% of DM) replacing steam-flaked corn in a high-concentrate diet. Final BW (P = 0.04) and overall ADG (P = 0.01) decreased linearly with increasing levels of SWDG. Increasing SWDG decreased overall G:F (P = 0.01), hot carcass weight (HCW; P <0.01), and longissimus muscle area (P < 0.01). No differences were observed in overall DMI (P = 0.15) and other carcass characteristics (P ≥ 0.09). Neither DMI nor G:F differed between corn WDG and SWDG when fed as 10% of the dietary DM. In Exp. 2, 200 steers (average BW = 369 kg) were either fed a control diet without SWDG or one of 3 SWDG (10% of DM) diets with no urea added (0DIP) or 50 (50DIP) and 100% (100DIP) of the difference in the DIP concentration between the 0DIP and control diets added as urea. Final BW (P = 0.03), overall ADG (P = 0.04), and overall G:F (P = 0.05) were greater for cattle fed the control diet. A linear decrease was observed in overall DMI with increasing DIP (P = 0.02). Likewise, overall ADG decreased with increasing DIP levels (P = 0.08). Cattle fed the control diet had greater HCW (P = 0.03), fat thickness (P = 0.02), and yield grade (P = 0.01) than those fed the 3 SWDG diets. Results from both experiments suggest decreased performance and carcass value with increasing levels of SWDG alone or combined

75
with additional DIP. At 10% of the dietary DM, corn and sorghum WDG resulted in similar ADG and G:F.
Table 1. Overall feeding period performance by cattle fed graded levels of wet sorghum distiller’s grains and 1 level of wet corn distiller’s grains (Exp. 1)
Distiller’s grain treatments1 Item 0% S5% S10% S15% C10% SE2 Initial BW, kg 406.5 401.9 407.7 408.6 399.6 7.34* Final BW, kg 605.0 604.6 596.8 583.8 584.7 7.67† Adjusted final BW, kg3 605.8 607.1 594.9 579.3 585.2 8.02‡ ADG, kg 1.50 1.54 1.43 1.32 1.40 0.05‡ Adjusted ADG, kg3 1.50 1.55 1.41 1.29 1.40 0.05‡ DMI, kg/d 8.48 8.78 8.41 8.20 7.98 0.20 G:F 0.177 0.175 0.170 0.160 0.175 0.01‡ Adjusted G:F3 0.178 0.177 0.168 0.157 0.175 0.01‡ 1Treatments (DM basis) were: 0% = 90% concentrate control diet without wet sorghum distiller’s grains; S5%, S10%, S15%, and C10% = 5, 10, and 15% wet sorghum distiller’s grains and 10% wet corn distiller’s grains, respectively. 2Pooled SE of treatment means, n = 8 pens/treatment. 3Adjusted final BW = hot carcass weight divided by the average dress (61.31%) of all the cattle, after which ADG and G:F values were recalculated using the adjusted BW. Cattle were on feed an average of 133 d. *S10% vs. C10%, P < 0.05; †Linear effect of wet sorghum distiller’s grain level, P < 0.05; ‡Linear effect of wet sorghum distiller’s grain level, P ≤ 0.01.

76
Table 2. Effects of degraded intake protein (DIP) concentration in wet sorghum distiller’s grains plus solubles on performance by finishing beef steers for the overall feeding period (Exp. 2) DIP restored, %1
Item Control 0 50 100 SE2 Initial BW, kg 370.4 368.7 367.7 369.1 9.41 Final BW, kg 605.3 596.2 586.7 582.6 10.21* Adjusted final BW, kg 607.4 593.2 588.6 582.1 11.36* ADG, kg 1.72 1.68 1.61 1.57 0.05*Ψ Adjusted ADG, kg3 1.74 1.66 1.63 1.56 0.06* DMI, kg/d3 9.24 9.25 8.99 8.72 0.22‡ G:F 0.186 0.181 0.179 0.180 0.01* Adjusted G:F3 0.188 0.179 0.180 0.179 0.01† 1DIP restored relative to steam-flaked corn-based Control. The DIP concentrations (NRC, 1996) were 8.4, 7.2, 7.8, and 8.4% (DM basis) for Control, 0, 50, and 100% DIP diets, respectively. 2Pooled SE of treatment means, n = 10 pens/treatment. 3Adjusted final BW = hot carcass weight divided by the average dress (62.05%) of all the cattle, after which ADG and G:F values were recalculated using the adjusted BW. Days on feed varied from 120 (8 pens) to 132 (12 pens) and 146 (20 pens). *Control vs. others, P < 0.05; †Control vs. others, P ≤ 0.07; ΨLinear effect of DIP level, P ≤0.08; ‡Linear effect of DIP level, P < 0.05. Effects of proportions of wet corn gluten feed and/or distiller’s dried grains with solubles in steam-flaked corn-based diets on performance and carcass characteristics of feedlot cattle. J. T. Vasconcelos and M. L. Galyean.
Two hundred crossbred steers (initial BW = 388 kg) were fed 5 different diets to evaluate the effects of proportions of wet corn gluten feed (WCG) and/or distiller’s dried grains with solubles (DDGS) on performance and carcass characteristics. Dietary treatments (DM basis) consisted of: 1) a steam-flaked corn-based high-concentrate diet with no WCG or DDGS (CON); 2) a diet with 7% DDGS; 3) a diet with 20% WCG; 4) a diet with 13% WCG and 7% DDGS; and 5) a diet with 20% WCG and 7% DDGS. Final BW and carcass-adjusted (to a constant dressing percent) final BW tended to be greater (P = 0.07) for the average of all 4 WCG/DDGS treatments than for CON, but no differences were noted among the 4 WCG/DDGS treatments (P > 0.10). Average daily gain was greater by steers in the 4 WCG/DDGS treatments than by steers fed the CON treatment from d 0 to 42 (P = 0.08), d 0 to 84

77
(P = 0.01), and overall (P = 0.04). Carcass-adjusted ADG also was greater (P = 0.04) for the average of the 4 WCG/DDGS treatments than for CON but not different among the 4 WCG/DDGS treatments. Dry matter intake from d 0 to 42 (P = 0.03), d 0 to 84 (P = 0.02), and for the overall study period (P = 0.02) was less by cattle fed the CON diet than by the cattle in the other treatments. Gain efficiency did not differ (P > 0.10) among CON and WCG/DDGS treatments. Hot carcass weight tended to be less (P = 0.07) for cattle fed the CON diet than for cattle fed the WCG/DDGS diets, but no differences were observed between the CON and WCDG/DDGS treatments for other carcass characteristics. Percentage of cattle grading USDA Choice or greater was not affected by dietary treatment. Data suggest that up to 20% WCG and 7% DDGS can be used effectively alone or in combination in steam-flaked corn-based finishing diets. Effects of Saccharomyces cerevisiae subspecies boulardii CNCM I-1079 on feed intake by healthy beef cattle treated with florfenicol and on health and performance of newly received beef heifers. S. A. Keyser, J. P. McMeniman, D. R. Smith, J. C. MacDonald, and M. L. Galyean. (In Press – Journal of Animal Science – doi:10.2527/jas.2006-751).
Effects of a live yeast supplement (Saccharomyces cerevisiae subspecies boulardii CNCM I-1079; ProTernative Stress Formula [PTSF] yeast) on DMI, performance, and health of beef cattle were evaluated in 3 experiments. In Exp. 1, a pilot study was conducted with 10 healthy beef steers (average BW = 391 kg) fed a 65% concentrate diet to evaluate effects of florfenicol (s.c. in the neck vs. sterile water injection) on DMI. Steers injected with florfenicol had 15.6 (P = 0.092) and 22.2% (P = 0.015) decreases in DMI compared with controls on the day of and day after injection, respectively, with no differences for the remainder of the 7-d period. In the main study of Exp. 1, healthy beef steers (6 pens of 5 steers each/treatment; average initial BW = 382.6 kg) were fed the Control or PTSF yeast diets (0.5 g of yeast•steer-1•d-1) for 5 d before being injected s.c. with florfenicol. Compared with the 5 d before injection, DMI decreased after injection, but it did not differ (P > 0.66) between treatments on the day of and day after injection. By the second day after injection, DMI tended (P = 0.107) to increase for steers fed PTSF yeast vs. Control steers, with a similar pattern on the third day after injection (P = 0.197). No differences were noted between treatments for the remainder of the 7-d period or for the subsequent 2 wk. In Exp. 2, 3 separate loads of beef heifers (277 heifers; average initial BW = 230.3 kg) were shipped from auction barns and assigned randomly to 1 of 2 treatments (5 pens/treatment within each load) during 35-d receiving periods: 1) Control = 65% concentrate receiving diet; or 2) PTSF yeast = 65% concentrate receiving diet with PTSF yeast added to supply 0.5 g of yeast/(heifer•d). All heifers were treated with florfenicol on arrival, and PTSF yeast heifers received approximately 1 g of yeast via an oral paste at the time of processing. Averaged over the 3 loads, treatments did not affect (P > 0.12) DMI, ADG, or G:F during the 35-d period, but the percentage of cattle treated once or more for respiratory disease (BRD) was greater for Control (P = 0.04) than for PTSF yeast heifers (24.0 vs. 13.78%, respectively). In Exp. 3, 2 separate loads of beef heifers (180 heifers; average initial BW = 209.0 kg) that were not treated with

78
antibiotic at the time of arrival processing were fed a 70% concentrate receiving diet and assigned the same 2 treatments as in Exp. 2. No differences (P > 0.72) were noted between treatments in ADG, DMI, and G:F for the 35-d receiving period, and BRD morbidity pooled across loads did not differ between treatments (40.2 vs. 33.1% for Control vs. PTSF yeast). Providing PTSF yeast in an oral paste at the time of processing combined with the addition of 0.5 g/(animal•d) in the diet had little effect on receiving period performance; however, it decreased BRD morbidity in heifers given florfenicol on arrival but was without effect on BRD morbidity in heifers that did not receive a prophylactic antibiotic. Effect of simulated air-lift and conveyor leg takeaway systems on starch availability and in vitro dry matter disappearance of steam-flaked corn grain. J. P. McMeniman and M. L. Galyean. (In Press – Animal Feed Science and Technology – doi:10.1016/j.anifeedsci.2006.11.00).
An experiment was conducted to determine effects of simulated air-lift (AIR) and auger/drag-chain leg (LEG) takeaway systems on starch availability (SA) and in vitro dry matter disappearance (IVDMD) of steam-flaked corn grain. At a commercial feedlot in Texas on 3 different days, corn grain was steam flaked to a bulk density of 360 g/L. At 3 random times per day, grain was sampled beneath the rolls, with a portion allocated to initial measurement of flake color with the Flake Camera Index System (FCIS). The remaining grain was allocated to the AIR and LEG treatments. For AIR, flaked grain was placed in a Styrofoam cooler, cooled to 37.8oC, covered, and stored for 4 h. For LEG, flaked grain was placed in a Stryofoam cooler, covered immediately, and stored for 4 h. After the 4-h storage period, 3 random samples of corn grain from each treatment were analyzed for SA, flake color, and IVDMD. The AIR samples had greater (P < 0.001) SA than LEG samples. Similarly, AIR samples had greater (P < 0.001) IVDMD at 4 and 24 h vs. LEG samples. Correspondingly, half time of disappearance (t½) was greater (P = 0.06) for AIR vs. LEG samples. The FCIS measurements did not differ between initial and 4-h AIR and LEG samples. Results indicate that rate of cooling of freshly processed steam-flaked corn grain as influenced by a simulated takeaway system may affect starch retrogradation. Whether the magnitude of these differences under commercial feedlot conditions elicits a difference in animal performance remains to be determined. Upcoming Research Projects
• Summarization of the 2007 Consulting Nutritionist Survey. • Feeding value of wet distiller’s grains in finishing diets based on dry-rolled or
steam-flaked corn. • Factors affecting in vitro hydrogen sulfide production in finishing diets. • Development of equations to predict daily feed intake by finishing beef
cattle. • Flake density x roughage level interactions in finishing diets. • Plane of nutrition x antibiotic effects on immune responses in steers. • Selenium source effects on immune responses of steers challenged with IBR.

79
Table 3. Nutrient analyses, enzymatic starch availability (SA), flake camera index system values (FCIS), and in vitro dry matter disappearance (IVDMD) of steam-flaked corn samples obtained from simulated air-lift (AIR) or auger/drag-chain leg (LEG) takeaway systems1 Item AIR LEG SEM P-value Nutrient, %2
Starch 75.94 75.64 - - DM 92.77 92.80 - - CP 8.25 8.26 - - ADF 2.68 2.96 - - EE 2.45 2.72 - - Ca 0.01 0.01 - - P 0.17 0.19 - - K 0.30 0.33 - - SA, % 52.2 31.3 1.20 <0.001 FCIS3
Initial 8,594 8,594 11.1 1.00 4 h 8,566 8,582 36.1 0.42 IVDMD, % 4 h 35.0 30.8 0.69 <0.001 24 h 72.3 67.6 1.00 <0.001 IVDMD t½, h 21.2 18.9 1.10 0.06 1Treatments were: AIR = steam-flaked grain placed in a Styrofoam cooler, cooled to 37.8oC, then covered and stored for 4 h; LEG = steam-flaked grain placed in a Styrofoam cooler, covered immediately and stored for 4 h. 2Nutrient analyses conducted in duplicate on composite samples of AIR and LEG corn grain, except for DM, which was conducted in duplicate on original air-dry samples of AIR and LEG. 3FCIS values are arbitrary units, with lower values theoretically representing higher SA.

80
South Dakota State University
R. H. Pritchard, E. R. Loe and A. Wertz-Lutz Department of Animal and Range Sciences South Dakota State University, Brookings
Role of Ghrelin in the Regulation of Feed Intake and Composition of Gain (A. E. Wertz-Lutz, R. H. Pritchard, A. Trenkle, D.C. Beitz, J. A. Clapper, D. H. Keisler, J. S. Thrulow)
Feed efficiency and composition of gain are two factors that heavily influence the profitability of beef production. Feed costs account for 40 to 70 percent of the total on-farm costs of beef production, and variation in feed intake can result in poor feed efficiency and increased incidence of metabolic disorders both of which negatively impact profitability in the production of beef. Currently, premiums and discounts are given to beef carcasses on the basis of intramuscular (quality grade) and subcutaneous (yield grade) adipose tissue, respectively. Nutrition during the growing-finishing period is one factor that can influence adipose tissue deposition. The interaction of nutrition and hormonal regulation of feed intake and composition of gain is an emerging area or research. Ghrelin is a peptide hormone that is secreted from the abomasum of cattle and, in rodents, fluctuation of ghrelin has been demonstrated to stimulate feed intake and alter body composition. As a result of the economic impact of feed intake and body composition on the profitability of beef production, we have been studying ghrelin in relation to feed intake and body composition. Our research has demonstrated that plasma ghrelin concentrations are elevated 6-fold when finishing cattle exposed to short-term (48 h) complete feed deprivation. Additionally, administration of exogenous ghrelin to achieve a plasma concentration similar to that measures for cattle deprived of feed, resulted in increased length of time spent feeding and a tendency for increased feed consumption during the period of elevated plasma ghrelin concentrations in satiated cattle. Additionally, long-term (21-d) moderate feed intake restriction (0.8 x that required for BW maintenance) resulted in persistently elevated plasma ghrelin concentrations throughout the 21-d restriction period for cattle in a lipolytic state. These data lead us to believe that ghrelin may have a role in feed intake regulation and perhaps signaling metabolic status in cattle. Currently, we are investigating the relationship of ghrelin and leptin with composition of gain by using cattle of similar age, genetic background, and pre-weaning management, but treated to a post-weaning growing program that results in differential compositional growth. Serial carcass measurements, tissue samples, and blood samples are being collected for analyses. Corn Germ in Finishing Diets (R. H. Pritchard, G. Kleinhans)
The BFRAC process (Broin) yields germ containing 16% CP and 19% EE. The dry, flowable product would make it easy to incorporate a significant level of EE into finishing diets.
To identify an optimal inclusion level, germ was substituted iso-nitrogenously for corn-SBM in 93% concentrate finishing diets based on whole shelled corn. The

81
12.8% CP diets were fed to 20 pens (8 hd pen-1) of steers for a 140d period. Germ caused a linear (P<.01) increase in DMI, with 30% germ diet intake 5.8% higher than controls. Germ also caused a linear (P<.01) increase in F/G with 30% germ diet F/G being 8.1% higher than controls. Cumulative ADG based upon carcass adjusted final BW was similar across diets (3.81 lb + 0.063). Germ also caused linear decreases in rib eye area (P=.08) and marbling (P<.05) with a trend toward higher Yield Grade (P=.11).
In the companion metabolism study using wethers, DMI increased as was demonstrated in the steers. There was a linear (P<.01) decline in DM digestibility from 89.7% for controls to 84.3% in 30% germ, that very likely was due to the dramatic increase (Linear P<.01) in DMI. The DE content of diets decreased linearly (P<.01) as germ increased from 0% (DE=3.62 Mcal/kp) to 30% (DE=3.48 Mcal/kg). The EE digestibility was higher (Quadratic P<.01) when germ was included in diet 81.9% and 87.9% (control v germ diets). Nitrogen retention was 4.54 g/d for 0 and 10% germ diets and was reduced by 54% to 2.08 g/d when the 30% germ diet was fed. This was not due to differences in N digestibility which was unaffected by diet. This reduced N retention response would be consistent with the reduced REA and inflated F/G observed in the steers. It appears that there are metabolic antagonisms present when corn oil content exceeds 5 to 6% of the diet.
De-oiled Distillers Grains in Calf Receiving Diets (R. H. Pritchard)
A new ethanol co-product emerging in the Midwest is distillers grains from which the oil has been extracted. The only apparent compositional change between conventional DDGS and this de-oiled distillers grain (dDGS) is the concentration of all other fractions proportional to removal of the oil. The product will still contain approximately 2 to 2.5% EE. We evaluated the replacement value of dDGS for SBM in corn silage based calf receiving diets (46 Mcal NEG/cwt). Treatments included iso-nitrogenous substitutions of supplemental CP. The control diet (SBM) contained 11.5% SBM, 11.7% CP. The 50/50 diet was supplemented with a SBM, dDGS blend wherein each ingredient provided equal parts N. The 10/90 diet supplement provided 10 parts SBM-N to 90 parts dDGS-N.
During the initial 32d after arrival, performance was evaluated using 27 pens of 9 or 10 calves/pen. The DIP balance based upon cattle BW and DMI, analyzed CP values of feeds and tabular values for CP degradability and TDN resulted in DIP balances of -51, -124, and -188 g/d for treatments SBM, 50/50 and 10/90 respectively. Treatment did not affect DMI 12.24 lb +.12. The 50/50 treatment caused an increase (P<.05) in ADG (3.10, 3.15 and 3.01) and improved (P<.01) F/G (4.35, 4.23 and 4.37) for treatments SBM, 50/50 and 10/90 respectively. Substitution of dDGS for SBM appears suitable in calf receiving diets. There appears to be some complementarities to an iso-N blend of SBM and dDGS that is not explained by DIP balance or MP allowed ADG. Cattle Housing Systems (E. R. Loe)
The Opportunities Farm Feedlot has three housing systems on one site. These systems include open pens with mounds, smaller area open pens with a shed over the feed alley-feed bunk-and 20 ft of pen, and a solid floor, bedded, monoslope

82
confinement barn. Each system has 4- 80 head pens. There are now 13 turns of closeouts in the comparison appropriate to use in making cattle performance comparisons. Data to date are heavily weighted to the Jan-Jun period of years and the cattle are mostly backgrounded steers. In this 13 turn comparison, days on feed were 156 d ± 0.04, and initial weights were 803 lb ± 0.4. Performance in the Open, Shed, and Confine systems respectively was: ADG) 3.39, 3.53, and 3.54 lb (P<.01); DMI 24.56, 24.69, and 24.37 lb (P> 0.2); and F/G 7.31, 7.05, and 6.92 (P<.01); Cost of Gain ($/lb) assuming fixed yardage costs was 0.48, 0.46, and 0.47 (P<.05).
Data collection continues on this project. Key issues in the long term evaluation will consider seasonal interactions with housing systems, as well as system influences on cattle health, carcass characteristics, and the O&M costs for each system. Southeast Research Farm Feedlot (E. R. Loe)
We are conducting experiments investigating diet considerations when feeding distillers grains and how fat sources effect beef composition. This work will progress to include evaluations of how beef quality is influenced when feeding soybeans, soy oil, or intake limiters.
We are evaluating the nutritional and economical effects, of feeding whole-shelled corn or dry-rolled corn in diets that contain moderate levels of distillers grains.
Additionally, we are conducting an experiment designed to determine whether there are meaningful interactions between distillers grains and ionophores. Other Projects in Progress Intake modifiers: (R. H. Pritchard, E. R. Loe) Multiple approaches compared with conventional cattle feeding De-oiled Distillers Grains: (R. H. Pritchard) Use as SBM replacement in calf and finishing diets Influence of Excess Dietary CP on Carcass Traits: (T. Machado, D. Wulf, E. R. Loe, R. H. Pritchard)
Impact of high dietary CP brought on by DDGS inclusion on carcass and sensory traits of beef. Influence of Cattle Housing on Carcass Traits: (T. Machado, D. Wulf, E. Loe, R. Pritchard)
Tracking of carcass traits across housing systems in the Opportunities Farm Feedlot. Relationship between Pen Intake Patterns and Quality Grade: (R. H. Pritchard)
Evaluation of historical data of DMI and grain intake at specific times while on feed and the potential relationships with carcass Yield and Quality Grades.

83

84

85
Graduate Student Research Presentations
Investigation of differences in feed efficiency through comparison of observed versus model predicted feed intake in Bos indicus – Bos taurus F2 full sibling steers. T. S. Amen, J.E. Sawyer, A. D. Herring, J. O. Sanders, D.K. Lunt and C. A. Gill. Texas A&M University, College Station and McGregor.
Individual feed intake (DMI) and body weight were measured on 149 F2 Nellore-Angus steers born and raised at the Texas A&M University Experiment Station at McGregor. Steers belonged to 12 full-sib embryo transfer families sired by 4 bulls and from 12 dams born in the spring and fall of 2003 to 2005. At approximately 12 months of age, steers were placed on feed for an average of 140 d with individual intake measured using Calan gates.
Using the NRC (2000) model, daily feed intake was predicted based on observed weight gain for each animal and standardized input for animal type, age, sex, condition, and breed. This model predicted intake (MDMI) was then subtracted from observed DMI and the difference defined as model predicted residual consumption (MPRC) such that those animals that consumed less than predicted (and thus, were more efficient) had negative MPRC. This method was utilized instead of traditional residual feed intake in order to make simultaneous use of data from multiple contemporary groups. Mixed procedures of SAS were then used to analyze MPRC with fixed factors of sire and family nested within sire. Initial analysis also included contemporary group; however, substantial imbalance existed with sire and family, so it was subsequently omitted. Sire (P = 0.016) and family (sire) (P < 0.001) both accounted for variation in MPRC. Least squares means for MPRC by sire ranged from a low of -0.51 ± 0.22 kg day -1 to a high of 0.65 ± 0.36 kg day -1. Least squares means for MPRC by family (sire) ranged from -2.13 ± 0.48 kg day -1 to 1.45 ± 0.60 kg day -1 across families. Furthermore, sires ranked the same for MPRC for both least squares means and simple means.
In a separate analysis, regression procedures of SAS were used to regress observed DMI on ADG to obtain predicted values for DMI as well as residuals (RFI) within each contemporary group. Then, the Mixed procedure was used to analyze RFI with fixed factors of sire and family nested within sire. As with MPRC, sire and family nested within sire both accounted for variation in RFI. However, in this analysis, sires ranked differently for RFI depending on if the rank was established with simple means or least squares means.
Selection based on RFI has been shown to improve feed efficiency without an accompanying increase in mature cow size. However, comparing animals of different contemporary groups may be problematic because the regression equation derived to obtain residuals is unique to the particular group of animals being evaluated. Developing an efficiency index from a stable model allows comparisons from data within and among contemporary groups, and MPRC holds promise as a stable, model-derived method of evaluating efficiency across contemporary groups.

86
Environmental factors affecting water intake in steers finished in feedlots. R.A. Arias and T.L. Mader. University of Nebraska-Lincoln.
Simple and multiple regression analyses were executed using records from 5 trials conducted from 1999 to 2005 at Haskell Ag Lab, to assess the effects of environmental factors on daily water intake (DWI), and to obtain an equation to predict DWI on steers finished in feedlot. Cattle used in these studies were mixed breed, but predominantly Angus or Angus crossbreds. Daily (n=2,134) weather variables and DMI were obtained. Exploratory data analyses showed the presence of multicollinearity for temperature-humidity index (THI), and mean, minimum and maximum temperatures. Thereby, two analyses were conducted; 1) including daily minimum temperature (Tmin) and daily maximum temperature (Tmax), and 2) using THI instead of temperature variables. Results confirm that DWI increases significantly during the summer season, although variability in DWI was greater during this season. Seasonal simple regression equations produced low r2 values (r2 < 0.5). However, simple regression r2 values were improved for models utilizing data from both seasons (Tmin r2= 0.57; Tmax r2= 0.52; and solar radiation r2= 0.50). Multiple regression analysis improved predictions across seasons and resulted in better models than simple regression models. Within season multiple regression model R2 values were 0.34 and 0.30 for summer and winter, respectively. However, when data were pooled among seasons an R2 equal to 0.71 was obtained with Tmin, solar radiation, and DMI included in the model. When THI was used in the model there was not an improvement in R2 across the seasons. The models were validated and compared with those reported by Winchester and Morris (1956; JAS 15(3):722-740) and Hicks et al., (NRC, 2000). Data from two experiments conducted during the winter and the summer of 2005-06 were used for this purpose. This analysis demonstrated that model providing the most accurate predictions of DWI was the including THI model. The data suggest that Tmin or THI are the primary weather parameters which influence DWI in steers. Effects of roughage source and level in finishing diets containing wet distillers grains on feedlot performance and economics. J. R. Benton, G. E. Erickson, T. J. Klopfenstein, K. J. Vander Pol, and M. A. Greenquist. University of Nebraska-Lincoln.
Three-hundred eighty five steers (BW = 346 ± 29 kg) were used to evaluate roughage source and level along with no roughage inclusion in a finishing diet containing wet distillers grains plus solubles (WDGS). Steers were blocked by weight (3 blocks), then stratified by weight within block and assigned randomly to pen (11 steers/pen). Pens were assigned randomly to one of 7 finishing diets within block (5 pens/diet).Treatments consisted of a control (CON) with no roughage and three roughage sources (alfalfa hay, corn silage, and corn stalks) included at two levels each. Alfalfa was included at 4% (LALF) or 8% (HALF, DM basis) and diets containing corn silage or corn stalks were balanced to provide equal percentages of NDF relative to alfalfa hay. Therefore, corn silage and corn stalks were included at 6% (LSIL) or 12% (HSIL) and 3% (LSTK) or 6% (HSTK), respectively (DM basis). All diets contained 30% WDGS and a 1:1 mixture of dry-rolled and high-moisture corn (DM basis). Final BW and ADG of steers fed corn stalks were higher (P<0.05) compared to

87
steers fed CON, LALF, or LSIL, but were not different from steers fed HALF or HSIL. There were no differences (P>0.05) observed for final BW and ADG among steers fed CON, LALF, and LSIL or among steers fed alfalfa hay and HSIL. No differences (P=0.09) in G:F were observed among treatments.
Fat thickness of cattle fed CON was lower (P < 0.05) compared with steers fed alfalfa, corn stalks, or HSIL but were not different (P > 0.05) from steers fed LSIL. Yield grade of steers fed CON was lower (P < 0.05) compared with steers fed alfalfa or corn stalks and was similar (P > 0.05) to steers fed corn silage. In summary, a positive gain response was observed when roughage was added to finishing diets containing 30% WDGS. Higher roughage levels resulted in increased final BW, DMI, and ADG. Overall, these data indicate roughage sources can be exchanged on an equal NDF basis in finishing diets containing 30% WDGS without any negative effects on feedlot performance.
Treatment1 CON LALF LSIL LSTK HALF HSIL HSTK SEM
NDF, %2 0.00 2.44 2.65 2.30 4.89 5.31 4.60 Final BW,
kg3 619a 633abc 631ab 649d 646cd 645bcd 649d 7
DMI, kg/d 10.1a 11.1b 11.0b 11.3bc 11.7c 11.5c 11.6c 0.2 ADG, kg 1.96a 2.06ab 2.05a 2.17c 2.16bc 2.15bc 2.18c 0.05
G:F 0.195 0.186 0.186 0.192 0.185 0.188 0.188 0.003 12th rib fat,
in 1.44a 1.66c 1.47ab 1.67c 1.64c 1.61bc 1.68c 0.07
Yield grade4 3.20ab 3.52c 3.16a 3.54c 3.52c 3.44bc 3.56c 0.13 1CON = control, LALF = low alfalfa hay, LSIL = low corn silage, LSTK = low corn stalks, HALF = high alfalfa hay, HSIL = high corn silage, HSTK = high corn stalks. 2NDF: Roughage NDF supplied from roughage source included in each diet. 3Final BW: Calculated as hot carcass weight divided by a common dress of 63%. 4Yield grade: 2.50 + (0.0038 * HCW, lb) + (0.2 * 2.0% KPH) + (2.5 * 12th rib fat, in) – (0.32*LM area, in2). abcdMeans with unlike superscripts differ (P<0.05). Evaluation of a mathematical model to estimate total feed required for pen-fed animals based on performance and diet information. B.M. Bourg1, L.O. Tedeschi1, and M.S. Brown2. Texas A&M University, College Station1, West Texas A&M University, Canyon2 .
The Cattle Value Discovery System (CVDS) was developed to predict growth and body composition based on animal, diet, and environment information, and to allocate feed to individual cattle fed in pens. The objective of this study was to evaluate the adequacy of CVDS in predicting total DM required (DMR) of pen-fed steers, based on either mean BW method (MBWM) or using the dynamic iterative growth model (DIM). Steers (N= 1,314) used in this evaluation were fed in 173 pens for an average of 133 days on test, across 8 studies conducted at West Texas A&M University. Diet ME values ranged from 1.26 to 1.42 Mcal/lb DM. The CVDS model was used to predict individual DMR and to estimate total DMR of each pen. Model adequacy was analyzed using the Model Evaluation System (MES). The mean of

88
observed DM allocated to pens was 22,614.79 lbs, and the mean DMR predicted by CVDS was 23,434.90 lbs and 22,634.63 lbs for MBWM and DIM methods, respectively. The regression of observed on predicted values indicated a high precision of both methods (r2 of 0.97) and no outliers were identified. The intercept and slopes of the regressions differed from zero and one simultaneously. Both methods had great accuracy based on the Cb value of 0.98 and 0.99 for MBWM and DIM methods, respectively. The mean biases were -3.5% (P < 0.01) and -0.08% (P=0.83) for MBWM and DIM methods, respectively. The balance analysis revealed that both methods tended to over-predict DMR for pens with greater than average DMI. The mean square error of prediction (MSEP) for the MBWM indicated that 26% of the error was attributed to mean bias, 30% to systematic bias, and only 44% to random error. For the DIM method, these values were 0.025%, 23%, and 77%, respectively. These results suggested that the CVDS model using either MBWM or DIM was highly precise and accurate in predicting DMR for pen-fed steers, but further work is needed to decrease mean and systematic biases when using the MBWM method and account for more of the random variation for the DIM method. UNL Meta-analysis on the effects of WDGS and Sweet Bran® on feedlot cattle performance and carcass characteristics. V.R. Bremer, G.E. Erickson, and T.J. Klopfenstien. University of Nebraska-Lincoln.
Two meta analyses of published University of Nebraska-Lincoln wet distillers grains + solubles (WDGS) and Sweet Bran (SB) feedlot research were completed to determine the effects of WDGS and SB dietary inclusion level on feedlot cattle performance and carcass characteristics. Compiled WDGS data included 34 treatment means representing 1,257 head from ten trials. Compiled SB data included 18 treatment means representing 880 head from seven trials. The cattle fed in these trials were predominantly black, crossbred steers fed as calves and yearlings. Diets contained either WDGS or SB, not both, in dry rolled corn (DRC), high moisture corn (HMC), or a 1:1 DRC:HMC combination based diet. Byproducts always replaced corn in the diets (and protein if protein needs were met by byproduct inclusion level). All diets contained 5 to 7.5% roughage (DM basis). Individual HCW, 12th rib fat, and USDA called marbling score were collected for each animal. Regression equations for ADG, feed conversion, 12th rib fat depth, and marbling score relative to level of WDGS or SB were developed utilizing the Proc Mixed procedure of SAS accounting for within experiment variation.
WDGS Sweet BranADG, lb y = -0.0005x2 + 0.0279x + 3.4669 y = 0.0126x + 3.6689Feed Conversion, lb/lb y = 0.0003x2 - 0.0309x + 6.4367 y = -0.0053x + 5.956612th Rib Fat, in y = -0.00008x2 + 0.0039x + 0.4912 y = 0.0016x + 0.4557Marbling Score1 y = -0.0277x2 + 1.3078x + 517.53 y = 0.4917x + 491.65x = diet byproduct inclusion level, % of diet DM1 500 = Small0

89
Cattle fed intermediate levels of WDGS (10 to 40% of diet DM) had a quadratic increase in ADG (P < 0.01), 12th rib fat depth (P = 0.04), marbling score (P = 0.05), and improved feed conversion (P = 0.09) when fed the same number of days as corn-fed cattle. Cattle fed intermediate levels of SB (10 to 40% of diet DM) had a linear increase in ADG (P < 0.01), 12th rib fat depth (P < 0.01), marbling score (P < 0.01), and improved feed conversion (P = 0.03) when fed the same number of days as corn-fed cattle. These data show that feedlot cattle fed intermediate levels (10 to 40%) of WDGS or Sweet Bran in DRC and HMC diets convert feed to gain more efficiently, get fat quicker, and exhibit more marbling than control corn fed cattle. Economic model for determining byproduct returns in finishing diets. C. D. Buckner, V. R. Bremer, T. J. Klopfenstein, G. E. Erickson, and D. R. Mark. University of Nebraska-Lincoln.
An economic model was developed for determining economic returns when feeding byproducts in finishing corn-based diets. Byproducts included in the model are wet and dry distillers grains with solubles (WDGS and DDGS, respectively), Sweet Bran, ADM gluten feed, and Dakota Bran Cake (DBRAN). Performance responses from research trials were used to predict DMI, F:G, and ADG. Model inputs include: cattle BW and prices, DMI and F:G if fed a dry-rolled, high moisture corn diet, byproduct inclusion, mileage for trucking byproduct, and yardage costs. Outputs from the model include: predicted ADG, byproduct transportation costs, ration and feeding costs, and profit/loss compared to a corn diet. In several scenarios that we compared, model assumptions were 740 lbs initial and 1300 lbs final BW, 24 lbs DMI and 6.5 F:G for a corn-based diet, $0.35/hd/daily yardage cost, and $3.70/bu corn price. Feeding WDGS at 95% corn price increased returns up to $50 per steer depending upon inclusion level and trucking distance. When byproduct was priced less than 95% the price of corn, the returns to feeding byproduct increased accordingly, depending on inclusion level and trucking distance. Little change occurred due to increased trucking cost. This new economic model allows flexibility for producers and nutritionists when inputing byproduct types, inclusion levels and trucking, while combining user inputs with biological performance predictions. Table 1. Equations for predicting DMI and G:F for byproduct dietary inclusion levels.
DMI, lb/d G:F, lb/lb Byproduct Equationa R2 Equationa R2 WDGS y = -0.00228x2 +
0.10099x + 23.942 0.9959 y = -0.0141x2 +1.0539x +
153.3 0.8712
DDGS y = -0.00088x2 + 0.03944x + 20.68
0.6474 y = -0.015x2 +0.75x + 164.4
0.6054
DBRAN y = 0.038x + 25.62 0.6327 y = 0.1667x + 147.5 0.6983 a x = byproduct inclusion level

90
An experimental model to study effects of bovine respiratory disease on cellular and humoral immune response, performance, and metabolic changes in finishing beef steers. L.O. Burciaga-Robles, B. McLaughlin, C.R. Krehbiel, D.L. Step, M. Montelongo, A.W. Confer, R.W. Fulton, C.J. Richards, U. DeSilva, and G. Zhang. Oklahoma State University, Stillwater.
Bovine Viral Diarrhea (BVDV) has been isolated alone or in combination with other viral and bacterial pathogens in animals diagnosed with Bovine Respiratory Disease (BRD), a disease causing major economic loss to the feedlot industry. The objective of this experiment was to develop a model to study effects of Mannheimia haemolytica following short-term (72 h) exposure to Bovine Viral Diarrhea (BVD) persistently infected calves (PI) on antibody production, differential white blood cell (WBC) counts, and performance in finishing cattle. Treatments included: 1) steers not challenged with BVDV or M. haemolytica (CTRL); 2) steers intratracheally challenged with M. haemolytica (MH) on d 0; 3) steers challenged with 72 h exposure to steers PI with BVD (BVD); and 4) steers with 72 h exposure to steers PI with BVD and intratracheally challenged with M. haemolytica (BVD+MH) on d 0. Six steers/treatment (initial BW = 691 + 69 lb) were placed in metabolism crates during the first 5 d of the experiment, the 2nd wk after the challenge, and on d 28 to 32 and 56 to 60 to determine N balance. Blood samples were collected before exposure to PI animals, after 72 h of PI exposure, and 2, 4, 6, 12, 18, 18, 24, 36, 48, 72 and 96 h post challenge to measure immune response. Data were analyzed using Proc Mixed with a first-order autoregressive correlation structure used for repeated measures. Seroconversion to BVDV started four days after PI exposure and remained greater (P<0.0001) through d 28. Rectal temperature was elevated (P<0.001) for BVD+MH and MH during the first 24 h after the M. haemolytica challenge. For BVD+MH and MH, total WBC count was greater (P<0.01) at 36 h post M. haemolytica challenge compared with CTRL, whereas in BVD steers, WBC count was lower (P<0.01). Total lymphocyte count was lower (P=0.004) during the first 72 h post BVD exposure for both the BVD and BVD+MH groups compared with CTRL, and this difference remained at 96 h post M. haemolytica challenge. An increased (P<0.001) total neutrophil count was observed during the first 36 h for the MH steers and for 72 h for the BVD+MH steers. DMI did not differ among treatments during the first 28 d (P=0.29) or over the entire experiment (P=0.51). In addition, no difference (P=0.75) in N balance was observed during the first 56 d of the trial. During the first 7 d, gain:feed tended (P=0.11) to be greater for CTRL compared with BVDV, MH and BDV+MH (0.15, 0.13, 0.10 and -0.10). However, across the entire feeding period, no difference (P=0.44) in gain:feed was observed. In conclusion, the model implemented resulted in an acute response to pathogens involved in the challenge, and numerical trends in performance after the challenge are in agreement with those reported in larger scale finishing trials. However, steers challenged with a single pathogen appeared to compensate by the end of the finishing period.

91
Effects of corn processing method and wet distillers grains with solubles inclusion level in finishing steer diets. M. Corrigan, G. Erickson, T. Klopfenstein, K. Vander Pol, M. Greenquist, and M. Luebbe. University of Nebraska, Lincoln. Four hundred eighty crossbred steer calves (318 ± 18 kg) were used in an experiment to determine if an interaction exists between corn processing method and wet distillers grains with solubles (WDGS) inclusion level in finishing steer diets fed for 168 d. A randomized complete block design was utilized with a 3 × 4 treatment structure. Diets were based on dry-rolled corn (DRC), high-moisture corn (HMC), or steam-flaked corn (SFC) with increasing levels of WDGS (0, 15, 27.5, 40% diet DM). A corn processing × WDGS level interaction (P < 0.01) was observed for final BW, ADG, G:F and HCW. In steers fed DRC based diets, final BW, ADG and G:F improved linearly (P < 0.01) with increasing WDGS levels. In steers fed HMC, ADG responded quadratically (P = 0.04) and G:F improved linearly (P = 0.02) with increasing WDGS levels. In steers fed SFC, final BW (P < 0.01) and ADG (P = 0.02) responded quadratically to WDGS inclusion level, with steers fed 15% WDGS having the numerically highest final BW and ADG. Dry matter intake, fat thickness, and marbling score responded quadratically to WDGS inclusion level and incidence of liver abscess decreased linearly with increasing levels of WDGS. In summary, a corn processing × WDGS level interaction on finishing steer performance was observed. Gain efficiency improved linearly in DRC and HMC fed steers in response to increasing dietary inclusion levels of WDGS. In steers fed SFC, no improvement in G:F was observed, however the numerically optimal G:F was observed in steers fed 15% WDGS and ADG decreased with greater WDGS inclusion levels (27.5 and 40% DM).
Table 1a WDGS Level, % DM P-value Item 0.0 15.0 27.5 40.0 Linear Quadratic DRC ADG, kg 1.65 1.71 1.76 1.78 < 0.01 0.60 G:F 0.163 0.170 0.181 0.185 < 0.01 0.77 HMC ADG, kg 1.67 1.80 1.80 1.75 0.15 0.04 G:F 0.183 0.189 0.197 0.194 0.02 0.25 SFC ADG, kg 1.66 1.70 1.63 1.56 < 0.01 0.02 G:F 0.182 0.186 0.182 0.183 0.91 0.40
aCorn processing method × WDGS level interaction for ADG, and G:F (P < 0.01).
Dried corn distiller’s grains with solubles: How much is too much? B. E. Depenbusch, C. M. Gordon, and J. S. Drouillard. Kansas State University, Manhattan.
Three hundred and forty five crossbred-yearling heifers (728 ± 23 lb) were obtained from a common source and used in a randomized complete block design finishing study. Experimental diets were based on steam-flaked corn (26 lb/bu) and contained 0, 15, 30, 45, 60, or 75% distiller’s grains with solubles (DG). Heifers were

92
housed in 54 concrete-surfaced pens (9 pens per treatment and 6 to 7 heifers per pen) and fed their respective diets once daily. Following harvest, de-boned rib sections were randomly selected from 10 carcasses per treatment and wet aged for 2 weeks prior to sensory and color analysis. Dry matter intakes were similar (P > 0.05) for levels of DG. Average daily gain was greatest (quadratic, P < 0.05) when 15% DG was fed. However, gain efficiency decreased (Linear, P < 0.05) as dietary levels of DG increased from 0% to 75%. Final BW and carcass weight responded quadratically (P < 0.05), with both weights being greatest at 15% DG. Heifers fed 30% DG had similar ADG, feed efficiency, final BW, and carcass weight as heifers fed no DG. Subcutaneous fat thickness (12th rib) decreased (Linear, P < 0.05) with increasing levels of DG, but kidney, pelvic, and heart fat increased. Carcasses grading USDA Choice or better decreased with increasing levels of DG, while the number of USDA 4 and 5 carcasses doubled compared to heifers fed no DG. Meat tenderness improved (Linear, P < 0.05) as level of DG increased in the diet, while juiciness and flavor intensity remained unchanged. Redness (color stability) of steaks was not different (P > 0.05) for DG levels. Results from this study suggest that animal performance was maximized at 15% DG; and as much as 30% DG can be fed without decreasing animal performance. In addition, meat tenderness appears to be improved when DG is fed without any adverse affects on juiciness, flavor, or retail display life. Effects of feeding polyclonal antibody preparations against Streptococcus bovis and Fusobacterium necrophorum on rumen in situ starch and fiber disappearance. N. DiLorenzo, G.I. Crawford, D. Blini, and A. DiCostanzo. University of Minnesota, St. Paul.
Avian-derived polyclonal antibody preparations (PAP) against Streptococcus bovis (PAP-Sb) or Fusobacterium necrophorum (PAP-Fn) were effective in reducing counts of target bacteria and improving feed efficiency of steers fed high-grain diets. Sixteen rumen-cannulated steers fed high-grain diets were used in a completely randomized design with a 2 X 2 factorial arrangement of treatments (PAP-Sb or PAP-Fn) to test effects of PAP on rumen in situ starch and fiber fraction disappearance. Diet (DM basis) fed once daily ad libitum was comprised of 83% corn grain, 12% corn silage and 5% supplement, and was formulated to contain (DM basis; 1.39 Mcal NEg/kg DM, 12.5% CP, 0.65% Ca, and 0.35% P). The supplement delivered 300 mg monensin/d and 90 mg tylosin/d. Polyclonal antibody preparations were top-dressed. No effects were observed on rumen in situ starch disappearance at 3 or 9 h post-incubation A PAP-Sb x PAP-Fn interaction (P = 0.04) was observed for rumen in situ starch disappearance at 6 h post-incubation. Steers receiving PAP-Sb had lesser (P < 0.05) rumen in situ starch disappearance at 6 h post-incubation than those receiving both or no PAP (45.7 % vs. 52.6 % and 54.2 % for PAP-Sb, both or control respectively). Steers receiving PAP-Sb tended (P = 0.06) to have lesser rumen in situ starch disappearance than those receiving PAP-Fn. No differences were observed in rumen NDF or ADF in situ disappearance after 24 h post-incubation. Previously documented reductions in rumen S. bovis counts observed in this study when feeding PAP-Sb are likely responsible for the reduced rumen in situ starch disappearance at 6 h post-incubation. However, this effect is transient as
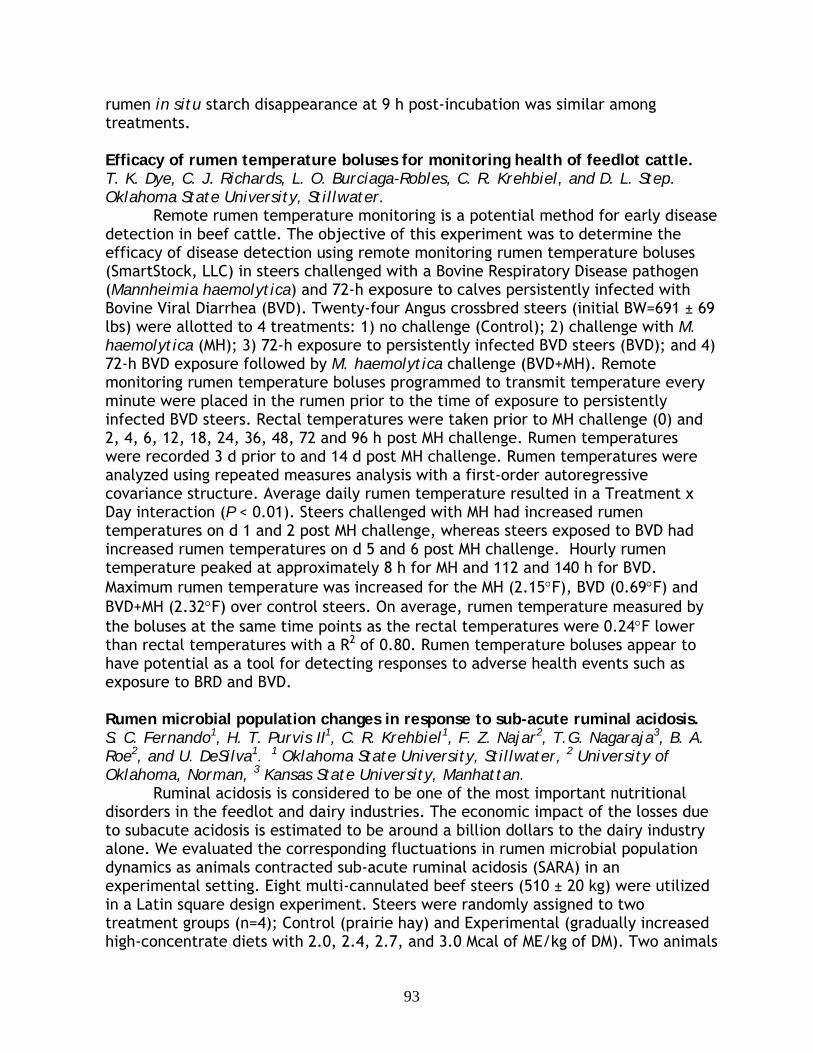
93
rumen in situ starch disappearance at 9 h post-incubation was similar among treatments. Efficacy of rumen temperature boluses for monitoring health of feedlot cattle. T. K. Dye, C. J. Richards, L. O. Burciaga-Robles, C. R. Krehbiel, and D. L. Step. Oklahoma State University, Stillwater.
Remote rumen temperature monitoring is a potential method for early disease detection in beef cattle. The objective of this experiment was to determine the efficacy of disease detection using remote monitoring rumen temperature boluses (SmartStock, LLC) in steers challenged with a Bovine Respiratory Disease pathogen (Mannheimia haemolytica) and 72-h exposure to calves persistently infected with Bovine Viral Diarrhea (BVD). Twenty-four Angus crossbred steers (initial BW=691 ± 69 lbs) were allotted to 4 treatments: 1) no challenge (Control); 2) challenge with M. haemolytica (MH); 3) 72-h exposure to persistently infected BVD steers (BVD); and 4) 72-h BVD exposure followed by M. haemolytica challenge (BVD+MH). Remote monitoring rumen temperature boluses programmed to transmit temperature every minute were placed in the rumen prior to the time of exposure to persistently infected BVD steers. Rectal temperatures were taken prior to MH challenge (0) and 2, 4, 6, 12, 18, 24, 36, 48, 72 and 96 h post MH challenge. Rumen temperatures were recorded 3 d prior to and 14 d post MH challenge. Rumen temperatures were analyzed using repeated measures analysis with a first-order autoregressive covariance structure. Average daily rumen temperature resulted in a Treatment x Day interaction (P < 0.01). Steers challenged with MH had increased rumen temperatures on d 1 and 2 post MH challenge, whereas steers exposed to BVD had increased rumen temperatures on d 5 and 6 post MH challenge. Hourly rumen temperature peaked at approximately 8 h for MH and 112 and 140 h for BVD. Maximum rumen temperature was increased for the MH (2.15°F), BVD (0.69°F) and BVD+MH (2.32°F) over control steers. On average, rumen temperature measured by the boluses at the same time points as the rectal temperatures were 0.24°F lower than rectal temperatures with a R2 of 0.80. Rumen temperature boluses appear to have potential as a tool for detecting responses to adverse health events such as exposure to BRD and BVD.
Rumen microbial population changes in response to sub-acute ruminal acidosis. S. C. Fernando1, H. T. Purvis II1, C. R. Krehbiel1, F. Z. Najar2, T.G. Nagaraja3, B. A. Roe2, and U. DeSilva1. 1 Oklahoma State University, Stillwater, 2 University of Oklahoma, Norman, 3 Kansas State University, Manhattan.
Ruminal acidosis is considered to be one of the most important nutritional disorders in the feedlot and dairy industries. The economic impact of the losses due to subacute acidosis is estimated to be around a billion dollars to the dairy industry alone. We evaluated the corresponding fluctuations in rumen microbial population dynamics as animals contracted sub-acute ruminal acidosis (SARA) in an experimental setting. Eight multi-cannulated beef steers (510 ± 20 kg) were utilized in a Latin square design experiment. Steers were randomly assigned to two treatment groups (n=4); Control (prairie hay) and Experimental (gradually increased high-concentrate diets with 2.0, 2.4, 2.7, and 3.0 Mcal of ME/kg of DM). Two animals

94
on the high-energy diet were challenged with 1.2g/kg BW of ground corn to experimentally induce SARA. An 800bp fragment of the microbial 16S rRNA gene was PCR amplified and the microbial population structure and diversity were assessed using Terminal Restriction Fragment Length Polymorphism (T-RFLP) and was analyzed using the Phylogenetic Analysis Tool (PAT). T-RFLP analysis revealed the presence of great diversity within the rumen. To identify the major contributors of SARA, 16S rDNA libraries were constructed from both animals with induced SARA and Control animals on the high-energy diet during critical stages of pH change and were sequenced. The sequence analysis showed significant increases in Proteobacteria (0.8% to 23.1%) and Actinobacteria (0.3% to 7.3%) populations, and significant decreases in Firmicutes (36.1% to 21.9), Spirochaetes (4.4% to 0.0), and Bacteroidetes (44.3% to 31.0%) populations. The phylogenetic analysis of the 16S rDNA libraries suggests an emergence of new Proteobacterial species during acidosis which are phylogenetically distant from other proteobacterial populations present in control animals. Furthermore, quantitative real-time PCR analysis of selected microbial species suggests an increase in Megaspera elsdenii, Streptococcus bovis, and a decrease in Propionibacterium acnes and Mitsuokella amylophilus during sub-acute ruminal acidosis.
Comparison of yearling steers sorted into heavy, medium, and light weight groups at feedlot entry. W.A. Griffin, J.D. Folmer, T.J. Klopfenstein, and G.E. Erickson. University of Nebraska, Lincoln.
Two separate experiments were used to determine differences in feedlot performance of weight sort groups. Each experiment was repeated across 2 yr. Steers were sorted into heavy (Sort H), medium (Sort M), and light (Sort L) groups and compared to an unsorted control (CON). Additional analyses were conducted to compare the sorted groups to control sort groups of heavy (CON H), medium (CON M), and light (CON L). In each experiment Sort H was fed the least number of days (average = 87 d), Sort M, Sort L, and CON were fed 3, 5, and 2 wk longer than Sort H, respectively. The CON steers were fed the same number of d, so the CON H, CON M, and CON L cattle were retrospectively, evaluated. In exp. 1, steers were sorted into 25% heavy, 50% medium, and 25% light. In exp. 2, steers were sorted into 32% heavy, 44% medium, and 24% light. In exp. 1 each sort group had higher final BW compared to CON (P = 0.01). However, CON H (P < 0.01) and CON L (P < 0.01) had the heaviest and lightest final BW, respectively. Daily gain was greatest for CON H (P < 0.01) and similar for other treatments (P > 0.05). Control heavy had the heaviest HCW and CON L had the lightest (P = 0.01); additionally, CON H produced the most overweight carcasses (P < 0.01). Marbling score (P < 0.01) was highest for Sort L and lowest for Sort H. Sort L had greater fat thickness (FT; P < 0.01) and Sort H had the lowest FT (P < 0.01). In exp. 2, CON H had heaviest final BW (P < 0.01) and CON L had lowest final BW (P < 0.01). Among control sort groups and sorted weight groups, Sort H and CON H had highest DMI (P < 0.01); however, Sort H had the poorest F:G (P = 0.02). In exp. 2, HCW (P < 0.01) was greatest for CON H and lowest for CON L. Marbling score (P < 0.05), and FT (P < 0.01) increased with increasing DOF. In both the sorted and control treatments heavier steers had the poorest G:F. Control heavy steers need to be managed to reduce overweight carcasses; however,

95
when sorted, medium steers have a higher risk of producing overweight carcasses based on the sorting procedures used in this study.
Effects of Micro-Aid concentration in a high-concentrate beef cattle finishing diet on fermentation and microbial protein synthesis in a continuous culture fermentation system. K. E. Hales, T. L. Covey, C. S. Abney, and M. L. Galyean. Texas Tech University, Lubbock.
Nine continuous culture fermenters were used to determine the effects of the addition 2 concentrations of Micro-Aid on fermentation and microbial growth in a continuous culture fermentation system. A randomized complete block design with replication within each block was used. The 3 treatments were replicated in 3 fermenters each in 2 separate 7-d periods (blocks), yielding 6 replicates per treatment over the 2 blocks. Each 7-d period consisted of 3 d for adaptation and 4 d for collection of effluent and measurement of fermentation variables. The feeding rate was approximately 30.7 g of OM/d, with an average fluid flow rate of 1.04 L/d (0.043 h-1). Within each block, treatments were applied randomly to fermenters. Treatments (DM basis) consisted of: 1) a basal (0 mg/kg of Micro-Aid; Control) steam-flaked corn-based diet (90% concentrate); 2) the Control diet plus 81 mg/kg of Micro-Aid; and 3) the Control diet plus 108 mg/kg of Micro-Aid. Concentrations of Micro-Aid were designed to provide the equivalent of 750 and 1,000 mg/d for a beef steer with a DMI of 9.3 kg/d. Two ruminally cannulated, mature Jersey steers (BW of approximately 500 kg) fed a 75% concentrate diet were used as ruminal fluid donors. Organic matter, N digestibility, and microbial protein synthesis data were analyzed using mixed model procedures. Treatment (0, 81, and 108 mg/kg of Micro-Aid in the dietary DM), block, and block x treatment were fixed effects in the model. The pH and ammonia concentration data were analyzed by time after feeding using repeated measures over days of sampling, with fermenter within block x treatment combinations as the subject of the repeated measures. Adding 108 mg/kg of Micro-Aid to the 90% concentrate diet resulted in a 34.2% increase (P < 0.04) in the quantity and a 42.86% increase (P < 0.06) in the efficiency of microbial N synthesized. As a result of differences in microbial OM, microbial N, and feed N flows, true OM and N digestion tended (P < 0.14 and 0.12, respectively) to be greater for the 2 Micro-Aid treatments than for the Control treatment. Efficiency of microbial N synthesis (MOEFF, g/kg of OM truly fermented) was increased (P < 0.05) for both Micro-Aid treatments compared with the Control. Fermenter pH at various times after dietary substrate was added was generally less for the 2 Micro-Aid treatments than for the Control, with lower (P < 0.05) pH at 2 and 9 h after feeding for the 108 mg/kg Micro-Aid treatment and an intermediate value for the 81 mg/kg Micro-Aid treatment. Microbial composition (ash, N, and purines) was similar among treatments. Furthermore, Micro-Aid did not seem to have major effects on fermenter ammonia concentrations nor did it markedly alter proportions and concentrations of VFA. Whether the changes noted in microbial growth and digestion in our continuous culture fermentation system would translate into improvements in performance by feedlot cattle fed highly fermentable, processed grain-based diets is not known but would seem to merit further study.

96
Effects of corn hybrid, processing method, and interactions on feedlot performance and digestion. F.W. Harrelson1, M.K. Luebbe1, N.F. Meyer1, G.E. Erickson1, T.J. Klopfenstein1, and W.A. Fithian2. 1University of Nebraska, Lincoln, 2Golden Harvest Seeds Inc., Waterloo, NE.
With corn being the most widely used grain for finishing cattle, a large amount of research has been conducted to evaluate ways to improve utilization by feedlot cattle. The majority of this research has focused on evaluating corn processing method effects on performance. Limited research has evaluated the effects of corn hybrid or genetic differences on feedlot performance. Even more limited, is research on any possible interactions between hybrid and processing method. Two experiments were conducted to determine the effects of hybrid, processing method, and possible interactions on feedlot performance and digestion. Six commercially available corn hybrids were grown at the University of Nebraska’s Agricultural Research and Development Center and harvested as either high-moisture (HMC, 70% DM) or dry-rolled corn (DRC, 84% DM). Hybrids were identity preserved during harvest, storage, and experimentation. Experiment 1 was a finishing trial utilizing 570 yearling steers (379 kg BW), in a 2×6 factorial design. Steers were blocked by BW and assigned randomly to pens, which were randomly assigned to treatments (6 pens/treatment, 12 total treatments, 8 hd/pen). Steers were implanted with Revalor S® on d 22 and were fed for 127 d (heavy block) or 134 d (light block). Diets were composed of 67.5% corn, 20% Wet Corn Gluten Feed (Sweet Bran®), 7.5% alfalfa hay, and 5% supplement (including Tylan® and Rumensin®). No significant hybrid effects or interactions were observed for any performance parameter. Processing had a significant effect on G:F (P <0.01), 12th rib fat thickness (P <0.02), and DMI (P <0.01). Cattle consuming HMC were more efficient (0.161 vs. 0.154), had lower DMI, and were fatter than those consuming DRC. With respect to hybrid differences due to processing method, a 0.65 - 8.53% improvement in G:F was exhibited for cattle consuming HMC corn compared to DRC within each hybrid; with H-9230SP having the least improvement and H-8803 having the most. Experiment 2 was an in situ metabolism trial, utilizing the mobile bag technique, to evaluate the effects of hybrid, processing method, and interactions on site and extent of digestion. Two ruminally and duodenally fistulated Holstein steers (490 kg BW), were utilized in a 2×6 factorial design utilizing corn samples from experiment 1. Samples were ground to simulate mastication (6.35 mm), and then 2.5g (DM) of each sample was placed in Dacron bags. Bags were ruminally incubated for 22 h; duodenal bags were then exposed to a simulated abomasal digestion using Pepsin and HCl, prior to being inserted into the duodenum. Bags were composited within animal and day for starch analysis. Significant hybrid*processing interactions were observed for ruminal and total-tract DM digestibility, as well as ruminal, post-ruminal, and total-tract starch digestion (P <0.01). Relationships were observed between G:F and post-ruminal starch digestibility (r=0.84), as well as total-tract starch digestibility (r=0.73). Correlations among hybrids within processing methods were not significant, leading us to conclude that processing method has a larger effect than hybrid. The results of experiment 1 confirm that processing method has a significant effect on finishing cattle performance, and no interactions with corn hybrid were observed. The results of experiment 2 suggest that an interaction occurs between hybrid and

97
processing method with respect to nutrient digestion. Overall, processing seems to have a greater effect on corn utilization than hybrid. Factors affecting residual feed intake in feedlot steers. J.W. Homm, L.L. Berger, and S. L. Rodriguez-Zas. University of Illinois, Urbana.
Profitability in beef production is a function of both inputs and outputs. The beef industry has focused on outputs such as weight, gain, and carcass merit. Feed costs are estimated to be approximately 60% of the total cost of production, and therefore represent an opportunity to increase profitability through improving feed efficiency (FE). Four hundred six steers (330.1 + 47.07 kg) originating from four different sources and from 29 different Simmental, Angus, and Simmental X Angus sires were used to determine factors affecting feed efficiency in feedlot steers. Seven dietary treatments were used that were composed primarily of corn, corn-based co-products and/or soy hulls. Daily individual animal intakes were recorded by the Growsafe® feed monitoring system. All steers were weighed and ultrasound measurements of marbling score, backfat thickness, and ribeye area were taken approximately every 28 d through 146 d. A total pen collection method established the digestible energy (DE) content of each diet. Residual feed intake (RFI, Mcals of DE/d) was not (P > 0.05) correlated to body weight (BW) or average daily gain. However, RFI was highly positively correlated to DE intake (Mcals/d) and average daily dry matter intake (ADDMI). RFI was negatively correlated to gain to feed (G:F) and was lowly, but significantly correlated to empty body fat. G:F was highly correlated to BW, average daily gain (ADG), ADDMI, and DE intake. Dietary treatment accounted for the majority of the variation (43%) in RFI. Dietary treatment and ADG accounted for approximately 51% of the variation in intake over maintenance requirements. Steers that ate more than 15 Mcals of DE per day over their maintenance requirements were less efficient than those eating less than 15 Mcals of DE per day over their maintenance requirements. Sire effects accounted for 9% of the variation in RFI. The range of RFI for progeny of the 29 sires was -2.10 to 2.22 Mcals of DE per day.
Evaluation of the effects of two commercially available modified live vaccines for bovine respiratory disease complex on naïve beef steers. W. J. Horne, K. S. Barling, A. D. Herring, D. K. Lunt, A. Thomas, and J. E. Sawyer. Texas A&M University, College Station.
This study was conducted to evaluate the effects of two commercially available modified live respiratory vaccines (MLV) on performance and antibody formation in beef steers. Naïve (confirmed seronegative to IBR and BVDV Types 1 & 2) beef steers (n = 107) were stratified by BW and randomly assigned to treatment within strata. Treatments consisted of either vaccine A (Type 1 BVD, IBR, PI3, BRSV), vaccine B (Types 1 & 2 BVD, IBR, PI3, BRSV), or control (physiological saline) administered SQ. Animals were fed individually in Calan ™ gates with rectal temperature (RT), body weight, feed intake, BVDV Type 1, BVDV Type 2, and IBR titer responses collected serially post-vaccination. At d 14, no differences existed for BVDV Type 1 or Type 2 antibody titers. At d 28 and 42, steers receiving B had the highest (P<0.01) BVDV Type 1 titer response, and steers receiving A had higher

98
titers (P<0.01) than control. At day 28, steers receiving B had a greater (P<0.01) BVDV Type 2 titer response than A- and control-treated steers. On day 42, B generated the highest (P<0.01) titer response with A greater (P<0.01) than controls. Antibody titers for IBR on d 14, 28, and 42 were greatest in steers receiving A (P<0.01), while those receiving B had higher IBR titers than controls (P < 0.01). Treatment had minimal effect on RT, although RT varied over time (P < 0.01). RT declined through day 3, increased through day 14, and then stabilized. A treatment by day interaction occurred for ADG. Control and vaccine B ADG declined throughout the study. Vaccine A ADG was significantly (P<0.01) higher for the middle third of the feeding period, such that overall ADG was similar for all treatments (P = 0.10). Inoculation with vaccine B resulted in the highest increase in BVDV Type 1 and 2 titers, without decreasing overall ADG relative to other treatments. Vaccine A produced the highest IBR titers without decreasing overall ADG compared control cattle. These results indicate that vaccination with a MLV can create adequate immune responses without negatively altering feeding performance of beef steers. Effect of wet distillers grains level on feedlot cattle performance and nutrient mass balance. M. K. Luebbe, G. E. Erickson, T. J. Klopfenstein, and M. A. Greenquist. University of Nebraska, Lincoln.
The effect of wet distillers grains plus solubles (WDGS) level on N and P mass balance was evaluated in two experiments. Calves were fed 167 d from November to May (WINTER) and yearlings were fed 133 d from June to October (SUMMER). Treatments consisted of 0, 15, and 30% dietary inclusion of WDGS (DM basis) replacing corn (CON, 15WDGS, 30WDGS, respectively). Traditional WDGS (32% DM) was fed in the WINTER and modified WDGS (52% DM) was fed in the SUMMER experiment. Basal diets for both experiments consisted of high-moisture and dry-rolled corn fed at a 1:1 ratio, 7.5% alfalfa hay, 5% molasses, and 5% supplement (DM basis). Mass balance was evaluated by measuring N and P in diets, feed refusals, manure, soil on the pen surface, and runoff. Nutrient retention was calculated based on ADG (NRC equations). Dietary treatments were fed in the same pens for both experiments. The CON and 15WDGS diets were balanced for MP using the 1996 NRC, and 30WDGS was in excess of requirements. Dry matter intake tended (P<0.10) to increase linearly with WDGS level for both experiments. Average daily gain increased linearly (P<0.05) with WDGS level in both experiments. Feed efficiency was not different (P>0.10) among WDGS level in either experiment. Marbling score was greater (P<0.01) for 30WDGS compared with CON and 15WDGS in the WINTER study. Final BW and HCW increased linearly (P<0.05) in the WINTER study. Carcass characteristics were not different (P>0.10) in the SUMMER. Nitrogen and P intake was greatest (P<0.01) for 30WDGS, intermediate for 15WDGS, and least for CON in both experiments. Nitrogen and P excretion was greatest (P<0.01) for 30WDGS, intermediate for 15WDGS, and least for CON in both experiments. Runoff N tended (P=0.09) to increase linearly in the WINTER but was not different (P=0.59) among WDGS level in the SUMMER. Runoff P was not different (P>0.50) among WDGS level in either experiment. The amount of manure OM, N, and P increased linearly (P<0.10) with WDGS level in both experiments. Nitrogen lost was 30.9, 42.0, and

99
45.5 lb•steer-1 in the WINTER and 31.2, 44.1, and 58.4 lb•steer-1 in the SUMMER for CON, 15WDGS, and 30WDGS, respectively. Percent N loss (percent of excreted N) was not different (P>0.15) among WDGS level and was 55.1, 63.8, and 55.0% in the WINTER and 58.1, 65.6, and 69.6% in the SUMMER. Correcting manure for soil P accounts for 98, 79, and 102% of excreted P in the WINTER and 87, 62, and 57% of excreted P in the SUMMER for CON, 15WDGS, and 30WDGS, respectively. Increasing dietary P will increase manure P and the amount of land needed for manure application when WDGS are used by feedlot cattle. In these experiments feeding WDGS balanced for MP or in excess of requirements resulted in improved ADG and more N in the manure. Percent N loss was not different among WDGS level but the amount of N lost was increased when WDGS was fed. Wet distiller’s grains with solubles in beef finishing diets with steam-flaked or dry-rolled corn. M. L. May, M. J. Quinn, J.J. Higgins, and J.S. Drouillard. Kansas State University, Manhattan.
A study was conducted to determine the optimum level of wet distiller’s grain with solubles in beef finishing diets containing dry rolled corn or steam flaked corn. Crossbreed yearling steers (n=624; initial BW = 998 ± 9 lb), were blocked by weight and randomly allocated, within block, to each of 8 treatment groups in a 2 x 4 factorial arrangement. Factors consisted of grain source (dry-rolled or steam-flaked) and level of distiller’s grains (0, 10, 20, or 30% of diet dry matter). Total of 24 pens (3 per treatment) were used, each containing 25 to 26 animals. The DRC diet containing 20% WDG was mis-formulated, and therefore was not included in the final analysis. Animals were harvested by block on d 69, 96 and 119, at a commercial abattoir. Cattle fed flaked corn diets were more efficient (P < 0.05) than cattle fed DRC diets. Dry matter intake, efficiency, and daily gain were improved by adding WDG to DRC diets, but resulted in poorer performance when added to SFC diets (interaction, P < 0.05). WDG can effectively replace a portion of the corn in finishing diets, but their nutritional value is greater in DRC diets than in SFC diets.
Dry Rolled Corn Steam Flaked Corn WDG level 0 10 20 30 0 10 20 30 Item SEM DM intake, lbs†‡ 20.5 21.7 - 21.8 20.3 20.1 19.9 19.1 0.48 Daily gain, lbs1‡ 2.52 2.87 - 3.08 2.83 2.72 2.59 2.53 0.21 Feed:Gain, lbs*‡ 7.90 7.46 - 7.63 7.02 7.24 7.52 7.45 0.28 Carcass wt, lbs‡ 788 804 - 802 801 798 790 782 6.44 % Select 66.2 65.1 - 64.1 68.0 73.1 64.8 78.2 5.81 YG 4 & 5, % 2.56 2.61 - 3.85 4.13 1.28 3.95 5.13 1.74
1Average daily and efficiency were computed by using carcass-adjusted final weights. Final live weight = hot carcass weight divided by a dressing percent of 63.5 *Grain effect (P < 0.05) †WDG effect (P < 0.05) ‡ WDG by grain source interaction (P < 0.01)

100
Use of distiller’s dry grains with solubles on beef finishing diets with high or low roughage levels. M.L. May, M.J. Hands, M.J. Quinn, B.E. Depenbusch, J.O. Wallace, C.D. Reinhardt and J.S. Drouillard. Kansas State University, Manhattan.
Two studies were conducted to evaluate the use of 25% dry corn distiller’s grains with solubles (DG) as a partial replacement for grain in finishing diets containing either high (15%) or low (5%) levels of corn silage (CS). In trial 1 crossbreed heifers (n=582, BW 832 ± 1.0 lb) were housed in 24 dirt surfaced pens with 21-25 heifers per pen and were fed 1 of 6 finishing diets twice daily for 110 d. Experimental diets were: steam-flaked corn (SFC) with no DG and 15% CS (SFC), SFC with 25% DG and 15% CS, SFC with 25% DG and 5% CS, dry-rolled corn (DRC) with no DG and 15% CS, DRC with 25% DG and 15% CS, and DRC with 25% DG and 5% CS. DMI were similar for control cattle and their counterparts fed 15% CS. The 5% CS groups consumed less feed daily and also were more efficient in growth. Decreasing roughage level did not affect performance, or incidence of liver abscess. Yield grade and carcass quality were not affected by including DDG. Trial 2 crossbred heifers (n=377; BW 832 ± 9 lb) were fed diets consisting of SFC with 15% CS (CON), SFC plus 25% DDG with 15% CS (HIGH), or SFC plus 25% DDG with 5% CS (LOW). Heifers were individually weighed and assigned randomly to feedlot pens containing 15 to 16 animals each, with eight pens per treatment. Heifers were fed twice daily ad libitum for 85 d. There were no differences among treatments with respect to ADG, G:F, final weight, carcass weight, subcutaneous fat thickness, carcass quality grade, or yield grade (P > 0.10). Compared to cattle fed the CON diet, heifers fed LOW had decreased DMI (19.87 vs. 18.78 lb/d) and higher dressing percentage (63.23 vs 63.73%). In summary, partial replacement of SFC and DRC with DDG yields satisfactory performance and carcass characteristics in cattle fed diets with corn silage as the roughage source. Additionally, it is possible to remove a significant portion of dietary roughage in diets containing DDG to achieve greater efficiency. Effect of leg-filled storage bins on starch availability, gelatinization, and in vitro dry matter disappearance of steam-flaked corn. J.P. McMeniman1, S.E. Bachman2, M.L. Galyean1, C. Bowers3, T. Bryant3, and C. Carter 3. 1Texas Tech University, Lubbock, 2Bachman Nutritional Consulting, Inc., Amarillo, 3Five Rivers Ranch Cattle Feeding, LLC, Loveland, CO.
An experiment was conducted to determine effects of leg-filled storage bins on starch availability (SA), gelatinization (GEL), and in vitro dry matter disappearance (IVDMD) of steam-flaked corn. At a commercial feedlot in Oklahoma on 4 consecutive days, corn was allowed to steam for approximately 45 min at 205oF in a cylindrical steam chest (48 inches diameter x 23 feet tall) before rolling to a bulk density of 28 pounds/bushel through 18 inch x 36 inch rolls. A minimum of 12 tons of grain was run through the rolls before sampling, and grain moisture content beneath the rolls was approximately 22%. Samples were taken randomly in the morning on the 4 consecutive days either directly beneath the rolls (ROLL) or on exit from the leg-filled storage bin (LEG). Flakes were allowed to equilibrate at room temperature for 10 to 15 min to allow steam to evaporate (flashing) and then packaged into 3 air-tight sample bags. One sample was submitted for enzymatic SA analysis (Servitech, Amarillo, TX). The second sample was submitted for GEL

101
analysis as measured by loss of microscopic birefringence (High Plains Laboratory, Inc., Hereford, TX). The third sample was frozen and analyzed at the Texas Tech University Ruminant Nutrition Laboratory for IVDMD. The IVDMD procedure involved incubation of approximately 0.5 g of ground grain with 35 mL of a 4:1 McDougall’s buffer-to-ruminal fluid mixture for 4, 8, 12, 24, and 36 h at 39oC. A 48-h incubation in acidified pepsin at 39oC followed the ruminal fluid-buffer incubation. The IVDMD analysis was replicated several weeks after the first run. Item ROLL LEG SE1 P-value SA, % 53.25 27.25 2.116 <0.001 GEL, % 47.00 45.25 0.445 0.035 IVDMD, % 4 h 37.64 29.18 0.456 <0.001 8 h 48.99 41.96 1.002 <0.001 12 h 58.65 50.62 0.802 <0.001 24 h 73.05 68.43 0.436 <0.001 36 h 85.14 79.48 0.516 <0.001 1Standard error of treatment means, n = 4 observations/treatment for SA and GEL; n = 8 observations/treatment for IVDMD values at various incubation times.
Overall, SA was substantially decreased (P < 0.001) for LEG vs. ROLL samples, and associated decreases (P < 0.001) in IVDMD were observed across all incubation periods. Although gelatinization decreased (P = 0.035) for LEG vs. ROLL samples, the magnitude of the difference was not large. Possible reasons for these responses may include increased retrogradation of starch and/or altered protein-starch interactions of steam-flaked corn at the higher apparent storage temperature in the leg-filled bin. Whether the magnitude of these differences under commercial feedlot conditions elicits a difference in animal performance remains to be determined.
Effect of CRINA Ruminants AF, a mixture of essential oil compounds on finishing beef steer performance, carcass characteristics, ruminal fermentation, and digestibility. N.F. Meyer1, G.E. Erickson1, T.J. Klopfenstein1, M.K. Luebbe1, M.A. Greenquist1, K.J. Vander Pol1, P. Williams2, and R. Losa3. 1University of Nebraska, Lincoln, 2DSM Nutritional Products, Inc., Parsippany, NJ, 3CRINA SA Gland, Switzerland.
In Exp. I, three-hundred seventy-six crossbred yearling steers were fed one of four treatments with 10 pens/treatment: 1) Control (CON), 2) CRINA RUMINANTS AF (CRINA), 3) CRINA RUMINANTS AF plus Tylan® (CRINA + T), and 4) Rumensin® plus Tylan® (RUM + T). There were no differences in Final BW or ADG between treatments. Dry matter intake averaged 12.1, 12.0, 11.9, and 11.4 kg/d for CON, CRINA, CRINA + T, and RUM + T, respectively (P<0.05). Feed efficiency was improved for the CRINA + T and RUM + T fed steers compared with CON steers (P<0.05). Liver abscesses were significantly greater for CON (27.9%), compared to treatments containing Tylan®, CRINA + T (8.6%) and RUM + T (6.5%). In Exp. II, eight

102
ruminally fistulated beef steers were used in a metabolism experiment to determine effects of CRINA Ruminants AF in altering ruminal fermentation characteristics and nutrient digestibilities. Using a replicated 3x4 Latin rectangle design, yearling steers were fed 3 treatments: 1) Control (CON), 2) CRINA RUMINANTS AF (CRINA), and 3) Rumensin® (RUM). Dry matter intake averaged 10.8, 11.5, and 9.3 kg/d for CON, CRINA, and RUM, respectively (P=0.39). There were no differences in DMI, OM intake, total tract DM, or OM digestibilities among treatments. Cattle fed RUM had greater time below a rumen pH of 5.0 compared to CRINA treatment (P<0.05). Total VFA concentrations and acetate concentrations were greater for the CRINA treatment (P<0.05) compared to CON and RUM. Acetate:propionate was 1.78, 1.49, and 1.43 for CON, CRINA, and RUM, respectively. The results of these studies suggest the addition of CRINA RUMINANTS AF favorably alters rumen fermentation end products without negatively affecting intake or rumen pH and in addition, CRINA RUMINANTS AF plus Tylan® or Rumensin® plus Tylan® improves F:G and decreases liver abscesses compared to no additives.
Metaphylaxis therapy interacts with temperament to influence performance of growing beef steers. Z.D. Paddock1, G.E. Carstens1, J.E. Sawyer1, R.R. Gomez1, B.M. Bourg1, P.A. Lancaster1, D.K. Lunt2, S.A. Moore3, and D.S. DeLaney3. Texas A&M University, College Station1 and McGregor2 and King Ranch, Kingsville, TX3.
The effect of metaphylactic therapy on growth, feeding behavior traits and intake of Santa Gertrudis steers (initial BW 265 ± 24 kg; n = 119) was evaluated during a 28-d receiving period. Steers were preconditioned at the source of origin, transported 550 km, and allowed to rest overnight before processing. At processing, steers were weighed, blocked by weight, and randomly assigned within weight block to receive 1.5 mL/45.5 kg BW ceftiofur crystalline free acid (EXC) administered at the base of the ear, or to receive no antimicrobial (CON). Steers within blocks receiving both treatments resided in common pens. Mean exit velocity (EV), measured on d 0 and 28 as rate of distance traveled while exiting from a chute, was used as an objective assessment of temperament. Steers were weighed on d 0, 14, and 28. Meal frequency and duration, bunk-visit frequency and duration, and DMI from d 7 to 28 were recorded continuously using a GrowSafe feeding system. Data were analyzed as a mixed model with block as a random effect, treatment as a fixed effect, and EV as a covariate. An unequal slopes model was fit for treatment by EV interactions, with treatment differences tested at the mean EV, and at -1 SD (calm steers) and +1 SD (excitable steers). Interactions between EV and metaphylaxis resulted in differences in ADG from d 0 to 14 (P < 0.01) and d 0 to 28 (P = 0.01). ADG was similar for CON- and EXC-treated steers with low EV, but at mean or high EV, EXC-treated steers had greater (P < 0.05) ADG than CON steers, with treatment differences increasing as EV increased. Intake declined with increasing EV in CON steers, but was unaffected by EV in EXC steers (P = 0.01). High-EV steers treated with EXC consumed more (P = 0.05) feed than high-EV CON steers. Bunk-visit frequency increased with EV for EXC-treated steers, but was unaffected by EV in CON steers (P = 0.01). Meal duration was similar for steers with low EV, but decreased at a greater rate for CON- than EXC-treated steers (P = 0.01). High-EV steers treated with EXC had 17 min/d longer (P = 0.05) meal durations than high-EV

103
CON steers. Only one steer was clinically morbid during this trial. Results demonstrate that metaphylaxis therapy resulted in positive effects on ADG, DMI and feeding behavior during the receiving period for steers with high EV (excitable temperaments), whereas, metaphylaxis therapy had less utility for steers with low EV (calm temperaments).
Response to dosing patterns of estradiol 17-beta and trenbolone acetate in finishing steers. S. L. Parr, R. H. Pritchard, and K. W. Bruns. South Dakota State University, Brookings. Predominately Angus steers (n=192, BW = 372 kg) were used to evaluate the effect of implant dosing pattern on finishing steer performance, carcass traits and concentrations of plasma urea-N (PUN). Cumulatively, all implant treatments provided 24 mg estradiol 17-beta (E2) and 120 mg trenbolone acetate (TBA). The four implant treatments (IMP) were 1) no implant; 2) 8 mg E2 and 40 mg TBA administered on d 0, 42, and 84; 3) 12 mg E2 and 60 mg TBA on d 0 and 63; and 4) 24 mg E2 and 120 mg TBA on d 0. Steers were stratified by BW, then randomly assigned to IMP within frame size (FSL=large; FSS=small) and were on full feed at initiation of study. Blood was collected from 3 steers per pen on d -1, 41, 62, 83 and d 125 for PUN determinations as a relative indicator of anabolism. Data were analyzed as a completely random design in a 2 x 4 factorial arrangement with factors of frame size and IMP. No frame size x IMP interactions occurred for feedlot performance or carcass traits. Cumulatively (133 d), implanted cattle had higher ADG (1.42 vs. 1.58 kg; P < 0.05) and improved G:F (0.139 vs. 0.150 kg/kg; P < 0.05) compared to control. Treatment 3 had lower DMI (10.30 vs. 10.83 kg; P < 0.05) and higher G:F (0.155 vs. 0.145 kg/kg; P < 0.05) compared to IMP 4. Dosing pattern did not affect cumulative ADG but the pattern of growth differed. During 1 to 63 d, the change in ADG relative to control was 6.8, 5.0 and 11.8% for IMP 2, 3 and 4, respectively. From d 64 to 133, the response was 19.5, 16.6 and 11.3%, respectively. Implants caused heavier carcasses (350 vs. 365 kg; P < 0.05); HCW did not differ among implant treatments. Marbling (mean = Modest30) was not affected by IMP. Ribeye area was larger for IMP 3 and 4 (81.9 vs. 86.2, 85.8 cm2; P < 0.05) compared to control. Overall treatment concentrations of PUN increased from d -1 to 125 (6.4, 7.7, 8.9, 10.2, and 10.5 mg/dl; P < 0.05). At d 41, implants lowered PUN concentrations (8.5a, 7.7b, 7.2b and 7.4b mg/dl; P < 0.05). At d 62 PUN concentrations were lower for IMP 2 and 3 compared to control an intermediate for IMP 4 (9.8a, 8,3b, 8.4b and 9.0ab mg/dl; P < 0.05). A frame size x IMP interaction existed at d 83 and d 125. In FSL, IMP did not affect PUN (10.4 mg/dl; P > 0.10) at these times. However, in FSS the PUN concentrations were lower for IMP 2 and 3 than IMP 1 or 4. The average concentrations of PUN for d 83 and 125 in FSS steers were 11.6a, 9.5b, 9.1b, 11.0a mg/dl (P < 0.05). Cattle receiving multiple, low doses of E2 and TBA had a slower decline in growth as days on feed increased vs. cattle receiving a single dose of E2 and TBA. Pulsatile dosing shifts the growth pattern causing sustained anabolic response over the feeding period. Smaller framed steers had increased response to pulsatile dosing patterns. The observed changes in PUN concentrations were responsive to time but not to anabolic dosage.

104
Effects of combined trenobolone acetate and estradiol implant and/or ractopamine-HCl administration on circulating Insulin-like Growth Factor-1 and skeletal muscle gene expression in cull cows. G. L. Parsons, K. A. Harborth, M. J. Quinn, T. T. Marston, J. S. Drouillard, and B. J. Johnson. Kansas State University, Manhattan. Objectives of this study were to evaluate the differences in circulating IGF-I concentrations and skeletal muscle gene expression in cull cows (n=32, 1217 ± 41 lbs) by administration of a combined trenbolone acetate and estradiol implant, Revalor-200 (IMP), and ractopamine-HCL (RAC; 300 mg/cow daily for final 28 days). Experimental design was a 4X4 randomized complete block design. Cows were allotted into four different harvest dates with treatments consisted of: 1) control, no IMP or RAC; 2) IMP only; 3) RAC only; 4) IMP and RAC. All cows were individually housed and fed for 60 days. Blood samples were collected on days 0, 14, 28, 42, and 56 of the feeding period for circulating IGF-I analysis. Biopsies of the Longissimus muscle were collected on day 0, 14, and 28, of RAC administration for analysis of β-adrenergic receptor (β-AR) and the steady state IGF-I mRNA. Implants increased the circulating IGF-I levels significantly during the feeding trial (P<0.003); and with advancing days on feed circulating IGF-I concentrations linearly increase (P<0.001). Ractopamine administration did not alter serum IGF-I concentrations (P=0.13). Neither IMP nor RAC had an effect on β1-AR, β2-AR, β3-AR, or IGF-I mRNA abundance. Advancing days had a tendency to increased β3-AR (P=0.07) abundance, but had no effects on the abundance of β1-AR, β2-AR, or IGF-I mRNA. Supplemental trace minerals (Zn, Cu, Mn, and Co) as Availa®4 or inorganic sources for shipping-stressed cattle. M. Pass1, E. B. Kegley1, and C. K. Larson2. 1University of Arkansas, Fayetteville, 2Zinpro Corp., Eden Prairie, MN.
Male beef calves (n = 288; 77 steers and 211 bulls) averaging 527 lb were obtained from sale barns, shipped to the research facility and arrived in 3 sets on January 10 (n = 96), January 31 (n = 98), and March 8, 2006 (n = 94). Following arrival, calves received viral respiratory and clostridial vaccinations, were dewormed, and bulls were castrated by banding. Within each set, calves were allocated randomly within 4 weight blocks to pen (2 pens/weight block; 11 to 13 calves/pen). Pens within block were randomly assigned to treatment. During the 42 d backgrounding period, calves were housed on 1.1-acre grass paddocks, had ad libitum access to bermudagrass hay, and were fed corn-soybean meal supplements (4 lb/d) that served as the carrier for treatments. Treatments consisted of supplemental Zn (360 mg/d), Cu (125 mg/d), Mn (200 mg/d), and Co (12 mg/d) from inorganic (zinc sulfate, manganese sulfate, copper sulfate, and cobalt carbonate) or organic (zinc amino acid complex, manganese amino acid complex, copper amino acid complex, and cobalt glucoheptonate; Availa-4, Zinpro Corp.) sources. Beginning the day after processing, calves were observed daily for signs of morbidity. Calves exhibiting morbidity signs (depression, ocular/nasal discharge, etc.) were brought to the chute and a rectal temperature was taken. If the rectal temperature was ≥ 104º F, the calf was treated according to a preplanned antibiotic regimen and returned to its home pen for convalescence. Records were kept of all treatments administered. Pen was the experimental unit for growth performance, medication costs, and blood

105
data. Calf was the experimental unit for percent morbidity data. Calves supplemented with organic trace mineral sources had a greater final weight (598 vs. 588 lb for organic and inorganic, respectively; P = 0.04) and ADG (1.7 vs. 1.5 lb/d for organic and inorganic, respectively; P = 0.04) than calves supplemented with iso-levels of trace minerals from inorganic sources. There was no effect (P = 0.46) of supplemental trace mineral source on the percentage of calves that had to be treated for bovine respiratory disease (63%). However, there was a tendency (P = 0.09) for supplementation with organic trace minerals to reduce the percentage of calves that received a second treatment. There was no effect (P ≥ 0.12) of dietary treatment or a treatment by sampling day interaction on antibody response to bovine respiratory syncytial virus (BRSV), bovine viral diarrhea (BVD), or parainfluenza type-3 (PI3) vaccination. When calves that had initial antibodies to infectious bovine rhinotracheitis virus (IBRV) were removed, there was an effect of dietary treatment (P = 0.03) in the naïve calves. Calves supplemented with inorganic trace minerals had a greater antibody response to IBRV vaccination than those supplemented with organic trace minerals. Organic trace mineral supplementation of Zn, Cu, Mn, and Co, improved growth performance of calves backgrounded 42 d compared to those fed equivalent levels of inorganic sources. Effects of a saccharin-containing additive (SUCRAM) on total tract digestibility, plasma metabolites, metabolic hormones, and urine organic acid excretion by steer calves. C. H. Ponce1, M. S. Brown1, J. C. Silva1, P. Schlegel2, and W. Rounds3. 1West Texas A&M University, Canyon, 2Pancosma SA, Geneva, Switzerland 3Prince Agri Products, Qunicy, IL.
Previous data suggest that SUCRAM C-150 (97% sodium saccharin; Pancosma SA) may improve growth performance by stressed beef calves. Fifteen steers (575 +/- 13 lb BW) were used to evaluate the effects of SUCRAM C-150 on total tract digestibility, plasma metabolite concentrations, and urine monoamine metabolite concentrations. Treatments included ad libitum access to a 60% concentrate diet (NC), ad libitum access to NC + 180 g of SUCRAM C-150/ton of DM (AS), and NC + 180 g of SUCRAM C-150/ton of DM with feed intake paired to NC (PS). Steers were adapted to treatments for 28 d before a 5-d collection of total feces and urine excreted. Jugular blood samples were collected on the last day of collection period. Steer DMI during the metabolism period did not differ (P > 0.15) between PS and NC (93 and 97 +/- 4 g/kg of BW0.75, respectively), but DMI tended (P = 0.14) to be greater for AS (105 g/kg of BW0.75) than for NC. Treatments did not alter (P > 0.15) apparent total tract DM, OM, CP, or NDF digestibility. Plasma homocysteine concentration was reduced (P < 0.03) by feeding PS or AS (0.57, 0.39, and 0.44 +/- 0.04 μg/mL for NC, PS, and AS, respectively). No differences were detected (P > 0.15) in plasma concentrations of tryptophan, large neutral amino acids, branched chain amino acids, or in the ratio of tryptophan to either large neutral or branched-chain amino acids. Urinary concentration (mmol/mol creatinine) of ethylmalonic acid, vanillymandelic acid (0.68, 1.65, and 1.47 +/ 0.23 for NC, PS, and AS, respectively), and 5-hydroxyindolacetic acid were greater (P < 0.06) for steers receiving AS than for steers receiving NC; steers fed PS had a greater (P = 0.02) urine vanillymandelic acid concentration than steers fed NC and tended (P < 0.12) to have
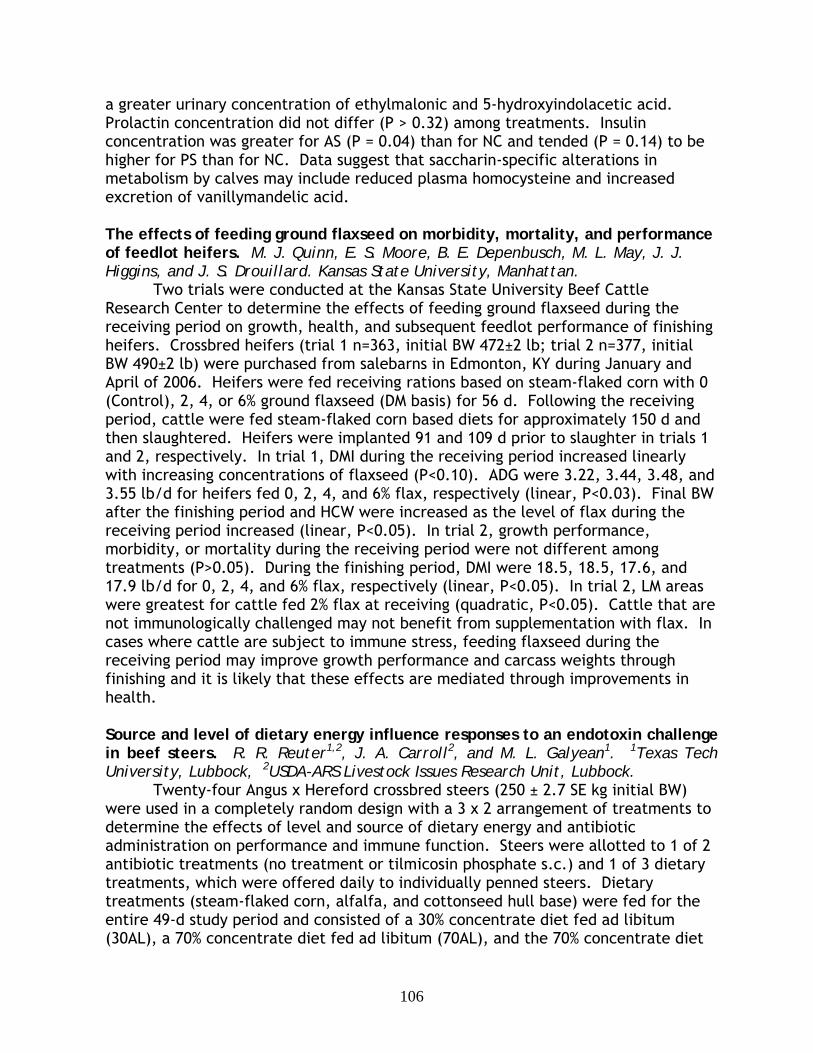
106
a greater urinary concentration of ethylmalonic and 5-hydroxyindolacetic acid. Prolactin concentration did not differ (P > 0.32) among treatments. Insulin concentration was greater for AS (P = 0.04) than for NC and tended (P = 0.14) to be higher for PS than for NC. Data suggest that saccharin-specific alterations in metabolism by calves may include reduced plasma homocysteine and increased excretion of vanillymandelic acid.
The effects of feeding ground flaxseed on morbidity, mortality, and performance of feedlot heifers. M. J. Quinn, E. S. Moore, B. E. Depenbusch, M. L. May, J. J. Higgins, and J. S. Drouillard. Kansas State University, Manhattan.
Two trials were conducted at the Kansas State University Beef Cattle Research Center to determine the effects of feeding ground flaxseed during the receiving period on growth, health, and subsequent feedlot performance of finishing heifers. Crossbred heifers (trial 1 n=363, initial BW 472±2 lb; trial 2 n=377, initial BW 490±2 lb) were purchased from salebarns in Edmonton, KY during January and April of 2006. Heifers were fed receiving rations based on steam-flaked corn with 0 (Control), 2, 4, or 6% ground flaxseed (DM basis) for 56 d. Following the receiving period, cattle were fed steam-flaked corn based diets for approximately 150 d and then slaughtered. Heifers were implanted 91 and 109 d prior to slaughter in trials 1 and 2, respectively. In trial 1, DMI during the receiving period increased linearly with increasing concentrations of flaxseed (P<0.10). ADG were 3.22, 3.44, 3.48, and 3.55 lb/d for heifers fed 0, 2, 4, and 6% flax, respectively (linear, P<0.03). Final BW after the finishing period and HCW were increased as the level of flax during the receiving period increased (linear, P<0.05). In trial 2, growth performance, morbidity, or mortality during the receiving period were not different among treatments (P>0.05). During the finishing period, DMI were 18.5, 18.5, 17.6, and 17.9 lb/d for 0, 2, 4, and 6% flax, respectively (linear, P<0.05). In trial 2, LM areas were greatest for cattle fed 2% flax at receiving (quadratic, P<0.05). Cattle that are not immunologically challenged may not benefit from supplementation with flax. In cases where cattle are subject to immune stress, feeding flaxseed during the receiving period may improve growth performance and carcass weights through finishing and it is likely that these effects are mediated through improvements in health.
Source and level of dietary energy influence responses to an endotoxin challenge in beef steers. R. R. Reuter1,2, J. A. Carroll2, and M. L. Galyean1. 1Texas Tech University, Lubbock, 2USDA-ARS Livestock Issues Research Unit, Lubbock.
Twenty-four Angus x Hereford crossbred steers (250 ± 2.7 SE kg initial BW) were used in a completely random design with a 3 x 2 arrangement of treatments to determine the effects of level and source of dietary energy and antibiotic administration on performance and immune function. Steers were allotted to 1 of 2 antibiotic treatments (no treatment or tilmicosin phosphate s.c.) and 1 of 3 dietary treatments, which were offered daily to individually penned steers. Dietary treatments (steam-flaked corn, alfalfa, and cottonseed hull base) were fed for the entire 49-d study period and consisted of a 30% concentrate diet fed ad libitum (30AL), a 70% concentrate diet fed ad libitum (70AL), and the 70% concentrate diet

107
fed to provide equal calculated NEg intake to the 30AL treatment (70RES). Orts were weighed and quantity of feed to offer was calculated daily. Steers were housed individually in outdoor soil-surfaced pens for 21 d, housed indoors in stanchions for 10 d, and then returned to the outdoor pens for the final 19 d. On d 27, steers were catheterized in the jugular vein, and on d 28, an i.v. lipopolysaccharide challenge (LPS, 2 µg/kg BW) was given (0 h) to induce an acute-phase immune response. Blood samples were collected on 30-min intervals from -2 to 6 h, and again at 8 and 12 h after the challenge, and serum cortisol
Table 1. Performance and lipopolysaccharide challenge response of beef steers
Item 70AL 70RES 30AL SE Energy source1
Energy level2
DMI, kg/d 13.3 9.8 14.6 0.45 0.001 0.001 NEg intake, Mcal/d 4.3 2.4 2.4 0.17 0.001 0.001 ADG, kg 1.11 0.53 0.86 0.13 0.80 0.005 Cortisol3, ng/mL 62.6 61.1 73.4 4.0 0.03 0.79 Peak cortisol time, h 2.4 2.5 4.8 0.7 0.01 0.90 Rectal temp Δ4, °C 1.97 1.15 1.14 0.27 0.23 0.04 Severity score5 10% 13% 27% -- 0.06 -- 1P-value for the contrast comparing 30AL vs. mean of 70AL and 70RES. 2P-value for the contrast comparing 70AL vs. 70RES. 3Mean cortisol over 12 h following endotoxin challenge. 4Peak temperature observed minus baseline (2-h mean temp before challenge). 5Value is the percentage of score observations ≥ 2, with the P-value determined from a χ2 contingency table analysis. concentrations were determined. Rectal temperature was recorded at 1-min intervals during the challenge using an indwelling, automatic rectal temperature probe. A subjective morbidity score (0 = normal to 4 = moribund) was assigned to each animal on 1-h intervals from 1 to 6 h after the challenge.
In response to the LPS challenge, steers on the 30% diet had greater cortisol (P = 0.03, Table 1) concentrations than steers on the 70% diet treatments. The 30% diet also increased both cortisol production (amount and peak time) and subjective severity score compared with the 70% diet treatments. No effect of level of NEg intake was detected for these variables; however, increased NEg intake increased rectal temperature response (P = 0.04, Table 1). No significant effects or interactions were detected for antibiotic treatment with respect to these variables.
Relationships of feed efficiency with carcass and non-carcass tissue composition in Angus bulls and heifers. F. R. B. Ribeiro1, G. E. Carstens1, P. A. Lancaster1, L. O. Tedeschi1, and M. E. Davis2. Texas A&M University, College Station1, The Ohio State University, Columbus2.
Objectives of this study were to characterize feed efficiency traits and examine their relationship with carcass and non-carcass tissue composition in Angus
108
bulls and heifers. Individual DMI were measured in Angus bulls (n = 16) and heifers (n = 16) fed a corn-based diet (ME = 2.85 Mcal/kg) for 70 d using Calan gates. BW was measured at 14-d intervals. Residual feed intake (RFI) was computed as the residual from the linear regression of DMI on mid-test BW0.75 and ADG within gender. Low RFI calves consumed 17% less feed than high RFI calves, but had similar ADG and BW. Within bulls and heifers, calves were separated into two groups: high and low RFI (n =8/gender). Upon harvest, gastrointestinal tract (GIT) and visceral organs were removed, dissected, and weighed. The 9-11th rib tissue was analyzed for protein and lipid content. There were no significant differences between low and high RFI groups for final BW (360.7 ± 42.4 kg), HCW (259.5 ± 44 kg) and empty BW (EBW; 384.3 ± 61.5 kg). There were also no significant difference for total internal fat (82 ± 20.1 g/kg EBW), and carcass lipid (30.3 ± 6.8 %), however low RFI calves had greater (P < 0.05) carcass protein content than high RFI calves (15.7 vs. 15.1 %). RFI groups had similar liver (13.5 ± 1.3 g/kg EBW) and heart (3.8 ± 0.3 g/kg EBW), however. As expected, heifers had more carcass lipid (35.3 vs. 25.9 ± 1 %) and IF (101.1 vs. 65.98 ± 2.2 g/kg EBW) than bulls. These results showed that RFI had minimal effects on carcass and non-carcass tissue composition.
Effects of dietary fat concentration and wet sorghum distiller’s grains plus solubles on feedlot performance and carcass characteristics of finishing heifers. J. C. Silva1, N. A. Cole2, M. S. Brown1, D. L. Mitchell1, C. H. Ponce1, and D. R. Smith1. 1West Texas A&M University, Canyon, 2USDA ARS Conservation and Production Research Laboratory, Bushland, TX.
Four hundred crossbred yearling heifers (initial BW = 823 lb) were used in two experiments to examine the effect of dietary fat concentration on the feeding value of wet sorghum distiller’s grains plus solubles (WSDGS). Treatments included two 92% concentrate diets based on steam-flaked corn (SFC) with 0% or 3% added fat from yellow grease and three diets with 15% WSDGS and either 0, 1.5, or 3% added fat from yellow grease (4 pens/treatment within study). Heifers were fed an average of 106 d before slaughter. Overall DMI was 6.1% greater (P < 0.01) for heifers fed WSDGS than for those fed SFC. Among heifers fed WSDGS, DMI was greatest for heifers fed 1.5% fat (P = 0.04; quadratic). Overall ADG was 5.8% greater (P = 0.04) for WSDGS compared to SFC. Among WSDGS, ADG tended to be greater for 1.5% fat (P = 0.12; quadratic). The DMI:ADG did not differ between SFC with 0 or 3% fat, nor was DMI:ADG altered by replacing a portion of SFC with WSDGS (P > 0.36). However, DMI:ADG increased linearly as more fat was added to WSDGS diets (P = 0.06). Hot carcass weight was increased an average of 11 lb (P = 0.05) when WSDGS replaced a portion of SFC, but carcass weight was greatest for heifers fed WSDGS with 1.5% fat (P = 0.09, quadratic). Heifers fed SFC without fat had a larger ribyea area, lower marbling score, less rib fat, and a lower yield grade (P < 0.08) than heifers fed SFC with 3% fat. Heifers fed WSDGS had more rib fat and a higher yield grade (P < 0.03) than heifers fed SFC. Inclusion of fat in SFC diets did not alter the distribution of carcass quality grades, but SFC with 3% fat produced fewer (P = 0.01) yield grade 1 carcasses than when fat was not fed. Feeding WSDGS did not alter carcass quality grade distribution compared to feeding SFC, but WSDGS produced fewer yield grade 3 carcasses (P = 0.03) than SFC. Heifers fed WSDGS had

109
a higher DMI and greater ADG than heifers fed SFC, but gain efficiency did not differ. When WSDGS replaced the combination of cottonseed meal (1/3) plus steam-flaked corn (2/3) this resulted in 91% NEg than that of whole corn. Adding more than 1.5% fat to diets containing WSDGS tended to reduce growth performance. Effects of different winter growing programs and subsequent finishing on gene expression in different adipose tissue depots in beef steers. D. R. Stein1, A. Pillai1, M. P. McCurdy1, U. DeSilva1, C. R. Krehbiel1, J. B. Morgan1, G. W. Horn1, J. J. Wagner2, P. Ayoubi1, J.R. Malayer1, and R. D. Geisert3. 1Oklahoma State University, Stillwater, 2Southeast Colorado Research Center, Colorado State University, Lamar, and 3Department of Animal Science, University of Missouri, Colombia.
The relationship between “waste” and “taste” fat is at the forefront of concerns of the U.S. beef industry as evidenced by the “Top Ten Greatest Quality Challenges” put forth by the 2005 NQBA; included were insufficient marbling and excess fat cover. The majority of the “waste” and “taste” inefficiency is due to either excess or insufficient lipid deposition and calculates to over a 2 billion dollar loss to the beef industry. Understanding the mechanisms regulating the metabolic pathways that orchestrate lipid deposition within and between depots could be integrated into management practices and ultimately enhance beef consumption, increase production efficiency, and increase profitability. The objective of this study was to determine gene expression profiles between subcutaneous (SQ) and intramuscular (IM) depots in beef steers from different winter growing programs. Steers of similar breed, type, and age were blocked by BW and randomly assigned to an initial harvest group (n=4) or one of four treatment groups; steers placed in the feedlot immediately after weaning and fed a high-concentrate diet ad libitum (CF); steers grazed on wheat pasture (WP); steers fed a sorghum silage-based growing diet (SF); or steers program fed a high-concentrate diet (PF). Steers in the SF and PF groups were fed to gain BW at a similar rate as WP steers. At the end of the growing phase (112 days), steers from WP, SF, and PF groups were placed in the feedlot and adapted to a high-concentrate diet. At the initiation of the feedlot phase, six steers from the WP, SF, and PF groups were randomly selected for harvest. At finish, six steers from each treatment were harvested at a common backfat (1.27 cm) as determined by ultrasound. At harvest, a 7.6 cm3 section was dissected from the Longissimus dorsi muscle between the 12th and 13th rib, and SQ and IM adipose tissue was collected and frozen (-80oC). Total RNA was extracted and microarray hybridizations performed to identify differential gene expression between SQ and IM adipose tissue among different growing programs. Data normalization for each depot was accomplished using R-project statistical environment and Bioconductor through the GenePix AutoProcessor (GPAP 3.2) website. TIGR MeV was used to identify genes that were co-expressed across diets. In the SC vs. IM comparison, K-means clustering revealed clusters 3 and 8 with patterns of up regulation in IM for WP steers. Cluster 7 showed a pattern of down-regulation in IM for WP steers. Clusters 1, 4, and 6 exhibited a down-regulation in IM from a high-concentrate to low-concentrate or WP diet. The numbers of genes from adipose tissue that were up-regulated or down-regulated were similar for steers grown on concentrate diets;

110
however, there were a greater number of up- and down-regulated genes for steers grown on WP prior to finishing, suggesting growing diet influences gene expression in adipose tissue. Increasing dietary protein improves nitrogen retention in steers following an endotoxin challenge. J. W. Waggoner, C. A. Löest, J. L. Turner, C. P. Mathis, K. K. Kane, D. M. Hallford, and M. K. Petersen. New Mexico State University, Las Cruces.
Bacterial lipopolysaccharide (LPS) stimulates the immune system and mimics the clinical and metabolic responses of gram(-) bacterial infection in cattle. The effects of LPS and dietary protein on N metabolism and serum concentrations of cortisol and haptoglobin (HAPT) in 24 steers (250 ± 2.8 kg BW) were evaluated. Treatments were a 2 × 3 factorial arrangement of LPS (0 vs 1.5 μg/kg BW; -LPS vs +LPS) and diets containing (DM basis): 1) 14.5% CP, 11.6% DIP and 2.9% UIP (CP14.5CON); 2) 16% CP, 13.3% DIP and 2.7% UIP (CP16DIP); and 3) 16% CP, 11.3% DIP and 4.7% UIP (CP16UIP). Casein was used to alter DIP, and fish meal and corn gluten meal were used to alter UIP. Steers were adapted to diets (1.2 Mcal/kg NEg; DM fed = 1.8% BW) for 14 d, and were infused (i.v. 1 mL/min) with LPS (in 100 mL saline) on d 15. Blood samples were collected prior to LPS infusion and every 2 h for 12 h thereafter. Feces, urine, and feed refusals were collected from d 16 to d 21. Serum cortisol and HAPT increased (P ≤ 0.05) in response to +LPS, but were not affected by diet. Serum cortisol of +LPS steers peaked at 4 h (5.4 vs 75.6 ng/mL for -LPS vs +LPS) and remained elevated for 12 h (P ≤ 0.05); serum HAPT of +LPS steers were elevated at 4, 6, 10 and 12 h (P ≤ 0.05). Dietary DM and N intakes were lower (P ≤0.05) for +LPS vs -LPS steers, and N intakes were greater (P ≤ 0.05) for higher CP diets. There was an LPS × diet interaction (P = 0.06) for N retained (% of intake). Lower N retention was observed for +LPS vs –LPS steers when fed CP14.5CON, due to a 24% increase (P = 0.10) in urinary N excretion of +LPS steers consuming CP14.5CON. These results imply that growing steers exposed to stressors, such as bacterial infection (LPS), during the receiving period may require greater dietary protein levels to maintain performance. Limit-feeding a high-concentrate diet may alter nutrient absorption. J. O. Wallace, W. F. Miller, B. J. Johnson, and C. D. Reinhardt. Kansas State University, Manhattan. Four steers (initial BW = 948 lb) were used in a 2 × 2 switchback design to compare the effects of a conventional step up program to limit-feeding a finishing diet as a means of ruminal adaptation to high concentrate diets. Steers were individually fed either (1) three conventional step up diets followed by a finishing diet (beginning with 60 and ending with 92% concentrate), starting at 1.5% of BW (STEP), or (2) limit-fed the finishing diet (92% concentrate), starting at 1.25% BW (LIMIT). Daily programmed increases of either 1.0 lb (STEP) or 0.5lb (LIMIT) were provided when less than 0.5 lb of feed remained in the bunk. Following the 4 week period (7 d/step) steers were placed in an outdoor pen and fed prairie hay and soybean meal for 21d. After all cattle reached ad libitum intake of the finishing diet, DMI as a % of BW was unaffected by treatment. During week 1, valerate absorption was higher

111
in the LIMIT steers (P = 0.02). However, following week 4 valerate absorption favored the STEP cattle (P = 0.05). Differences in total VFA and DMI during week 1 are a result of experimental design but the difference in valerate absorption after adaptation may suggest the conventional step-up diets are beneficial for rumen development and nutrient absorption. Limit-feeding a finishing diet to adapt cattle to a high concentrate diet is effective when comparing DMI to that of conventionally adapted cattle, but the resulting decrease in nutrient absorption may not compensate for the decrease in ration costs. In addition, application of a limit-fed diet may be difficult in large pen settings. Table 1. Weeks 1 and 4 Total VFA, valerate absorbance, and DMI
Treatment STEP LIMIT SEM P-Value Week 1 Total VFA (mM) 116.34 99.67 9.42 0.02 Valerate Absorption (%/h) 0.27 0.46 0.06 0.02 DMI (% BW) 1.71 1.29 0.12 <0.01 Week 4 Total VFA (mM) 99.85 107.81 2.80 0.03 Valerate Absorption (%/h) 0.55 0.23 0.08 0.05 DMI (% BW) 2.61 2.80 0.12 0.12
Feed management case study demonstrating assessment and planning tools. R.A. White1, G.E. Erickson2, R.K. Koelsch2, R.E. Massey3, V. R. Bremer2, J.H. Harrison1. 1Washington State University, Puyallup, 2University of Nebraska, Lincoln, 3University of Missouri, Columbia.
Feed management is an optional component of a Comprehensive Nutrient Management Plan (CNMP) and may be a viable option to decrease excess nutrients such as N and P on concentrated animal feeding operations (CAFO). The National Feed Management Education Project has developed assessment tools to facilitate integration and implementation of a feed management plan (FMP) into a CNMP. The two audiences for the education program are animal nutritionists and nutrient management planners (planners). In most cases, collaboration between these two individuals is needed for successful completion of a FMP. A feed management case study was developed for a Kansas feedlot (35,000 head capacity). The feedlot utilizes a nutritionist and private nutrient management planner. The case study was developed by the nutrient management planner who had previous knowledge of the operation. The objectives of the case study were to 1) test practical use of the assessment tools in the field, and 2) use completed case studies as an educational resource. The tools used were the opportunity checklist, feed management plan checklist, and SPREAD, a new software tool that integrates FM into nutrient planning and economic decisions. The opportunity checklist is a list of 20 questions that determine the relative opportunity for feed management to impact whole farm nutrient management or increase net farm income by feeding more efficiently. It is deigned to be used by a nutrient management planner with little knowledge of feed

112
management. The feed management plan checklist is a more comprehensive list of questions intended to be used by a consulting nutritionist with a strong background in feed management. The checklist documents current feeding practices and is the basis for developing a FMP. The SPREAD software integrates estimates of nutrient excretion based upon the feeding program and animal performance inputs with estimates of land-base and time requirements for land application of manure nutrients, and economic costs and benefits associated with land application. The SPREAD software uses the new ASABE manure standards, improving accuracy of farm specific nutrient excretions. The beef manure standards utilize an animal mass balance approach where excretion is estimated as a difference between intake and retention in body mass or product (meat). Dry matter excretion is based on estimates of feed dry matter digestibility with adjustments based upon research literature for solids in urine. The case study feedlot data was entered into SPREAD. More acreage was needed when manure application was calculated on a one-year nitrogen rate compared to a four-year phosphorus rate (4,985 and 6,576, respectively). When the phosphorus in the ration was decreased from 0.40% to 0.30%, acres needed was reduced by 24%, however the value of the manure decreased by 35%. Careful consideration of feed management should be taken when developing a CNMP to maintain economic viability. The assessment and planning tools developed by The National Feed Management Education Program establish the framework for integrating feed management into whole farm nutrient management planning. Performance and hay intake of beef calves fed dried distiller’s grains. S. J. Winterholler, B. P. Holland, J. J. Cranston, T. K. Dye, M. D. Hudson, C. R. Krehbiel, G. W. Horn and D. L. Lalman. Oklahoma State University, Stillwater. A 56-d preconditioning trial was conducted with fall-weaned steer calves (n=64; initial BW=434 ± 56 lb) to determine rate of gain by feeding increasing levels of corn dried distiller’s grains with solubles (DDGS). Steers were stratified by weight and randomly allotted to receiving pens (4 animals/pen, 4 pens/treatment), and pens were randomly assigned to one of the following treatments: 0.30, 0.75, 1.20 or 1.65% of BW of DDGS (33.2% CP, 44.8% NDF, 10.8% fat and 0.52% S, DM basis). Cattle were fed prairie hay (4.8% CP, 68.8% NDF) ad libitum and refusals were measured weekly to estimate hay intake. The 1.65% treatment was chosen to maximize DDGS intake while not exceeding the maximum tolerable dietary S concentration recommended by NRC (1996). After the 56-d trial, calves grazed wheat pasture prior to feedlot entry. As level of DDGS increased, ADG increased quadratically (P<0.01) with means of 1.20, 2.05, 2.42, 2.81 lb/d, respectively. Prairie hay intake decreased linearly (P<0.01) as level of DDGS increased. For every 1 lb of DDGS consumed, prairie hay intake was decreased by 0.34 lb (R2=0.90). Total DMI increased linearly (P<0.01) across increasing levels of DDGS with means of 10.81, 12.82, 13.58, 15.11 lb/d, respectively. Similarly, feed:gain improved quadratically (P<0.01) with increasing DDGS and was 9.06, 6.26, 5.60, 5.38, respectively. After 73-d on wheat pasture, ADG was greatest for steers fed the lowest level of DDGS during the preconditioning period (P<0.05) with gains of 2.65, 2.60, 2.38 and 2.36 lb/d, respectively. However, total ADG was 1.78, 2.21, 2.27, and 2.40 lb/d for

113
DDGS at 0.30, 0.75, 1.20 or 1.65% of BW, respectively across both periods. In this trial, while outside our data range, ADG was maximized at 2.0% BW of DDGS as determined by the first derivative of the response function. Similar calculations indicated that 1.38% BW of DDGS optimized feed efficiency. Moreover, DDGS decreased prairie hay intake, but total DMI was increased. Calves readily consumed DDGS and feeding DDGS may be a viable option in preconditioning programs when hay is limited. However, economic feasibility should be evaluated with changing prices of DDGS and other feedstuffs. Effects of combined trenbolone acetate and estradiol implant and/or ractopamine-HCl administration versus natural beef production in finishing steers. S. J. Winterholler, A. S. Webb, G. L. Parsons, D. K. Walker, M. J. Quinn, J. S. Drouillard, and B. J. Johnson. Kansas State University, Manhattan.
Two experiments were conducted to evaluate the interactive effects of combined trenbolone acetate and estradiol-17β implant, Revalor-S, (IMP), ractopamine-HCl (RAC), and ionophore/antibiotic (IA) administration on finishing steer performance, carcass characteristics and circulating IGF-I. In Exp. 1, crossbred steers (n=120; initial BW=400 kg) were stratified by weight and randomly allotted to 12 pens of 10 hd/pen. Pens were randomly assigned to one of four treatments: 1) Natural (NAT): No IMP/No RAC/No IA; 2) Conventional (CON): IMP/No RAC/IA; 3) Natural plus (NAT+): No IMP/RAC/NoIA; 4) Conventional plus (CON+): IMP/RAC/IA. In Exp. 2, individually-fed crossbred steers (n=24; initial BW=453 kg) were blocked by body weight and randomly assigned to same treatment groups as Exp. 1 (2 hd/trt/weight block). In Exp. 2, serum was harvested from blood collected on d 0 (prior to IMP) 31, and d 0, 14 and 28 of RAC feeding. In Exp. 1, overall ADG, final weight, overall feed:gain and HCW was greater for implanted steers versus natural (P<0.01). Ractopamine increased daily gain during final 37 d and increased overall feed:gain (P<0.05); as well, RAC reduced marbling score and improved yield grade (P<0.05), but did not effect dressing percentage (P>0.10). In Exp. 2, IMPxRAC interactions were detected in ADG and feed:gain the last 28 d, overall ADG, overall feed:gain, and final weight. This interaction indicates that performance responses in CON+ steers was greater than in CON and NAT+ steers (P<0.01). An IMPxRAC interaction was detected for HCW (P<0.01); NAT+ steers had lighter carcasses than all other treatments (P<0.05) and HCW was similar among CON and NAT and between CON and CON+ (P>0.10). Treatment did not affect dressing percentage, yield grade or marbling score (P>0.06). Circulating IGF-I concentration was increased 51% on d 31 by implantation, and was in greater concentration throughout the duration of the trial than non-implanted steers (P<0.05). Circulating IGF-I levels were not changed by RAC (P>0.10). These data indicated that IMP and RAC may work in a synergistic manner as evidenced by significant interaction to enhance growth in yearling feedlot steers.

114