2007 OMAE FNPF combined Yim
29
1 PREDICTIVE CAPABILITY OF A 2-D FNPF FLUID-STRUCTURE INTERATION MODEL Solomon C. Yim * Department of Civil Engineering Oregon State University, U.S.A. Huan Lin David C. Robinson Katsuji Tanizawa The Boeing Company US Naval Academy National Maritime Research Institute Tukwila, WA 98108 USA Annapolis, MD 21402 U.S.A. Tokyo, Japan ABSTRACT The predictive capability of two-dimensional (2-D) fully-nonlinear-potential-flow (FNPF) models of an experimental submerged moored sphere system subjected to waves is examined in this study. The experimental system considered includes both single-degree-of-freedom (SDOF) surge-only as well as two-degree-of-freedom (2DOF) surge-heave coupled motions, with main sources of nonlinearity from free surface boundary, large geometry and coupled fluid-structure interaction. The FNPF models track the nonlinear free-surface boundary exactly hence can accurately model highly nonlinear (non-breaking) waves. To examine the predictive capability of the approximate 2-D models and keep the computational effort manageable, the structural sphere is converted to an equivalent 2-D cylinder. Fluid-structure interaction is coupled through an implicit boundary condition enforcing the instantaneous dynamic equilibrium between the fluid and the structure. The numerical models are first calibrated using free vibration test results and then employed to investigate the wave-excited experimental responses via comparisons of time history and frequency response diagrams. Under monochromatic wave excitations, both SDOF and 2DOF models exhibit complex nonlinear experimental responses including co-existence, harmonics, sub-harmonics and super-harmonics. It is found that the numerical models can predict the general qualitative nonlinear behavior harmonic and subharmonic responses as well as bifurcation structure. However, the predictive capability of the models deteriorates for superharmonic resonance possibly due to three-dimensional (3-D) effects including diffraction and reflection. To accurately predict * Corresponding author
Transcript of 2007 OMAE FNPF combined Yim

1
PREDICTIVE CAPABILITY OF A 2-D FNPF FLUID-STRUCTURE INTERATION MODEL
Solomon C. Yim* Department of Civil Engineering Oregon State University, U.S.A.
Huan Lin David C. Robinson Katsuji Tanizawa The Boeing Company US Naval Academy National Maritime Research Institute Tukwila, WA 98108 USA Annapolis, MD 21402 U.S.A. Tokyo, Japan
ABSTRACT
The predictive capability of two-dimensional (2-D) fully-nonlinear-potential-flow (FNPF) models of an
experimental submerged moored sphere system subjected to waves is examined in this study. The
experimental system considered includes both single-degree-of-freedom (SDOF) surge-only as well as
two-degree-of-freedom (2DOF) surge-heave coupled motions, with main sources of nonlinearity from
free surface boundary, large geometry and coupled fluid-structure interaction. The FNPF models track the
nonlinear free-surface boundary exactly hence can accurately model highly nonlinear (non-breaking)
waves. To examine the predictive capability of the approximate 2-D models and keep the computational
effort manageable, the structural sphere is converted to an equivalent 2-D cylinder. Fluid-structure
interaction is coupled through an implicit boundary condition enforcing the instantaneous dynamic
equilibrium between the fluid and the structure. The numerical models are first calibrated using free
vibration test results and then employed to investigate the wave-excited experimental responses via
comparisons of time history and frequency response diagrams. Under monochromatic wave excitations,
both SDOF and 2DOF models exhibit complex nonlinear experimental responses including co-existence,
harmonics, sub-harmonics and super-harmonics. It is found that the numerical models can predict the
general qualitative nonlinear behavior harmonic and subharmonic responses as well as bifurcation
structure. However, the predictive capability of the models deteriorates for superharmonic resonance
possibly due to three-dimensional (3-D) effects including diffraction and reflection. To accurately predict
* Corresponding author

2
the nonlinear behavior of moored sphere motions in the highly sensitive response region, it is
recommended that the more computational intensive 3-D numerical models be employed.
INTRODUCTION
Over the years, highly complex nonlinear structural response behavior of a large number
of compliant marine structural systems had been identified and demonstrated in analyses,
numerical simulations and experimental results (e.g., Thompson 1983; Virgin and Bishop 1988;
Soliman and Thompson 1991; Gottlieb and Yim 1992 and 1993; Isaacson and Phadke 1994; Lin
and Yim 1995; Gottlieb et al 1997). Lin et al (1998) conducted a medium-scale experimental
investigation of the nonlinear response behavior of a submerged, moored marine structural
system with a single-degree-of-freedom (SDOF) -- surge only, and a two-degree-of-freedom
(2DOF) -- coupled surge and heave motions, to examine their sensitive nonlinear response
characteristics. SDOF (Yim and Lin 2006a; Lin and Yim 2006a) and 2DOF (Lin and Yim 2006b;
and Yim and Lin 2006b) analytical and numerical studies based on small-body theory
formulation had been carried out to model the experimental systems and predict their responses.
Those analytical models were derived based on Morison formulation with an independent flow
field assumption. To keep the analyses and simulations manageable, simple sinusoidal waves
matching the amplitude and period of the measured waves were employed as the input excitation.
A comparison of the numerical predictions with measured experimental results indicated that the
small-body theory Morison models were able to capture the general qualitative nonlinear
behavior of the systems. Specifically, for both models, an underlying bifurcation pattern,
coexistence of different nonlinear responses including harmonics, sub-harmonics and super-
harmonics were predicted and verified by the experimental results.

3
There are several advantages of using the small-body Morison formulation. They include:
(1) low (one and two) DOF second-order governing equations; (2) capability of modeling fully
three-dimensional (3-D) problems including form and viscous drag effects; (3) resulting
equations are sufficiently simple for modern geometric and perturbation analyses; and (4) the
system is amenable to stochastic analyses such as Ito stochastic integration, Fokker-Planck
equation with path-integral solution, and reliability estimation (Lin and Yim 2006b; Yim and Lin
2006b). While these advantages enable a variety of analyses and relatively easy interpretation of
numerical results, the small-body theory based models also have some disadvantages. They
include difficulty in accounting for nonlinear wave excitation without compromising the ease of
analysis. For example, the incident waves in Lin and Yim (2006a and b) and Yim and Lin (2006a
and b) were approximated by a simple sinusoidal function, and therefore, second and higher
order nonlinear waves could not be taken into account. In addition, the fluid motion is assumed
to be unaffected by the presence of the structure, and hence true fluid-structure interaction
cannot accounted for. It is likely that these limitations led to the inability of the models to
accurately predict the super-harmonics motions of the SDOF (Yim and Lin 2006a) and 2DOF
(Lin and Yim 2006a) structural responses. More advanced numerical models that can take into
account nonlinear wave motions and coupled fluid-structure interaction without significantly
increasing the computational efforts and reducing the relative ease of analyses is needed.
Recently, Yim et al (2007) presented a two-dimensional (2-D) approximation of the fully-
nonlinear-potential-flow (FNPF) models for each of the SDOF and 2DOF experimental systems including
nonlinear wave effects and incorporating dynamic coupled fluid-structure interaction effects. The FNPF
model formulation of the submerged sphere experimental system was implemented by employing an
acceleration-potential for the fluid flow. Nonlinear waves were included by incorporating the exact free-

4
surface boundary conditions. As an approximation worth examining, the sphere was converted to an
equivalent cylinder for efficient 2-D computations (in terms of seconds or minutes on a PC instead of
what could be days on parallel computers). The approximation was further justified by the plan symmetry
of the problem. The fully nonlinear coupled fluid-structure interaction was enforced by an implicit
boundary condition upholding instantaneous dynamic equilibrium between the fluid and the structure.
They presented a stochastic analysis of the nonlinear response behavior but showed only very limited
information on the predictive capability of the models under deterministic excitation.
In this study, we present an in-depth examination of the predictive capability of the SDOF and
2DOF FNPF models for deterministic steady-state responses. Specifically, we first provide a brief
summary of the experimental system configurations and the numerical formulation. The damping
coefficient(s) of both the SDOF and 2DOF numerical models are identified by calibrating the numerical
predictions with experimental free-vibration test results. We then assess the predictive capability of the
models by comparing the simulation results with corresponding measured experimental data of the
systems subjected to monochromatic nonlinear wave excitations including time histories and frequency
response diagrams over the wave frequency range considered. Finally, we provide a discussion on the
significance of these models in practical analysis of nonlinear fluid-structure interaction systems.
EXPERIMENTAL CONFIGURATIONS
The SDOF and 2DOF experiments were conducted at the O. H. Hinsdale Wave Laboratory at
Oregon State University in a 2-D wave flume which had dimensions of 104.3 m (length), 3.66 m (width)
and 4.57 m (depth) and a hydraulically driven, hinged flap wave board (Lin et al 1998). Data recorded
during each test included wave profiles, water particle velocities, sphere displacements, and restoring
force on the springs. The experimental model considered in this study is a geometrically nonlinear two-
point moored system free to move in all 6 degree-of-freedom, i.e. surge, heave, pitch, yaw, sway, and roll.
However, because of the direction of incident waves and symmetry of experimental configuration, it was

5
observed that the movement of the sphere was predominantly two dimensional, in surge and heave only.
A total of 16 channels of measurements, including 6 wave gauges, 2 current meters and 8 string pots,
were used to measure wave profiles, water particle velocities, and sphere movements, respectively. The
data were collected, conditioned, filtered and stored for later reduction. The 6 wave gauges were located
at 3.35, 1.22, and 0.46 m up- and down-stream of the quiescent position of the sphere, respectively. Based
on a geometric relationship between instrumentations and sphere’s displacements, all the measurements
(channels 9-16) of the movements of the sphere were initially decomposed into surge, heave and roll
components for later analyses and comparisons. Roll motions based on the decomposition were found
negligible for all tests as experimentally observed. Four measurements (channels 11, 14-16) are used in
this study to compute surge and heave motions. The measurements at 0.46 m upstream are chosen to
estimate incident wave conditions.
SDOF Model -- The SDOF experimental model was a geometrically nonlinear two-point moored system
with confined motions in surge only. The model consisted of a sphere on a rod supported by guyed masts
1.77m above the bottom of a closed wave channel. A sphere made of PVC with diameter 0.457m was
used. The sphere was neutrally buoyant when submerged. Springs of stiffness of 292 N/m were attached
to the sphere at a 90° angle to provide a nonlinear restoring force with large geometric nonlinearity. The
energy dissipation mechanism includes linear system (structural) damping (associated with the system
connections and contact points of instrumentation), time-dependent Coulomb friction (due to the set-up of
restricted surge motion), and hydrodynamic drag. The Coulomb friction originates from the lift force (in
heave) and combined drag/lift moment (in pitch). The initial tension in the mooring cables was
sufficiently low (from 219 to 438 N) to ensure nonlinear motion response.
2DOF Model -- The 2DOF experimental model had the same configuration as its SDOF counterpart,
except that the central rod was removed. The sphere was free to move in all 6 degree-of-freedoms (i.e.
surge, heave, pitch, yaw, sway, and roll). However, because of the direction of incident waves and
symmetry of experimental configuration, the movement of the sphere was observed to be predominantly

6
two dimensional with negligible pitch (i.e. mostly coupled surge and heave), and hence the system is
essentially of 2DOF. The energy dissipation mechanism includes structural damping (associated with
system connections and contact points of instrumentation), and hydrodynamic drag. As in the SDOF case,
the initial tension in the mooring cables (springs) was sufficiently low (from 66.72 to 133.44 N) to ensure
nonlinear motion response.
Test Classification -- The experimental tests can be classified as free-vibration, continuous search tests,
and data acquisition tests. The free vibration tests were conducted to identify pertinent system parameters,
especially damping. The continuous search tests were performed to search and identify underlying
bifurcation pattern within the wave frequency range considered. The data were acquisition for specific
sets of parameters to examine the nonlinear structural response behavior subjected to various incident
wave conditions and are used for simulation comparisons.
FNPF MODEL OF FLUID-STRUCTURE INTERACTION SYSTEM
Formulation of the 2-D FNPF models of the experimental fully coupled fluid-structure interaction system
has been presented in Yim et al (2007). Generalized expressions of the generic experimental
configurations including surge, heave and pitch motions were derived. A brief summary pertaining
specifically to the models considered in this study is presented in this section. Some information deemed
essential for this study but omitted in Yim et al (2007) due to space limitation are presented here.
The fluid is assumed homogenous, incompressible, inviscid and the flow is assumed irrotational.
The model has a space fixed Cartesian coordinate system with the origin located at the intersection of the
at-rest wave-making boundary and the still water level. The fluid domain consists of the interior of the
flume, and the fluid boundaries are the wavemaker surface, the absorbing surface, the free surface, the
bottom boundary, and the body surface. The two dimensional fluid velocity ( )tzx ,,v can be computed
from the fluid velocity potential ( )tzx ,,φ

7
( ) ( )tzxtzx ,,,, φ∇=v (1a)
and the pressure ( ), ,P x z t from the unsteady Bernoulli equation is given by
( ) ( ) ( )21, , , ,2
P x z t x z t gz Q ttφρ φ∂⎡ ⎤= − ∇ − +⎢ ⎥∂⎣ ⎦
(1b)
where ρ is the water density, and g the gravitational acceleration.
In the interior of the domain, the velocity potential ( )tzx ,,φ satisfies the Laplace equation.
( ) 0,,2 =∇ tzxφ (1c)
Taking the material derivative of the fluid velocity (Eq. (1a)), the acceleration potential can be obtained
( )21 Constant2
PtφΦ φ η∂
= + ∇ = − − +∂
(1d)
where P is the pressure and η is the wave elevation. The acceleration potential can be directly solved for
the pressure exerting on the boundary along the submerged structure. On free surface, the nonlinear
dynamic boundary condition is obtained by setting the pressure, P, in Eq.(1c) equal to zero and given by
φφηφ ∇⋅∇−−=21
t (2a)
where η denotes the wave elevation. Integration of this equation is carried out by the mixed Eulerian-
Lagrangian method. The bottom boundary is assumed fixed and impermeable, and described as
0=nφ (2b)
The body surface is assumed to be rigid and impermeable and the surface boundary condition for the
acceleration potential is given by:
( ) ( ) ( ) ( )r-Vnrnr-VrVnn
×−∇×⋅+××⋅+×−∇−×+⋅=∂∂ ωφωωωωφω 22
nkΦ
(2c)
Waves are generated by an oscillating boundary with specified amplitude and frequency
subjected to the nonlinear free surface boundary conditions. An artificial damping zone is employed at

8
each end of the flume to approximate the radiation boundary condition. Given a design-wave amplitude,
the stroke of the oscillating boundary can be estimated by linear wave theory (Dean and Dalrymple 1984).
With fully nonlinear boundary conditions (Eq. (2a)), a wide range of (linear and nonlinear) waves can be
generated. An artificial damping zone is applied at each end of the flume to approximate the radiation
boundary condition and damp out possible reflected waves. The free surface is computed by a mixed
Eulerian-Lagrangian (MEL) method, which traces the motions of specified fluid particles with velocities
computed from the Eulerian formulation (Longuet-Higgins and Cokelet 1976).
A comparison of a sample experimental wave profile, FNPF simulation, and corresponding
sinusoidal approximation is shown in Fig.1. The nonlinearity in experimental wave profile is clearly
characterized by the relatively peaky crest and flat trough. Note that the FNPF simulation and the
experimental result are in very good agreement. As expected, the discrepancy between the sinusoidal
(linear wave) approximation and experimental result is significant. It is this accurate approximation of the
nonlinear flow field the FNPF models can reproduce that attracted us to examine the predictive capability.
To reduce the computational effort by keeping the dimension of the problem 2-D (thus
computation in terms of seconds or minutes on a PC rather than days on a parallel cluster for 3-D models
to obtain steady-state responses), an equivalent 2-D structural system at the dynamic equilibriums is
formulated for the sphere experimental structure. The 3-D sphere is converted to an equivalent 2-D
cylinder with an approximate “equivalent” radius obtained by equating the hydrodynamic forces exerting
on the sphere and cylinder. This approximation is further justified by the plane symmetry of the problem
considered. The weight of the equivalent 2-D cylinder is heavier than the sphere by a factor of 3πR/64.
The motion of the structure is described by rigid body dynamics. The motion of a point Q on the
surface of the body, with respect to the origin of the fixed, inertial coordinate system is given by (Yim et
al 2007):
( ) 0Q ω= + ×V V r (3)

9
where V0 is the translational velocity of the origin of the body-centered, non-inertial coordinate system
with respect to the fixed coordinate system, and ω is instantaneous angular velocity of the point Q about
the body-centered origin.
The motion of the submerged equivalent cylinder with unit length is governed by Euler’s
equation in vector form as
gf FFM +=+ βα (4)
where M is the inertia tensor involving surge and heave degrees of freedom, respectively; and β is the
gyro moment and a null vector in 2-D computations. Fg is the sum of the external forces, consisting of
restoring force R and structural damping force g. For the SDOF model, the effects caused by the
Coulomb friction on the response characteristics may be significant. When the rod is removed for the
2DOF model, the hydrodynamic drag may play a more prominent role in the damping mechanism. Ff is
the generalized hydrodynamic force and can be calculated by
∫∫ −∇⋅∇−−=−Φ−=bb S
tS
f NdszNdsz )21()(F φφφ (5)
where z the distance from the water surface and N is the outward normal.
Fluid-structure interaction is enforced by an implicit boundary condition obtained from the
dynamic equilibrium between fluid and body. The equations of motion and boundary conditions are
discretized in a matrix form for computational purpose. A boundary element method (BEM) technique is
employed for computation with a standard, 4th order Runge-Kutta method time integration. Constant
integration time steps are chosen to satisfy the Courant-Friedrichs-Levy (CFL) condition (Yim et al 2007).
MODEL CALIBRATION
Experimental results of free vibration tests are employed here to calibrate the FNPF model
formulation as well as to estimate the system damping parameter.

10
Free Vibration Tests
A free vibration test is conducted by displacing the sphere and allowing it to oscillate at its
submerged natural frequency in the wave tank in calm water. By measuring the amplitudes of successive
(damped) cycles, the damping ratio could be estimated as (Clough and Penzien 1993)
224 δπ
δξ+
= 2
1lnp
p
xx
=δ (6)
where xp1 and xp2 are the peak amplitudes of a selected cycle and its succeeding cycle, respectively. Free-
vibrations tests were conducted for both SDOF and 2DOF experimental systems to measure damping-
caused decay rate and estimate the corresponding damping parameters.
For the SDOF model, there are 3 free-vibration tests (Test S2A-C) with initial tension of 111.2N.
The initial surge displacement was usually large (near 0.5 m) in order to overcome the friction between
the sphere and rod, and the response oscillated with amplitude decaying to zero in 2-3 cycles. A typical
SDOF free vibration test is shown in Fig.2. The estimated damping ratio is near 13% for the first two
cycles, and increases to near 24% for the last two cycles. It is also noted that the period varies between
3.8 s and 3.95 s. The variations in the decay rate and period indicate the high degree of time-dependency,
which may be caused by the frictional damping between the sphere and rod.
For the 2DOF experimental model, tests were conducted independently in surge and heave
directions to estimate the damping parameter in the respective motion. For both surge and heave tests the
initial displacements were relatively smaller at around 0.02 m. There are 10 free-vibration tests in total
with 5 tests in surge (T1C-F) and the other 5 tests in heave (T2A-E). The initial tension on the springs is
chosen much larger (222.4N) than that (111.2N) for other tests subjected to waves. Nonetheless, these
tests results still serve the purpose of parameter identification and model validation. The initial
displacements were at around 0.015m for surge tests and most of the responses oscillated with amplitude
decaying to zero in 4 cycles. The initial displacements were at around 0.025m for heave tests and most of
the responses oscillated more than 6 cycles. Typical 2DOF free tests in surge and heave are shown in Figs.

11
3a and b, respectively. The damping ratios estimated in surge and heave are near 10% and 8%,
respectively. It is noted that the damping ratio in surge increases to almost 60% in the last two cycles.
The distinct experimental response behaviors may indicate a different damping mechanism in surge from
that in heave. Also note that the periods of surge and heave vary between [3.12 3.145] s and [3.045 3.11]
s, respectively. The variations imply the presence of time dependency in the 2DOF damping mechanism.
These estimated damping ratios are used for the linear structural damping for the model simulations of the
free vibration tests.
Forced Vibration Calibration
SDOF Model -- Relatively good agreement of sample SDOF free-vibration test result and simulation is
shown in Fig.2. Discrepancies between experimental result and simulation in amplitude and period are
nonetheless noted. It is recognized that the energy dissipation in the response amplitude decay is caused
by a combination of hydrodynamic drag, structural damping and Coulomb type of damping (friction)
between the sphere and rod. It is noted that hydrodynamic drag force is not taken into account in potential
flow models, and that the Coulomb damping between the sphere and rod is governed by the contact area
and time, and therefore time-dependent. Hence the discrepancies between the test results and simulations,
especially in the latter cycles, may be caused by the single viscous damping approximation of the
combined damping effects (Eq. (1)).
By comparing with test results, the damping coefficient for FNPF model simulation is identified
to be near 18% of the critical damping. The seemingly high damping coefficient may result from the
combined effects from hydrodynamic, structural and frictional damping. For tests subjected to wave
excitations, the coefficient may vary depending on the wave conditions. Nonetheless, the good agreement
validates the model, and also provides an initial estimate for damping coefficient for the tests subjected to
designed wave conditions. It is also noted that there is a small variation in experimental response period,
which is mainly caused by the time-dependent Coulomb frictional component of the overall damping.

12
2DOF Model -- Good agreement of sample responses of 2DOF free-vibration test results (surge & heave)
and their corresponding simulations are shown in Fig.3. The damping effects in the 2DOF response
amplitude decay are caused by a combination of hydrodynamic drag and structural damping. Different
response behaviors in the test results (Figs.3a & b) indicate that the damping mechanism in surge may be
different from that in heave. Nonetheless, the linear structural damping provides a reasonable
approximation to both mechanisms. The damping coefficient for FNPF model simulations is identified to
be near 10% of the critical damping for both surge and heave, and it will provide an initial estimate for
damping coefficient of the tests subjected to wave excitations. It is also noted that compared to its SDOF
counterpart, there is much smaller variation in experimental response period, which indicates the time-
dependent component in the overall damping becomes less significant for the 2DOF model. In addition,
because of the 2DOF configuration is symmetric along the direction of the incident waves, the structural
responses are two-dimensional of coupled surge and heave with negligible pitch motion. Numerical
results verify that the pitch motion is negligible compared to surge and heave as observed and anticipated.
Based on the calibration results of the free vibration tests, for the SDOF model (x2 = 0), the
structural damping coefficient has been identified ~ 18% of the critical damping coefficient, Ccr1. For the
2DOF model, because of the removal of the rod, the structural damping coefficient is estimated to be ~
10% of the critical damping coefficient, Ccr1,2. Note that the magnitude and time variation of the Coulomb
friction component (only for SDOF model) and hydrodynamic drag are dependent of wave conditions.
The estimated damping coefficients are employed as an initial guess, and fine tuned by comparing with
the experimental results, and constant damping ratios of 10% and 5% are identified and used for all SDOF
and 2DOF model computations, respectively.
RESPONSE COMPARISON & ANALYSIS
Experimental results of the system subjected to wave excitations could be categorized as
continuous search tests and data-acquisition tests. The continuous search tests were designed to seek

13
possible highly nonlinear response phenomena in the wave frequency range of interest. In this search
mode, the wave frequency was gradually varied within the range of [0.1 0.7] Hz. Wavelengths of the
frequency range tested varied between around 3 and 50m. At every 2-3 minutes, the wave frequency was
increased (or decreased) by 0.01 Hz. Wave height and period as well as response amplitude and period
were manually recorded for data acquisition tests to further examine interesting nonlinear phenomena
observed. Note that due to the limitations of wave tank capacities, the wave height was not held constant
(0.12~0.92m). In addition, because of the wide range of wave frequencies and heights tested, the
experimental wave conditions range from nonlinear deep water (Stoke V) to shallow water (Cnoidal I)
waves (Dean and Dalrymple 1984).
SDOF Model
Harmonic Response -- Experimental responses observed near the primary resonance are
predominantly harmonic. Sample experimental wave profile and response, and the corresponding
FNPF simulations near the primary resonance (~ 0.25 Hz) are shown in Fig.4. Wave height and
period are 0.0793m and 3.7s, respectively, and wavelength is estimated about 14.1m. The wave
condition can be closely described by the linear wave theory (Dean and Dalrymple 1984). Good
agreement is shown between the experimental and simulated responses in both amplitude and
characteristics. Slight phase difference in the responses (Fig.4b) is noted. The difference may be
caused by the viscous damping approximation to a nonlinear, time-dependent energy dissipative
mechanism originated from the combined effects of structural damping, Coulomb damping and
hydrodynamic drag.
Sub-harmonic Response -- Sub-harmonic experimental responses are frequently observed and identified
near a secondary resonance at around 0.5 Hz. Sample experimental wave profile and sub-harmonic
response, and the FNPF simulations are compared in Fig.5. Wave height and period are 0.634m and 2.0s,
respectively, and wavelength is estimated about 6.1m. Although still in the linear wave range, the wave

14
condition is classified near the nonlinear Stoke wave domain (Dean and Dalrymple 1984). The simulation
captures the sub-harmonic nature of the response, but the contribution of the primary resonance
(secondary crests) is not as profound as that of the experimental result, which may also be the cause of
slightly over-estimated amplitude in the primary crests. Slight phase difference in these responses is also
noted.
Super-harmonic Response -- Super-harmonic experimental responses are often observed and identified
near another secondary resonance at around 0.125 Hz. Sample experimental wave profile and super-
harmonic, and the FNPF simulations are shown in Fig.6. Wave height and period are 0.60m and 6.5s,
respectively, and wavelength is estimated about 29m. The wave condition is classified as shallow water
(Cnoidal) wave category (Dean and Dalrymple 1984). The FNPF simulated result is generally not in very
good agreement with the experimental response in characteristics or amplitude. The phase difference
between simulated and experimental results appears quite pronounced. This result indicates that the
discrepancy between the experimental system damping mechanism and the approximate damping model
becomes more significant in the hydrodynamic drag dominant, super-harmonic domain. Also, in this low
excitation frequency range, the 3-D diffraction and reflection effects in the relatively narrow wave flume
are more pronounced. Three-dimensional models such as the one developed by Zhu et al (1999) may need
to be employed.
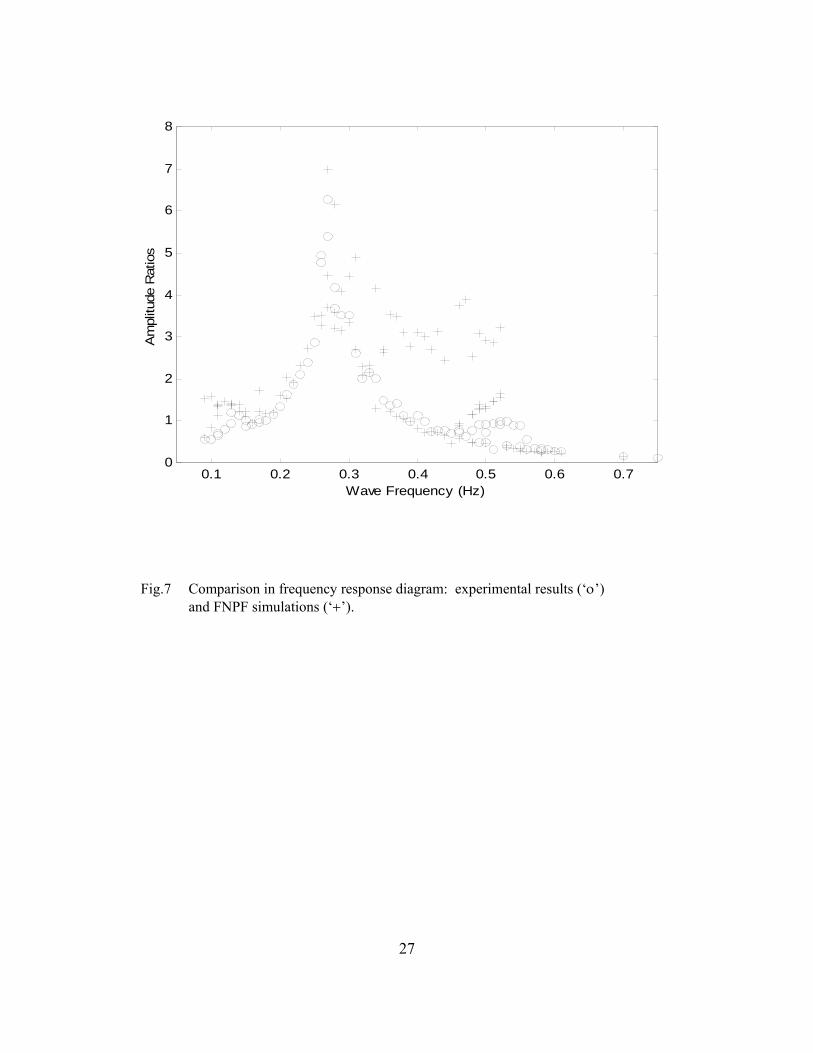
Frequency Response Diagram -- A frequency response diagram as shown in Fig.7 reflects the overall
nonlinear characteristics of the experimental results (‘×’). Using selective experimental wave parameters
as inputs for FNPF numerical model, simulated results are shown by ‘ο.’ With each specified wave
frequency and amplitude, there are 10 various initial conditions employed to identify possible coexisting
nonlinear responses. The simulations closely follow the overall behavior of the experimental results. It is
noted that simulations capture the location of bifurcation points at both super- and sub-harmonic
resonances, i.e., 0.12 and 0.48 Hz, but overestimate in amplitude. The numerical simulations predict the
co-existence of large amplitude responses between wave frequencies of [0.25 0.55] Hz. Therefore, large-

15
amplitude responses may be experienced in the experiment with specific combinations of sphere’s initial
conditions and wave excitation details.
2DOF Model
The wave frequencies considered in the experiment range from 0.1 to 0.8 Hz, which results in
structural responses of super-harmonics (near 0.125 Hz), harmonics (near 0.25 Hz) and sub-harmonics
(near 0.5 Hz). The FNPF model predictions are compared with the experimental results here in both time
history and frequency response diagram. The FNPF simulations have been compared with all
experimental results. Comparisons of representative tests in time domain include harmonics, sub-
harmonics, and super-harmonics are presented here for demonstration purpose.
Harmonic Response -- Comparisons of the numerical predictions and experimental results of wave
profile, harmonic surge and heave responses (Test E2) are shown in Figs.8a, b & c, respectively. It is
observed that the simulations of wave profile, surge and heave are in very good agreement with
experimental results in both characteristics and amplitude.
Sub-Harmonic Response -- Comparisons of the numerical predictions and experimental results of wave
profile, sub-harmonic surge and heave responses (Test E6) are shown in Figs.9a, b & c. The simulations
of wave profile, surge and heave are in agreement with experimental results in characteristics and
amplitude. It is however noted that simulated responses slightly overestimate in amplitude, and also differ
from the experimental response in sub-harmonic characteristics (smaller amplitude component in higher
frequency). The phase difference between the experimental and simulated results is not notable. In
comparison to the SDOF results (cf. Fig.5), this good agreement in the phase may indicate that the
viscous damping model gives a good approximation in the sub-harmonic domain when the time-
dependent Coulomb friction is absent.
Super-Harmonic Response -- Comparisons of the numerical predictions and experimental results of wave
profile, super-harmonic surge and heave responses (Test E4) are shown in Figs.10a, b & c. Observe that
the simulations of wave profile, surge and heave are in agreement with experimental results. The

16
overestimates of predictions in both surge and heave response amplitudes are more significant, and the
differences in characteristic details and phase between the predictions and experimental results are more
notable. These discrepancies may be inherited from the differences between the ideal fluid (inviscid and
irrotational) and real fluid, the 2-D cylinder approximation and sphere, and also the viscous damping
approximation and nonlinear energy dissipative mechanism. The differences become more prominent
near the nonlinear resonance regions (e.g., sub- and super-harmonic), especially in the drag-dominant
domain, near the super-harmonic resonance. Again, as suggested in the SDOF case, in the low excitation
frequency range, the 3-D diffraction and reflection effects in the relatively narrow wave flume are more
pronounced and 3-D numerical models may need to be employed.
Frequency Response Diagram -- The FNPF simulated surge and heave responses are noted by ‘∗’ and
compared with the experimental results ‘o’ in Figs.11a and b, respectively. Super-harmonic, harmonic,
and sub-harmonic resonances are indicated near 0.13, 0.26, and 0.52 Hz, respectively. A few large
amplitude responses are indicated to exist between [0.25 0.35] Hz. The experimental wave conditions are
the inputs for the FNPF model simulations, and 10 various initial conditions are employed for each wave
excitation to identify possible coexisting responses. In general, the FNPF predictions are in agreement
with the experimental results. It is noted that there are coexisting large-amplitude responses near 0.5 Hz,
and hence it could be expected to observe transitions between the two coexisting response attractors. Also
note that the simulations overestimate the amplitude near the super-harmonic resonance (~[0.1 0.2] Hz)
for both surge and heave responses. The overestimation re-affirms that the difference between the
hydrodynamic forces by assumed ideal and real fluids increases in the drag-dominant, super-harmonic
region.
HIGHLY SENSITIVE, NONLINEAR RESPONSE
One of the initial attempts of the experimental study was to identify the existence of highly
nonlinear, sensitive responses, even chaos. With the tests conducted and results available, it has been

17
inconclusive whether these chaotic responses exist in medium to large-scale experiments. Extensive
simulations were then performed employing a 2DOF, small-body-based model, and the numerical results
indicated that chaotic responses may exist for the medium-scale, experimental sphere system (Lin and
Yim 2004). Nonetheless, the overly simplified wave approximation of small-body models does not
consider wave breaking criteria, and therefore, the wave conditions employed in predicting chaotic
response may not be realized in the lab or field conditions. In addition, the fluid-structure interactions are
not taken into account. Hence, the existence of the numerically identified chaotic response needs to be re-
affirmed here by the FNPF model. Employing the system parameters used in small-body model
simulations, the FNPF model simulations also identify the existence of highly nonlinear, sensitive
(chaotic) responses (Lin et al 1998). Therefore, given the specified wave conditions and large initial
displacements, these highly nonlinear responses may be experimentally observed.
DISCUSSION AND CONCLUDING REMARKS
The numerical models formulated based on fully nonlinear potential flow is calibrated by
comparing with free vibration test results, and employed to simulate the responses of a moored, surged,
experimental structural system subjected to monochromatic waves for both surge-only (SDOF) and surge-
heave coupled (2DOF) configurations.
Model Calibration (Free Vibration Tests)
Good agreement is shown between model simulations and experimental results of SDOF and 2DOF
free vibration tests, and the model is calibrated. Because of the additional frictional damping caused by
the rod, the damping coefficient identified for the SDOF configuration is almost twice of that of its 2DOF
counterpart. For the 2DOF configuration, the damping coefficient in either surge or heave is identified is
of the same magnitude. These identified coefficients are used as initial estimates and fine-tuned for the
tests subjected to designed wave excitations. It is noted that in each of the SDOF and 2DOF free vibration
tests, a small variation in the response period is noted. The variation is more significant in the SDOF tests,

18
and may be mainly caused by the time-dependent Coulomb friction. Based on the agreement
demonstrated between experimental and simulated results, the linear damping is a reasonably good
approximation to the complex energy dissipation mechanism of the experimental system.
Comparison and Analysis (Tests to Wave Excitations)
SDOF Model -- The FNPF structural response simulations are in good agreement with sample
experimental responses near the primary and secondary resonances. It is however noted that complex
energy dissipation mechanism in the experiment, including frictions, time-dependent Coulomb damping
and drag effect is approximated by a linear viscous structural damping term. The simplified, linear
damping mechanism may be the major cause for the overestimated sub-harmonic response amplitude.
Discrepancy between experimental and simulated results becomes more prominent in the 3-D effect
dominated super-harmonic region.
2DOF Model -- Predictions of FNPF models in general agree well with the experimental results in both
frequency response diagram and time history. However, in the lower frequency, super-harmonic regions
(drag-dominant), the model predictions are over-estimated in amplitude. Numerical simulations predict
the existence of large amplitude responses. Therefore, large-amplitude responses may be experienced in
the experiment with specific combinations of sphere’s initial conditions and wave excitation details.
FNPF predictions verify the existence of high order nonlinear responses, even chaos. Chaotic response is
identified to exist with large initial displacements and/or velocities, which may provide guidelines in
future experimental search for higher order nonlinear responses.
FNFP model simulations of the SDOF surge-only experimental results are consistently in better
agreement than those of the 2DOF, surge-heave coupled motions. It may result from the fact that for the
SDOF system, the presence of the rod causes significant (Coulomb) damping effects, thus stabilizes the
system. The Coulomb damping eliminates large-amplitude responses and in comparison, hydrodynamic
damping effects on the structural response become less prominent. As for the 2DOF system, the rod is

19
removed, and the hydrodynamic effects on the structural responses are in full effect, and the degree of
agreement between experimental and simulated results greatly depends on the incident wave conditions.
Comparing the predictive capability of the 2-D FNPF models with the small-body Morison
formulation models presented in Yim and Lin (2006a and b) and Lin and Yim (2006 and b) (not show
here due to space limitations), it is observed that both approaches provide very similar accuracy, namely,
high degree of agreement for harmonic responses, reasonable agreement for sub-harmonic response.
However, the agreement deteriorates significantly for super-harmonic responses due to possibly the
significant influence of 3-D effects. Thus, for those who are interested in performing geometric analysis
of the nonlinear behavior of the moored system over a large parametric space, and significant data is
available of a detailed system identification (ID) study, the small-body Morison formulation will be
preferred. On the other hand, if the researcher does not have a data set available for a detailed system ID
analysis, and is only interested in estimating the response of a few selected cases, the 2-D FNPF models,
which need only to estimate the structural damping parameters, would be preferred. Finally, the 2-D
approximate models examined here may only be suitable for systems with plane symmetry and limited 3-
D influences. For accurate prediction of response of inertia dominated fluid-structure interaction system
with strong 3-D effects, the 3-D FNPF numerical models, e.g. Zhu et al 1999, is recommended.
ACKNOWLEDGMENT
Financial support from the US Office of Naval Research (N00014-04-1-0008 and N00014-06-1-0326) is
gratefully acknowledged. The writers would like to thank the reviewers for their valuable comments.
REFERENCES
Clough, R.W., and Penzien, J. (1993). Dynamics of Structures, 2nd Edition. McGraw-Hills, New York.
Dean, R.G., and Dalrymple, R.A. (1984). Water Mechanics for Engineers and Scientists. Englewood
Cliffs, New Jersey.

20
Gottlieb, O., and Yim, S.C.S., 1992, “Nonlinear oscillations, bifurcations and chaos in a multi-point
mooring system with a geometric nonlinearity,” Appl. Ocean Res., 14, pp. 241-257.
Gottlieb, O., and Yim, S.C.S., 1993, “Drag-induced instability and chaos in mooring systems,” Ocean
Engng., 29, pp. 569-599.
Gottlieb, O., Yim, S.C.S., and Lin, H., 1997, “Analysis of bifurcation superstructure of a nonlinear ocean
system,” J. Engng. Mech., ASCE, 123, pp. 1180-1187.
Isaacson, M., and Phadke, A., 1994, “Chaotic motion of a nonlinearly moored structure,” Proc. 4th Intl.
Offshore and Polar Engineering Conference, Osaka, Japan, April 10-15, Vol.III, pp. 338-345.
Lin, H., and Yim, S.C.S., 1995, “Chaotic roll motion and capsizing of ships under periodic excitation with
random noise,” Appl. Ocean Res., 17, pp. 185-204.
Lin, H., Yim, S.C.S., and Gottlieb, O. (1998). “Experimental investigation of response stability and
transition behavior of a nonlinear ocean structural system,” Intl J. Ocean Engrg, 25, pp.323-343.
Lin. H. and Yim, S.C. (2006a). “An Independent-Flow-Field Model for a SDOF Nonlinear Structural
System – Part II: Analysis of Complex Responses,” Offshore Mech. Arctic Engng., 128, pp.23-30.
Lin, H., and Yim, S.C.S. (2006b). “Coupled Surge-Heave Motions of a Moored System. I: Model
Calibration and Parametric Study,” J Engng Mech, ASCE, 132, pp.671-680.
Longuet-Higgins, M., and Cokelet, E. (1976). “The deformation of steep surface waves on water I. a
numerical method of computation,” Proc Royal Soc. A 350, pp.1-26.
Soliman, M., and Thompson, J.M.T., 1991, “Transition and steady state analysis of capsize phenomena,”
Appl. Ocean Res., 13, pp. 82-92.
Thompson, J.M.T. (1983). “Complex dynamics of compliant offshore structures,” Proc of Royal Soc
London A, 387, pp. 407-427.
Virgin, L.N. and Bishop, S.R. (1988). “Complex dynamics and chaotic responses in the time
domain simulations of a floating structure,” Ocean Engng, 15, pp. 7-90.

21
Yim, S.C. and Lin, H. (2006a). “An Independent-Flow-Field Model for a SDOF Nonlinear Structural
System – Part I: Identification and Comparisons,” Offshore Mech. Arctic Engng., 128, pp.17-22.
Yim, S.C. and Lin, H. (2006b). “Coupled Surge-Heave Motions of a Moored System. II: Stochastic
Analysis and Simulation,” J Engng Mech, ASCE, 132, pp.681-689.
Yim, S.C., Lin, H. and Tanizawa, K. (2007). “FNPF Analysis of Stochastic Experimental Fluid-Structure
Interaction Systems,” Offshore Mech. Arctic Engng., 129, pp.9-20.
Zhu, Q., Liu, Y. Tjavaras, A.A., Triantafyllou, M.S., and Yue, D. (1999). “Mechanics of Nonlinear
Short-Wave Generation by a Moored Near-Surface Buoy,” J Fluid Mech, 381, pp.305-335.

22
70 71 72 73 74 75
-1
-0.5
0
0.5
1
Time (sec)
Wav
e E
leva
tion
(m)
Exp FNPFIFF
0 5 10 15 20-0.5
-0.25
0
0.25
0.5
Sur
ge (m
)
Time (s)
Exp Simul
Fig.1 Comparison of wave profiles (Test D2) of experimental result (solid), FNPF simulation (dotted) and sinusoidal approximation (dashed)
Fig.2 Comparison of experimental and simulated responses of a sample SDOF free vibration test (Test S2C)

23
0 5 10 15 20-0.02
-0.01
0
0.01
0.02
Time (s)
Sur
ge (m
)
Exp Simul
0 5 10 15 20-0.05
-0.025
0
0.025
0.05
Time (s)
Hea
ve (m
)
Exp Simul
Fig.3 Comparison of 2DOF experimental and simulated responses of sample free vibration test in: a) surge (Test T1F), and b) heave (Test T2D)

24
80 85 90 95 100-0.1
-0.05
0
0.05
0.1
Time (sec)
W a
v e
E l e
v (m
)
80 85 90 95 100-0.5
-0.25
0
0.25
0.5
Time (sec)
S p
h e
r e
D i s p
l (m
)
Fig.4 Wave profile and harmonic response near primary resonance (Test D14): experimental (solid) and numerical simulation
(dotted)

25
80 85 90 95 100-1
-0.5
0
0.5
1
Time (sec)
W a
v e
E l e
v (m
)
80 85 90 95 100-1
-0.5
0
0.5
1
Time (sec)
S p
h e
r e
D i s
p l (
m)
Fig.5 Wave profile and sub-harmonic response near secondary resonance (Test D2): experimental (solid) and numerical simulation (dotted)

26
100 105 110 115 120-1
-0.5
0
0.5
1
Time (sec)
W a
v e
E l e
v (m
)
100 105 110 115 120-1
-0.5
0
0.5
1
Time (sec)
S p
h e
r e
D i s p
l (m
)
Fig.6 Wave profile and super-harmonic response near secondary resonance (Test D3): experimental (solid) and numerical simulation (dotted)
27
0.1 0.2 0.3 0.4 0.5 0.6 0.70
1
2
3
4
5
6
7
8
Wave Frequency (Hz)
Am
plitu
de R
atio
s
Fig.7 Comparison in frequency response diagram: experimental results (‘ο’) and FNPF simulations (‘+’).

28
70 71 72 73 74 75 76 77 78 79 80-0.4
0
0.4W
ave
Elev
(m)
70 71 72 73 74 75 76 77 78 79 80-0.2
0
0.2
Surg
e (m
)
70 71 72 73 74 75 76 77 78 79 80-0.2
0
0.2
Time (sec)
Hea
ve (m
)
70 75 80 85 90-0.5
0
0.5
Wav
e E
lev
(m)
70 75 80 85 90-0.8
0
0.8
Sur
ge (m
)
70 75 80 85 90-0.8
0
0.8
Time (sec)
Hea
ve (m
)
Fig.8 Comparison of wave profile and harmonic responses (Test E2): a) wave profile, b) surge, and c) heave displacement; solid line – experimental and dashed line – simulated
Fig.9 Comparison of wave profile and sub-harmonic responses (Test E6): a) wave profile, b) surge, and c) heave displacement; solid line – experimental and dashed line – simulated

29
200 205 210 215 220 225 230 235 240-0.5
0
0.5W
ave
Ele
v (m
)
200 205 210 215 220 225 230 235 240-0.5
0
0.5
Sur
ge (m
)
200 205 210 215 220 225 230 235 240-0.5
0
0.5
Time (sec)
Hea
ve (m
)
0 0.2 0.4 0.6 0.8 10
5
10
Freq (Hz)
Sur
ge (R
A)
ExpDataFNPF
0 0.2 0.4 0.6 0.8 10
5
10
Freq (Hz)
Hea
ve (R
A)
Fig.10 Comparison of wave profile and super-harmonic responses (Test E4): a) wave profile, b) surge, and c) heave displacement; solid line – experimental and dashed line – simulated
Fig.11 Comparisons of experimental results (‘o’) and FNPF predictions (‘*’) in frequency response diagrams