2006 grower meeting
38
Grain Profitability FINIDNG A NEW HORSE FOR A NEW RACE
-
Upload
profitable-growth-services-llc -
Category
Environment
-
view
38 -
download
0
Transcript of 2006 grower meeting
Grain Profitability
FINIDNG A NEW
HORSE FOR A NEW
RACE
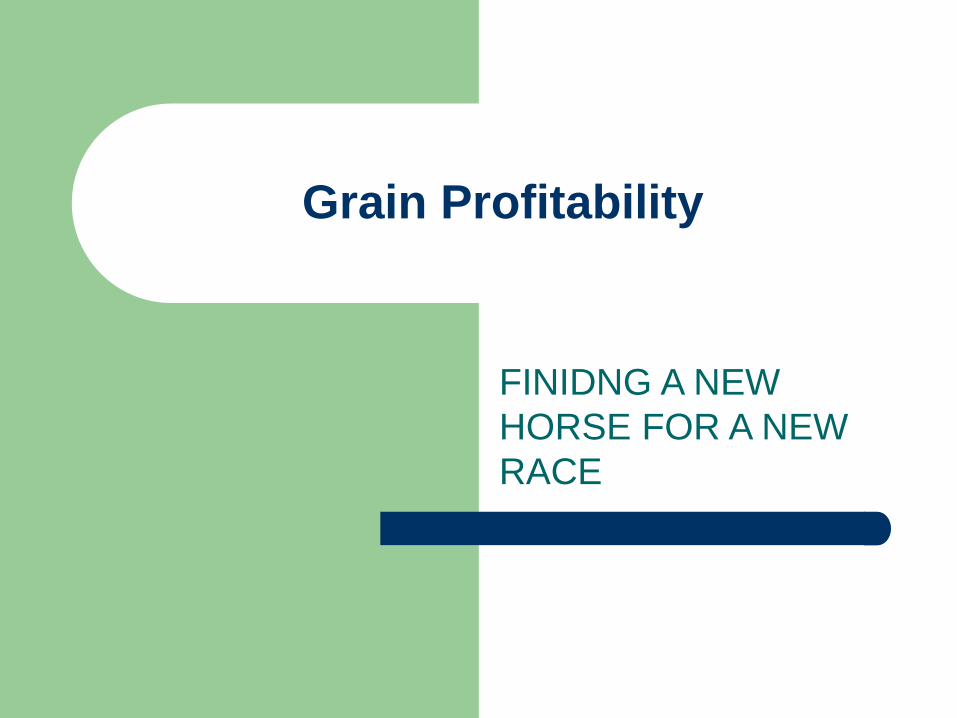
Doanes’ Says…
19811991
20012006
3-D Column 1
0
0.5
1
1.5
2
2.5
3
TO
NN
ES
YEAR
TONES PER HECTARE
19811991
20012006
MILLION TONNES
0
100
200
300
400
500
600
WORLD GRAIN STOCKS
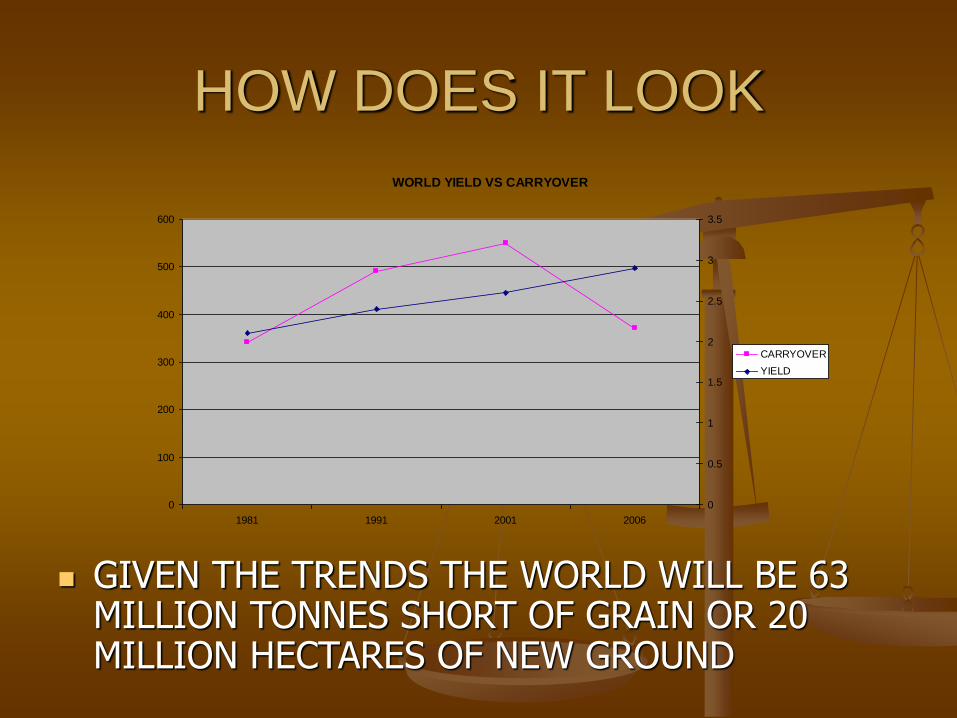
HOW DOES IT LOOK
WORLD YIELD VS CARRYOVER
0
100
200
300
400
500
600
1981 1991 2001 2006
0
0.5
1
1.5
2
2.5
3
3.5
CARRYOVER
YIELD
GIVEN THE TRENDS THE WORLD WILL BE 63 MILLION TONNES SHORT OF GRAIN OR 20 MILLION HECTARES OF NEW GROUND
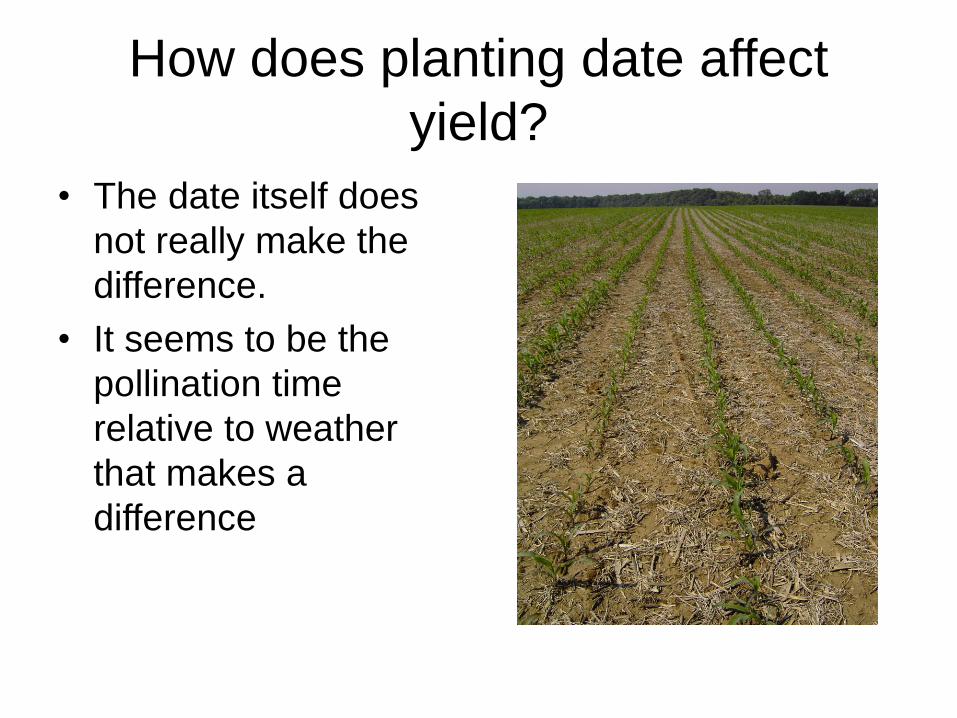
How does planting date affect
yield?
• The date itself does
not really make the
difference.
• It seems to be the
pollination time
relative to weather
that makes a
difference

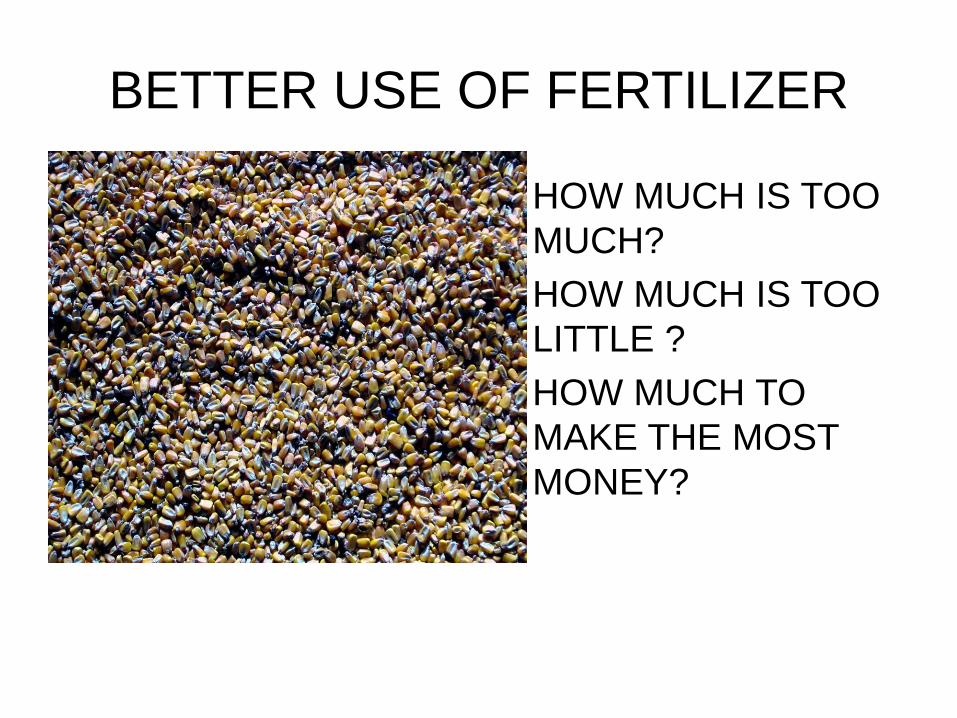
BETTER USE OF FERTILIZER
• HOW MUCH IS TOO
MUCH?
• HOW MUCH IS TOO
LITTLE ?
• HOW MUCH TO
MAKE THE MOST
MONEY?
How did ESN perform?
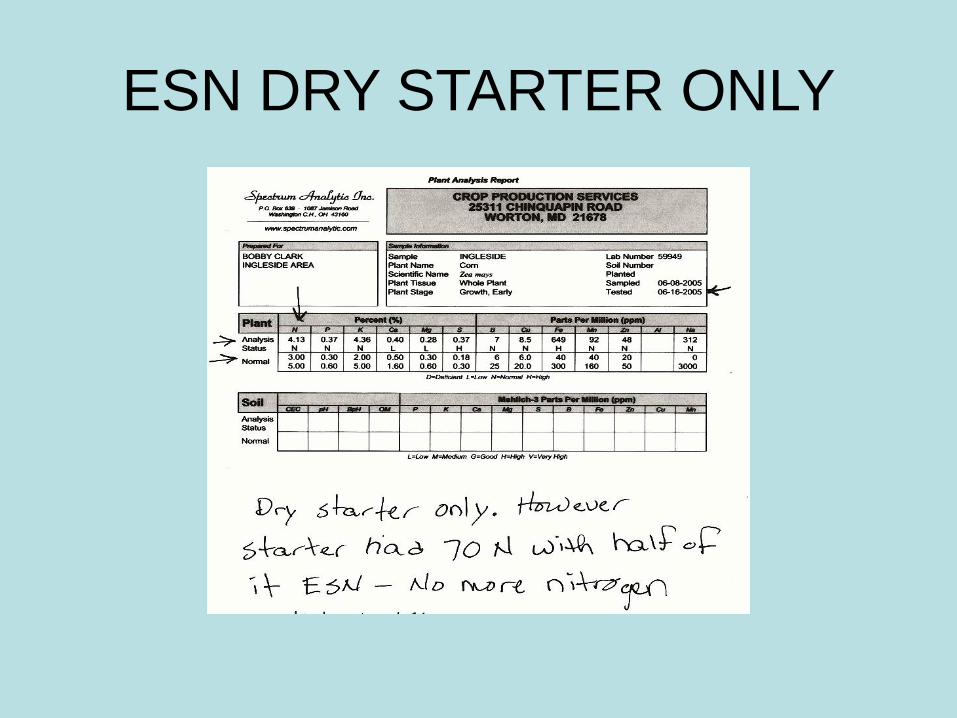
ESN DRY STARTER ONLY
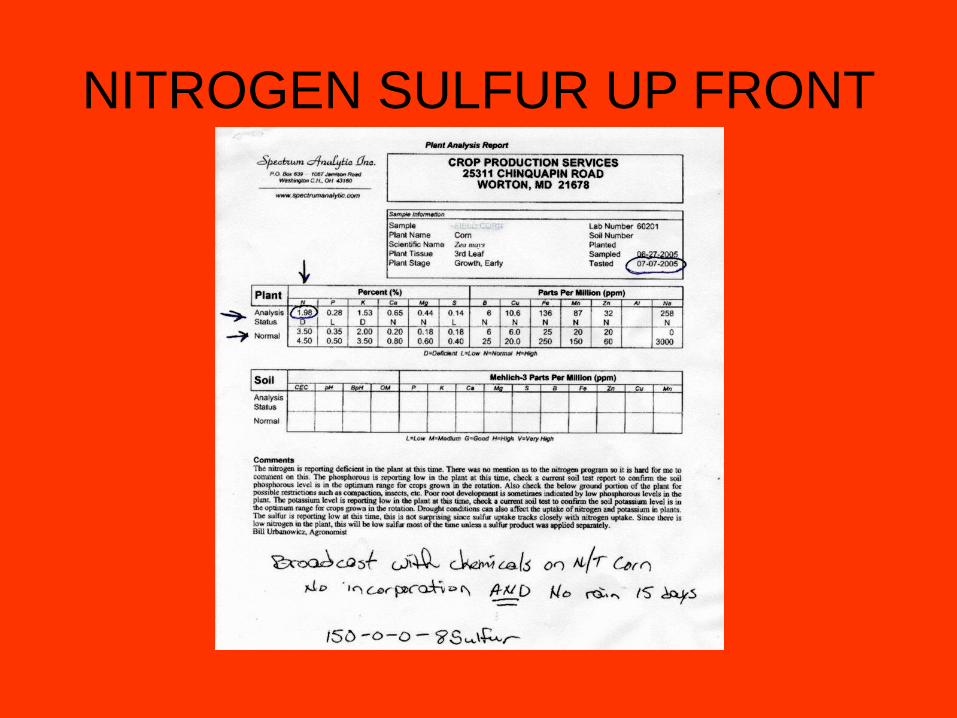
NITROGEN SULFUR UP FRONT
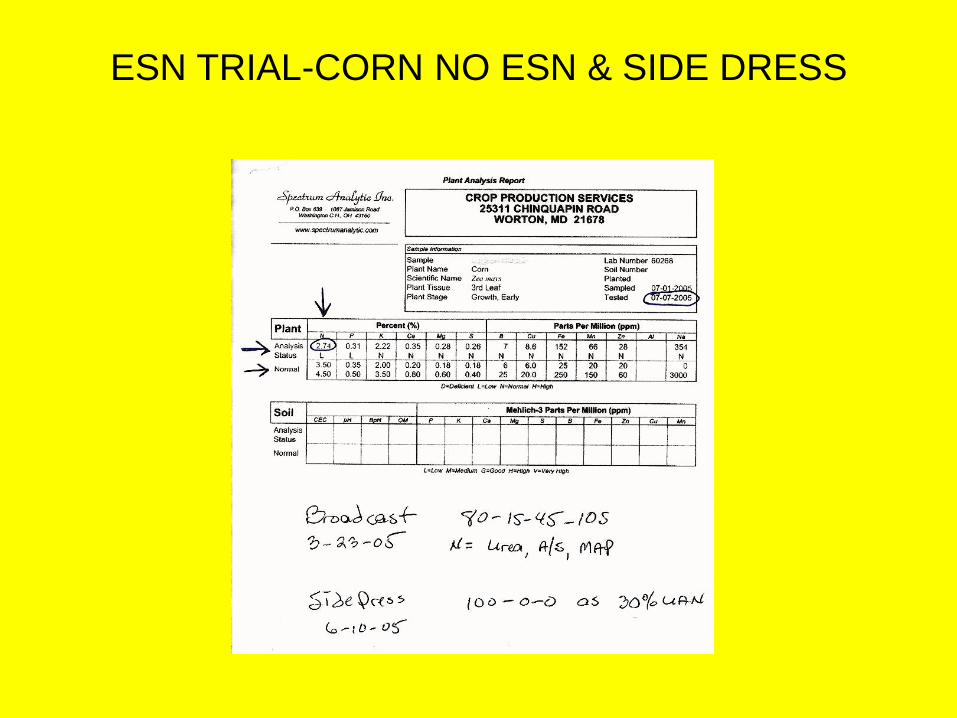
ESN TRIAL-CORN NO ESN & SIDE DRESS
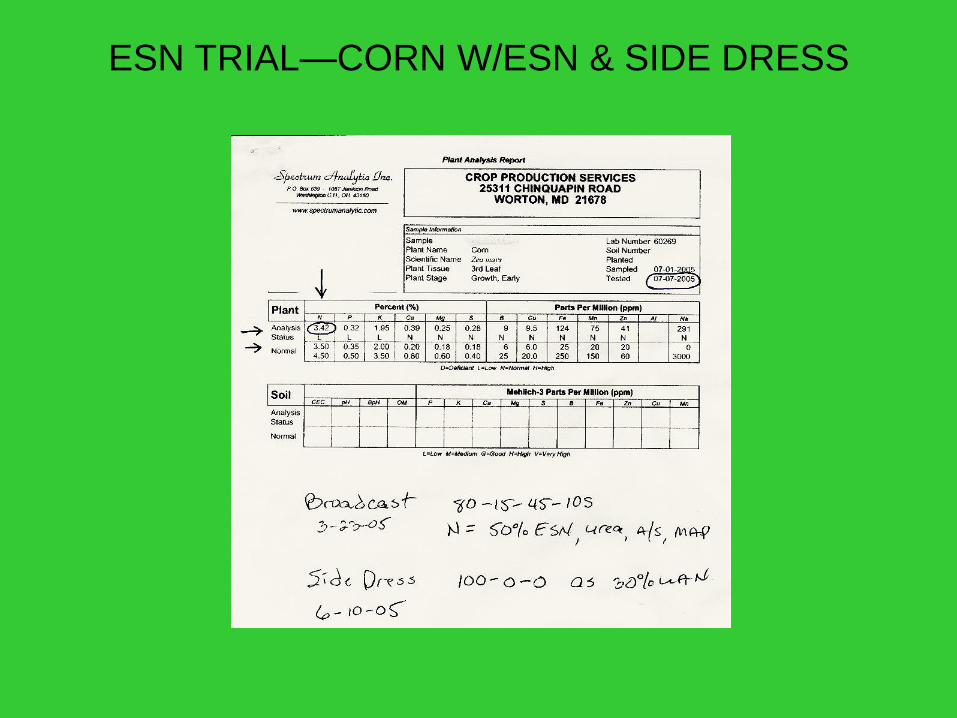
ESN TRIAL—CORN W/ESN & SIDE DRESS
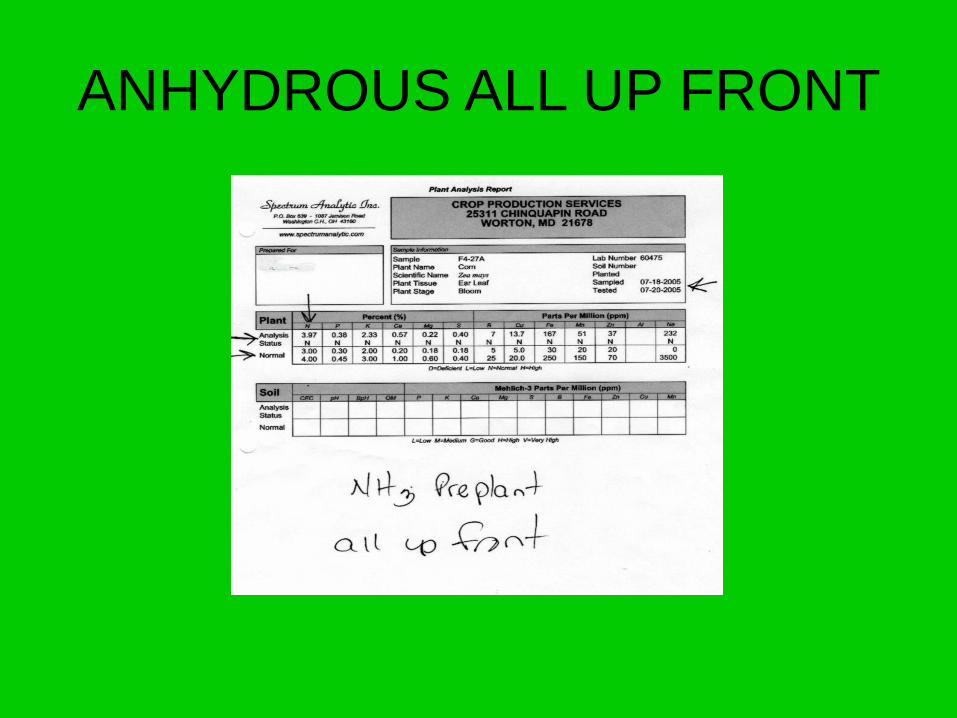
ANHYDROUS ALL UP FRONT
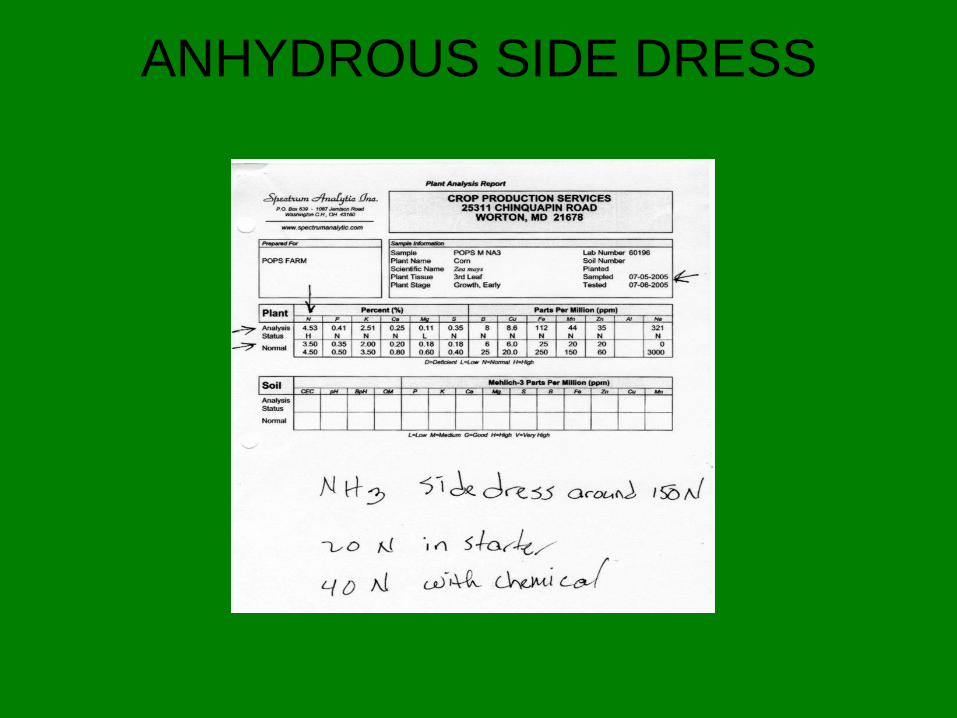
ANHYDROUS SIDE DRESS
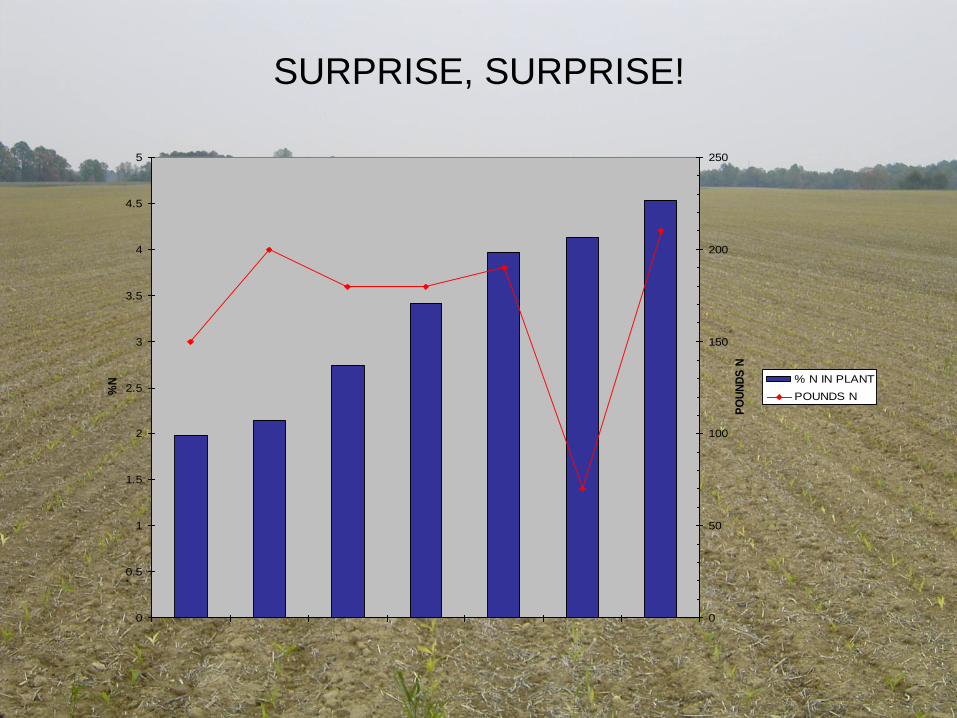
SURPRISE, SURPRISE!
0
0.5
1
1.5
2
2.5
3
3.5
4
4.5
5
%N
0
50
100
150
200
250
PO
UN
DS
N
% N IN PLANT
POUNDS N

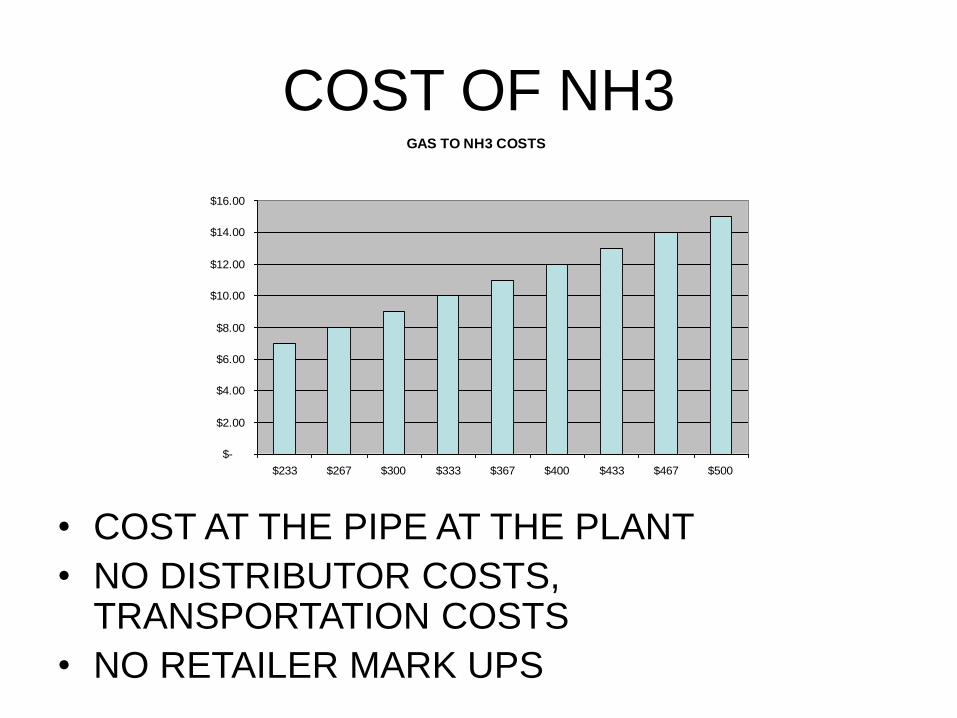
COST OF NH3
• COST AT THE PIPE AT THE PLANT
• NO DISTRIBUTOR COSTS, TRANSPORTATION COSTS
• NO RETAILER MARK UPS
GAS TO NH3 COSTS
$-
$2.00
$4.00
$6.00
$8.00
$10.00
$12.00
$14.00
$16.00
$233 $267 $300 $333 $367 $400 $433 $467 $500

WHAT CAN WE TAKE AWAY?
• Samples were taken when corn was about the third collar—good timing of application to N usage
• Cover crop does help tie up soil & nitrogen
• We did see that 70 lb. nitrogen will get a crop safely and had the second highest tissue reading…this was on sandy, light soil.
• Nitrogen timing…not quantity makes the biggest difference
• Good overall nutrient balance is the most efficient use of nitrogen
• Follow your soil sample results for proper balance
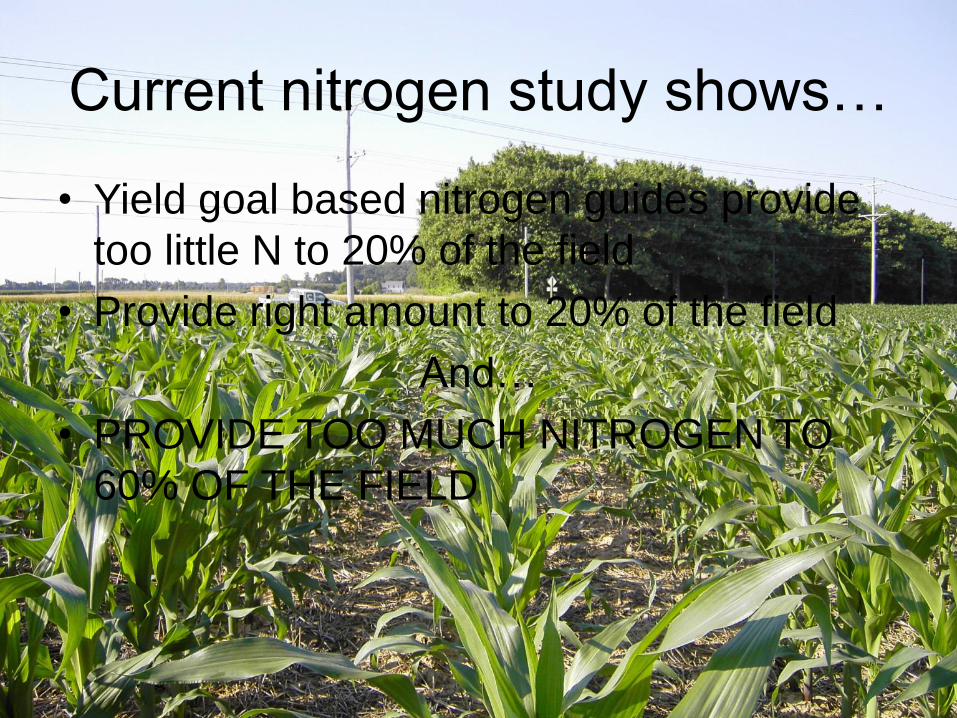
Current nitrogen study shows…
• Yield goal based nitrogen guides provide
too little N to 20% of the field
• Provide right amount to 20% of the field
And…
• PROVIDE TOO MUCH NITROGEN TO
60% OF THE FIELD
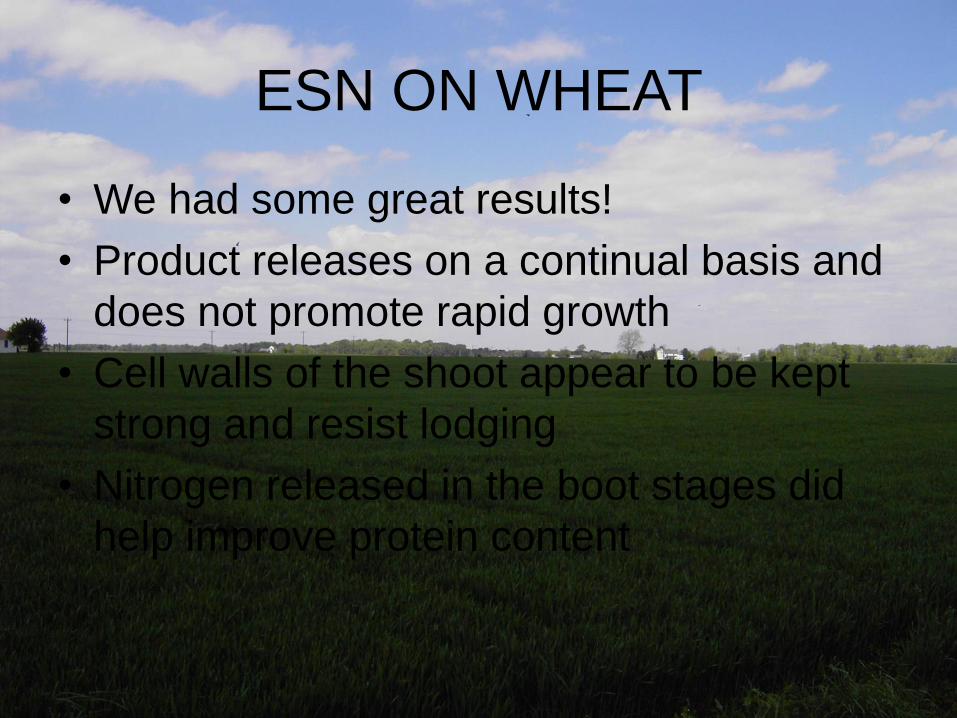
ESN ON WHEAT
• We had some great results!
• Product releases on a continual basis and
does not promote rapid growth
• Cell walls of the shoot appear to be kept
strong and resist lodging
• Nitrogen released in the boot stages did
help improve protein content
ESN does allow you to shift from
ammonium sulfate and regulate
the amount of sulfur you apply to
the field, and helps maintain pH.
Consider switching sulfur needs
to K-Mag.
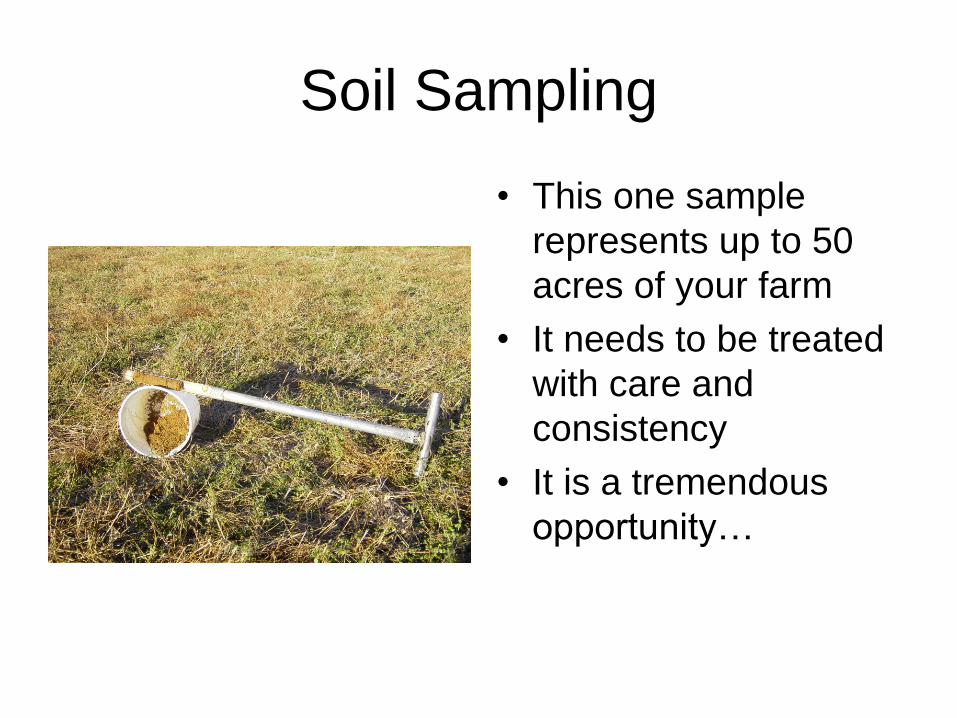
Soil Sampling
• This one sample
represents up to 50
acres of your farm
• It needs to be treated
with care and
consistency
• It is a tremendous
opportunity…
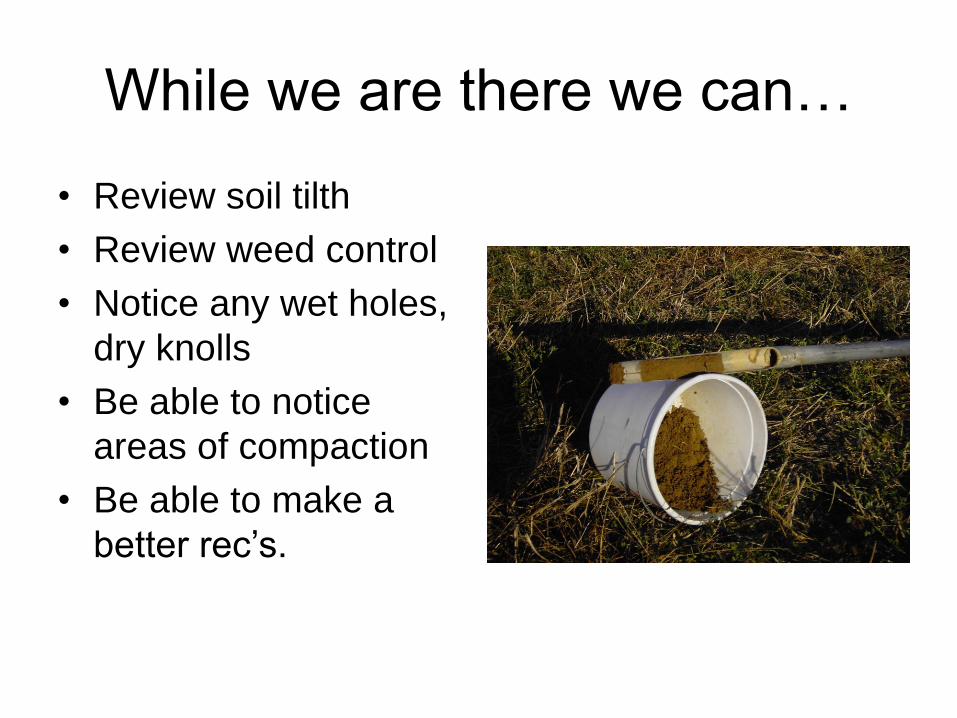
While we are there we can…
• Review soil tilth
• Review weed control
• Notice any wet holes,
dry knolls
• Be able to notice
areas of compaction
• Be able to make a
better rec’s.
What are some things we notice?
• What about those pH’s?— why are they
low?
• Lime is the best way to correct pH!!
• Damp Lime or Dry Lime?
– Key is to lime when needed. Once we get
below 5.8 pH we consistently see yield loss
due to low magnesium uptake.
– Weed control begins to diminish at 5.5 pH
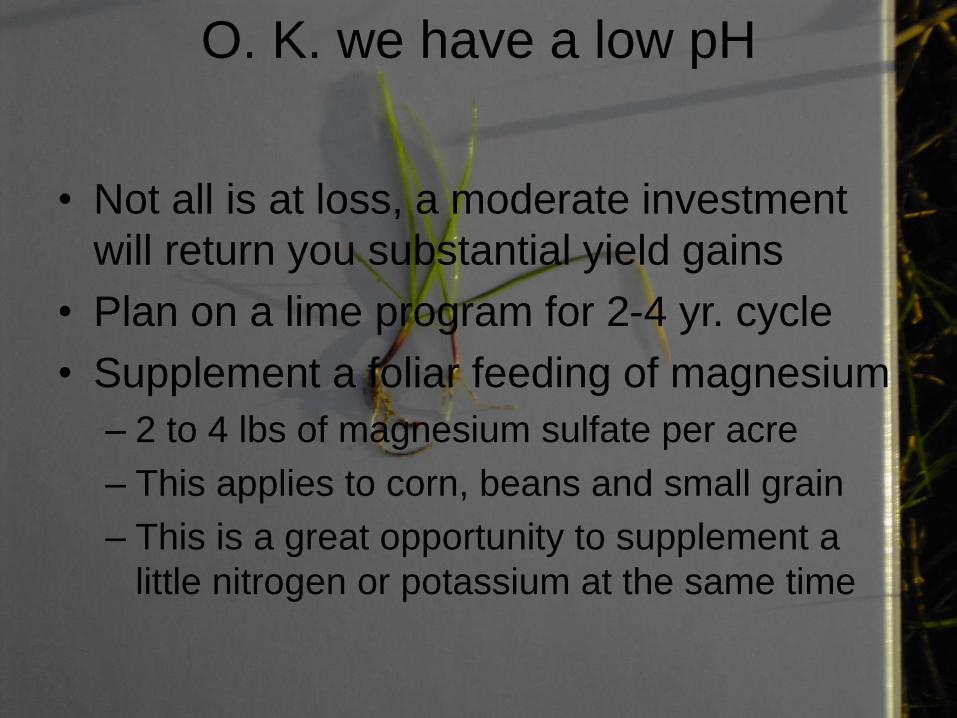
O. K. we have a low pH
• Not all is at loss, a moderate investment
will return you substantial yield gains
• Plan on a lime program for 2-4 yr. cycle
• Supplement a foliar feeding of magnesium
– 2 to 4 lbs of magnesium sulfate per acre
– This applies to corn, beans and small grain
– This is a great opportunity to supplement a
little nitrogen or potassium at the same time
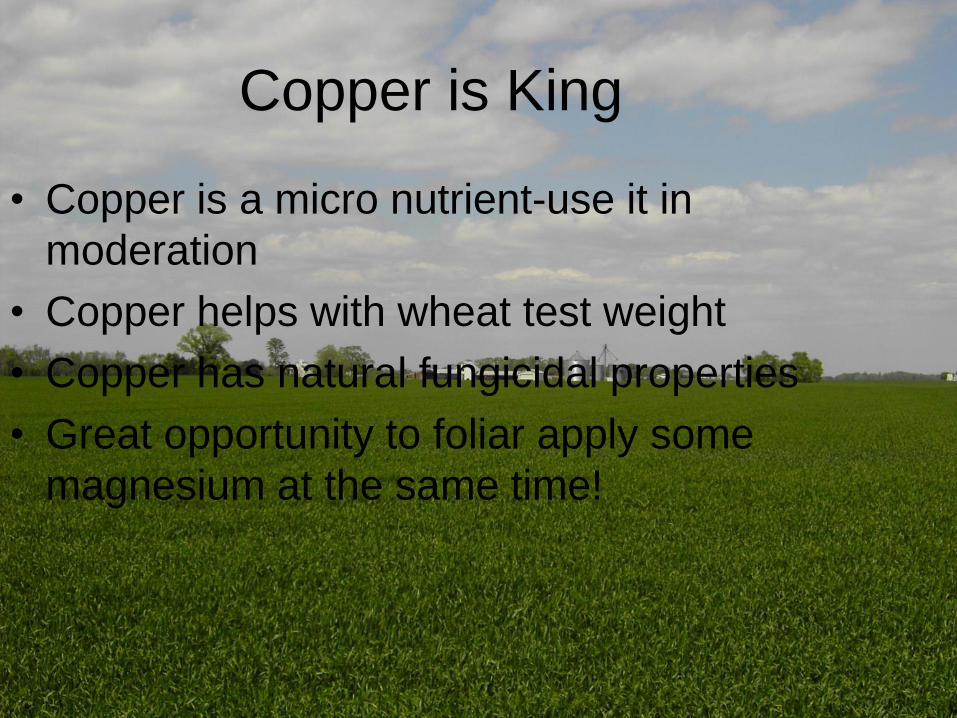
Copper is King
• Copper is a micro nutrient-use it in
moderation
• Copper helps with wheat test weight
• Copper has natural fungicidal properties
• Great opportunity to foliar apply some
magnesium at the same time!
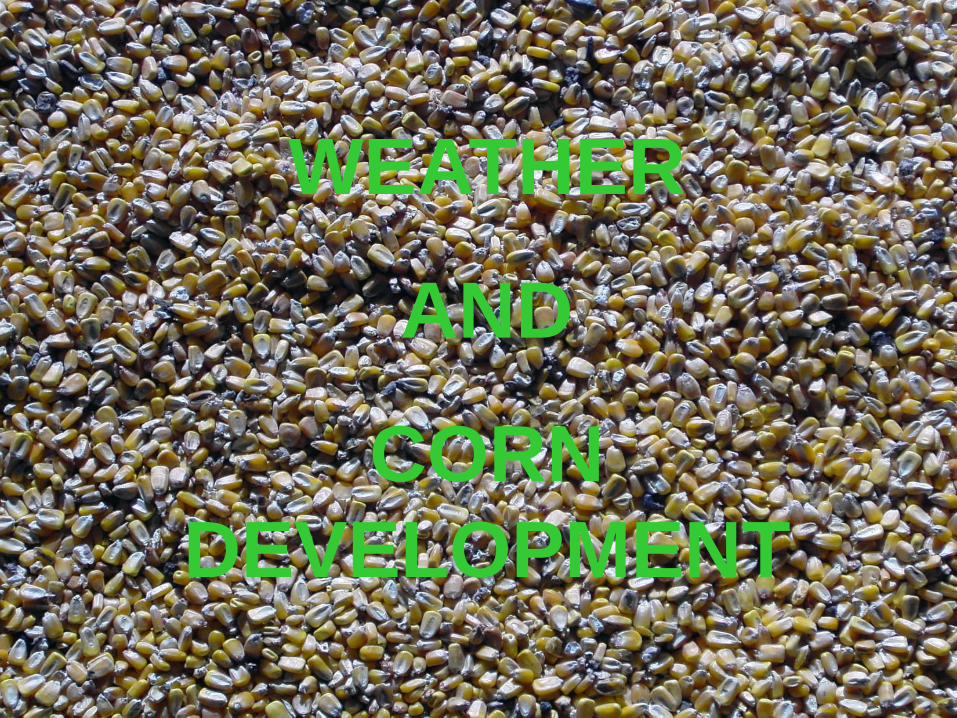
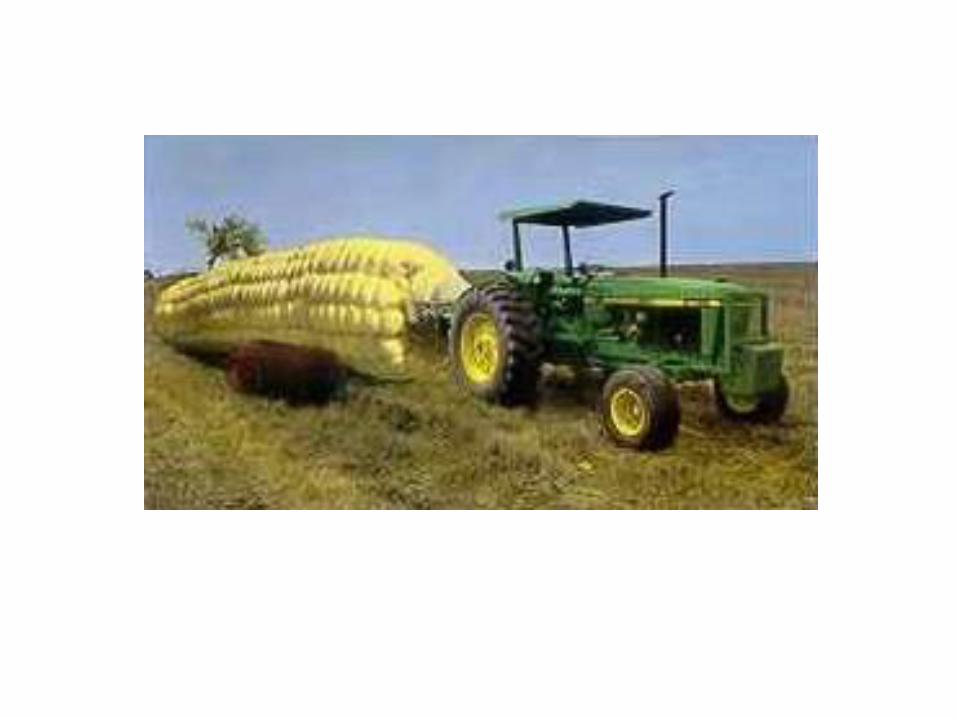
WEATHER
AND
CORN
DEVELOPMENT
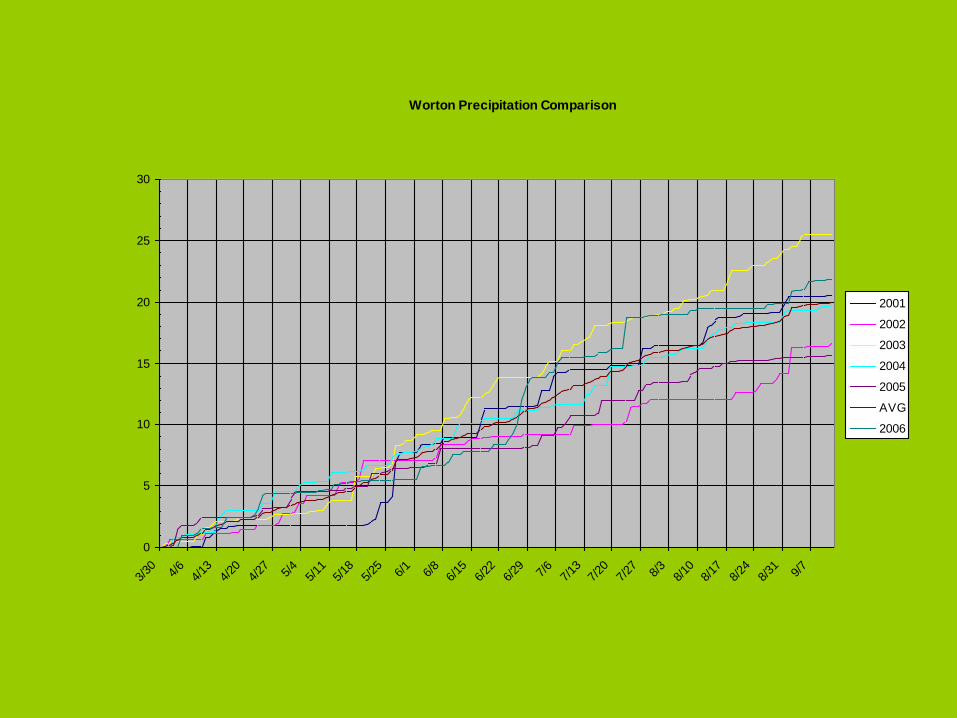
Worton Precipitation Comparison
0
5
10
15
20
25
30
3/30 4/
64/
134/
204/
27 5/4
5/11
5/18
5/25 6/
16/
86/
156/
226/
29 7/6
7/13
7/20
7/27 8/
38/
108/
178/
248/
31 9/7
2001
2002
2003
2004
2005
AVG
2006
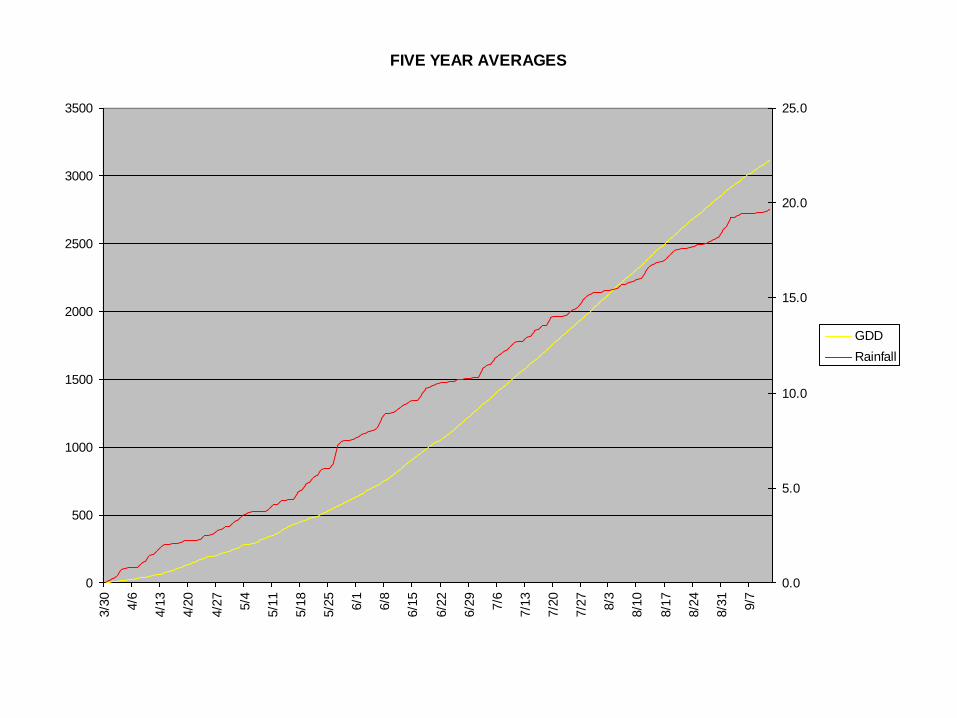
FIVE YEAR AVERAGES
0
500
1000
1500
2000
2500
3000
35003/3
0
4/6
4/1
3
4/2
0
4/2
7
5/4
5/1
1
5/1
8
5/2
5
6/1
6/8
6/1
5
6/2
2
6/2
9
7/6
7/1
3
7/2
0
7/2
7
8/3
8/1
0
8/1
7
8/2
4
8/3
1
9/7
0.0
5.0
10.0
15.0
20.0
25.0
GDD
Rainfall
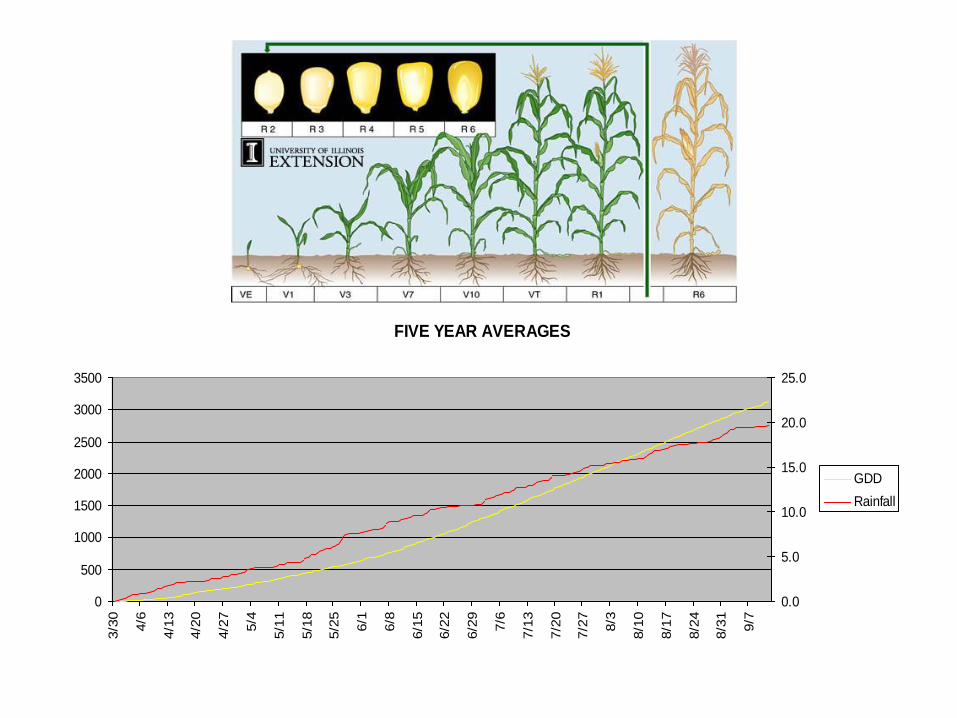
FIVE YEAR AVERAGES
0
500
1000
1500
2000
2500
3000
3500
3/3
0
4/6
4/1
3
4/2
0
4/2
7
5/4
5/1
1
5/1
8
5/2
5
6/1
6/8
6/1
5
6/2
2
6/2
9
7/6
7/1
3
7/2
0
7/2
7
8/3
8/1
0
8/1
7
8/2
4
8/3
1
9/7
0.0
5.0
10.0
15.0
20.0
25.0
GDD
Rainfall
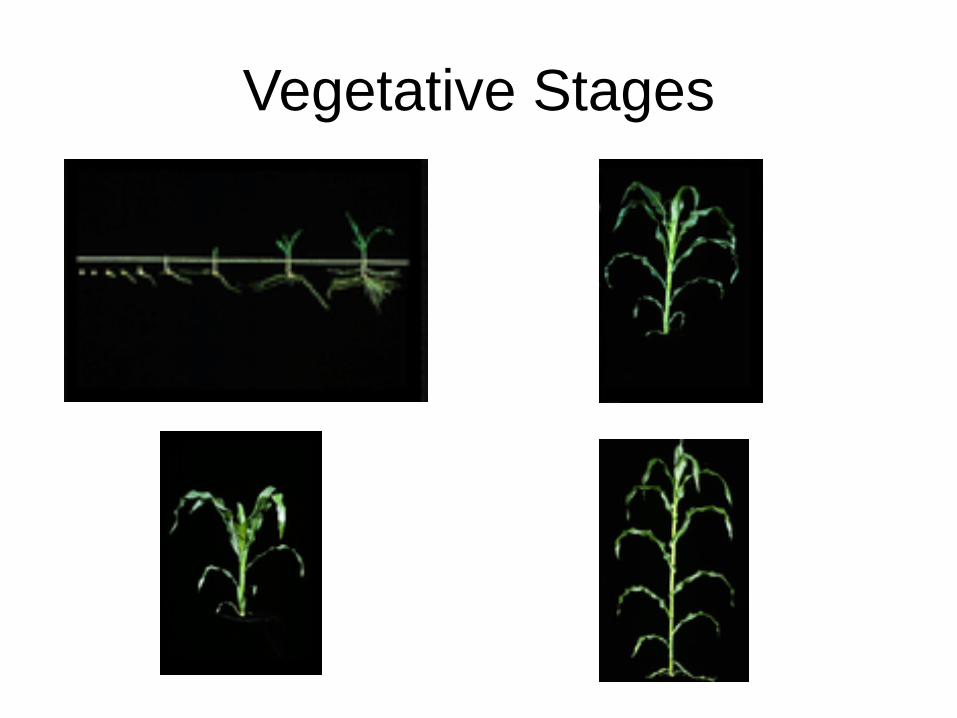
Vegetative Stages
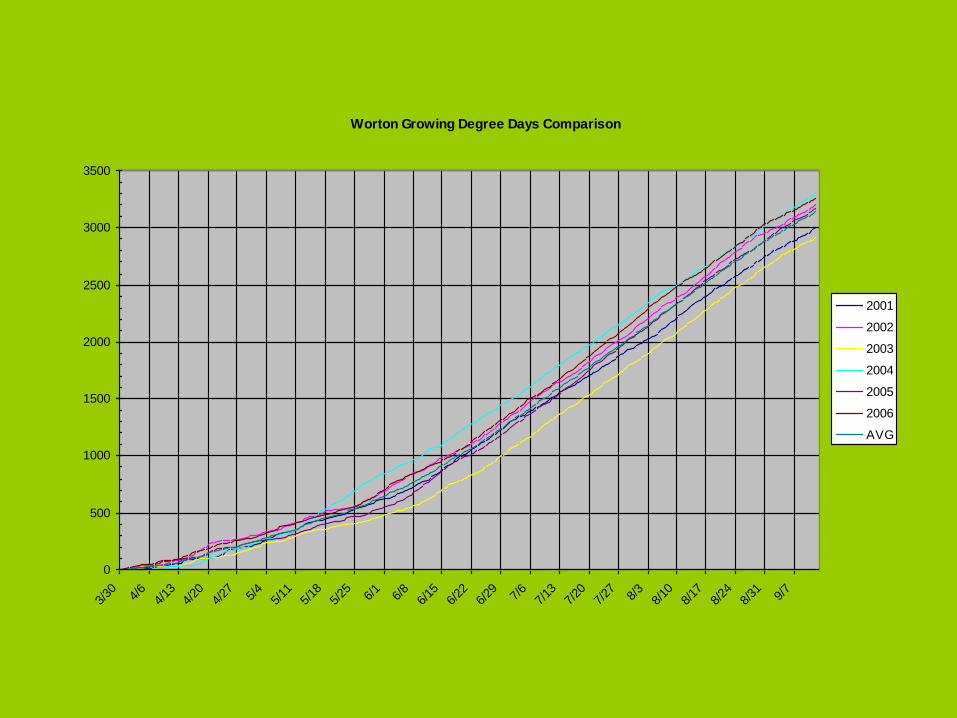
Worton Growing Degree Days Comparison
0
500
1000
1500
2000
2500
3000
3500
3/30 4/
64/
134/
204/
27 5/4
5/11
5/18
5/25 6/
16/
86/
156/
226/
29 7/6
7/13
7/20
7/27 8/
38/
108/
178/
248/
31 9/7
2001
2002
2003
2004
2005
2006
AVG